Article

Analysis of the Effect of Dry Magnetic Separation on the Process of Ferruginous Quartzites Disintegration

by
Darya Nikolaevna Shibaeva
1,
Alena Arkad’evna Kompanchenko
2,* and
Sergey Vasil’evich Tereschenko
1
1
Mining Institute of the Federal Research Centre “Kola Science Centre of the Russian Academy of Sciences”, 14 Fersman Street, 184209 Apatity, Russia
2
Geological Institute of the Federal Research Centre “Kola Science Centre of the Russian Academy of Sciences”, 14 Fersman Street, 184209 Apatity, Russia
*
Author to whom correspondence should be addressed.
Submission received: 25 June 2021 / Revised: 15 July 2021 / Accepted: 19 July 2021 / Published: 22 July 2021
(This article belongs to the Special Issue Selective Disintegration: Theory and Practice)

Abstract

:
The paper considers the results of the application of dry magnetic separation on samples of ferruginous quartzites of the Kostomuksha ore field, represented by refractory ore, free-milling ore, and their mixture. The assessment of the influence of the ore texture on the technological parameters of dry magnetic separation indicates their insignificant changes: the yield of the non-magnetic product varies from 12.4 to 13.5%, and the Fetotal content in the magnetic product increases by 1.11–1.14 times. A decrease of at least 15% in the number of harmful impurities was found: S by 16.2–17.3%, SiO2 by 15.5–21.1%, and Al2O3 by 39.1–48.4%. The authors have performed a comparative assessment of the granularity of the initial ore and the magnetic product with the measurement of energy consumption, as well as an analysis of the magnetite liberation on particle sizes of less than 2 mm. It was found that due to the release of a non-magnetic product in the amount of 12.3–14.5%, represented by non-magnetite or weakly mineralized rock varieties, energy consumption for the crushing process is reduced by at least 5%. The mineral liberation assessment showed that mainly free magnetite is contained in the −0.4 mm fineness class. It was found that in the magnetic separation product of the refractory ore sample, the amount of liberated magnetite in the size class −1 + 0 mm increases by 12.1% compared to the initial ore sample. For the free-milling ore sample, the opposite trend is observed: a decrease in the amount of free magnetite by 30.9% in the magnetic product. Analysis of the magnetite liberation in the mixture indicates deterioration in the results obtained during the separate crushing of refractory and free-milling ore and a decrease in the amount of liberated magnetite in the magnetic product by 60% compared to the initial ore.

1. Introduction

Among the priority activities of the mining and industrial complex and research organizations providing support to the entire technological cycle of deposit operation, the primary is the design and industrial development of innovative technologies aimed at resource and energy conservation, rational use of mineral reserves, environmental safety, and protecting the environment from industrial pollution [1]. One of the ways to improve the efficiency of the mining enterprise, and in particular the ore beneficiation stage, is the staged removal of end products from the processing as the minerals containing useful components are liberated in the crushing and grinding processes [2]. The first stage, in which a part of empty and low-mineralized rocks with a grain size of less than 300 mm is removed, is a preliminary concentration (pre-concentration) of the mined rock mass by means of lumpy separation, based on magnetic, gravitational, and radiometric properties of the minerals. Reduction of technological flow in its implementation contributes to compliance with the principle of rational ore preparation: “not to crush and not to process anything unnecessary” [3,4,5,6,7,8].
The use of the pre-concentration process in mineral processing technology does not reduce the total amount of processing waste, but changes its size; namely, it forms a lumpy material of separation waste with a size of 300 to 20 mm and directs it to waste dumps. The fine-grained wastes formed during the ore separation product processing are stored in the tailing’s storage. Reducing the negative environmental impact of mineral processing waste in this case is provided by reducing the amount of fine-grained tailings, which are the main source of air pollution from the surface of dry beaches of reclamation bays, slopes of dams [9], as well as the possibility of secondary use of dry magnetic separation waste-production of crushed stone used in road repairs, backfilling dams, embankments, filling mined-out space, and production of construction materials.
The positive effects of the pre-concentration processes on the crushing and grinding process, in particular on the reduction of energy consumption during crushing and grinding, was noted in [10]. The paper [11] presents the results of complex studies of the Khibiny apatite ores, covering the entire ore processing cycle: ore preparation, including X-ray luminescence separation, and apatite flotation, as well as the study of the physical-mechanical and mineral-technological properties of rocks sorted during pre-concentration to determine the scope of their recycling, indicating a 30% reduction in the number of finely ground apatite flotation tails while maintaining the quality of apatite concentrate and apatite extraction in the concentrate at the level of 97%.
In this work, the influence of pre-concentration processes on crushing, grinding, and magnetic separation is considered by the example of the iron ores of the Kostomuksha ore field located on the territory of North Karelia (Russia), 10 km north of Kostomuksha town. A large number of scientific papers have been devoted to the geological structure and the study of the material composition of ores [12,13,14,15,16], therefore in this work, only a brief overview is presented.
The geological structure of the Kostomuksha ore field contains the metamorphic complex of the Lower Proterozoic rocks, represented by a variety of crystalline schists (quartz-amphibole-biotite composition), ferruginous quartzites, plagioporphyries, gabbro, amphibolites. Ferruginous quartzites occur mainly in the upper rock horizon of the metamorphic thickness and compose parallel elongated ore beds, intercalated with interlayers of ore-free crystalline schists.
The whole complex of rocks forms a monoclinal fold arched in plan. The ore field extends in the form of a curved strip up to 15 km long, 0.7—1.8 km wide, and is divided into three sections: Northern, Central, and Southern. The Northern and Central sections are 8.5 km long and extend first in the meridional direction, then turn sharply to the southeast. The Southern section is traced in the latitudinal direction at a distance of 6.5 km. The Central and Southern sections are represented by the largest, sustained in thickness and strike ore basins containing the main ore reserves. In addition to the main ore basins, there is a significant number of relatively low, thick, and less well-sustained individual sets of ferruginous quartzites, occurring, as a rule, in the hanging wall of the metamorphic stratum.
Specific features of the ore body occurrence require a particular approach to the organization and technology of its mining. In quarries of the Karelsky Okatysh mining and processing plant, so-called interbedded zones occur: the ore contains rock inclusions or the ore deposit neighbors upon a dead rock [17]. The implementation of drilling-and-blasting operations led to mixing of the ore and rock, which increases the throughput for obtaining a necessary amount of commercial product. A solution to the identified problem, i.e., separation of dead rocks at an early stage of technological cycle, which ensures, inter alia, the reduction of energy consumption for key energy-intensive operations such as grinding and classification (more than 66%) [18], is dry magnetic separation. The choice of this pre-concentration method is conditioned by the ore mineral composition: from high- to low-magnetic ferruginous quartzites, magnetite-amphibole, amphibole-magnetite, and biotite-magnetite differences. The main ore mineral of ferruginous quartzites is magnetite (20–65%); hematite is constantly present, but on average no more than 2%; pyrite, pyrrhotite, rarely chalcopyrite, arsenopyrite, sphalerite, marcasite, and galena are found in sulfides. The silicate part is represented by quartz (20–50%), amphibole (5–20%), and biotite (0–40%).
Amphibole—magnetite quartzites are the richest (magnetite content −40–65 to 75%) and the purest in sulfur; biotite-magnetite ores are the poorest (20–35%) and contain pyrrhotite from 0.5 to 10%, pyrite up to 1.5%, and apatite up to 3. At the time of the beginning of the development [12], the ores of one of the oldest Kostomuksha deposits were considered poor in terms of their iron content, and free-milling in terms of the beneficiation. Also, for certain ore sites, an increased gold content was recorded [19].
At present, JSC Karelsky Okatysh mines the ores of the Kostomuksha and Korpangskoe deposits, but they are processed separately, since the Kostomuksha ores belong to the refractory ore, and the Korpangskoe deposit ores are free-milling. The differences in the ore beneficiation are related to the magnetite impregnation—namely, the content of pieces with larger magnetite in the sample of free-milling ores.
The aim of this work is to assess the influence of textural features and material composition of the Kostomuksha and Korpangskoe ore deposits on the implementation of primary ore preparation processes, including their pre-concentration by dry magnetic separation and primary crushing on jaw and roll crushers. To achieve this goal, the following areas of research were identified: assessment of the influence of ore texture on the technological parameters of dry magnetic separation; selection of modes of dry magnetic separation of ore samples; estimation of ore crushing capacity and magnetite liberation at particle sizes less than 2 mm by means of mineralogical and granulometric analysis; estimation of energy consumption during crushing of the initial ore and the processed product of dry magnetic separation.

2. Materials and Methods

2.1. Materials

The studied material is represented by iron ore samples from the Kostomuksha and Korpangskoe deposits of the Kostomuksha ore field, selected after the second stage of crushing at the crushing and processing plant of JSC Karelsky Okatysh. The size class of the initial samples is −80 + 0 mm. The samples include ferruginous quartzites and rocks of the host rocks. The initial ore size was delivered to the magnetic separation, as well as the narrow size classes: −80 + 50 mm, −50 + 20 mm, and −20 + 0 mm. The initial ore mass and the processed product of dry magnetic separation (magnetic product) of the −80 + 0 mm size class were crushed.

2.2. Methods

The study of the initial lumpy material of both samples was carried out by analyzing the chemical composition into 8 elements: Fetotal and Femagn by titration; S-by weight; SiO2 by photocolorimetric method; MgO, CaO, Al2O3, and Na2O by atomic absorption method; and the granulometric composition of the samples was determined by sieve analysis in several stages using a set of sieves with grids with square holes of 50 mm, 20 mm, 10 mm, and 5 mm.
Dry magnetic separation of the ore samples under study was carried out on an SMBS-L laboratory drum magnetic separator with a magnetic induction value on the surface of the drum of the magnetic separator equal to B = 0.75 Tl, which provides maximum extraction of particles with magnetic properties and a rotation speed of the shell of the drum of the magnetic separator of 57 rpm, ensuring optimal distribution of major (magnetic force) and competitive forces (centrifugal force). Rotation velocity gearing up to 69 r/min increases the loss of Fetot with a non-magnetic fraction by 20%. The ore mass was fed to the rotating drum of the magnetic separator in a uniform flow due to the discharge of the receiving hopper by the vibrating feeder.
The described and implemented regime of dry magnetic separation, including magnetic field intensity on the surface of the magnetic separator shell and velocity of the magnetic separator drum shell, is considered as valid results of magnetic separation of the ferruginous quartzites of the Olenegorsk ore field [20] and a series of experiments on samples of the Kostomuksha, Korpangskoe deposit ores and their mixture, such as:
-
detailed lump analysis combined with flow cascade magnetic separation under different magnetic induction values on the magnetic separator drum surface (0.16 T, 0.32 T, 0.45 T, and 0.75 T), measuring of magnetic susceptibility using a SM-30 susceptimeter, and chemical analysis of each lump;
-
magnetic separation under different magnetic induction values on the magnetic separator drum surface (0.16 T, 0.32 T, 0.45 T, and 0.75 T) and rotation velocity of the magnetic separator drum shell (45 rounds per minute and 57 rounds per minute).
-
The mineralogical composition and textural features of rocks of dry magnetic separation products with a size of 5 mm to 80 mm with obtaining a quantitative assessment of these indicators were analyzed using macroscopic (visual) study of samples and detailed analysis of thin sections and polished thin sections by optical microscopy on an Axioplan II polarization microscope.
The initial ore and the processed product of dry magnetic separation were crushed on a jaw crusher of 80 × 150 in three operations under the conditions of a filled crushing space with a decrease in the gap between the jaws from operation to operation and then on a roll crusher in one operation to bring the sample material to the fineness class of −2 + 0 mm.
The disintegration scheme is shown in Figure 1: the power supply of the crusher and its unloading were subjected to a sieve analysis on sieves with square holes of 10 mm, 5 mm, 3.5 mm, and 2 mm. After each operation, the final product of crushing of the size class −2 + 0 mm was removed from the process. The mass of each sample of the initial ore was reduced by quartering to obtain a mass equal to or close to the mass of the magnetic separation product.
To make a comparative assessment of the amount of electricity spent on crushing the initial ore and the magnetic fraction of the dry magnetic separation in the process of bringing the material to a given size, the energy consumption of each of the operations of the disintegration process was measured. The power consumption was calculated by the number of pulses of the electric meter light indicator, for which 800 imp corresponds to 1 kW·h.
To assess the effect of the dry magnetic separation on the crushing results, a representative sample was selected from each sample, the amount of which was determined by Chechotte’s empirical formula [21]. The following parameters were analyzed:
-
granulometric composition of the crushing products of the −2 + 0 mm size class, determined by the sieve analysis in one stage, using a set of sieves with grids with square holes of 2 mm, 1 mm, 0.63 mm, 0.4 mm, 0.2 mm, 0.1 mm, and 0.045 mm;
-
ore mineral liberation in the crushing products of the initial and processed ore, selected during the classification of size classes: +2 mm, −2 + 1 mm, −1 + 0.63 mm, −0.63 + 0.4 mm, −0.4 + 0.2 mm, −0.2 + 0.1 mm, −0.1 + 0.045 mm, and −0.045 + 0 mm, in the created artificial preparations based on epoxy resin in reflected polarized light on a polarization microscope Axioplan II.

3. Results

The study of the initial material of iron ore samples (size class of −80 + 0 mm) from the Kostomuksha and Korpangskoe deposits has shown that their chemical and material composition are almost identical. Deviations in the contents of the studied chemical compounds are within 0.5% absolute (Table 1).
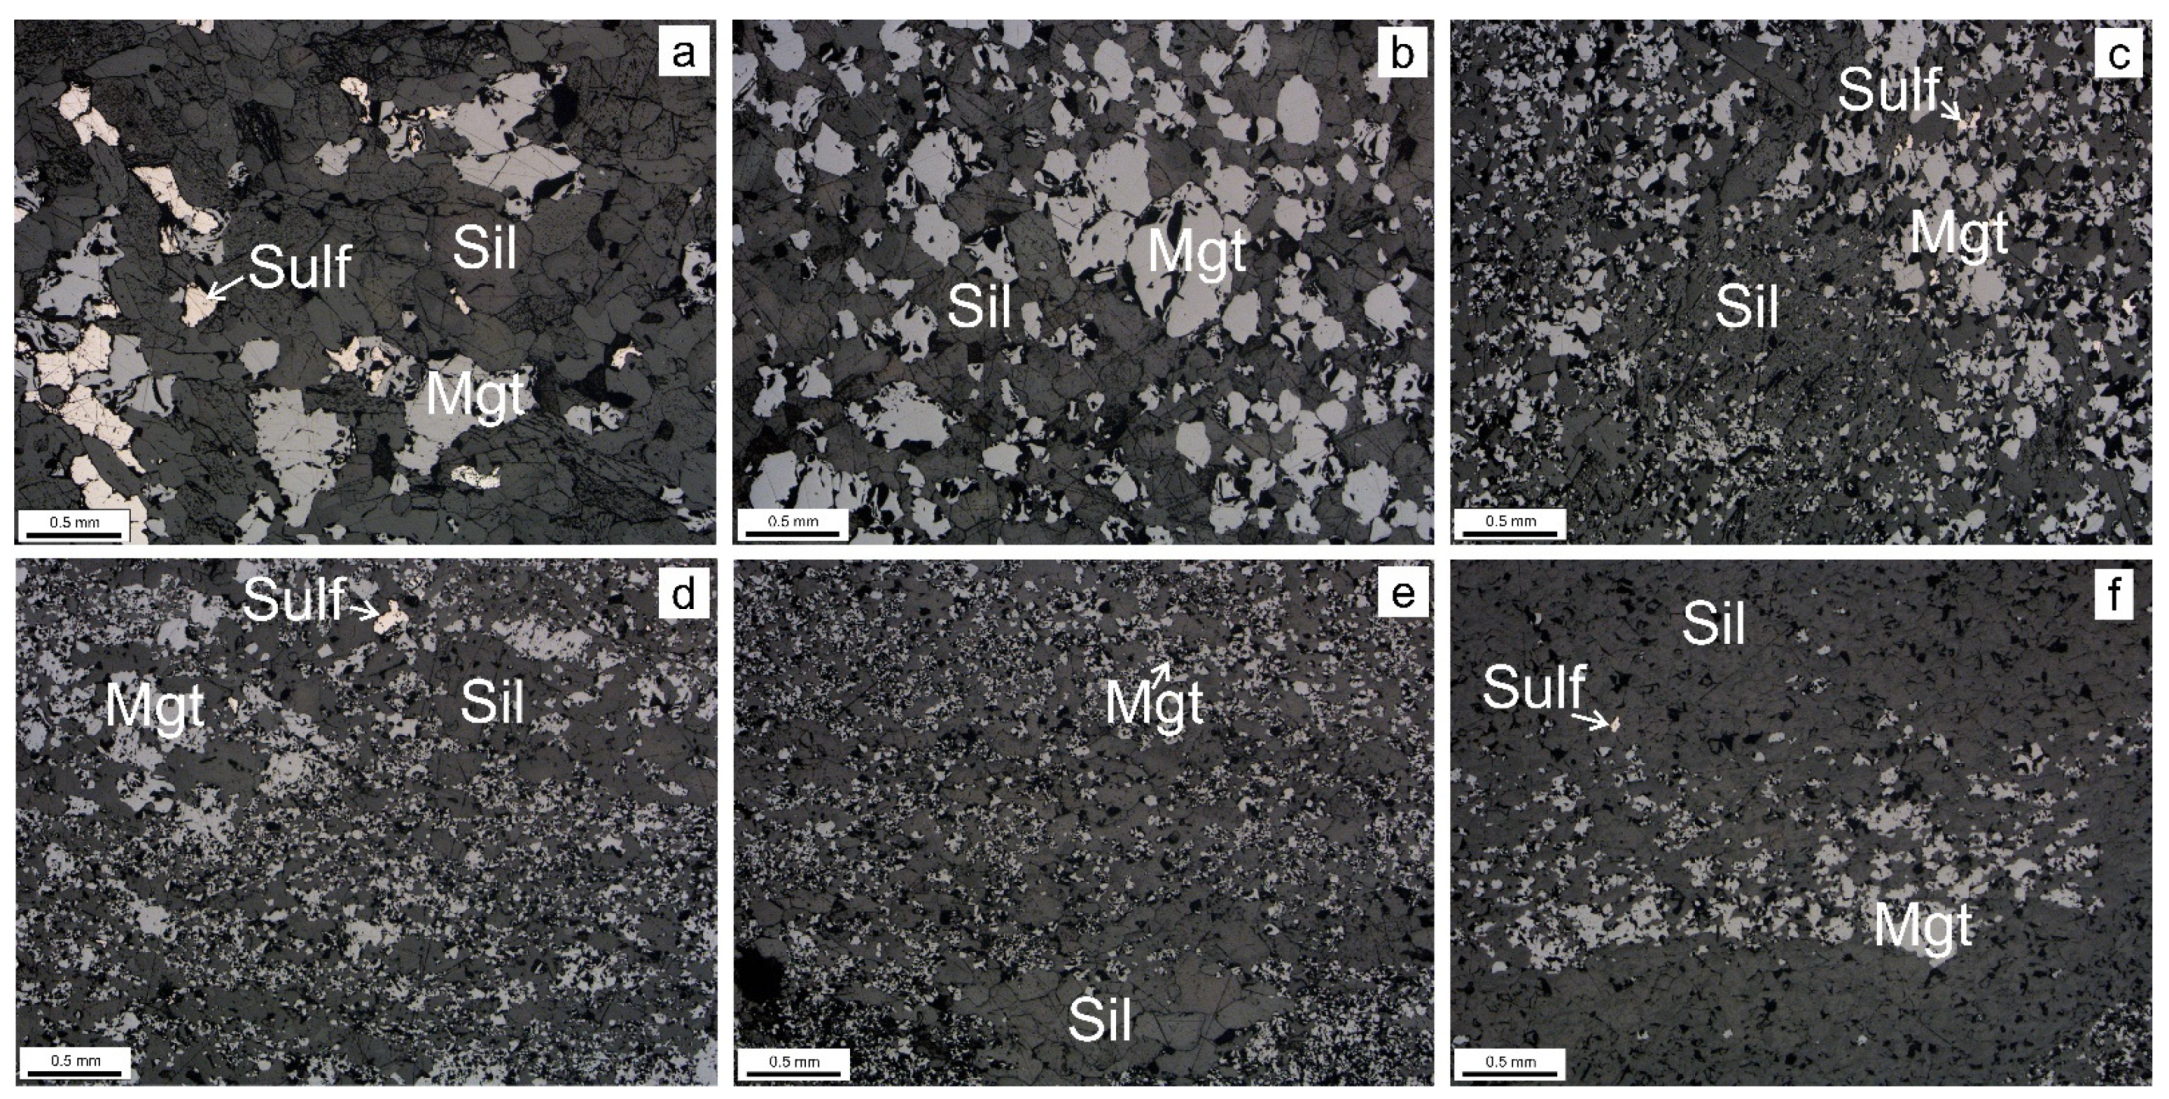
The petrographic composition of studied iron ore samples is given in Table 2. The refractory ore sample (Kostomuksha deposit) is presented mainly by weakly banded ferruginous quartzites I with fine-grained (>0.2 mm) magnetite (Figure 2d–f). Ferruginous quartzites II occur as a weakly banded rock with medium-grained (0.5–1 mm) magnetite (Figure 2a–c) and are presented in the free-milling ore sample of the Korpangskoe deposit. The amount of ferruginous quartzites II with medium-grained magnetite is greater in five times in the free-milling ore sample.
According to the results of ore mass distribution analysis by size, in the Kostomuksha deposit ore sample, the size class −80 + 50 mm predominates by 55.8%; in the sample of the Korpangskoe deposit, the highest yield is in the size class −50 + 20 mm, −45.04% (Table 3). The yield of particle size classes with particle sizes less than 20 mm is close and amounts to 18.12% and 17.34%.
Table 4, Table 5 and Table 6 present the results of dry magnetic separation (DMS) of an iron ore sample of size class −80 + 0 mm.
It has been established that technological parameters of dry magnetic separation of initial and classified ore mass differ insignificantly. E.g., for an iron ore sample of the Kostomuksha deposit, the yield of the non-magnetic fraction was 12.40 and 10.35%, and the Fetotal in it was 5.70 and 5.36%, respectively, for the ore mass of the initial and classified size, which indicates the lack of necessity of the process of classification of ore mass before dry magnetic separation (Table 7).
The mineralogical and petrographic composition of the non-magnetic products of all the studied samples of size class −80 + 0 mm is represented by the host complex rocks, as well as, probably, boulder and pebble material of overburden rocks, mainly diorites, amphibole schists, amphibolite, granites, and pegmatites.
The rocks of the magnetic product are mainly represented by ferruginous quartzites: medium- to fine-grained, uneven-grained, weakly banded, massive textures. The following varieties are distinguished: containing one or two types of amphiboles and micaceous ferruginous quartzites. The content of silicates and quartz varies in the range of 20% to 60% (Figure 2). The scale shown in the upper-left corner of the first thin section applies to all others. Ore minerals are represented by magnetite, hematite, and sulfides. The size of the magnetite impregnation is from the first microns up to 1 mm (Figure 3).
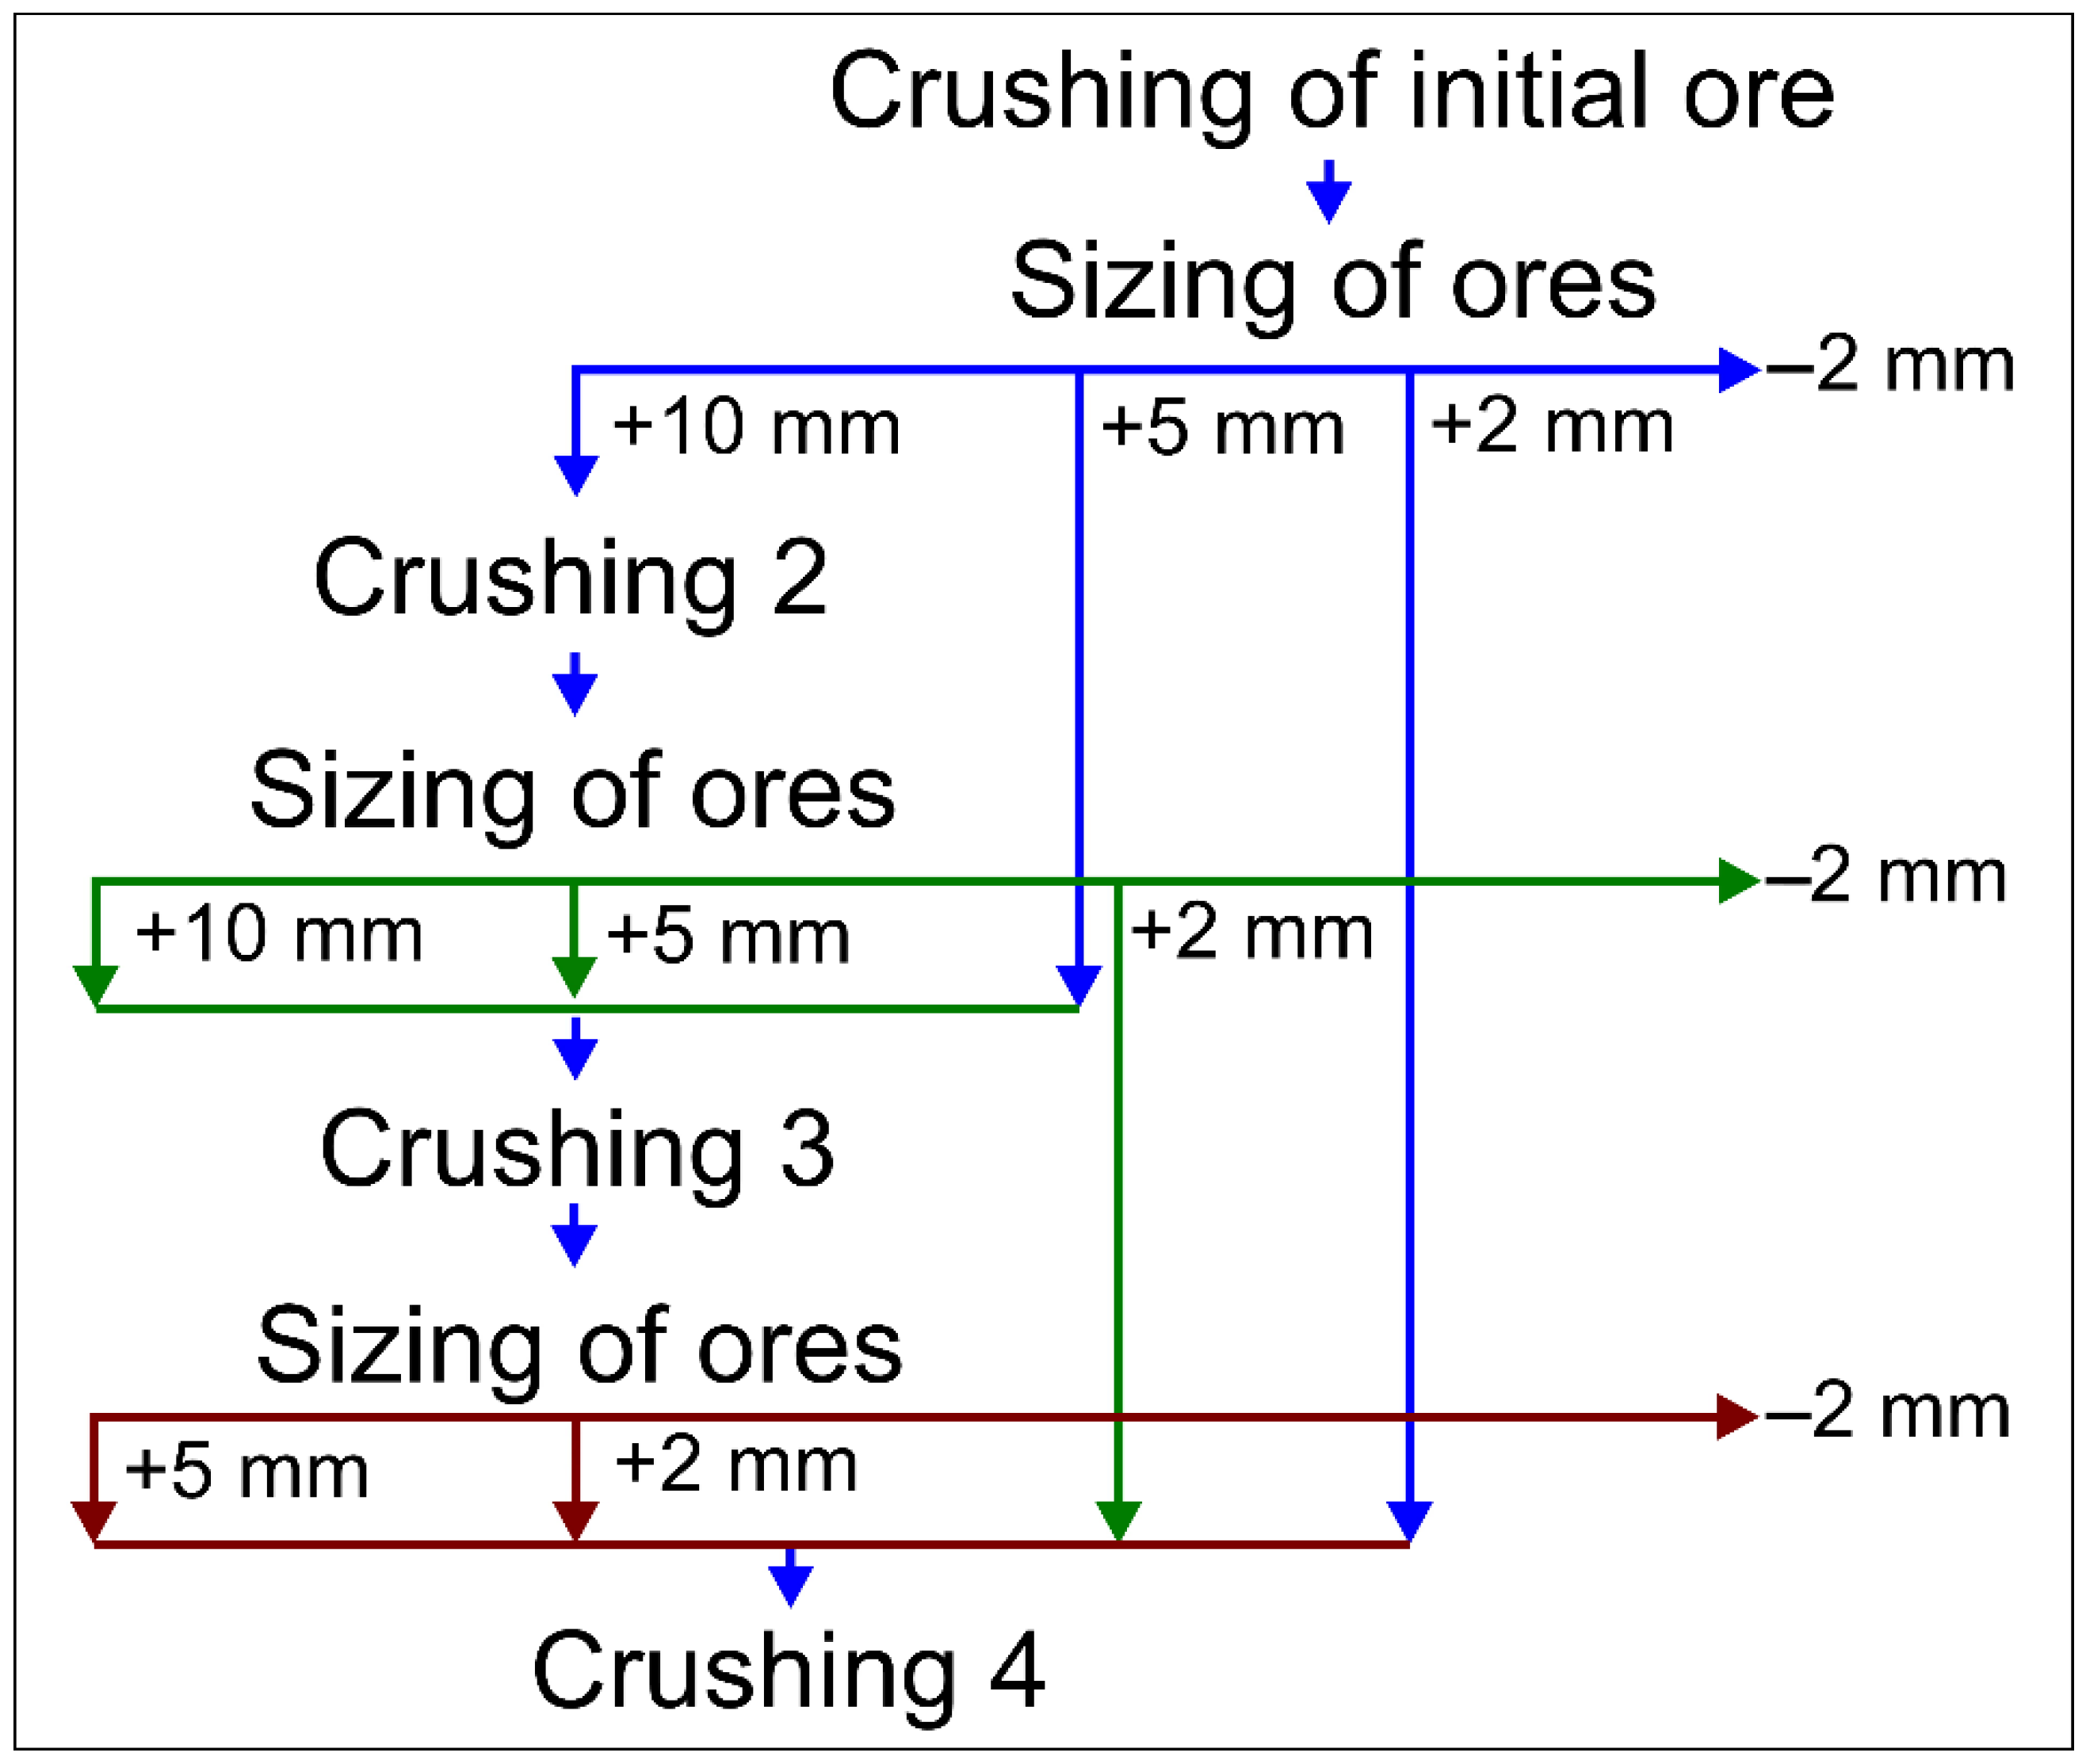
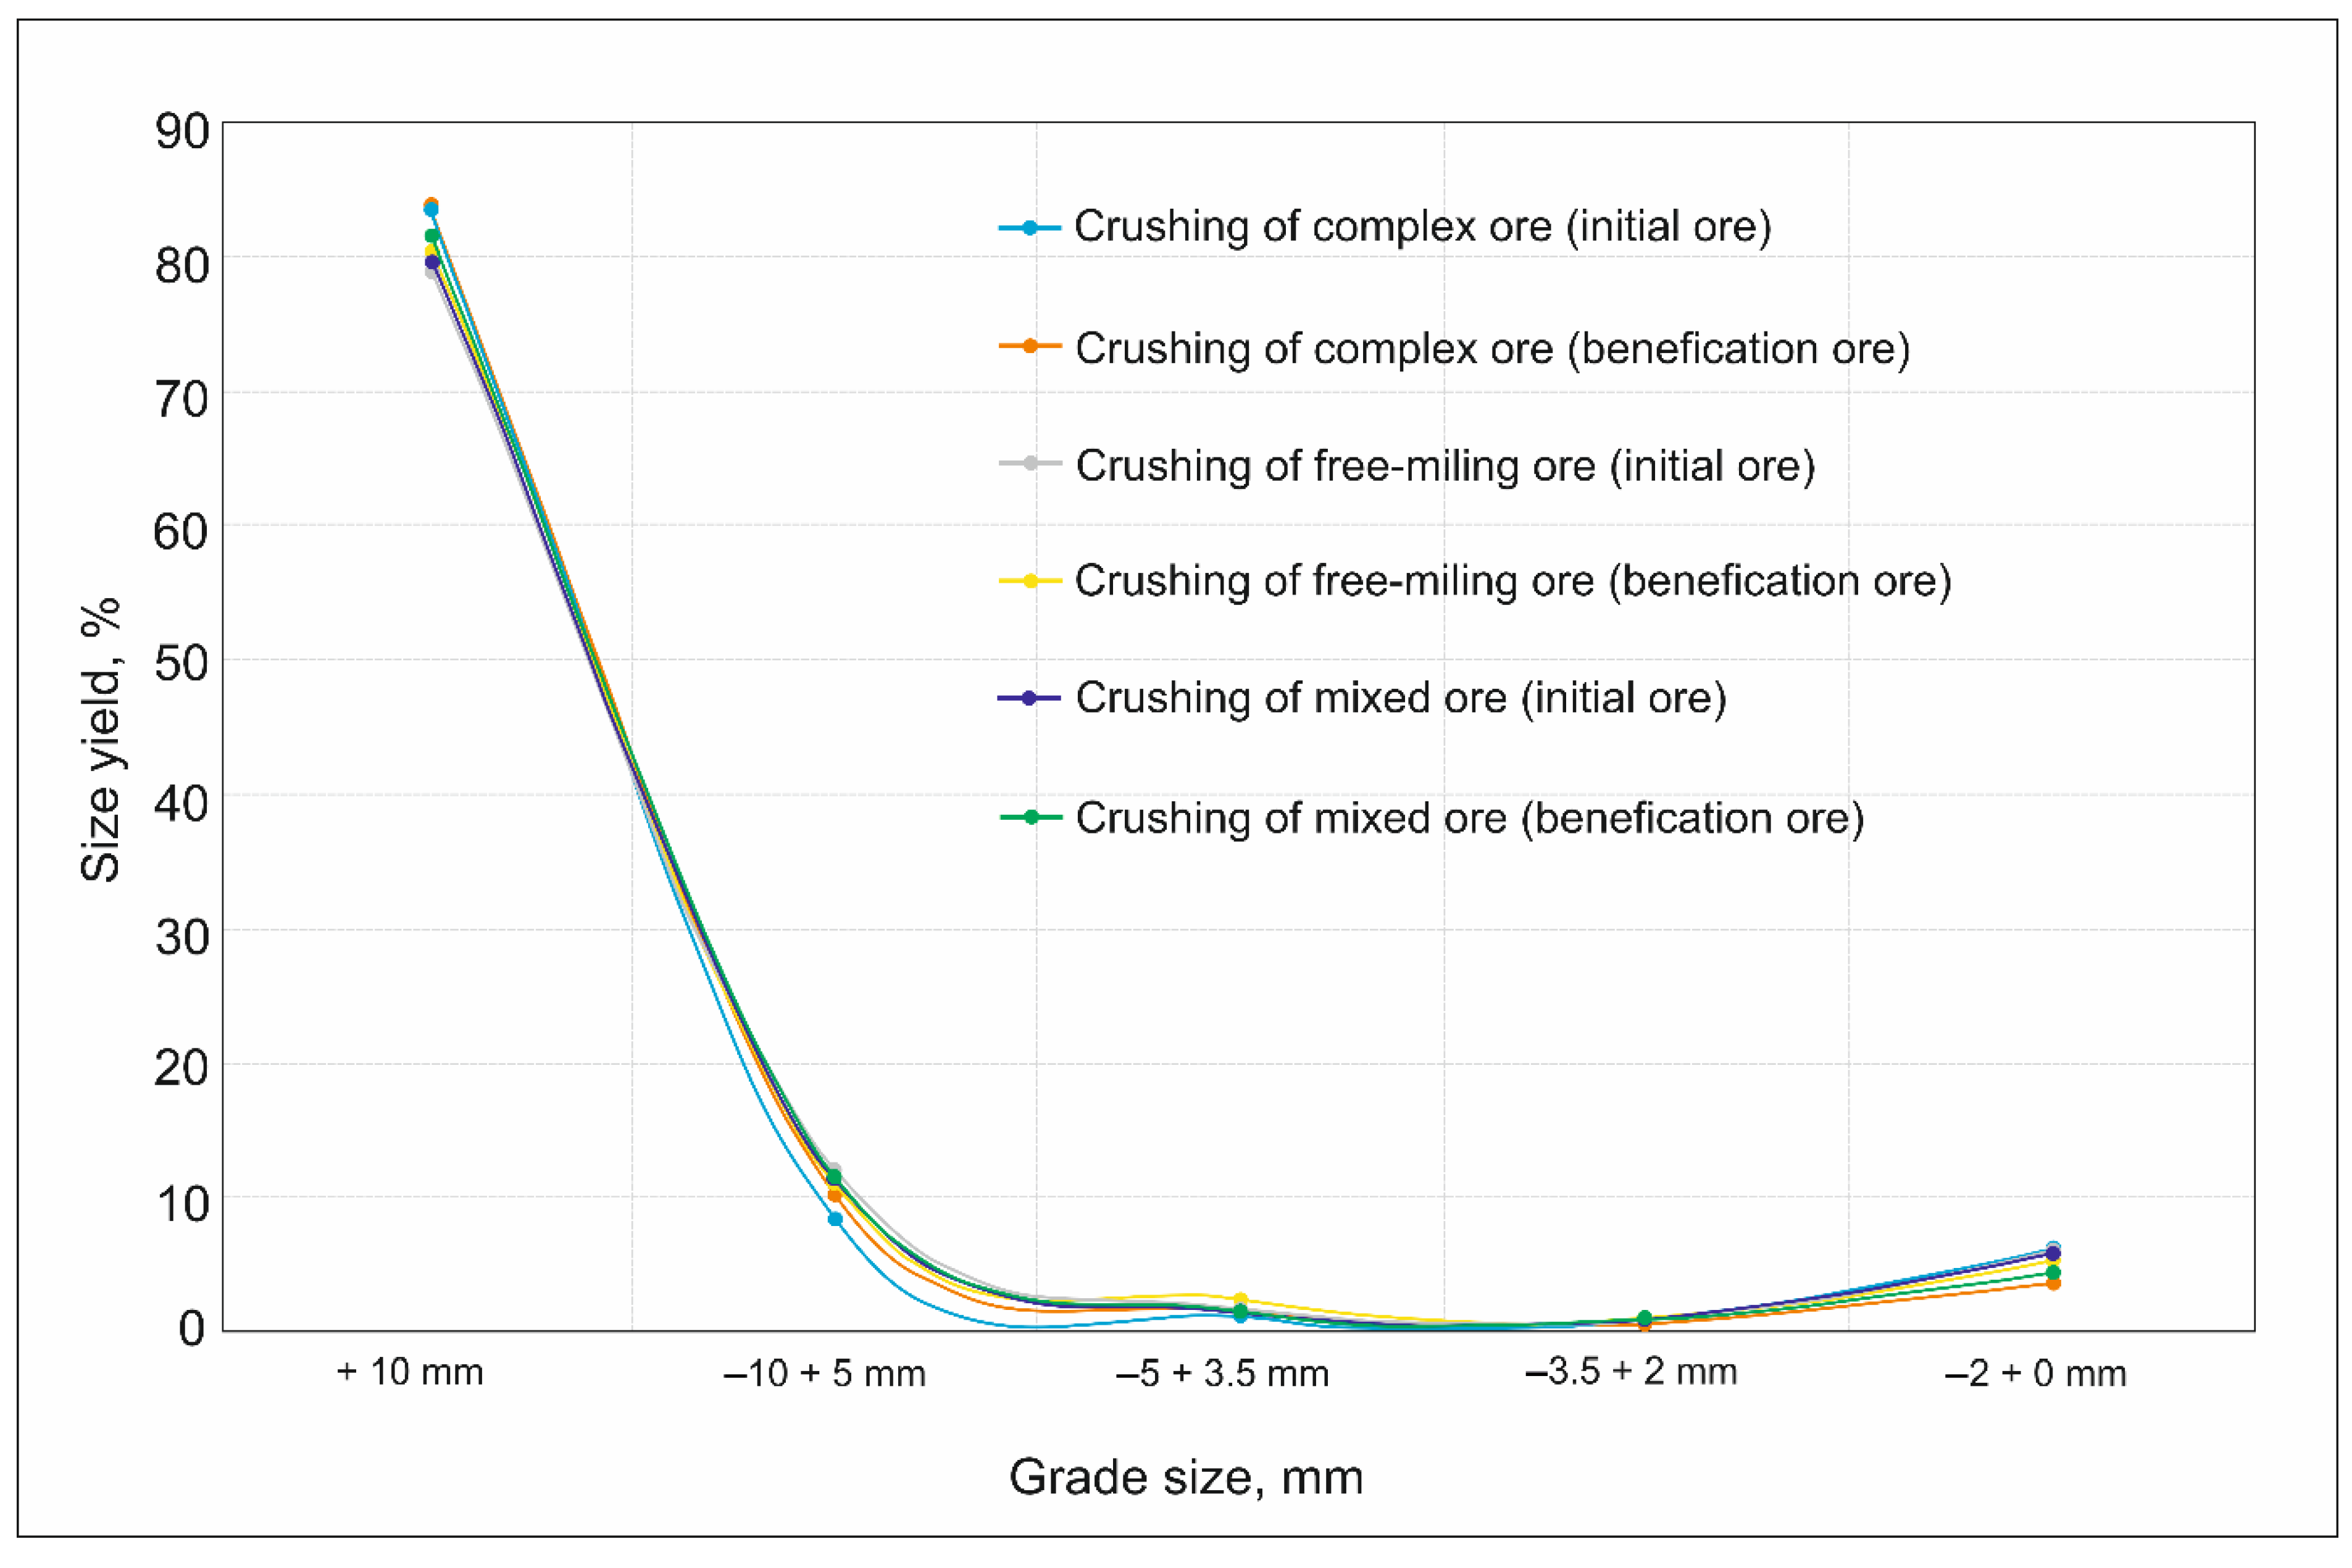
The granulometric composition of crushing products of the initial and processed ore of the intermediate disintegration stages and the final (more than 94% of the size class −2 + 0 mm), namely the yield of size classes, in most cases coincide; the variations are minimal and do not exceed 2% absolute (Figure 4, Table 8).
Figure 5 shows a histogram of the energy consumed when bringing the samples’ ore mass to a particle size of less than 2 mm. A decrease in the energy consumption for crushing the magnetic separation product in relation to the crushing of the source ore material has been found:
-
for an ore sample from the Kostomuksha deposit by 5%;
-
for an ore sample from the Korpangskoe deposit by 8%;
-
for a mixture of ore samples from the Kostomuksha and Korpangskoe deposits by 6%.
Table 9 presents the names of the polished sections prepared for the assessment of the liberation of ore minerals in the crushing products of the initial and processed ore. The yield of the size classes indicated in Table 9 is shown in Table 8. The polished sections consist of the required amount of the tested substance and epoxy resin.
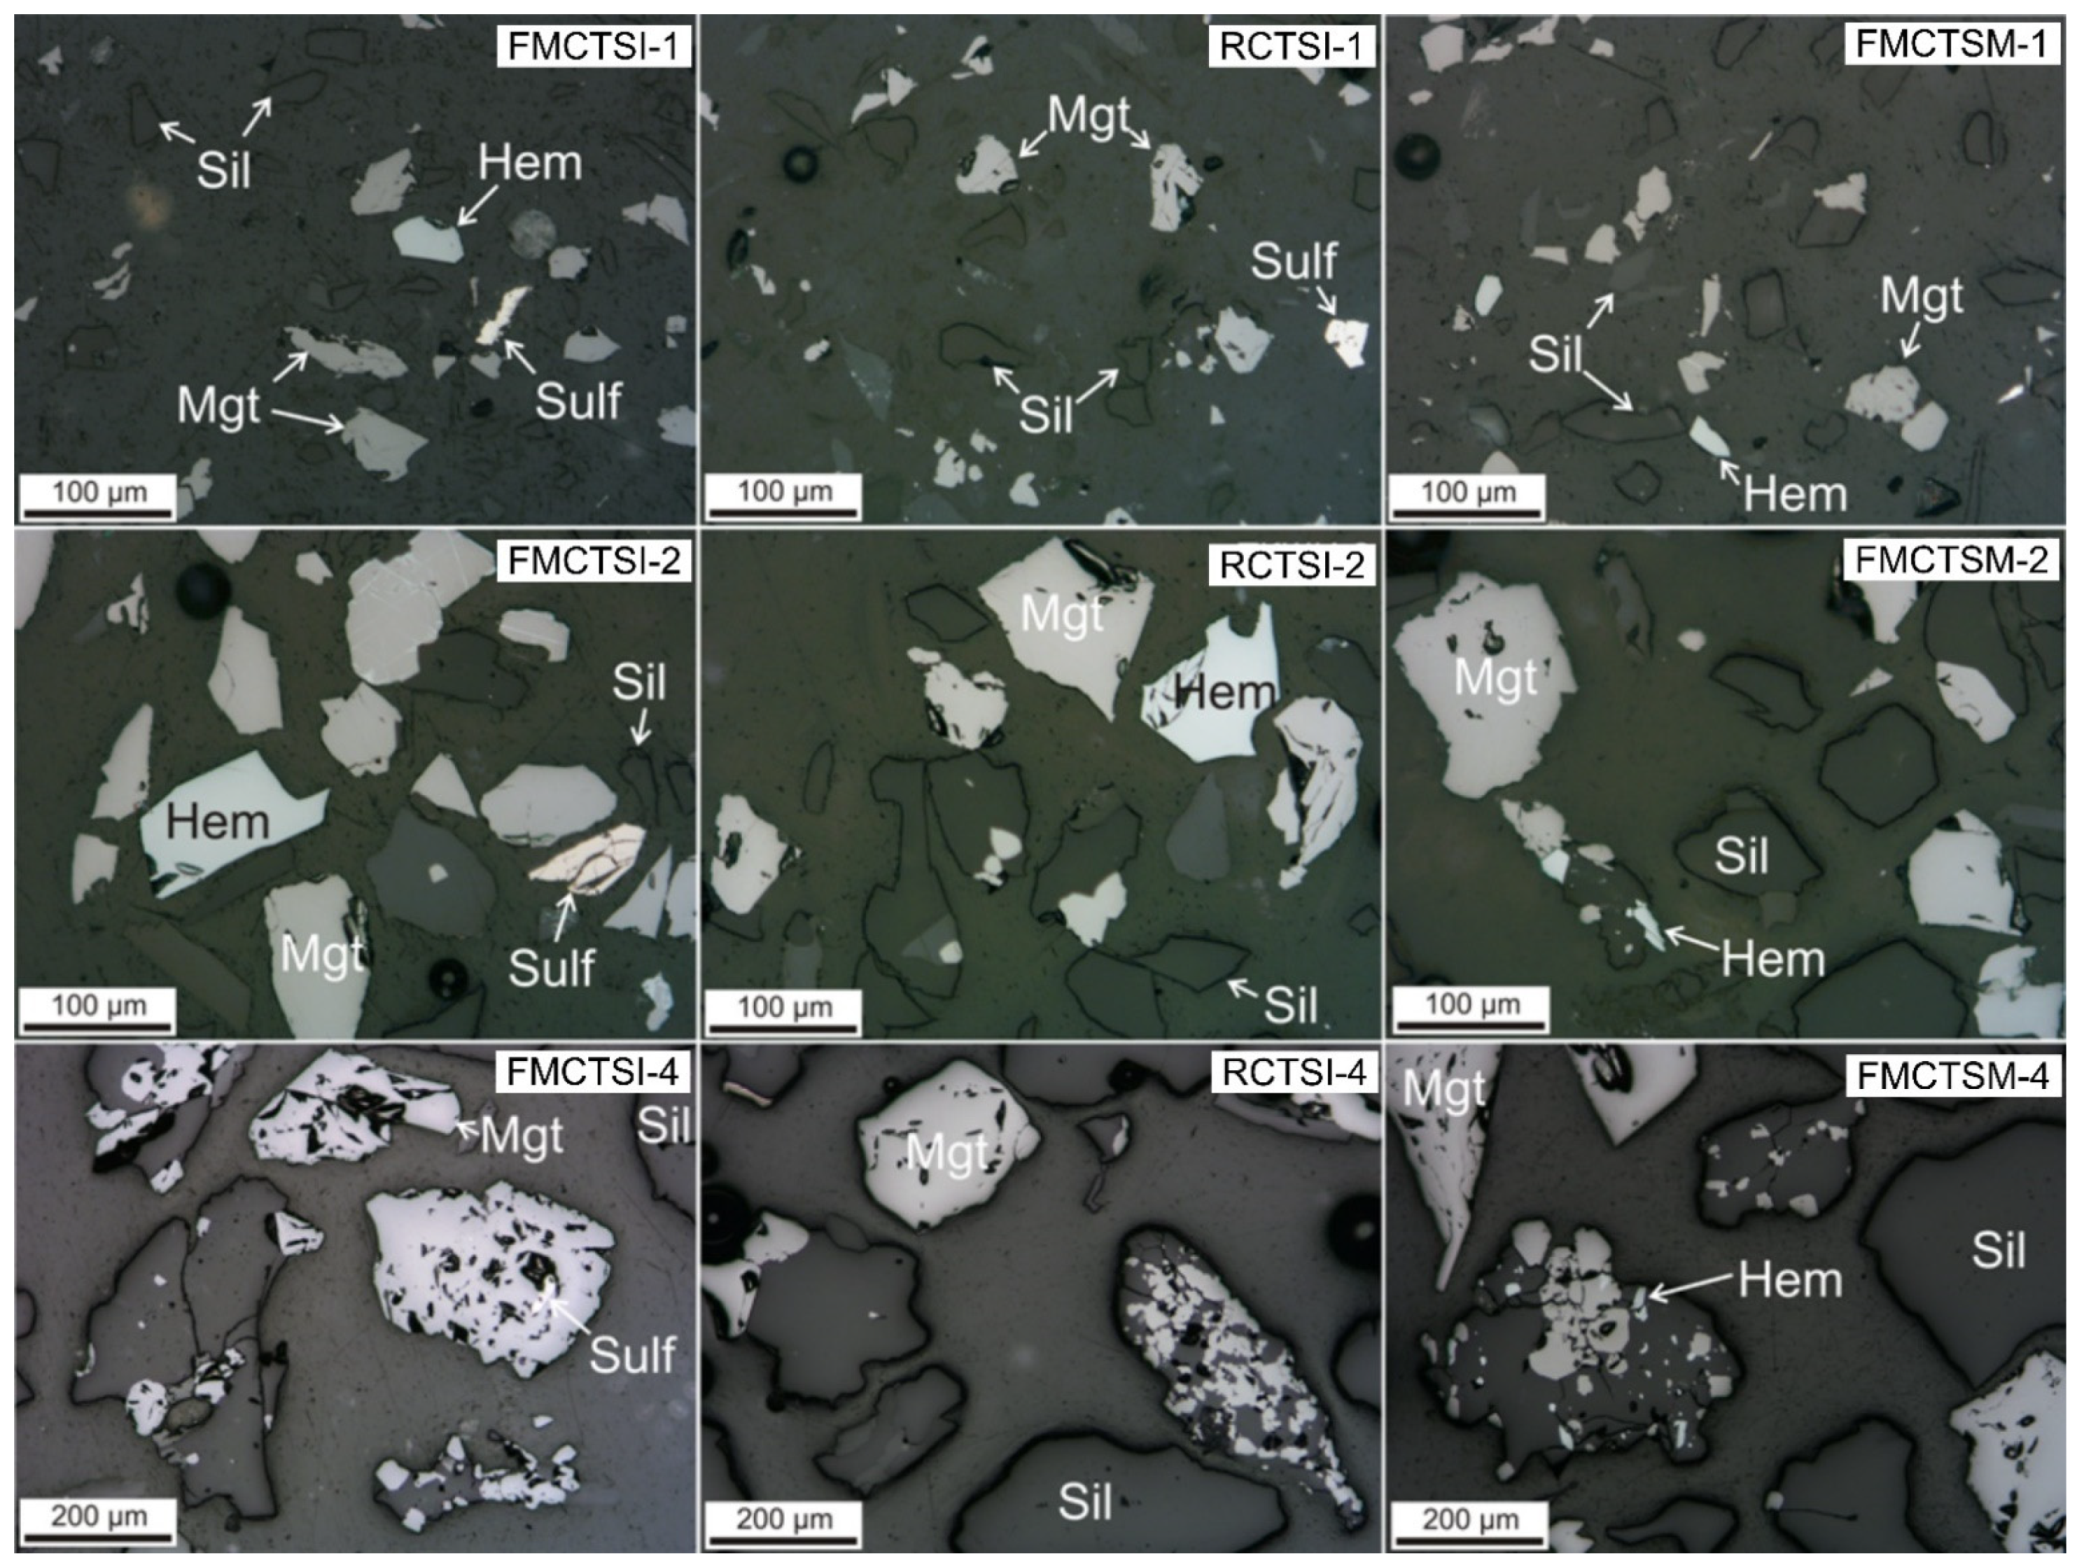
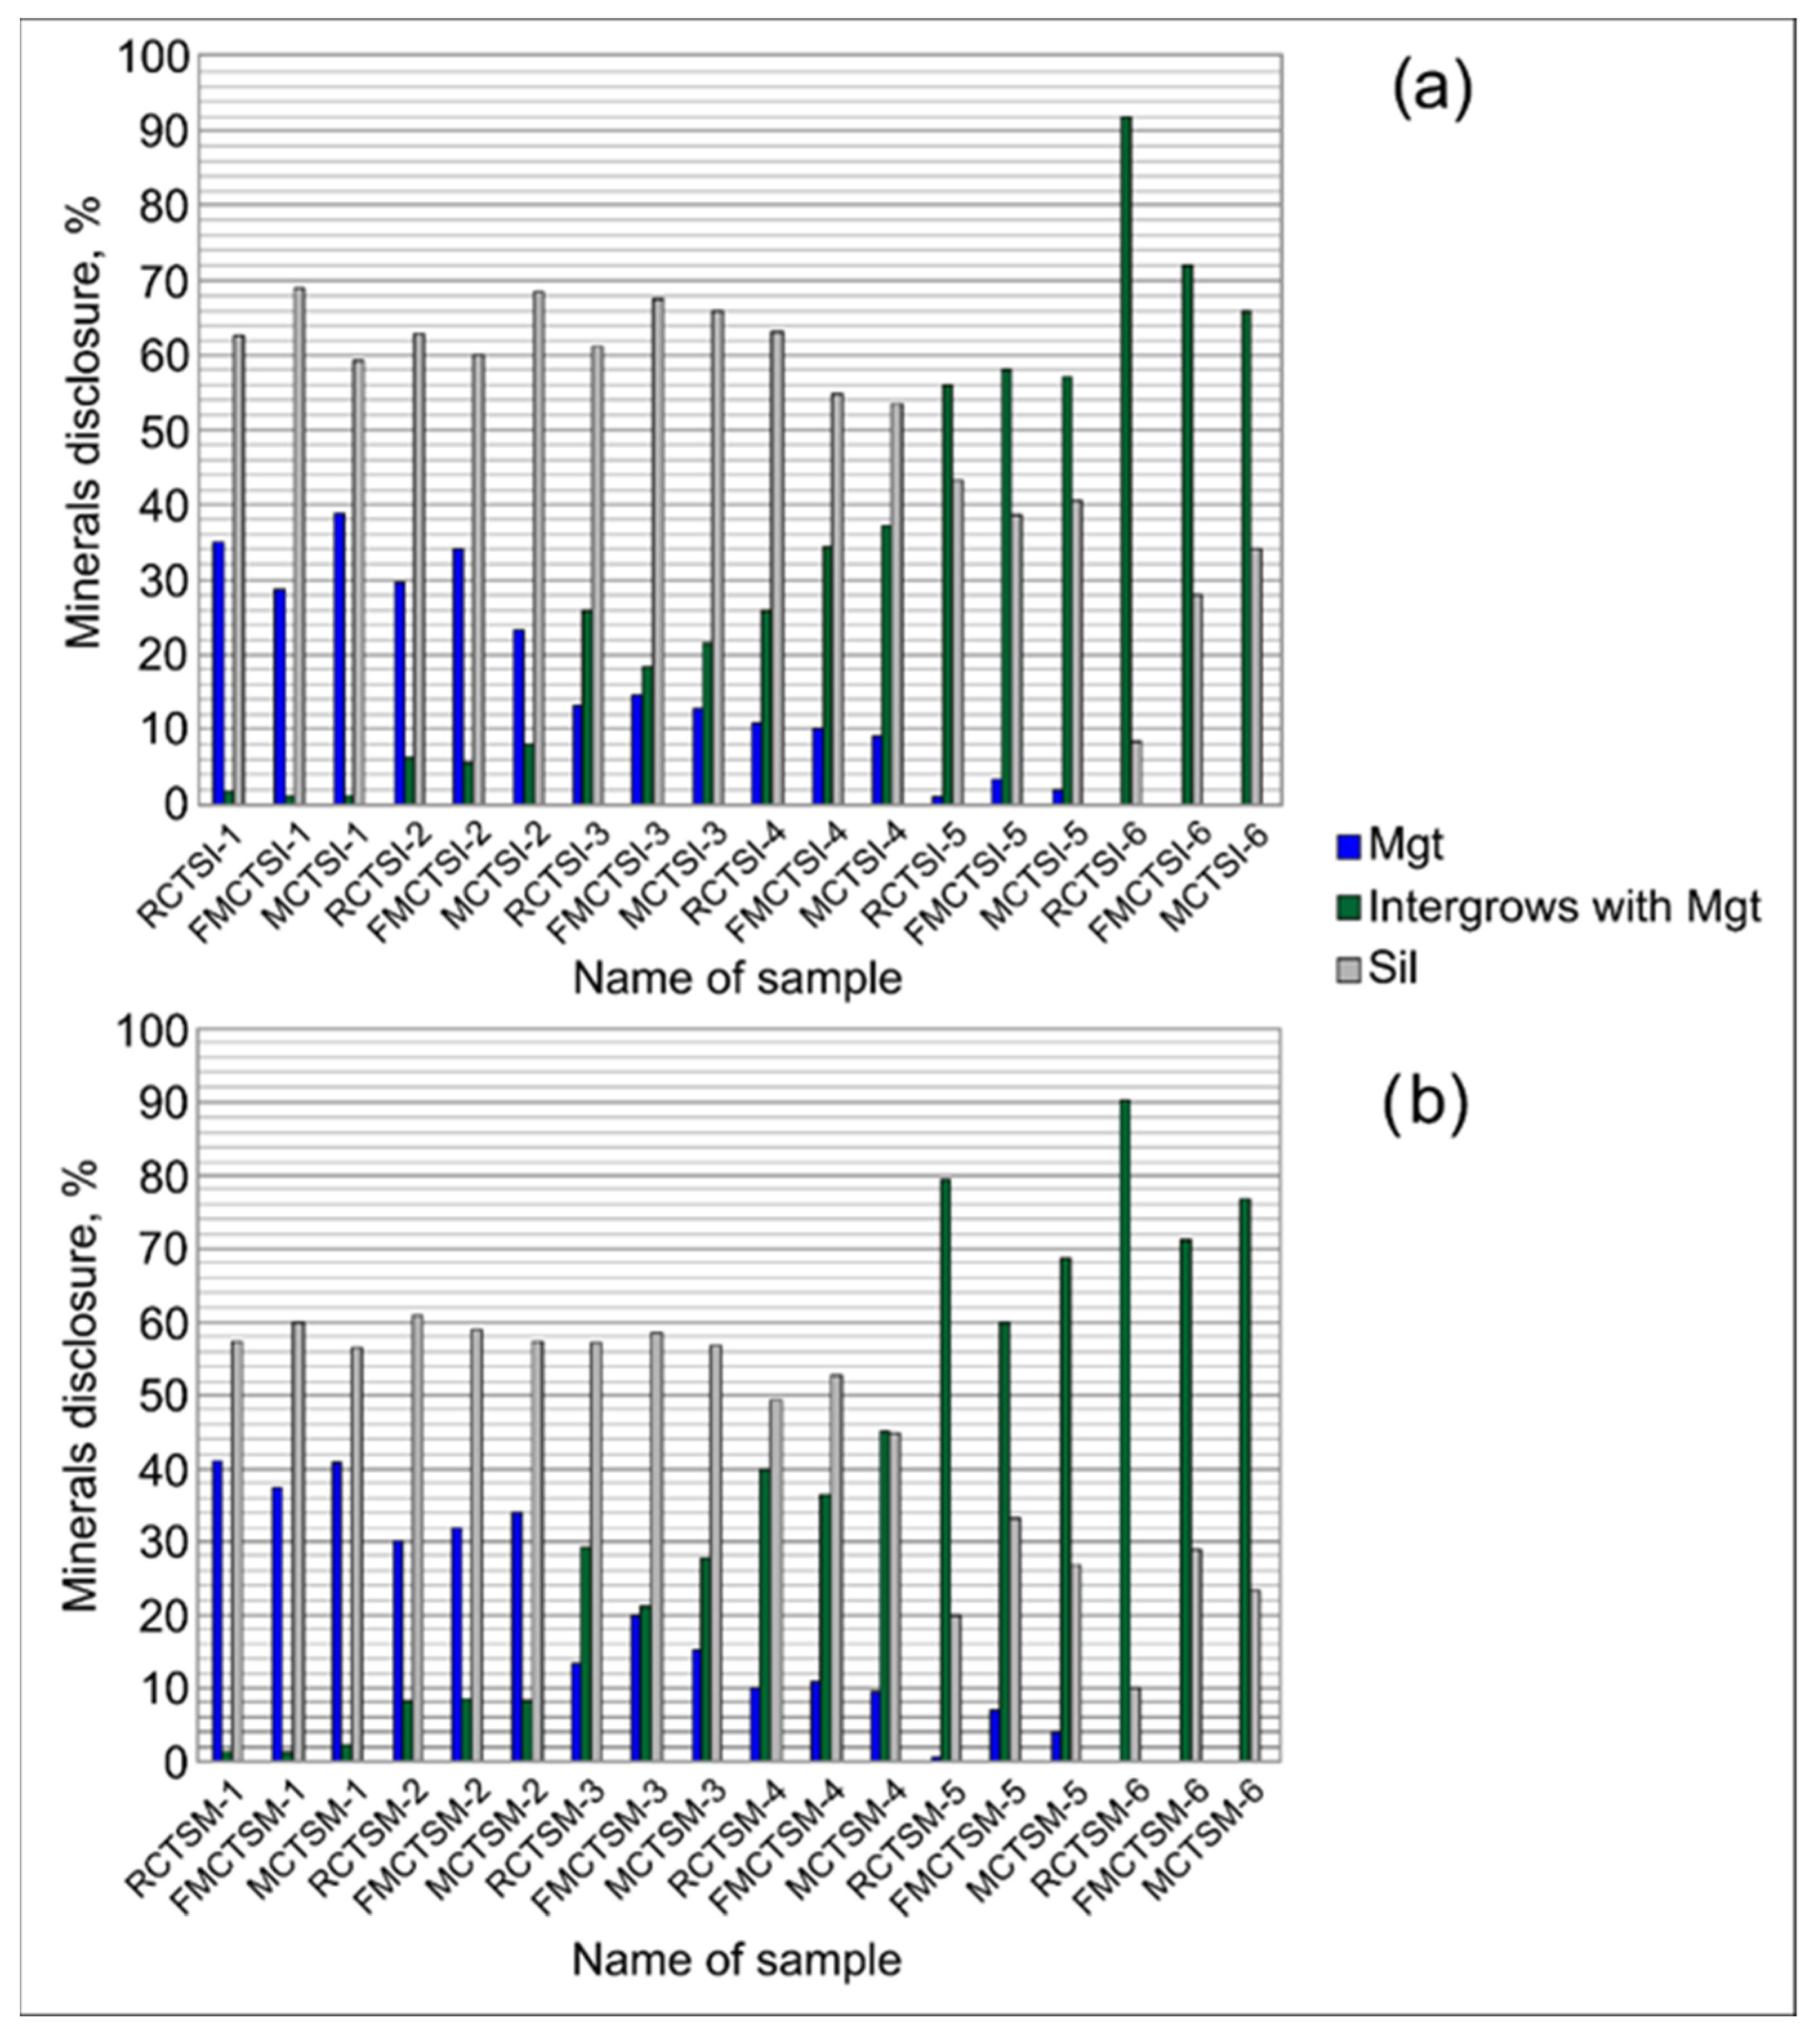
Table 10 shows the results of quantitative evaluation of the disclosed grains of some minerals: magnetite, hematite, sulfides, and the intergrows of these minerals with each other and silicates (Figure 6) in the combined size class –0.63 + 0.045 mm.

4. Discussion

Analysis of the results of dry magnetic separation of ferruginous quartzites (Table 4, Table 5 and Table 6) indicates its high efficiency on samples of ferruginous quartzites from the Kostomuksha ore field of the size class −80 + 0 mm. More than 98% Femagn and at least 96% Fetotal are extracted into the magnetic product.
The results of dry magnetic separation of refractory and free-milling ore samples performed separately and in the mixture indicate minor changes in the technological parameters of separation, namely:
-
the yield of a non-magnetic product varies from 12.4% to 13.5%,
-
the Fetotal content in the magnetic product increases by 1.11–1.14 times,
-
the amount of Fetotal losses with a non-magnetic product varies in the range of 2.4–3.6%, which means that there is no need for additional preparation of ore from different deposits separation. In addition, the amount of harmful impurities is reduced by at least 15%: S by 16.2–17.3%, SiO2 by 15.5–21.1%, and Al2O3 by 39.1–48.4%, which negatively affect the properties of the metal or the iron smelting (destroying the elements of the blast furnace).
It was found that due to the removal by dry magnetic separation of a non-magnetic product in the amount of 12.3–14.5%, represented by non-magnetite or weakly mineralized rock varieties (Table 2) which are close to the ferruginous quartzites on their strength properties or exceed this reduced energy consumption for the crushing by at least 5% (reducing the size class from −80 + 0 mm to −2 + 0 mm). The most energy-consuming (44.1–49.3% of the total energy consumption spent on bringing the sample material to the size class −2 + 0 mm), regardless of the sample affiliation, is the third stage of crushing the ore mass of the size class −10 + 5 mm (Figure 1).
For the processed ore from the Kostomuksha deposit, the crushing time was reduced by 23% compared to the crushing of the initial ore of the same mass. For the sample from the Korpangskoe deposit and the mixture, there are no significant differences (1–2%).
Analysis of the crushing products of the size class −1 + 0 mm revealed the presence of small amounts of hematite (0.63–1.99% Hem), both in free form and in aggregates with magnetite and silicates (Table 10).
As noted above, the main macroscopic mineralogical and petrographic differences in ore samples from the Kostomuksha and Korpangskoe deposits are the content of lumps with larger magnetite, which explains their classification as refractory and free-milling ores and is reflected in the results of the study of the liberation of ore minerals in the crushing products of the initial and processed ore (Figure 7).
Mostly liberated magnetite is contained in the size class −0.4 mm. A small amount of magnetite is present in the fineness class −0.63 + 0.4 mm (less than 0.26%) and in the size class +0.63 mm; all magnetite is present in the aggregates.
It was found that in the magnetic separation product of the ore sample from the Kostomuksha deposit, the amount of liberated magnetite in the size class −1 + 0 mm increases by 12.1% compared to the initial ore sample. For the sample of the Korpangskoe deposit, the opposite trend is observed: a decrease in the amount of free magnetite by 30.9% in the magnetic product. Analysis of the magnetite liberation in the mixture indicates a deterioration in the results obtained during the separate crushing of refractory and free-milling ore and a decrease in the amount of open magnetite in the magnetic product by 60% compared to the initial ore.
In the aggregates, magnetite is found with hematite (Hem), sulfides (Sulf), and silicates (Sil). Two types of magnetite aggregates with silicates are distinguished: 1—an aggregate composed of relatively large magnetite and silicates, where hematite and sulfides may be present; 2—a thin impregnation of magnetite in silicate, where hematite may also be present, and less often sulfides. In the initial ore, the magnetite aggregates with silicates are represented by the second type.
The amount of magnetite with sulfides (Mgt + Sulf) and with hematite and silicates (Mgt + Hem + Sil) in the magnetic separation product for all samples decreases. For magnetite aggregates with hematite (Mgt + Hem), the tendency of a decrease in their quantity is noted for samples of the Korpangskoe deposit and the mixture. Since the refractory ore contains more fine phenocrysts of magnetite in silicates, the percentage of aggregates is higher both in the original ore and in the magnetic fraction than in the free-milling ore and mixture.
The diagram (Figure 7) shows that the initial ore, unlike the magnetic product, contains more liberated silicates.

5. Conclusions

The textural and structural features, material (rock varieties), and granulometric composition of ferruginous quartzite samples from the Kostomuksha and Korpangskoe deposits of the Kostomuksha ore field do not have a significant impact on the technological parameters of the primary ore preparation processes: dry magnetic separation and disintegration (reduction of grain size class from −80 + 0 mm to −2 + 0 mm). Therefore, they do not require separate implementation of dry magnetic separation of refractory and free-milling ore samples. Moreover, it is noted that when crushing a mixture of ore samples, the overall energy consumption is reduced: the energy consumption when crushing a mixture of ore samples is reduced for the original ore by 8.8%, and for the magnetic product by 9.1% compared to separate crushing.
Analysis of mineral liberation indicates a significant decrease in the yield of free magnetite during crushing of a mixture of magnetic products of refractory and free-milling samples (for the initial ore the amount of liberated magnetite is almost the same), as well as an increase in the amount of magnetite aggregates with sulfides, hematite, and silicates by 3.2–4.6% absolute.
The presented results of the mineral liberation during the crushing determine the feasibility and effectiveness of the implementation of separate crushing. In the future, to confirm this thesis, it is necessary to evaluate the distribution of free minerals and aggregates after the crushing processes.

Author Contributions

Disintegration and dry magnetic separation process analysis, D.N.S. and S.V.T.; mineralogical investigation, A.A.K.; literature review, S.V.T. and A.A.K.; illustration and table preparations, D.N.S. and A.A.K. All authors have read and agreed to the published version of the manuscript.

Funding

This research was funded by R&D state task №0232-2016-0007 “Development of methods for managing the ore quality characteristics based on pre-concentration and ore preparation for mineral deposits in the Arctic zone” (2016–2018).

Data Availability Statement

Data available on request from corresponding author.

Acknowledgments

The authors are grateful to anonymous reviewers and the Editor for their help on improving this paper.

Conflicts of Interest

The authors declare no conflict of interest.

References

  1. Sevostyanov, V.S.; Uralsky, V.I.; Sevostyanov, M.V. Resource and Energy-Saving Equipment and Complexes for Processing of Natural and Secondary Materials; Belgorod State Technological University: Belgorod, Russia, 2017; 315p. (In Russian) [Google Scholar]
  2. Pelevin, E.V. Technology of magnetite ore beneficiaiton and ways to improve the quality of iron concentrates. Min. J. 2011, 4, 20–28. [Google Scholar]
  3. Zong, Q.X.; Fu, L.Z.; Bo, L. Variables and Applications on Dry Magnetic Separator. In Proceedings of the 3rd International Conference on Advances in Energy and Environmental Research (ICAEER 2018), Guilin, China, 10–12 August 2018; Volume 53, pp. 1–9. [Google Scholar] [CrossRef]
  4. Kern, M.; Tusa, L.; Leißner, T.; Boogaart, K.G.V.D.; Gutzmer, J. Optimal sensor selection for sensor-based sorting based on automated mineralogy data. J. Clean. Prod. 2019, 234, 1144–1152. [Google Scholar] [CrossRef]
  5. Kolacz, J. Sensor based sorting with signal pattern recognition: The new powerful tool in mineral processing. In Proceedings of the XXVII International Mineral Processing Congress, Santiago, Chile, 20–24 October 2014; pp. 106–115. [Google Scholar]
  6. Chanturia, V.A. Modern problems of mineral processing in Russia. Eur. J. Miner. Process. Environ. Prot. 2001, 1, 25–41. [Google Scholar]
  7. Mohanty, S.; Nayak, B.; Bhattacharyya, K.K. High intensity magnetic separation of iron ore slime and its limitations. In Proceedings of the XI International Seminar on Mineral Processing Technology, Jamshedpur, India, 15–17 December 2010; pp. 173–178. [Google Scholar]
  8. Valery, W.; Duffy, K.; Reple, A.; Prati, F.; Holtham, P.; Walker, P. Evaluation of bulk ore sorting for pre-concentration of copper ore at PanAust Phu Kham operation. In Proceedings of the 24th World Mining Congress, Rio de Janeiro, Brazil, 18–21 October 2016; pp. 145–154. [Google Scholar]
  9. Ermolovich, E.A. Technology of iron ore processing waste as a way to control a source of negative environmental impact. Min. Inf. Anal. Bull. 2009, 12, 375–379. [Google Scholar]
  10. Chetverik, M.S.; Babii, E.V.; Bubnova, E.A.; Tereschenko, V.V. The main directions of the rational nature management in open pit mining. Gorn. Vestn. 2013, 1, 58–62. [Google Scholar]
  11. Tereshchenko, S.V.; Shibaeva, D.N.; Alekseeva, S.A. X-Ray Luminescence Separation of Khibiny Low-Grade Apatite Ore. J. Min. Sci. 2019, 55, 124–133. [Google Scholar] [CrossRef]
  12. Chernyavsky, V.I. Prospects of development of the Kostomuksha iron ore deposit in the KSSR. Proc. Karelian Branch Acad. Sci. USSR 1961, 32, 3–16. [Google Scholar]
  13. Slabunov, A.I.; Lobach-Zhuchenko, S.B.; Bibikova, E.V.; Balagansky, V.; Sorjonen-Ward, P.; Volodichev, O.I.; Shchipansky, A.A.; Svetov, S.; Chekulaev, V.P.; Arestova, N.A.; et al. The Archean of the Baltic Shield: Geology, Geochronology, and Geodynamic settings. Stratigr. Geol. Correl. 2006, 40, 409–433. [Google Scholar] [CrossRef]
  14. Chekulaev, V.P.; Arestova, N.A. Archean Metaterrigenous Rocks of the Karelian Province: Geological Position, Geochemistry, Sediment Provenance. Strat. Geol. Correl. 2020, 28, 693–715. [Google Scholar] [CrossRef]
  15. Kuleshevich, L.V.; Furman, V.N. The taloveis gold deposit in the precambrian Kostomuksha greenstone belt, Karelia. Geol. Ore Depos. 2009, 51, 51–67. [Google Scholar] [CrossRef]
  16. Gorkovets, V.Y.; Raevskaya, M.B. Geology and ore content of geological formations of the Kostomuksha iron ore district. In Large and Super-Large Deposits: Patterns of Location and Formation Conditions; IGEM RAS: Moscow, Russia, 2004; pp. 95–109. (In Russian) [Google Scholar]
  17. Gorkovets, V.Y.; Sharov, N.V. Kostomuksha Ore Area (Geology, Deep Structure and Mineralogeny); Karelian Research Centre RAS: Petrozavodsk, Russia, 2015; 322p. (In Russian) [Google Scholar]
  18. Arsen’ev, V.A.; Sentemova, V.A.; Yadryshnikov, A.O. Changing the topology of the schemes of magnetic enrichment of iron ores in order to reduce energy costs. Gorn. Inf. Anal. Byulleten 2000, 11, 224–231. (In Russian) [Google Scholar]
  19. Slabunov, A.I.; Nesterova, N.S.; Egorov, A.V.; Kuleshevich, L.V.; Kevlich, V.I. Age of the Archean Strata with Banded Iron Formation in the Kostomuksha Greenstone Belt, Karelian Craton, Fennoscandian Shield: Constraints on the Geochemistry and Geochronology of Zircons. Geochem. Int. 2021, 59, 341–356. [Google Scholar] [CrossRef]
  20. Tereshchenko, S.V.; Shibaeva, D.N.; Alekseeva, S.A.; Kompanchenko, A.A. Research of the influence of material composition and size of iron quartzites of the Olenegorsk deposit on the results of dry magnetic separation. Obogashchenie Rud. 2020, 6, 15–20. [Google Scholar] [CrossRef]
  21. GOST 48-287-87 Requirements for Process Samples for Beneficiation Studies. In Industry Standard: Ores of Non-Ferrous and Rare Metals; MCM USSR: Moscow, Russia, 1984; 24p. (In Russian)
Figure 1. Disintegration scheme of iron ore samples.
Minerals 11 00797 g001
Figure 2. Ferruginous quartzites from the Kostomuksha ore field in thin sections. Black minerals are magnetite and sulfides. The upper row (ac) presents prevalent ores in the Korpangskoe deposit, the lower row (df)—prevalent ores in the Kostomuksha deposit. Transmitted polarized light.
Minerals 11 00797 g002
Figure 3. Ore magnetite impregnation in ferruginous quartzites of the Kostomuksha ore field. Mgt—magnetite, Sil—silicates, quartz, Sulf—sulfides. The upper row (ac) presents prevalent ores in the Korpangskoe deposit, the lower row (df)—prevalent ores in the Kostomuksha deposit. Reflected polarized light.
Minerals 11 00797 g003
Figure 4. Distribution of size classes in the product of the first crushing stage.
Minerals 11 00797 g004
Figure 5. Histograms of energy consumption when crushing the sample material of the initial ore and the magnetic product separated during dry separation.
Minerals 11 00797 g005
Figure 6. Liberated minerals and aggregates in the final product of the studied samples crushing. The upper right corner is the polished section’s name (see Table 7). Reflected polarized light.
Minerals 11 00797 g006
Figure 7. Ratio of liberated minerals and aggregates in the final product of crushing the samples under study: (a) the initial ore; (b) the processed product of dry magnetic separation.
Minerals 11 00797 g007
Table 1. Chemical composition of studied iron ore samples.
Content, %
FetotalFemagnSSiO2MgOCaOAl2O3Na2O
Iron ore sample, Kostomuksha deposit29.0123.760.1151.271.691.314.030.78
Iron ore sample, Korpangskoe deposit29.4224.090.0949.141.741.403.820.72
Table 2. Petrographic composition of studied iron ore samples.
Rock NameYield of Rock Type in Size Class, %
−80 + 50 mm−50 + 20 mm−20 + 10 mm−10 + 5 mmSum (−80 + 5 mm)
M1M2M1M2M1M2M1M2M1M2
Magnetic rocks
Ferruginous quartzites I53.0717.5126.9426.64.03.760.170.4584.1848.32
Ferruginous quartzites II4.6312.701.8517.210.013.180.251.116.7434.20
Weakly magnetic/non-magnetic rocks
Diorites04.030.660.520.200.370.020.040.884.96
Amphibole schists2.773.500.242.810.160.490.040.093.216.88
Amphibolite3.700.290.5400.180.10004.420.39
Quartzites0.50000.750.080.20000.580.95
Granite/pegmatite02.7900.3100.3800.0203.51
Quartz0000.7000.0800.0100.80
Total64.6740.8330.2448.894.628.560.481.72100100
Note: M1—Kostomuksha deposit, M2—Korpangskoe deposit.
Table 3. Granulometric composition of studied iron ore samples.
Yield of Size Class, %
−80 + 50 mm−50 + 20 mm−20 + 10 mm−10 + 5 mm−5 + 0 mmTotal
Iron ore sample, Kostomuksha deposit55.8026.093.990.4213.71100
Iron ore sample, Korpangskoe deposit37.6145.047.881.587.88100
Table 4. Results of dry magnetic separation of an iron ore sample, Kostomuksha deposit.
Separation ProductYield, %Content, %Recovery, %
FetotalFemagnSSiO2MgOCaOAl2O3Na2OFetotFemagnSSiO2MgOCaOAl2O3Na2O
Magnetic product87.6032.3126.940.1149.491.591.142.80.3997.699.383.884.582.376.060.944.0
Non-magnetic product12.405.71.30.1563.882.422.5412.683.52.40.716.215.517.724.039.156.0
Initial ore10029.0123.760.1151.271.691.314.030.78100100100100100100100100
Table 5. Results of dry magnetic separation of an iron ore sample, Korpangskoe deposit.
Separation ProductYield, %Content, %Recovery, %
FetotalFemagnSSiO2MgOCaOAl2O3Na2OFetotalFemagnSSiO2MgOCaOAl2O3Na2O
Magnetic product85.7033.0727.610.0946.581.641.322.40.3196.398.283.381.280.880.853.836.7
Non-magnetic product14.307.533.00.10864.52.341.8812.343.213.71.816.718.819.219.246.263.3
Initial ore10029.4224.090.09349.141.741.403.820.72100100100100100100100100
Table 6. Results of dry magnetic separation of mixture of iron ore samples, Kostomuksha and Korpangskoe deposits.
Separation ProductYield, %Content, %Recovery, %
FetotalFemagnSSiO2MgOCaOAl2O3Na2OFetotalFemagnSSiO2MgOCaOAl2O3Na2O
Magnetic product85.5032.5828.160.1341.191.581.172.390.3197.399.682.778.979.378.651.634.3
Non-magnetic product14.505.330.720.1665.112.431.8813.223.52.70.417.321.120.721.448.465.7
Initial ore10028.6324.180.13444.661.701.273.960.77100100100100100100100100
Table 7. Results of dry magnetic separation of iron ore samples, Kostomuksha and Korpangskoe deposits.
Separation ProductsSeparation of Initial OreSeparation of Sizing Ore (50 mm and 20 mm)
Yield, %FetotYield, %Fetot
Kostomuksha deposit
Magnetic product87.6032.6589.6531.10
Non-magnetic product12.405.7010.355.36
Initial ore10029.3110028.44
Korpangskoe deposit
Magnetic product84.7331.1184.9232.74
Non-magnetic product15.274.2215.084.43
Initial ore10026.9210028.38
Table 8. Granulometric composition of the final crushing product.
Size Class, mmKostomuksha DepositKorpangskoe DepositMixture
InitialProcessedInitialProcessedInitialProcessed
+2 mm5.965.904.523.824.414.57
−2 + 1 mm30.9830.5229.1825.5125.9929.28
−1 + 0.63 mm10.6310.4311.0810.5311.0510.98
−0.63 + 0.4 mm7.587.348.318.668.597.78
−0.4 + 0.2 mm12.5111.4514.2216.4614.2614.18
−0.2 + 0.1 mm14.9114.1315.2417.0015.8315.83
−0.1 + 0.045 mm11.8612.5511.8212.3212.7011.99
−0.045 mm5.577.685.635.697.175.40
Total100100100100100100
Table 9. Name of polished sections for the analysis of aggregates in crushing products.
Size Class, mmName of Preparation
Initial OreMagnetic Product of Dry Magnetic Separation
Ore sample, Kostomuksha deposit
−0.045 + 0RCTSI-1RCTSM-1
−0.1 + 0.045RCTSI-2RCTSM-2
−0.2 + 0.1RCTSI-3RCTSM-3
−0.4 + 0.2RCTSI-4RCTSM-4
−0.63 + 0.4RCTSI-5RCTSM-5
−1 + 0.63RCTSI-6RCTSM-6
Ore sample, Korpangskoe deposit
−0.045 + 0FMCTSI-1FMCTSM-1
−0.1 + 0.045FMCTSI-2FMCTSM-2
−0.2 + 0.1FMCTSI-3FMCTSM-3
−0.4 + 0.2FMCTSI-4FMCTSM-4
−0.63 + 0.4FMCTSI-5FMCTSM-5
−1 + 0.63FMCTSI-6FMCTSM-6
Mixture of ore samples. The Kostomuksha and Korpangskoe deposits in ratio 50:50
−0.045 + 0MCTSI-1MCTSM-1
−0.1 + 0.045MCTSI-2MCTSM-2
−0.2 + 0.1MCTSI-3MCTSM-3
−0.4 + 0.2MCTSI-4MCTSM-4
−0.63 + 0.4MCTSI-5MCTSM-5
−1 + 0.63MCTSI-6MCTSM-6
Note: FMCTSI—free-milling combined thin section initial; FMCTSM—free-milling combined thin section magnetic; RCTSI—refractory combined thin section initial; RCTSM—refractory combined thin section magnetic; MCTSI—mixture combined thin section initial; MCTSM—mixture combined thin section magnetic.
Table 10. Analysis of aggregates in the final product of crushing of samples studied.
№ PreparationMgtHemSulfMgt + HemMgt + SulfMgt + SilMgt + Hem + SilSilTotal
RCTSI-134.90.380.470 *0.161.49062.6100
RCTSI-229.560.970.390.1905.81063.08100
RCTSI-312.970.15000.3225.320.1661.08100
RCTSI-410.570.490.010.020.1625.040.6563.06100
RCTSI-50.6500.3100.3253.671.9243.13100
RCTSI-600003.2368.919.658.22100
RCTSM-140.950.190.470.1900.95057.25100
RCTSM-230.280.380.470.0908.06060.72100
RCTSM-313.2800.330029.34057.05100
RCTSM-49.690.350.520.170.0139.440.5149.31100
RCTSM-50.3400.360077.042.1920.07100
RCTSM-600002.1282.625.389.88100
FMCTSI-128.551.280.27001.01068.89100
FMCTSI-233.890.30.490.205.14059.98100
FMCTSI-314.46000.140.317.590.1567.36100
FMCTSI-410.290.010.530.190.1833.210.954.69100
FMCTSI-53.0900.340055.672.4138.49100
FMCTSI-6000.120063.958.1327.8100
FMCTSM-137.431.240.180.0901.24059.82100
FMCTSM-231.80.50.340.250.088.12058.91100
FMCTSM-320.1400.1800.1821.02058.48100
FMCTSM-410.930.010.1800.1735.630.3552.73100
FMCTSM-56.92000057.442.4233.22100
FMCTSM-6000.080065.575.4828.87100
MCTSI-138.510.350.710.1800.89059.36100
MCTSI-222.890.270.450.090.097.81068.4100
MCTSI-312.6500.170.170.1620.630.565.72100
MCTSI-48.920.010.380.03036.430.5753.66100
MCTSI-51.9600.3400.6553.922.6140.52100
MCTSI-6000.130062.763.1233.99100
MCTSM-140.830.280.380.0902.08056.34100
MCTSM-233.840.180.270.180.098.01057.43100
MCTSM-315.0900.620027.370.3156.61100
MCTSM-49.440.370.320.050.0144.620.3844.81100
MCTSM-53.8300.760066.671.9226.82100
MCTSM-6000.150073.533.1523.17100
Note: Mgt—magnetite; Hem—hematite; Sulf—sulfide; Sil—silicate, quartz; «+»—mineral aggregate; *—less than one grin per 1000.
Publisher’s Note: MDPI stays neutral with regard to jurisdictional claims in published maps and institutional affiliations.

