
Chemical Composition Data of the Main Stages of Copper Production from Sulfide Minerals in Chile: A Review to Assist Circular Economy Studies

 , and
, and
Abstract
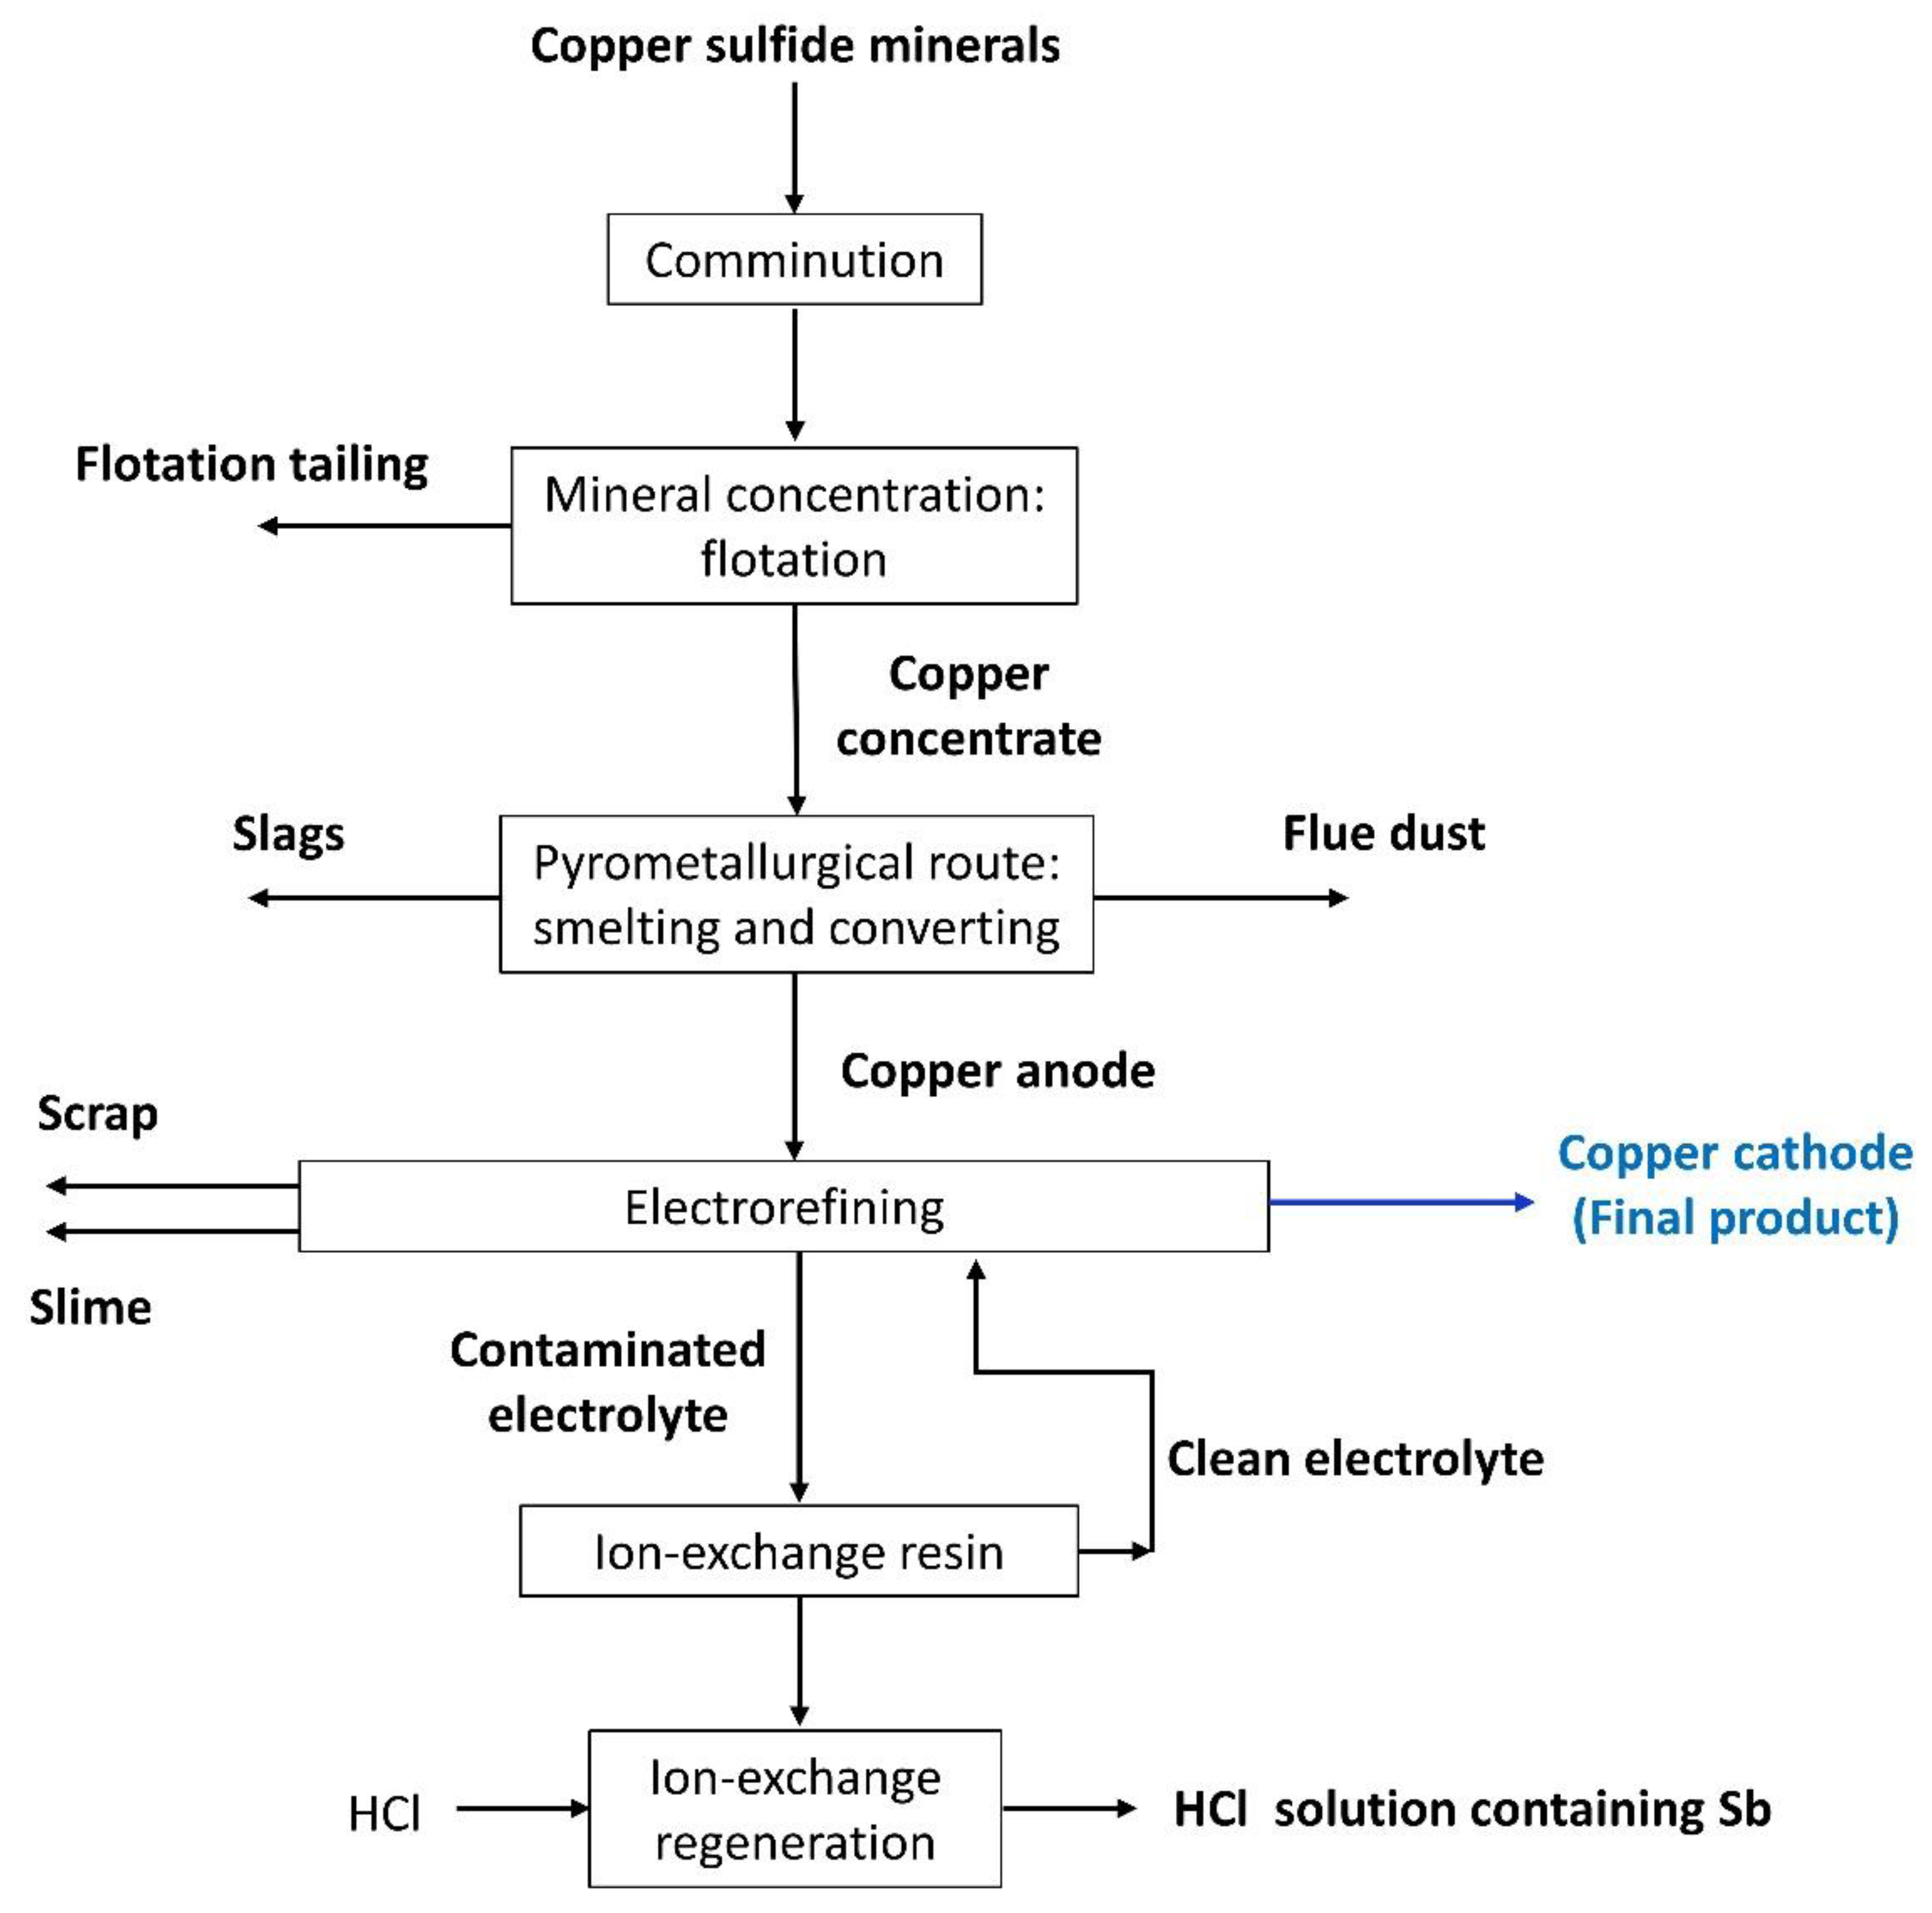
:1. Introduction
2. Copper Sulfide Minerals
3. Mineral Processing: Comminution
4. Mineral Concentration: Flotation
4.1. Copper Concentrate
4.2. Flotation Tailings
5. Anode Casting: Smelting and Converting Processes
5.1. Copper Anode
5.2. Smelter and Converter Slag
5.3. Smelter and Converter Flue Dust
6. Copper Electrorefining
6.1. Anode Scrap
6.2. Anode Slime
6.3. Acid Electrolyte
7. Ion-Exchange Resins
7.1. Clean Electrolyte after Passing through Ion-Exchange Resins
7.2. Elution Solution from Ion-Exchange Membranes
8. Conclusions and Perspectives
Author Contributions
Funding
Conflicts of Interest
References
- Dini, J.W.; Snyder, D.D. Electrodeposition of Copper. In Modern Electroplating; John Wiley & Sons, Inc.: Hoboken, NJ, USA, 2011; pp. 33–78. [Google Scholar]
- Yin, Z.; Sun, W.; Hu, Y.; Zhang, C.; Guan, Q.; Wu, K. Evaluation of the possibility of copper recovery from tailings by flotation through bench-scale, commissioning, and industrial tests. J. Clean. Prod. 2018, 171, 1039–1048. [Google Scholar] [CrossRef]
- Endres, F.; Abbott, A.; MacFarlane, D.R. Electrodeposition from Ionic Liquids; Wiley-VCH: Weinheim, Germany, 2008; Volume 1, ISBN 978-3-527-31565-9. [Google Scholar]
- Saidi, M.; Kadkhodayan, H. Experimental and simulation study of copper recovery process from copper oxide ore using aspen plus software: Optimization and sensitivity analysis of effective parameters. J. Environ. Chem. Eng. 2020, 8, 103772. [Google Scholar] [CrossRef]
- Lagos, G.; Peters, D.; Lima, M.; Jara, J.J. Potential copper production through 2035 in Chile. Miner. Econ. 2020, 33, 43–56. [Google Scholar] [CrossRef]
- Palacios, J.; Sánchez, M. Wastes as resources: Update on recovery of valuable metals from copper slags. Trans. Institutions Min. Metall. Sect. C Miner. Process. Extr. Metall. 2011, 120, 218–223. [Google Scholar] [CrossRef]
- Schlesinger, M.E.; King, M.J.; Sole, K.C.; Davenport, W.G. Extractive Metallurgy of Copper; Elsevier: Amsterdam, The Netherlands, 2011; Volume 53, ISBN 9780080967899. [Google Scholar]
- Reyes-Bozo, L.; Godoy-Faúndez, A.; Herrera-Urbina, R.; Higueras, P.; Salazar, J.L.; Valdés-González, H.; Vyhmeister, E.; Antizar-Ladislao, B. Greening chilean copper mining operations through industrial ecology strategies. J. Clean. Prod. 2014, 84, 671–679. [Google Scholar] [CrossRef] [Green Version]
- Xu, W.; Dhawan, N.; Lin, C.L.; Miller, J.D. Further study of grain boundary fracture in the breakage of single multiphase particles using X-ray microtomography procedures. Miner. Eng. 2013, 46–47, 89–94. [Google Scholar] [CrossRef]
- Aldrich, C. Consumption of steel grinding media in mills—A review. Miner. Eng. 2013, 49, 77–91. [Google Scholar] [CrossRef]
- Pamparana, G.; Kracht, W.; Haas, J.; Díaz-Ferrán, G.; Palma-Behnke, R.; Román, R. Integrating photovoltaic solar energy and a battery energy storage system to operate a semi-autogenous grinding mill. J. Clean. Prod. 2017, 165, 273–280. [Google Scholar] [CrossRef]
- Curry, J.A.; Ismay, M.J.L.; Jameson, G.J. Mine operating costs and the potential impacts of energy and grinding. Miner. Eng. 2014, 56, 70–80. [Google Scholar] [CrossRef]
- Jacob, W.; Cooper, D.R.; Gutowski, T.; Ramos-Grez, J. The efficiency of copper ore comminution: A thermodynamic exergy analysis. Miner. Eng. 2017, 109, 21–31. [Google Scholar] [CrossRef]
- Agheli, S.; Hassanzadeh, A.; Hassas, B.V.; Hasanzadeh, M. Effect of pyrite content of feed and configuration of locked particles on rougher flotation of copper in low and high pyritic ore types. Int. J. Min. Sci. Technol. 2018, 28, 167–176. [Google Scholar] [CrossRef]
- Vaziri Hassas, B.; Caliskan, H.; Guven, O.; Karakas, F.; Cinar, M.; Celik, M.S. Effect of roughness and shape factor on flotation characteristics of glass beads. Colloids Surf. A Physicochem. Eng. Asp. 2016, 492, 88–99. [Google Scholar] [CrossRef]
- Han, B.; Altansukh, B.; Haga, K.; Stevanović, Z.; Jonović, R.; Avramović, L.; Urosević, D.; Takasaki, Y.; Masuda, N.; Ishiyama, D.; et al. Development of copper recovery process from flotation tailings by a combined method of high-pressure leaching-solvent extraction. J. Hazard. Mater. 2018, 352, 192–203. [Google Scholar] [CrossRef] [PubMed]
- Mackay, I.; Videla, A.R.; Brito-Parada, P.R. The link between particle size and froth stability—Implications for reprocessing of flotation tailings. J. Clean. Prod. 2020, 242, 118436. [Google Scholar] [CrossRef]
- Santander, M.; Valderrama, L. Recovery of pyrite from copper tailings by flotation. J. Mater. Res. Technol. 2019, 8, 4312–4317. [Google Scholar] [CrossRef]
- Escobar, B.; Quiroz, L.; Vargas, T. Effect of Flotation and Solvent Extraction Reagents on the Bioleaching of a Copper Concentrate with Sulfolobus Metallicus. Adv. Mater. Res. 2009, 71–73, 421–424. [Google Scholar] [CrossRef]
- Mackay, I.; Mendez, E.; Molina, I.; Videla, A.R.; Cilliers, J.J.; Brito-Parada, P.R. Dynamic froth stability of copper flotation tailings. Miner. Eng. 2018, 124, 103–107. [Google Scholar] [CrossRef]
- Tabosa, E.; Rubio, J. Flotation of copper sulphides assisted by high intensity conditioning (HIC) and concentrate recirculation. Miner. Eng. 2010, 23, 1198–1206. [Google Scholar] [CrossRef]
- Devia, M.; Parra, R.; Queirolo, C.; Sánchez, M.; Wilkomirsky, I. Copper smelting and converting: Past and present Chilean developments. Miner. Process. Extr. Metall. Trans. Inst. Min. Metall. 2019, 128, 108–116. [Google Scholar] [CrossRef]
- Jarošíková, A.; Ettler, V.; Mihaljevič, M.; Drahota, P.; Culka, A.; Racek, M. Characterization and pH-dependent environmental stability of arsenic trioxide-containing copper smelter flue dust. J. Environ. Manag. 2018, 209, 71–80. [Google Scholar] [CrossRef]
- Xu, Z.F.; Li, Q.; Nie, H.P. Pressure leaching technique of smelter dust with high-copper and high-arsenic. Trans. Nonferrous Met. Soc. China 2010, 20, s176–s181. (In English) [Google Scholar] [CrossRef]
- Ha, T.K.; Kwon, B.H.; Park, K.S.; Mohapatra, D. Selective leaching and recovery of bismuth as Bi2O3 from copper smelter converter dust. Sep. Purif. Technol. 2015, 142, 116–122. [Google Scholar] [CrossRef]
- González, C.; Parra, R.; Klenovcanova, A.; Imris, I.; Sánchez, M. Reduction of Chilean copper slags: A case of waste management project. Scand. J. Metall. 2005, 34, 143–149. [Google Scholar] [CrossRef]
- Montenegro, V.; Sano, H.; Fujisawa, T. Recirculation of chilean copper smelting dust with high arsenic content to the smelting process. Mater. Trans. 2008, 49, 2112–2118. [Google Scholar] [CrossRef] [Green Version]
- Montenegro, V.; Sano, H.; Fujisawa, T. Recirculation of high arsenic content copper smelting dust to smelting and converting processes. Miner. Eng. 2013, 49, 184–189. [Google Scholar] [CrossRef]
- Wilkomirsky, I.; Parra, R.; Parada, F.; Balladares, E. Continuous Converting of Copper Matte to Blister Copper in a High-Intensity Molten-Layer Reactor. JOM 2014, 66, 1687–1693. [Google Scholar] [CrossRef]
- Arroyo-Torralvo, F.; Rodríguez-Almansa, A.; Ruiz, I.; González, I.; Ríos, G.; Fernández-Pereira, C.; Vilches-Arenas, L.F. Optimizing operating conditions in an ion-exchange column treatment applied to the removal of Sb and Bi impurities from an electrolyte of a copper electro-refining plant. Hydrometallurgy 2017, 171, 285–297. [Google Scholar] [CrossRef]
- Wang, X.; Chen, Q.; Yin, Z.; Wang, M.; Xiao, B.; Zhang, F. Homogeneous precipitation of As, Sb and Bi impurities in copper electrolyte during electrorefining. Hydrometallurgy 2011, 105, 355–358. [Google Scholar] [CrossRef]
- Thanu, V.R.C.; Jayakumar, M. Electrochemical recovery of antimony and bismuth from spent electrolytes. Sep. Purif. Technol. 2020, 235, 116169. [Google Scholar] [CrossRef]
- Yellishetty, M.; Huston, D.; Graedel, T.E.; Werner, T.T.; Reck, B.K.; Mudd, G.M. Quantifying the potential for recoverable resources of gallium, germanium and antimony as companion metals in Australia. Ore Geol. Rev. 2017, 82, 148–159. [Google Scholar] [CrossRef]
- Xiao, F.; Mao, J.; Cao, D.; Shen, X.; Volinsky, A.A. The role of trivalent arsenic in removal of antimony and bismuth impurities from copper electrolytes. Hydrometallurgy 2012, 125–126, 76–80. [Google Scholar] [CrossRef]
- Wang, X.W.; Chen, Q.Y.; Yin, Z.L.; Wang, M.Y.; Tang, F. The role of arsenic in the homogeneous precipitation of As, Sb and Bi impurities in copper electrolyte. Hydrometallurgy 2011, 108, 199–204. [Google Scholar] [CrossRef]
- Navarro, P.; Simpson, J.; Alguacil, F.J. Removal of antimony (III) from copper in sulphuric acid solutions by solvent extraction with LIX 1104SM. Hydrometallurgy 1999, 53, 121–131. [Google Scholar] [CrossRef]
- Artzer, A.; Moats, M.; Bender, J. Removal of Antimony and Bismuth from Copper Electrorefining Electrolyte: Part II—An Investigation of Two Proprietary Solvent Extraction Extractants. JOM 2018, 70, 2856–2863. [Google Scholar] [CrossRef]
- Navarro, P.; Alguacil, F.J. Adsorption of antimony and arsenic from a copper electrorefining solution onto activated carbon. Hydrometallurgy 2002, 66, 101–105. [Google Scholar] [CrossRef]
- Salari, K.; Hashemian, S.; Baei, M.T. Sb(V) removal from copper electrorefining electrolyte: Comparative study by different sorbents. Trans. Nonferrous Met. Soc. China 2017, 27, 440–449. [Google Scholar] [CrossRef]
- Awe, S.A.; Sandström, K. Selective leaching of arsenic and antimony from a tetrahedrite rich complex sulphide concentrate using alkaline sulphide solution. Miner. Eng. 2010, 23, 1227–1236. [Google Scholar] [CrossRef]
- Cifuentes, L.; Crisóstomo, G.; Ibáñez, J.P.; Casas, J.M.; Alvarez, F.; Cifuentes, G. On the electrodialysis of aqueous H2SO4-CuSO4 electrolytes with metallic impurities. J. Memb. Sci. 2002, 207, 1–16. [Google Scholar] [CrossRef]
- Riveros, P.A. The removal of antimony from copper electrolytes using amino-phosphonic resins: Improving the elution of pentavalent antimony. Hydrometallurgy 2010, 105, 110–114. [Google Scholar] [CrossRef]
- Haas, J.; Moreno-Leiva, S.; Junne, T.; Chen, P.J.; Pamparana, G.; Nowak, W.; Kracht, W.; Ortiz, J.M. Copper mining: 100% solar electricity by 2030? Appl. Energy 2020, 262, 114506. [Google Scholar] [CrossRef]
- Lam, E.J.; Cánovas, M.; Gálvez, M.E.; Montofré, Í.L.; Keith, B.F.; Faz, Á. Evaluation of the phytoremediation potential of native plants growing on a copper mine tailing in northern Chile. J. Geochem. Explor. 2017, 182, 210–217. [Google Scholar] [CrossRef]
- Northey, S.; Mohr, S.; Mudd, G.M.; Weng, Z.; Giurco, D. Modelling future copper ore grade decline based on a detailed assessment of copper resources and mining. Resour. Conserv. Recycl. 2014, 83, 190–201. [Google Scholar] [CrossRef]
- Lagos, G.; Peters, D.; Videla, A.; Jara, J.J. The effect of mine aging on the evolution of environmental footprint indicators in the Chilean copper mining industry 2001–2015. J. Clean. Prod. 2018, 174, 389–400. [Google Scholar] [CrossRef]
- De Solminihac, H.; Gonzales, L.E.; Cerda, R. Copper mining productivity: Lessons from Chile. J. Policy Model. 2018, 40, 182–193. [Google Scholar] [CrossRef]
- Alcalde, J.; Kelm, U.; Vergara, D. Historical assessment of metal recovery potential from old mine tailings: A study case for porphyry copper tailings, Chile. Miner. Eng. 2018, 127, 334–338. [Google Scholar] [CrossRef]
- Fuentes, G.; Viñals, J.; Herreros, O. Hydrothermal purification and enrichment of Chilean copper concentrates. Part 1: The behavior of bornite, covellite and pyrite. Hydrometallurgy 2009, 95, 104–112. [Google Scholar] [CrossRef]
- Cortés, S.; Soto, E.E.; Ordóñez, J.I. Recovery of copper from leached tailing solutions by biosorption. Minerals 2020, 10, 158. [Google Scholar] [CrossRef] [Green Version]
- Torres, C.M.; Taboada, M.E.; Graber, T.A.; Herreros, O.O.; Ghorbani, Y.; Watling, H.R. The effect of seawater based media on copper dissolution from low-grade copper ore. Miner. Eng. 2015, 71, 139–145. [Google Scholar] [CrossRef]
- Fuentes, G.; Viñals, J.; Herreros, O. Hydrothermal purification and enrichment of Chilean copper concentrates. Part 2: The behavior of the bulk concentrates. Hydrometallurgy 2009, 95, 113–120. [Google Scholar] [CrossRef]
- Gentina, J.C.; Acevedo, F. Application of bioleaching to copper mining in Chile. Electron. J. Biotechnol. 2013, 16, 16. [Google Scholar] [CrossRef]
- Barkhordari, H.R.; Jorjani, E.; Eslami, A.; Noaparast, M. Occurrence mechanism of silicate and aluminosilicate minerals in Sarcheshmeh copper flotation concentrate. Int. J. Miner. Metall. Mater. 2009, 16, 494–499. [Google Scholar] [CrossRef]
- Casas, J.M.; Crisóstomo, G.; Cifuentes, L. Antimony Solubility and Speciation in Aqueous Sulphuric Acid Solutions at 298 K. Can. J. Chem. Eng. 2008, 82, 175–183. [Google Scholar] [CrossRef]
- Dimitrijević, M.; Kostov, A.; Tasić, V.; Milosević, N. Influence of pyrometallurgical copper production on the environment. J. Hazard. Mater. 2009, 164, 892–899. [Google Scholar] [CrossRef] [PubMed]
- Hansen, H.K.; Yianatos, J.B.; Ottosen, L.M. Speciation and leachability of copper in mine tailings from porphyry copper mining: Influence of particle size. Chemosphere 2005, 60, 1497–1503. [Google Scholar] [CrossRef]
- Padilla, R.; Rodríguez, G.; Ruiz, M.C. Copper and arsenic dissolution from chalcopyrite-enargite concentrate by sulfidation and pressure leaching in H2SO4-O2. Hydrometallurgy 2010, 100, 152–156. [Google Scholar] [CrossRef]
- Cruz, C.; Reyes, A.; Jeldres, R.I.; Cisternas, L.A.; Kraslawski, A. Using Partial Desalination Treatment to Improve the Recovery of Copper and Molybdenum Minerals in the Chilean Mining Industry. Ind. Eng. Chem. Res. 2019, 58, 8915–8922. [Google Scholar] [CrossRef]
- Araya, G.; Toro, N.; Castillo, J.; Guzmán, D.; Guzmán, A.; Hernández, P.; Jeldres, R.I.; Sepúlveda, R. Leaching of oxide copper ores by addition of weak acid from copper smelters. Metals 2020, 10, 627. [Google Scholar] [CrossRef]
- Voisin, L. New Strategies for the Treatment of Copper Concentrates with High Arsenic Content in Chile. Available online: http://mric.jogmec.go.jp/public/kouenkai/2012-11/briefing_121108_5new.pdf (accessed on 20 December 2021).
- Yianatos, J.; Vallejos, P.; Grau, R.; Yañez, A. New approach for flotation process modelling and simulation. Miner. Eng. 2020, 156, 106482. [Google Scholar] [CrossRef]
- Mathe, E.; Cruz, C.; Lucay, F.A.; Gálvez, E.D.; Cisternas, L.A. Development of a grinding model based on flotation performance. Miner. Eng. 2021, 166, 106890. [Google Scholar] [CrossRef]
- Deng, J.; Wen, S.; Xian, Y.; Bai, S.; Liu, D.; Shen, H. Efficient utilization of copper sulfide ore in Chile by flotation. Adv. Mater. Res. 2012, 524–527, 975–982. [Google Scholar] [CrossRef]
- Palencia, I.; Romero, R.; Mazuelos, A.; Carranza, F. Treatment of secondary copper sulphides (chalcocite and covellite) by the BRISA process. Hydrometallurgy 2002, 66, 85–93. [Google Scholar] [CrossRef]
- Vallejos, P.; Yianatos, J. Analysis of Industrial Flotation Circuits Using Top-of-froth and Concentrate Mineralogy. Miner. Process. Extr. Metall. Rev. 2021, 42, 511–520. [Google Scholar] [CrossRef]
- Ballantyne, G.R.; Powell, M.S. Benchmarking comminution energy consumption for the processing of copper and gold ores. Miner. Eng. 2014, 65, 109–114. [Google Scholar] [CrossRef] [Green Version]
- Ekrem Yüce, A.; Mustafa Tarkan, H.; Zeki Doǧan, M. Effect of bacterial conditioning and the flotation of copper ore and concentrate. Afr. J. Biotechnol. 2006, 5, 448–452. [Google Scholar]
- Larouche, P. Minor Elements in Copper Smelting and Electrorefining. Master’s Thesis, McGill University, Montréal, QC, Canada, 2001. [Google Scholar]
- Senior, G.D.; Guy, P.J.; Bruckard, W.J. The selective flotation of enargite from other copper minerals—A single mineral study in relation to beneficiation of the Tampakan deposit in the Philippines. Int. J. Miner. Process. 2006, 81, 15–26. [Google Scholar] [CrossRef]
- Smith, L.K.; Bruckard, W.J. The separation of arsenic from copper in a Northparkes copper-gold ore using controlled-potential flotation. Int. J. Miner. Process. 2007, 84, 15–24. [Google Scholar] [CrossRef]
- Finch, J.A.; Tan, Y.H. A comparison of two flotation circuits. Miner. Eng. 2021, 170, 107002. [Google Scholar] [CrossRef]
- Cisternas, L.A.; Lucay, F.A.; Acosta-Flores, R.; Gálvez, E.D. A quasi-review of conceptual flotation design methods based on computational optimization. Miner. Eng. 2018, 117, 24–33. [Google Scholar] [CrossRef]
- Jamett, N.; Cisternas, L.; Vielma, J.P. Solution Strategies to Stochastic Design of Mineral Flotation Plants; Elsevier: Amsterdam, The Netherlands, 2014; Volume 34. [Google Scholar]
- Hassanzadeh, A.; Hasanzadeh, M. Chalcopyrite and pyrite floatabilities in the presence of sodium sulfide and sodium metabisulfite in a high pyritic copper complex ore. J. Dispers. Sci. Technol. 2017, 38, 782–788. [Google Scholar] [CrossRef]
- Lü, C.; Wang, Y.; Qian, P.; Liu, Y.; Fu, G.; Ding, J.; Ye, S.; Chen, Y. Separation of chalcopyrite and pyrite from a copper tailing by ammonium humate. Chin. J. Chem. Eng. 2018, 26, 1814–1821. [Google Scholar] [CrossRef]
- Flores, G.A.; Risopatron, C.; Pease, J. Processing of Complex Materials in the Copper Industry: Challenges and Opportunities Ahead. JOM 2020, 72, 3447–3461. [Google Scholar] [CrossRef] [PubMed]
- Moreno, P.A.; Aral, H.; Cuevas, J.; Monardes, A.; Adaro, M.; Norgate, T.; Bruckard, W. The use of seawater as process water at Las Luces copper-molybdenum beneficiation plant in Taltal (Chile). Miner. Eng. 2011, 24, 852–858. [Google Scholar] [CrossRef]
- Cisternas, L.A.; Gálvez, E.D. The use of seawater in mining. Miner. Process. Extr. Metall. Rev. 2018, 39, 18–33. [Google Scholar] [CrossRef]
- Sernageomin. Catastro de Depósitos de Relaves en Chile; Sernageomin: Santiago, Chile, 2020. Available online: https://www.sernageomin.cl/datos-publicos-deposito-de-relaves/ (accessed on 20 December 2021).
- Lyu, Z.; Chai, J.; Xu, Z.; Qin, Y.; Cao, J. A Comprehensive Review on Reasons for Tailings Dam Failures Based on Case History. Adv. Civ. Eng. 2019, 2019, 4159306. [Google Scholar] [CrossRef]
- Hesketh, A.H.; Broadhurst, J.L.; Harrison, S.T.L. Mitigating the generation of acid mine drainage from copper sulfide tailings impoundments in perpetuity: A case study for an integrated management strategy. Miner. Eng. 2010, 23, 225–229. [Google Scholar] [CrossRef]
- Demetrio, S.; Ahumada, J.; Duran, M.A.; Mast, E.; Rojas, U.; Sanhueza, J.; Reyes, P.; Morales, E. Slag cleaning: The Chilean copper smelter experience. JOM 2000, 52, 20–25. [Google Scholar] [CrossRef]
- Huisman, J.L.; Schouten, G.; Schultz, C. Biologically produced sulphide for purification of process streams, effluent treatment and recovery of metals in the metal and mining industry. Hydrometallurgy 2006, 83, 106–113. [Google Scholar] [CrossRef]
- Smuda, J.; Dold, B.; Spangenberg, J.E.; Friese, K.; Kobek, M.R.; Bustos, C.A.; Pfeifer, H.R. Element cycling during the transition from alkaline to acidic environment in an active porphyry copper tailings impoundment, Chuquicamata, Chile. J. Geochem. Explor. 2014, 140, 23–40. [Google Scholar] [CrossRef]
- Vargas, F.; Lopez, M.; Rigamonti, L. Environmental impacts evaluation of treated copper tailings as supplementary cementitious materials. Resour. Conserv. Recycl. 2020, 160, 104890. [Google Scholar] [CrossRef]
- Vargas, F.; Alsina, M.A.; Gaillard, J.F.; Pasten, P.; Lopez, M. Copper entrapment and immobilization during cement hydration in concrete mixtures containing copper tailings. J. Clean. Prod. 2021, 312, 127547. [Google Scholar] [CrossRef]
- Marín, O.; Valderrama, J.O.; Kraslawski, A.; Cisternas, L.A. Potential of tailing deposits in chile for the sequestration of carbon dioxide produced by power plants using ex-situ mineral carbonation. Minerals 2021, 11, 320. [Google Scholar] [CrossRef]
- Araya, N.; Ramírez, Y.; Kraslawski, A.; Cisternas, L.A. Feasibility of re-processing mine tailings to obtain critical raw materials using real options analysis. J. Environ. Manag. 2021, 284, 112060. [Google Scholar] [CrossRef] [PubMed]
- Araya, N.; Kraslawski, A.; Cisternas, L.A. Towards mine tailings valorization: Recovery of critical materials from Chilean mine tailings. J. Clean. Prod. 2020, 263, 121555. [Google Scholar] [CrossRef]
- Imris, I.; Rebolledo, S.; Sanchez, M.; Castro, G.; Achurra, G.; Hernandez, F. The Copper Losses in the Slags From the El Teniente Process. Can. Metall. Q. 2000, 39, 281–290. [Google Scholar] [CrossRef]
- Lam, E.J.; Gálvez, M.E.; Cánovas, M.; Montofré, I.L.; Rivero, D.; Faz, A. Evaluation of metal mobility from copper mine tailings in northern Chile. Environ. Sci. Pollut. Res. 2016, 23, 11901–11915. [Google Scholar] [CrossRef]
- Medina Tripodi, E.E.; Gamboa Rueda, J.A.; Aguirre Céspedes, C.; Delgado Vega, J.; Collao Gómez, C. Characterization and geostatistical modelling of contaminants and added value metals from an abandoned Cu–Au tailing dam in Taltal (Chile). J. South Am. Earth Sci. 2019, 93, 183–202. [Google Scholar] [CrossRef]
- Santibáñez, C.; Verdugo, C.; Ginocchio, R. Phytostabilization of copper mine tailings with biosolids: Implications for metal uptake and productivity of Lolium perenne. Sci. Total Environ. 2008, 395, 1–10. [Google Scholar] [CrossRef]
- Villarroel, D. Process for refining copper in solid state. Miner. Eng. 1999, 12, 405–414. [Google Scholar] [CrossRef]
- Cifuentes, G.; Simpson, J.; Zúñiga, C.; Briones, L.; Morales, A. Model and simulation of an ion exchange process for the extraction of antimony. J. Metall. Eng. 2012, 1, 75–85. [Google Scholar]
- Toro, N.; Ayala, L.; Pérez, K.; Castillo, J.; Navarra, A. Economic and strategic analysis of the current situation of Chilean copper smelters. In Proceedings of the AIP Conference Proceedings, Indore, India, 14–16 December 2020; Volume 2281, p. 020008. [Google Scholar]
- Imris, I.; Sánchez, M.; Achurra, G. Copper losses to slags obtained from the El Teniente process. Trans. Inst. Min. Metall. Sect. C Miner. Process. Extr. Metall. 2005, 114, 135–140. [Google Scholar] [CrossRef]
- Bengoa, J.; Palacios, J.; Sánchez, M. Effect of oxygen enrichment in El Teniente Converter productivity at the Ilo Smelter Plant, Peru. In Proceedings of the TMS Yazawa International Symposium on Metallurgical Thermochemistry and Materials Processing, San Diego, CA, USA, 2–6 March 2003. [Google Scholar]
- Goñi, C.; Sanchez, M. Modelling of copper content variation during “El Teniente” slag cleaning process. In Proceedings of the VIII International Conference Molten 2009, Santiago, Chile, 18–21 January 2009; pp. 1203–1210. [Google Scholar]
- Artzer, A.; Moats, M.; Bender, J. Removal of Antimony and Bismuth from Copper Electrorefining Electrolyte: Part I—A Review. JOM 2018, 70, 2033–2040. [Google Scholar] [CrossRef]
- Chen, T.T.; Dutrizac, J.E. Mineralogical characterization of anode slimes: Part 7—Copper anodes and anode slimes from the chuquicamat a division of codelco-Chile. Can. Metall. Q. 1991, 30, 95–106. [Google Scholar] [CrossRef]
- Cifuentes, G.; Vargas, C.; Simpson, J. Analisis de las principales variables de proceso que influyen en el rechazo de los cátodos durante el electrorrefino del cobre. Rev. Metal. 2009, 45, 228–236. [Google Scholar] [CrossRef]
- Cifuentes, G.; Hernández, S.; Navarro, P.; Simpson, J.; Reyes, C.; Naranjo, A.; Tapia, L. Anodic Slimes Characteristics and Behaviour in Copper Refining. In Proceedings of the Copper, Phoenix, AZ, USA, 10–13 October 1999; pp. 427–435. [Google Scholar]
- Roy, S.; Sarkar, S.; Datta, A.; Rehani, S. Importance of mineralogy and reaction kinetics for selecting leaching methods of copper from copper smelter slag. Sep. Sci. Technol. 2016, 51, 135–146. [Google Scholar] [CrossRef]
- Zhou, H.; Liu, G.; Zhang, L.; Zhou, C. Mineralogical and morphological factors affecting the separation of copper and arsenic in flash copper smelting slag flotation beneficiation process. J. Hazard. Mater. 2021, 401, 123293. [Google Scholar] [CrossRef]
- Busolic, D.; Parada, F.; Parra, R.; Sanchez, M.; Palacios, J.; Hino, M. Recovery of iron from copper flash smelting slags. Trans. Inst. Min. Metall. Sect. C Miner. Process. Extr. Metall. 2011, 120, 32–36. [Google Scholar] [CrossRef]
- Cardona, N.; Coursol, P.; MacKey, P.J.; Parra, R.; Vargas, J.; Parra, R. The physical chemistry of copper smelting slags and copper losses at the Paipote smelter part 2—Characterisation of industrial slags. Can. Metall. Q. 2011, 50, 330–340. [Google Scholar] [CrossRef]
- Herreros, O.; Quiroz, R.; Manzano, E.; Bou, C.; Viñals, J. Copper extraction from reverberatory and flash furnace slags by chlorine leaching. Hydrometallurgy 1998, 49, 87–101. [Google Scholar] [CrossRef]
- Nazer, A.S.; Pavez, O.; Rojas, F. Use of copper slag in cement mortar. Rem Rev. Esc. Minas 2012, 65, 87–91. [Google Scholar] [CrossRef] [Green Version]
- Yang, Z.; Rui-Lin, M.; Wang-Dong, N.; Hui, W. Selective leaching of base metals from copper smelter slag. Hydrometallurgy 2010, 103, 25–29. [Google Scholar] [CrossRef]
- Banza, A.N.; Gock, E.; Kongolo, K. Base metals recovery from copper smelter slag by oxidising leaching and solvent extraction. Hydrometallurgy 2002, 67, 63–69. [Google Scholar] [CrossRef]
- Li, Y.; Papangelakis, V.G.; Perederiy, I. High pressure oxidative acid leaching of nickel smelter slag: Characterization of feed and residue. Hydrometallurgy 2009, 97, 185–193. [Google Scholar] [CrossRef]
- Li, Y.; Perederiy, I.; Papangelakis, V.G. Cleaning of waste smelter slags and recovery of valuable metals by pressure oxidative leaching. J. Hazard. Mater. 2008, 152, 607–615. [Google Scholar] [CrossRef] [PubMed]
- Baghalha, M.; Papangelakis, V.G.; Curlook, W. Factors affecting the leachability of Ni/Co/Cu slags at high temperature. Hydrometallurgy 2007, 85, 42–52. [Google Scholar] [CrossRef]
- Sánchez, M.; Sudbury, M. Physicochemical characterization of copper slag and alternatives of friendly environmental management. J. Min. Metall. Sect. B Metall. 2013, 49, 161–168. [Google Scholar] [CrossRef]
- Parada, F.; Parra, R.; Marquez, F.; Jara, R.; Carrasco, J.C.; Palacios, J. Management of copper pyrometallurgical slags: Giving additional value to copper mining industry. In Proceedings of the VII International Conference on Molten Slags, Fluxes & Salts, Cape Town, South Africa, 25–28 January 2004; pp. 543–550. [Google Scholar]
- Chen, Y.; Liao, T.; Li, G.; Chen, B.; Shi, X. Recovery of bismuth and arsenic from copper smelter flue dusts after copper and zinc extraction. Miner. Eng. 2012, 39, 23–28. [Google Scholar] [CrossRef]
- Balladares, E.; Kelm, U.; Helle, S.; Parra, R.; Araneda, E. Chemical-mineralogical characterization of copper smelting flue dust. DYNA 2014, 81, 11–18. [Google Scholar] [CrossRef]
- Berasaluce, M.; Mondaca, P.; Schuhmacher, M.; Bravo, M.; Sauvé, S.; Navarro-Villarroel, C.; Dovletyarova, E.A.; Neaman, A. Soil and indoor dust as environmental media of human exposure to As, Cd, Cu, and Pb near a copper smelter in central Chile. J. Trace Elem. Med. Biol. 2019, 54, 156–162. [Google Scholar] [CrossRef]
- Gonzalez-Montero, P.; Iglesias-Gonzalez, N.; Romero, R.; Mazuelos, A.; Carranza, F. Recovery of zinc and copper from copper smelter flue dust. Optimisation of sulphuric acid leaching. Environ. Technol. 2020, 41, 1093–1100. [Google Scholar] [CrossRef]
- Okanigbe, D.O.; Popoola, A.P.I.; Adeleke, A.A. Characterization of Copper Smelter Dust for Copper Recovery. Procedia Manuf. 2017, 7, 121–126. [Google Scholar] [CrossRef]
- Alguacil, F.J.; Garcia-Diaz, I.; Lopez, F.; Rodriguez, O. Recycling of copper flue dust via leaching-solvent extraction processing. Desalin. Water Treat. 2015, 56, 1202–1207. [Google Scholar] [CrossRef]
- González, A.; Font, O.; Moreno, N.; Querol, X.; Arancibia, N.; Navia, R. Copper Flash Smelting Flue Dust as a Source of Germanium. Waste Biomass Valorization 2017, 8, 2121–2129. [Google Scholar] [CrossRef]
- Cifuentes, G.; Hernández, J.; Guajardo, N. Recovering Scrap Anode Copper Using Reactive Electrodialysis. Am. J. Anal. Chem. 2014, 05, 1020–1027. [Google Scholar] [CrossRef] [Green Version]
- Ilkhchi, M.O.; Yoozbashizadeh, H.; Safarzadeh, M.S. The effect of additives on anode passivation in electrorefining of copper. Chem. Eng. Process. Process Intensif. 2007, 46, 757–763. [Google Scholar] [CrossRef]
- Acharya, S. Copper refining electrolyte and slime processing—Emerging techniques. Adv. Mater. Res. 2014, 828, 93–115. [Google Scholar] [CrossRef]
- Loira, P.S.; Mikenberg, D.C. Reusable Anode System for Electrorefining Processes. U.S. Patent Application 14/768,022, 3 March 2016. [Google Scholar]
- Cifuentes, G.; Hernández, J.; Manríquez, J.; Guajardo, N. Modeling Operational Parameters of a Reactive Electro-Dialysis Cell for Electro-Refining Anodic Scrap Copper. Am. J. Anal. Chem. 2014, 5, 1011–1019. [Google Scholar] [CrossRef] [Green Version]
- Zeng, W.; Free, M.L.; Wang, S. Studies of Anode Slime Sintering/Coalescence and Its Effects on Anode Slime Adhesion and Cathode Purity in Copper Electrorefining. J. Electrochem. Soc. 2016, 163, E14–E31. [Google Scholar] [CrossRef]
- Hiskey, J.B.; Moats, M.S. Periodic oscillations during electrolytic dissolution of copper anodes. In Proceedings of the Copper, Electrowinning and Refining, Clausthal-Zellerfeld, Germany, 6–10 June 2010; Volume 4, pp. 1367–1377. [Google Scholar]
- Hoffmann, J.E. The Purification of Copper Refinery Electrolyte. JOM 2004, 56, 30–33. [Google Scholar] [CrossRef]
- Liu, G.; Wu, Y.; Tang, A.; Pan, D.; Li, B. Recovery of scattered and precious metals from copper anode slime by hydrometallurgy: A review. Hydrometallurgy 2020, 197, 105460. [Google Scholar] [CrossRef]
- Hait, J.; Jana, R.K.; Sanyal, S.K. Processing of copper electrorefining anode slime: A review. Miner. Process. Extr. Metall. 2009, 118, 240–252. [Google Scholar] [CrossRef]
- Xing, W.D.; Sohn, S.H.; Lee, M.S. A Review on the Recovery of Noble Metals from Anode Slimes. Miner. Process. Extr. Metall. Rev. 2020, 41, 130–143. [Google Scholar] [CrossRef]
- Moats, M.; Robinson, T.; Davenport, W.; Karcas, G.; Demetrio, S. Electrolytic copper refining—2007 world tankhouse operating data. In Copper Electrorefining and Electrowinning; Canadian Institute of Mining: Montreal, QC, Canada, 2007; pp. 195–241. [Google Scholar]
- Moats, M.S.; Hiskey, J.B. Role of electrolyte additives on passivation behaviour during copper electrorefining. Can. Metall. Q. 2000, 39, 297–306. [Google Scholar] [CrossRef]
- Cifuentes, G.; Guajardo, N.; Hernández, J. Recovery of hydrochloric acid from ion exchange processes by reactive electrodialysis. J. Chil. Chem. Soc. 2015, 60, 2711–2715. [Google Scholar] [CrossRef] [Green Version]
- Petkova, E.N. Mechanisms of floating slime formation and its removal with the help of sulphur dioxide during the electrorefining of anode copper. Hydrometallurgy 1997, 46, 277–286. [Google Scholar] [CrossRef]
- Vikström, H. Is There a Supply Crisis? Sweden’s Critical Metals, 1917–2014. Extr. Ind. Soc. 2018, 5, 393–403. [Google Scholar] [CrossRef]
- Anderson, C.G. The metallurgy of antimony. Geochemistry 2012, 72, 3–8. [Google Scholar] [CrossRef]
- Filella, M.; Belzile, N.; Chen, Y.W. Antimony in the environment: A review focused on natural waters I. Occurence. Earth-Sci. Rev. 2002, 57, 125–176. [Google Scholar] [CrossRef]
- Hočevar, S.B.; Ogorevc, B.; Wang, J.; Pihlar, B. A study on operational parameters for advanced use of bismuth film electrode in anodic stripping voltammetry. Electroanalysis 2002, 14, 1707–1712. [Google Scholar] [CrossRef]
- Sverdrup, H.U.; Ragnarsdottir, K.V.; Koca, D. An assessment of metal supply sustainability as an input to policy: Security of supply extraction rates, stocks-in-use, recycling, and risk of scarcity. J. Clean. Prod. 2017, 140, 359–372. [Google Scholar] [CrossRef]
- Müller, S.; Schötz, C.; Picht, O.; Sigle, W.; Kopold, P.; Rauber, M.; Alber, I.; Neumann, R.; Toimil-Molares, M.E. Electrochemical synthesis of Bi 1-xSb x nanowires with simultaneous control on size, composition, and surface roughness. Cryst. Growth Des. 2012, 12, 615–621. [Google Scholar] [CrossRef]
- Shabani, A.; Hoseinpur, A.; Yoozbashizadeh, H.; Vahdati Khaki, J. As, Sb, and Fe removal from industrial copper electrolyte by solvent displacement crystallisation technique. Can. Metall. Q. 2019, 58, 253–261. [Google Scholar] [CrossRef]
- Zeraati, M.; Chauhan, N.P.S.; Sargazi, G. Removal of electrolyte impurities from industrial electrolyte of electro-refining copper using green crystallization approach. Chem. Pap. 2021, 75, 3873–3880. [Google Scholar] [CrossRef]
- Cifuentes, G.A.; Simpson, J.R.; Vargas, C.A. Precipitation of Antimony and Bismuth from Copper Refinery Electrolyte Using PbO2. U.S. Patent Application 13/917,342, 17 October 2013. [Google Scholar]
- Cifuentes, M.; Cifuentes, G.; Simpson, J.; Zúñiga, C. A comparative study of ion exchange process for the extraction of antimony. In Proceedings of the Copper 2013, Santiago, Chile, 8–10 April 2013. [Google Scholar]
- Riveros, P.A.; Dutrizac, J.E.; Lastra, R. A study of the ion exchange removal of antimony(III) and antimony(V) from copper electrolytes. Can. Metall. Q. 2008, 47, 307–316. [Google Scholar] [CrossRef]
- McKevitt, B.; Dreisinger, D. A comparison of various ion exchange resins for the removal of ferric ions from copper electrowinning electrolyte solutions Part II: Electrolytes containing antimony and bismuth. Hydrometallurgy 2009, 98, 122–127. [Google Scholar] [CrossRef]
- Ruiz, I.; Rios, G.; Arbizu, C.; Hanschke, U.; Burke, I. Pilot tests on bismuth and antimony removal from electrolyte at atlantic copper refinery. In Proceedings of the European Metallurgical Conference (EMC), Weimar, Germany, 23–26 June 2013; pp. 85–98. [Google Scholar]
- Ando, K.; Tsuchida, N. Recovering Bi and Sb from electrolyte in copper electrorefining. JOM 1997, 49, 49–51. [Google Scholar] [CrossRef]
- Moghimi, F.; Jafari, A.H.; Yoozbashizadeh, H.; Askari, M. Adsorption behavior of Sb(III) in single and binary Sb(III)—Fe(II) systems on cationic ion exchange resin: Adsorption equilibrium, kinetic and thermodynamic aspects. Trans. Nonferrous Met. Soc. China 2020, 30, 236–248. [Google Scholar] [CrossRef]
- Nagai, T. Purification of copper electrolyte by solvent extraction and ion-exchange techniques. Miner. Process. Extr. Metall. Rev. 1997, 17, 143–168. [Google Scholar] [CrossRef]
- Riveros, P.A. Method to Remove Antimony from Copper Electrolytes. U.S. Patent 8,349,187, 8 January 2013. [Google Scholar]
- Kryst, K.; Simmons, P. Antimony and Bismuth Control in Copper Electrolyte by Ion Exchange. In Extraction; Springer International Publishing: Cham, Switzerland, 2018; pp. 2107–2111. ISBN 978-3-319-95021-1. [Google Scholar]


| Type | Mineral | Formula |
|---|---|---|
| Oxides | Cuprite | Cu2O |
| Tenorite | CuO | |
| Malachite | CuCO3·Cu(OH)2 | |
| Azurite | (CuCO3)2·Cu(OH)2 | |
| Chrysocolla | CuO·SiO2·2H2O | |
| Atacamite | Cu2Cl(OH)3 | |
| Sulfides | Chalcocite | Cu2S |
| Covellite | CuS | |
| Chalcopyrite | CuFeS2 | |
| Bornite | Cu5FeS4 | |
| Stannite | Cu2FeSnS4 | |
| Enargite | Cu3AsS4 | |
| Tennantite | Cu12As4S13 | |
| Famatinite | Cu3SbS4 | |
| Tetrahedrite | Cu12Sb4S13 |
| A | |||||||
| Ref. | [51] | [61] | [61] | [61] | [61] | [57] | [62] |
| Mine | Lomas Bayas | El Salvador | Chuquicamata | Andina | Escondida | El Teniente | Unknown |
| Pyrite | 55.9 | 38 | 35 | 6.2 | 30 | ||
| Chalcocite | 15.3 | 21 | 11.2 | 1.5 | 53 | 5.92 | |
| Bornite | 11.3 | 1.51 | 1.65 | 0.27 | 0.11 | 6–9 | 18.85 |
| Covellite | 7.9 | 14 | 17 | 1.1 | 0.6 | 0.71 | |
| Chalcopyrite | 7.7 | 7.5 | 12 | 81 | 4.8 | 86–90 | 74.51 |
| Digenite | 0.6 | ||||||
| Enargite | 2.1 | 5.3 | 0.6 | 0.36 | 0.01 | ||
| Molybdenite | 0.29 | 0.89 | 0.29 | ||||
| Metallic copper | 0.46 | 0.16 | |||||
| Cuprite | 0.5 | ||||||
| Hematite | 0.2 | 0.08 | |||||
| Others | 1.3 | 15.44 | 17.7 | 7.9 | 10.07 | ||
| B | |||||||
| Antofagasta Region | |||||||
| Ref. [63] | |||||||
| Pyrite | 0.68 | Magnetite | 0.11 | Kaolinite Group | 1.88 | ||
| Chalcocite/Digenite/Covellite | 0.42 | Goethite | 0.01 | Muscovite/Sericite | 0.74 | ||
| Chalcopyrite/ Bornite | 0.08 | Other Cu Minerals | 0.38 | Chlorite/Biotite | 10.87 | ||
| Enargite/Tennantite/Tetrahedrite | 0 | Other Fe Oxides/Sulfates | 0.26 | Other Phyllosilicates | 0.92 | ||
| Native Cu/Cuprite/Tenorite | 0 | Quartz | 24.44 | Others | 0.53 | ||
| Molybdenite | 0.01 | Feldspars | 58.66 | ||||
| A | Chemical Composition (wt%) | ||||||||||||
| Ref. | Mine/region | Cu | Fe | ||||||||||
| [64] | Northern Chile | 1.49 | 10.36 | ||||||||||
| [65] | Cerro Colorado | 1.28–2.05 | 1.47–1.99 | ||||||||||
| [57] | El Teniente | 1.20 | |||||||||||
| [7] | Los Bronces | 1.06 | |||||||||||
| [7] | Candelaria | 0.9–1.0 | |||||||||||
| [66] | Unknown | 0.7–0.86 | |||||||||||
| B | Chemical Composition (wt%) | ||||||||||||
| Ref. | Mine/region | Cu | Fe | SiO2 | Al2O3 | As | Pb | Zn | Ag | S | CaO | Mg | Au |
| [64] | Northern Chile | 1.49 | 10.36 | 48.09 | 8.6 | <0.1 | 0.049 | 0.037 | <5 | 2.26 | 8.07 | 2.92 | <0.2 |
| Mineral | Sample 1 (% v/v) | Sample 2 (% v/v) |
|---|---|---|
| Digenite | 34 | 26 |
| Pyrite | 24 | 35 |
| Chalcopyrite | 23 | 21 |
| Covellite | 9 | 9 |
| Bornite | 6 | 3 |
| Sphalerite | 3 | 4 |
| Enargite | 1 | 2 |
| Molybdenite | ~0.1 | ~0.1 |
| Galena | ~0.1 | ~0.1 |
| Ref. | [52] | [52] | [27] | [28] | [7] |
|---|---|---|---|---|---|
| Mine/Region | Chuquicamata | Unknown | Potrerillos | ||
| Cu | 33.5 | 31.8 | 36.1 | 36.1 | 30 |
| Fe | 21.6 | 18.3 | 22.9 | 22.9 | 25 |
| S | 33.4 | 31.8 | 32.6 | 32.6 | 32 |
| Pb | 0.090 | 0.091 | 0.20 | 0.20 | |
| Zn | 2.10 | 3.07 | 0.70 | 0.70 | |
| Bi | 0.0069 | 0.011 | 0.1 | 0.05 | |
| Sb | 0.012 | 0.042 | 0.01 | 0.01 | |
| As | 0.48 | 0.79 | 0.7 | 0.7 | |
| Hg | 0.0021 | 0.00069 | |||
| Mo | 0.16 | 0.055 | |||
| Te | 0.00047 | 0.001 | |||
| Tl | 0.00004 | 0.00011 | |||
| Cd | 0.0103 | 0.0110 | |||
| SiO2 | 5.4 | 8.0 | 4 | ||
| A (wt%) | ||||||||||||
|---|---|---|---|---|---|---|---|---|---|---|---|---|
| Ref. | [91] | [44] | [92] | [64] | [50] | [93] | [18] | [94] | [7] | |||
| Mine/ Region | El Teniente | Northern Chile, Atacama Desert | Northern Chile, Atacama Desert | Northern Chile | Commune of Taltal, Antofagasta Region | Commune of Taltal, Antofagasta Region | Atacama Desert | Las Tórtolas, Central Chile | El Soldado/Los Bronces/Mantos Blancos | |||
| Cu | 1.05 | 1.115 | 1.0571 | 0.050 | 0.1527 | 0.1315–0.6566 | 0.260 | 0.0485 | 0.180/0.133/0.120 (respectively) | |||
| Fe | 41.78 | 3.5015 | 3.5488 | 9.86 | 7.20 | 16.12 | ||||||
| SiO2 | 40.5 | 54.2 | ||||||||||
| Al2O3 | 10.13 | |||||||||||
| Al | 2.3841 | 8.30 | ||||||||||
| Pb | 0.01832 | 0.007565 | 0.034 | 0.0015–0.02041 | ||||||||
| Ni | 0.0017–0.0085 | |||||||||||
| Zn | 0.02822 | 0.02967 | 0.047 | 0.0221 | 0.0167–0.0381 | 0.0041 | ||||||
| S | 0.03 | 2.71 | ||||||||||
| SO42− | 0.21982 | 0.33826 | ||||||||||
| Au | 0.1 | 0.00001–0.00005 | ||||||||||
| Ag | <5 | |||||||||||
| CaO | 6.54 | |||||||||||
| Ca | 0.02925 | 0.02797 | 2.9 | |||||||||
| MgO | 3.74 | |||||||||||
| As | 0.000363 | <0.01 | 0.00155–0.00306 | |||||||||
| Mg | 0.01066 | 2.3 | ||||||||||
| K | 0.001804 | 4.1 | ||||||||||
| Na | 0.3265 | 0.32701 | 1.5 | |||||||||
| Cr | 0.000289 | |||||||||||
| Ti | 0.4 | |||||||||||
| Mo | 0.01337 | 0.0109 | ||||||||||
| Mn | 0.03525 | 0.03228 | 0.1379 | 0.0952–0.1631 | ||||||||
| Sr | 0.0219 | |||||||||||
| P | 0.1384 | |||||||||||
| Cl | 0.8774 | |||||||||||
| Ba | 0.069 | |||||||||||
| Cd | 0.000134 | <0.000002 | ||||||||||
| B | 0.00641 | |||||||||||
| Ce | 0.0234 | |||||||||||
| Hg | 0.00006–0.0011 | |||||||||||
| Mine/Region | B (g/t and wt%) [89] | |||||||||||
| Sierra Gorda | Cu (g/t) | V (g/t) | Co (g/t) | Y (g/t) | Nb (g/t) | Ba (g/t) | Sc (g/t) | Hf (g/t) | Ta (g/t) | Sb (g/t) | Bi (g/t) | Ni (g/t) |
| 981 | 125 | 12 | 82 | 28 | 486 | 11 | 8.56 | 0.13 | 10.31 | <10 | 84 | |
| Zn (g/t) | Rb (g/t) | Sr (g/t) | Zr (g/t) | Pb (g/t) | Cs (g/t) | Th (g/t) | U (g/t) | As (g/t) | Mo (g/t) | Sn (g/t) | Ag (g/t) | |
| 159 | 329 | 68 | 557 | 50 | 6.53 | 55.93 | 22.23 | <20 | 415.97 | 85.2 | 21.4 | |
| Cd (g/t) | W (g/t) | La (g/t) | Ce (g/t) | Pr (g/t) | Nd (g/t) | Sm (g/t) | Eu (g/t) | Gd (g/t) | Tb (g/t) | Dy (g/t) | Ho (g/t) | |
| 12.1 | <10 | 42.71 | 80.38 | 10.15 | 34.12 | 7.55 | 1.01 | 6.07 | 0.85 | 4.47 | 0.87 | |
| Er (g/t) | Tm (g/t) | Yb (g/t) | Lu (g/t) | Au (g/t) | Hg (g/t) | Cr (g/t) | S Total (%) | SiO2 (%) | Al2O3 (%) | TiO2 (%) | Fe2O3 (%) | |
| 2.41 | 0.36 | 2.35 | 0.32 | <0.02 | 0.03 | 41 | 0.85 | 63.09 | 14.43 | 0.55 | 5.91 | |
| CaO (%) | MgO (%) | MnO (%) | Na2O (%) | K2O (%) | P2O5 (%) | PPC (%) | SO3 (%) | |||||
| 0.8 | 2.05 | 0.09 | 1.58 | 6.01 | 0.13 | 4.74 | - | |||||
| Mantos Blancos | Cu (g/t) | V (g/t) | Co (g/t) | Y (g/t) | Nb (g/t) | Ba (g/t) | Sc (g/t) | Hf (g/t) | Ta (g/t) | Sb (g/t) | Bi (g/t) | Ni (g/t) |
| 1932 | 120 | 10.33 | 70 | 43 | <20 | 16.33 | 6.303 | <0.01 | <10 | <10 | 83.33 | |
| Zn (g/t) | Rb (g/t) | Sr (g/t) | Zr (g/t) | Pb (g/t) | Cs (g/t) | Th (g/t) | U (g/t) | As (g/t) | Mo (g/t) | Sn (g/t) | Ag (g/t) | |
| 72 | 29 | 108 | 347 | 140 | 1.9 | 14.11 | 4.867 | <20 | <5 | 106 | 25.8 | |
| Cd (g/t) | W (g/t) | La (g/t) | Ce (g/t) | Pr (g/t) | Nd (g/t) | Sm (g/t) | Eu (g/t) | Gd (g/t) | Tb (g/t) | Dy (g/t) | Ho (g/t) | |
| 11.2 | <10 | 24.063 | 60.057 | 8.07 | 30.48 | 7.11 | 1.33 | 6.367 | 0.883 | 5.22 | 1.027 | |
| Er (g/t) | Tm (g/t) | Yb (g/t) | Lu (g/t) | Au (g/t) | Hg (g/t) | Cr (g/t) | S Total (%) | SiO2 (%) | Al2O3 (%) | TiO2 (%) | Fe2O3 (%) | |
| 2.99 | 0.42 | 2.83 | 0.387 | <0.02 | 0.02 | 48.33 | 0.257 | 64.72 | 13.79 | 0.5 | 4.38 | |
| CaO (%) | MgO (%) | MnO (%) | Na2O (%) | K2O (%) | P2O5 (%) | PPC (%) | SO3 (%) | |||||
| 2.037 | 2.26 | 0.06 | 7.36 | 0.543 | 0.153 | 3.47 | - | |||||
| Talabre | Cu (g/t) | V (g/t) | Co (g/t) | Y (g/t) | Nb (g/t) | Ba (g/t) | Sc (g/t) | Hf (g/t) | Ta (g/t) | Sb (g/t) | Bi (g/t) | Ni (g/t) |
| 2296 | 70 | 6 | 62 | 39 | 518 | 22 | 6.3 | <0.01 | 55.33 | <10 | 77 | |
| Zn (g/t) | Rb (g/t) | Sr (g/t) | Zr (g/t) | Pb (g/t) | Cs (g/t) | Th (g/t) | U (g/t) | As (g/t) | Mo (g/t) | Sn (g/t) | Ag (g/t) | |
| 231 | 124 | 498 | 568 | 741 | 0.89 | 1.74 | 1.67 | 783 | 124.39 | 46.7 | 17.9 | |
| Cd (g/t) | W (g/t) | La (g/t) | Ce (g/t) | Pr (g/t) | Nd (g/t) | Sm (g/t) | Eu (g/t) | Gd (g/t) | Tb (g/t) | Dy (g/t) | Ho (g/t) | |
| 3.29 | 88.8 | 6.98 | 11.88 | 1.44 | 5.54 | 1.02 | 0.4 | 0.86 | 0.11 | 0.6 | 0.12 | |
| Er (g/t) | Tm (g/t) | Yb (g/t) | Lu (g/t) | Au (g/t) | Hg (g/t) | Cr (g/t) | S Total (%) | SiO2 (%) | Al2O3 (%) | TiO2 (%) | Fe2O3 (%) | |
| 0.33 | 0.05 | 0.34 | 0.05 | <0.02 | 0.5 | 19 | 0.96 | 67.81 | 14.34 | 0.18 | 2.06 | |
| CaO (%) | MgO (%) | MnO (%) | Na2O (%) | K2O (%) | P2O5 (%) | PPC (%) | SO3 (%) | |||||
| 1.89 | 0.38 | 0.03 | 1.06 | 4.09 | 0.08 | 4.79 | 2.4 | |||||
| Esperanza | Cu (g/t) | V (g/t) | Co (g/t) | Y (g/t) | Nb (g/t) | Ba (g/t) | Sc (g/t) | Hf (g/t) | Ta (g/t) | Sb (g/t) | Bi (g/t) | Ni (g/t) |
| 675 | 160 | 11 | 49 | 21 | 185 | 26 | 3.88 | <0.01 | <10 | <10 | 70 | |
| Zn (g/t) | Rb (g/t) | Sr (g/t) | Zr (g/t) | Pb (g/t) | Cs (g/t) | Th (g/t) | U (g/t) | As (g/t) | Mo (g/t) | Sn (g/t) | Ag (g/t) | |
| 83 | 99 | 295 | 313 | 20 | 1.71 | 4.28 | 1.44 | <20 | 16.94 | 60.93 | 25.5 | |
| Cd (g/t) | W (g/t) | La (g/t) | Ce (g/t) | Pr (g/t) | Nd (g/t) | Sm (g/t) | Eu (g/t) | Gd (g/t) | Tb (g/t) | Dy (g/t) | Ho (g/t) | |
| <1 | <10 | 15.96 | 32.32 | 4.31 | 17.46 | 3.65 | 1.06 | 3.43 | 0.49 | 2.87 | 0.55 | |
| Er (g/t) | Tm (g/t) | Yb (g/t) | Lu (g/t) | Au (g/t) | Hg (g/t) | Cr (g/t) | S Total (%) | SiO2 (%) | Al2O3 (%) | TiO2 (%) | Fe2O3 (%) | |
| 1.71 | 0.26 | 1.6 | 0.23 | <0.02 | 0.24 | 29 | 2.58 | 48.06 | 13.50 | 0.62 | 5.86 | |
| CaO (%) | MgO (%) | MnO (%) | Na2O (%) | K2O (%) | P2O5 (%) | PPC (%) | SO3 (%) | |||||
| 3.41 | 0.07 | 0.07 | 3.73 | 2.79 | 0.16 | 9.66 | 6.45 | |||||
| Laguna Seca | Cu (g/t) | V (g/t) | Co (g/t) | Y (g/t) | Nb (g/t) | Ba (g/t) | Sc (g/t) | Hf (g/t) | Ta (g/t) | Sb (g/t) | Bi (g/t) | Ni (g/t) |
| 1335 | 96.67 | 30.67 | 45 | 10.33 | 508 | 18.667 | 3.463 | 0.29 | 26.33 | <10 | 16.33 | |
| Zn (g/t) | Rb (g/t) | Sr (g/t) | Zr (g/t) | Pb (g/t) | Cs (g/t) | Th (g/t) | U (g/t) | As (g/t) | Mo (g/t) | Sn (g/t) | Ag (g/t) | |
| 609 | 176 | 341 | 433 | 90 | 1.71 | 6.15 | 1.71 | <20 | 176.15 | 47.33 | 20.2 | |
| Cd (g/t) | W (g/t) | La (g/t) | Ce (g/t) | Pr (g/t) | Nd (g/t) | Sm (g/t) | Eu (g/t) | Gd (g/t) | Tb (g/t) | Dy (g/t) | Ho (g/t) | |
| 3.22 | 30.8 | 17.967 | 40.15 | 5.14 | 21.407 | 4.44 | 1.293 | 3.757 | 0.457 | 2.6767 | 0.537 | |
| Er (g/t) | Tm (g/t) | Yb (g/t) | Lu (g/t) | Au (g/t) | Hg (g/t) | Cr (g/t) | S Total (%) | SiO2 (%) | Al2O3 (%) | TiO2 (%) | Fe2O3 (%) | |
| 1.487 | 0.237 | 1.533 | 0.25 | <0.02 | 1.443 | 35 | 0.577 | 62 | 20.68 | 0.553 | 3.26 | |
| CaO (%) | MgO (%) | MnO (%) | Na2O (%) | K2O (%) | P2O5 (%) | PPC (%) | SO3 (%) | |||||
| 0.527 | 2.25 | 0.043 | 1.057 | 3.61 | 0.173 | 5.177 | - | |||||
| Ref. | [7] | [102] | [103] | [104] | [103] | [104] | [104] | [104] | [103] |
|---|---|---|---|---|---|---|---|---|---|
| Smelter | Chuquicamata | El Teniente | El Teniente | Fundición Hernán Videla Lira | Fundición Hernán Videla Lira | Fundición Hernán Videla Lira | Ventanas | Ventanas | |
| Cu (%) | 98.57–99.76 | 99.62 | 99.61 | 99.6 | |||||
| As | 365–1587 | 1200 | 917.4 | 952.4 | 292.48 | 196.8 | 169.7 | 828.2 | 808.44 |
| Sb | 60–235 | 200 | 140.95 | 153.1 | 52.61 | 59.3 | 48.5 | 609.9 | 366.38 |
| Bi | 6–55 | <10 | 3.45 | 3.4 | 5.38 | 8.4 | 5.0 | 8.2 | 8.14 |
| Fe | 6–31 | 29 | 12.65 | 13.4 | 75.75 | 43.9 | 37.6 | 70 | 44.8 |
| Ni | 13–107 | 32 | 138.4 | 146.2 | 355.0 | 657.0 | 320.2 | 371.6 | 256.72 |
| Pb | 18–139 | <13 | 37.9 | 43.7 | 652.25 | 1539.0 | 580.0 | 453 | 321.8 |
| S | 10–21 | 29 | 16.0 | 20.0 | 42 | ||||
| O | 1069–1624 | 1335.0 | 1641.0 | 2113 | |||||
| Au | 1–16 | 1.83 | 1.2 | 1.2 | 29.61 | 31.7 | 35.2 | 30.9 | 22.84 |
| Ag | 155–431 | 270 | 133.5 | 134.0 | 407.42 | 469.0 | 481 | 717 | 477.2 |
| Se | 86–277 | 120 | 218.08 | 209.1 | 160.5 | 164.0 | 156.3 | 227 | 201.0 |
| Te | 10–40 | 33 | 10.3 | 10.0 | 30.33 | 27.1 | 27.6 | 104 | 53.1 |
| Sn | 1.5 | 5.5 | 3.1 | 5.2 | |||||
| Ref. | [109] | [83] | [107] | [110] | [27] | [83] | [91] | [108] | [7] | [83] |
|---|---|---|---|---|---|---|---|---|---|---|
| Type | Flash Smelting Furnace | Teniente Converter | Peirce–Smith Converter | |||||||
| Smelter/ Converter | Chuquicamata | Unknown | Unknown | Hernán Videla Lira | Chuquicamata | Unknown | Unknown | Hernan Videla Lira | Potrerillos | Unknown |
| Cu | 1.61 | 3.23 | 2.27 | 0.75 | 8.0 | 7.4 | 7.2 | 7.03 | 8.0 | 13.3 |
| Fe (total) | 35.8 | 41.3 | 41.45 | 38.4 | 39.4 | 38.11 | 38 | 41.1 | ||
| Fe3O4 | 7.35 | 11.8 | 5.14 | 18.1 | 19.73 | 28.4 | ||||
| Fe2O3 | 15.76 | |||||||||
| FeO | 27.25 | 37.79 | ||||||||
| SiO2 | 27.7 | 27.89 | 26.1 | 37.5 | 24.19 | 25 | 18.9 | |||
| Si | 15.4 | |||||||||
| Al | 1.6 | |||||||||
| Al2O3 | 2.91 | 3.56 | ||||||||
| Ca | 0.49 | |||||||||
| CaO | 2.10 | 1.26 | ||||||||
| MgO | 0.88 | 0.76 | ||||||||
| S | 3.57 | 0.83 | 1.9 | 2.37 | 2.38 | 1.98 | 0.79 | |||
| Zn | 7.9 | |||||||||
| ZnO | 2.54 | |||||||||
| Pb | 0.11 | 0.1 | ||||||||
| Bi | 0.1 | |||||||||
| As | 0.0074 | 0.4 | ||||||||
| Sb | 0.06 | |||||||||
| Cr2O3 | 0.05 | |||||||||
| Cl | 0.12 | |||||||||
| Ref. | [27,28] | [123] | [124] | [119] |
|---|---|---|---|---|
| Smelter/Region | Chuquicamata | Unknown | Northern Chile | Chagres |
| Cu | 10.4 | 24.5 | 5.6 | 22.98–25.51 |
| Fe | 0.8 | 14 | 0.3 | 17.64–22.74 |
| S | 10.4 | 7.2 | 8.26–11.53 | |
| Zn | 15.6 | 0.15 | 21.3 | 0.197–0.291 |
| Pb | 7.8 | 0.08 | 5.7 | 0.067–0.133 |
| Bi | 3.5 | 0.013–0.043 | ||
| As | 19.4 | 0.9 | 10.5 | 0.82–2.04 |
| Sb | 0.1 | 0.012–0.057 | ||
| Mo | 0.45 | 0.092–0.190 | ||
| Al | 1.2 | 0.2 | 1.3–1.43 | |
| Ca | 0.3 | 0.46–0.49 | ||
| K | 1.8 | |||
| Mg | 0.06 | |||
| Na | 0.3 | |||
| P | <0.1 | |||
| Si | 1.1 | 2.92–3.01 | ||
| Ni | 0.004–0.005 |
| Ref. | [134] | [102] | [134] | [104] | [104] | [104] | [136] | [136] |
|---|---|---|---|---|---|---|---|---|
| Refinery | Chuquicamata | Chuquicamata | El Salvador | Fundición Hernán Videla Lira | El Teniente | Ventanas | Ventanas | Potrerillos |
| Cu | 27 | 22.9 | 5 | 19.8 | 28.8 | 12.05 | 24.27 | 7.8 |
| As | 5 | 6.6 | 0.7 | 1.51 | 9.2 | 2 | 6.2 | 9.22 |
| Sb | 4 | 5.56 | 3 | 0.058 | 8.06 | 0.18 | 5.5 | 10.45 |
| Bi | 0.21 | 0.19 | 0.29 | 0.12 | 0.3 | 0.41 | ||
| Te | 0.59 | 0.77 | 0.14 | 0.82 | 0.8 | 0.66 | ||
| Fe | 0.29 | 0.26 | 0.07 | 0.21 | 0.1 | 0.19 | ||
| Pb | 0.52 | 32.2 | 1.76 | 23.25 | 8.1 | 1.16 | ||
| Ni | 0.02 | 0.43 | 0.12 | 0.68 | 0.1 | 0.02 | ||
| Se | 4 | 4.92 | 21 | 3.9 | 9.3 | 3.14 | 7.9 | 8.65 |
| Ag | 12 | 21.9 | 24 | 14.77 | 15.42 | |||
| Au | 0.07 | 0.14 | 1.4 | 7.74 | 0.47 | 11.34 | 5.4 | 0.47 |
| Zn | 0.077 | 0.02 | 0.1 | |||||
| Mg | 0.004 | 0.01 | ||||||
| Ca | 0.3 | 4.14 | 0.6 | |||||
| Al | 0.44 | |||||||
| SO4 | 7.8 | |||||||
| SiO2 | 6.94 | |||||||
| P | <0.02 | |||||||
| Cl | 1.06 | 0.7 |
| Ref. | [38] | [96,149] | [148] |
|---|---|---|---|
| H2SO4 (g/L) | 160 | 220 | 202.2 |
| Cu (g/L) | 45.6 | 39.4 | 45.5 |
| As (g/L) | 21.2 | 9.76 | 6.4 |
| Sb (g/L) | 0.44 | 0.2167 | 0.58 |
| Bi (g/L) | 0.60 | ||
| Ni (g/L) | 18.2 | ||
| Fe (g/L) | 0.174 |
| H2SO4 | Cu | Sb | Fe | As |
|---|---|---|---|---|
| 220 | 39.4 | 0.2167 | 0.174 | 9.76 |
| Sb Concentration (g/L) | |||
|---|---|---|---|
| Time (h) | MX-2 | UR-3300S | Duolite C-467 |
| 1 | 0.0296 | 0.0366 | 0.0398 |
| 2 | 0.1025 | 0.0544 | 0.1085 |
| 3 | 0.1071 | 0.0615 | 0.117 |
| 4 | 0.1095 | 0.0616 | 0.1139 |
| 5 | 0.1195 | 0.0605 | 0.1175 |
| 6 | 0.1198 | 0.0611 | 0.1186 |
| 7 | 0.1201 | 0.0617 | 0.1191 |
| 8 | 0.1201 | 0.0619 | 0.1189 |
| [156] | [42] | [150] | [30] | |||||
|---|---|---|---|---|---|---|---|---|
| Time (h) | Sb (g/L) | Bed Volume | Sb (g/L) | Bed Volume | Sb (g/L) | Cycle | Sb (g/L) | Bi (g/L) |
| 6 | 0.021 | 0 | 0.000 | 0 | 0.000 | 1 | 1.233 | 1.000 |
| 12 | 0.056 | 1.1 | 0.148 | 0.6 | 0.013 | 2 | 1.367 | 0.933 |
| 18 | 0.049 | 3.0 | 0.579 | 1.7 | 0.013 | 4 | 1.133 | 0.667 |
| 24 | 0.043 | 4.7 | 0.613 | 2.8 | 0.168 | 5 | 1.083 | 0.667 |
| 29 | 0.040 | 6.5 | 0.279 | 3.9 | 0.946 | 6 | 1.217 | 0.633 |
| 46 | 0.032 | 8.2 | 0.099 | 5.1 | 2.290 | 7 | 1.067 | 0.517 |
| 57 | 0.026 | 10 | 0.030 | 6.2 | 1.740 | 8 | 1.133 | 0.517 |
| 71 | 0.021 | 11.7 | 0.010 | 7.3 | 1.080 | 9 | 0.933 | 0.467 |
| 78 | 0.019 | 13.7 | 0.003 | 8.5 | 0.712 | 10 | 1.000 | 0.417 |
| 94 | 0.016 | 15.8 | 0.000 | 9.7 | 0.505 | |||
| 18.9 | 0.000 | 10.8 | 0.376 | |||||
| 21.8 | 0.000 | 12.1 | 0.207 | |||||
| 15.0 | 0.052 | |||||||
| 17.1 | 0.000 | |||||||
Publisher’s Note: MDPI stays neutral with regard to jurisdictional claims in published maps and institutional affiliations. |
© 2022 by the authors. Licensee MDPI, Basel, Switzerland. This article is an open access article distributed under the terms and conditions of the Creative Commons Attribution (CC BY) license (https://creativecommons.org/licenses/by/4.0/).
Share and Cite
Barros, K.S.; Vielmo, V.S.; Moreno, B.G.; Riveros, G.; Cifuentes, G.; Bernardes, A.M. Chemical Composition Data of the Main Stages of Copper Production from Sulfide Minerals in Chile: A Review to Assist Circular Economy Studies. Minerals 2022, 12, 250. https://0-doi-org.brum.beds.ac.uk/10.3390/min12020250
Barros KS, Vielmo VS, Moreno BG, Riveros G, Cifuentes G, Bernardes AM. Chemical Composition Data of the Main Stages of Copper Production from Sulfide Minerals in Chile: A Review to Assist Circular Economy Studies. Minerals. 2022; 12(2):250. https://0-doi-org.brum.beds.ac.uk/10.3390/min12020250
Chicago/Turabian StyleBarros, Kayo Santana, Vicente Schaeffer Vielmo, Belén Garrido Moreno, Gabriel Riveros, Gerardo Cifuentes, and Andréa Moura Bernardes. 2022. "Chemical Composition Data of the Main Stages of Copper Production from Sulfide Minerals in Chile: A Review to Assist Circular Economy Studies" Minerals 12, no. 2: 250. https://0-doi-org.brum.beds.ac.uk/10.3390/min12020250