Article

Evolution of Ore-Forming Fluids and Gold Deposition of the Sanakham Lode Gold Deposit, SW Laos: Constrains from Fluid Inclusions Study

1
College of Earth Sciences, Chengdu University of Technology, Chengdu 610059, China
2
Chengdu Center, China Geological Survey, Chengdu 610081, China
3
Research Center of Applied Geology, China Geological Survey, Chengdu 610036, China
4
Sichuan Zhuyu Investment Co., Ltd., Chengdu 610042, China
*
Author to whom correspondence should be addressed.
Submission received: 8 December 2021 / Revised: 27 January 2022 / Accepted: 30 January 2022 / Published: 17 February 2022

Abstract

:
The Sanakham gold deposit is a newly discovered gold deposit in the Luang Prabang (Laos)–Loei (Thailand) metallogenic belt. It consists of a series of auriferous quartz-sulfide veins, which is distinguished from the regional known porphyry-related skarn and epithermal gold deposits. There are four mineralization stages identified in Sanakham, with native gold grains mainly occurring in stages II and III. Evolution of ore-forming fluids and gold deposition mechanisms in Sanakham are discussed based on fluid inclusion petrography, microthermometry, and Laser Raman spectroscopy. The original ore-forming fluids belong to a medium-high temperature (>345 °C) CH4-rich CH4–CO2–NaCl–H2O system. In stages II and III, the ore fluids evolve into a NaCl–H2O–CO2 ± CH4 system characterized by medium temperature (~300 °C), medium salinity (~10 wt% NaCl eq.), and CO2-rich (~10% mol). They might finally evolve into a NaCl–H2O system with temperature decreasing and salinity increasing in stage IV. Two fluid immiscibility processes occurred in stages II and III, which created high-CH4 & low-CO2 and low-CH4 & high-CO2 end-members, and CO2-poor and CO2-rich endmembers, respectively. Gold-deposition events are suggested to be associated with the fluid immiscibility processes, with P–T conditions and depth of 236–65 MPa, 337–272 °C, and 8.7–6.5 km, respectively.

1. Introduction

The mainland of Southeast Asia consists of a series of continental blocks or terranes together with related sutures and volcanic arcs (Figure 1a). It is endowed with a diversity of mineral resources distributed in several important metallogenetic belts, such as the Truong Son Fe-Cu-Au-W-Sn belt, Vientiane–Kon Tum K-Al-Cu-Au belt, Da Lat Au-Fe-Cu belt, Gulf of Thailand–East Malaysia Au-Sb-Cu belt, and the Luang Prabang–Loei Cu-Au-Ag belt [1]. The Luang Prabang (Laos)–Loei (Thailand) metallogenic belt lies along the western periphery of the Indochina Block, to the east of Changning–Menglian–Chieng Mai Suture zone (Figure 1a). The belt, formed during the subduction–accretionary orogeny of the Paleo-Tethys Ocean and the subsequent collisional orogeny between the Sibumasu Block and the Indochina Block, is traditionally recognized as a metallogenic belt dominated by porphyry-related skarn and epithermal deposits [2,3] (Figure 1b).
The Sanakham gold deposit, a newly discovered gold deposit in this belt with a gold resource of 10.6 t @ 3.05 g/t Au, is located about 3 km north to the Muang Sanakham County, southwest Laos (Figure 1b). The gold orebodies consist of a series of quartz-sulfide veins that are controlled by secondary structures of the regional NNE-trending brittle-ductile shear zone, which is different from the regional porphyry-related skarn and epithermal gold deposits. Given it is such a particular lode gold deposit in the Luang Prabang–Loei belt, studying it should be meaningful in both prospecting and theory. Nevertheless, there are no reports of studies on the Sanakham gold deposit up to now. We therefore carried out detailed petrography, microthermometry, and Laser Raman spectroscopy on fluid inclusions in gold-related quartz from different mineralization stages, identified by field and microscopic observation. This study aims to discuss the evolution of ore-forming fluids and gold deposition mechanisms in Sanakham, and to provide basic data for further study on regional gold metallogenic regularity.

2. Geology and Mineralization

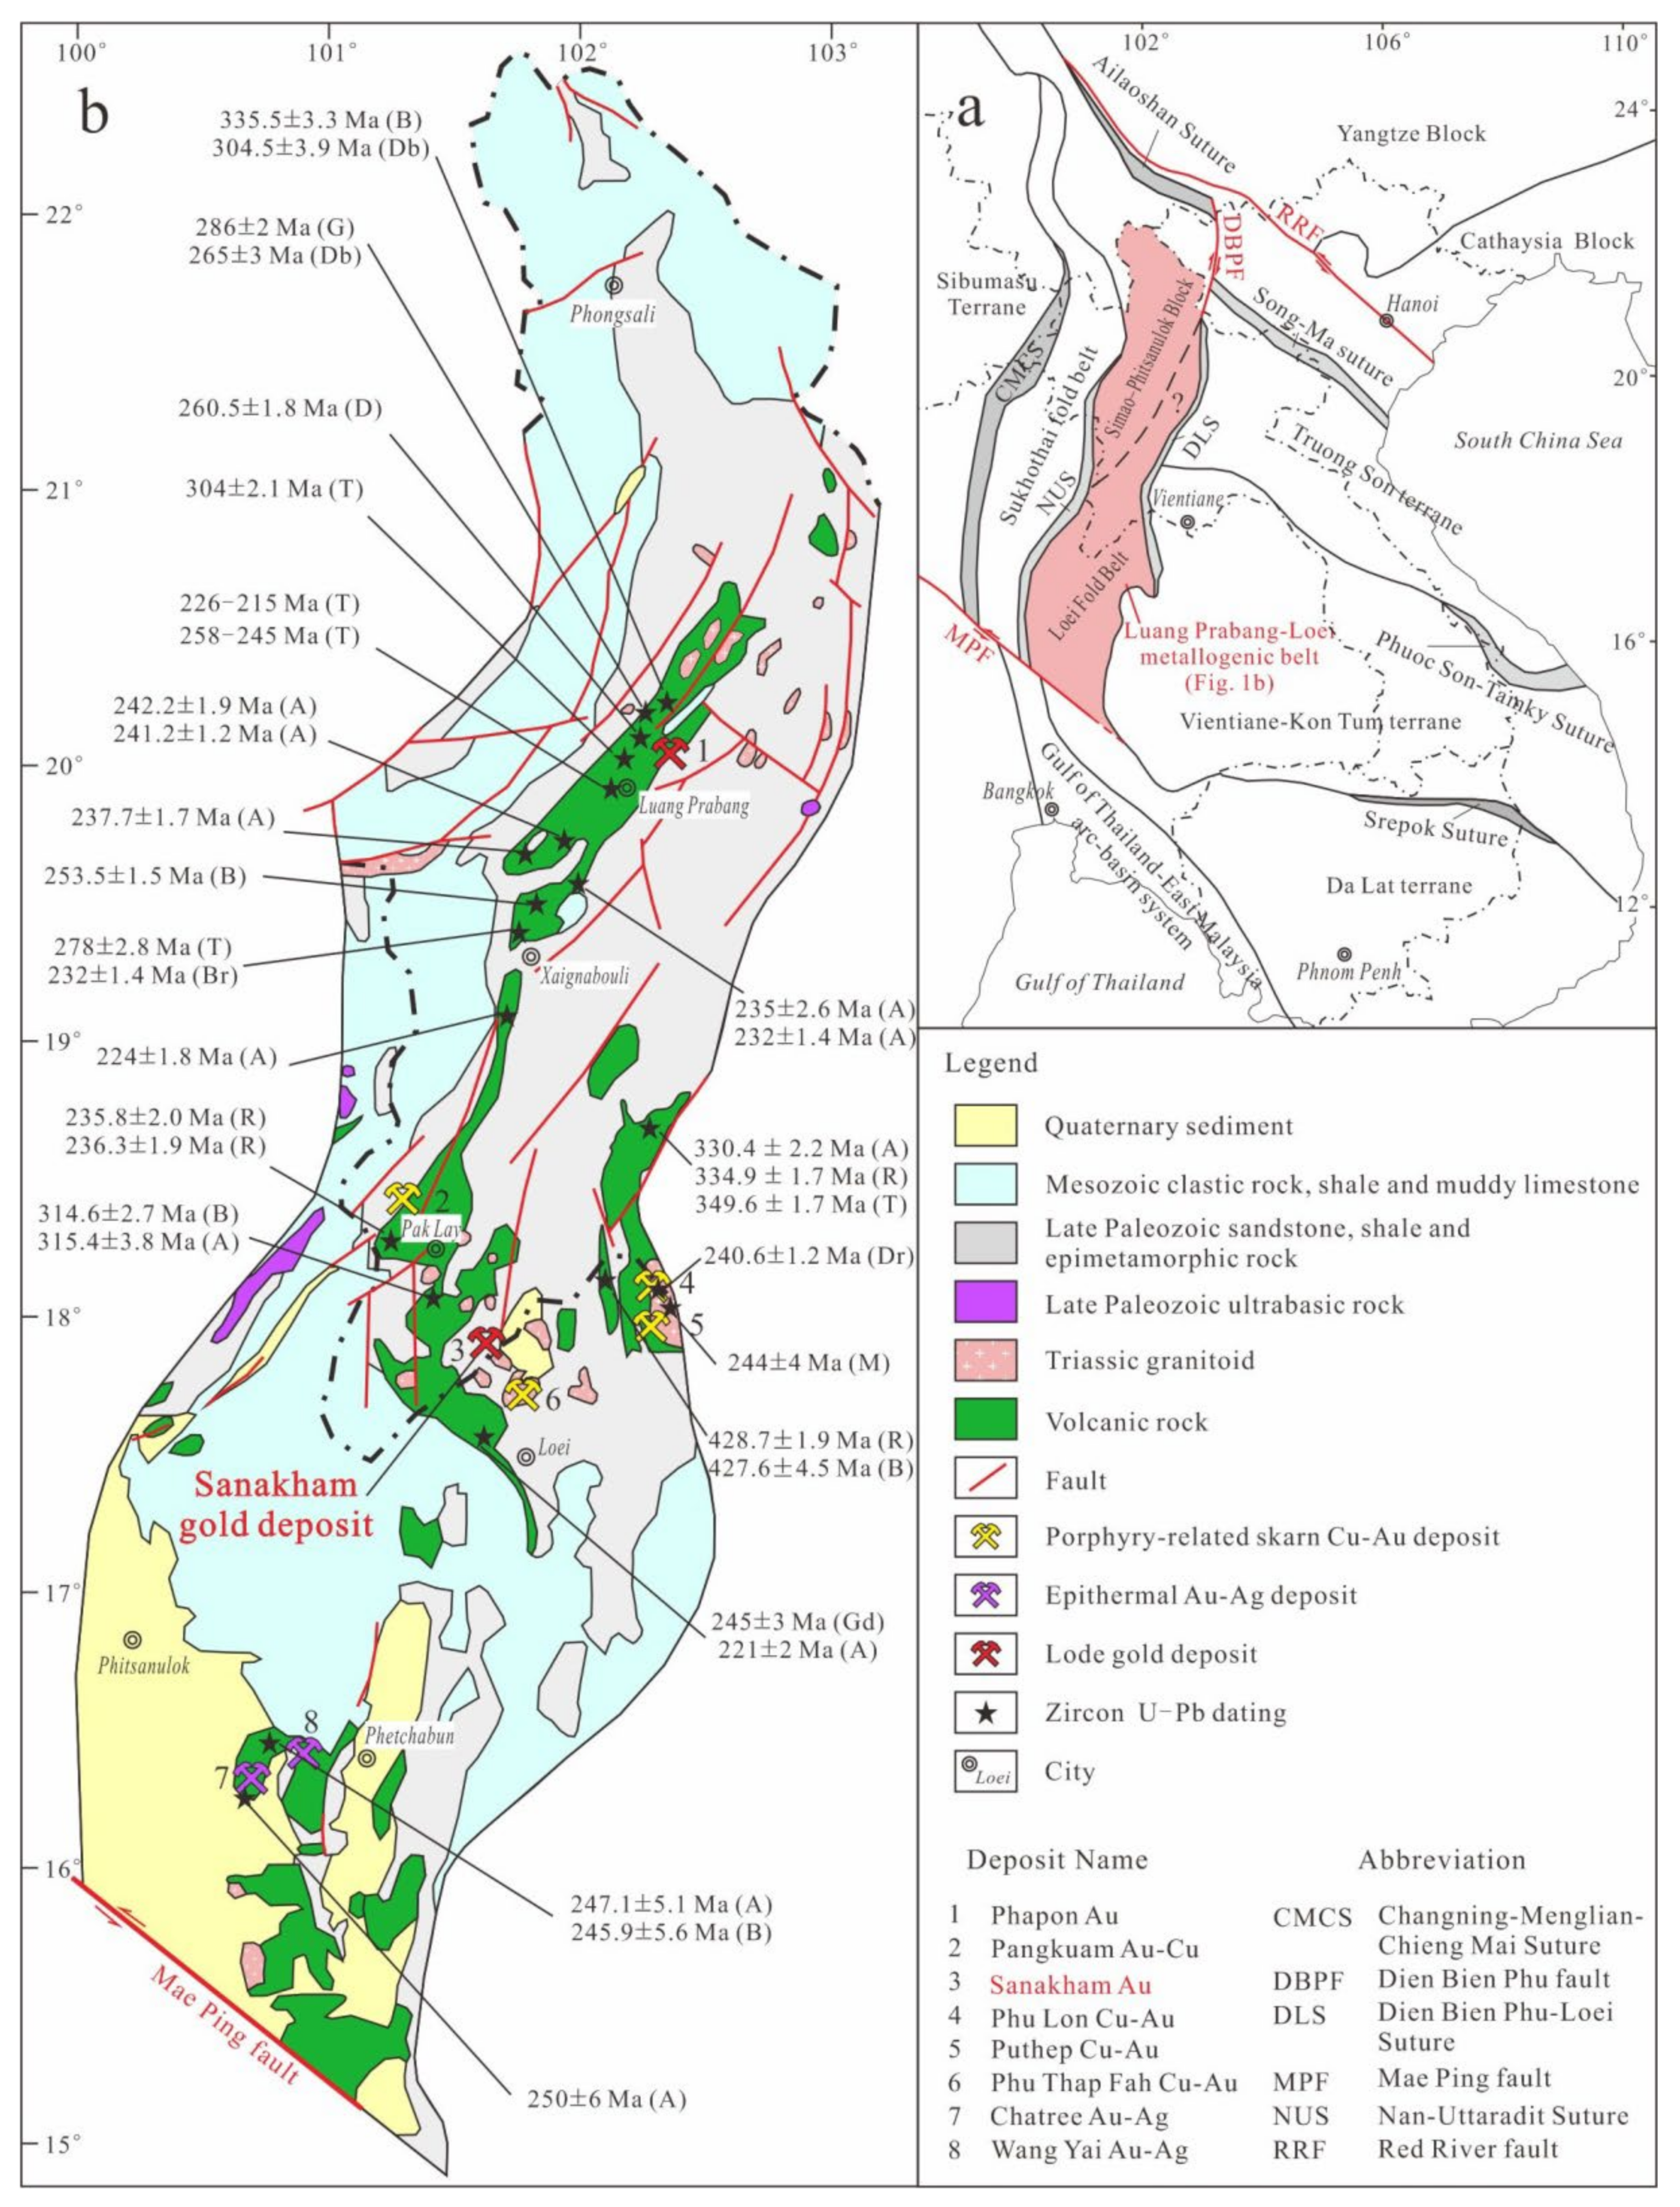
2.1. Regional Geological Setting

The Luang Prabang–Loei metallogenic belt is NNE-NE trending, bounded by the Dien Bien Phu–Loei Suture (DLS) to the east, the Nan–Uttaradit Suture (NUS) to the west, and the Meiping Fault (MPF) to the south, and is adjacent to the Simao Block in the Sanjiang Region to the north [1]. The NE-trending Luang Prabang tectonic belt develops in the central-northern part of the metallogenic belt (Figure 1a); it is characterized by a large number of Late Paleozoic–Mesozoic intermediate–basic magmatic rocks, including pillow-shaped basalts, andesites, gabbro, diabase, diorite, and volcanic clastic rocks (Figure 1b). The Carboniferous magmatic rocks, including basalt, andesite, and diabase, mainly occurred around Luang Prabang and Pak Lay [5,6,7]. The Permian to Early Triassic igneous rocks are normally gabbro, diabase, tuff, and diorite, and are confined around Luang Prabang and Xaignabouli [4,8,9,10]. The Middle–Late Triassic exposed intermediate–acid igneous rocks are widespread in the belt [5,9,11,12]. Some important gold deposits occurred in the Luang Prabang tectonic belt, including orogenic Au (Phapon [17,18]), skarn gold–copper (Pangkuam [19]), and the Sanakham lode gold deposit.
The northwest side of the Luang Prabang tectonic belt belongs to the Simao–Phitsanulok Block (Figure 1a), which is regarded as a back-arc foreland basin [1]. It mainly consists of Late Paleozoic sandstone, shale, and epimetamorphic rocks, Triassic clastic rocks and carbonate rocks, and Middle Jurassic red clastic rocks [10]. Only a few copper occurrences are found in the basin.
The southeast side of the Luang Prabang tectonic belt is the Loei Fold Belt (Figure 1a), with Late Paleozoic and Mesozoic sediments and volcanic rocks [6,13], as well as Early–Middle Triassic magmatic rocks exposed (Figure 1b). The representative porphyry–skarn copper–gold deposits (Phu Lon, Puthep, and Phu Thap Fah) develop to the north and northeast of Loei in Thailand and are genetically related with the felsic-intermediate intrusive rocks [14,15]. A set of Late Permian to Early Triassic andesitic–rhyolitic volcanic and pyroclastic rocks develops in the south of the metallogenic belt, associated with several epithermal Au–Ag deposits [16].

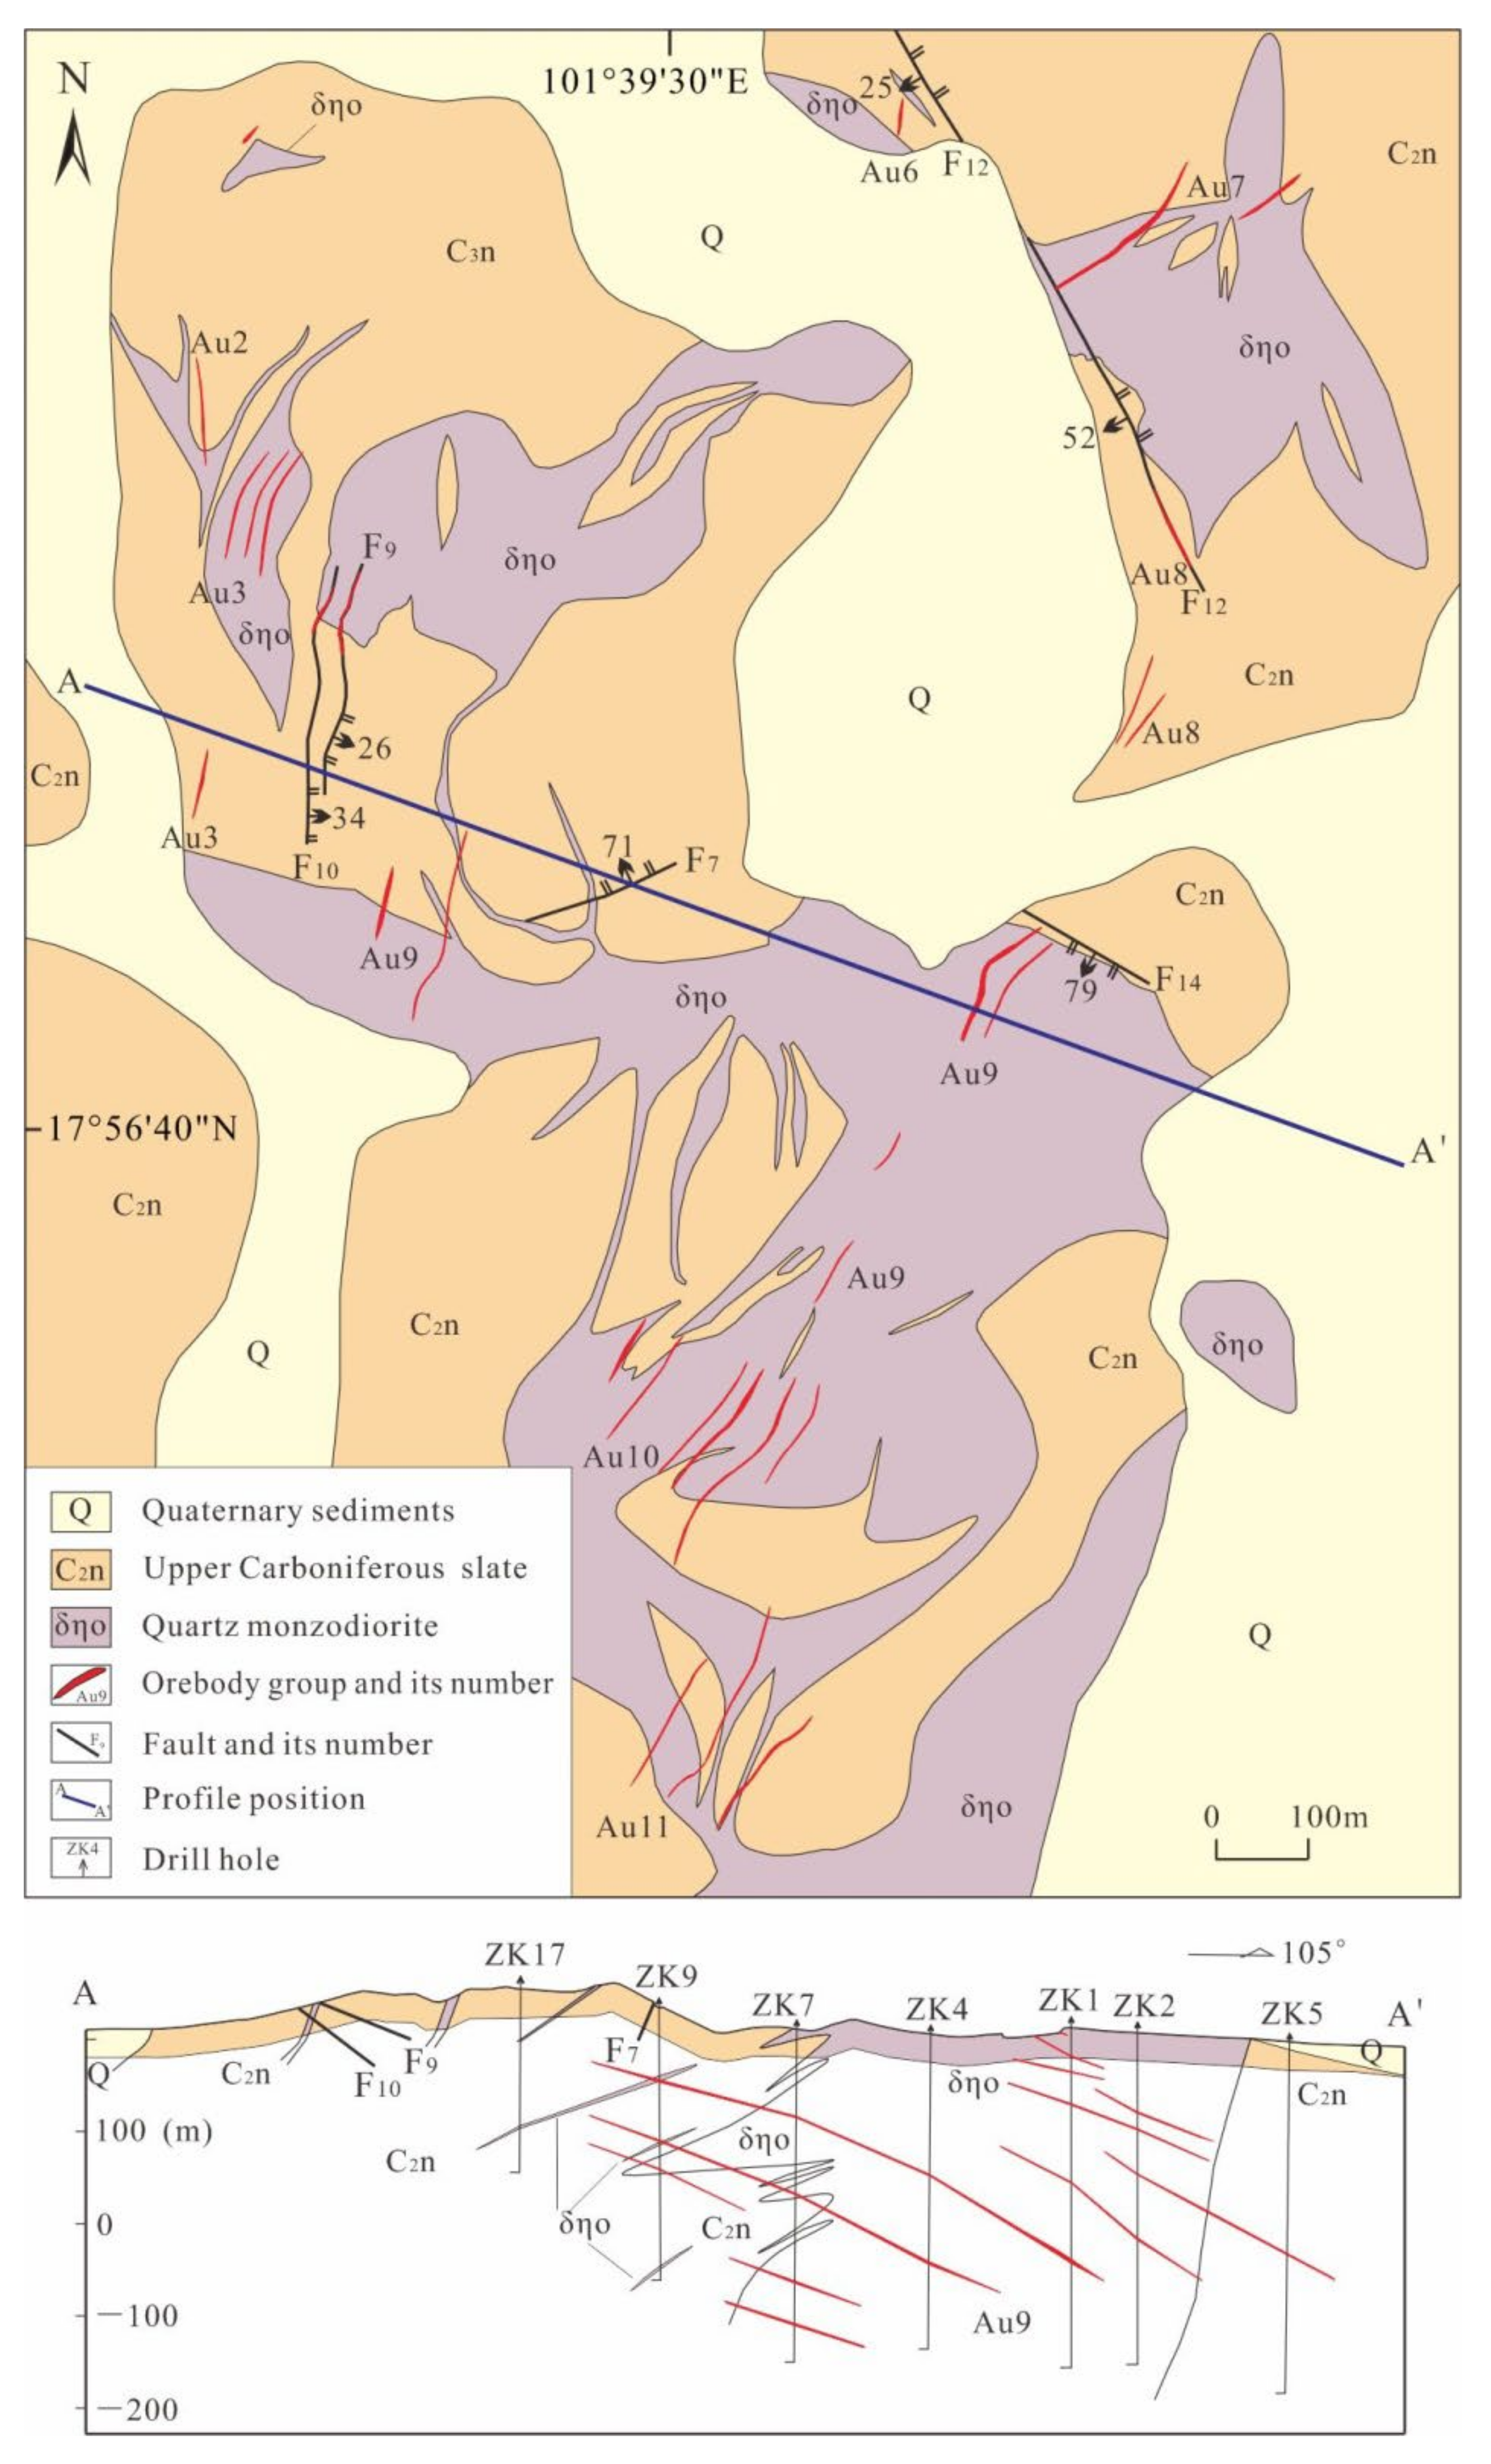
2.2. Local Geological Setting

The main stratum in the mining area is the Upper Carboniferous Nanpo Formation (C2n), which consist of purple–red thick-layered metamorphic siltstone, silty slate, slate, and brown thin-layered feldspar–debris sandstone (Figure 2). It is N to NNE trending, generally dipped to the west with a dip angle of 60–85°, and is more than 600 m in thickness. The Quaternary sediments (Q), which mainly consists of fragments that came from slate, carbonaceous slate, and metamorphic siltstone, are widespread on gentle slopes and platforms in various areas of the mining area.
The structures in the mine are mainly brittle–ductile shear zone, fault, and fracture (Figure 2). The brittle–ductile shear zone trends northeast, consistent with the regional Luang Prabang structural belt, and generally controls the overall output of the orebodies. The faults are secondary structures of the regional brittle–ductile shear zone and trend NNE or nearly S–N. They control the main intrusions and geological boundaries in the mining area. Gold orebodies normally occur within the faults and their secondary fractures.
The Middle Triassic intermediate–acid magmatic rocks are well developed and intruded into the Upper Carboniferous low-grade metamorphic rocks as an NNE-trending intrusive stock (Figure 2). The intrusions mainly consist of quartz monzodiorite with a hypidiomorphic granular texture and massive structure. It is composed of plagioclase, amphibole, alkaline feldspar, a small amount of quartz, and trace amounts of pyrite in size of 0.1–4 mm, and is gray-white in color because of weathering.
Ninety-one gold orebodies have been identified in the Sanakham deposit, and they can be divided into more than ten orebody groups (Figure 2). Most of the orebodies, vein or veinlet in shape, are included in the Au9 orebody group and account for 3/4 of the total gold resources. The several main orebodies in the Au9 orebody group are about 80–400 m in length, strike towards the NE, and dip 10°–40° SE with a depth of 300–600 m. They range in thickness from 0.8 to 4 m, averaging about 1.2–1.5 m. The gold grade ranges from 1.0 to 12.3 g/t, with an average gold grade of 3.05 g/t. The wallrocks are generally quartz monzonite, slate, and, locally hornfel.

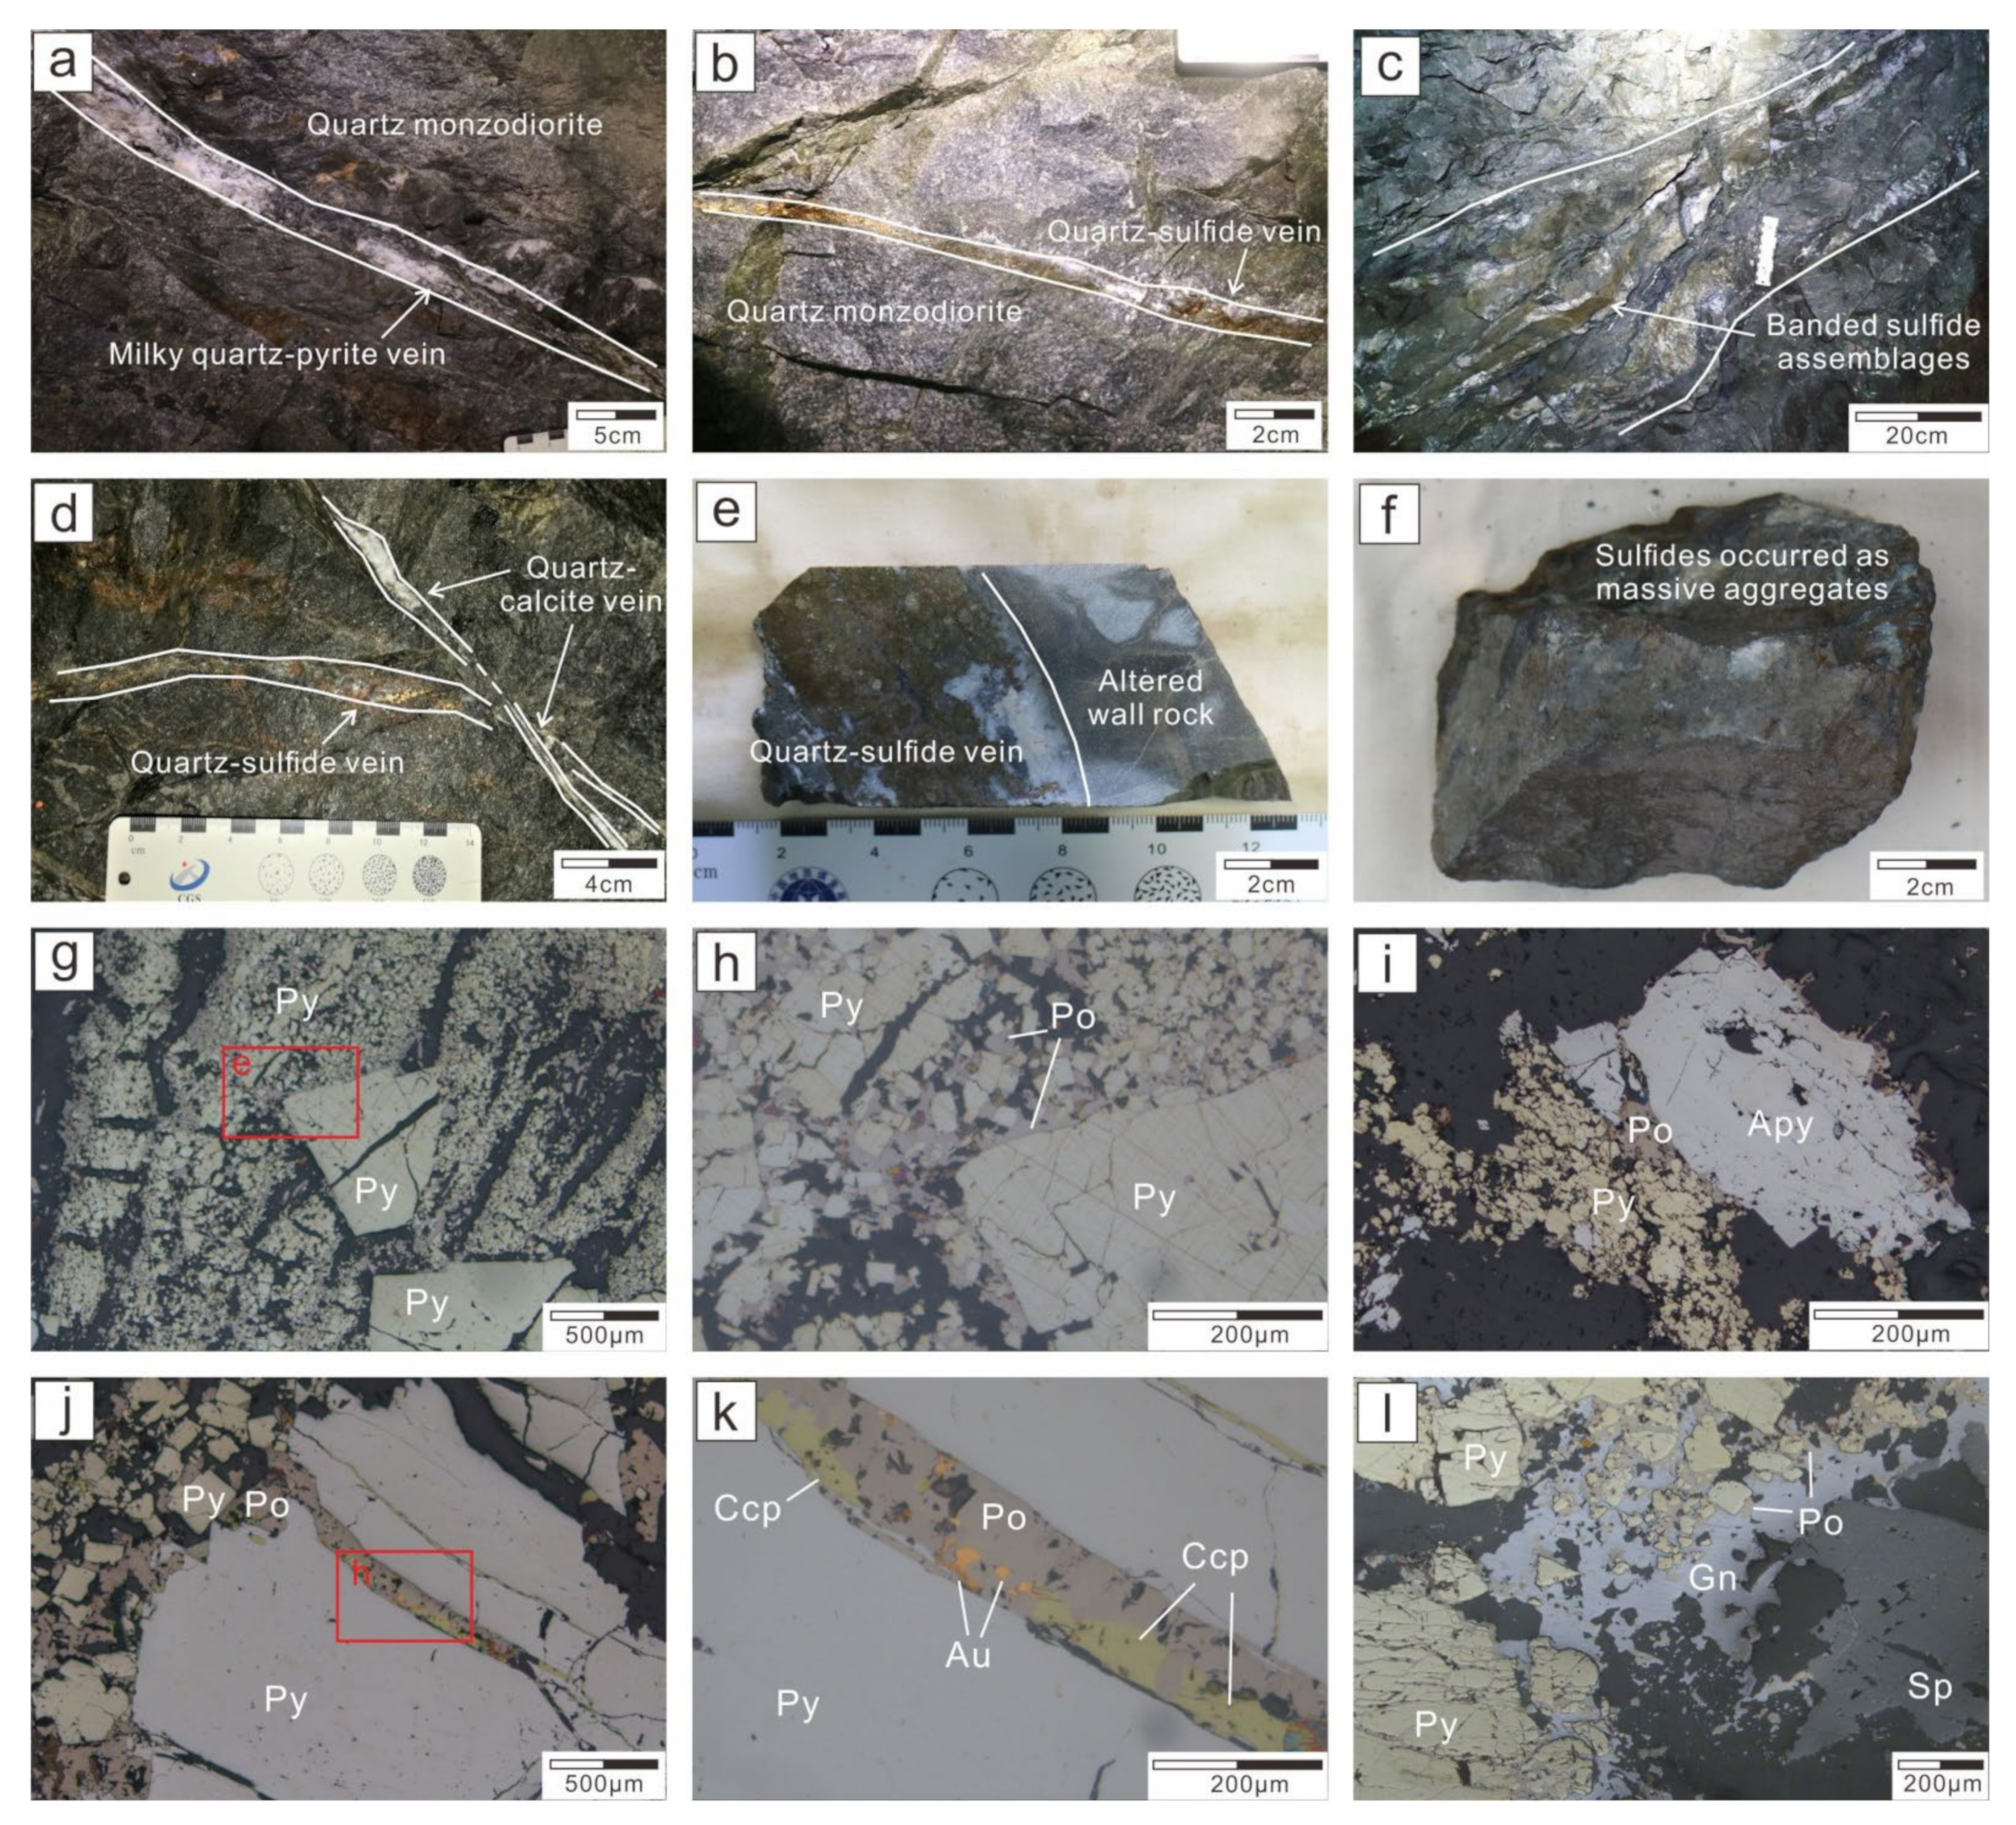
2.3. Wall-Rock Alterations and Ore Mineralization

The wall-rock alteration at Sanakham mainly developed in the quartz monzodiorite and is controlled by the NE–NNE trending faults. The hydrothermal alterations are primarily silicification, sulfidation, sericitization, and carbonation, among which silicification and sulfidation have the closest relationship with gold mineralization. Silicification is the most widely distributed alteration, normally occurred as veins and networks, with a small amount disseminated in the intrusions. Sulfidation is dominated by pyrite, and lesser pyrrhotite, chalcopyrite, arsenopyrite, galena, and sphalerite. They co-exist with quartz to form quartz-sulfide veins (Figure 3a–d), generally as banded sulfide assemblages or massive aggregates (Figure 3e–f). The plagioclase, biotite, and potassium feldspar are locally subjected to sericitization around the orebodies, showing a coexistence relationship with disseminated silicification. Carbonation is normally in the form of calcite veinlets, 0.1 to 1 cm in width, interspersed in the wall rock. K-feldspar and chlorite are widely distributed in the intrusions and formed earlier than gold-related mineralization. Hydrothermal metasomatic alteration develops along the contact zones between quartz monzonite and slate, with a width of less than 20 m. It is characterized by skarnization, marbleization and hornfel alteration, but has little spatial relation with gold mineralization.
The lode gold orebodies primarily occur in the fault zones and fractures in the quartz monzodiorite and locally extend into Upper Carboniferous strata along with the structures. Primary sulfide ores mainly present vein stockwork and massive structures followed by disseminated structures. The ore minerals are primarily pyrite (~10 vol%), with lesser chalcopyrite and pyrrhotite (each 2–3 vol%), and a small amount of arsenopyrite, galena, and sphalerite (each ~1 vol%); the gangue minerals mainly consist of quartz (60–70 vol%) with minor calcite (5–10 vol%) and lesser sericite (1–3 vol%). Based on cross-cutting relationships and mineral assemblage characteristics (Figure 3), four mineralization stages have been identified in Sanakham (Figure 4): quartz–pyrite–arsenopyrite (stage I), quartz–pyrite–pyrrhotite-chalcopyrite (stage II), quartz–pyrite–base-metal sulfide (stage III), and quartz–carbonate (stage IV). Native gold occurs mainly in the main ore stages, i.e., stages II and III.
Stage I is normally quartz veins that comprise milky white quartz (Figure 3a), minor sericite, and euhedral to subhedral coarse-grained disseminated pyrite (Figure 3g) and arsenopyrite (Figure 3i). Stage II is characterized by quartz–sulfide veins and veinlets in grey color. The minerals are primarily subhedral to anhedral fine-grained pyrite, with minor pyrrhotite and chalcopyrite, which normally occurs around the boundary of stage I pyrite and arsenopyrite (Figure 3h,i). Native gold appears generally as irregular inclusions in pyrrhotite or chalcopyrite that fill in fractures of pyrite (Figure 3j,k). Similarly, stage III is characterized by quartz–sulfide veins and sulfide massive aggregations that consist of quartz, pyrite, pyrrhotite, chalcopyrite, and galena and sphalerite in particular (Figure 3l). They normally crosscut or overprint the stage II veins. Stage IV is characterized by quartz–calcite veinlets that crosscut the quartz–sulfide veins (Figure 3d).

3. Sampling and Analytical Methods

A total of nine samples of gold-bearing ore were selected for fluid-inclusion analyses. Twenty doubly polished sections (about 0.1 mm thick) were chosen for petrographical study; of these, twelve sections were selected for microthermometry and Laser Raman study on hydrothermal quartz grains at the Fluid Inclusion Laboratories, Chengdu Center of China Geological Survey.
Fluid inclusion microthermometry was made with a Linkam THMSG 600 heating-cooling stage (−198 to 600 °C). The reproducibility of measurements was ±1 °C at temperatures >30 °C and ± 0.1 °C at temperatures <30 °C. The measurements of melting temperatures of ice (Tm ice), melting temperatures of the carbonic phase (mainly consist of CO2 and CH4, Tm carbon), clathrate-melting temperatures (Tm clath), and partial homogenization of carbonic phase (Th carbon) were made at the heating rate of 0.2 °C/min, and for final homogenization temperature (Th TOT), the heating rate was 1.0 °C/min.
Laser Raman spectroscopy of individual inclusions was performed using a Renishaw Raman spectrometer equipped with a 514 nm Ar ion laser as the source of excitation. The instrument records peaks in the range of 1200 to 3800 cm−1 with a resolution of ±1 cm−1 and a spectral repeatability of less than 0.1 cm−1.

4. Results

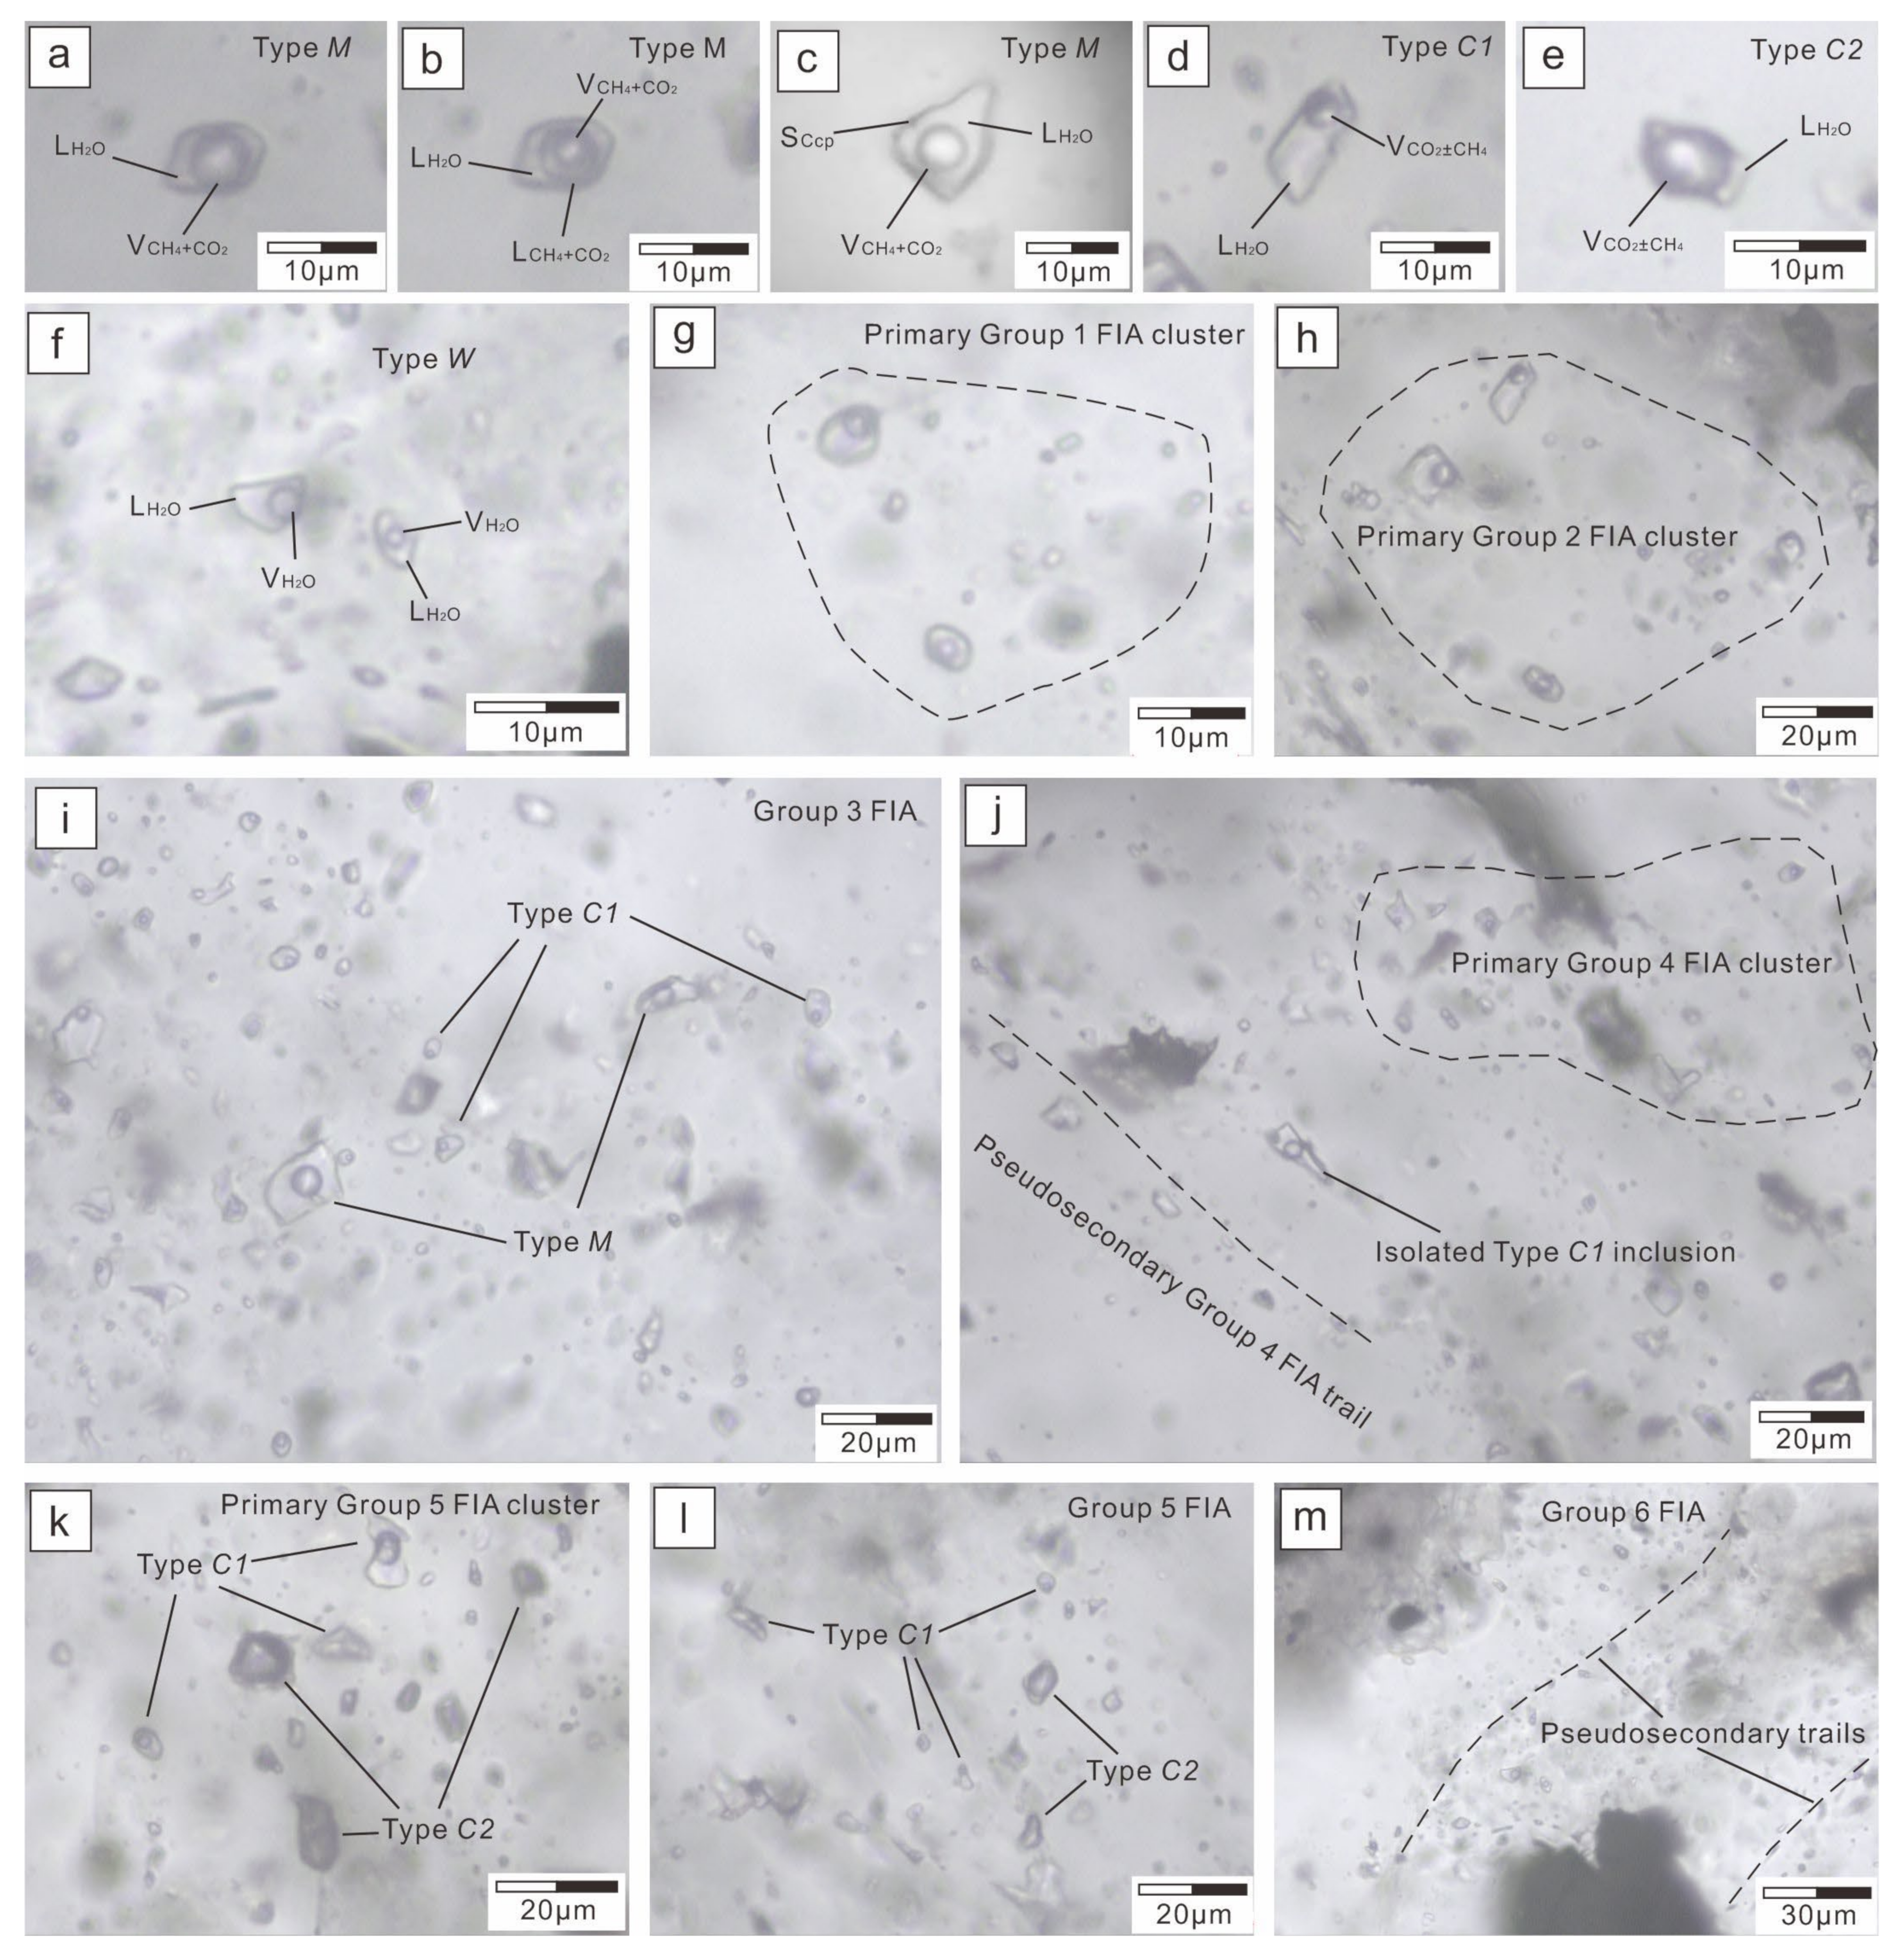
4.1. Fluid-Inclusion Petrography

Based on micro-observation, microthermometry and Laser Raman analyses, the fluid inclusions were classified and grouped according to textural criteria using the FIA (fluid inclusion assemblage) method [20,21]. Three gold-related primary fluid inclusion types were observed in quartz: type M, CH4-rich fluid inclusion; type C, CO2-rich fluid inclusion; and type W, aqueous inclusions. Type M inclusions normally comprise a carbonic vapor phase and an aqueous phase at room temperature (Figure 5a). The carbonic phase consists primarily of CH4, less of CO2, and occasionally of C2H6 and H2S, and separates into vapor and liquid carbonic phases through cooling (Figure 5b). These inclusions have a continuum V/(L + V) ratios range from 0.3 to 0.8 and homogenize to either liquid or vapor. Daughter minerals can be occasionally found in individual type M inclusions (Figure 5c). Type C inclusions contain two (aqueous + carbonic) or three (aqueous + liquid carbonic + vapor carbonic) phases at room temperature, and can be further divided into two subtypes based on their V/(L + V) ratios: type C1 has V/(L + V) ratios mostly between 0.1 and 0.3 and homogenizes into liquid (the aqueous phase, Figure 5d), whereas type C2 has V/(L + V) ratios of 0.6 and 0.9 and normally homogenizes into vapor (the carbonic phase, Figure 5e). The carbonic phase of type C inclusions consists of major CO2 and less CH4, which is different from type M inclusions. Type W aqueous inclusions comprise an aqueous phase and a vapor phase with V/(L + V) ratios of 0.05 to 0.25, and homogenize to liquid (Figure 5f). The type M and C inclusions are normally 5–15 μm in diameter, have predominately regular to negative crystal shape or partly irregular shape. The type W inclusions are relatively smaller (2–10 μm) and have regular to irregular shape.
Six groups of FIA occur in hydrothermal quartz grains and are summarized in Table 1. Group 1 FIA consists of type M inclusions that show nearly constant V/(L + V) ratios, and widely distributed as clusters in stage I quartz (Figure 5g). Group 2 FIA, composed of C1 inclusions sharing the same composition, locally occurs as clusters in stage II quartz (Figure 5h). Group 3 FIA consists of M and C1 inclusions that widely occur as clusters in stage II quartz and show various volumes of the carbonic phases (Figure 5i). Group 4 FIA, also composed of C1 inclusions sharing the same composition, exists in stage III quartz, either as clusters, or along pseudo-secondary trails, or as isolated inclusions (Figure 5j). Group 5 FIA is distinctive and widespread in stage III quartz and consists of type C1 and C2 inclusions. The coexisting C1 and C2 inclusions have different V/(L + V) ratios and homogenize to liquid and vapor, respectively (Figure 5k,l). Group 6 FIA generally occurred in stage IV quartz and was comprised of W inclusions with identical V/(L + V) ratios (Figure 5m).

4.2. Results of Microthermometry

A total of 23 FIAs selected from hydrothermal quartz from all four stages were analyzed. The microthermometric data and calculated parameters (min, max, mean and number) for every FIA are listed in Table 2, Table 3, Table 4 and Table 5. Of which, mean values of each type of fluid inclusions in every FIA are used for assessment and math statistics.

4.2.1. FIA in Stage I

Four Group 1 FIAs, each comprising 3–5 inclusions, were measured to gain exact microthermometry data (Table 2 and Figure 6). The Tm carbon of type M inclusions occurs between −74.2 and −69.5 °C, with a mean value of −72.2 °C. The Tm clath and Th carbon of type M inclusions range from −5.7 to −2.9 °C (mean −4.2 °C), and 4.9 to 9.5 °C (mean 6.8 °C), relatively. These inclusions generally homogenize into liquid phase finally, with Th TOT between 326° and 345 °C (mean 337 °C).

4.2.2. FIA in Stage II

Two Group 2 FIAs, which are comprised of four type C1 inclusions each, were measured successfully (Table 3 and Figure 6). The Tm carbon, Tm clath, Th carbon, and Th TOT of C1 inclusions in Group 2 FIA are −57.9 to −57.5 °C (mean −57.7 °C), 4.3 to 4.8 °C (mean 4.6 °C), 18.2 to 20.3 °C (mean 19.3 °C), and 305 to 318 °C (mean 312 °C), respectively. The microthermometric data are similar to those in Group 1 FIA in stage I quartz.
Table 2. Summary of the microthermometric data and calculated parameters for Group 1 FIAs from stage I quartz.
FIA GroupFIA No.FI TypeRangeTm carbon (°C)Tm clath (°C)Th carbon (°C)Th TOT (°C)Salinity (wt.% NaCl)
Group 1Group 1-1MMin−76.1−3.57.832817.9
(N = 5)Max−70.3−2.211.135219.1
Mean−74.2−2.99.534018.6
Group 1-2MMin−74.4−4.73.133618.8
(N = 4)Max−71.1−3.16.735220.2
Mean−72.8−3.94.834519.5
Group 1-3MMin−73.5−5.54.932919.4
(N = 4)Max−70.1−3.88.234620.9
Mean−71.6−4.66.633720.1
Group 1-4MMin−70.5−7.45.231719.8
(N = 3)Max−68.7−4.27.034122.4
Mean−69.5−5.76.032621.0
Table 3. Summary of the microthermometric data and calculated parameters for Groups 2 and 3 FIAs from stage II quartz.
FIA GroupFIA No.FI TypeRangeTm carbon (°C)Tm clath(°C)Th carbon (°C)Th TOT(°C)Salinity (wt.% NaCl)Bulk Density (g/cm3)XH2OXNaClXCO2 + XCH4XCO2XCH4
Group 2Group 2-1C1Min−58.63.916.52959.40.7820.8250.0260.0510.0460.005
(N = 4)Max−57.24.820.631410.70.9830.9150.0340.1480.1440.004
Mean−57.94.318.230510.10.8770.8720.0300.0980.0920.006
Group 2-2C1Min−58.24.417.93118.90.7700.8210.0250.0670.0620.005
(N = 4)Max−56.95.122.532610.00.9400.9020.0310.1540.1510.003
Mean−57.54.820.33189.40.8560.8660.0280.1070.1030.004
Group 3Group 3-1MMin−73.1−11.00.332423.0
(N = 4)Max−68.4−8.38.934725.0
Mean−70.7−9.84.333524.1
C1Min−60.64.913.83067.80.8350.8550.0240.0710.0580.013
(N = 3)Max−57.95.819.63359.20.9240.9060.0270.1190.1120.007
Mean−59.25.216.43208.80.8760.8780.0260.0960.0840.012
Group 3-2MMin−72.4−8.22.134121.7
(N = 3)Max−70.6−6.67.636423.0
Mean−71.5−7.55.035522.4
C1Min−59.55.316.73297.00.7320.8070.0190.0530.0460.007
(N = 3)Max−57.36.319.33428.60.9680.9200.0270.1740.1690.005
Mean−58.15.918.13357.60.8330.8620.0220.1160.1080.008
Group 3-3MMin−67.2−4.314.831518.6
(N = 3)Max−63.8−2.917.933919.8
Mean−65.6−3.716.232619.3
C1Min−58.43.522.43289.40.7300.7940.0250.0840.0770.007
(N = 4)Max−57.04.824.034511.30.9090.8810.0350.1810.1770.004
Mean−57.64.123.333710.40.8250.8450.0300.1250.1200.005
Group 3-4MMin−65.7−6.812.727320.6
(N = 4)Max−62.1−5.213.930621.9
Mean−64.0−5.913.328821.2
C1Min−57.93.819.72829.80.8470.8590.0290.0550.0520.003
(N = 3)Max−56.84.522.029710.90.9730.9110.0340.1120.1110.001
Mean−57.24.220.929010.30.9250.8940.0320.0750.0730.002
Group 3-5MMin−73.1−6.28.832520.4
(N = 3)Max−71.2−4.913.734621.4
Mean−72.0−5.511.233620.9
C1Min−61.42.917.432010.60.8020.8310.0300.0470.0370.010
(N = 2)Max−59.84.021.633812.10.9990.9140.0390.1390.1200.019
Mean−60.63.519.532911.30.8950.8740.0340.0920.0750.017
Group 3-6MMin−68.9−4.86.430418.8
(N = 4)Max−64.7−3.19.234220.3
Mean−66.6−4.17.932319.7
C1Min−58.84.416.33118.50.7520.8120.0230.0650.0590.007
(N = 3)Max−57.25.420.833410.00.9460.9040.0310.1650.1600.005
Mean−58.14.918.83229.20.8530.8650.0270.1080.1000.008
Table 4. Summary of the microthermometric data and calculated parameters for Groups 4 and 5 FIAs from stage III quartz.
FIA GroupFIA No.FI TypeRangeTm carbon (°C)Tm clath (°C)Th carbon (°C)Th TOT (°C)Salinity (wt.% NaCl)Bulk Density (g/cm3)XH2OXNaClXCO2 + XCH4XCO2XCH4
Group 4FIA 4-1C1Min−57.43.822.12869.70.8510.8620.0290.0680.0650.003
(N = 4)Max−56.84.624.230810.90.9410.8980.0340.1100.1090.001
Mean−57.04.323.329810.10.8850.8760.0300.0930.0910.002
FIA 4-2C1Min−57.74.619.62938.60.7960.8380.0240.0660.0630.003
(N = 5)Max−56.75.324.43019.70.9410.9040.0300.1380.1370.001
Mean−57.25.022.02969.10.8650.8720.0270.1010.0980.003
Group 5FIA 5-1C1Min−58.22.014.226611.70.9010.8730.0360.0410.0380.003
(N = 4)Max−56.63.219.627913.31.0210.9160.0430.0910.0910.000
Mean−57.32.517.127212.60.9740.9010.0400.0590.0570.002
C2Min−60.13.816.32709.50.8600.3990.0130.3320.2790.053
(N = 3)Max−57.94.722.428710.90.8840.6440.0240.5880.5530.035
Mean−59.04.319.127810.10.8720.5390.0190.4430.3940.049
FIA 5-2C1Min−59.25.619.53077.10.8320.8650.0210.0590.0520.007
(N = 3)Max−57.16.223.23258.10.9490.9160.0250.1150.1120.003
Mean−58.35.921.33167.60.8930.8930.0230.0840.0770.007
C2Min−59.56.018.73026.10.8270.3360.0070.3820.3320.050
(N = 2)Max−58.16.820.13347.50.8750.6030.0150.6570.6110.046
Mean−58.86.419.43186.80.8500.4890.0110.5000.4500.050
FIA 5-3C1Min−57.23.322.931310.40.8120.8380.0300.0460.0450.001
(N = 4)Max−56.64.125.332911.60.9980.9170.0370.1320.1320.000
Mean−56.83.724.032211.00.9000.8790.0340.0880.0870.001
C2Min−58.64.523.53349.20.8300.5170.0160.2760.2510.025
(N = 2)Max−57.24.927.33459.80.8660.7000.0240.4670.4530.014
Mean−57.94.725.43399.50.8470.6200.0200.3600.3380.022
FIA 5-4C1Min−59.22.914.52789.50.8880.8790.0290.0380.0330.005
(N = 4)Max−58.44.719.229912.11.0220.9230.0390.0920.0850.007
Mean−58.83.616.929011.20.9500.8990.0350.0660.0590.007
C2Min−59.44.116.22828.00.8580.4000.0110.4450.3870.058
(N = 2)Max−59.25.720.329410.40.8630.5360.0190.5890.5180.071
Mean−59.34.918.32889.20.8600.4740.0150.5110.4500.061
FIA 5-5C1Min−58.43.821.230110.00.8060.8370.0290.0650.0600.005
(N = 2)Max−57.24.424.831310.90.9490.9010.0340.1350.1310.004
Mean−57.84.123.030710.40.8860.8750.0310.0930.0880.005
C2Min−60.73.622.531010.10.8320.4850.0170.3750.3040.071
(N = 3)Max−57.14.325.932411.20.8410.6010.0230.4980.4830.015
Mean−59.14.024.231610.60.8360.5480.0200.4320.3840.048
FIA 5-6C1Min−57.54.321.12738.60.8430.8630.0250.0410.0390.002
(N = 4)Max−57.05.324.929510.11.0030.9270.0320.1120.1100.002
Mean−57.34.923.22849.20.9270.9000.0280.0710.0690.002
C2Min−58.74.220.82828.00.7980.2480.0070.4840.4400.044
(N = 3)Max−57.15.725.729310.30.8070.4990.0180.7450.7230.022
Mean−57.85.023.72879.10.8020.3960.0120.5920.5620.030
Table 5. Summary of the microthermometric data and calculated parameters for Group 6 FIAs from stage IV quartz.
FIA GroupFIA No.FI TypeRangeTh TOT (°C)Tm ice (°C)Salinity (wt.% NaCl)Bulk Density (g/cm3)XH2OXNaCl
Group 6Group 6-1WMin227−12.413.20.9380.9550.045
(N = 4)Max243−9.316.40.9490.9430.057
Mean235−10.814.80.9430.9490.051
Group 6-2WMin215−9.511.40.9160.9620.038
(N = 5)Max232−7.713.40.9520.9540.046
Mean223−8.612.40.9350.9580.042
Group 6-3WMin184−15.817.40.9940.9390.061
(N = 4)Max206−13.419.51.0320.9310.069
Mean196−14.518.41.0120.9360.064
Six Group 3 FIAs, which are widespread in stage II quartz and consist of several coexisting type M and C1 inclusions, were chosen for microthermometry (Table 3 and Figure 6). The Tm carbon of type M inclusions occurs between −72.0 and −64.0 °C (mean −68.4 °C), while the type C1 inclusions have an obviously higher Tm carbon range from −60.6 and −57.2 °C (mean −58.5 °C). The Tm clath and Th carbon of type M inclusions range from −9.8 to −3.7 °C (mean −6.1 °C) and 4.3 to 16.2 °C (mean 9.7 °C), respectively. Similarly, the type C1 inclusions have a higher Tm clath and Th carbon range from 3.5 to 5.9 °C (mean 4.6 °C) and 16.4 to 23.3 °C (mean 19.5 °C), respectively. The M inclusions generally homogenize finally into the liquid phase with Th TOT between 288° and 355 °C (mean 327 °C). All of the type C1 inclusions finally homogenize into the liquid phase and occur generally between 290° and 337°C, with a mean value of 322 °C.

4.2.3. FIA in Stage III

For the local existed Group 4 FIAs (Table 4 and Figure 6), the Tm carbon, Tm clath, Th carbon, and Th TOT of type C1 inclusions are, respectively, −57.2 to −57.0 °C (mean −57.1 °C), 4.3 to 5.0 °C (mean 4.7 °C), 22.0 to 23.3 °C (mean 22.7 °C), and 296 to 298 °C (mean 297 °C), which are generally similar to the Group 2 FIAs in stage II quartz.
The coexisting type C1 and C2 inclusions in the six measured Group 5 FIAs have the similar microthermometric data (Table 4 and Figure 6). The Tm carbon of type C1 inclusions occur between −58.8 and −56.8 °C, with a mean value of −57.7 °C. The type C2 inclusions have slightly lower Tm carbon range from −59.3 and −57.8 °C (mean −58.7 °C). The Tm clath and Th carbon of type C1 inclusions range relatively from 2.5 to 5.9 °C, and 16.9 to 24.0 °C. While, the type C2 inclusions have slightly higher Tm clath and Th carbon relatively from 4.9 to 6.4 °C, and 18.3 to 25.4 °C. The C1 and C2 inclusions finally homogenize into liquid and vapor phase, with Th TOT of 272° to 322 °C (mean 299 °C) and 278° to 339 °C (mean 304 °C), respectively. Some coexisting C1 and C2 inclusions have their V/(L + V) ratios change during heating, but cracked almost simultaneously before final homogenization.

4.2.4. FIA in Stage IV

Three Group 6 FIAs which comprise 4−5 type W inclusions in each were selected for microthermometry (Table 5 and Figure 6). The type W inclusions have melting temperatures of ice (Tm ice) range from −14.5 to −8.6 °C (mean −11.3 °C), and total homogenization into liquid occurs between 196 and 235 °C (mean 218 °C).

4.3. Results of Laser Raman Spectroscopy
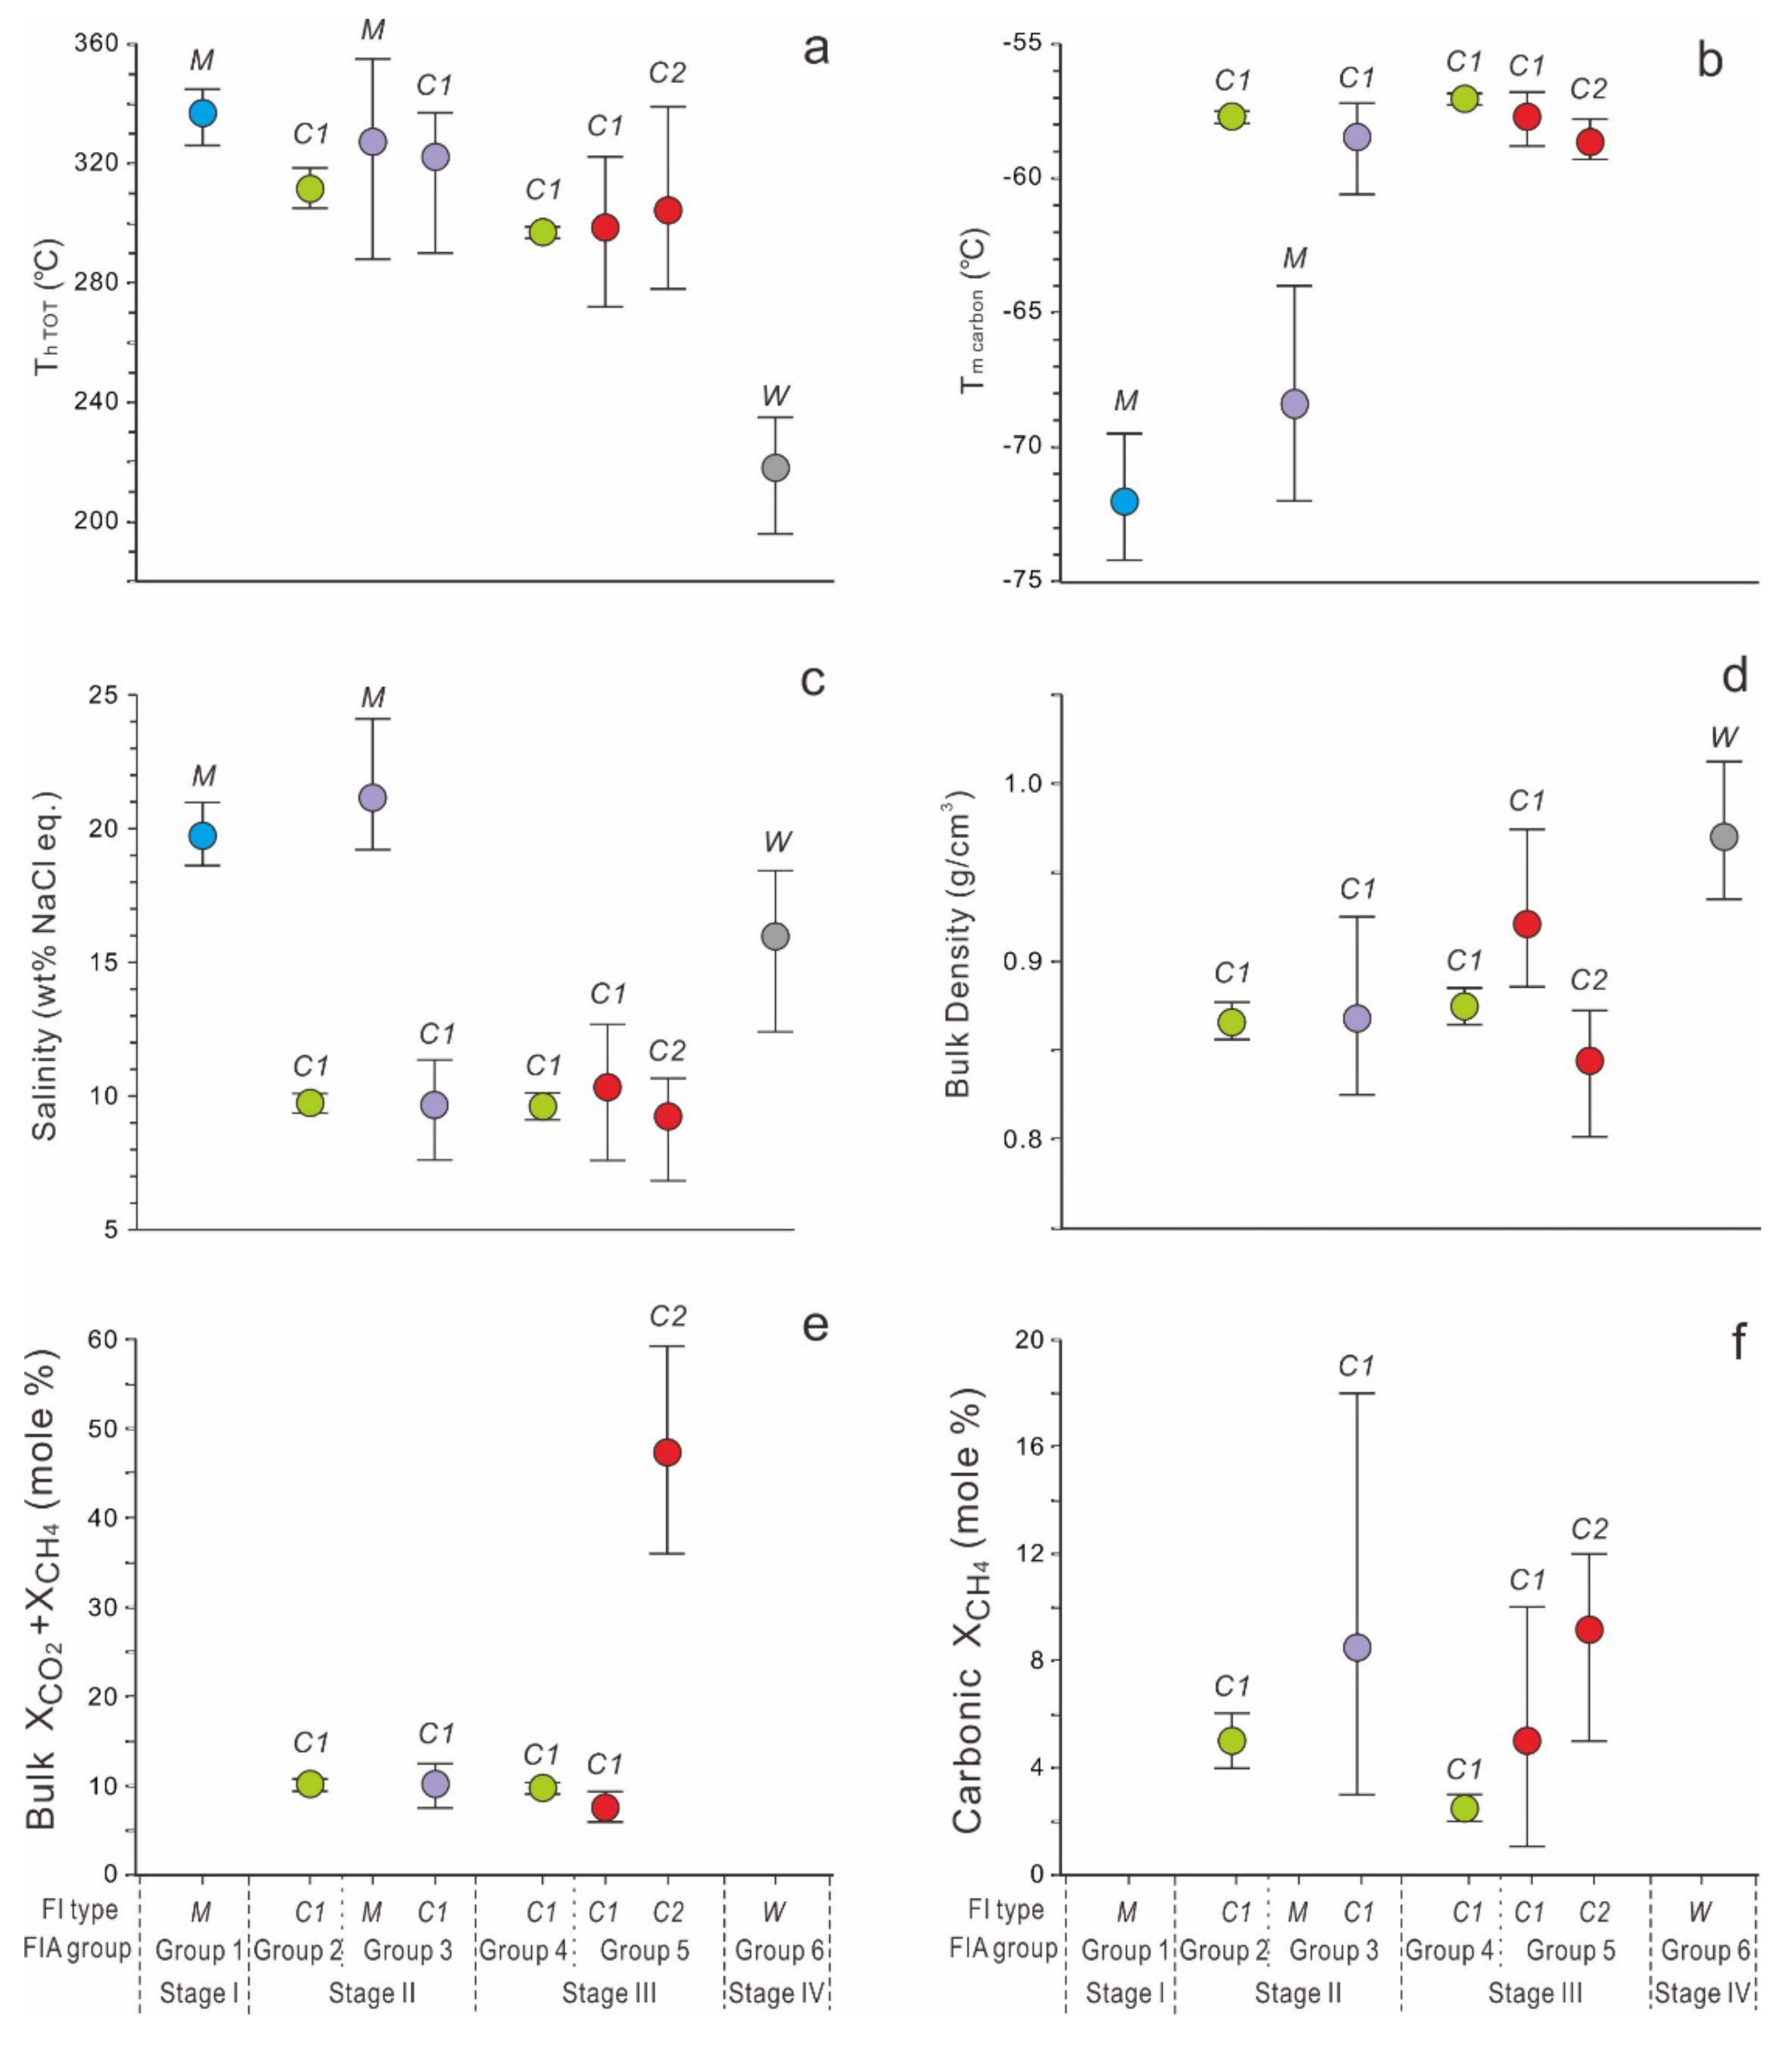
Laser Raman spectroscopy indicates that both type M and type C fluid inclusions have carbonic component-dominate vapor phase (Figure 7). The gas phases of these inclusions consist of CH4 + CO2 ± C2H6 ± H2S, with no detectable N2. The type C inclusions normally have high CO2 spectroscopic peaks (Figure 7a), while most spectroscopic analyses show high CH4 peaks in type M inclusions (Figure 7b–d). Type M inclusions contain about 70–85 mole % CH4 in carbonic phase, much higher than that of C1 inclusions (CH4 contents normally lower than 20%). The occasional daughter minerals in type M inclusions are normally chalcopyrite (Figure 7d) and calcite.
The salinity (wt% NaCl equiv (eq.)), bulk density, and composition of the above fluid inclusions were estimated according to the program of Bakker [22] using the software MacFlincor [23]. The CH4 content in the carbonic phase of type C inclusions was estimated from the V-X phase diagram of the CO2–CH4 system [24]. The bulk CH4 content, thus can be calculated combined with XCO2 + XCH4 and carbonic XCH4. For the type M inclusions, CH4 content is too high to get its accurate data based on the V-X phase diagram, thus evaluated by Laser Raman spectroscopy here. The salinities of type M inclusions are calculated using Tm clath based on the equation from Darling et al. [25]. The bulk density of type M inclusions are hard to assess because of the high CH4 content. The results of FIA assessment and math statistics are presented in Table 2, Table 3, Table 4 and Table 5 and Figure 6 and Figure 8.

4.3.1. Salinity

Stage I: Salinities in type M inclusions in Group 1 FIA vary from 18.6 to 21.0 wt% NaCl eq. (mean 9.8 wt% NaCl eq.).
Stage II: Salinities in type C1 inclusions in Group 2 FIA vary from 9.4 to 10.1 wt% NaCl eq. (mean 9.8 wt% NaCl eq.). The type C1 inclusions in Group 3 FIA that coexist with type M inclusions, similarly, have salinities ranging from 7.6 to 11.3 wt% NaCl eq. (mean 9.6 wt% NaCl eq.). Type M inclusions in Group 3 FIA, however, have higher salinities ranging from 19.3 to 24.1 wt% NaCl eq. (mean 21.3 wt% NaCl eq.), which are even higher than those in type M inclusions in Group 1 FIA.
Stage III: The range of salinities of types C1 and C2 inclusions in Group 5 FIAs are 6.8–10.6 wt% and 7.6–12.6 wt% NaCl eq. (mean 10.3, and 9.2 wt% NaCl eq.), respectively. The salinities of inclusions show a decreasing trend along with the increasing of CO2 content in Group 5 FIAs. Salinities of type C1 inclusions in Group 4 FIA are 9.1–10.1 NaCl eq. (mean 9.6 wt% NaCl eq.), basically equal to C1 inclusions in Group 5 FIA in stage III, as well as C1 inclusions in Group 2 FIA in stage II.
Stage IV: Type W inclusions in Group 6 FIA have relatively higher salinities of 12.4–18.4 NaCl eq. (mean 15.2 wt% NaCl eq.) than C1 inclusions from previous stages.

4.3.2. Bulk Density

Stage II: The bulk densities of the type C1 inclusions in both Groups 2 and 3 FIA are nearly the same, from 0.856–0.877 g/cm3 (mean 0.867 g/cm3) and 0.825–0.925 g/cm3 (mean 0.868 g/cm3), respectively.
Stage III: For Group 5 FIA, the bulk densities of the type C1 and C2 inclusions are quite different, with ranges of 0.886–0.974 g/cm3 (mean 0.922 g/cm3) and 0.802–0.872 g/cm3 (mean 0.845 g/cm3), respectively. Nevertheless, bulk densities of type C1 inclusions in Group 4 FIA are 0.865–0.885 g/cm3 (mean 0.875 g/cm3), lower than the C1 inclusions in Group 5 FIA in stage III but generally equal to C1 inclusions in Group 2 FIA in stage II.
Stage IV: Bulk densities of W inclusions in Group 6 FIA are 0.935–1.012 g/cm3 (mean 0.963 g/cm3), obviously higher than the type C inclusions from the quartz of previous stages.

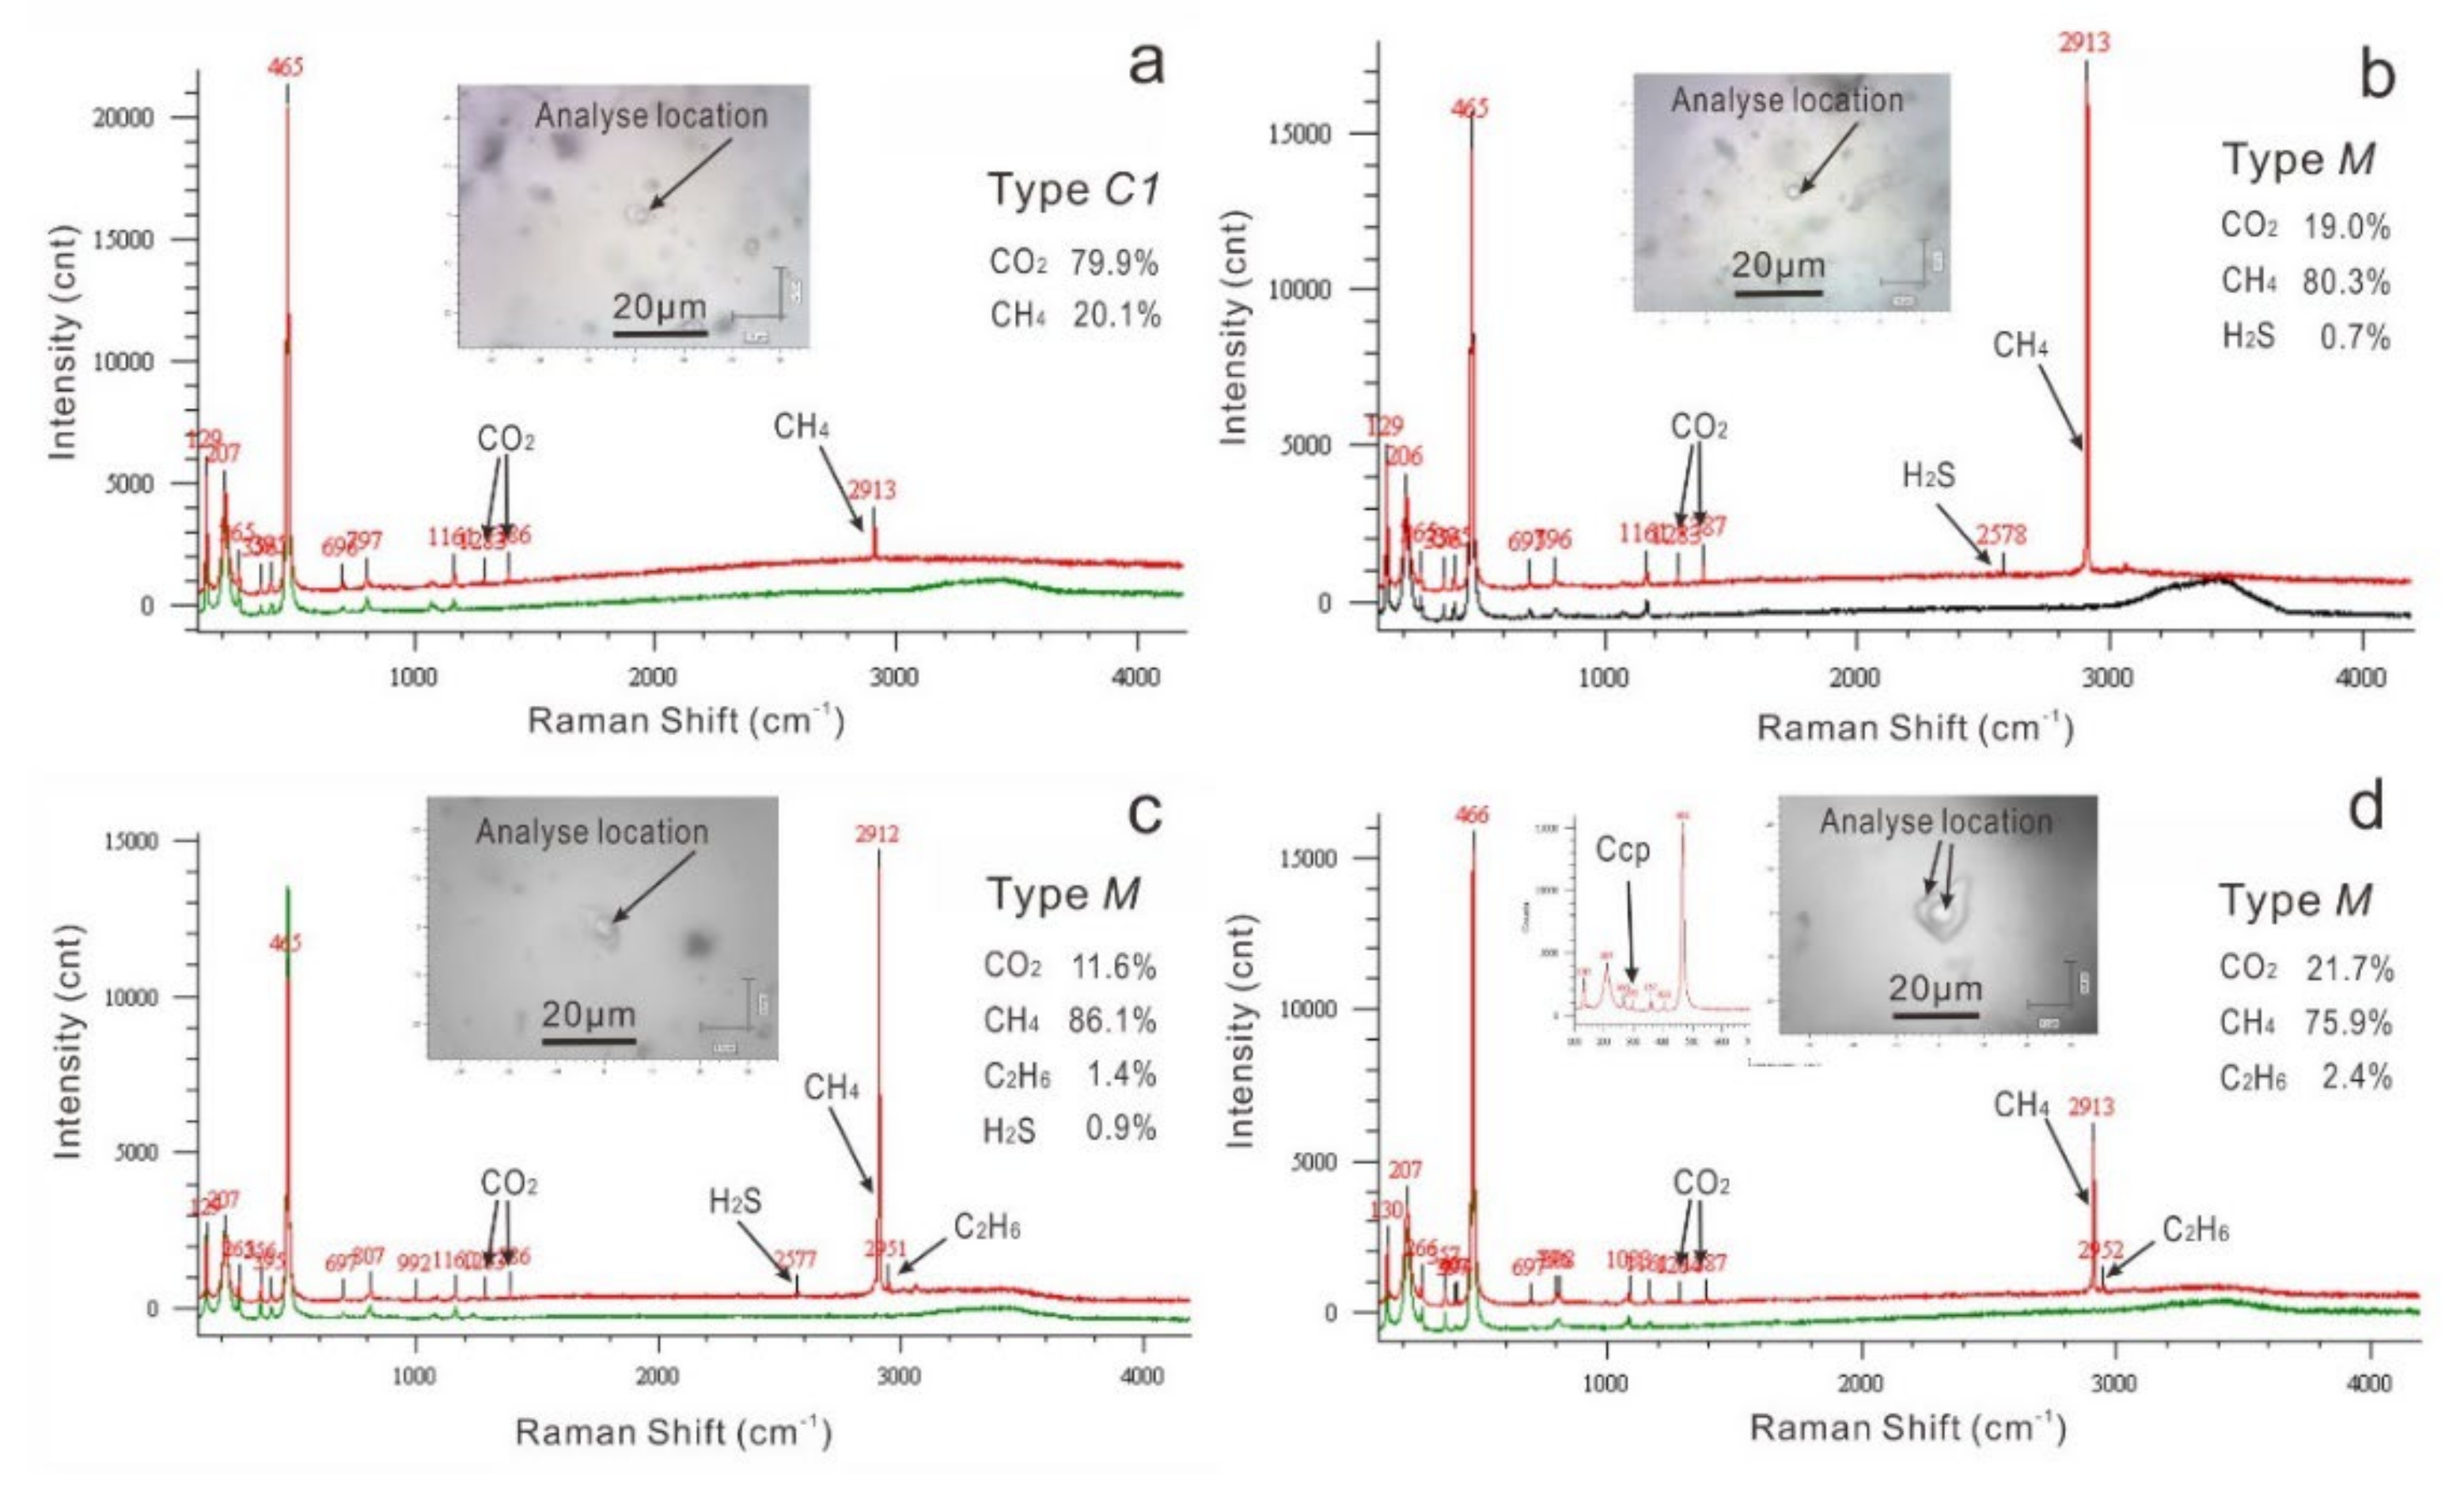
4.3.3. Content of CO2 and CH4

Both type M and C inclusions are able to assume the contents of CO2 and CH4. For type M inclusions, the content of CO2 + CH4 varies from 30 to 80 mol%, carbonic XCH4 of are generally 70–85 mole% based on Raman data.
In stage II, the type C1 inclusions from Group 2 FIAs consist of ~87 mol% H2O with CO2 + CH4 varying from 9.8 to 10.7 mol% (mean 10.3 mol%), while the type C1 inclusions from Group 3 FIA that coexist with type M inclusions have similar bulk compositions, with a relatively wider CO2 + CH4 range of 7.5–12.5 mol% (mean 10.2 mol%). The carbonic XCH4 of type C1 inclusions in Groups 2 and 3 FIAs are 4–6 mol% and 3–18 mol%, respectively. The bulk XCH4 of type C1 inclusions in Groups 2 and 3 FIAs are therefore calculated to be 0.4–0.6 mol% (median 0.5 mol%) and 0.2–1.7 mol% (median 0.9 mol%), respectively.
In stage III, the CO2 + CH4 in type C1 and C2 inclusions from Group 5 FIAs have ranges of 5.9–9.3 mol% (median 7.7 mol%) and 36.0–59.2 mol% (median 47.3 mol%), respectively. The carbonic CH4 and bulk CH4 of C2 inclusions are, respectively, 5–12 mol% and 2.2–6.1 mol%, higher than the coexisting C1 inclusions (1–10 mol% and 0.1–0.7 mol%). Type C1 inclusions in the two Group 4 FIAs have a higher content of CO2 + CH4 (9.3–10.1 mol%) than those in Group 5 FIA.

5. Discussion

5.1. Nature of Ore-Forming Fluids

According to fluid-inclusion petrography, Laser Raman spectroscopy, and microthermometry studies, there are big differences in composition among each fluid inclusion type and FIA group. Each of the Group 1, 2, 4, and 6 FIAs comprise only one type of fluid inclusion, and they represent a homogeneous fluid (Table 1). Group 1 FIA, consists of type M CH4-rich fluid inclusions and represents a CH4-rich CH4–CO2–NaCl–H2O system in stage I, is characterized by medium temperatures (326–345 °C) and is CH4-rich (~20–70% mol). Group 2 and 4 FIAs consist of type C1 inclusions in stages II and III, respectively, belong to a NaCl–H2O–CO2–CH4 system, with medium temperatures (296–318 °C) and medium salinity (9.1–10.1 wt% NaCl eq.), and are CO2-rich (~10% mol) with minor CH4 (~5% in carbonic phase). While Group 6 FIAs in stage IV belong to a NaCl–H2O system, which is characterized by medium–low temperatures (196–239 °C) and relatively higher salinity (12.4–18.4 wt% NaCl eq.). Thus, the ore-forming fluids of Sanakham gold deposit might primarily belong to a medium temperature CH4-rich CH4–CO2–NaCl–H2O system, which evolved into a NaCl–H2O–CO2–CH4 system in the main ore stage, and finally transformed into a medium–low temperature, medium–high salinity NaCl–H2O fluid.

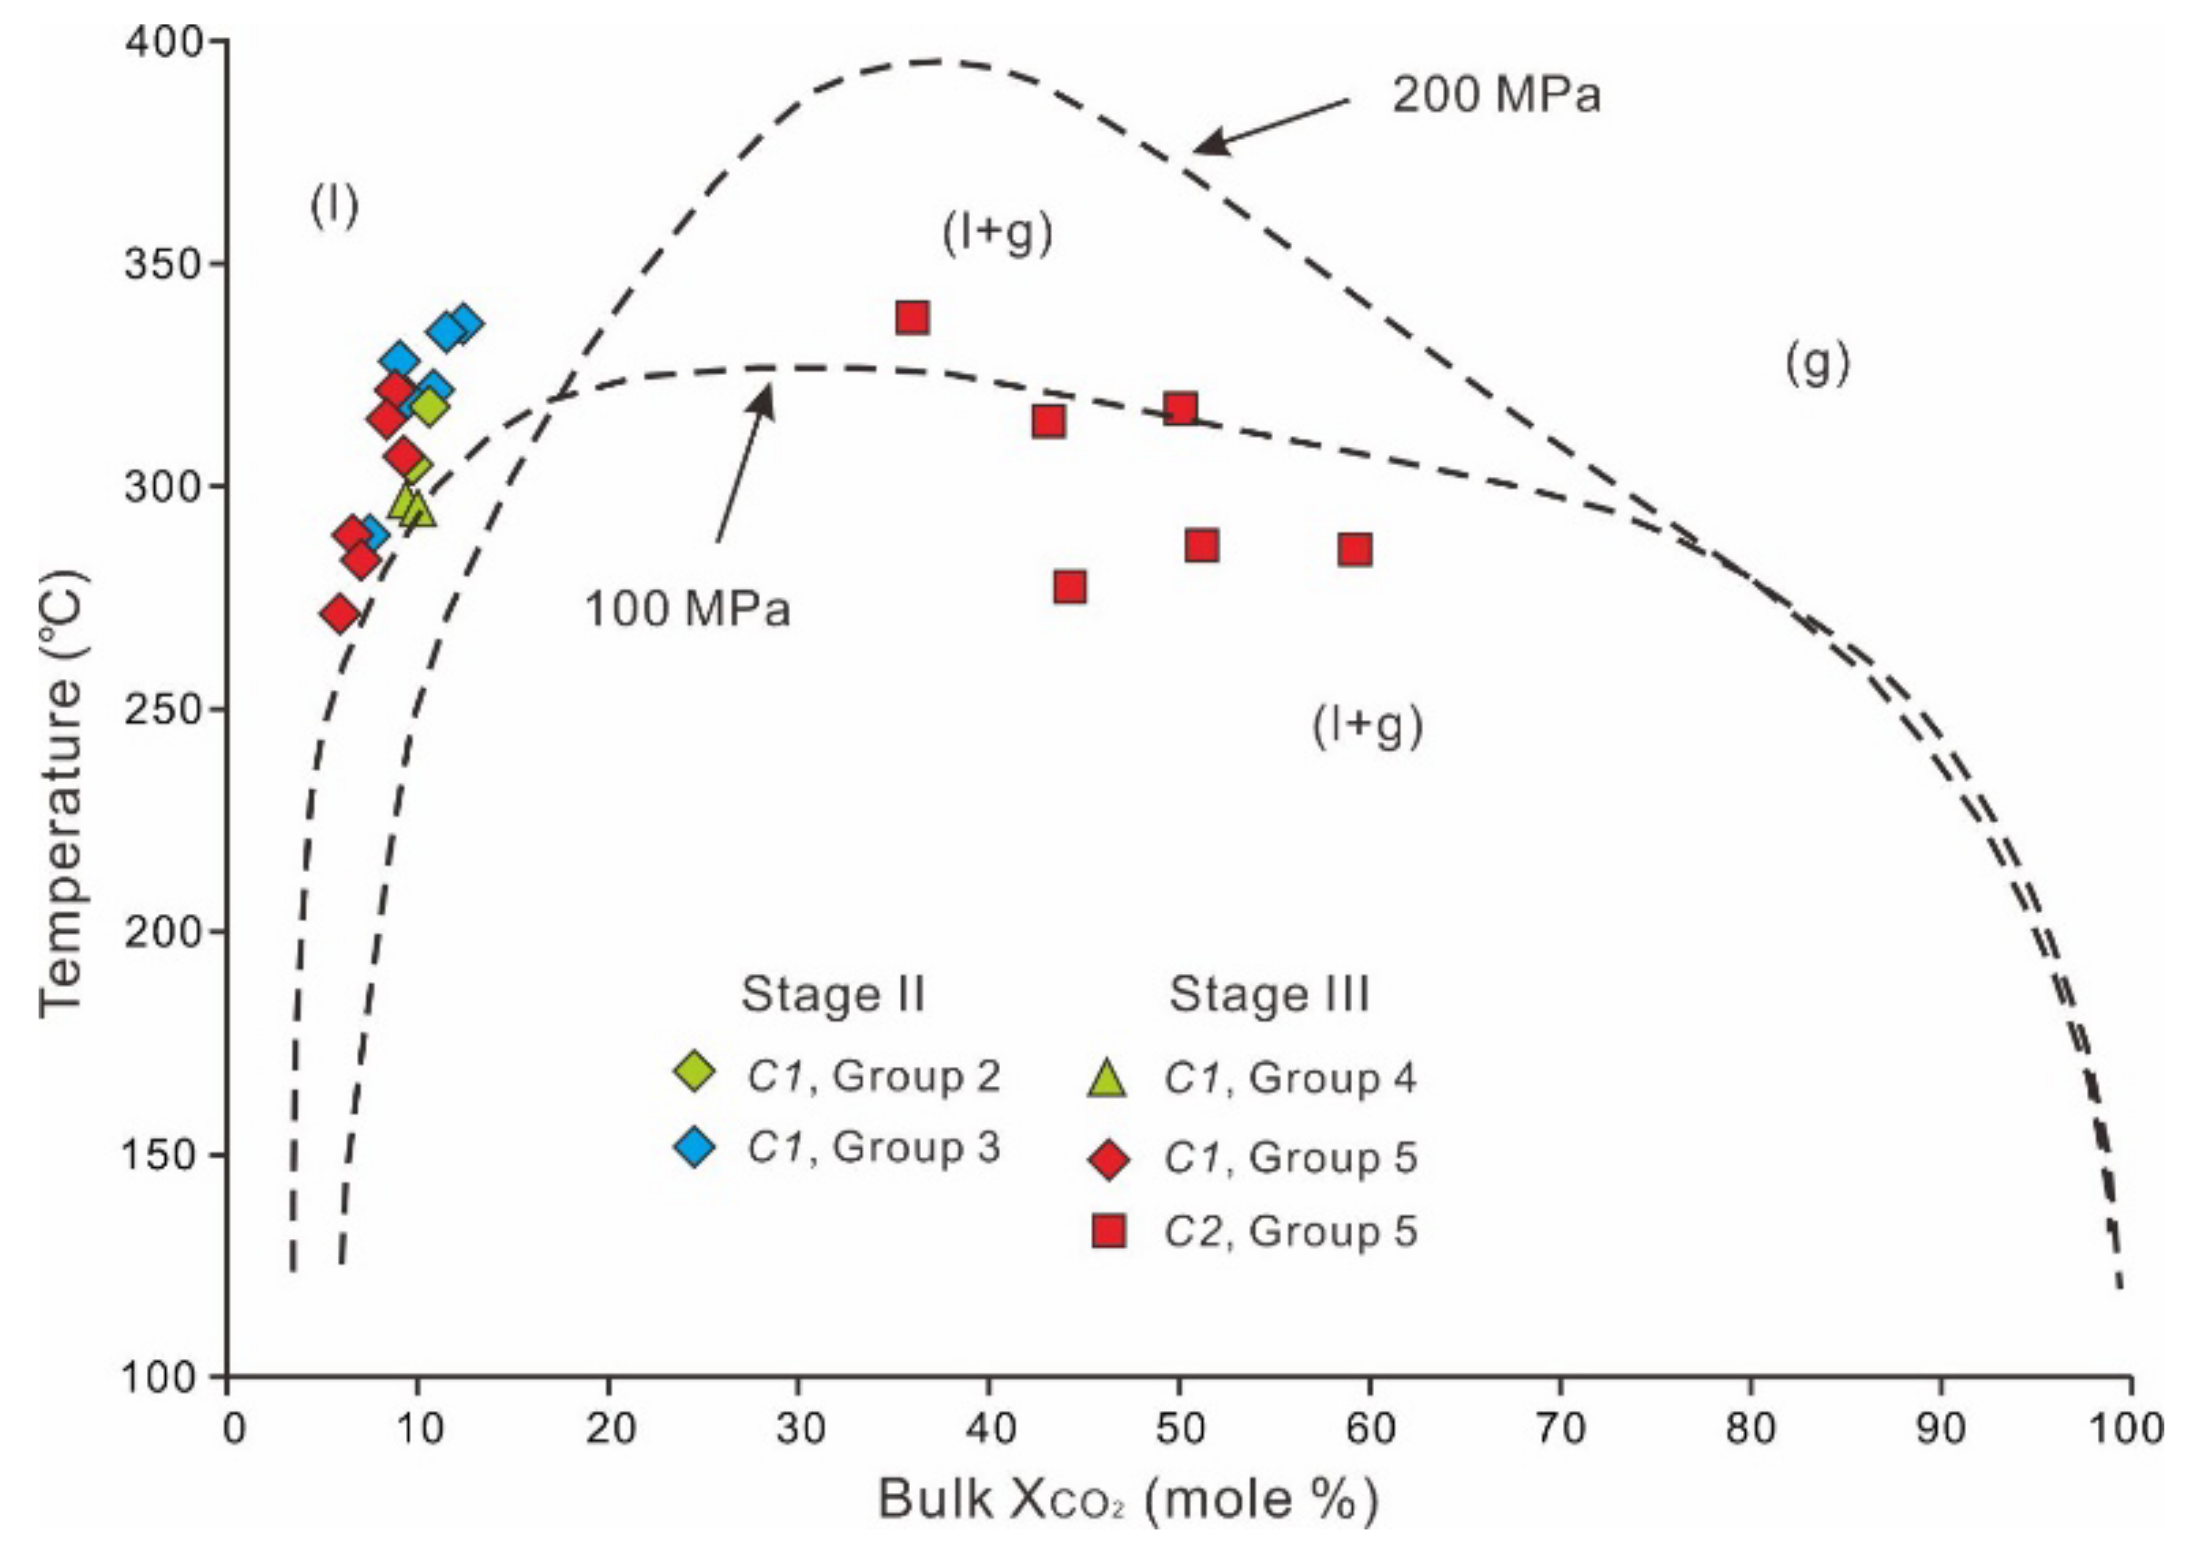
5.2. Fluid Immiscibility Processes

As mentioned above, both Group 3 FIAs in stage II and Group 5 FIAs in stage III consist of fluid inclusions with significantly different composition. The coexistence of the CH4-rich and CO2-rich inclusions (Group 3 FIA) and C1 and C2 inclusions with obviously different contents of CO2 (Group 5 FIA) can be explained by the following three processes [26]: (1) fluid immiscibility caused by phase separation of a homogeneous fluid; (2) fluid mixing caused by heterogeneous trapping of multi-source hydrothermal fluids; or (3) post-entrapment modification. In this study, undeformed hydrothermal quartz grains with euhedral to subhedral shape are preferentially selected for fluid inclusion analysis. The inclusions for microthermometry, moreover, have no evidence of necking down [27]. The post-entrapment modification process thus can be excluded in Sanakham.
Ramboz et al. [28] propose three lines of evidence which may indicate a fluid immiscibility process for the two contrasting types of inclusions: (i) the two types of inclusions must occur in the same regions and there must be good evidence of contemporaneous trapping; (ii) the two types of inclusions must have similar total homogenization temperature ranges, with one type of inclusion homogenizing to the aqueous phase, and the others homogenizing to the vapor phase; (iii) if one inclusion type decrepitates before homogenization, then the other type must behave similarly. With reference to the above principles, Group 5 FIA meets the criteria of fluid immiscibility, including (1) type C1 and C2 inclusions contemporaneously trapped in the same FIA (Figure 5k,l); (2) type C1 and C2 inclusions, respectively, homogenize to the aqueous phase (liquid) and CO2 vapor phase, and have a similar Th TOT (272–322 °C and 278–339 °C; Table 4); (3) some coexisting C1 and C2 inclusions generally have moderate V/(L + V) ratios, decrepitate before homogenization, and are not recorded in the data sheet. In addition, type C1 inclusions have slightly higher salinities (7.6–12.6 wt% NaCl eq.) than type C2 inclusions (6.8–10.6 wt% NaCl eq. Figure 7c), because salt is preferentially fractionated into the aqueous phase during phase separation [29]. It is inferred that the C1 and C2 inclusions in Group 5 FIA are two endmembers of unmixed fluids of a medium temperature, medium salinity, and CO2-rich parent fluid (Figure 9). Considering the widespread Group 5 FIA in stage III quartz, fluid immiscibility was a dominant process for stage III mineralization.
For Group 3 FIA in stage II quartz, the contemporaneously trapped type M and C1 inclusions also have similar homogenization temperature ranges (Figure 5i and Table 3), which are 288–355 °C and 290–337 °C, respectively. Except for the liquid phase, furthermore, type M and type C1 inclusions have entirely different compositions in their carbonic phase. According to the Raman results, CH4 contents in the carbonic phase of type M inclusions are ~80%, and the CO2 contents are ~20%. Meanwhile, the type C inclusions contain contrary amounts of CO2 and CH4 (Figure 6), which can also be proven by their distinctly different Tm carbon (Table 3). Thus, we cannot attribute the Group 3 FIA to a heterogeneous trapping of multi-source fluids led by fluid mixing [31], which prefers a continuum of compositions in diverse fluid inclusions. The type M and C1 inclusions are better suggested to be two endmembers of unmixed fluids that belong to a CH4-rich CH4–CO2–NaCl–H2O system. The fluid immiscibility process should also take part in stage II mineralization in Sanakham.

5.3. Implications for Gold Deposition

Given that the native gold in Sanakham is closely associated with sulfides such as pyrite, pyrrhotite, and chalcopyrite, the ore fluids are considered to be near-neutral to weakly acidic [32,33]. The ore-forming fluids are < 400 °C and enriched in CO2, indicating that the gold-transporting species were probably bisulfide complexes, mainly Au(HS)2− [34,35]. Gold deposition, led by the destabilization of gold–bisulfide complexes, was likely associated with fluid immiscibility, fluid mixing, and other chemical changes [36,37].
Taking into consideration the fluid immiscibility process in stages II and III, the Group 3 and 5 FIAs are reliable for estimating the P-T conditions of gold mineralization. The final homogenization temperatures of type C1 inclusions, respectively, in Group 3 FIA (290–337 °C) and Group 5 FIA (272–322 °C) are considered to be close to the temperature of entrapment [20]. The P-T phase diagram (Figure 10) shows a representative solvus for H2O–CO2 fluids containing 10 wt% NaCl eq. and 10 mol% CO2 (calculated after [30]), which is close to the composition of ore-forming fluids in stages II and III. The trapping pressures can be calculated from their isochores (0.825–0.925 g/cm3 for stage II and 0.886–0.974 g/cm3 for stage III) at the given homogenization temperatures. The estimated P-T conditions of gold mineralization in stages II and III ranged, respectively, from 134 to 65 MPa and 337 to 290 °C, and 236 to 75 Mpa and 322 to 272 °C (Figure 10). During fluid immiscibility caused by multiple hydraulic fracturing and pressure pulsation, gold deposition is believed to occur in conditions between lithostatic and hydrostatic pressure [38]. The highest and lowest pressures can be used to determine the depth considering that they are produced by the lithostatic and hydrostatic pressures, respectively. The densities of host quartz monzodiorite and ore-forming fluids are assumed, respectively, to be 2.7 g/cm3 and 1.0 g/cm3. Thus, for stage III, the calculated maximum and minimum depths are 8.7 km and 7.5 km, respectively. However, the highest pressure (134 MPa) in stage II indicates a depth of < 5.0 km, while the lowest pressure (65 MPa) indicates a depth of > 6.5 km. Taking the depth assumed from stage III into consideration, the depths for gold deposition in Sanakham are suggested to be 8.7–6.5 km. Fluid immiscibility in stage III occurred at relatively higher pressures than that in stage II, which might be attributed to a large release of CO2 and subsequent pressure increase in the fracture system.
Except for Group 3 and 5 FIAs, which show evidence for fluid immiscibility, the homogenization temperatures of other primary fluid inclusions could only be regarded as the minimum temperature of entrapment. Combined with the above discussion, thus, the evolution of ore-forming fluids and related gold-deposition processes can be summarized below (as shown in Figure 11). The primary ore-forming fluids in stage I belonged to a CH4-rich CH4–CO2–NaCl–H2O system (Group 1 FIA), which is characterized by medium–high temperature (>345 °C) and a high content of CH4 (~20–70% mol). The first fluid immiscibility process occurred in stage II and is represented by two coexisting endmembers (Group 3 FIA) including both those with high-CH4 and low-CO2 and the opposite. The ore fluids gradually evolved into a NaCl–H2O–CO2 ± CH4 fluid (Group 2 FIA) with medium temperature (~300 °C), medium salinity (9.1–10.1 wt% NaCl eq.), and a high content of CO2 (~10% mol) during stages II and III. The second fluid immiscibility process occurred widely in stage III and therefore created two new coexisting endmembers (Group 5 FIA), which are the CO2-poor (~7% mol) and relatively salinity-rich (7.6–12.6 wt% NaCl eq.) ones, as well as the opposite. Due to the volatile loss caused by fluid unmixing, the ore fluids finally evolved into a medium–low temperature (>239 °C), medium–high salinity (12.4–18.4 wt% NaCl eq.) NaCl–H2O system in stage IV (Group 6 FIA) accompanied by simply cooling. The two important gold-deposition events were generated, respectively, along with fluid immiscibility processes during stages II and III mineralization.
Compared with important gold deposits in the Luang Prabang–Loei metallogenic belt, the epithermal gold class can be excluded in Sanakham because there is neither continental volcanic rock exposure, nor characteristic kaolinite, alunite, or porous silicification. Even though quartz monzodiorite predominates in the wall rock, the hydrothermal metasomatic alteration, such as skarnization and horny alteration, has little spatial relation with gold mineralization, different from the regional representative porphyry-skarn copper–gold deposits [15,17]. Actually, the lode-gold orebodies in Sanakham are strictly controlled by the NE-NNE trending faults and crosscut the lithological interfaces between quartz monzodiorite and slate (Figure 2), which is similar to the Phapon epizonal orogenic gold deposit in the northern part of the Luang Prabang–Loei belt [13,14].
In most gold deposits, including porphyry and orogenic systems, the ore-forming fluids normally comprise remarkable contents of CO2 which are closely related to the fluid immiscibility system. Additionally, it is not uncommon for methane to be included in the ore fluids, e.g., gold deposits from Jiaodong [39,40,41,42,43,44,45], Ailaoshan [46], West Qinling [47,48], and Southwest Guizhou [49] in China, the Abitibi gold belt in Canada [50], and Hamadi gold deposit in Sudan [51], as well as some porphyry Cu-Mo and rare-metal deposits [52,53,54,55,56,57,58,59,60,61]. Based on high P-T experimental results, Naden et al. [62] pointed out that the CH4-bearing fluid system has a much wider immiscible area than the CO2-bearing fluid system under the same P-T conditions. At 300 °C for example, the immiscibility process could occur when CO2 content is higher than 15% mol, while the CH4 content only needs to be above 5% mol [63]. Thus, a small amount of CH4 in a NaCl–H2O–CO2 system could greatly expand the immiscibility area and result in gold deposition, which is identical to the stage II mineralization in Sanakham. However, the CH4-rich CH4–CO2–NaCl–H2O ore fluids cannot be simply interpreted as products of alternative magmatic, metamorphic, or mantle-derived fluids. It is generally assumed that the extremely high content of CH4 has an organic source, including partial decomposition of organic matter, or a reaction between water and graphite or organic carbon in the formations [64]. The Upper Carboniferous carbonaceous slate, therefore, might be a possible source of the abundant CH4, even though more refined studies on the source and evolution of ore-forming fluids are further needed.

6. Conclusions

The Sanakham gold deposit, located in the Luang Prabang–Loei metallogenic belt, predominately consists of auriferous quartz vein-type orebodies that are controlled by NE-NNE trending faults within Middle Triassic quartz monzodiorite and secondary Upper Carboniferous low-grade metamorphic rocks. Detailed study through petrography, microthermometry, and Laser Raman spectroscopy on fluid inclusions in gold-related quartz were carried out in the Sanakham gold deposit. The following conclusions are drawn from this study on the evolution of ore-forming fluids and gold deposition mechanisms in Sanakham:
(1)
Four mineralization stages have been distinguished in Sanakham, of which the quartz–pyrite–pyrrhotite-chalcopyrite stage (II) and the quartz–pyrite–base-metal sulfide stage (III) are identified as the main gold deposition stages.
(2)
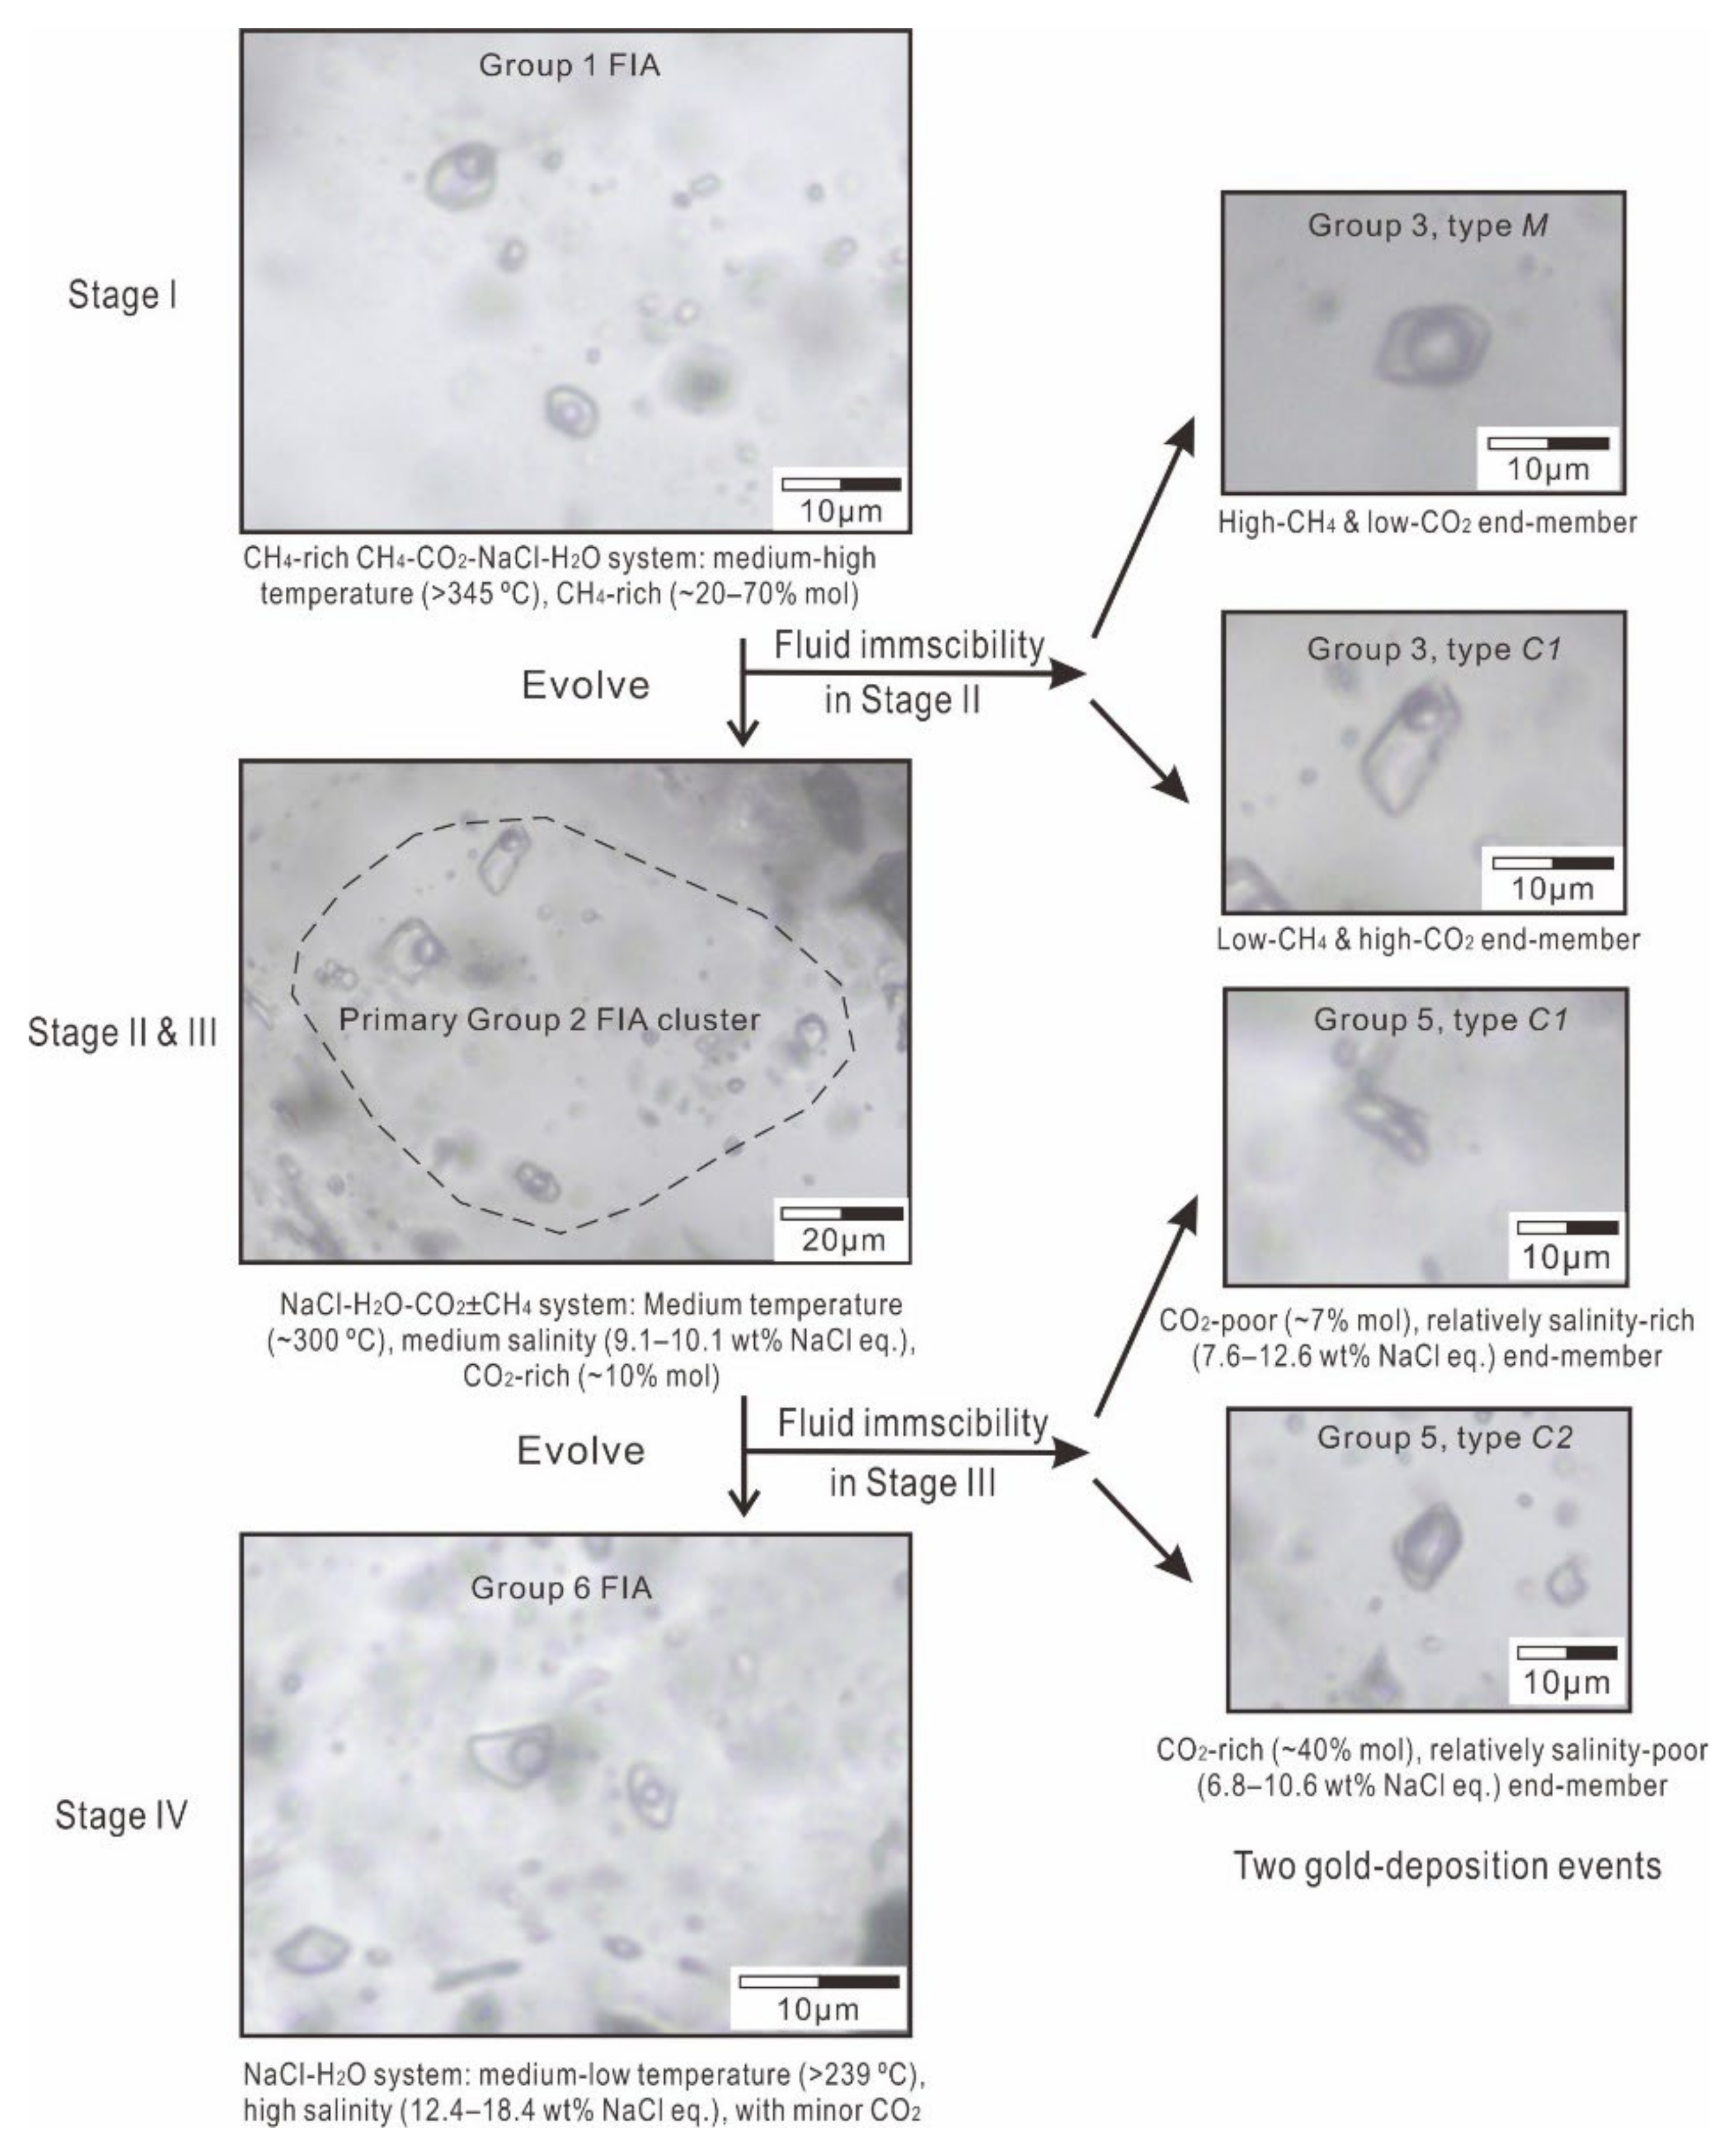
The initial ore-forming fluids belonged to a medium-high temperature CH4-rich CH4–CO2–NaCl–H2O system, which gradually evolved into a medium temperature, medium salinity, and high CO2 content NaCl–H2O–CO2 ± CH4 system during the main ore stages, and then a medium-low temperature, medium-high salinity NaCl–H2O system in stage IV.
(3)
Gold-deposition events were generated along with the two fluid immiscibility processes during stage II and III mineralization, respectively. The former created two coexisting high-CH4 and low-CO2 and low-CH4 and high-CO2 endmembers, while the latter created two coexisting CO2-poor and CO2-rich endmembers.
(4)
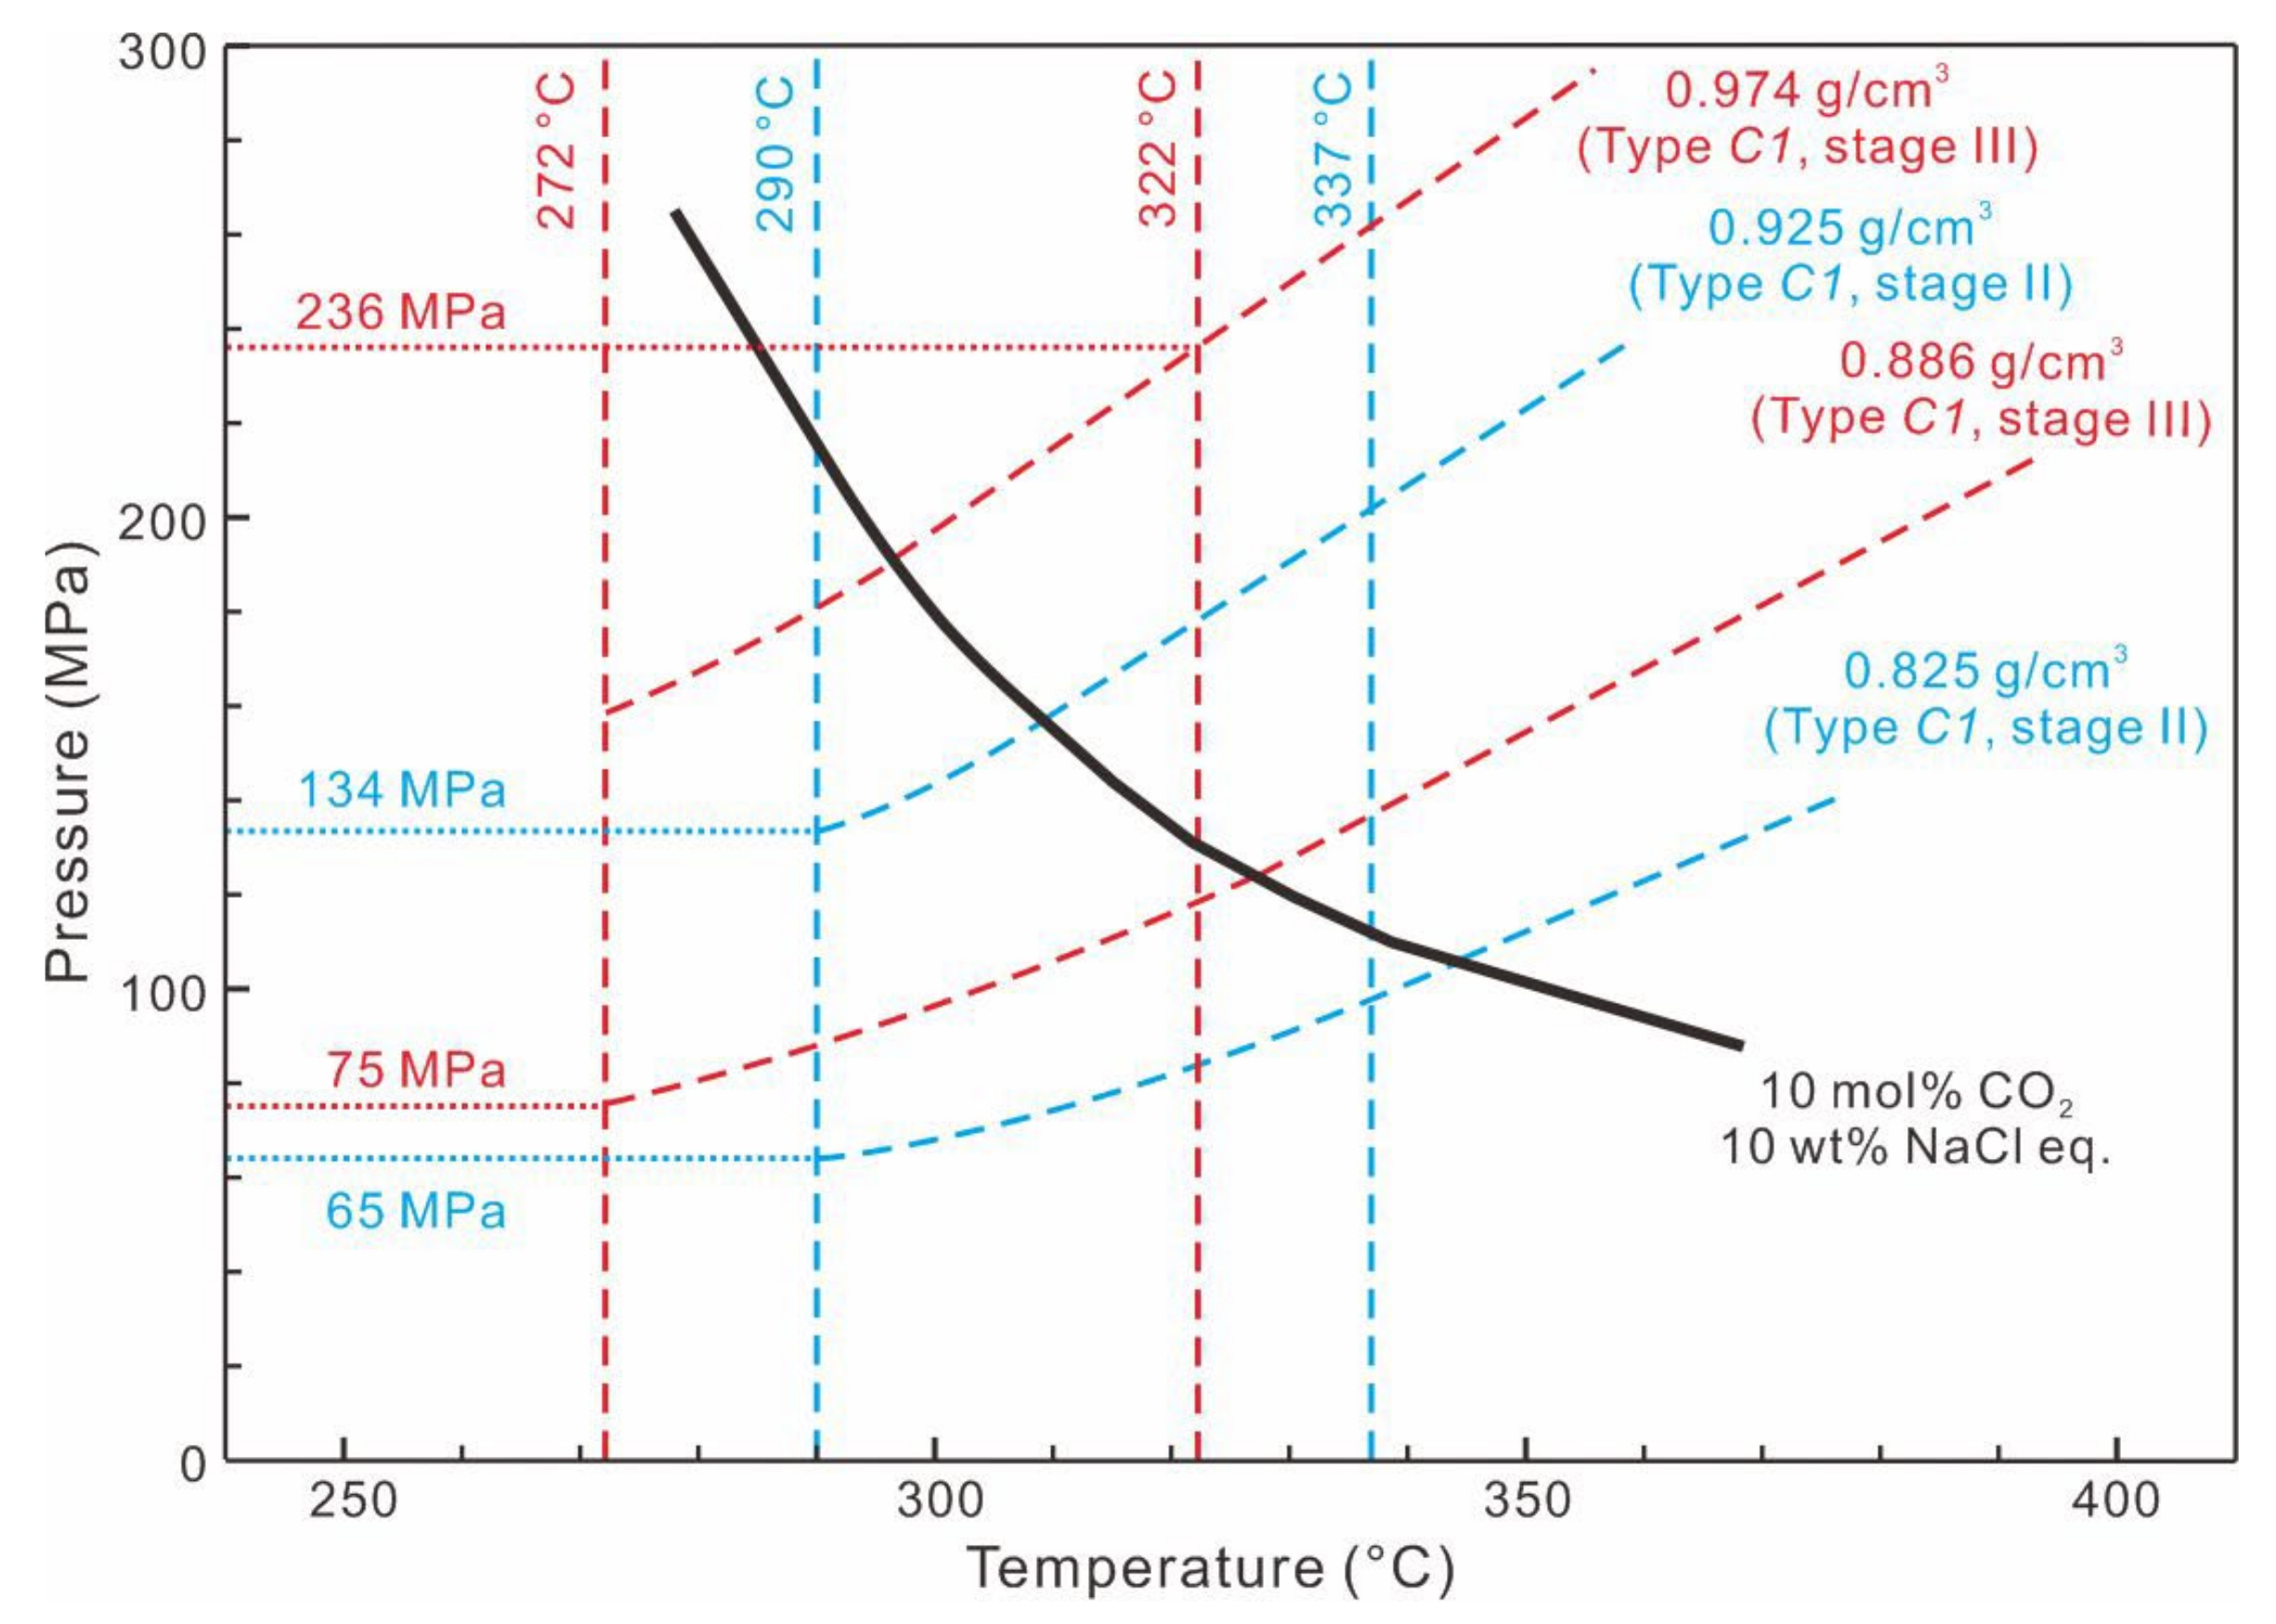
The presence of CH4 in ore-forming fluids promoted the fluid immiscibility and resulted in gold deposition at P–T conditions generally around 236 to 65 MPa and 337 to 272 °C, with estimated gold mineralization depths of 8.7–6.5 km.

Author Contributions

Conceptualization, S.L. and L.G.; data curation, S.L., S.X. and H.L.; formal analysis, L.G. and J.D.; funding acquisition, S.L., L.G. and L.H.; investigation, L.G., M.S., F.N. and X.C.; writing—original draft, S.L.; writing—review and editing, L.G. and J.D. All authors have read and agreed to the published version of the manuscript.

Funding

This research was funded by the National Natural Science Foundation of China, grant No. 42102113; the China Geological Survey Project, grant No. DD20201161 and DD2019444; and the Open Research Fund from the Key Laboratory of Deep Geodynamics, Ministry of Natural Resources, grant No. J1901.

Data Availability Statement

Not applicable.

Acknowledgments

We thank the geologists from the Guanghang Mining Development Co., Ltd. in Laos for their assistance with the field work in the Sanakham gold deposit.

Conflicts of Interest

The authors declare that they have no known competing financial interests or personal relationships that could have appeared to influence the work reported in this paper.

References

  1. Liu, S.S.; Yang, Y.F.; Guo, L.N.; Nie, F.; Peng, Z.M.; Pan, G.T. Tectonic characteristics and metallogeny in Southeast Asia. Geol. China 2018, 45, 863–889, (In Chinese with English abstract). [Google Scholar]
  2. Goldfarb, R.J.; Taylor, R.D.; Collins, G.S.; Goryachev, N.A.; Orlandini, O.F. Phanerozoic continental growth and gold metallogeny of Asia. Gondwana Res. 2014, 25, 48–102. [Google Scholar] [CrossRef]
  3. Khin, Z.; Meffre, S.; Lai, C.K.; Santosh, M.; Burrett, C.F.; Graham, I.T.; Manaka, T.; Salam, A.; Kamvong, T.; Cromie, P. Tectonics and metallogeny of mainland Southeast Asia–A review and contribution. Gondwana Res. 2014, 26, 5–30. [Google Scholar] [CrossRef]
  4. Wang, Y.J.; Yang, T.X.; Zhang, Y.Z.; Qian, X.; Gan, C.S.; Wang, Y.K.; Wang, Y.; Vongpaseuth, S. Late Paleozoic back-arc basin in the Indochina block: Constraints from the mafic rocks in the Nan and Luang Prabang tectonic zones, Southeast Asia. J. Asian Earth Sci. 2020, 195, 104333. [Google Scholar] [CrossRef]
  5. Shi, M.F.; Khin, Z.; Liu, S.S.; Xu, B.C.; Meffre, S.; Cong, F.; Nie, F.; Peng, Z.M.; Wu, Z.B. Geochronology and petrogenesis of Carboniferous and Triassic volcanic rocks in NW Laos: Implications for the tectonic evolution of the Loei Fold Belt. J. Asian Earth Sci. 2021, 208, 104661. [Google Scholar] [CrossRef]
  6. Qian, X.; Feng, Q.L.; Yang, W.Q.; Wang, Y.J.; Chonglakmani, C.; Monjai, D. Arc-like volcanic rocks in NW Laos: Geochronological and geochemical constraints and their tectonic implications. J. Asian Earth Sci. 2015, 98, 342–357. [Google Scholar] [CrossRef]
  7. Qian, X.; Feng, Q.L.; Wang, Y.J.; Chonglakmani, C.; Monjai, D. Geochronological and geochemical constraints on the mafic rocks along the Luang Prabang zone: Carboniferous back-arc setting in northwest Laos. Lithos 2016, 245, 60–75. [Google Scholar] [CrossRef]
  8. Rossignol, C.; Bourquin, S.; Poujol, M.; Hallot, E.; Dabard, M.-P.; Nalpas, T. The volcaniclastic series from the Luang Prabang Basin, Laos: A witness of a Triassic magmatic arc? J. Asian Earth Sci. 2016, 12, 159–183. [Google Scholar] [CrossRef] [Green Version]
  9. Shi, M.F.; Wu, Z.B.; Liu, S.S.; Peng, Z.M.; Guo, L.N.; Nie, F.; Xu, S.W. Geochronology and petrochemistry of volcanic rocks in the Xaignabouli area, NW Laos. J. Earth Sci. 2019, 30, 37–51. [Google Scholar] [CrossRef]
  10. Guo, L.N.; Hou, L.; Nie, F.; Liu, S.S.; Xu, S.W.; Zhang, Q.M. Zircon U-Pb dating of quartz-diorite from Luang Prabang tectonic belt in Laos: Implication for eastward subduction of the Paleo-Tethys Ocean. Sediment. Geol. and Tethyan Geol. 2020, 40, 68–75, (In Chinese with English abstract). [Google Scholar]
  11. Blanchard, S.; Rossignol, C.; Bourquin, S.; Dabard, M.P.; Hallot, E.; Nalpas, T.; Poujol, M.; Battail, B.; Jalil, N.E.; Steyer, J.S.; et al. Late Triassic volcanic activity in South-East Asia: New stratigraphical, geochronological and paleontological evidence from the Luang Prabang Basin (Laos). J. Asian Earth Sci. 2013, 70–71, 8–26. [Google Scholar] [CrossRef]
  12. Qian, X.; Feng, Q.L.; Wang, Y.J.; Yang, W.Q.; Chonglakmani, C.; Monjai, D. Petrochemistry and Tectonic Setting of the Middle Triassic Arc-Like Volcanic Rocks in the Sayabouli Area, NW Laos. J. Earth Sci. 2016, 27, 365–377. [Google Scholar] [CrossRef]
  13. Liu, S.S. Study on the Tectonics-Magmatic-Mineralization of the Luang Prabang-Loei Copper-Gold Metallogenic Belt. Ph.D. Thesis, Chengdu Univerisity of Technology, Chengdu, China, 2021. [Google Scholar]
  14. Kamvong, T.; Khin, Z. The origin and evolution of skarn-forming fluids from the Phu Lon deposit, northern Loei Fold Belt, Thailand. Evidence from fluid inclusion and sulfur isotope studies. J. Asian Earth Sci. 2009, 34, 624–633. [Google Scholar] [CrossRef]
  15. Nie, F.; Liu, S.S.; Yang, Y.F.; Peng, Z.M.; Guo, L.N. Zircon U-Pb dating of the diorite of Phu Lon skarn Cu-Au deposit in Thailand and its significance. Sediment. Geol. Tethyan Geol. 2019, 39, 71–78, (In Chinese with English abstract). [Google Scholar]
  16. Salam, A.; Khin, Z.; Meffre, S.; McPhie, J.; Lai, C.K. Geochemistry and geochronology of epithermal Au-hosted Chatree volcanic sequence: Implication for tectonic setting of the Loei Fold Belt in central Thailand. Gondwana Res. 2014, 26, 198–217. [Google Scholar] [CrossRef]
  17. Guo, L.N.; Hou, L.; Liu, S.S.; Nie, F. REE geochemistry and C-O isotope characteristics of hydrothermal calcites: Implications for fluid–rock reaction and ore-forming processes in the Phapon gold deposit, NW Laos. Minerals 2018, 8, 438. [Google Scholar] [CrossRef] [Green Version]
  18. Guo, L.N.; Liu, S.S.; Hou, L.; Wang, J.T.; Zhang, Q.M.; Shi, M.F.; Nie, F.; Yang, Y.F.; Peng, Z.M. Fluid inclusion and C-H-O isotopes geochemistry of the Phapon gold deposit, NW Laos: Implications for fluid source and ore genesis. J. Earth Sci. 2019, 30, 80–94. [Google Scholar] [CrossRef]
  19. Zhao, Y.P.; Kang, T.S.; Ning, G.C.; Ge, H.; Pan, H. Geochemical characteristics of the volcanic intrusive complex in the Pangkuam copper-gold deposit of Laos and its geological significance. Acta Petrol. Et Mineral. 2017, 36, 281–294, (In Chinese with English abstract). [Google Scholar]
  20. Goldstein, R.H.; Reynolds, T.J. Systematics of Fluid Inclusions in Diagenetic Minerals; SEPM Short Course 31; SEPM Society for Sedimentary Geology: Tulsa, OK, USA, 1994; Volume 31, pp. 1–199. [Google Scholar]
  21. Chi, G.X.; Diamond, L.W.; Lu, H.Z.; Lai, J.Q.; Chu, H.X. Common problems and pitfalls in fluid inclusion study: A review and discussion. Minerals 2021, 11, 7. [Google Scholar] [CrossRef]
  22. Bakker, R.J. Package Fluids 1. Computer programs for analysis of fluid inclusion data and for modelling bulk fluid properties. Chem. Geol. 2003, 194, 3–23. [Google Scholar] [CrossRef]
  23. Brown, P.E.; Hagemann, S.G. MacFlincor and its application to fluids in Archaean lode-gold deposits. Geochim. Cosmochim. Acta 1995, 59, 3943–3952. [Google Scholar] [CrossRef]
  24. Thiéry, R.; Vidal, J.; Dubessy, J. Phase equilibria modelling applied to fluid inclusions: Liquid-vapour equilibria and calculation of the molar volume in the CO2-CH4-N2 system. Geochim. Cosmochim. Acta 1994, 58, 1073–1082. [Google Scholar] [CrossRef]
  25. Darling, R.S. An extended equation to calculate NaCl contents from final clathrate melting temperatures in H2O-CO2-NaCl fluid inclusions: Implications for P-T isochore location. Geochim. Cosmochim. Acta 1991, 55, 3869–3871. [Google Scholar] [CrossRef]
  26. Pichavant, M.; Ramboz, C.; Weisbrod, A. Fluid immiscibility in natural processes: Use and misuse: I. Phase equilibria analysis–a theoretical and geometrical approach. Chem. Geol. 1982, 37, 29–48. [Google Scholar]
  27. Bakker, R.J.; Jansen, J.B.H. A mechanism for preferential H2O leakage from fluid inclusions in quartz, based on TEM observations. Contrib. Mineral. Petrol. 1994, 116, 7–20. [Google Scholar] [CrossRef]
  28. Ramboz, C.; Pichavant, M.; Weisbrod, A. Fluid immiscibility in natural processes: Use and misuse of fluid inclusion data, II. Interpretation of fluid inclusion data in terms of immiscibility. Chem. Geol. 1982, 37, 29–48. [Google Scholar] [CrossRef]
  29. Lawrence, D.M.; Treloar, P.J.; Rankin, A.H.; Boyce, A.; Harbidge, P. A fluid inclusion and stable isotope study at the Loulo mining district, Mali, West Africa: Implications for multifluid sources in the generation of orogenic gold deposits. Econ. Geol. 2013, 180, 229–257. [Google Scholar] [CrossRef]
  30. Bowers, T.S.; Helgeson, H.C. Calculation of thermodynamic and geochemical consequences of nonideal mixing in the system H2O–CO2–NaCl on phase relations in geologic systems: Equation of state for H2O–CO2–NaCl fluids at high pressures and temperatures. Geochim. Cosmochim. Acta 1983, 47, 1247–1275. [Google Scholar] [CrossRef]
  31. Anderson, M.R.; Rankin, A.H.; Spiro, B. Fluid mixing in the generation of mesothermal gold mineralization in the Transvaal Sequence, Transvaal, South Africa. Eur. J. Mineral. 1992, 4, 933–948. [Google Scholar] [CrossRef]
  32. Williams-Jones, A.E.; Bowell, R.J.; Migdisov, A.A. Gold in solution. Elements 2009, 5, 281–287. [Google Scholar] [CrossRef]
  33. Guo, L.N.; Goldfarb, R.J.; Wang, Z.L.; Li, R.H.; Chen, B.H.; Li, J.L. A comparison of Jiaojia- and Linglong-type gold deposit ore-forming fluids: Do they differ? Ore Geol. Rev. 2017, 88, 511–533. [Google Scholar] [CrossRef]
  34. Benning, L.G.; Seward, T.M. Hydrosulphide complexing of gold (I) in hydrothermal solutions from 150 to 500°C and 500 to 1500 bars. Geochim. Cosmochim. Acta 1996, 60, 1849–1871. [Google Scholar] [CrossRef]
  35. Phillips, G.N.; Evans, K.A. Role of CO2 in the formation of gold deposits. Nature 2004, 429, 860–863. [Google Scholar] [CrossRef] [PubMed]
  36. Mikucki, E.J. Hydrothermal transport and depositional processes in Archean lode-gold systems: A review. Ore Geol. Rev. 1998, 13, 307–321. [Google Scholar] [CrossRef]
  37. Pokrovski, G.S.; Tagirov, B.R.; Schott, J.; Hazemann, J.L.; Proux, O. A new view on gold speciation in sulfur-bearing hydrothermal fluids from in situ X-ray absorption spectroscopy and quantum-chemical modeling. Geochim. Cosmochim. Acta 2009, 73, 5406–5427. [Google Scholar] [CrossRef] [Green Version]
  38. Weatherley, D.K.; Henley, R.W. Flash vaporization during earthquakes evidenced by gold deposits. Nat. Geosci. 2013, 6, 294–298. [Google Scholar] [CrossRef]
  39. Fan, H.R.; Zhai, M.G.; Xie, Y.H.; Yang, J.H. Ore-forming fluids associated with granite-hosted gold mineralization at the Sanshandao deposit, Jiaodong gold province, China. Mineral. Depos. 2003, 38, 739–750. [Google Scholar] [CrossRef]
  40. Deng, J.; Yang, L.Q.; Groves, D.I.; Zhang, L.; Qiu, K.F.; Wang, Q.F. An integrated mineral system model for the gold deposits of the giant Jiaodong province, eastern China. Earth-Sci. Rev. 2020, 208, 103274. [Google Scholar] [CrossRef]
  41. Deng, J.; Qiu, K.F.; Wang, Q.F.; Goldfarb, R.J.; Yang, L.Q.; Zi, J.W.; Geng, J.Z.; Ma, Y. In-situ dating of hydrothermal monazite and implications on the geodynamic controls of ore formation in the Jiaodong gold province, Eastern China. Econ. Geol. 2020, 115, 671–685. [Google Scholar] [CrossRef]
  42. Goldfarb, R.J.; Mao, J.W.; Qiu, K.F.; Goryachev, N. The great Yanshanian metallogenic event of eastern Asia: Consequences from one hundred million years of plate margin geodynamics. Gondwana Res. 2021, 100, 223–250. [Google Scholar] [CrossRef]
  43. Qiu, K.F.; Goldfarb, R.J.; Deng, J.; Yu, H.C.; Gou, Z.Y.; Ding, Z.J.; Wang, Z.K.; Li, D.P. Gold deposits of the Jiaodong Peninsula, eastern China. SEG Spec. Publ. 2020, 23, 753–773. [Google Scholar]
  44. Guo, L.N.; Deng, J.; Yang, L.Q.; Wang, Z.L.; Wang, S.R.; Wei, Y.J.; Chen, B.H. Gold deposition and resource potential of the Linglong gold deposit, Jiaodong Peninsula: Geochemical comparison of ore fluids. Ore Geol. Rev. 2020, 120, 103434. [Google Scholar] [CrossRef]
  45. Song, M.C.; Xue, G.Q.; Liu, H.B.; Li, Y.X.; He, C.Y.; Wang, H.J.; Wang, B.; Song, Y.X.; Li, S.Y. A Geological-Geophysical Prospecting Model for Deep-Seated Gold Deposits in the Jiaodong Peninsula, China. Minerals 2021, 11, 1393. [Google Scholar] [CrossRef]
  46. Li, Y.; Wang, D.; Wang, C.; Sun, Y.; Pu-chi, M. Geology and Geochemistry of Selected Gold Deposits in the Ailaoshan Metallogenic Belt, China: Origin of Ore-Forming Fluids. Minerals 2021, 11, 1276. [Google Scholar] [CrossRef]
  47. Qiu, K.F.; Yu, H.C.; Deng, J.; McIntire, D.; Gou, Z.Y.; Geng, J.Z.; Chang, Z.S.; Zhu, R.; Li, K.N.; Goldfarb, R.J. The giant Zaozigou orogenic Au-Sb deposit in West Qinling, China: Magmatic or metamorphic origin? Miner. Depos. 2020, 55, 345–362. [Google Scholar] [CrossRef]
  48. Yang, L.Q.; Deng, J.; Dilek, Y.; Qiu, K.F.; Ji, X.Z.; Li, N.; Taylor, R.D.; Yu, J.Y. Structure, geochronology, and petrogenesis of the Late Triassic Puziba granitoid dikes in the Mianlue suture zone, Qinling Orogen, China. Geol. Soc. Am. Bull. 2015, 11/12, 1831–1854. [Google Scholar] [CrossRef]
  49. Peng, Y.W.; Gu, X.X.; Liu, L.; Cheng, W.B.; Zhang, Y.M.; Wu, C.Y.; Lv, P.R. Fluid inclusion characteristics and implications to mineralization in the Zimudang gold deposit in Southwest Guizhou Province, China. Acta Mineral. Sin. 2012, 32, 211–220, (In Chinese with English abstract). [Google Scholar]
  50. Robert, F.; Kelly, W.C. Ore-forming fluids in Archean gold-bearing quartz veins at the Sigma Mine, Abitibi greenstone belt, Quebec, Canada. Econ. Geol. 1987, 82, 1464–1482. [Google Scholar] [CrossRef]
  51. Xu, J.H.; Wang, J.X.; Xiang, P.; Li, Y.H.; Xiao, X.; Zhang, H.; Cheng, X.H. Extremely CO2-rich fluid inclusions in an orogenic gold deposit: Hamadi gold deposit of Sudan. Acta Petrol. Sin. 2015, 31, 1040–1048, (In Chinese with English abstract). [Google Scholar]
  52. He, D.Y.; Qiu, K.F.; Santosh, M.; Yu, H.C.; Long, Z.Y.; Wang, J.Y. Inhomogeneous crust-mantle interaction and Triassic tectonic escape of a Proterozoic microplate: A tale of the Bikou Terrane. Lithos 2021, 396–397, 106227. [Google Scholar] [CrossRef]
  53. Qiu, K.F.; Deng, J.; Yu, H.C.; Wu, M.Q.; Wang, Y.; Zhang, L.; Goldfarb, R. Identifying hydrothermal quartz vein generations in the Taiyangshan porphyry Cu-Mo deposit (West Qinling, China) using cathodoluminescence, trace element geochemistry, and fluid inclusions. Ore Geol. Rev. 2021, 128, 103882. [Google Scholar] [CrossRef]
  54. Qiu, K.F.; Taylor, R.D.; Song, Y.H.; Yu, H.C.; Song, K.R.; Li, N. Geologic and geochemical insights into the formation of the Taiyangshan porphyry copper–molybdenum deposit, Western Qinling Orogenic Belt, China. Gondwana Res. 2016, 35, 40–58. [Google Scholar] [CrossRef]
  55. Wang, Y.; Qiu, K.F.; Müller, A.; Hou, Z.L.; Zhu, Z.H.; Yu, H.C. Machine Learning Prediction of Quartz Forming-Environments. J. Geophys. Resour. Solid Earth 2021, 126, e2021jb021925. [Google Scholar] [CrossRef]
  56. Qiu, K.F.; Yu, H.C.; Hetherington, C.; Huang, Y.Q.; Yang, T.; Deng, J. Tourmaline composition and boron isotope signature as a tracer of magmatic-hydrothermal processes. Am. Miner. 2021, 106, 1033–1044. [Google Scholar] [CrossRef]
  57. Qiu, K.F.; Yu, H.C.; Wu, M.Q.; Geng, J.Z.; Ge, X.K.; Gou, Z.Y.; Taylor, R.D. Discrete Zr and REE mineralization of the Baerzhe rare-metal deposit, China. Am. Miner. 2019, 104, 1487–1502. [Google Scholar] [CrossRef]
  58. Wu, M.Q.; Samson, I.M.; Qiu, K.F.; Zhang, D.H. Concentration mechanisms of REE-Nb-Zr-Be mineralization in the Baerzhe deposit, NE China: Insights from textural and chemical features of amphibole and rare-metal minerals. Econ. Geol. 2021, 116, 651–679. [Google Scholar] [CrossRef]
  59. Yu, H.C.; Qiu, K.F.; Hetherington, C.J.; Chew, D.; Huang, Y.Q.; He, D.Y.; Geng, J.Z.; Xian, H.Y. Apatite as an alternative petrochronometer to trace the evolution of magmatic systems containing metamict zircon. Contrib. Mineral. Petrol. 2021, 176, 68. [Google Scholar] [CrossRef]
  60. Yu, H.C.; Qiu, K.F.; Pirajno, F.; Zhang, P.C.; Dong, W.Q. Revisiting Phanerozoic evolution of the Qinling Orogen (East Tethys) with perspectives of detrital zircon. Gondwana Res. 2021. accepted. [Google Scholar] [CrossRef]
  61. Zhang, L.; Qiu, K.F.; Hou, Z.L.; Pirajno, F.; Shivute, E.; Cai, Y.W. Fluid-rock reactions of the Triassic Taiyangshan porphyry Cu-Mo deposit (West Qinling, China) constrained by QEMSCAN and iron isotope. Ore Geol. Revi. 2021, 132, 104068. [Google Scholar] [CrossRef]
  62. Naden, J.; Shepherd, T.J. Role of methane and carbon dioxide in gold depositions. Nature 1989, 342, 793–795. [Google Scholar] [CrossRef]
  63. Van den Kerkhof, A.M.; Thiéry, R. Carbonic inclusions. Lithos 2001, 55, 49–68. [Google Scholar] [CrossRef]
  64. Jiang, N.; Wang, Y.L. The role of CH4 in gold mineralization. Global Geol. 1995, 14, 29–32. (In Chinese) [Google Scholar]
Figure 1. Regional geological map. (a) Simplified tectonic map showing structural units of Laos andadjacent regions; (b) simplified geological map of the Luang Prabang–Loei metallogenic belt (geochronological data from [4,5,6,7,8,9,10,11,12,13,14,15,16], modified from [5,10]). A = andesite; B = basalt; Br = breccia; D = dacite; Db = diabase; Dr = diorite; G = gabbro; Gd = Granodiorite; M = monzonite; R = rhyolite; T = tuff.
Minerals 12 00259 g001
Figure 2. Simplified geological map of the Sanakham gold deposit and geological cross-sections along line AA’.
Minerals 12 00259 g002
Figure 3. Typical alteration and mineralization in the Sanakham gold deposit (di are reflected light images). (a), Milky quartz–pyrite vein in quartz monzodiorite; (b), quartz–sulfide vein in quartz monzodiorite; (c), banded sulfide assemblages; (d), quartz—calcite vein crosscut quartz—sulfide vein; (e), coexistence of sulfides and quartz in hand sample; (f), sulfides occurred as massive aggregates; (g,h), stage I euhedral to subhedral coarse-grained pyrite and stage II subhedral to anhedral fine-grained pyrite and pyrrhotite; (i), stage II pyrite and pyrrhotite occurred around stage I arsenopyrite; (j,k), native gold coexisting with pyrrhotite or chalcopyrite that fills in fractures of pyrite; (l), sulfide aggregations in stage III. Apy, arsenopyrite; Au, native gold; Ccp, chalcopyrite; Gn, galena; Po, pyrrhotite; Py, pyrite.
Minerals 12 00259 g003
Figure 4. Paragenetic sequence of hydrothermal minerals in the Sanakham gold deposit, with line thickness indicating the relative abundance of minerals.
Minerals 12 00259 g004
Figure 5. Photomicrographs of typical fluid inclusions and FIA groups in the Sanakham gold deposit. (a) Typical type M CH4-rich fluid inclusion consisting of H2O liquid and carbonic vapor (CH4 + CO2 ± C2H6 ± H2S) phases at room temperature; (b) type M FI consisting of three (H2O liquid + carbonic liquid + carbonic vapor) phases at about −20°C; (c) type M CH4-rich fluid inclusion with daughter mineral (chalcopyrite); (d) type C1 liquid-rich CO2 inclusion; (e) type C2 vapor-rich CO2 inclusion; (f) type W two-phase H2O-NaCl inclusion; (g) primary cluster of Group 1 FIA in stage I quartz; (h) primary cluster of Group 2 FIA in stage II quartz; (i) group 3 FIA in stage II quartz consisting of type M and C1 inclusions with various volumes of the carbonic phases; (j) Group 4 FIA occurred as cluster, pseudo-secondary trail, and isolated type C1 inclusions in stage III quartz; (k) primary cluster of Group 5 FIA consisting of type C1 and C2 inclusions showing opposite modes of homogenization at approximately the same temperature; (l) pseudo-secondary Group 5 FIA trail in stage III quartz; (m) pPseudo-secondary Group 6 FIA trails containing type W fluid inclusions in stage IV quartz.
Minerals 12 00259 g005
Figure 6. Ranges of Th TOT (a), Tm carbon (b), salinity (c), bulk density (d), bulk XCO2 + XCH4 (e), and carbonic XCH4 (f) versus Groups 1–6 FIA in the four stages, respectively. The points in the middle of the bars are the mean value.
Minerals 12 00259 g006
Figure 7. Laser Raman spectra of vapor bubbles (red color), aqueous (green color), or daughter minerals (in the d figure) of fluid inclusions in the Sanakham gold deposit. (a), Type C1 inclusion; (bd), type M inclusion.4.4. Composition and Density of Fluid Inclusions.
Minerals 12 00259 g007
Figure 8. Homogenization temperature (Th TOT) versus salinity (wt% NaCl eq.) diagram showing the evolution of the ore-forming fluids for different groups of FIA from stages II and III quartz in the Sanakham gold deposit. The horizontal and vertical bars are the ranges of Th TOT and salinity of every single FIA.
Minerals 12 00259 g008
Figure 9. Homogenization temperature (Th TOT) versus calculated equivalent mole fraction CO2 of type C1 and C2 inclusions in stages II and III. The dashed curves delimit the two-phase regions of the H2O–CO2–NaCl system at 100 and 200 MPa, respectively. Data after Bowers and Helgeson (1983) [30]. g, gas; l, liquid.
Minerals 12 00259 g009
Figure 10. Estimated P-T conditions for the formation of the quartz veins in stages II and III in the Sanakham deposit. Representative isochores for mean bulk densities, respectively, for type C1 inclusions, and the solvus for H2O–CO2 fluids containing 10 wt% NaCl eq. and 10 mol% CO2 (calculated after reference [30]). The blue and red dashed lines define the range of Th TOT and bulk density of type C1 inclusions in Groups 3 and 5 FIA, respectively. The dotted lines represent the range of trapping pressures.
Minerals 12 00259 g010
Figure 11. Evolution of ore-forming fluids and related gold-deposition processes in the Sanakham gold deposit.
Minerals 12 00259 g011
Table 1. Summary of the fluid inclusion and FIA groups in hydrothermal quartz from four mineralization stages.
Ore StageFIA GroupFluid Inclusion TypeFrequency of Occurrences Implication For Ore Fluids Processes
Stage IGroup 1MAbundantHomogeneous fluid
Stage IIGroup 2C1LocalHomogeneous fluid
Group 3M + C1AbundantFluid immiscibility
Stage IIIGroup 4C1LocalHomogeneous fluid
Group 5C1 + C2AbundantFluid immiscibility
Stage IVGroup 6WAbundantHomogeneous fluid
Publisher’s Note: MDPI stays neutral with regard to jurisdictional claims in published maps and institutional affiliations.

