
Kinetic Analysis of Recovering Zinc from Electric Arc Furnace Dust by Vacuum Carbothermic Reduction at 20 Pa


1
School of Metallurgical Engineering, Xi’an University of Architecture and Technology, Xi’an 710055, China
2
Research Center of Metallurgical Engineering & Technology of Shaanxi Province, Xi’an 710055, China
*
Authors to whom correspondence should be addressed.
Minerals 2022, 12(2), 261; https://0-doi-org.brum.beds.ac.uk/10.3390/min12020261
Submission received: 17 January 2022
/
Revised: 7 February 2022
/
Accepted: 16 February 2022
/
Published: 18 February 2022
(This article belongs to the Topic Recycling and Value-Added Utilization of Secondary Raw Materials)
Abstract
:Electric arc furnace dust (EAFD) presents a contamination hazard due to its heavy metal leachability. The traditional disposal methods of landfill or stacking not only pose a threat to the environment but also waste metal resources. This paper adopted vacuum carbothermic reduction to dispose of EAFD and the zinc metal could be obtained as a product. The reduction ratios of the EAFD were carried out under various reaction temperatures and times at 20 Pa. Furthermore, the kinetics of the reduction process was also studied. The reduction ratio of the reaction process can be facilitated through increasing the temperature or lengthening the time and can reach up to 99.6% under the condition of 1373 K with 60 min. The zinc ferrite and zinc oxide were reduced first and then iron oxide reduction occurred. The reduction process could be divided into three stages: Stage 1 involved the direct reduction of zinc ferrite and zinc oxide, and the control step was the phase boundary reaction with the apparent activation energy of 48.54 kJ/mol; Stage 2 involved the reduction of zinc oxide and iron oxide, and the control step was also the phase boundary reaction with the apparent activation energy of 56.27 kJ/mol; Stage 3 involved the escape of gas phase products and the control step was diffusion with the apparent activation energy of 105.3 kJ/mol.
1. Introduction
Electric arc furnace dust (EAFD) is typical zinc-containing dust. It is generated during the melting of scrap in an electric arc furnace and collected by bag filters or electrostatic precipitators. The yield of EAFD is 10–20 kg per ton raw steel production [1,2]. Due to this, a great deal of heavy metal elements, such as zinc, lead, cadmium, chromium, and nickel, enter into the gas phase in the process of steel making, and EAFD is classified as hazardous waste [3,4,5]. Currently, landfill or stockpiling is the main treatment method, but it not only wastes metal resources but also poses potential threats to the environment. Therefore, many processes [6,7,8] have been developed all over the world in order to realize the comprehensive utilization of the disposal of EAFD.
The technology of extracting zinc from zinc-containing dust is mainly divided into pyrometallurgy [9,10] and hydrometallurgy [11]. The pyrometallurgical process is the most commonly used commercial technique [12]. One of the representative processes is the Waelz kiln [13]. The method used at the Waelz kiln is carbothermic reduction under normal atmospheric pressure. The product is a low-added-value crude zinc oxide powder (less than 80% purity [13]). The vacuum carbothermic reduction method is used in the recovery and extraction of many metals due to its characteristics such as high added value of the product, environmental friendliness, and resource conservation [14,15,16,17]. Zinc is easily evaporated since it has a low boiling point (907 °C). Therefore, vacuum carbothermic reduction can be applied to the recovery of zinc in EAFD. In a vacuum atmosphere, the secondary oxidation of zinc vapor to zinc oxide is avoided, and the initial temperature of the reduction reaction can be reduced at the same time [18]. In addition, it can also accelerate the rapid diffusion of zinc vapor and accelerate the reaction [14]. This may be a more efficient strategy to dispose of EAFD.
In the kinetic studies of the vacuum carbothermic reduction process, the dependence of the apparent activation energy on reaction progress was always observed since the process can be quite complicated and involves multiple steps [19,20]. However, this circumstance had been neglected in many studies and they treated the apparent activation energy as constant throughout the whole process [10,21]. For example, in a kinetic analysis of the vacuum carbothermic reduction of zinc oxide [21], the authors calculated the apparent activation energies corresponding to the different control equations. The control steps of the whole reaction were determined by comparing the magnitude of the apparent activation energy, which may deviate significantly from the actual situation. In the current work, a rational kinetic analysis was performed, starting with five sets of isothermal experiments. Through the experimental results, the reduction process was divided into different stages and analyzed to study in depth the vacuum carbothermic reduction process of EAFD.
We disposed of the EAFD using a vacuum carbothermic reduction method. The effects of the reaction temperature and time on the reduction ratio of EAFD were investigated. Meanwhile, combining X-ray diffraction (XRD), scanning electron microscopy (SEM), and energy-dispersive spectroscopy (EDS) detection tools, the kinetics of the vacuum carbothermic reduction process of zinc oxide was systematically analyzed to explore the mechanism of EAFD, which could provide a theoretical basis for the application of the vacuum carbothermic reduction disposal of EAFD.
2. Materials and Methods
2.1. Raw Materials
The EAFD used in this study was obtained from a steel company in China. The chemical composition analysis was performed using X-ray fluorescence (XRF, Arl Thermo 900 XP-161, Thermo Fisher Scientific, Waltham, MA, USA), as shown in Table 1. The composition of the EAFD sample included 31.66% Zn and small amounts of Fe, Ca, Mg, and Si.
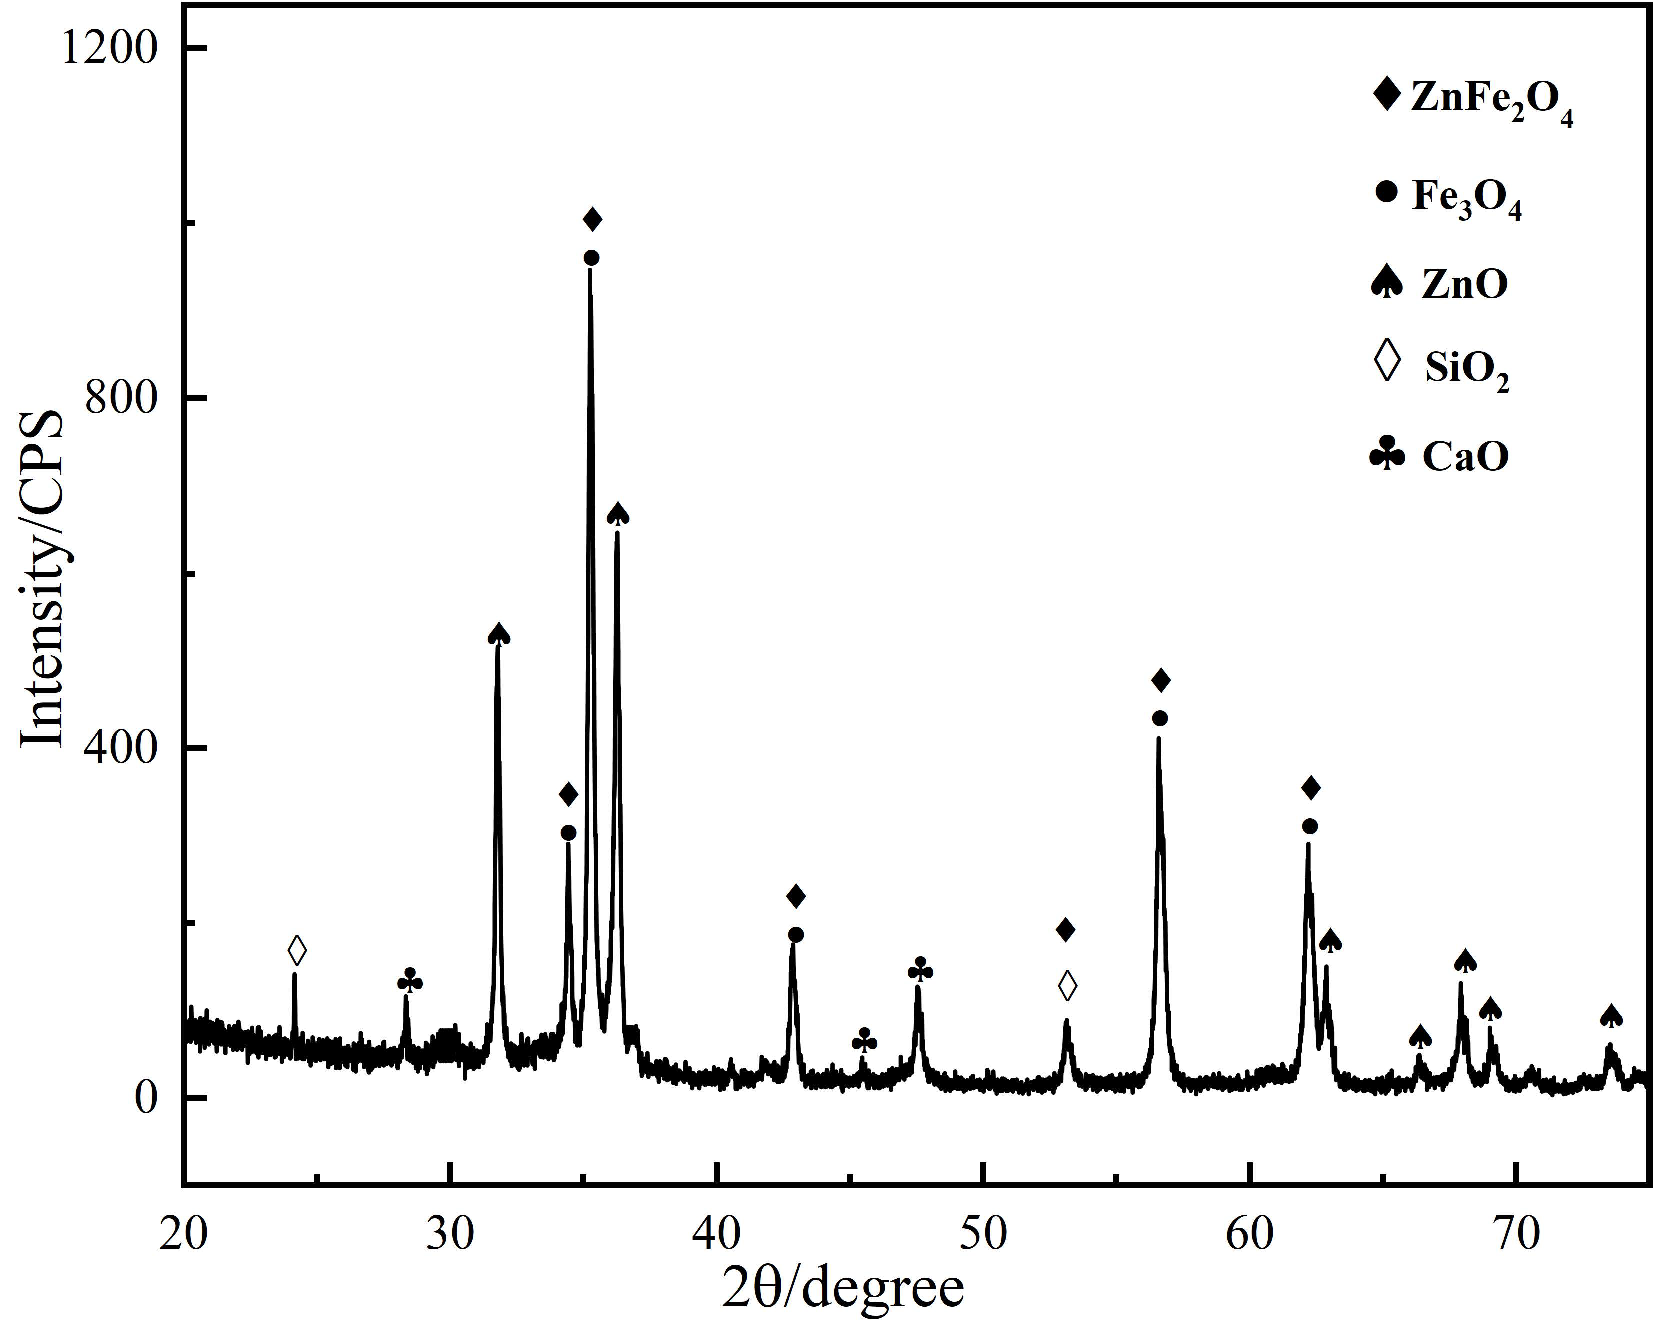
The phase of the EAFD and products were identified using an XRD instrument (D/max-3B), using Cu Kα radiation with a scanning rate of 2 deg/min, which was made by the Rigaku Corporation of Tokyo, Japan. The results are shown in Figure 1. It could be found that the EAFD was a mixture of multiple oxides, and the majority were ZnFe2O4 (PDF card no. 22-1012), ZnO (PDF card no. 36-1451), and Fe3O4 (PDF card no. 19-0629). There also existed a small amount of CaO (PDF card no. 28-0775) and SiO2 (PDF card no. 47-1144).
2.2. Experimental Vacuum Determination
During the carbothermic reduction of EAFD, the primary reactions occurring in the zinc-containing phase were as follows [10,13]:
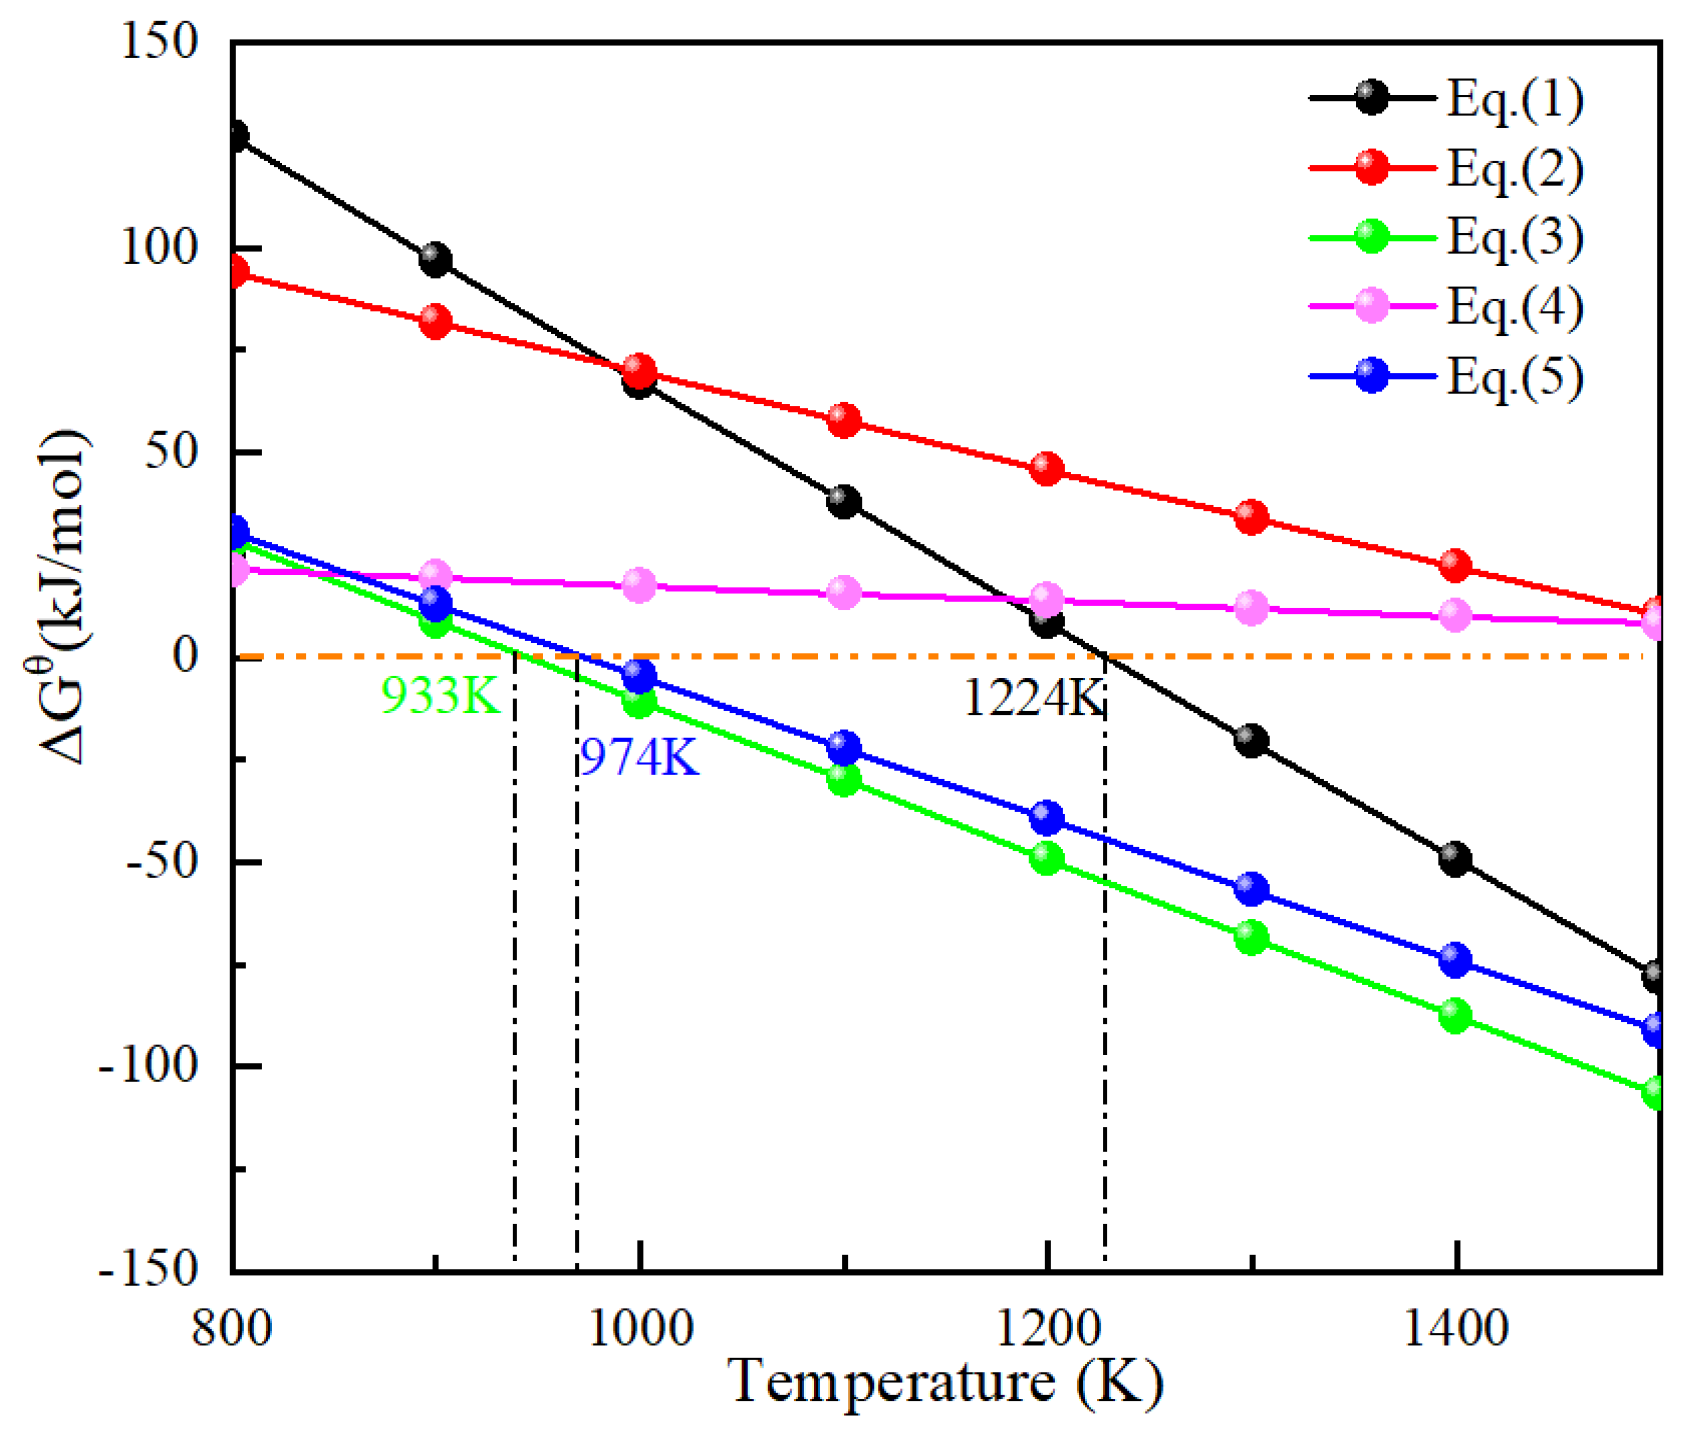
Standard Gibbs free energy calculations were performed for Equations (1)–(5) using the EQUILIB module in FactSage software (GTT-Technologies, Herzogenrath, Germany), and the result is shown in Figure 2.
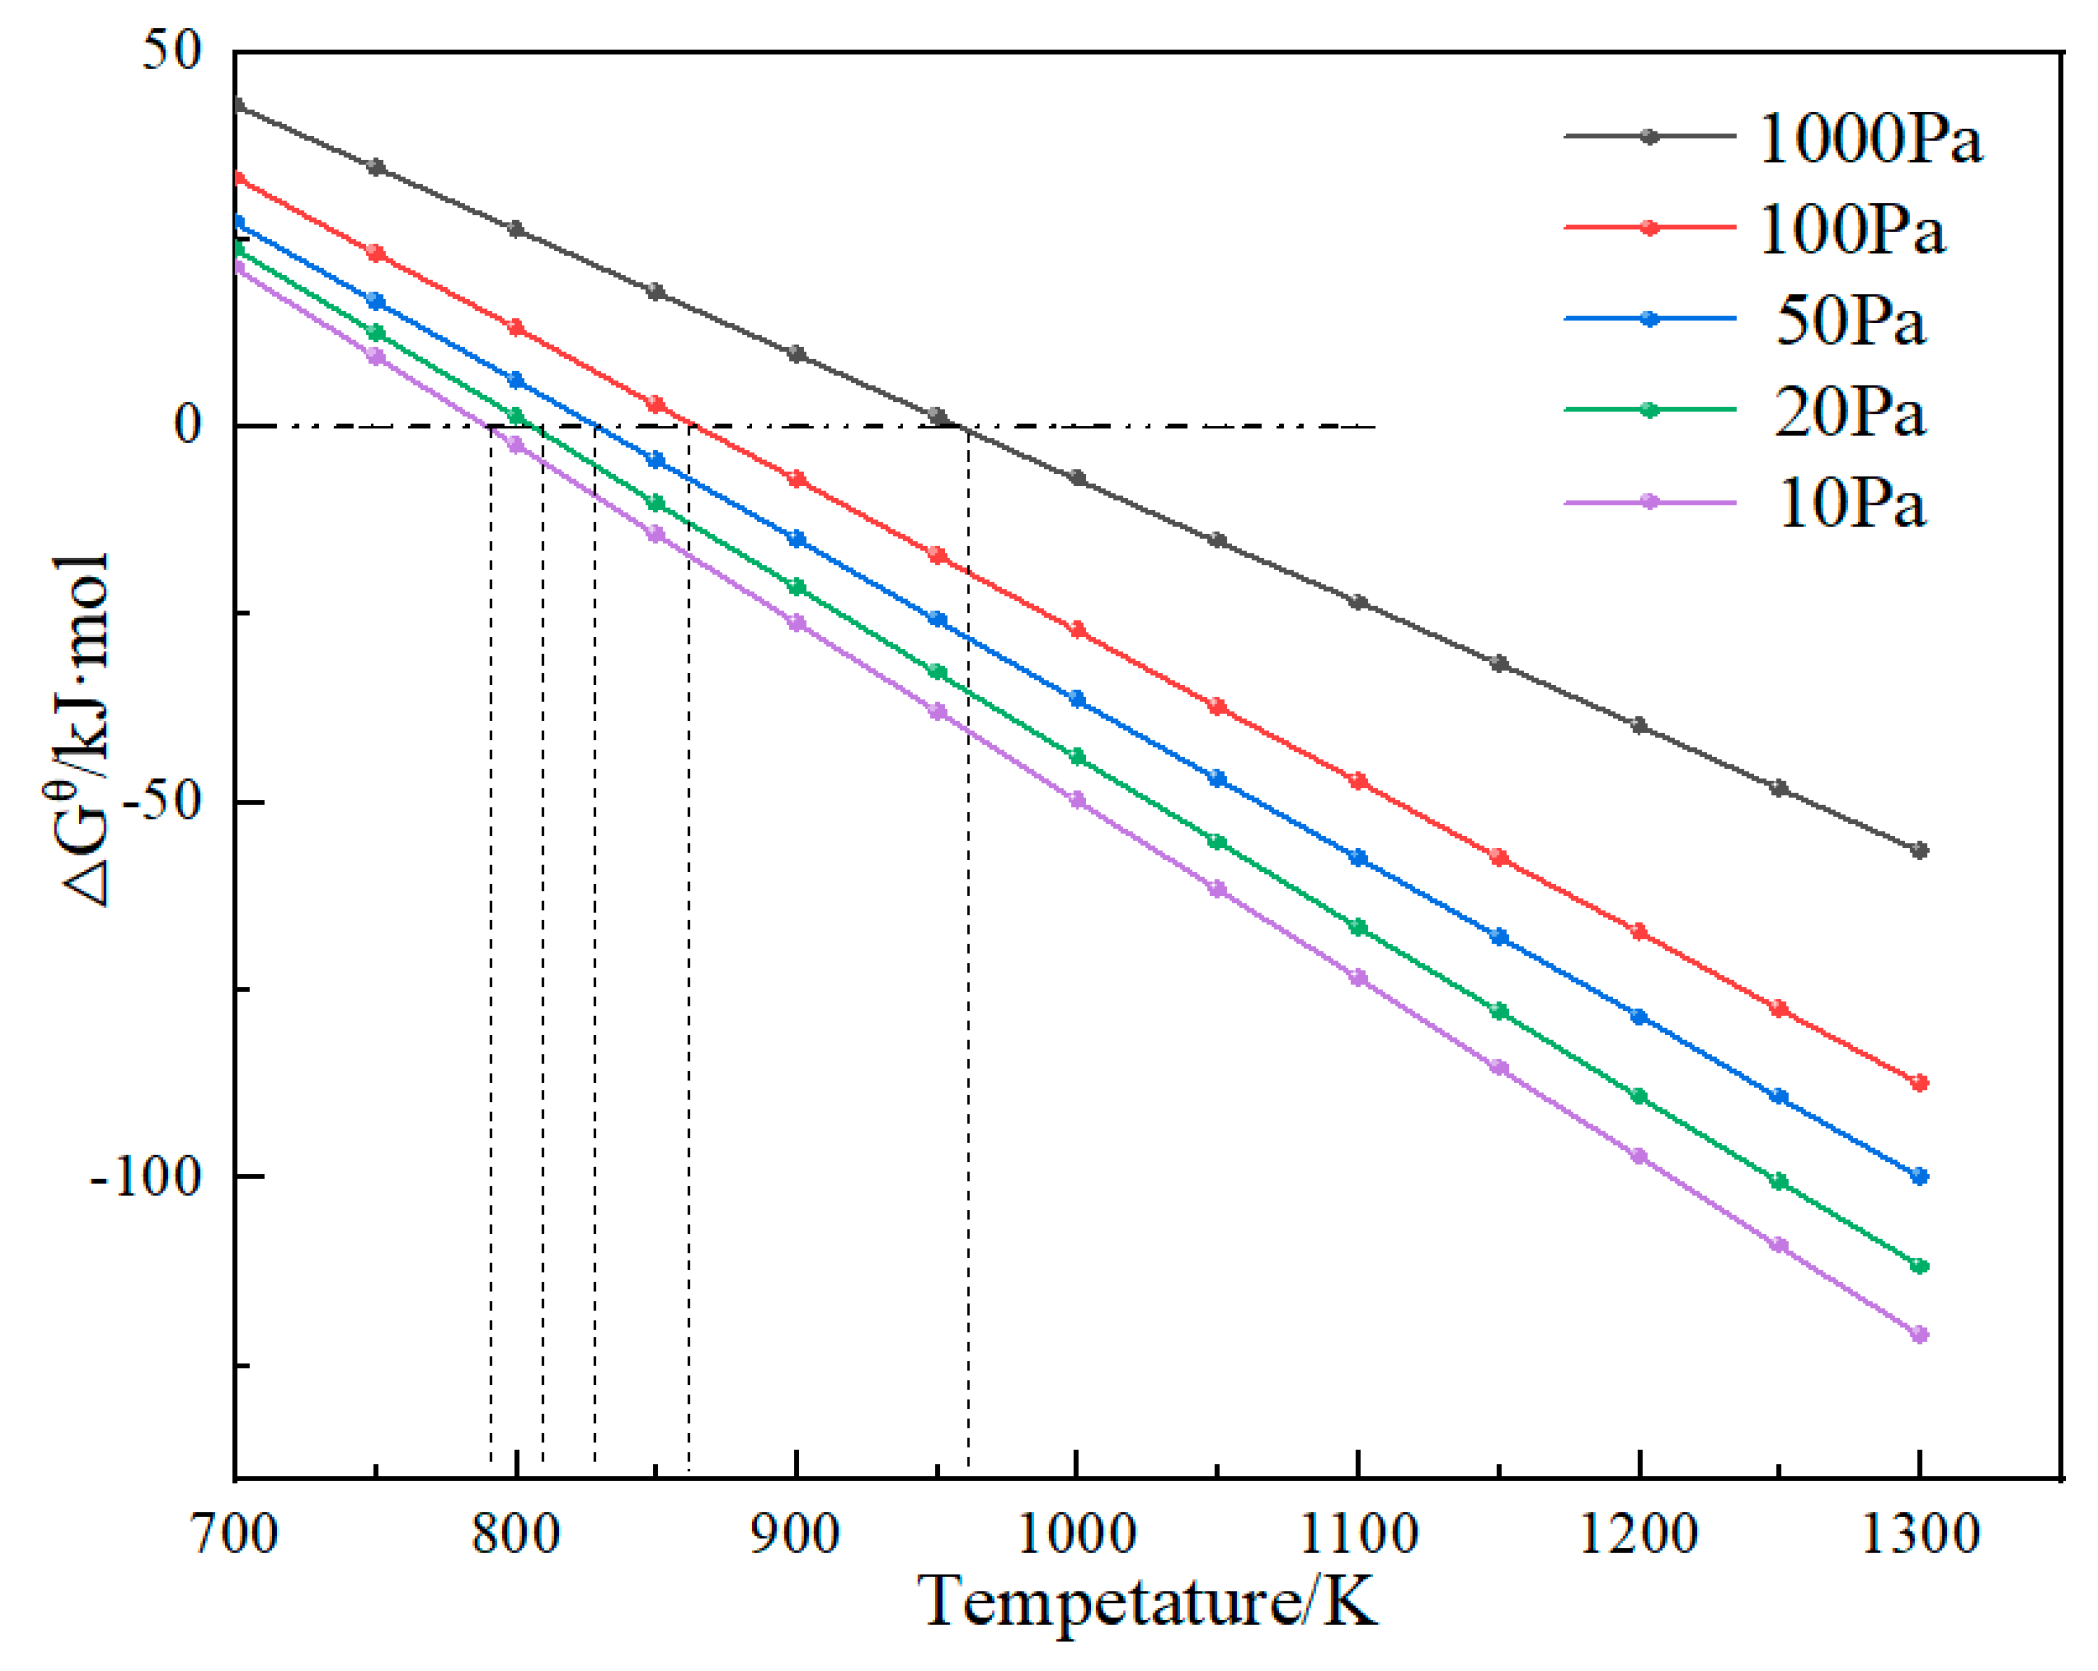
As shown in Figure 2, the initial reaction temperatures of Equations (1), (3) and (5) were 1224 K, 933 K, and 974 K, respectively. In addition, Equations (2) and (4) were both above 1400 K. Increasing the temperature could reduce the standard Gibbs free energy and thus make the reaction more inclined to occur in the forward direction. For reactions where the pressure increased after the reaction, reducing the system pressure also could reduce the Gibbs free energy. The Gibbs free energy of Equation (1) in the vacuum atmosphere was taken as the research goal of thermodynamic calculation to determine the appropriate vacuum degree. The results of Gibbs free energy calculation at the different vacuum degrees are shown in Figure 3.
Figure 3 shows that the increase in vacuum degree effectively lowered the initial reaction temperature. The initial reaction temperatures were 961 K, 859 K, 827 K, 809 K and 793 K when the vacuum degrees were 1000 Pa, 100 Pa, 50 Pa, 20 Pa and 10 Pa, respectively. Considering the actual production conditions, the experimental vacuum degree was selected as 20 Pa.
2.3. Experimental Procedure
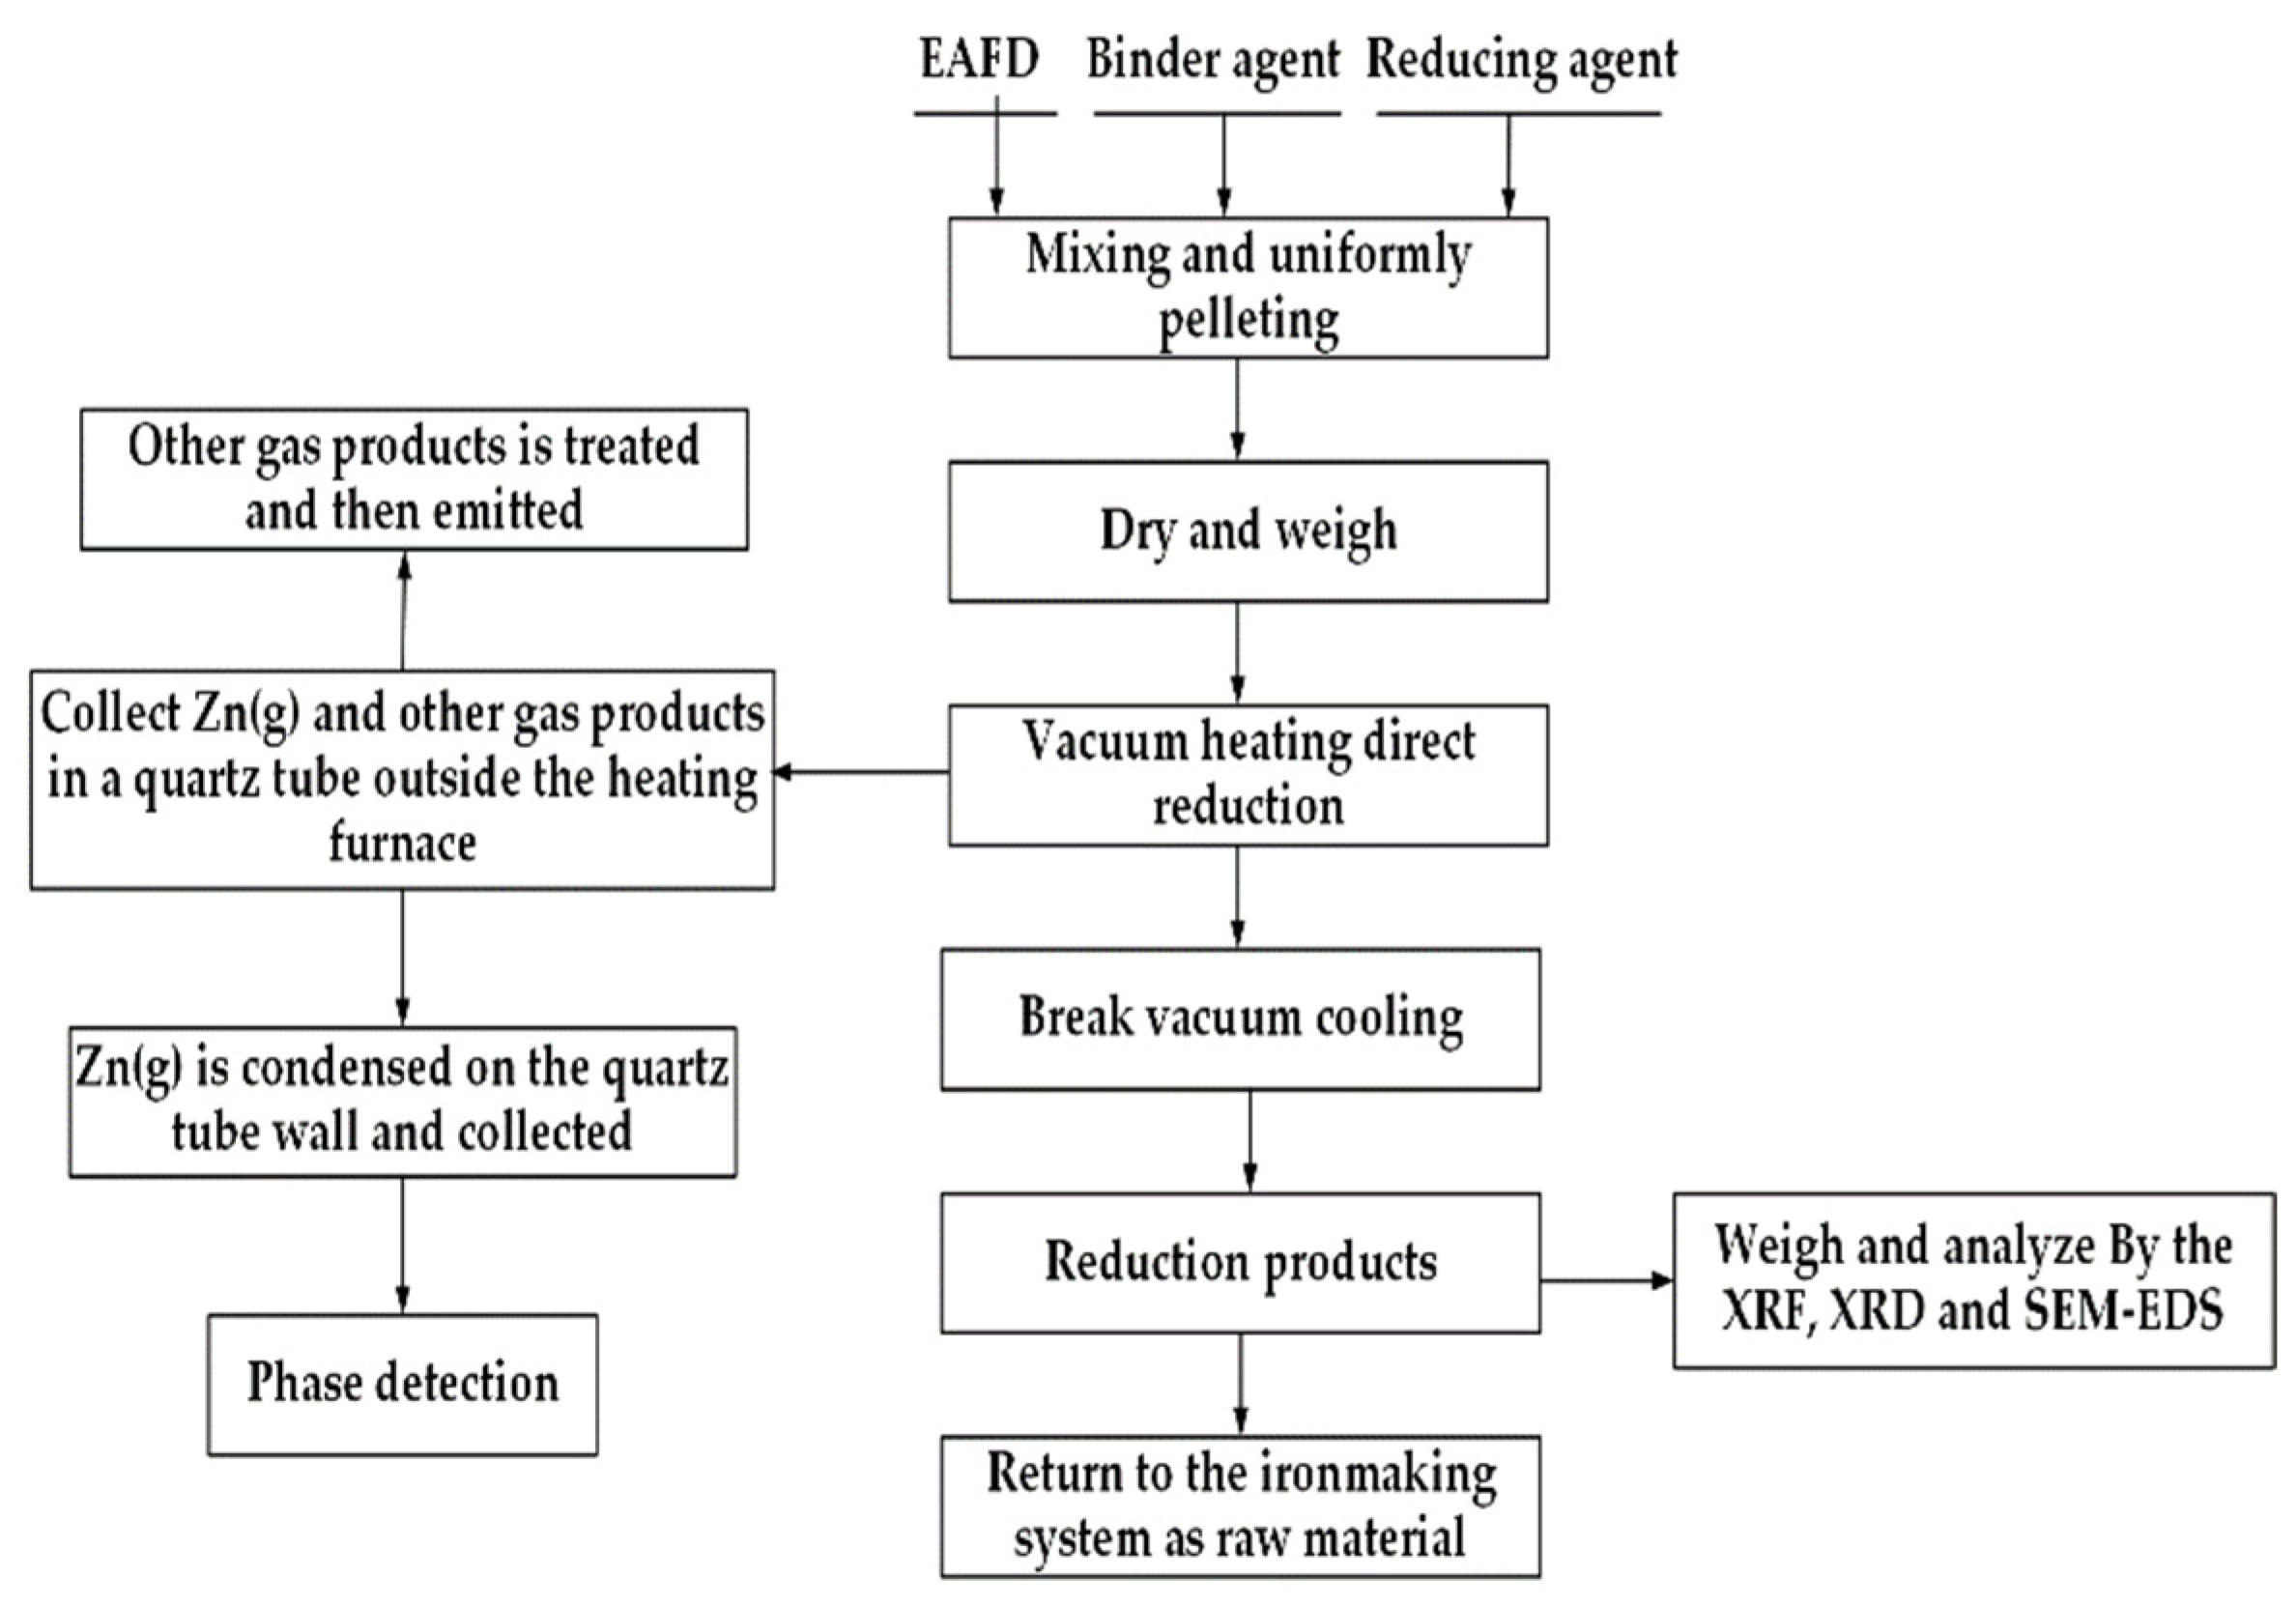
The raw pellets of 15 mm were prepared by mixing EAFD, binder, water, and reducing agent using a balling disc. EAFD and reducing agent were mixed with a molar ratio of Zn:C = 1:3. The binder used was bentonite. The prepared raw pellets were placed into an oven at 373 K and dried for 2 h. After the dried pellets were weighed and recorded, they were then placed in the vacuum furnace.
Then, it was pumped down to 20 Pa and the dried pellets were heated from room temperature to 1173 K. The temperature was held at 1173 K for the time required for the experiment. The experiment was repeated while the heating temperatures were changed to 1223 K, 1273 K, 1323 K, and 1373 K. Later, the temperature was lowered to room temperature while the vacuum remained the same. The gaseous product was aspirated by the vacuum pump and collected in a quartz tube outside the heating furnace. Finally, the test samples were prepared by grinding, polishing, and etching of the reduction products from each group of experiments. The product samples were qualitatively characterized via XRD analysis (D/max-3B) using Cu Kα radiation (2 deg/min), SEM (FEI Quanta 250FEG, FEI, Hillsborough, ORE, USA), and EDS (JSM-6360LV).
The experimental process is described in Figure 4.
3. Results and Discussion
3.1. Reduction Product Analysis
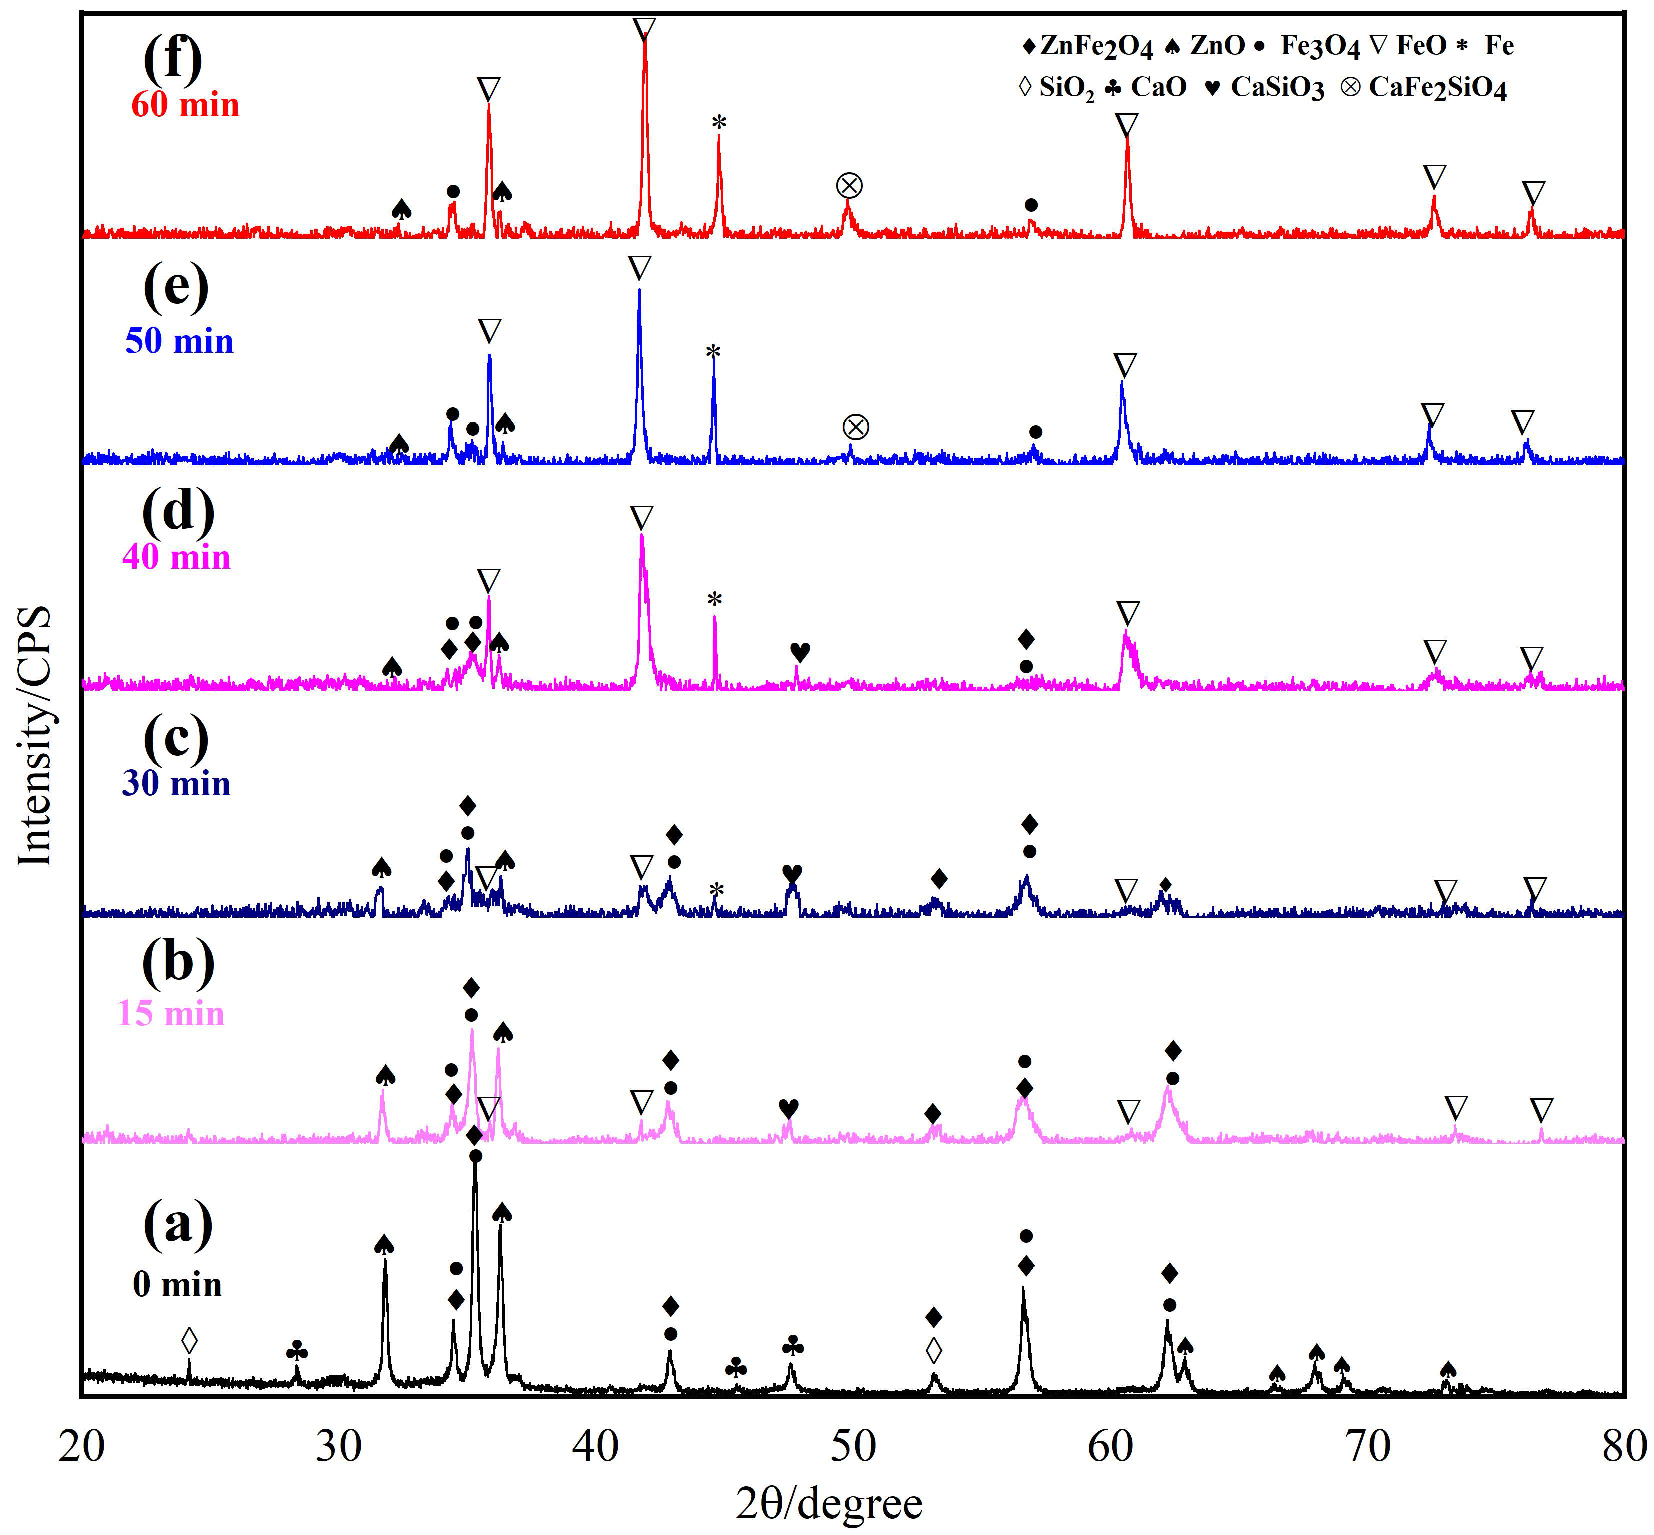
To clarify the phase changes in the reduction progress of EAFD, several reduction products under the experimental conditions (vacuum of 20 Pa, temperature of 1173 K, C/Zn of 3), obtained at different reaction times, were qualitatively investigated via XRD and the results were plotted, as shown in Figure 5.
According to Figure 5, the diffraction peaks for ZnO (PDF card no. 36-1451) and ZnFe2O4 (PDF card no. 22-1012) tended to decrease with increasing reaction time. The phase of CaO (PDF card no. 28-0775) and SiO2 (PDF card no. 47-1144) disappeared in the reduction products when the reaction time was 15 min, while a new phase of CaSiO3 (PDF card no. 18-0306) appeared. This represented the complete conversion of CaO and SiO2 to CaSiO3 Meanwhile, the peak intensities of both ZnO and ZnFe2O4 had been decreased, and a new phase, FeO, was found (PDF card no. 49-1447). This was mainly due to the occurrence of Equations (1) and (3). As the temperature was above the boiling point of zinc and the zinc was pumped out as zinc vapor, no zinc diffraction peaks were detected in the XRD pattern of the reduction products.
When the reaction time was extended to 30 min, the diffraction peaks of ZnO and ZnFe2O4 present in this phase substantially weakened, illustrating that the degree of Equations (1) and (3) increased. Meanwhile, the new phase Fe (PDF card no. 06-0696) appeared in the reduction products and the diffraction peaks of FeO increased. Due to the large amount of CO generated in the reduction products, Fe3O4 could be reduced via Equation (6).
The formation of Fe mainly corresponded to the reduction of FeO via Equation (7).
No new phase was observed when the reduction time was 40 min. The diffraction peaks of FeO and Fe continued to intensify, while the diffraction peak of the Fe3O4 phase weakened, illustrating that Fe3O4 was further reduced by CO.
After the reaction time of 40 min, the ZnFe2O4 phase disappeared, indicating that the reduction of ZnFe2O4 was complete. The primary phase present in the product at this stage was FeO and Fe. During the vacuum carbothermic reduction of EAFD, the main phase changed, and no metallic zinc and lead were found. This was mainly because zinc and lead volatilized as the metal vapor after being reduced.
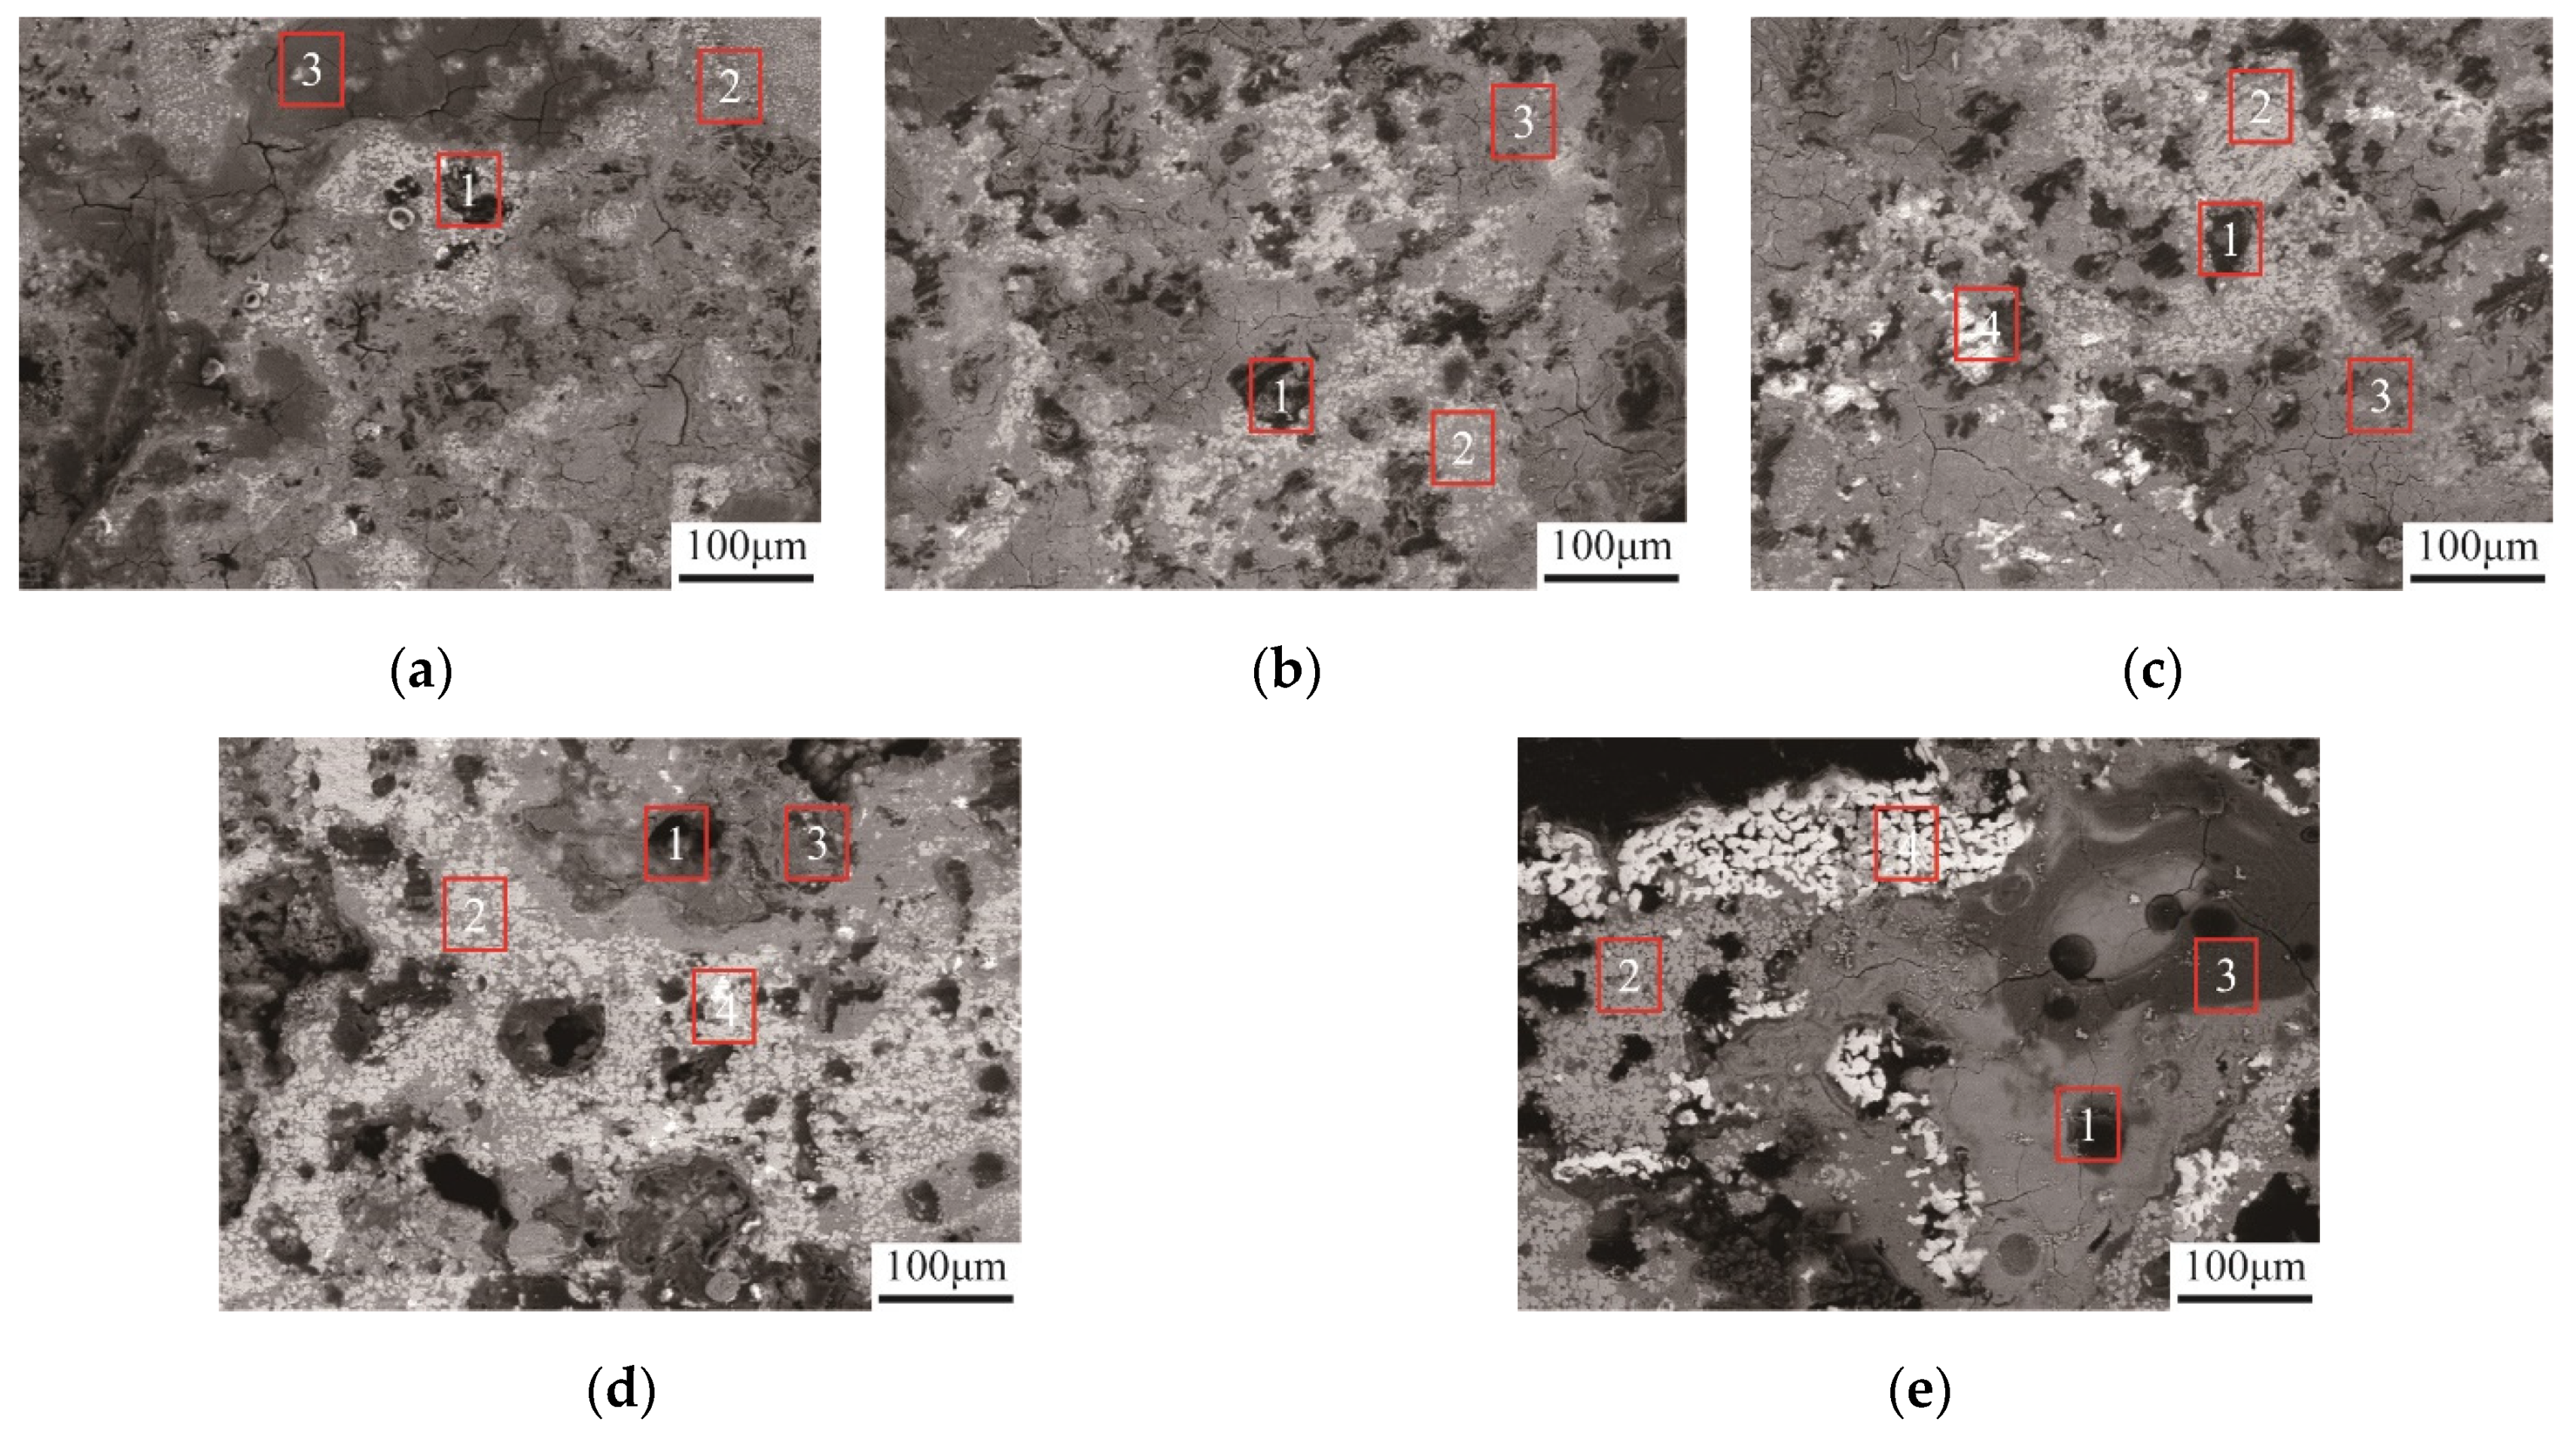
Figure 6 shows the SEM images of the reduction products.
We present the EDS results obtained at points 1–4 in Figure 6c.
From Figure 6 and Table 2, it can be observed that the reduction products were mainly divided into four regions. The hollow region was the zinc ferrite that had undergone the decomposition reaction (Equation (3)) and had been produced as a gas phase (Equation (1)). The light white regions were ferrous oxide. The dark gray regions were silicates, and the bright white regions were iron. When the reaction time was 15 min, the reduction products were mainly undecomposed zinc ferrite and unreduced zinc oxide. The structure at 30 min displayed greater porosity with more holes, which was not observed at 15 min. This meant an increase in the degree of Equations (1) and (3), which was confirmed by XRD analysis (Figure 5). Furthermore, it was also noticed that the light white regions became more numerous. The SEM images captured at 40 min (Figure 6c) showed the slight enlargement of the hollow region and the light white region. Moreover, some iron could be observed. Continuing to increase the reaction time to 50–60 min, it was seen that ferrous oxide and iron became more numerous and the number of hollow regions remained essentially the same. It was suggested that Equations (1) and (3) were nearly complete during this period and the main transformation was from iron oxides to iron.
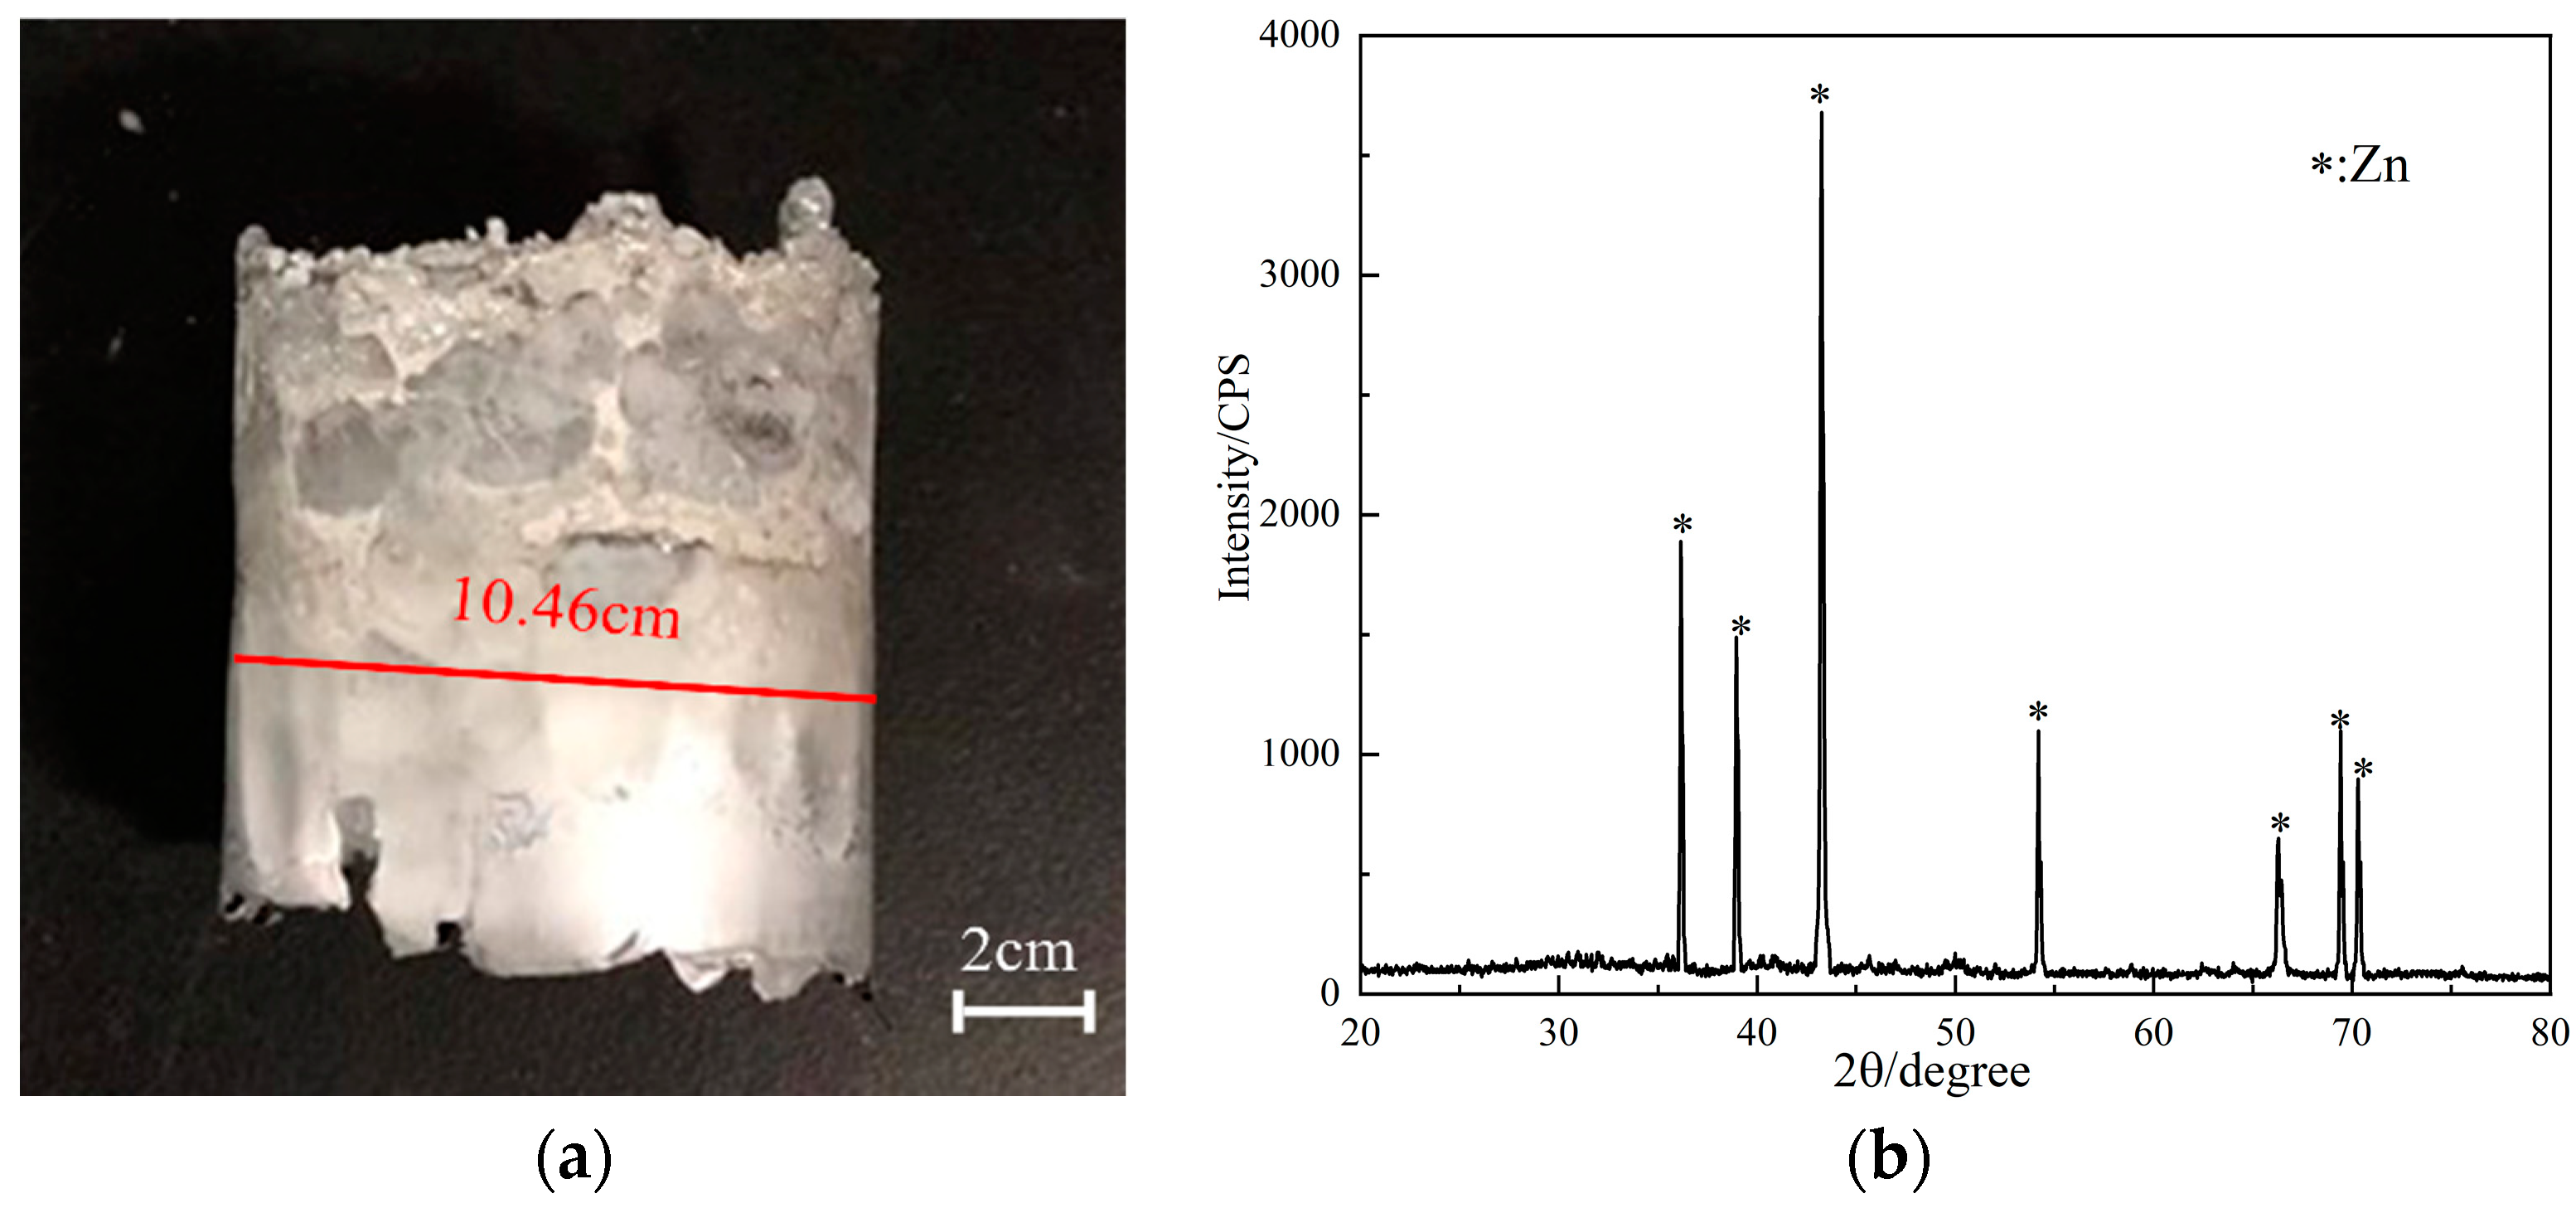
The XRD analysis of the condensed product is shown in Figure 7: the condensate collected is shown in Figure 7a and the XRD analysis is shown in Figure 7b.
Figure 7 shows that the condensate collected in the condensation zone was metallic zinc. However, no metallic lead was found, probably because the content of metallic lead in the condensate was too low to be detected by XRD. The XRD analysis of the collected condensation products proved that the experiments were successful in collecting metallic zinc. It indicated that the vacuum carbothermic reduction of EAFD was feasible.
3.2. Effect of Temperature and Time on Reduction Ratio of Zinc
The reduction ratio of EAFD was characterized by the reduction ratio of zinc, which can be defined by Equation (8):
where x refers to the reduction ratio of zinc; t is the reaction time, min; is the mass of the pellet at t = 0, g; is the content of zinc in the pellet at t = 0, g/g; is the mass of the pellet at t; is the content of zinc in the reduction product at t.
The relationships among the reduction ratios, reaction temperatures, and time are shown in Figure 8.
It can be seen from Figure 8 that the reduction ratio of zinc increased dramatically with the reaction time, while this increasing range slowed down when the reaction time exceeded 30 min. At 1373 K with 60 min reaction time, the reduction ratio of zinc could reach up to 99.6%.
Reaction temperature was a significant parameter of thermodynamics and kinetics. At the temperature of 1173 K, the reduction ratio increased rapidly at first, reached 77.6% at 30 min, and increased slowly at subsequent soaking times. The final reduction ratio was 78.7%. After increasing the temperature to 1223 K, 1273 K, 1323 K and 1373 K, the reduction ratio was increased. The reduction ratios were 83.2%, 88.6%, 92.40% and 94.6% at 30 min, and 84.0% 89.5%, 94.3%, 97.4% and 99.6% at the end of the experiments. It could be seen that the reduction ratio increased with temperature. This could be attributed to the fact that the increase in temperature caused the molecular motion to accelerate and the collisions to intensify, so that more ordinary molecules were converted into activated molecules. Thus, the activity of the reactants was enhanced and a high reduction ratio could be obtained in a short time.
3.3. Kinetic Analysis
The vacuum carbothermic reduction of EAFD was complex and was affected by many factors, such as the raw material composition, system pressure, heating time, and so on. The type still was the carbothermic reduction. The carbothermal reduction was essentially a gas–solid reaction [22], conforming to the ‘reduced nucleus reaction model’ [14,23,24], which was adopted to describe the vacuum carbothermic reduction process for EAFD in this study.
The whole process was divided into the following five steps:
- Boundary layer gas diffusion: the diffusion of reducing gas CO molecules on the surface of the boundary layer.
- The reducing gas CO diffuses to the reaction interface through the solid product layer.
- At the reaction interface, the reducing gas CO reacts with zinc oxide and zinc ferrite.
- After the reaction, the gas products Zn(g), CO, and CO2 begin to diffuse to the outer surface.
- The gas products Zn(g), CO, and CO2 leave the surface layer and diffuse into the air.
The controlling step of the shrinking nuclear reaction model could be divided into three types: carbon gasification reaction control, phase boundary reaction control, and diffusion control.
The kinetic equation is expressed as follows:
where k is the apparent rate constant; α is the reaction degree, which is defined by
where xt is the reduction ratio at time t; xe is the final reduction ratio at the end of the experiment; x0 is the initial reduction ratio.
In the present case, α = xt could be obtained since xe =1 and x0 = 0. Integration of Equation (11) gave the relationship between α and t. The functions F(α) and f(α) are shown in Table 3.
The function F(α) in Table 3 was substituted into Equation (11). Table 4 provides the correlation coefficient (R2) and the residual sum of squares (RSS) values of the fitting lines by using the reduction ratios at 1173 K.
The linear relationship and the accuracy of the fitting were poor in the scale of 0−60 min. If the scale of time was reduced, the linear relationship and accuracy were improved. In the scale of 0−15 min, the linear relationship obtained from the functions C and R1 was better than that from other functions. The same method was used to determine the scale of time at temperatures of 1223–1373 K. A good linear relationship was obtained in the scale of 0−15 min, and the values of R2 and RSS are shown in Table 5.
According to the values of R2 and RSS, the function R2 was optimal for explaining the reduction process in the range of 0−15 min. Based on the same principle, the experimental results were divided into three parts.
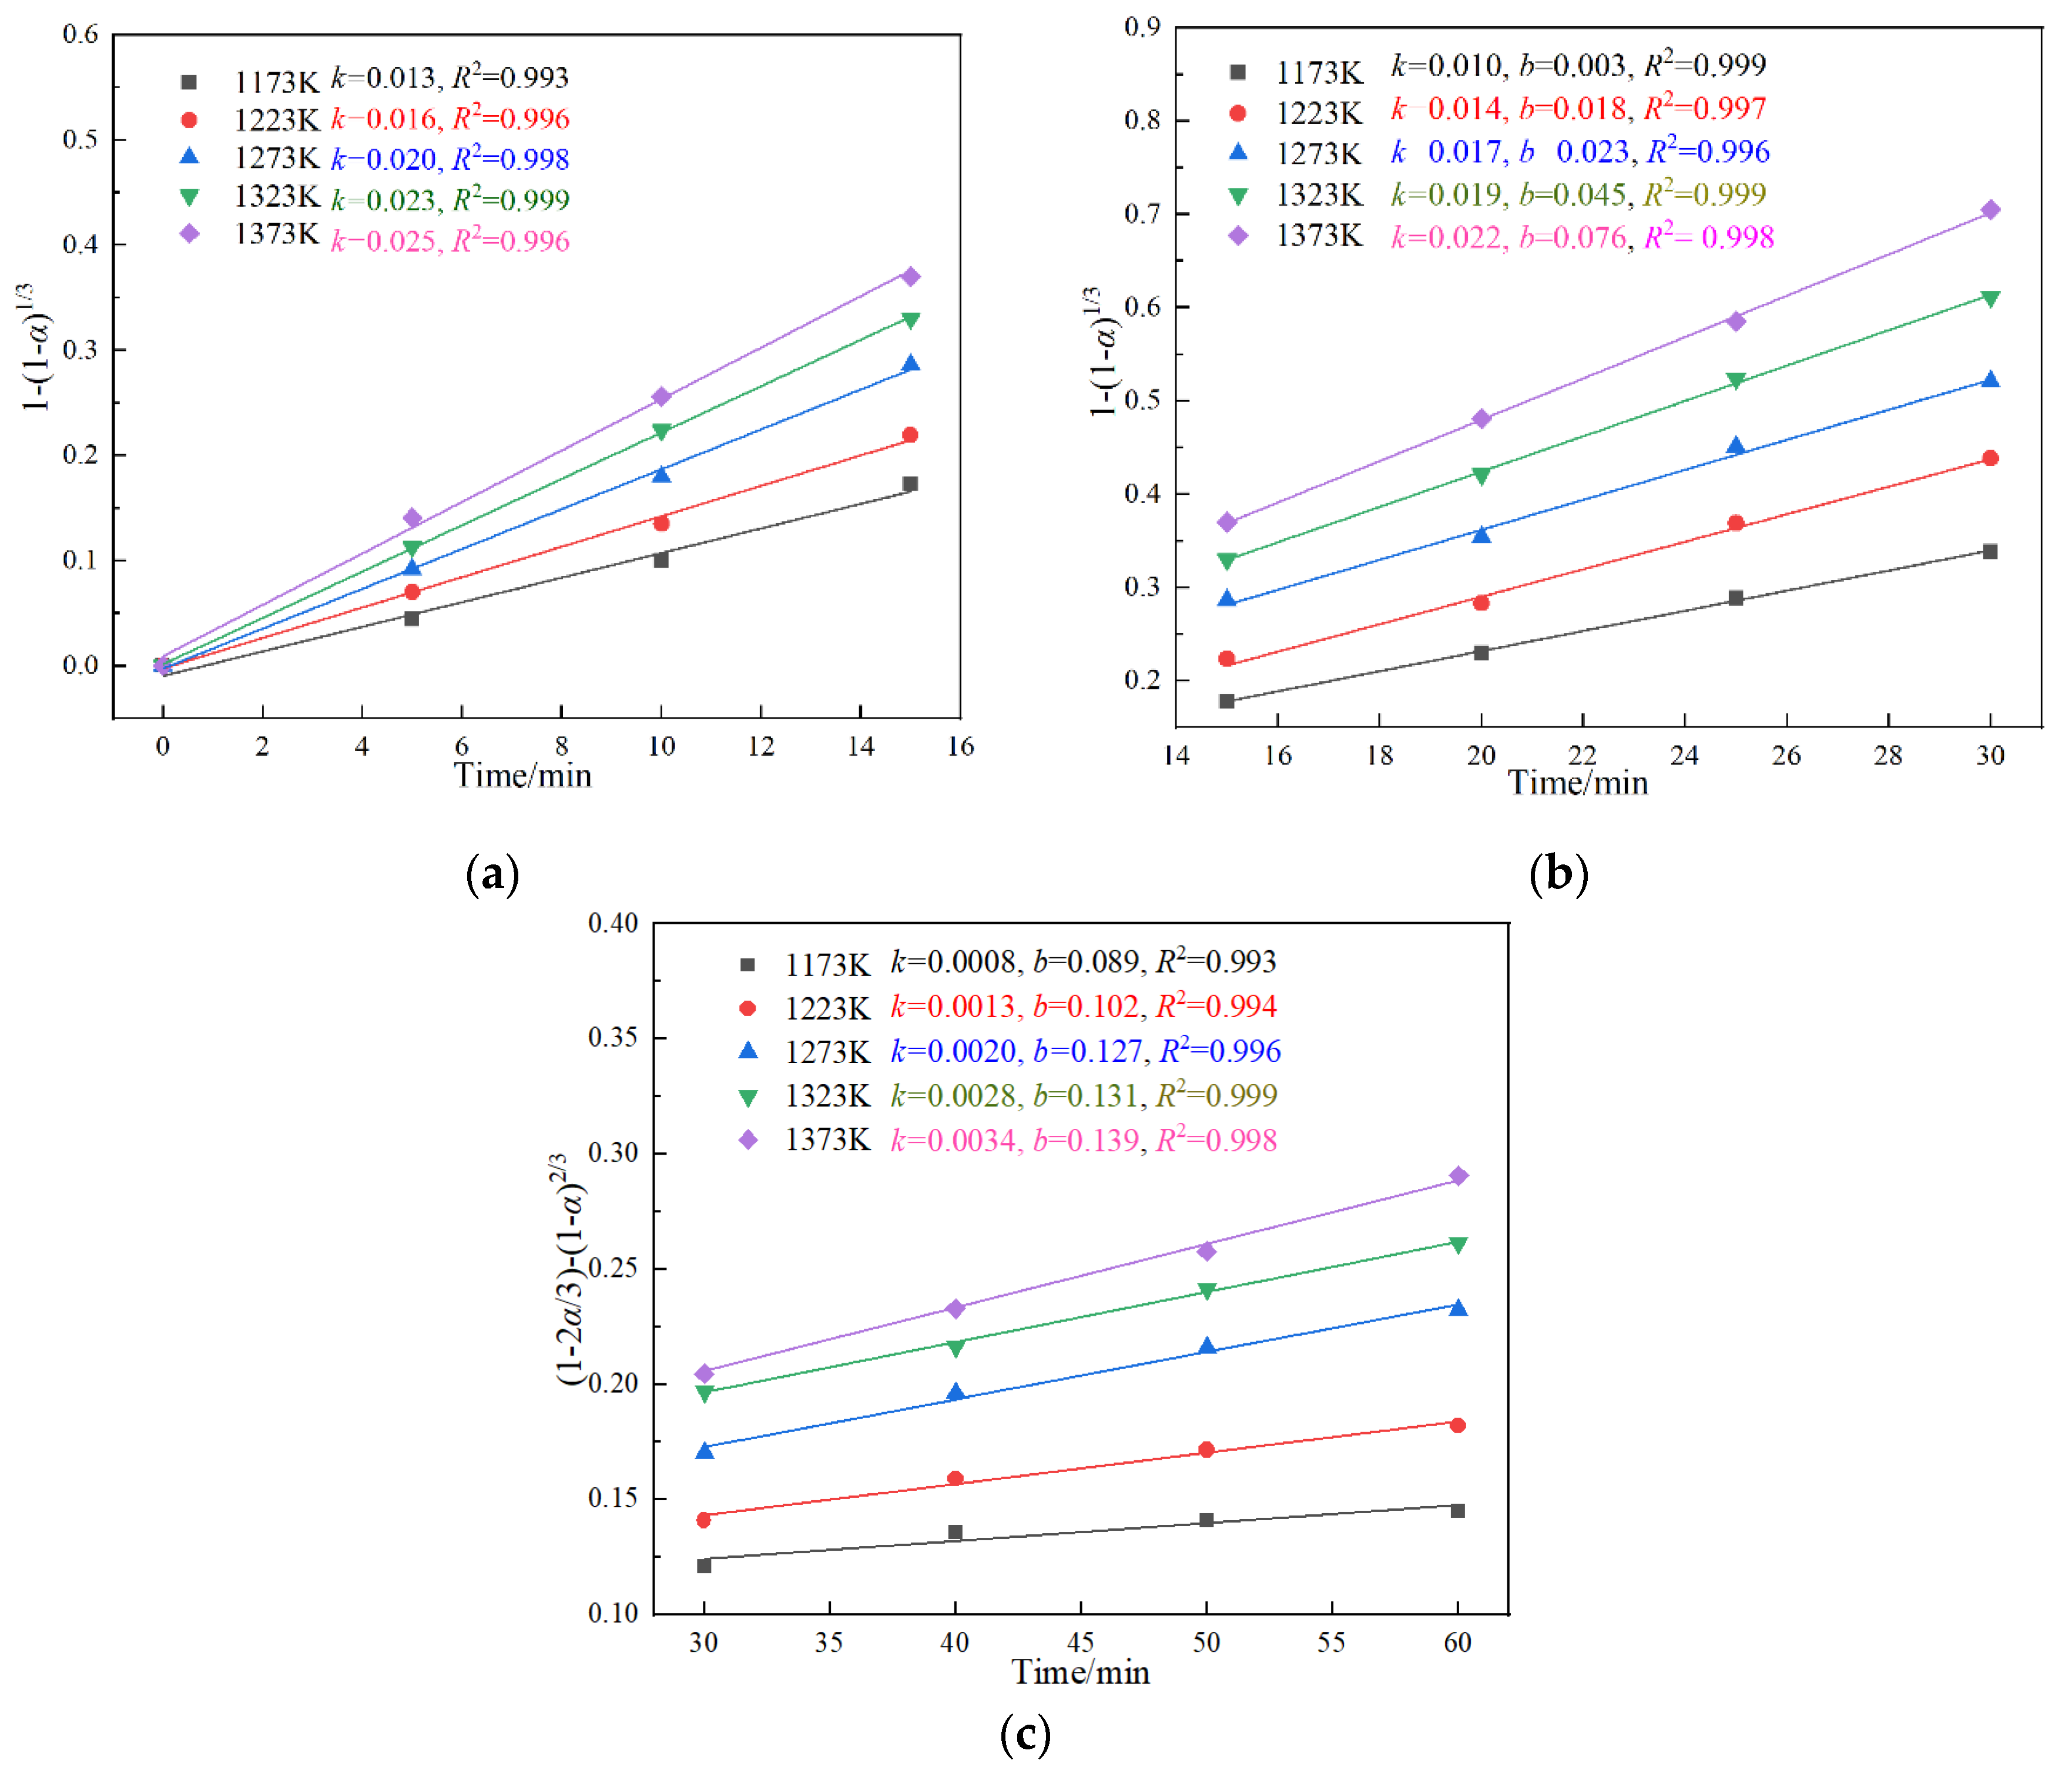
According to the method of determining the fitting function in the first part, it could be found that the second and third parts were well explained by the functions R2 and D2, respectively. The relationship between F(α) and t at different temperatures is shown in Figure 9. The slope of the straight line was the apparent rate constant k. In Figure 9b,c, the linear relationship between F(α) and t is expressed by Equation (12) as calculated from a non-zero moment.
Figure 9 shows that the values of k were maximum in 0–15 min and minimum in 30–60 min at the same temperature. Moreover, the increasing k values with temperature indicated that the reduction was greatly enhanced at a higher temperature. The fitting results illustrated that the reaction speed was fast in 0–15 min, and decreased after 15 min. Results of the fitting explained the variation in the reduction ratio with time and temperature.
Based on the Arrhenius equation, the relationship between the k and absolute temperature (T) is given by Equation (13):
where A refers to the pre-exponential constant (min−1); R is the gas constant (8.314 J/(mol·K)); E is the apparent activation energy (J/mol).
Equation (14) could be obtained by taking the natural logarithm of both sides of Equation (13).
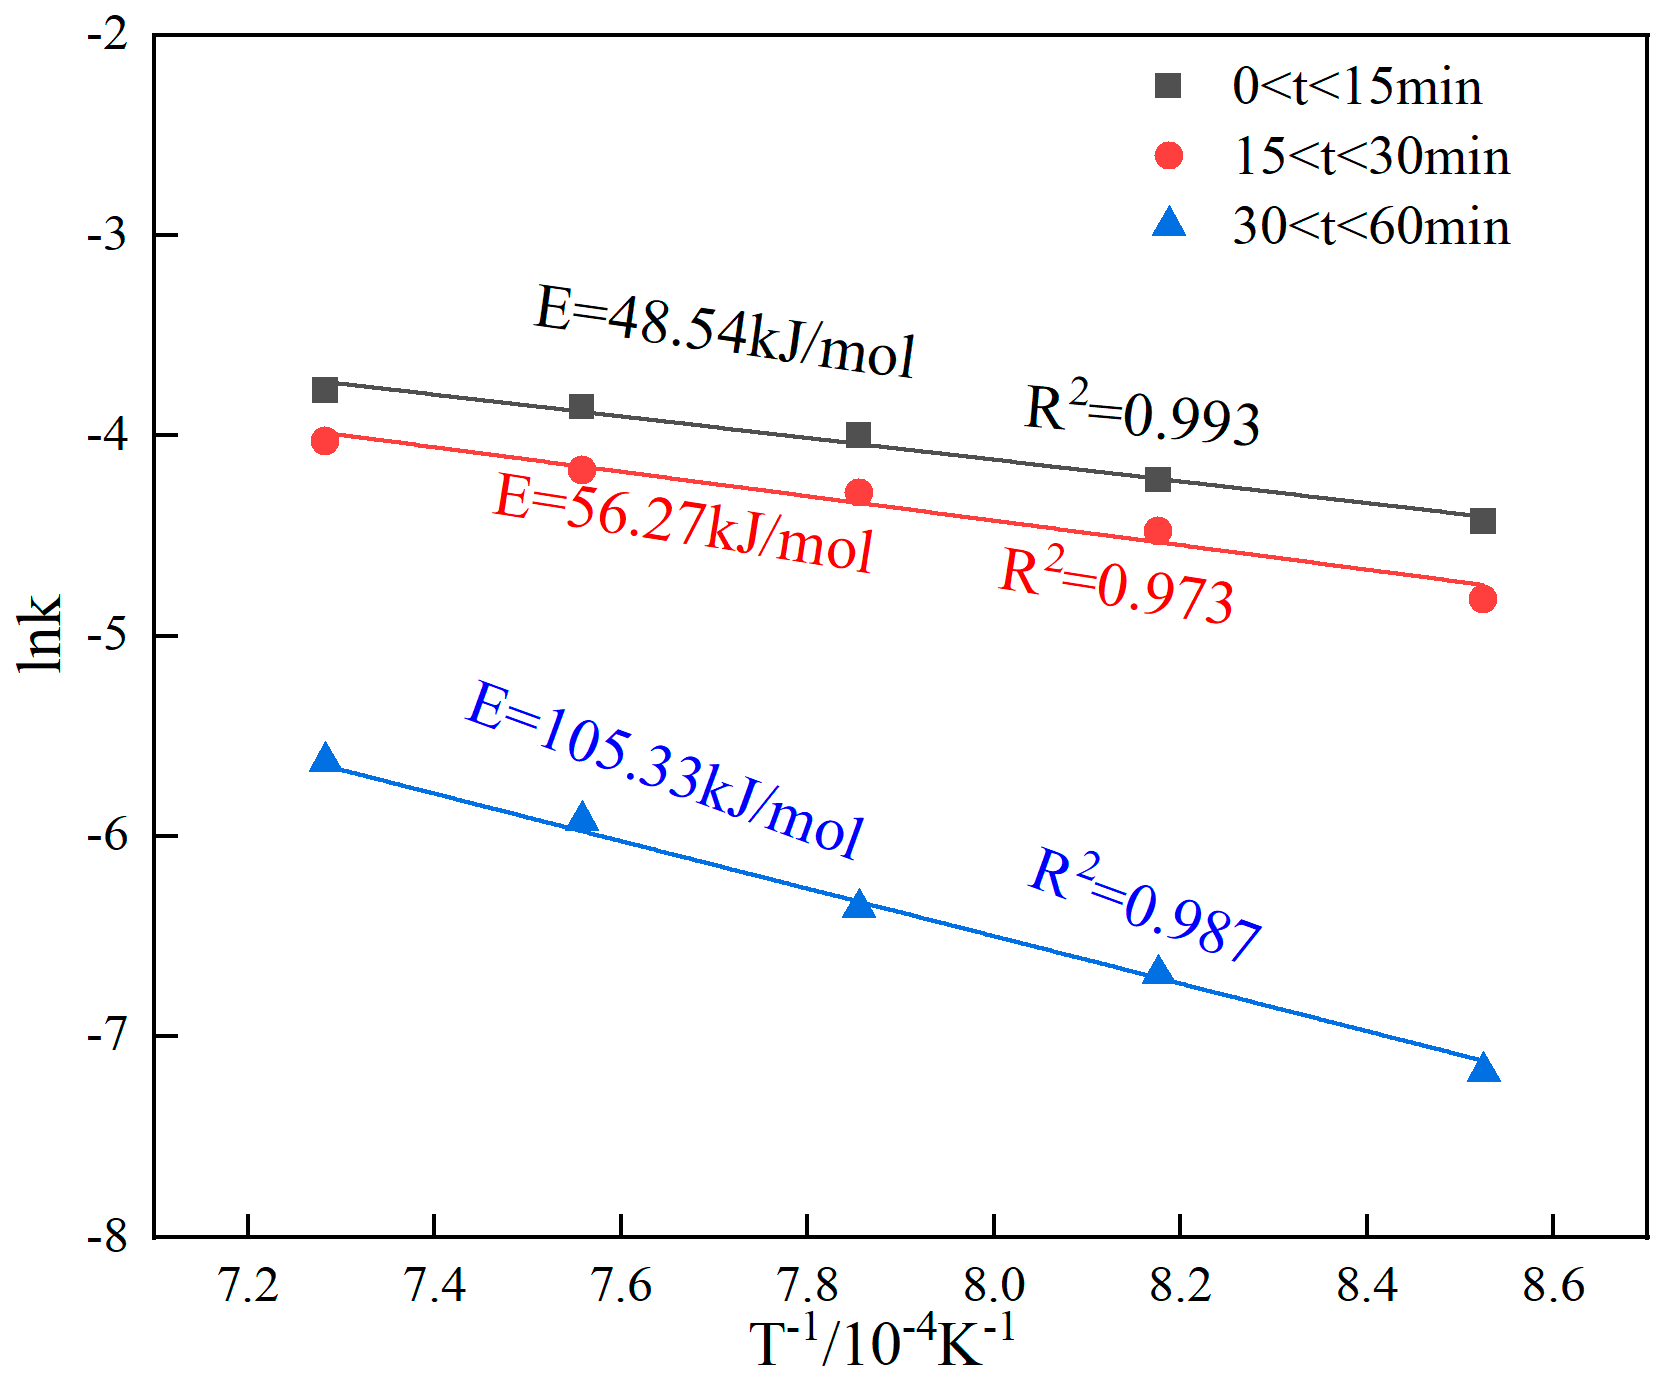
Substituting the data in Figure 9 into Equation (14), the fitting curves that revealed the relationship between (−lnk) and 1/T were obtained, as shown in Figure 10. The value of E/R equals the slope of the fitting straight line, from which the activation energy value could be calculated.
The apparent activation energies calculated from the linear slope for the three stages were 48.54 kJ/mol, 56.27 kJ/mol, and 105.33 kJ/mol, with R2 of 0.993, 0.973, and 0.987, respectively. According to the kinetic models, the controlling steps in the first and second stages of the reduction process were the phase boundaries, and the controlling step of stage 3 changed from the phase boundary reaction to diffusion.
3.4. Mechanistic Analysis of Vacuum Carbothermic Reduction of EAFD
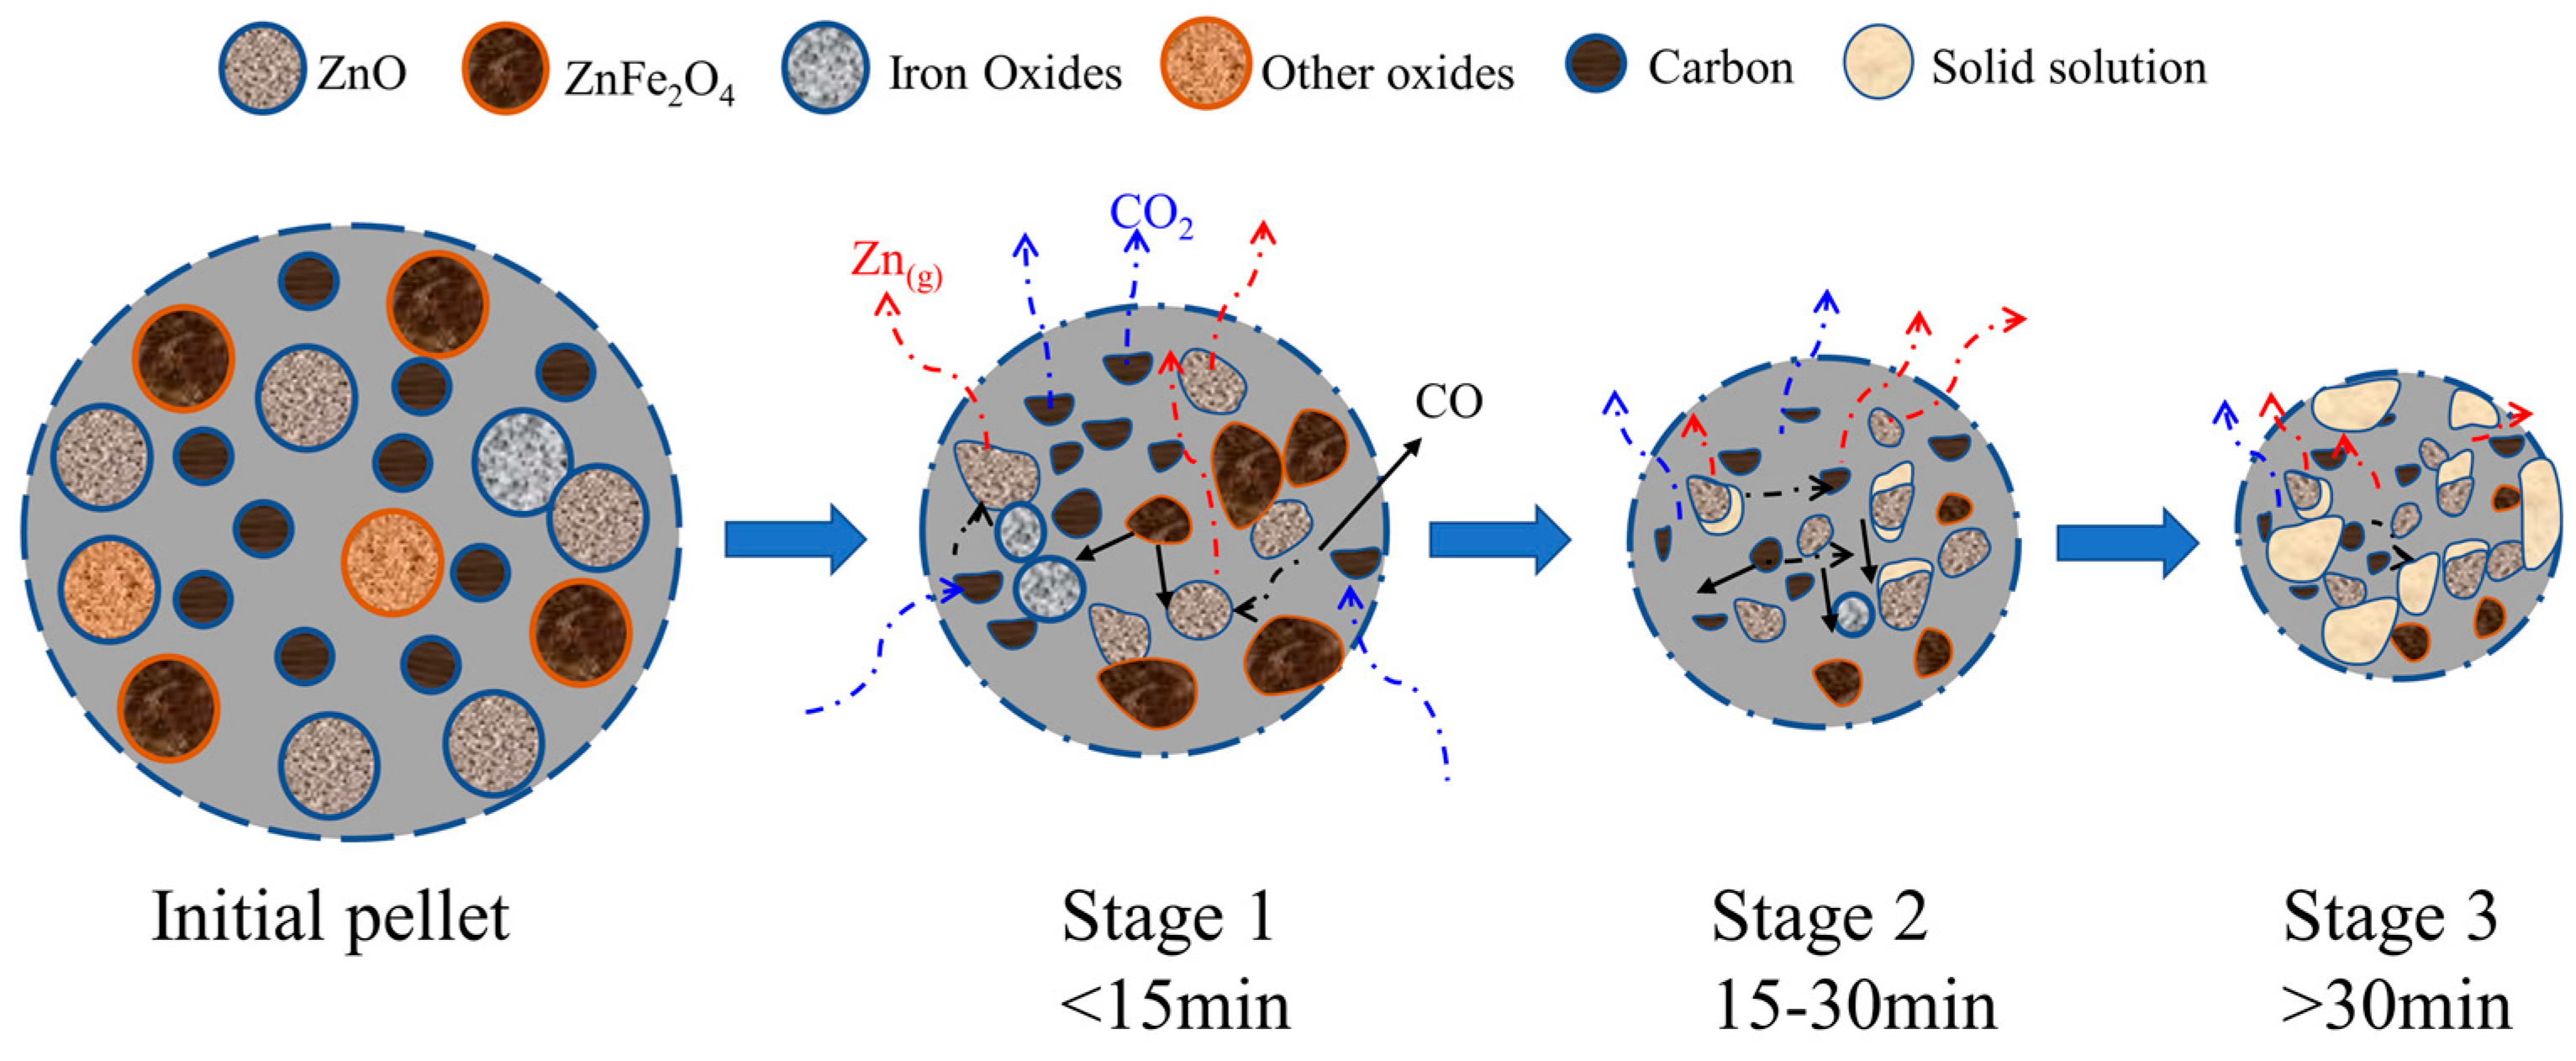
On the basis of the theoretical analysis and experimental results, a reduction mechanism for the vacuum carbothermic reduction of EAFD is proposed and shown schematically in Figure 11. The whole reduction progress can be described as follows.
In the first stage, the main reaction of the reduction was the direct reduction of zinc ferrite and zinc oxide. At this stage, the reactants were abundant and the number of activated molecules was large, so the reaction rate was fast. The control step was the reduction of zinc ferrite and zinc oxide co-control. When the reduction proceeded to the second stage, the decomposition of zinc ferrite approached the end and the reduction of zinc oxide became the main reaction. Simultaneously, wustite was reduced to iron. The controlling step in this stage was the reduction reaction of zinc oxide. When the reduction was in the third stage, the reduction of zinc oxide was also close to complete and the indirect reduction of iron oxides was the main reaction. As the solid product of iron oxide reduction blocked the pores, the diffusion resistance of zinc vapor increased, resulting in a slower reaction rate. The control step became diffusion.
4. Conclusions
- The vacuum carbothermic reduction experiment for the disposal of EAFD successfully collected metallic zinc. The reduction ratio increased with the increase in temperature and time. The highest reduction ratio of 99.6% was achieved under the condition of 20 Pa and 1373 K with 60 min reaction time.
- The microstructure of the reduced sample was shown as the hollow, light white, dark gray, and bright white regions. The hollow region was the zinc ferrite that had undergone the decomposition and had been produced as the gas phase. The light white regions were ferrous oxide. The dark gray regions were silicates, and the bright white regions were iron. An increase in reduction time was beneficial to the generation and expansion of the hollow and light white regions.
- The reaction mechanism was summarized as follows: zinc ferrite was first converted into zinc oxide and iron oxide, and zinc oxide was reduced to zinc at the same time. The iron oxide was further reduced to metallic iron after the zinc oxide reaction was nearly complete.
- The reduction process was divided into three parts based on the experimental data and the phase morphology analysis of the reduction product. The reduction process of the 0–15 min period was controlled by the reduction of zinc ferrite and the co-control of zinc oxide. The controlling step in the 15–30 min period was the reduction reaction of zinc oxide. The diffusion process determined the reaction rate in the 30–60 min period. The apparent activation energies of the three stages were measured to be 48.54 kJ/mol, 56.27 kJ/mol, and 105.33 kJ/mol, respectively.
Author Contributions
Conceptualization, Z.Z. and X.X.; formal analysis, S.M.; funding acquisition, Z.Z.; investigation, S.M.; methodology, S.M.; project administration, Z.Z.; software, S.X. and X.L.; validation, S.M.; visualization, S.X. and X.L.; writing—original draft, S.M.; writing—review and editing, X.X. All authors have read and agreed to the published version of the manuscript.
Funding
This research was funded by Shaanxi Provincial Science and Technology Department (grant number 2019TSLGY05-08 and 2020GY-166).
Data Availability Statement
Data sharing not applicable.
Acknowledgments
The authors are grateful to the Department of Science and Technology of Shaanxi Province and the Instrumental Analysis Center of Xi’an University of Architecture and Technology.
Conflicts of Interest
The authors declare no conflict of interest.
References
- Oustadakis, P.; Tsakiridis, P.; Katsiapi, A.; Agatzini-Leonardou, S. Hydrometallurgical process for zinc recovery from electric arc furnace dust (EAFD): Part I: Characterization and leaching by diluted sulphuric acid. J. Hazard. Mater. 2010, 179, 1–7. [Google Scholar] [CrossRef] [PubMed]
- Mantovani, M.; Takano, C.; Büchler, P. EAF and secondary dust characterisation. Process. Prod. Appl. 2004, 31, 325–332. [Google Scholar] [CrossRef]
- Dutra, A.; Paiva, P.; Tavares, L. Alkaline leaching of zinc from electric arc furnace steel dust. Miner. Eng. 2006, 19, 478–485. [Google Scholar] [CrossRef]
- Havlik, T.; Turzakova, M.; Stopic, S.; Friedrich, B. Atmospheric leaching of EAF dust with diluted sulphuric acid. Hydrometallurgy 2005, 77, 41–50. [Google Scholar] [CrossRef]
- Sofilić, T.; Rastovčan-Mioč, A.; Cerjan-Stefanović, Š.; Novosel-Radović, V.; Jenko, M. Characterization of steel mill electric-arc furnace dust. J. Hazard. Mater. 2004, 109, 59–70. [Google Scholar] [CrossRef] [PubMed]
- Xanthopoulos, P.; Agatzini-Leonardou, S.; Oustadakis, P.; Tsakiridis, P. Zinc recovery from purified electric arc furnace dust leach liquors by chemical precipitation. J. Environ. Chem. Eng. 2017, 5, 3550–3559. [Google Scholar] [CrossRef]
- Halli, P.; Hamuyuni, J.; Revitzer, H.; Lundström, M. Selection of leaching media for metal dissolution from electric arc furnace dust. J. Clean. Prod. 2017, 164, 265–276. [Google Scholar] [CrossRef]
- Nazari, A.; Shafyei, A.; Saidi, A. Recycling of electric arc furnace dust into glass-ceramic. Mater. Chem. Phys. 2018, 205, 436–441. [Google Scholar] [CrossRef]
- Wang, W.; Li, X.; He, Y.; Xi, H.; Wang, J.; Qiu, G. Effect of CaCO3 on volatilization of self-reduced zinc from blast furnace dust. J. Iron Steel Res. Int. 2022. [Google Scholar] [CrossRef]
- Zhang, H.; Li, J.; Xu, A.; Yang, Q.; He, D.; Tian, N. Carbothermic Reduction of Zinc and Iron Oxides in Electric Arc Furnace Dust. J. Iron Steel Res. Int. 2014, 21, 427–432. [Google Scholar] [CrossRef]
- Wang, C.; Guo, Y.; Wang, S.; Chen, F.; Tan, Y.; Zheng, F.; Yang, L. Characteristics of the reduction behavior of zinc ferrite and ammonia leaching after roasting. Int. J. Miner. Metall. Mater. 2020, 27, 26–36. [Google Scholar] [CrossRef]
- Zhang, H.; Hong, X. An overview for the utilization of wastes from stainless steel industries. Resour. Conserv. Recycl. 2011, 55, 745–754. [Google Scholar] [CrossRef]
- Morcali, M.; Yucel, O.; Aydin, A.; Derin, B. Carbothermic Reduction of Electric Arc Furnace Dust and Calcination of Waelz Oxide by Semi-Pilot Scale Rotary Furnace. J. Min. Metall. B 2012, 48, 173–184. [Google Scholar] [CrossRef]
- Zhang, R.; Li, X. Kinetics Simulation of Zn Extraction from Dust Dried in Blast Furnace by Carbothermic Reduction in Vacuum. J. Vac. Sci. Technol. 2014, 34, 53–59. [Google Scholar]
- Zhang, W.; Tian, Y.; Liu, D.; Wang, F.; Yang, B.; Xu, B. Experimental study on the thermal volatilization and condensation of zinc at 10 Pa and 200 Pa. J. Mater. Res. Technol. 2020, 9, 3590–3597. [Google Scholar] [CrossRef]
- Huang, R.; Liu, P.; Qian, X.; Zhang, J. Comprehensive utilization of Panzhihua ilmenite concentrate by vacuum carbothermic reduction. Vacuum 2016, 134, 20–24. [Google Scholar] [CrossRef]
- Xiong, L.; Xiang, Y.; Wu, X.; He, Z.; Yin, Z. Preparation of high purity zinc from zinc oxide ore by vacuum carbothermic reduction. Vacuum 2017, 146, 200–205. [Google Scholar] [CrossRef]
- Xiong, L.; Chen, Q.; Yin, Z.; Zhang, P. Thermodynamic analysis and experimental reseach on treatment of low-grade pb/zn oxide ore by vacuum carbothermic reduction. Asian J. Chem. 2009, 29, 64. [Google Scholar]
- Song, Q.; Zhang, L.; Xu, Z. Kinetic analysis on carbothermic reduction of GeO2 for germanium recovery from waste scraps. J. Clean. Prod. 2019, 207, 522–530. [Google Scholar] [CrossRef]
- Xie, W.; Chen, J.; Wang, H.; Zhang, X.; Peng, X.; Yang, Y. Kinetics of magnesium preparation by vacuum-assisted carbothermic reduction method. Rare Metals 2014, 35, 192–197. [Google Scholar] [CrossRef]
- Xiong, L.; Chen, Q.; Yin, Z.; Zhang, P. Vacuum Carbothermal Reduction Kinetics of Zinc Oxide Ore. Chem. Mater. Sci. 2010, 10, 133–137. [Google Scholar]
- Xing, X.; Du, Y.; Zheng, J.; Wang, S.; Ren, S.; Ju, J. Isothermal Carbothermal Reduction of FeTiO3 Doped with MgO. JOM 2021, 73, 1328–1336. [Google Scholar] [CrossRef]
- Huang, D.; Yang, X.; Yang, T.; Kong, L. Kinetics and modeling of the reduction process of carbon-containing pellets. Acta Metall. Sin. 1996, 32, 629. [Google Scholar]
- Liang, Z.; Tsai, H. Reduction of solid–solid thermal boundary resistance by inserting an interlayer. Int. J. Heat Mass Transf. 2012, 55, 2999–3007. [Google Scholar] [CrossRef]
Figure 1.
XRD pattern of the EAFD.

Figure 2.
Relationship between the standard Gibbs free energy and temperature for Equations (1)–(5).
Figure 2.
Relationship between the standard Gibbs free energy and temperature for Equations (1)–(5).

Figure 3.
The Gibbs free energy at different vacuum degrees.

Figure 4.
The experimental process.

Figure 5.
XRD patterns of the reduction products at different reduction times. (a) 0 min (b) 15 min (c) 30 min (d) 40 min (e) 50 min (f) 60 min.
Figure 5.
XRD patterns of the reduction products at different reduction times. (a) 0 min (b) 15 min (c) 30 min (d) 40 min (e) 50 min (f) 60 min.

Figure 6.
Changes in morphology of reduction products with time: (a) 15 min, (b) 30 min, (c) 40 min, (d) 50 min, (e) 60 min; (1) hollow region, (2) light white region, (3) dark gray region, (4) bright white region.
Figure 6.
Changes in morphology of reduction products with time: (a) 15 min, (b) 30 min, (c) 40 min, (d) 50 min, (e) 60 min; (1) hollow region, (2) light white region, (3) dark gray region, (4) bright white region.

Figure 7.
Condensate collected and XRD analysis: (a) condensate collected (b) XRD analysis.

Figure 8.
Effect of the reaction temperature (a) and reaction time (b) on zinc reduction ratio at 20 Pa.
Figure 8.
Effect of the reaction temperature (a) and reaction time (b) on zinc reduction ratio at 20 Pa.

Figure 9.
Relationship between F(α) and time at different temperatures: (a) 0 < t < 15 min; (b) 15 < t < 30 min; (c) 30 < t < 60 min.
Figure 9.
Relationship between F(α) and time at different temperatures: (a) 0 < t < 15 min; (b) 15 < t < 30 min; (c) 30 < t < 60 min.

Figure 10.
Linear fitting curves of the relationship between lnk and 1/T.

Figure 11.
Schematic diagram of the mechanism of vacuum carbothermic reduction of EAFD.


Table 1.
Composition of the EAFD used in the present study.
| Compound | Fe | Al | Si | Mg | Ca | Zn | Pb | S |
|---|---|---|---|---|---|---|---|---|
| Weight Percentage | 21.7 | 0.67 | 2.11 | 3.20 | 4.45 | 31.66 | 0.37 | 0.68 |
Table 2.
EDS results analysis of points 2–4 in Figure 6c, (atomic percent) %.
Table 2.
EDS results analysis of points 2–4 in Figure 6c, (atomic percent) %.
| Point | Fe | O | C | Zn | Ca | Si |
|---|---|---|---|---|---|---|
| 2 | 31.64 | 59.13 | 1.31 | 3.94 | 2.07 | 0.61 |
| 3 | 5.98 | 55.94 | 0.66 | 1.32 | 17.64 | 18.46 |
| 4 | 76.56 | 20.34 | 0.13 | 0.31 | 1.34 | 1.32 |
Table 3.
Mechanism functions of the reduction process.
| Symbol | F(α) | f(α) | Rate-Controlling Process |
|---|---|---|---|
| C | −ln(1 − α/3) | 1/(3 − α) | Carbon gasification reaction |
| D1 | [1 − (1 − α) 1/3]2 | 3/2(1 − α)2/3[1 − (1 − α)1/3] | Diffusion; Jander equation |
| D2 | (1 − 2α/3) − (1 − α)2/3 | 3/2[(1 − α)−1/3 − 1]−1 | Diffusion; Ginstling-Brounstein equation |
| R1 | 1 − (1 − α)1/2 | 2(1 − α)1/2 | Phase boundary reaction; cylindrical symmetry |
| R2 | 1 − (1 − α)1/3 | 3(1 − α)2/3 | Phase boundary reaction; spherical symmetry |
Table 4.
Values of R2 and RSS obtained from reduction ratios at 1173 K.
| Time/min | Mechanism Function | |||||||||
|---|---|---|---|---|---|---|---|---|---|---|
| C | D1 | D2 | R1 | R2 | ||||||
| R2 | RSS | R2 | RSS | R2 | RSS | R2 | RSS | R2 | RSS | |
| 0–60 | 0.855 | 2.05 × 10⁻² | 0.905 | 2.64 × 10⁻² | 0.903 | 8.06 × 10⁻² | 0.909 | 6.11 × 10⁻² | 0.924 | 3.6 × 10⁻² |
| 0–30 | 0.952 | 3.22 × 10⁻³ | 0.660 | 1.58 × 10⁻² | 0.738 | 4.97 × 10⁻² | 0.926 | 1.75 × 10⁻² | 0.900 | 1.43 × 10⁻² |
| 0–15 | 0.987 | 2.44 × 10⁻⁴ | 0.982 | 1.82 × 10⁻⁵ | 0.958 | 8.50 × 10⁻⁵ | 0.991 | 4.51 × 10⁻⁴ | 0.993 | 1.66 × 10⁻⁶ |
Table 5.
Values of R2 and RSS obtained from reduction ratios at 0–15 min.
| Temperature/K | Mechanism Function | |||||||||
|---|---|---|---|---|---|---|---|---|---|---|
| C | D1 | D2 | R1 | R2 | ||||||
| R2 | RSS | R2 | RSS | R2 | RSS | R2 | RSS | R2 | RSS | |
| 1223 | 0.970 | 2.13 × 10⁻⁴ | 0.952 | 1.34 × 10⁻⁴ | 0.968 | 2.06 × 10⁻⁴ | 0.987 | 6.11 × 10⁻⁴ | 0.996 | 1.38 × 10⁻⁵ |
| 1273 | 0.961 | 1.49 × 10⁻⁴ | 0.950 | 1.11 × 10⁻⁴ | 0.979 | 4.97 × 10⁻⁴ | 0.971 | 1.75 × 10⁻³ | 0.998 | 1.43 × 10⁻⁶ |
| 1323 | 0.961 | 1.27 × 10⁻⁴ | 0.968 | 4.23 × 10⁻⁵ | 0.969 | 6.49 × 10⁻⁵ | 0.964 | 8.95 × 10⁻⁴ | 0.999 | 5.96 × 10⁻⁷ |
| 1373 | 0.958 | 5.44 × 10⁻⁴ | 0.974 | 1.34 × 10⁻⁵ | 0.979 | 8.50 × 10⁻⁵ | 0.978 | 4.51 × 10⁻⁴ | 0.996 | 1.66 × 10⁻⁶ |
Publisher’s Note: MDPI stays neutral with regard to jurisdictional claims in published maps and institutional affiliations. |
© 2022 by the authors. Licensee MDPI, Basel, Switzerland. This article is an open access article distributed under the terms and conditions of the Creative Commons Attribution (CC BY) license (https://creativecommons.org/licenses/by/4.0/).
Share and Cite
MDPI and ACS Style
Ma, S.; Zhang, Z.; Xing, X.; Xu, S.; Li, X. Kinetic Analysis of Recovering Zinc from Electric Arc Furnace Dust by Vacuum Carbothermic Reduction at 20 Pa. Minerals 2022, 12, 261. https://0-doi-org.brum.beds.ac.uk/10.3390/min12020261
AMA Style
Ma S, Zhang Z, Xing X, Xu S, Li X. Kinetic Analysis of Recovering Zinc from Electric Arc Furnace Dust by Vacuum Carbothermic Reduction at 20 Pa. Minerals. 2022; 12(2):261. https://0-doi-org.brum.beds.ac.uk/10.3390/min12020261
Chicago/Turabian StyleMa, Shaobo, Zhaohui Zhang, Xiangdong Xing, Shuxiang Xu, and Xintao Li. 2022. "Kinetic Analysis of Recovering Zinc from Electric Arc Furnace Dust by Vacuum Carbothermic Reduction at 20 Pa" Minerals 12, no. 2: 261. https://0-doi-org.brum.beds.ac.uk/10.3390/min12020261
Note that from the first issue of 2016, this journal uses article numbers instead of page numbers. See further details here.