Article

Magnesium Coprecipitation with Calcite at Low Supersaturation: Implications for Mg-Enriched Water in Calcareous Soils

by
Mostafa Abdollahpour
1,†,
Frank Heberling
2,*,
Dieter Schild
2 and
Rasoul Rahnemaie
1,*
1
Department of Soil Science, Tarbiat Modares University, Tehran P.O. Box 14115-336, Iran
2
Institute for Nuclear Waste Disposal, Karlsruhe Institute of Technology, Hermann-von-Helmholtz Platz 1, 76344 Eggenstein-Leopoldshafen, Germany
*
Authors to whom correspondence should be addressed.
Visiting Scientist at Institute for Nuclear Waste Disposal, Karlsruhe Institute of Technology, Hermann-von-Helmholtz Platz 1, 76344 Eggenstein-Leopoldshafen, Germany.
Submission received: 22 October 2021 / Revised: 14 February 2022 / Accepted: 15 February 2022 / Published: 19 February 2022
(This article belongs to the Special Issue Ion Adsorption at Mineral–Water Interfaces)

Abstract

:
The concentrations of magnesium (Mg) and calcium (Ca) in natural aqueous environments are controlled by sorption and dissolution–precipitation reactions. Ca binding in calcareous soils depends on the degree of solution saturation with respect to CaCO3. Mg may be bound in precipitating calcite. Here, we investigated Mg incorporation into calcite via the recrystallization of vaterite, which simulates a very low supersaturation in a wide range of Mg to Ca ratios and pH conditions. Increasing the Mg to Ca ratios (0.2 to 10) decreased the partition coefficient of Mg in calcite from 0.03 to 0.005. An approximate thermodynamic mixing parameter (Guggenheim a0 = 3.3 ± 0.2), that is valid for dilute systems was derived from the experiments at the lowest initial Mg to Ca ratio (i.e., 0.2). At elevated Mg to Ca ratios, aragonite was preferentially formed, indicating kinetic controls on Mg partitioning into Mg-calcite. Scanning electron microscopy (SEM-EDX) analyses indicated that Mg is not incorporated into aragonite. The thermodynamic mixing model suggests that at elevated Mg to Ca ratio (i.e., ≥1) Mg-calcite becomes unstable relative to pure aragonite. Finally, our results suggest that the abiotic incorporation of Mg into calcite is only effective for the removal of Mg from aqueous environments like calcareous soil solution, if the initial Mg to Ca ratio is already low.

Graphical Abstract

1. Introduction

Calcite, aragonite, and vaterite are the major polymorphs of calcium carbonate. Among them, calcite is the most stable and abundant form at ambient conditions. In some marine and terrestrial systems, where biotic or abiotic kinetically controlled processes control the formation of aragonite, it may be present as the major polymorph [1,2]. The presence of aragonite in soil is, however, attributed to formation at a high temperature and/or sufficiently high Mg concentration [3,4]. The last form, vaterite, is a metastable mineral and rarely found in natural environments [1]. Hence, vaterite and aragonite are considered to be precursors for calcite formation via Ostwald ripening [5,6]. Ostwald ripening leads to the dissolution of metastable polymorphs of calcium carbonate (vaterite) and the subsequent crystallization of stable polymorphs [6] (calcite and/or aragonite, depending on solution conditions).
Due to the high solubility of carbonate minerals and daily variations in soil water content, the dissolution and precipitation of carbonate minerals frequently occur in calcareous soils and sediments. The calcium concentration varies as these processes occur. Ions other than Ca may also be sequestered by coprecipitation. The extent of ion sequestration depends on ion concentrations and may vary from trace (like heavy metals) to major components (like magnesium (Mg)). Typically, Mg, strontium (Sr), and manganese (Mn) are major impurities in natural calcites [1]. Natural calcite with a considerable amount of Mg in its structure is usually called Mg-calcite [1,2]. In marine environments, where the Mg concentration is relatively high, ~50 mmol/L ≅ 5 × Ca concentration [7,8], the formation of Mg-calcites is common [1]. Mg coprecipitation with calcite has been extensively studied in the context of marine environments [9]. These results are not directly transferable to terrestrial systems, where low supersaturation conditions are omnipresent in the soil solution of calcareous soils.
Groundwater is the major source of irrigation water in arid and semi-arid regions [10]. The quality of groundwater thus dominantly affects the salt accumulation or migration in the soil profiles [11,12]. Recent investigations have shown an important shift in the ionic composition of irrigation water towards relatively high concentrations of Mg, such that the Mg to Ca ratio exceeds unity [13,14]. Using Mg-enriched irrigation water gradually changes the ionic composition of the soil solution, as well as the composition of exchangeable ions in the solid phase (i.e., clays) [15]. At the same time, this process may affect the composition of precipitated calcium carbonate, leading to the formation of Mg-calcite and/or other polymorphs. These reactions affect the solubility of minerals and, in turn, the equilibrium concentration of ions. Therefore, the solution speciation predicted with thermodynamically valid solubility constants for pure phases may not correctly simulate real solution speciation.
The interaction of Mg with calcite has been studied using microscopic and spectroscopic techniques, as well as with kinetic models [8,16,17]. Typically, a partition coefficient is used to quantify the amount of foreign ions (e.g., Mg) in the calcite structure [9,18,19]. The high variability in Mg uptake that has been previously reported can be attributed to differences in experimental conditions such as supersaturation conditions and methods of preparing Mg-calcite. Synthesizing Mg-calcite at a relatively high supersaturation (Ω ≈ 50, Ω is defined in Equation (2)) usually incorporates low amounts of Mg into the calcite structure (≈0–1 mole %) compared to very high supersaturation (Ω > 200), which leads to the incorporation of significant amounts of Mg (≈14 mole %) [20,21]. The equilibrium pH may also affect the incorporation rate. Keeping the pH constant even at very low supersaturation (Ω = 5–11) induces Mg incorporation (7–10 mol%) [9]. Moreover, the incorporation rate can be controlled by changes in the solution chemistry, precipitation rate, and temperature [19]. For instance, an increase in the Mg to Ca ratio in a solution leads to a decrease in partition coefficients [9] and could reduce the calcite growth rates [1,9,18] by inhibiting calcite nucleation via Mg adsorption on growth sites, distortion of the calcite lattice, changes in the surface charge, and cation dehydration [22]. As a result, in the presence of Mg ions, calcite morphology may change, and new faces may develop on edges and corners [19].
Prolonged drought and the unbalanced use of groundwater as irrigation water may lead to changes in the ionic composition of groundwater. In some arid and semi-arid regions, with abundant calcareous soils, such changes often imply a relative increase in the aqueous Mg ion concentration and the aqueous Mg to Ca ratio. Subsequently, such processes are expected to have a long-term effect on the carbonate minerals in the respective soils. The aim of this study was, therefore, to investigate the impact of the aqueous Mg to Ca ratio on newly forming calcium carbonate minerals and to quantify the resulting Mg-uptake at conditions relevant for calcareous soils in arid- and semi-arid regions.
To facilitate the experimental procedure, the recrystallization of metastable vaterite to calcite (or aragonite) (according to the Ostwald ripening process) is employed in order to enable calcite (or aragonite) growth in simple batch-type experiments at five Mg to Ca ratios, three different pH conditions, and in the absence and presence of kaolinite and bentonite. This experimental method simulates low supersaturation (Ω = 3–4). Vaterite is not regarded as a component of interest in the investigated chemical system. Rather, it is the source that provides a constant supply of calcium (Ca) and carbonate ions at constant supersaturation with respect to calcite (and aragonite), as dictated by the differences in the solubility products of the respective polymorphs, and thus enables constant crystal growth at low supersaturation in very simple batch-type experiments. The Mg uptake is quantified via both solution chemistry and the digestion of Mg-doped calcium carbonate. In addition, the Mg-doped precipitates are characterized by X-ray diffraction and Rietveld refinement, as well as by scanning electron microscopy (SEM-EDX). On the basis of the experimental results, a regular mixing model for the dilute (Mg,Ca)CO3 solid solution is suggested.

2. Materials and Methods

2.1. Synthesis of Vaterite

Vaterite was synthesized by a rapid mixing of 10-mL 0.33-M CaCl2 (CaCl2·2H2O, p.a., from Merck KGaA, Darmstadt, Germany) and 10-mL 0.33-M Na2CO3, (Na2CO3, anhydrous, p.a., from Merck KGaA, Darmstadt, Germany) in a water/ethylene glycol (80/20%, v/v) mixture [23] (ethylene glycol, p.a., Merck KGaA, Darmstadt, Germany). After less than one minute of mixing, the precipitated solid phase was removed from the solution by filtration using a 10-µm Millipore® filter paper (Merck KGaA, Darmstadt, Germany) and a suction pump. The solid phase was washed with a water and ethanol (50/50%, v/v) mixture (ethanol absolute, Merck KGaA, Darmstadt, Germany) and dried at 60 °C. X-ray diffraction of the originally synthesized solid phase (Figure S1), shows that about 98% of the solid phase is vaterite. MilliQ water (18.2 MΩ∙cm, <4 ppb DOC) was used for the preparation of the solutions. The experiments were carried out at room temperature (20 ± 1 °C).

2.2. Mg-Calcite Coprecipitation Experiments

To evaluate the effect of a Mg to Ca ratio on Mg incorporation into calcite, solutions with five initial Mg to Ca ratios (0.2, 1, 2, 5, and 10) were reacted with vaterite (1 g/L) to simulate the relevant conditions for the precipitation of solid phases in soils, irrigated with Mg-enriched water. In these experiments, Ca2+ is provided by vaterite dissolution (log10 Ksp = −7.91). The Ca concentrations provided by vaterite dissolution were calculated by PHREEQC (Version 2, US Geological Survey, Reston, VA, USA [24]) and the PSI/Nagra chemical thermodynamic database [25]. The calculated Ca concentrations at pH 7.5, 8, and 9 were 5, 2.5, and 0.8 mmol/L, respectively (assuming equilibrium with atmospheric CO2). The pH of the suspensions was adjusted to 7.5, 8, and 9 by adding precalculated volumes of HCl to the centrifuge tubes (50 mL) (dilutions from HCl, 1M, Titrisol, Merck, KGaA, Darmstadt, Germany). The amount of added Mg2+ (MgCl2·6H2O, p.a., Merck, KGaA, Darmstadt, Germany) at each Mg to Ca ratio was chosen based on the expected (calculated) Ca2+ concentration. After solution preparation, a mass of 0.04 g of vaterite was added to the centrifuge tube to obtain a 1-g/L suspension. In the experiments, a low supersaturation with respect to calcite (Ω     3 to 4) was established due to vaterite dissolution. All the experiments were carried out at a 0.025-mol/L NaCl background electrolyte concentration.
The saturation indices (SI) of the solutions (Equation (1)) were calculated using PHREEQC.
S I calcite = log ( I A P K S P ( calcite ) )
The saturation state (Ω) of the solutions with respect to calcite (Equation (2)) was subsequently obtained as
Ω calcite = I A P K S P ( calcite ) = 10 S I
where IAP is the activity product of Ca2+ and CO32− ions, as calculated by PHREEQC, and K S P ( calcite ) is the solubility product of calcite ( K S P ( calcite ) = 10 8.48 ) .
The suspensions were shaken at 20 rpm for 7 days, and then centrifuged. The supernatants were collected to measure the equilibrium pH, total dissolved concentrations of Ca2+ and Mg2+, and total inorganic carbon (TIC). The concentrations of Ca and Mg in the supernatants were measured by ICP-OES (Perkin Elmer, optima 8300). The total inorganic carbon was measured by expulsion with phosphoric acid.

2.3. Mineralogy and Morphology of the Precipitated Solid Phase

Solids were separated from the solution by centrifugation. To eliminate soluble salts from the precipitated solid phase, a volume of 5 mL of ethanol was added to the solid after centrifugation and decantation. The suspensions were rapidly shaken and centrifuged again. The supernatants were discarded, and the solid was air-dried. An aliquot of the solid (10 mg) was transferred to centrifuge tubes and digested with 10-mL 0.1-M HCl in order to determine the contents of Ca and Mg in the solid by ICP-OES and ICP-MS (Thermo Element XR), respectively. The remaining solids were characterized by X-ray powder diffraction (XRD, BRUKER D8-advance, Karlsruhe, Germany), scanning electron microscopy (SEM-EDX, FEI Quanta 650 FEG environmental SEM, Eindhoven, The Netherlands). SEM-EDX spectra of selected areas were acquired by use of a Thermo Scientific UltraDryTM silicon drift X-ray detector (Peltier cooled) and analyzed by Thermo Fisher Scientific Pathfinder software, version 2.8. Rietveld refinement (using the TOPAS 6.0 software, BRUKER, Karlsruhe, Germany) was used to quantify the solid-phase composition (i.e., vaterite/aragonite/calcite ratio) and to characterize the resulting calcite.
In this study, the incorporation of Mg into calcite is expressed as (Equation (3)):
( 1 X Mg C ) Ca 2 + + X Mg C Mg 2 + + CO 3 2   Ca ( 1 X Mg C ) Mg X Mg C CO 3
where X Mg C is the mole fraction of MgCO3 in the precipitated solid.

2.4. The Partition Coefficient of Mg in the Calcite Structure

The homogeneous Henderson–Kracek partition coefficient (D) (Equation (4)) for Mg between calcite and the solution phase was used to quantify Mg incorporation into calcite.
D = X Mg C / X Ca C M Mg L / M Ca L
X Ca C is the mole fraction of Ca in the solid (calcite), and M Mg L and M Ca L , are the molar equilibrium concentrations of Mg and Ca ions in the solution, respectively.
X Ca C is calculated from the known mole fraction of Mg in the solid (calcite):
X Ca C = 1 X Mg C
In this study, X Mg C was obtained by two methods:
A: by calculating the magnesium percentage in calcite from digestion and the subsequent solution analysis (X1). The percent mole fraction of Mg incorporated into the solid is then given by Equation (6):
X 1 = [ Mg ] ( Mg calcite %   × [ Ca ] ) + [ Mg ]
where [Ca] and [Mg] are the concentrations of Ca and Mg ions in the solution after digestion as measured by ICP-OES and ICP-MS (iCAPTM TQ ICP-MS, Thermo Fisher Scientific, Waltham, MA, USA), respectively. Mg-calcite% is the percentage of Mg-calcite in the solid phase, as obtained from Rietveld refinement of the XRD data. Method A assumes (as supported by SEM-EDX) that Mg is incorporated only into calcite and not into vaterite or aragonite.
B: by using SEM-EDX results to calculate X Mg C and (X2) using Equation (7):
X 2 = Mg   atom   % Ca   atom   %   +   Mg   atom   %
where Mg and Ca atom % are the fractions of Mg and Ca measured at various points on Mg-calcite crystals by SEM-EDX.

2.5. Modeling

Experimental partition coefficients were further used to calculate the dimensionless Guggenheim parameter, a0 (Equation (8)), which characterizes the non-ideality of the Mg-calcite solid solution (as described, e.g., in Heberling et al. [26]).
a 0 = ( exp ( K S P ( magnesite ) K S P ( calcite ) × D ) ) / ( 2 × X Mg C 1 )
where K S P ( calcite ) and K S P ( magnesite ) are the solubility products of calcite and magnesite (KSP(magnesite) = 10−8.29), respectively [27].
The free energy of mixing, dGM (Equation (9)), of the precipitated Mg-calcite is described relative to the free energy of a hypothetical mechanical mixture of equal composition without any molecular interactions between the components [28]. It was assumed that the dilute Mg-calcite is a mixture between magnesite and calcite.
d G ( ( Mg , Ca ) CO 3 )   ( X Mg C ) = X Mg C   d G 0   ( magnesite ) + ( 1 X Mg C )   d G 0   ( calcite ) + d G M   ( X Mg C )
The quantities dG0 (magnesite) and dG0 (calcite) are standard free energies of formation at 298 K for magnesite (−1030.6 kJ/mol) and calcite (−1128.8 kJ/mol), respectively.
dGM can be decomposed into an ideal free energy of mixing ( d G id M ) and an excess free energy of mixing (dGE).
d G M = d G id M + d G E
For the dilute Mg-calcite, we assume random mixing. Then, the entropy contribution to d G id M   can be calculated as:
d G id M ( X Mg C ) = R T   [ X Mg   ln   ( X Mg C ) + ( 1 X Mg C )   ln   ( 1 X Mg C ) ]
where R and T are the universal gas constant (R = 8.3145 J/mol/K) and the absolute temperature (K), respectively.
For nonideal solid solutions, Guggenheim [29] proposed to describe dGE by:
d G E = X Mg C X Ca C R T [ a 0 + a 1 ( X Mg C X Ca C ) + a 2 ( X Mg C X Ca C ) 2 + ]
This relates the free energy calculations to the Guggenheim parameter, a0, which we determined from experimental partition coefficients (Equation (8)). Higher order parameters were not considered (a1 = a2 … = 0). Combining Equations (4)–(8) with Equations (9)–(12) allows calculating the free energy of the Mg-calcite solid solution on the basis of the experimental results.

2.6. Incorporation of Mg2+ in Calcite in the Presence of Clay Minerals

To evaluate the effect of clay minerals in soils on the incorporation of Mg2+ into calcite, four solutions with varying Mg to Ca ratios (0.2, 1, 2, and 5) were equilibrated with vaterite in the presence of either bentonite or kaolinite. Georgia kaolinite (KGa-1) was obtained from the Source Clay Repository of the Clay Minerals Society. Its specific surface area determined by BET (N2 adsorption, Quantachrome Autosorb Gas Sorption System, Quantachrome, Odelzhausen, Germany) was found to be 15.6 m2/g. The cation exchange capacity (CEC) of KGa-1 was 0.015 molc/kg. Bentonite (Na-montmorillonite) was obtained from LEM (Laboratoire Environnement et Mineralurgie, Nancy, France). The specific surface area and CEC for this bentonite were 75.4 m2/g and 0.9 molc/kg, respectively.
To investigate the effects of kaolinite and bentonite clays, the procedure was as described in Section 2.2. The pH of the suspension was adjusted to 8 by adding HCl. Known amounts of bentonite or kaolinite were added to the centrifuge tubes (50 mL) to obtain 0.2- and 1-g/L suspensions for each clay. After 24 h of equilibration time, an amount yielding 1 g/L of vaterite was added. Suspensions were shaken at low speed for 7 days, then centrifuged. The supernatants were collected to measure the final pH and the concentrations of Ca, Mg, and TIC. The solid phase was washed with 5-mL ethanol to remove the soluble salts and then air-dried. Finally, a mass of 10 mg of the solid phases was introduced into 10-mL 0.1-M HCl to measure the concentrations of the Ca and Mg ions incorporated in the carbonate phases, and the solid was characterized by XRD and SEM-EDX.

3. Results

3.1. Magnesium Coprecipitation with Calcite

The equilibrium Ca and Mg concentrations were lower compared to their initial values (as shown in Table 1). The saturation state of the solutions with respect to pure calcite at the end of the experiments was higher than 1 (Ω > 1) and increased with increasing the Mg to Ca ratio, indicating incomplete equilibration during the experimental period.
The maximum Mg incorporation was found at a Mg to Ca ratio of 0.2 (Table 1 and Figure 1a). As will be shown later, this is because, at the lowest Mg to Ca ratio, Mg-calcite formation is more pronounced than at higher ratios. For Mg to Ca ratios above 2, the amount of Mg incorporated in the precipitated solid slightly increased proportional with its solution concentration. No obvious trend was observed for the incorporated Mg concentration with increasing pH. Based on mass balance calculations, a notable agreement exists between the Mg removed from the solution and the Mg incorporated into the solid (as determined by the digestion method) for the Mg to Ca ratio of 0.2 with a relatively small experimental error. No significant difference was found between the initial and the equilibrium Mg concentrations for higher Mg to Ca ratios. Figure 1b indicates that the equilibrium Mg to Ca ratio in solution is approximately twice the initial Mg to Ca ratio.

3.2. Mineralogy and Morphology of the Precipitated Solid

3.2.1. X-ray Powder Diffraction (XRD)

Selected XRD patterns of the precipitated solids are shown in Figure 2. The quantitative analyses of the calcium carbonate polymorphs are presented in Table 2. At the lowest Mg to Ca ratio (i.e., 0.2), Mg-calcite is the dominant precipitated solid phase (75–83%), with 17–25% of aragonite and no characteristic peaks of the other phases. At higher Mg to Ca ratios (>0.2), an obvious change in the mineralogy of the precipitated solids was observed. The X-ray diffraction patterns showed that the precipitated solids comprised 4 to 5% Mg-calcite and 95 to 96% aragonite. At the highest Mg to Ca ratio (i.e., 10), the diffraction patterns showed 2 to 3% Mg-calcite, 64–85% aragonite, and 13–34% vaterite. These data imply that Mg to Ca ratios >0.2 prevent Mg-calcite formation, and that aragonite precipitation is preferred. At the highest Mg to Ca ratio, even vaterite remains stable over 7 days. The XRD patterns also indicate that pH has no significant effect on the composition with respect to crystalline polymorphs.

3.2.2. Morphology of the Precipitated Solids

SEM images of the precipitated solids are presented in Figure 3. In agreement with the X-ray diffraction data, the morphology of the precipitated solids changes with increasing the Mg concentration in the solution. When the ratio is 0.2, Mg is incorporated into the calcite structure, and new faces develop at the edges and corners (Figure 3a) compared to the expected rhombohedral morphology of pure calcite. At the higher Mg to Ca ratios, i.e., 1, 2, 5, and 10, considerable changes in the shape and kind of calcium carbonate polymorph formation can be observed. At these ratios, hexagonal prismatic and needle-like aragonite crystals are formed. SEM-EDX analyses (Figure S2) demonstrate that aragonite, formed at high Mg to Ca ratios, does not contain measurable amounts of Mg (<0.1 atom %).

3.3. Mole Fractions and Partition Coefficients

The mole fractions of Mg in the precipitated solids and the concomitant partition coefficients ( D ) are presented in Table 3. The mole fractions slightly increase with increasing the Mg to Ca ratio. As such, at the Mg to Ca ratio of 0.2, the average mole fraction of Mg is nearly 1 mole % MgCO3, but at the Mg to Ca ratio of 10, this value increases to nearly 10 mole % MgCO3. The calculated D values, however, decrease with the increasing Mg to Ca ratio and appear to be pH-independent. The D values determined from the SEM-EDX results (Method B) are systematically lower than those calculated from Method A but show the same trend.
The calculated dimensionless Guggenheim parameters determined from both the Mg percentage in calcite from digestion and SEM-EDX results are presented in Table 3. We obtained relatively high dimensionless interaction parameters (3 < a0 < 7) indicating that calcite and magnesite form a nonideal solid solution. As will be discussed below, the average dimensionless Guggenheim parameter for the lowest Mg to Ca ratio (i.e., 0.2), a0 = 3.3 ± 0.2, is assumed to be the best estimate for an equilibrium value.
The thermodynamic characteristics of (Mg,Ca)CO3 in Table 3 show that, with increasing the Mg to Ca ratios in a solution, the calculated free energy of the precipitated solids increases. As such, at the lowest Mg to Ca ratio (i.e., 0.2), where the dominant precipitated solid is Mg-calcite (Table 2), we obtained a similar free energy as aragonite (i.e., −1128.3 KJ/mol). Therefore, Mg-calcite containing less than 1 mole % MgCO3 is thermodynamically as stable as aragonite. At Mg to Ca ratios of 1 and 2, the calculated free energies indicate that the precipitated solids become less stable than aragonite but are more stable than vaterite (−1125.8 KJ/mol). Correspondingly, when Mg-calcite becomes thermodynamically less stable than aragonite, aragonite precipitates as a stable phase. At higher Mg to Ca ratios (i.e., 5, and 10), the predicted Mg-calcite becomes even unstable with respect to vaterite.
In order to properly address the effect of supersaturation on the formation of Mg-calcite, the supersaturation with respect to the solid solution needs to be considered rather than the supersaturation with respect to pure calcite. According to Prieto [30], the stoichiometric saturation state of an aqueous solution with respect to a solid solution is given by Equation (13).
Ω s t = I A P s t K s t = a C a 1 X   a M g X   a C O 3 ( K S P ( magnesite ) γ M g X M g ) X M g × ( K S P ( calcite ) γ C a X C a ) X C a
where K s t is the stoichiometric solubility product, and γ M g and γ C a are the activity coefficients of Mg and Ca in the solid, which can be expressed via a Guggenheim expansion series, Equations (14) and (15) [30]:
ln γ M g = X C a 2 [ a 0 a 1 ( 3 X M g X C a ) + a 2 ( X M g X C a ) ( 5 X M g X C a ) + ]
ln γ C a = X M g 2 [ a 0 a 1 ( 3 X C a X M g ) + a 2 ( X C a X M g ) ( 5 X C a X M g ) + ]
As pointed out earlier, higher order parameters (i.e., a1, a2, and …) were not considered. The calculated stoichiometric saturation states in Table 3 indicate that all the experimental aqueous solutions are supersaturated with respect to Mg-calcite (Ωst > 1). This explains the kinetically driven formation of Mg-calcite, even though it may be metastable with respect to aragonite. The elevated Mg-solution concentrations thus play an active role in the formation of the solid solution and an indirect role in the formation of aragonite.

3.4. Effects of Clays on Mg Coprecipitation with Calcite

The ionic composition of the solution phases with four initial Mg to Ca ratios (i.e., 0.2, 1, 2, and 5) equilibrated with 1 g/L of vaterite at an average actual pH of 8.8 in the presence of 0.2 and 1 g/L of either kaolinite or bentonite are presented in the electronic Annex 1 (Table S1). No additional information on Mg incorporation into calcite was obtained from the experiments in the presence of clay minerals in the coprecipitation experiments.
The XRD results on the precipitated solids in the presence of the clays are presented in Table S1. The presence of clay minerals suppresses the formation of Mg-calcite at a low Mg to Ca ratio. For kaolinite, this effect is not pronounced at a clay content of 0.2 g/L but becomes clearly visible at a clay content of 1 g/L. Bentonite is more effective in that sense and leads to a significant reduction in the Mg-calcite content even at a clay content of 0.2 g/L and to a very strong reduction at 1 g/L. For high Mg to Ca ratios, Mg-calcite formation is similar to that in the absence of clay particles.

4. Discussion

In contrast to previous studies, which involved slightly higher supersaturation [9], our experiments aimed at simulating the effect of Mg to Ca ratios on the formation of calcite polymorphs in groundwater like media and were carried out at relatively low supersaturation (Ω = 3 to 4). Such low supersaturations were realized by using vaterite as a precursor of calcite formation [6].
The results obtained for the Mg coprecipitation experiments with calcite yielded a white precipitate, which consisted of Mg-calcite, aragonite, and vaterite, depending on the Mg to Ca ratio of the solution phase. Only calcite incorporated significant amounts of Mg2+ ions. The amount of Mg incorporation was controlled by the Mg to Ca concentration ratio in the solution. As such, the mole fraction of Mg in Mg-calcite increased with the increasing Mg to Ca ratios. The same trend has been reported in earlier studies at higher supersaturations [2,9,19]. For example, Mucci and Morse [9] reported that the amount of Mg incorporated in the calcite structure increased from 2.7 to 11.2% when increasing the solution Mg to Ca ratio from 1 to 10.3.
The Mg to Ca ratio in solution affected the morphology of the CaCO3 polymorphs. At the lowest Mg to Ca ratio (i.e., 0.2), the morphologies of the precipitated solid differ from that of pure calcite (rhombohedral morphology). At this ratio, the modification involves new faces on the edges and corners as stepped and kinked surfaces. Similar morphological changes in the presence of low Mg concentration were observed by Zhang and Dawe [19]. The formation of stepped and kinked surfaces indicates a higher affinity of some edges and corner sites for Mg incorporation, as suggested earlier [18,19]. As the Mg concentration increases (i.e., at a Mg to Ca ratio larger than 0.2), aragonite becomes the dominant CaCO3 polymorph. Previous studies based on the same concept of calcite crystallization from a vaterite precursor in the absence of Mg have showed that the vaterite-calcite transformation in aqueous solution at room temperature was completed in less than two days, and aragonite was not observed at any stage of the transformation [31]. Therefore, it can be confirmed that the presence of Mg inhibits calcite formation, while aragonite formation is favored. The SEM-EDX analyses of precipitated solids at Mg to Ca ratios above 0.2 revealed that Mg ions are not incorporated into aragonite. Aragonite precipitation is, thus, not much affected by Mg ions and can outcompete calcite precipitation. The formation thermodynamics of (Mg,Ca)CO3 (see below) indicate that, with increasing the Mg incorporation into calcite, the forming Mg-calcite becomes less stable than aragonite, which offers a likely explanation for the experimental observations. The results indicated that, at about 1 mole % Mg content, Mg-calcite becomes more soluble than aragonite, but they also showed that low amounts of Mg-calcite with up to 12 mole % may form via kinetic controls.
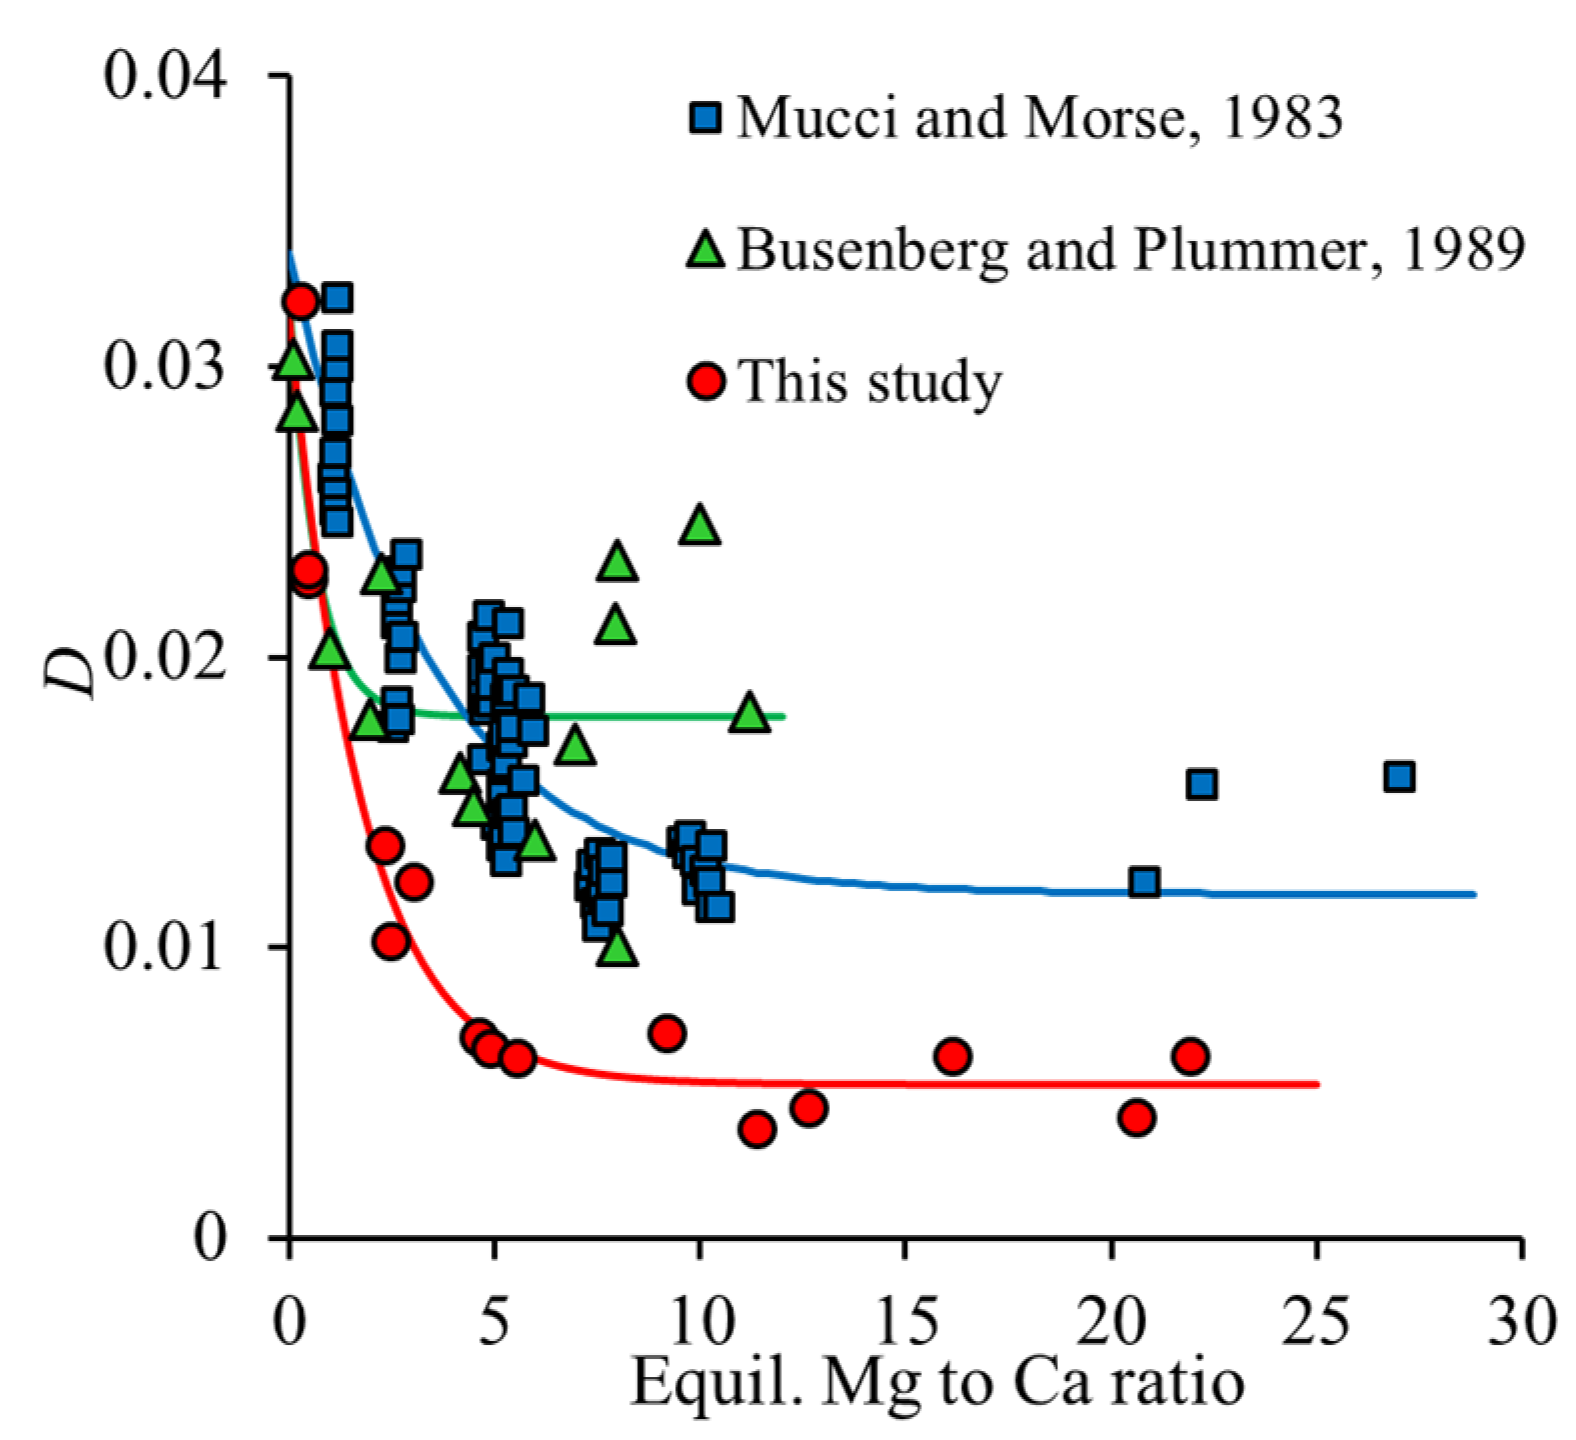
As shown in Figure 4, a decrease in the calculated D values was observed as a function of the Mg to Ca ratio in the solution. For comparison, the experimental data of Mucci and Morse [9], obtained in seawater at a slightly higher supersaturation (Ω     3–17), are also presented in Figure 4. The same trend and comparable partition coefficients were observed by Busenberg and Plummer [27]. The derived partition coefficients of our study were systematically lower than those reported by Mucci and Morse [9] or Busenberg and Plummer [27]. The averages were 1.1 × 10⁻², 1.79 × 10⁻², and 2.0 × 10⁻², respectively. We suggest that this difference mainly reflects the expected kinetic effect that higher supersaturation leads to higher partition coefficients during the incorporation of ions, for which incorporation is unfavorable, i.e., D < 1 [32].
All D values are considerably lower than what would be expected for an ideal solid solution. With log(Ksp(magnesite)) = −8.29 and log(Ksp(calcite)) = −8.48, Dideal is 1.55.
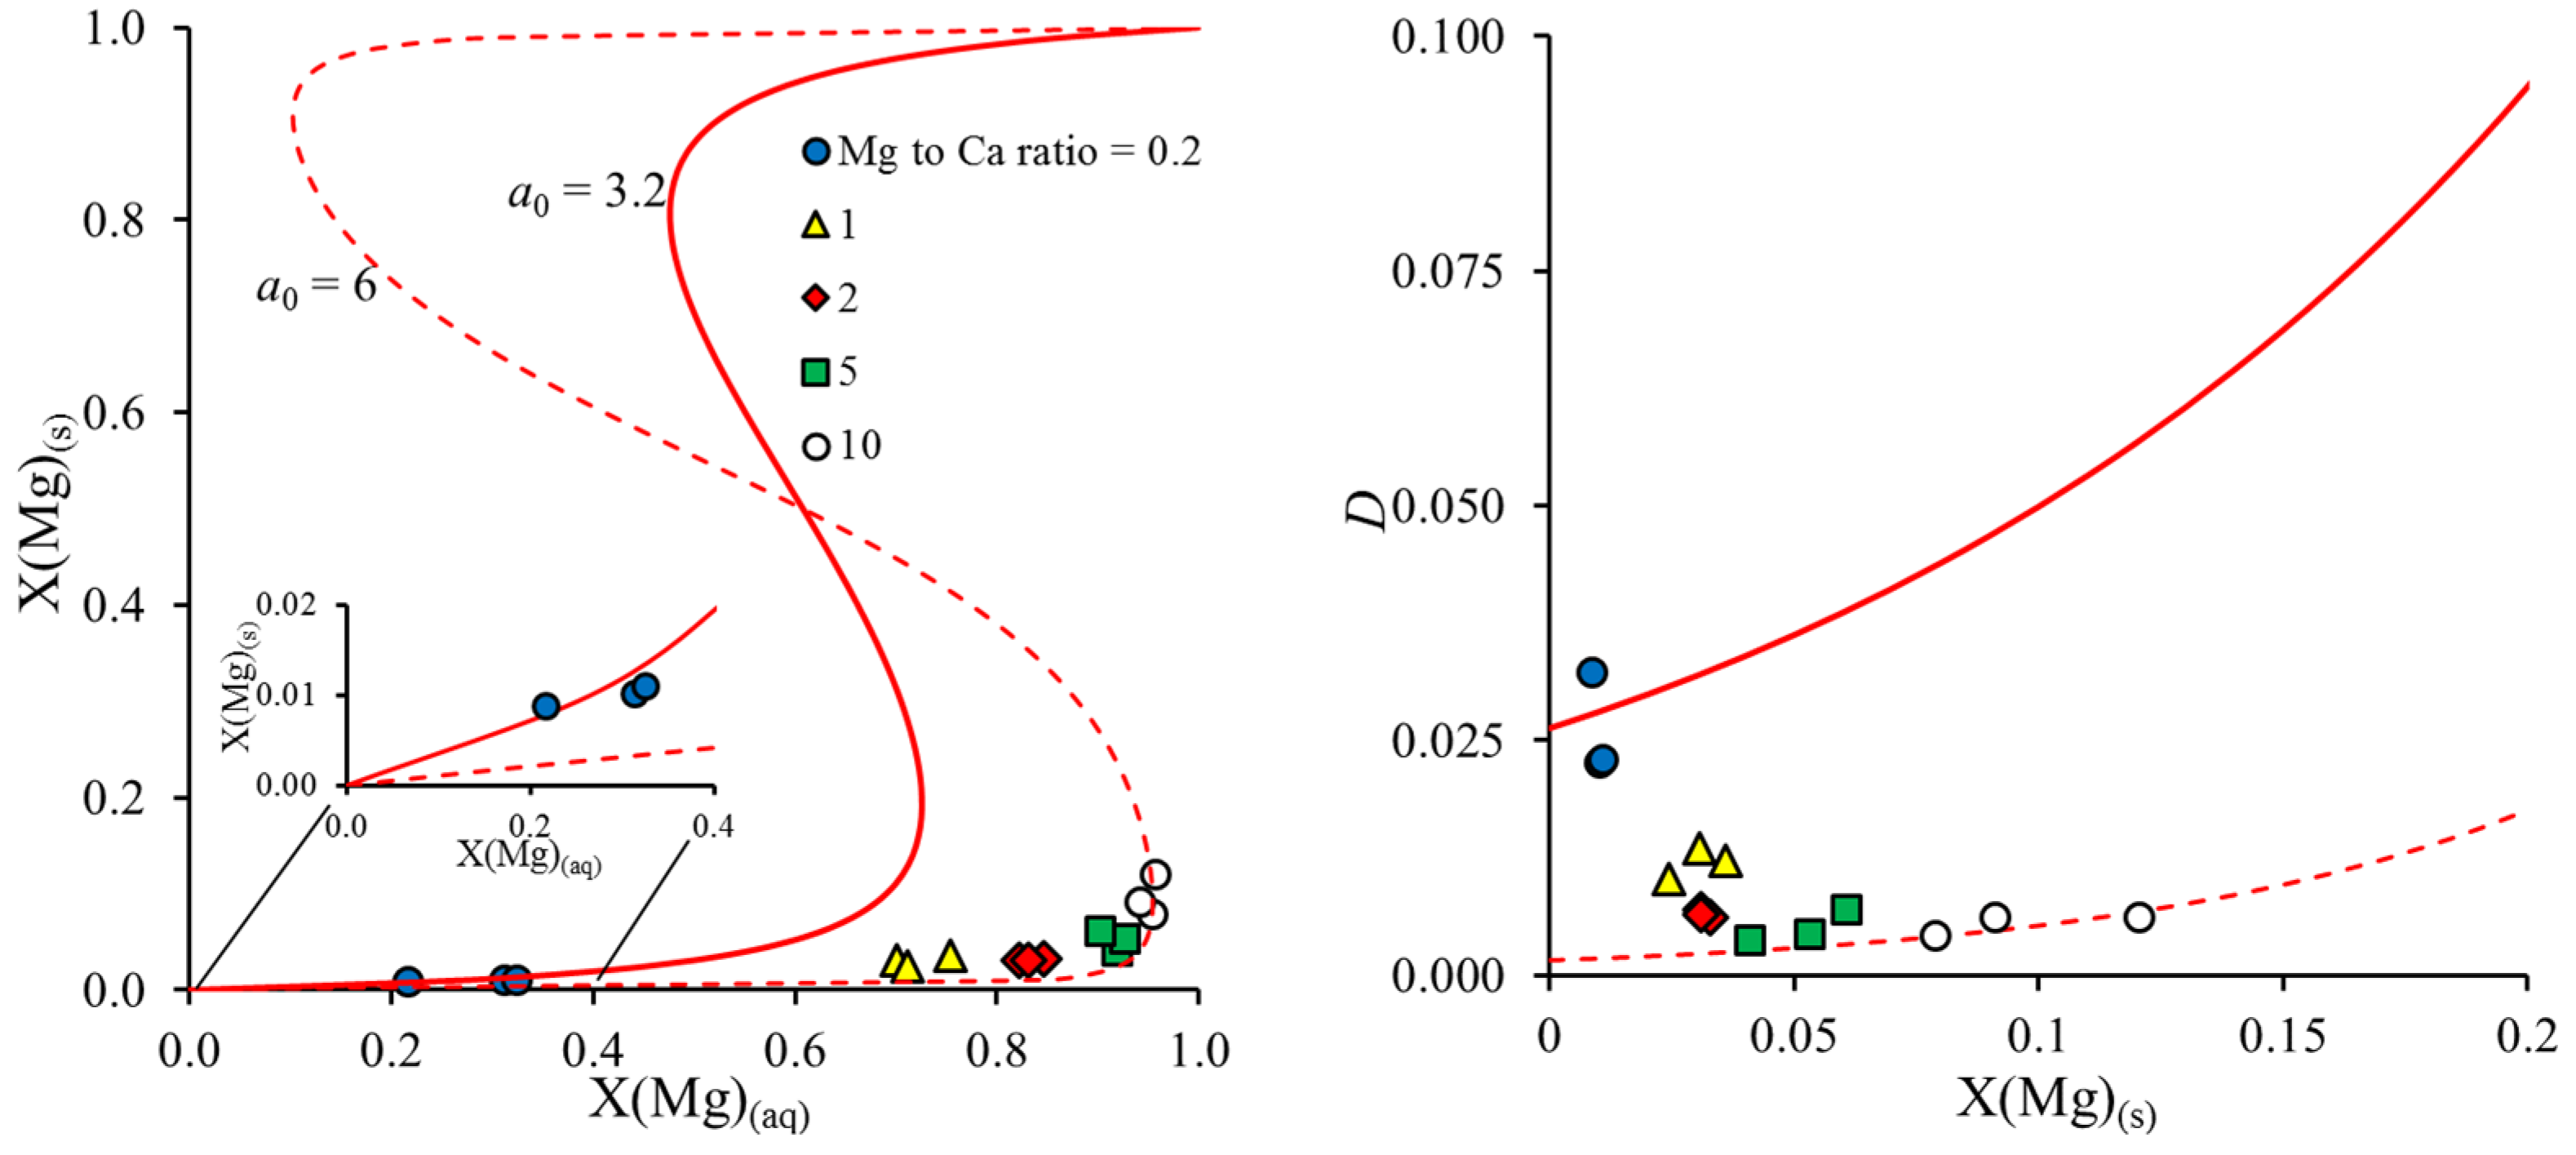
In general, a decrease in the partition coefficient with the increasing Mg content of the solid disagrees with the expected trend of thermodynamic solid solution models, as indicated in Figure 5 (right graph, solid line). The data plotted in Figure 4 indicate that partition coefficients at elevated Mg to Ca ratios showed a stronger influence on supersaturation, while, at the lowest Mg to Ca ratios, comparable values around D = 0.03 were obtained in this study, by Mucci and Morse [9], and by Busenberg and Plummer [27] (i.e., for their Group I Mg-calcites in NaCl solution), independent of the degree of supersaturation. Thus, we suggest that the highest partition coefficients, obtained at the lowest Mg to Ca ratio, provide the best estimate for a thermodynamic value. Correspondingly, we used the value of a0 = 3.3 ± 0.2 for further thermodynamic calculations. As pointed out previously [27], this parameter is only applicable for dilute Mg-calcites (<ca. 1 mole % Mg). The corresponding thermodynamic model predicts a large miscibility gap from 5 to 95% MgCO3 in calcite and a spinodal gap from 19 to 81% MgCO3 in calcite. Experiments at higher initial Mg to Ca ratios in a solution mostly fall into the spinodal gap, as indicated in the Rozeboom diagram (Figure 5). However, instead of the formation of a Mg-rich solid solution, aragonite formation is favored under these conditions, and Mg partitioning into Mg-calcite decreases. As this is opposed to the expected thermodynamic trend, it must be kinetically controlled, likely via processes at the Mg-calcite–water interface (as mentioned above) in competition with aragonite formation. The precipitation of the Mg-rich endmember from the solution is kinetically suppressed except for extreme salt brines, as has been pointed out before [27].
Since it is not possible to capture the dependence of D on the Mg to Ca ratio in a solution by a simple thermodynamic model, we derived the parameters for an empirical relation in the form of Equation (16) to describe the dependence of D on the solution composition.
D = a + ( b × exp ( Mg   to   Ca   ratio ) c )
The optimized values for a, b, and c are presented in Table 4. The corresponding model curves are included in Figure 4.
In the presence of kaolinite, very similar results are obtained compared to the absence of kaolinite. Correspondingly, we conclude that the presence of kaolinite has only a moderate impact on the formation of Mg-calcite and other calcium carbonate polymorphs. The presence of bentonite reduces the reaction rate. So far, we can only speculate about the responsible processes. The effects could be related to the sorption capacity of bentonite for Ca2+ and Mg2+ ions, which may impact the aqueous ion concentrations. Moreover, dissolved silica in solution originating from the dissolution of amorphous silica (which may be a minor constituent of bentonite) could impact the crystal growth of calcium carbonate [33].

5. Conclusions

In this study, we investigated the interaction of Mg-enriched irrigation water and calcite, which is the dominant form of soil calcium carbonate in arid and semi-arid regions via the recrystallization of metastable vaterite to calcite and/or aragonite at five Mg to Ca ratios, three different pH conditions, and in the presence and/or absence of kaolinite or bentonite at low supersaturation (Ω = 3 to 4). We found that the amount of Mg incorporation into calcite is affected by the Mg to Ca molar ratio in the solution (irrigation water). Our study also highlights the importance of the ionic composition of groundwater as a decisive factor in the mineralogical and morphological changes of calcium carbonate polymorphs in calcareous soils when the dominant ions of irrigation water are Mg, Ca, Na, CO3, and Cl. Based on the experimental results, a very low Mg to Ca molar ratio (≈0.2) promotes the formation of Mg-calcite, but higher ratios strongly inhibit the growth of calcite and induce the formation of aragonite. The formation of Mg-free aragonite instead of Mg-calcite, along with low Mg incorporation into calcite, increased the Mg to Ca ratio to approximately twice the initial values (Figure 1b) in natural aqueous environments like calcareous soil solution. Therefore, the efficient removal of Mg from the aqueous solution via coprecipitation with calcium carbonate minerals can only occur if the initial Mg to Ca ratios are already low. At elevated Mg to Ca ratios, this process becomes ineffective.

Supplementary Materials

The following supporting information can be downloaded at https://www.mdpi.com/article/10.3390/min12020265/s1: Figure S1: X-ray diffraction pattern of the synthesized vaterite. Figure S2: SEM images and SEM-EDX spot analyses of Mg-calcite and aragonite. Table S1: The ionic composition of the solution phase and XRD results of the precipitated solids for the experiments including clay minerals.

Author Contributions

Conceptualization, F.H. and R.R.; Methodology, F.H.; Investigation, M.A.; SEM imaging and EDX analyses, D.S.; Formal Analysis, M.A. and F.H.; Writing—Original Draft Preparation, M.A.; Writing—Review and Editing, F.H. and R.R.; Supervision, F.H. and R.R.; and Funding Acquisition, R.R. All authors have read and agreed to the published version of the manuscript.

Funding

This research was funded by the council of Tarbiat Modares University.

Data Availability Statement

The data presented in this study are available on request from the corresponding author.

Acknowledgments

The authors would like to thank Johannes Lützenkirchen for his support and help. We wish to thank Nicolas Finck for the support in synthesizing vaterite. F. Geyer, S. Moisei-Rabung, and T. Kisely are acknowledged for the ICP-MS, ICP-OES, and TIC measurements, respectively.

Conflicts of Interest

The authors declare no conflict of interest.

References

  1. Morse, J.W.; Mackenzie, F.T. Geochemistry of Sedimentary Carbonates; Elsevier Science Publishers: Amsterdam, The Netherlands, 1990. [Google Scholar]
  2. De Choudens-Sanchez, V.; Gonzalez, L.A. Calcite and Aragonite Precipitation Under Controlled Instantaneous Supersaturation: Elucidating the Role of CaCO3 Saturation State and Mg/Ca Ratio on Calcium Carbonate Polymorphism. J. Sediment. Res. 2009, 79, 363–376. [Google Scholar] [CrossRef]
  3. Quigley, R.M.; Dreimanis, A. Secondary aragonite in a soil profile. Earth Planet. Sci. Lett. 1966, 1, 348–350. [Google Scholar] [CrossRef]
  4. Podwojewski, P. The occurrence and interpretation of carbonate and sulfate minerals in a sequence of Vertisols in New Caledonia. Geoderma 1995, 65, 223–248. [Google Scholar] [CrossRef]
  5. Kobayashi, K.; Hashimoto, Y.; Wang, S.-L. Boron incorporation into precipitated calcium carbonates affected by aqueous pH and boron concentration. J. Hazard. Mater. 2019, 383, 1–30. [Google Scholar] [CrossRef] [PubMed]
  6. Ogino, T.; Suzuki, T.; Sawada, K. The rate and mechanism of polymorphic transformation of calcium carbonate in water. J. Cryst. Growth 1990, 100, 159–167. [Google Scholar] [CrossRef]
  7. Mewes, A.; Langer, G.; de Nooijer, L.J.; Bijma, J.; Reichart, G.J. Effect of different seawater Mg2+ concentrations on calcification in two benthic foraminifers. Mar. Micropaleontol. 2014, 113, 56–64. [Google Scholar] [CrossRef] [PubMed] [Green Version]
  8. Astilleros, J.M.; Fernández-Díaz, L.; Putnis, A. The role of magnesium in the growth of calcite: An AFM study. Chem. Geol. 2010, 271, 52–58. [Google Scholar] [CrossRef] [Green Version]
  9. Mucci, A.; Morse, J.W. The incorporation of Mg and Sr into calcite overgrowths: Influences of growth rate and solution composition. Geochim. Cosmochim. Acta 1983, 47, 217–233. [Google Scholar] [CrossRef]
  10. Ortiz, A.C.; Jin, L. Chemical and hydrological controls on salt accumulation in irrigated soils of southwestern U.S. Geoderma 2021, 391, 114976. [Google Scholar] [CrossRef]
  11. Xia, J.; Zhang, S.; Zhao, X.; Liu, J.; Chen, Y. Effects of different groundwater depths on the distribution characteristics of soil-Tamarix water contents and salinity under saline mineralization conditions. Catena 2016, 142, 166–176. [Google Scholar] [CrossRef]
  12. Corwin, D.L. Climate change impacts on soil salinity in agricultural areas. Eur. J. Soil Sci. 2021, 72, 842–862. [Google Scholar] [CrossRef]
  13. Dehghani, F.; Rahnemaie, R.; Malakouti, M.J.; Saadat, S. Investigating Calcium to Magnesium Ratio Status in Some Irrigation Water in Iran. J. Water Res. Agric. 2012, 26, 117–129. [Google Scholar]
  14. Qadir, M.; Schubert, S.; Oster, J.D.; Sposito, G.; Minhas, P.S.; Cheraghi, S.A.M.; Murtaza, G.; Mirzabaev, A.; Saqib, M. High-magnesium waters and soils: Emerging environmental and food security constraints. Sci. Total Environ. 2018, 642, 1108–1117. [Google Scholar] [CrossRef]
  15. Abdollahpour, M.; Rahnemaie, R.; Lützenkirchen, J. The vulnerability of calcareous soils exposed to Mg-enriched irrigation water. Land Degrad. Dev. 2020, 31, 2295–2306. [Google Scholar] [CrossRef]
  16. Loste, E.; Wilson, R.M.; Seshadri, R.; Meldrum, F.C. The role of magnesium in stabilising amorphous calcium carbonate and controlling calcite morphologies. J. Cryst. Growth 2003, 254, 206–218. [Google Scholar] [CrossRef]
  17. Mucci, A. Growth kinetics and composition of magnesian calcite overgrowths precipitated from seawater: Quantitative influence of orthophosphate ions. Geochim. Cosmochim. Acta 1986, 50, 2255–2265. [Google Scholar] [CrossRef]
  18. Paquette, J.; Vali, H.; Mucci, A. TEM study of Pt-C replicas of calcite overgrowths precipitated from electrolyte solutions. Geochim. Cosmochim. Acta 1996, 60, 4689–4699. [Google Scholar] [CrossRef]
  19. Zhang, Y.; Dawe, R.A. Influence of Mg2+ on the kinetics of calcite precipitation and calcite crystal morphology. Chem. Geol. 2000, 163, 129–138. [Google Scholar] [CrossRef]
  20. Kinsman, K.J.J.; Holland, H.D. The co-precipitation of cations with CaCO3: IV. The co-precipitation of Sr2+ with aragonite between 16 and 96 C. Geochim. Cosmochim. Acta 1969, 3, 1–17. [Google Scholar] [CrossRef]
  21. Glover, E.D.; Sippel, R.F. Synthesis of magnesium calcites. Geochim. Cosmochim. Acta 1967, 31, 603–614. [Google Scholar] [CrossRef]
  22. Park, W.K.; Ko, S.J.; Lee, S.W.; Cho, K.H.; Ahn, J.W.; Han, C. Effects of magnesium chloride and organic additives on the synthesis of aragonite precipitated calcium carbonate. J. Cryst. Growth 2008, 310, 2593–2601. [Google Scholar] [CrossRef]
  23. Parakhonskiy, B.V.; Haasa, A.; Antolini, R. Sub-micrometer vaterite containers: Synthesis, substance loading, and release. Angew. Chemie. Int. Ed. 2012, 51, 1195–1197. [Google Scholar] [CrossRef] [PubMed] [Green Version]
  24. Parkhurst, B.D.L.; Appelo, C.A.J. User’s Guide to PHREEQC (Version 2): A Computer Program for Speciation, Batch-Reaction, One-Dimensional Transport, and Inverse Geochemical Calculations; U.S. Geological Survey: Reston, VA, USA, 1999.
  25. Thoenen, T.; Hummel, W.; Berner, U.; Curti, E. The PSI/Nagra Chemical Thermodynamic Database 12/07; Paul Scherrer Institut, Villigen PSI: Villigen, Switzerland, 2014. [Google Scholar]
  26. Heberling, F.; Metz, V.; Böttle, M.; Curti, E.; Geckeis, H. Barite recrystallization in the presence of 226Ra and 133Ba. Geochim. Cosmochim. Acta 2018, 232, 124–139. [Google Scholar] [CrossRef]
  27. Busenberg, E.; Plummer, L.N. Thermodynamics of magnesian calcite solid-solutions at 25 °C and 1 atm total pressure. Geochim. Cosmochim. Acta 1989, 53, 1189–1208. [Google Scholar] [CrossRef]
  28. Heberling, F.; Schild, D.; Degering, D.; Schäfer, T. How well suited are current thermodynamic models to predict or interpret the composition of (Ba,Sr)SO4 solid-solutions in geothermal scalings? Geotherm. Energy 2017, 5, 1–16. [Google Scholar] [CrossRef] [Green Version]
  29. Guggenheim, A.E. Theoretical basis of Raoult’s law. Trans. Faraday Soc. 1937, 33, 151–159. [Google Scholar] [CrossRef]
  30. Prieto, M. Thermodynamics of Solid Solution- Aqueous Solution Systems. Rev. Mineral. Geochem. 2009, 70, 47–85. [Google Scholar] [CrossRef]
  31. Schmidt, M.; Stumpf, T.; Walther, C.; Geckeis, H.; Fanghänel, T. Phase transformation in CaCO3 polymorphs: A spectroscopic, microscopic and diffraction study. J. Colloid Interface Sci. 2010, 351, 50–56. [Google Scholar] [CrossRef]
  32. Shtukenberg, A.G.; Punin, Y.O.; Azimov, P. Crystallization kinetics in binary solid solution-aqueous solution systems. Am. J. Sci. 2006, 306, 553–574. [Google Scholar] [CrossRef]
  33. Pina, C.M.; Merkel, C.; Jordan, G. On the bimodal effects of silicic acids on calcite growth. Cryst. Growth Des. 2009, 9, 4084–4090. [Google Scholar] [CrossRef]
Figure 1. Changes in the Mg to Ca ratio in (a) precipitated solids and (b) equilibrium solutions as a function of the initial ratio in the solution.
Minerals 12 00265 g001
Figure 2. Selected X-ray powder diffraction (XRD) patterns of the precipitated solids for an average actual pH of 8.8.
Minerals 12 00265 g002
Figure 3. Selected scanning electron microscopy (SEM) images of precipitated solids formed during the transformation of vaterite to Mg-calcite and/or aragonite. The Mg to Ca ratios are (a) 0.2, (b) 1, (c) 2, (d) 5, and (e) 10. Images are taken from experiments with an average actual pH of 8.8.
Minerals 12 00265 g003
Figure 4. The partition coefficients for Mg incorporation into Mg-calcite as a function of the equilibrium Mg to Ca ratio in a solution in comparison with the data of Mucci and Morse [9] and Busenberg and Plummer [27]. The lines are model predictions using the empirical parameters given in Table 4.
Minerals 12 00265 g004
Figure 5. Rozeboom diagram and partition coefficient. The (left) plot shows a Rozeboom diagram of the (Mg,Ca)CO3 system. The (right) plot shows the partition coefficient as a function of a Mg mole fraction in the solid. The solid and dashed lines are the predictions for X(Mg)(s) and D values using dimensionless Guggenheim parameters of 3.3 and 6, respectively. The value a0 = 3.3 ± 0.2 is considered a good estimate for a thermodynamic value. The calculation with a0 = 6 (dashed line) is just for illustrative purposes.
Minerals 12 00265 g005
Table 1. The change in average actual pH, equilibrium concentrations of calcium (Ca), magnesium (Mg), total inorganic carbon (TIC), and the saturation state with respect to calcite (Ω) removed Mg from the solution phase and the Ca and Mg concentrations in the precipitated solids. N.S. stands for not significant.
Mg to Ca RatioCaMgpHFinalCaMgTICΩCaMg∆Mg(aq)
Initial (mmol/L)Supernatant (mmol/L)Solid (mol/kg)mmol/L
0.2518.062.040.932.062.7510.060.0860.070
2.50.58.480.870.421.211.869.940.0820.084
0.80.169.280.330.090.772.519.570.0660.068
1558.062.094.912.262.759.450.012N.S.
2.52.58.610.832.531.242.299.480.011N.S.
0.80.89.370.310.770.732.519.500.012N.S.
25108.072.099.682.282.579.680.009N.S.
2.558.920.894.921.344.579.620.010N.S.
0.81.69.410.321.590.762.759.790.009N.S.
55258.302.1524.492.393.639.550.012N.S.
2.512.58.970.9712.311.304.279.350.016N.S.
0.849.580.433.940.794.279.450.012N.S.
105508.372.3247.852.613.809.550.025N.S.
2.5258.971.1124.451.444.179.470.026N.S.
0.889.540.497.900.874.079.360.019N.S.
Table 2. Results of the XRD analysis of the precipitated solids.
Mg to Ca RatioAverage Actual pHMg-Calcite
(%)
Aragonite
(%)
Vaterite
(%)
0.28.283170
8.875250
9.478220
18.24960
8.84960
9.45950
28.25950
8.84960
9.44960
58.23970
8.83907
9.42980
108.237918
8.826434
9.428513
Table 3. The mole fractions of Mg in Mg-calcite, partition coefficients (D), calculated dimensionless Guggenheim parameter, a0, free energy, and stoichiometric supersaturation of the aqueous solution with respect to the forming Mg-calcite solid solution. The mole fraction of Mg ions in the calcite structure was calculated by: (A) the Mg percentage in calcite from digestion and (B) a SEM-EDX analysis. The average dimensionless Guggenheim parameter for the lowest Mg to Ca ratio (i.e., 0.2), a0 = 3.3 ± 0.2, is assumed to be the best estimate for an equilibrium value. This value was used to calculate the free energy of the solid solution. Ω s t is the stoichiometric saturation state of an aqueous solution with respect to Mg-calcite.
Mg to Ca RatioAverage Actual
pH
XMgDa0Free EnergyΩst
Mg %SEM-EDXMg %SEM-EDXMg %SEM-EDX
0.28.20.010-0.023-3.37-−1128.22.77
8.80.0100.0100.0230.0213.363.47−1128.11.88
9.40.009-0.032-3.00-−1128.32.52
18.20.031-0.014-4.07-−1126.22.92
8.80.0360.0250.0120.0084.224.53−1125.72.42
9.40.025-0.010-4.31-−1126.82.63
28.20.031-0.007-4.79-−1126.12.78
8.80.0330.0090.0060.0024.936.09−1126.04.95
9.40.031-0.007-4.85-−1126.12.98
58.20.041-0.004-5.56-−1125.24.11
8.80.0530.0090.0040.0015.526.84−1124.05.01
9.40.061-0.007-5.09-−1123.24.90
108.20.079-0.004-5.94-−1121.44.83
8.80.1200.0130.0060.0016.057.13−1117.35.86
9.40.091-0.006-5.62-−1120.25.19
Table 4. The fitted parameters of a, b, and c for Equation (16) that describes the partition coefficient of Mg in calcite as a function of the Mg to Ca ratio. For comparison purposes, the derived values for Mucci and Morse [9] and Busenberg and Plummer [27] data are also presented.
Study/ParametersabcR2
This study0.0050.0261.7630.95
Mucci and Morse [9]0.0120.0223.3750.81
Busenberg and Plummer, 18980.0180.0140.670.52
Publisher’s Note: MDPI stays neutral with regard to jurisdictional claims in published maps and institutional affiliations.

