
Cancer Risk Assessment and Geochemical Features of Granitoids at Nikeiba, Southeastern Desert, Egypt

 ,
,
Abstract
:1. Introduction
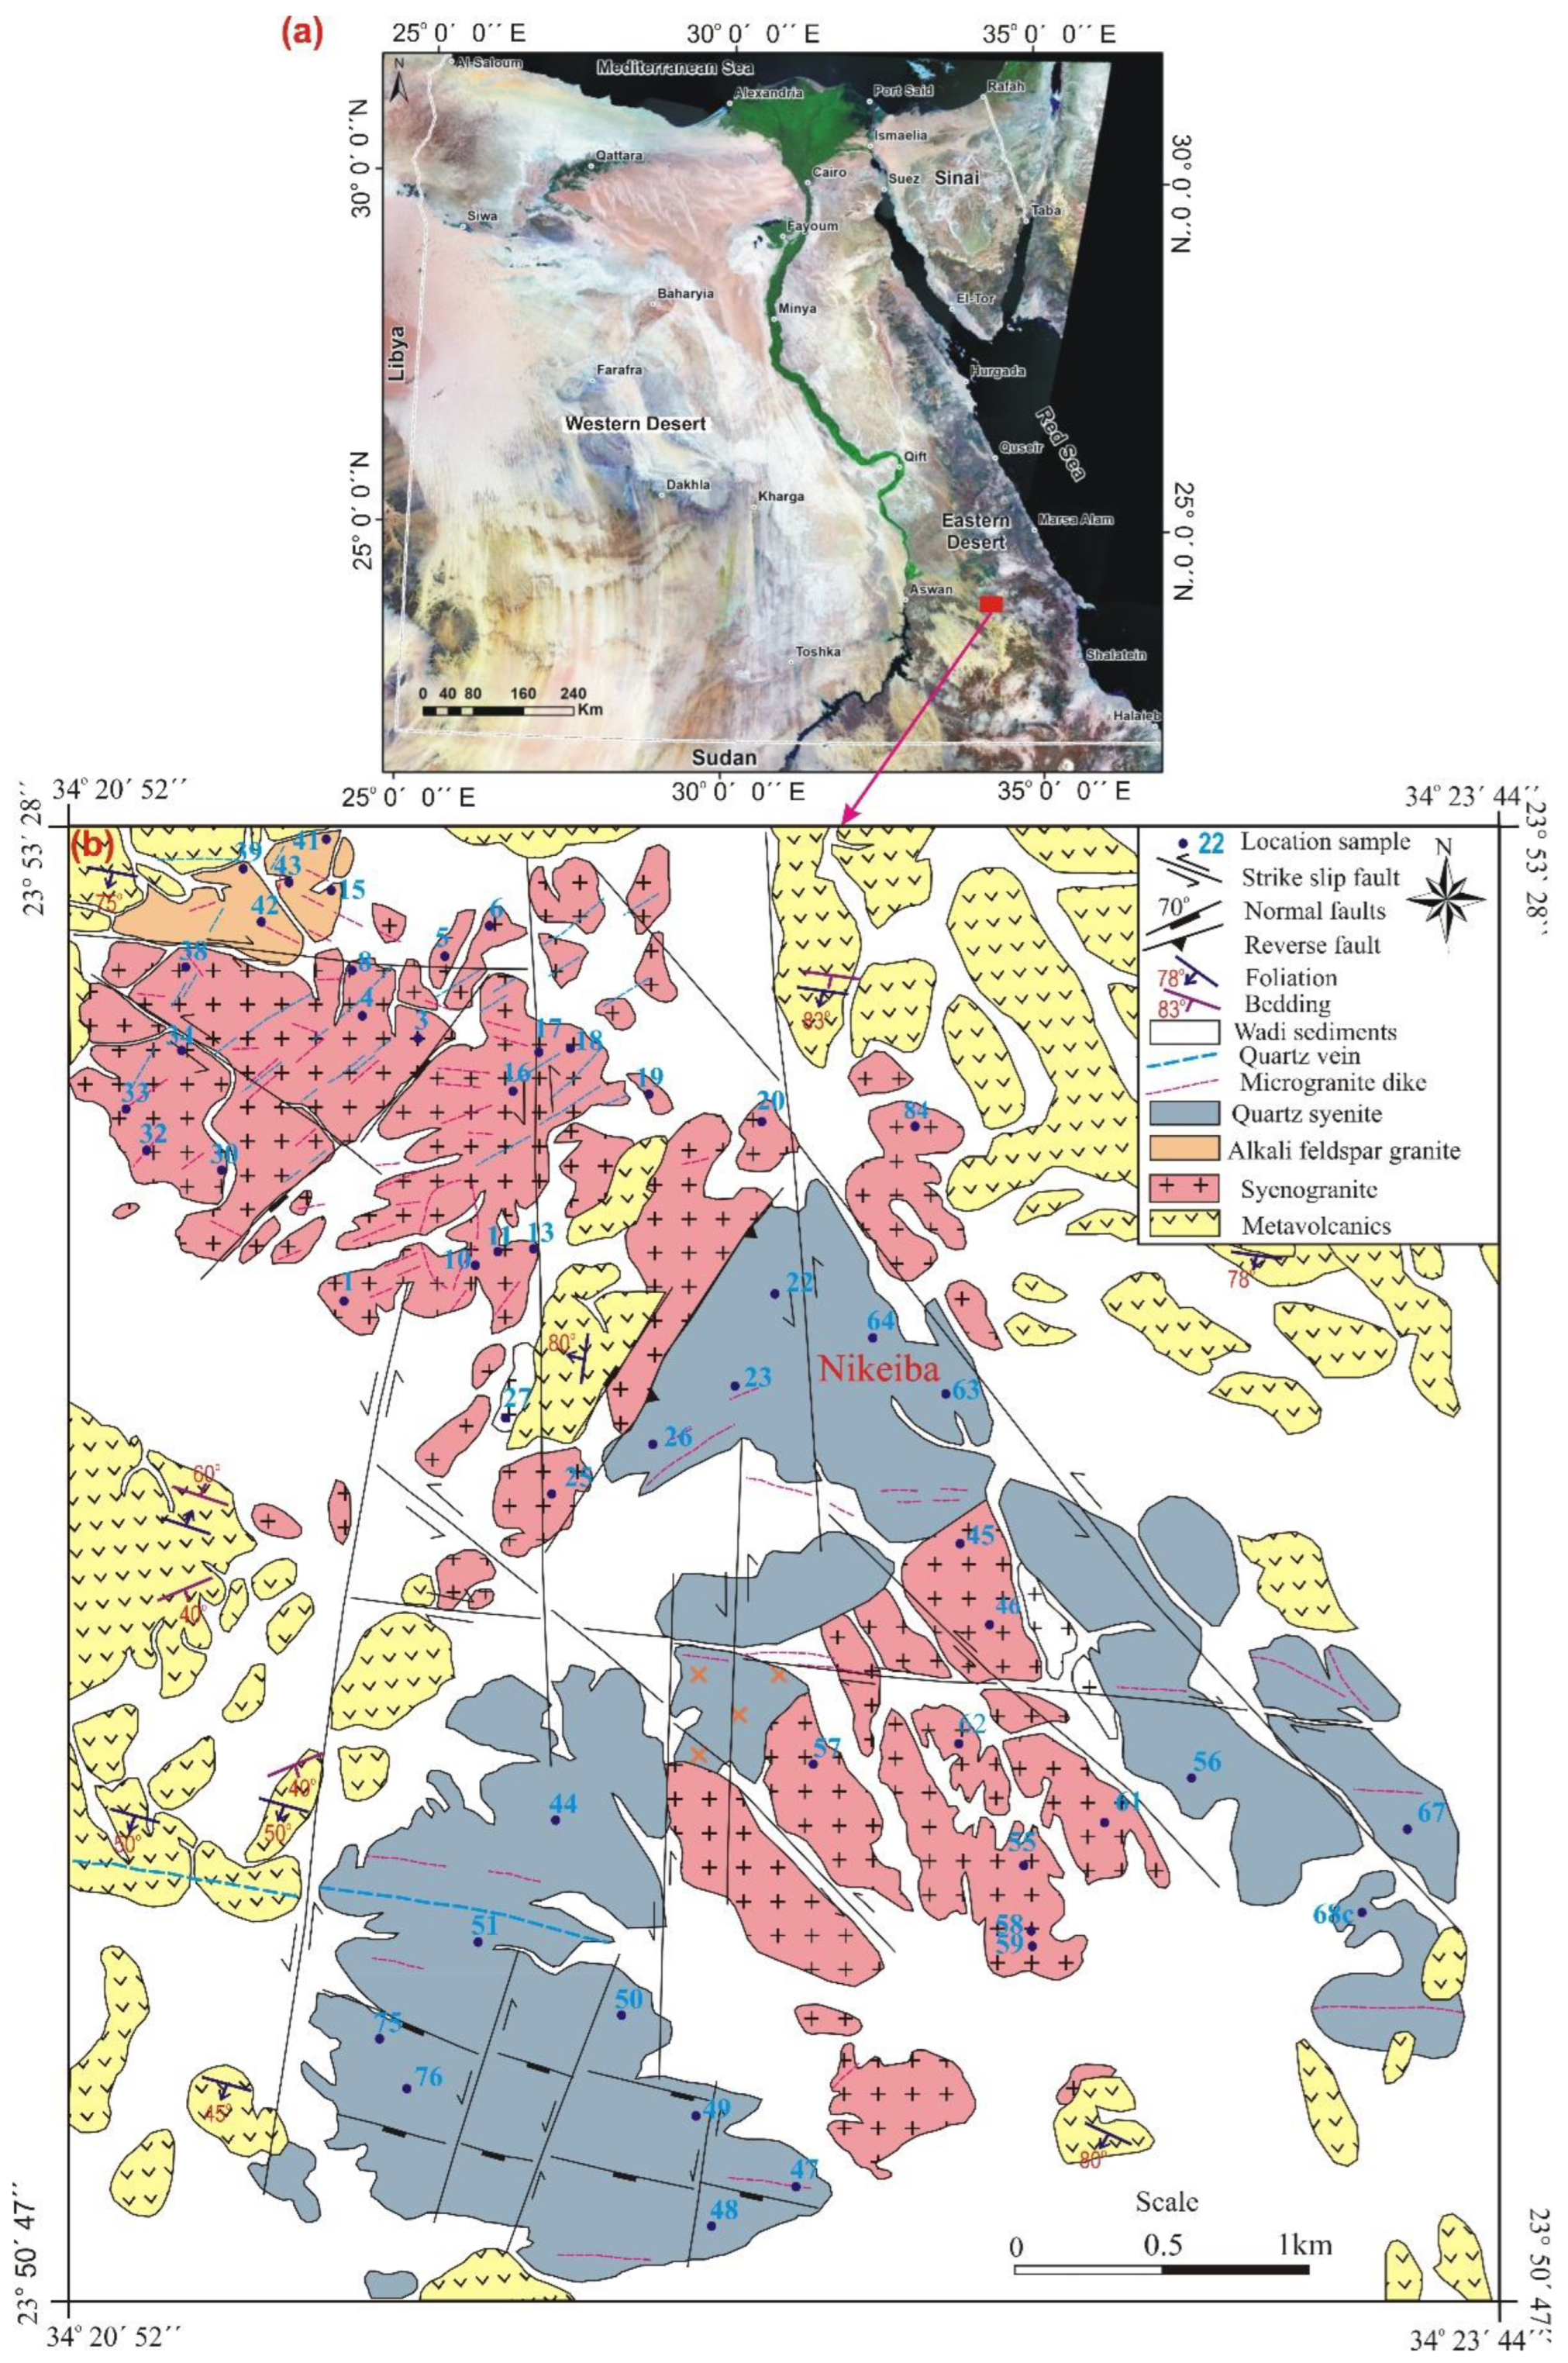
2. Geologic Setting
3. Material and Analytical Methods
4. Results and Discussion
4.1. Radioactivity
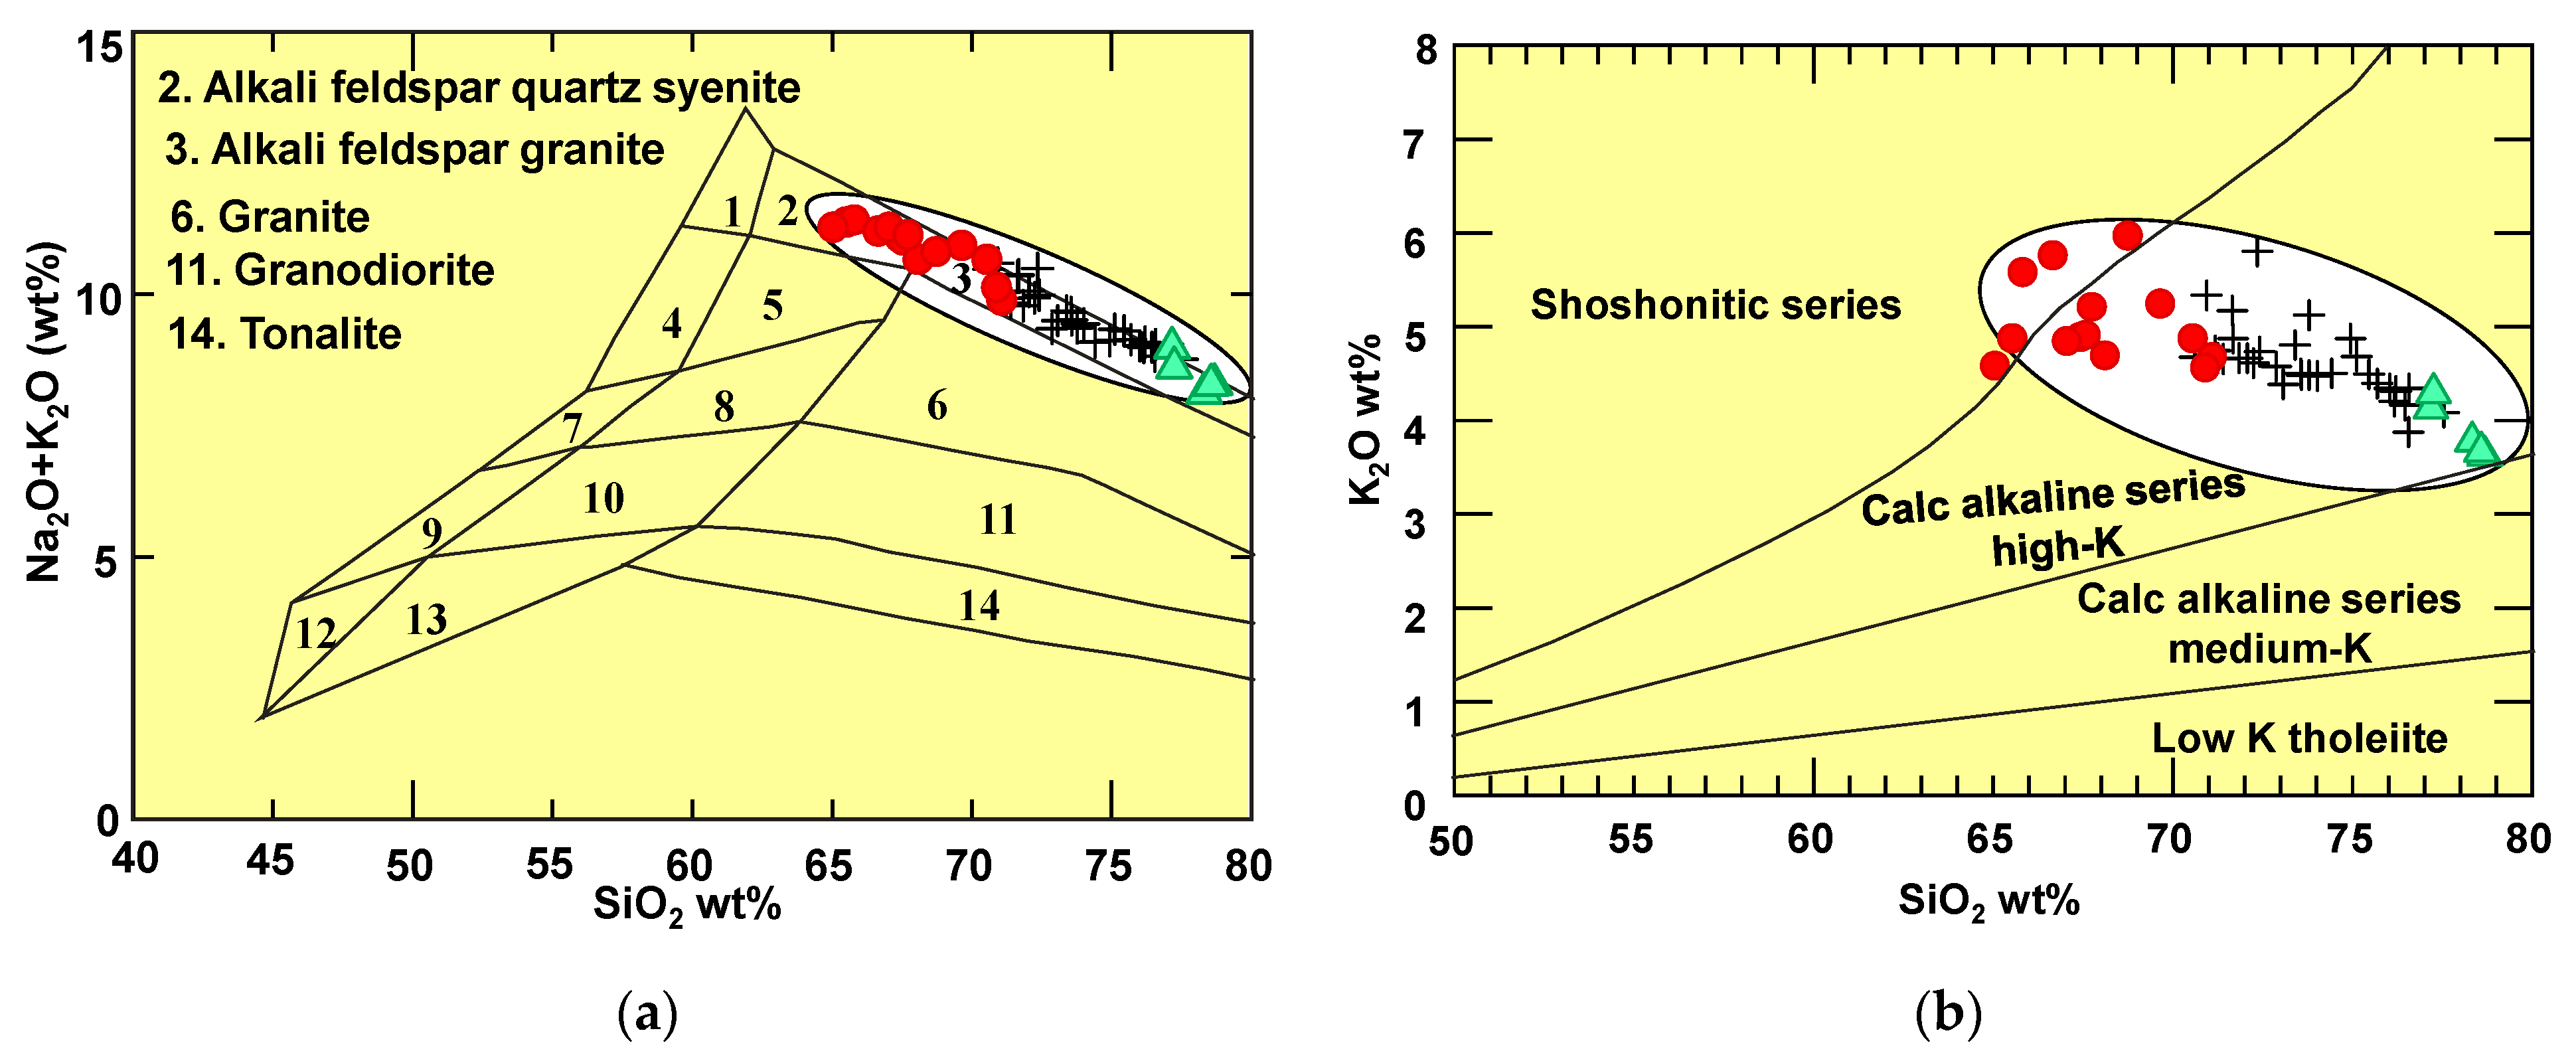
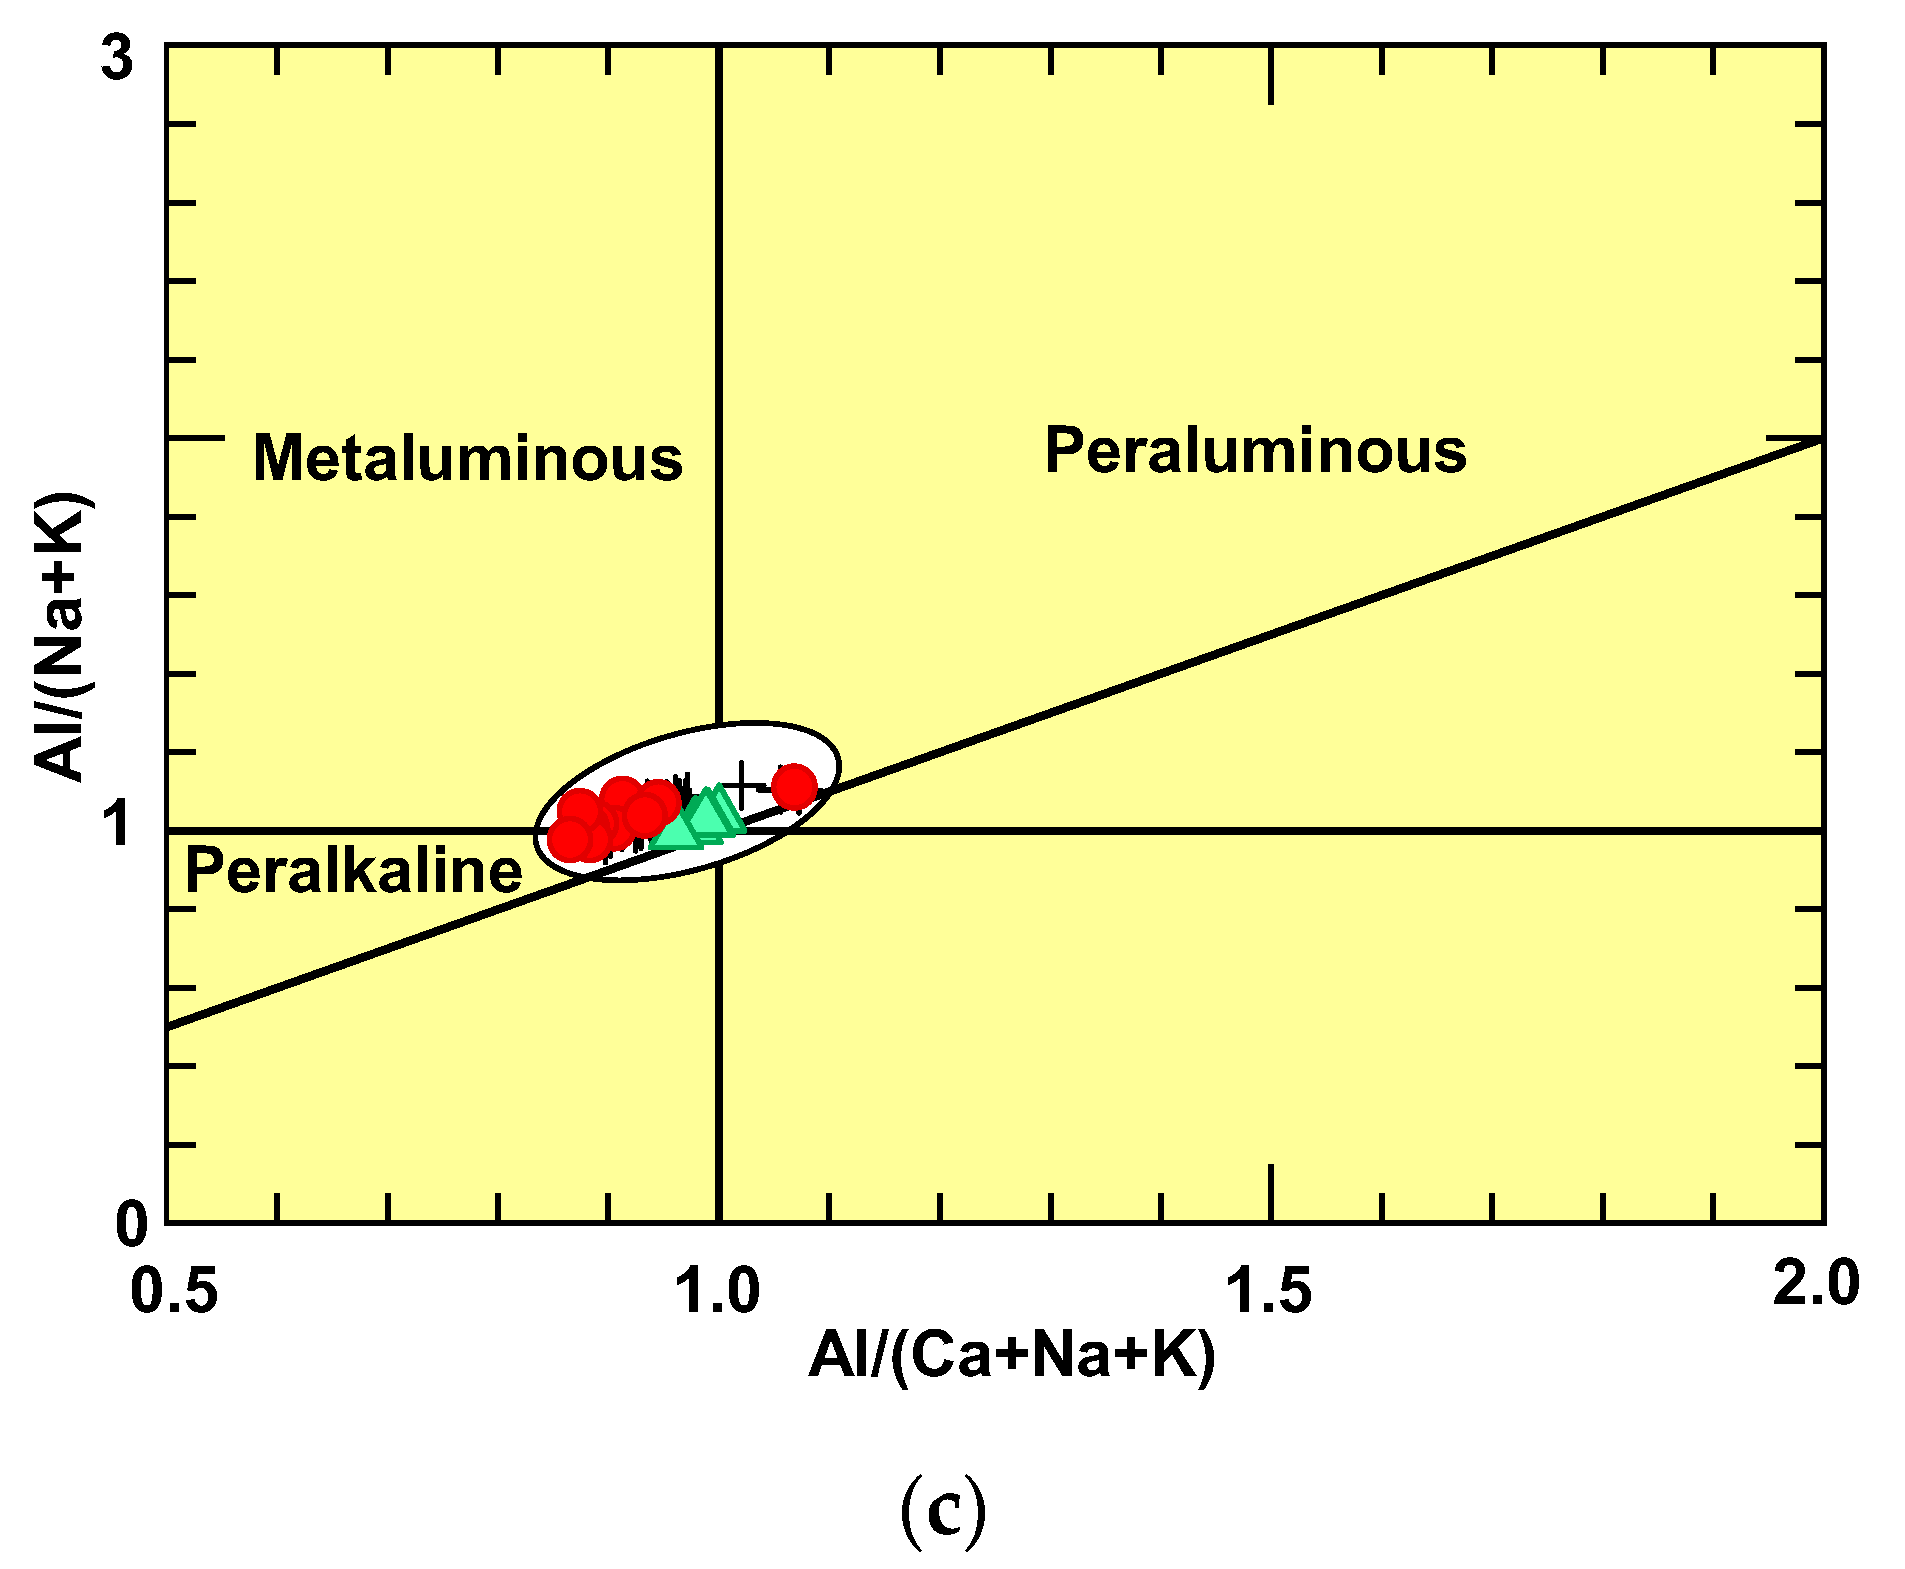
4.2. Geochemistry
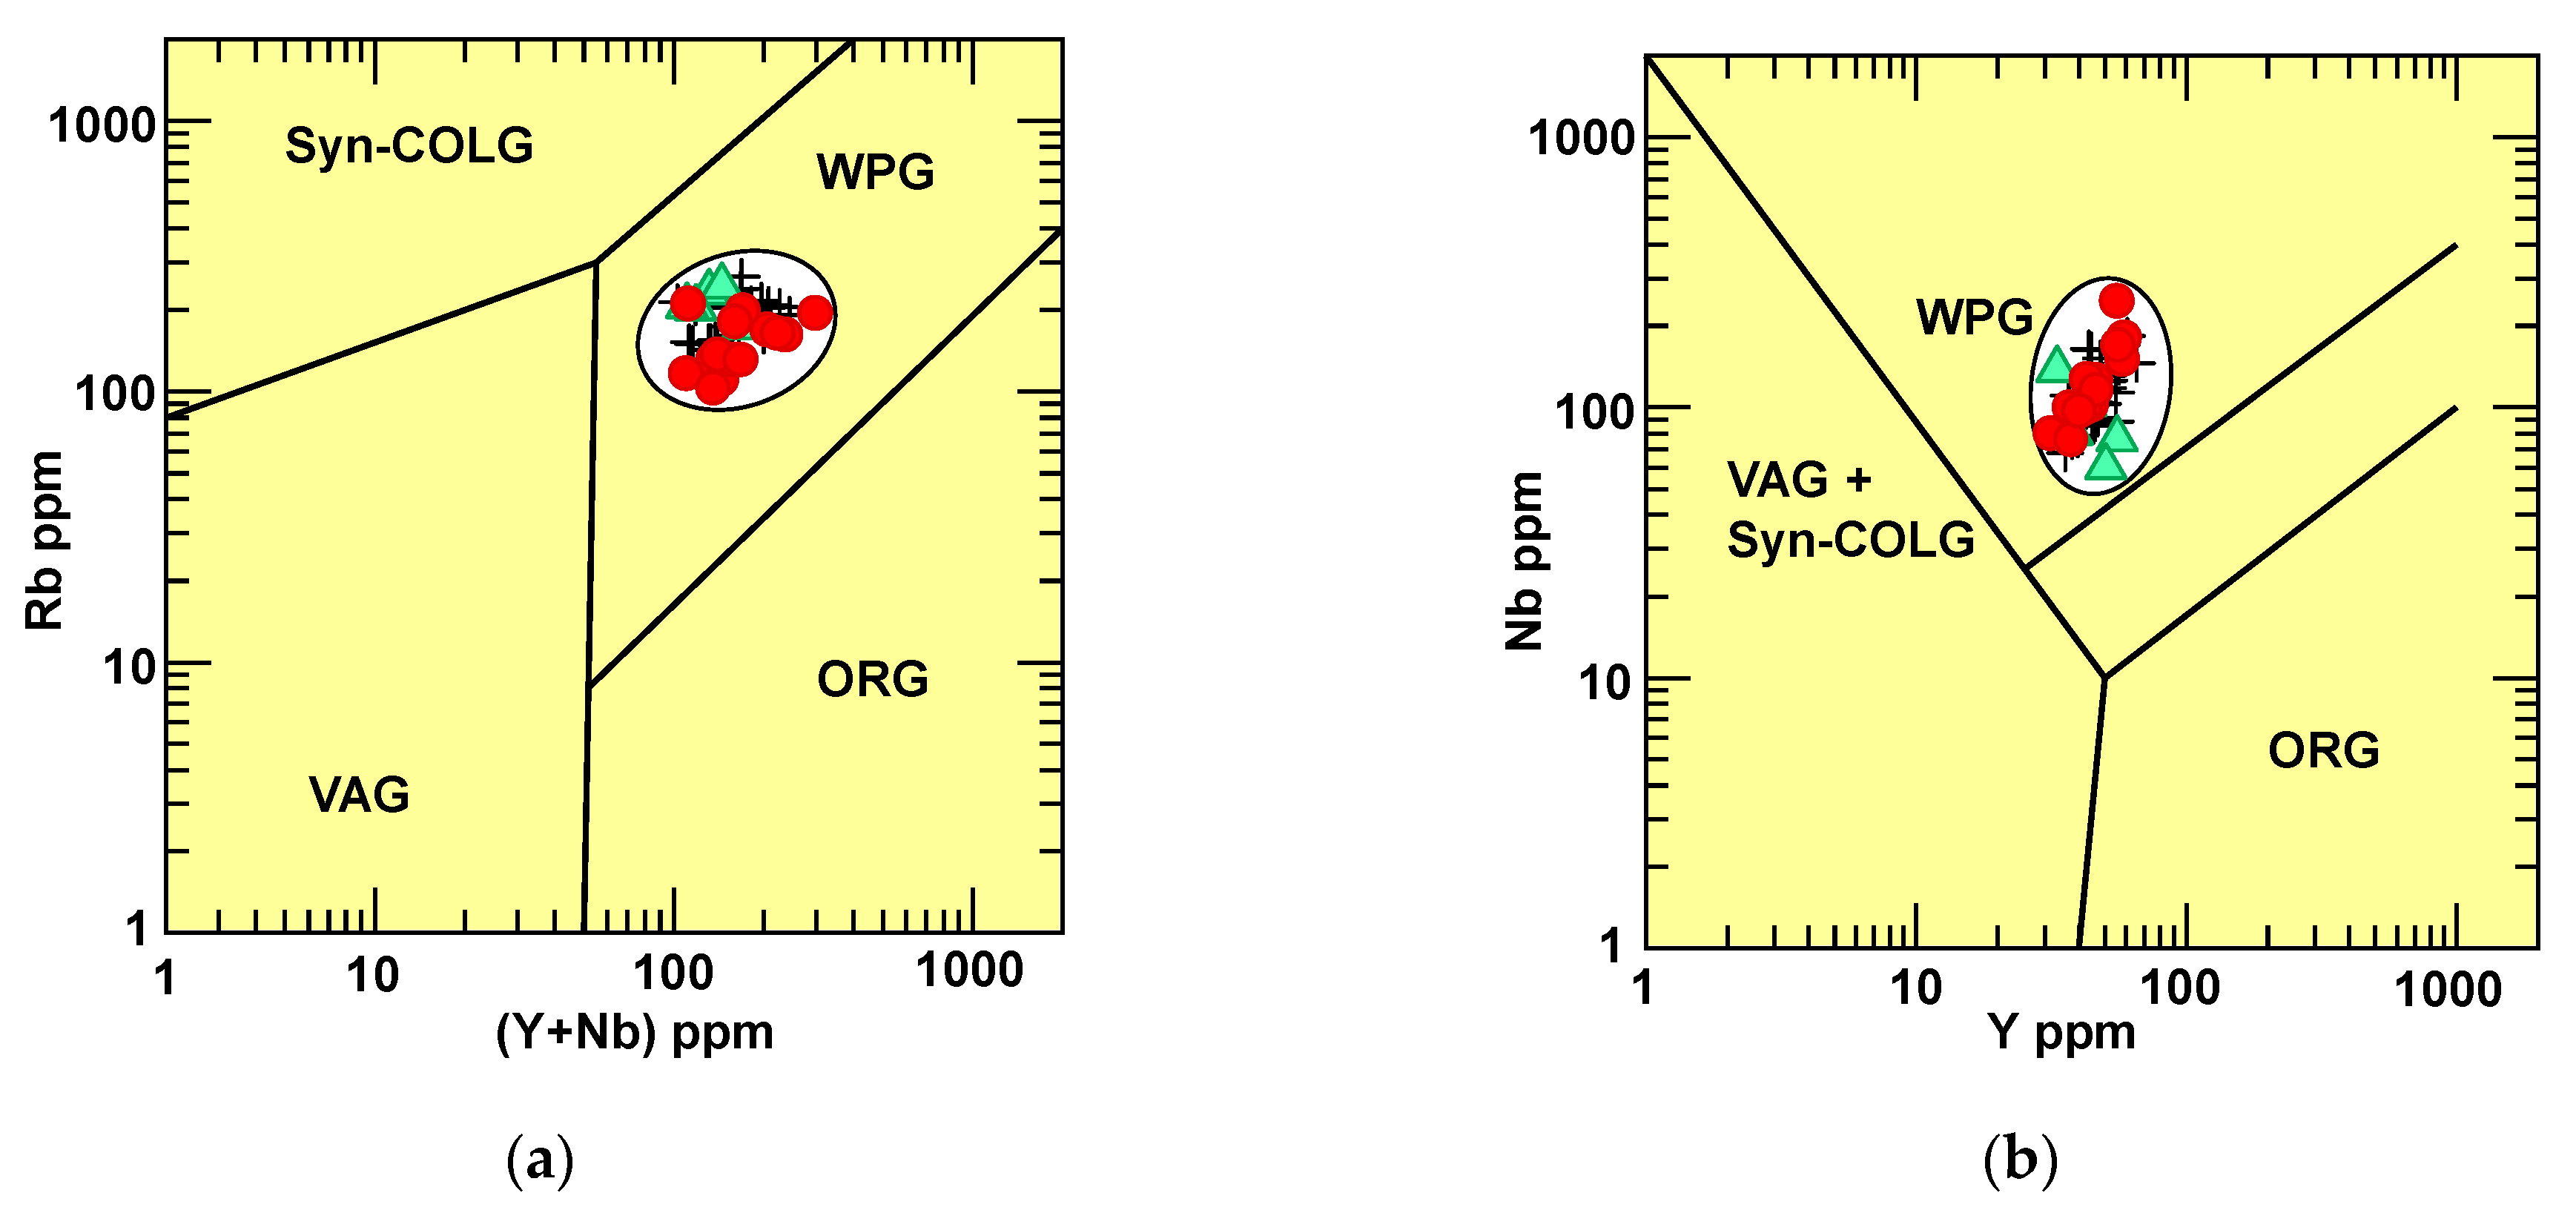
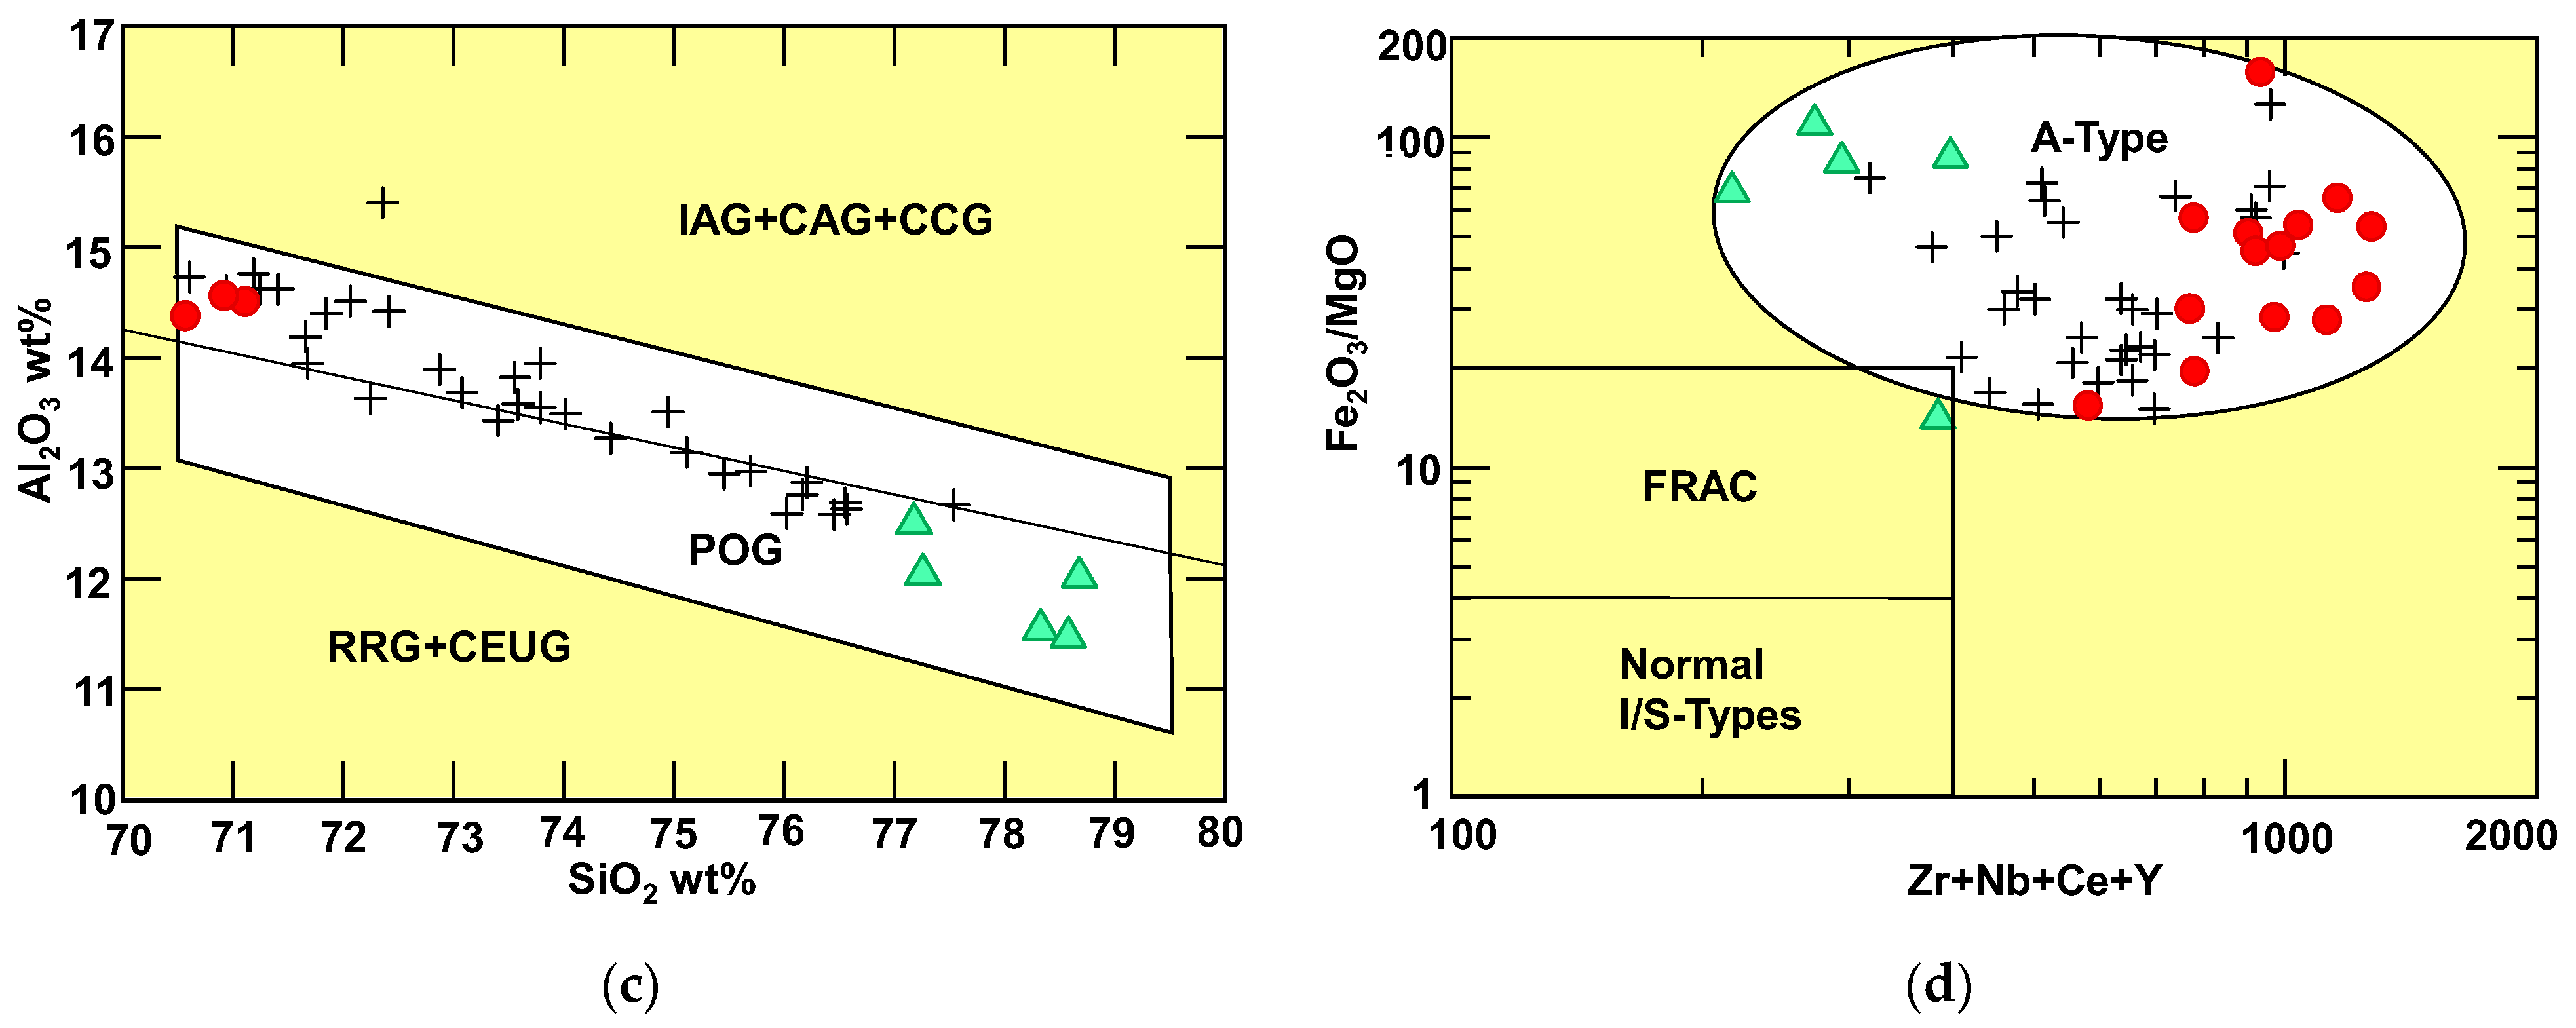
4.3. Petrogenesis of Granitoids
4.4. Spider Diagrams
4.5. Geochemical Features of U and Th in Granitoids
4.6. Radiological Assessment
4.6.1. Activity Concentration
4.6.2. Dair and AED
4.6.3. AGDE and ELCR
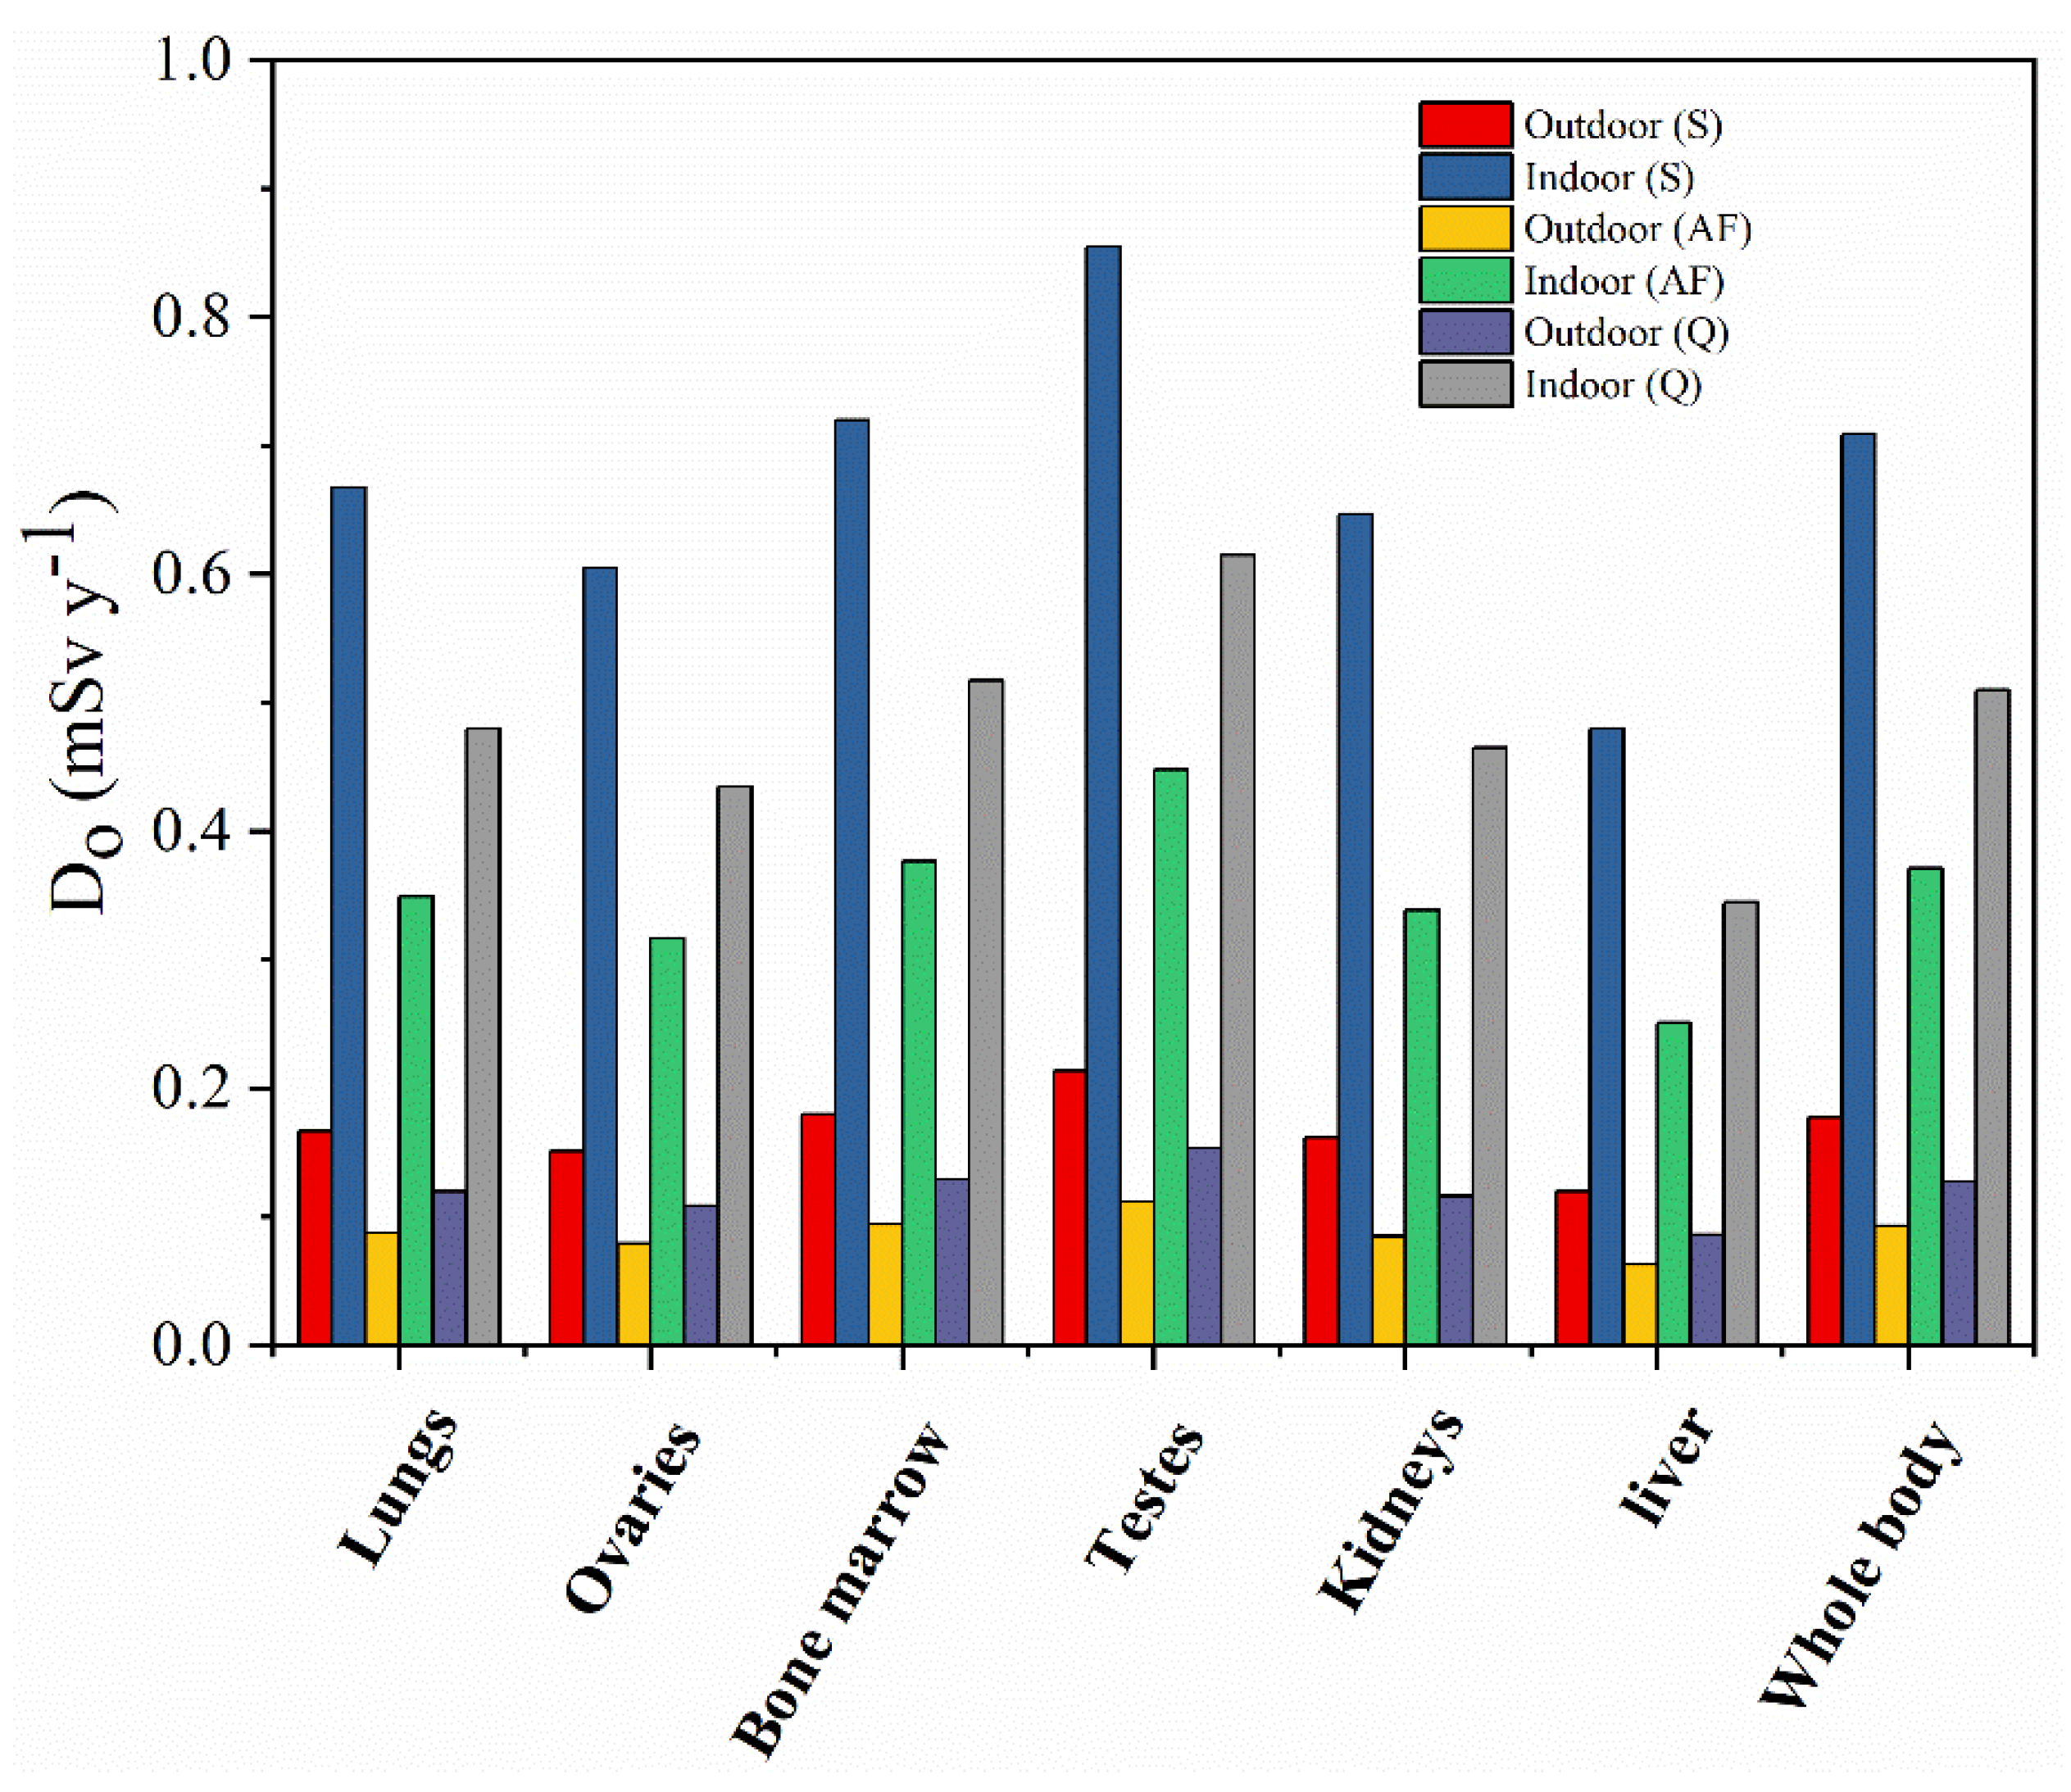
4.6.4. Effective Dose (Do) to Various Body Organs
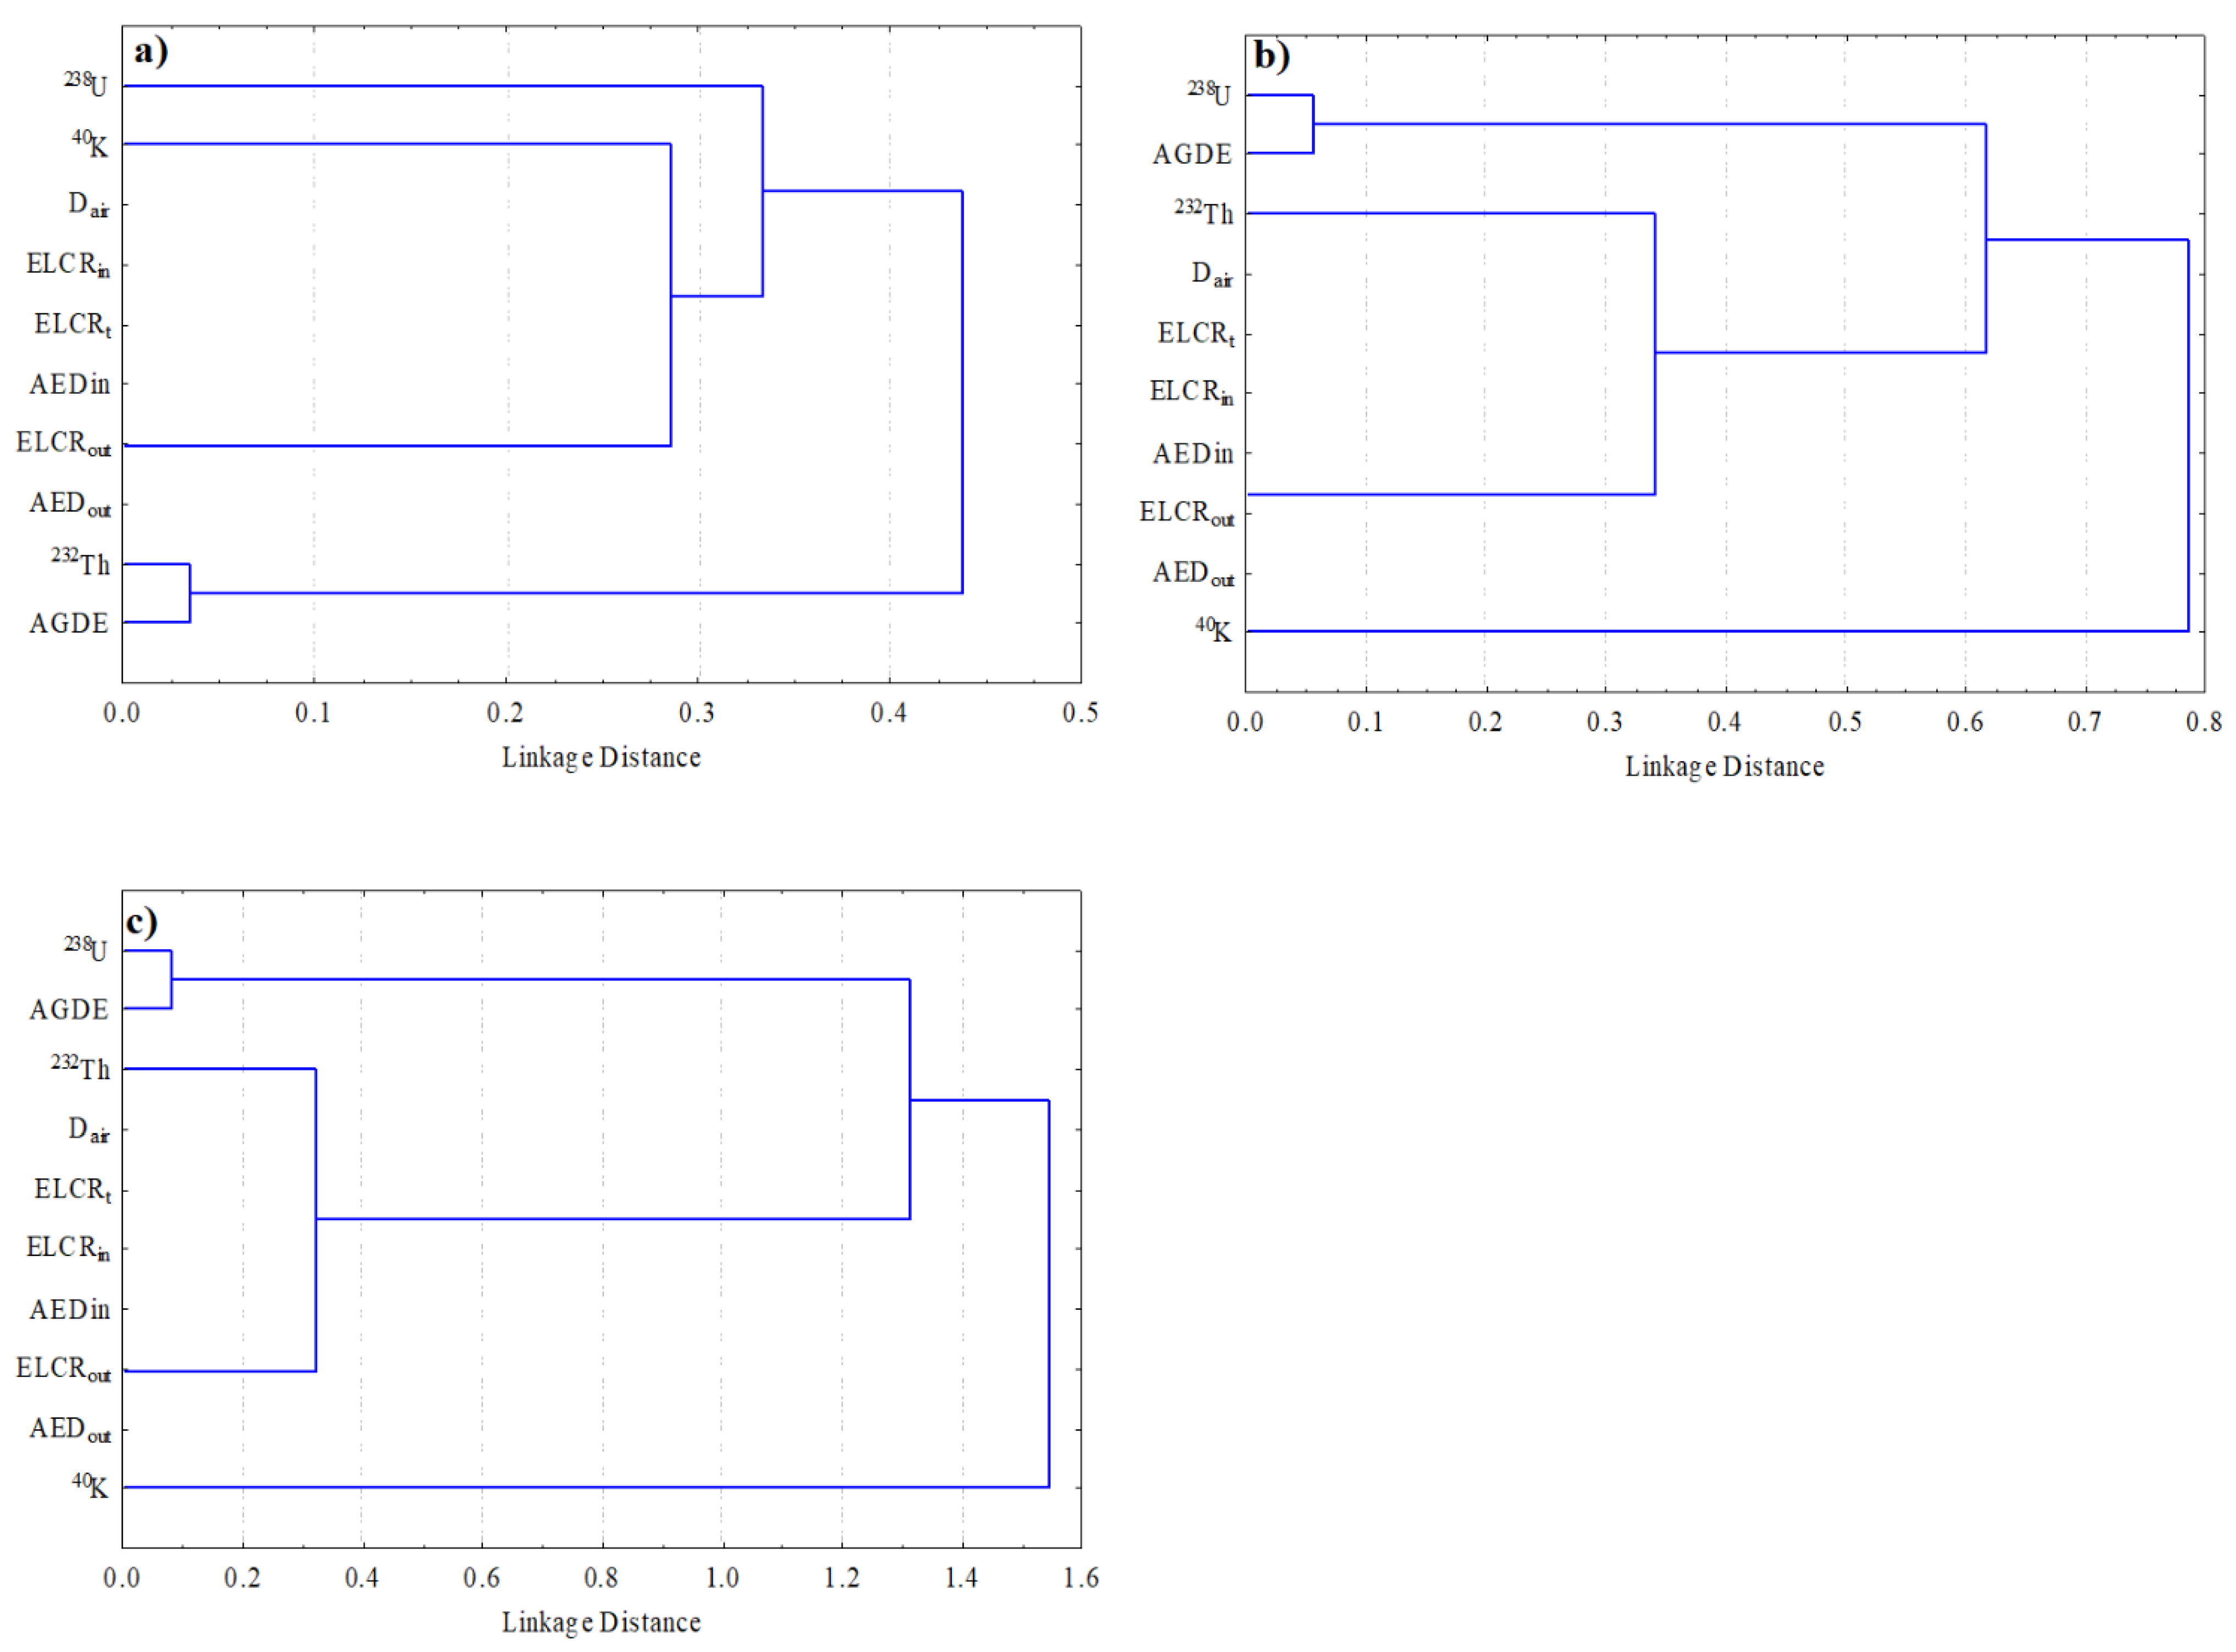
4.7. Statistical Analysis
5. Conclusions
Author Contributions
Funding
Data Availability Statement
Conflicts of Interest
References
- Singh, L.S.; Vallinayagam, G. High heat producing volcano-plutonic rocks of the Siner area, Malani Igneous Suite, Western Rajasthan, India. Int. J. Geosci. 2012, 3, 1137–1141. [Google Scholar] [CrossRef] [Green Version]
- Scharfenberg, L.; Jandausch, S.; Anetzberger, L.; Regelous, A.; Sharma, K.K.; de Wall, H. Differences in natural gamma radiation characteristics of Erinpura and Malani granites in NW India. J. Earth Syst. Sci. 2019, 128, 137. [Google Scholar] [CrossRef] [Green Version]
- Karen, J.W.; Peter, J.M.; Robert, A.Z.; James, L.S. Margaritasite: A new mineral of hydrothermal origin from the Pena Blanc Uranium District, Mexico. Am. Mineral. 1982, 67, 1273–1289. [Google Scholar]
- Dayvault, R.D.; Castor, S.B.; Berry, M.R. Uranium associated with volcanic rocks of the McDermitt Caldera, Nevada and Oregon. In Uranium Deposits in Volcanic Rocks; IAEA: Vienna, Austria, 1985; pp. 379–409. [Google Scholar]
- Cunningham, C.G.; Rasmussen, J.D.; Steven, T.A.; Rye, R.O.; Rowley, P.D.; Romberger, S.B.; Selverstone, J. Hydrothermal uranium deposits containing molybdenum and fluorite in the Marysvale volcanic field, west-central Utah. Miner. Depos. 1998, 33, 477–494. [Google Scholar] [CrossRef]
- Bhushan, S.K. Malani rhyolites—A review. Gondwana Res. 2000, 3, 65–77. [Google Scholar] [CrossRef]
- Chabiron, A.; Alyoshin, A.P.; Cuney, M.; Deloule, E.; Golubev, V.; Velitchkin, V.I.; Poty, B. Geochemistry of the rhyolitic magmas from the Streltsovka Caldera (Transbaikalia, Russia): A melt inclusion study. Chem. Geol. 2001, 175, 273–290. [Google Scholar] [CrossRef]
- Sharma, K.K. The Neoproterozoic Malani magmatism of the northwestern Indian shield: Implications for crustbuilding processes. J. Earth Syst. Sci. 2004, 113, 795–807. [Google Scholar] [CrossRef] [Green Version]
- Stern, R.J.; Hedge, C.E. Geochronologic and isotopic constraints on late Precambrian crustal evolution in the Eastern Desert of Egypt. Am. J. Sci. 1985, 285, 97–172. [Google Scholar] [CrossRef]
- Omran, A.A. Geology, mineralogy and radioelements potentiality of microgranite dikes to the south of wadi Abu Hadieda area, northern Eastern Desert. Al-Azhar Bull. Sci. 2014, 25, 47–62. [Google Scholar] [CrossRef]
- Abdel Gawad, A.E.; Skublov, S.G.; Levashova, E.V.; Ghoneim, M.M. Geochemistry and U–Pb Age Dating of Zircon as a Petrogenetic Tool for Magmatic and Hydrothermal Processes in Wadi Ras Abda Syenogranite, Eastern Desert, Egypt. Arab. J. Sci. Eng. 2021, 119, 1–15. [Google Scholar]
- Hussein, H.A.; Hassan, M.A.; El-Tahir, M.A.; Abou-Deif, A. Uranium-bearing siliceous veins in younger granites, Eastern Desert, Egypt. In Vein Type Uranium Deposits; Fuchs, H., Ed.; International Atomic Energy Agency: Vienna, Austria, 1986; pp. 143–157. [Google Scholar]
- Abd El-Naby, H.A. Genesis of secondary uranium minerals associated with jasperoid veins, El Erediya area, Eastern Desert, Egypt. Miner. Depos. 2008, 43, 933–944. [Google Scholar] [CrossRef]
- Elsaid, M.; Aboelkhair, H.; Dardier, D.; Hermas, E.; Minoru, U. Processing of Multispectral ASTER Data for Mapping Alteration Minerals Zones: As an Aid for Uranium Exploration in Elmissikat-Eleridiya Granites, Central Eastern Desert, Egypt. Open Geol. J. 2014, 8 (Suppl. 1), 69–83. [Google Scholar] [CrossRef] [Green Version]
- Salman, A.B.; El Aassy, I.E.; Shalaby, M.H. New occurrence of uranium mineralization in Gabal Gattar, Northern Eastern Desert, Egypt. Ann. Geol. Surv. Egypt 1986, 16, 31–34. [Google Scholar]
- Salman, A.B.; El Kholy, D.M.; El Zalaky, M.A. Relation between granite plutonism, faulting and uranium mineralization in the northern part of Gabal Qattar area, Nortern Eastern Desert, Egypt. Al-Azhar Bull. Sci. 2005, 16, 23–35. [Google Scholar]
- Shalaby, M.H. New occurrence of uranium mineralizations GVII, Gabal Qattar uranium prospect, north Eastern Desert, Egypt. Bull. Fac. Sci. Alex. Univ. 1995, 35, 447–460. [Google Scholar]
- Mahdy, N.M.; El Kalioubi, B.A.; Wohlgemuth-Ueberwasser, C.C.; Shalaby, M.H.; El-Afandy, A.H. Petrogenesis of U- and Mo-bearing A2-type granite of the Gattar batholith in the Arabian Nubian Shield, Northeastern Desert, Egypt: Evidence for the favorability of host rocks for the origin of associated ore deposits. Ore Geol. Rev. 2015, 71, 57–81. [Google Scholar] [CrossRef]
- Abdalla, H.M.; Matsueda, H.; Ishihara, S.; Miura, H. Mineral Chemistry of Albite-Enriched Granitoids at Um Ara, Southeastern Desert, Egypt. Int. Geol. Rev. 1994, 36, 1067–1077. [Google Scholar] [CrossRef]
- Abdalla, H.M.; Ishihara, S.; Matsueda, H.; Abdel-Monem, A.A. On the albite-enriched granitoids at Um Ara area, Southeastern Desert, Egypt: I. Geochemical, ore potentiality and fluid inclusion studies. J. Geochem. Explor. 1996, 57, 127–138. [Google Scholar] [CrossRef]
- Dawood, Y.H.; Abd El-Naby, H.H. Mineralogy and genesis of secondary uranium deposits, Um Ara area, south Eastern Desert, Egypt. J. Afr. Earth Sci. 2001, 32, 317–323. [Google Scholar] [CrossRef]
- Gaafar, I.; Cuney, M.; Abdel Gawad, A.E. Mineral chemistry of two mica granite rare metals: Impact of geophysics on the distribution of uranium mineralization at El Sela shear zone, Egypt. Open J. Geol. 2014, 4, 137–160. [Google Scholar] [CrossRef]
- Abdel Gawad, A.E.; Orabi, A.H.; Bayoumi, M.B. Uranium evaluation and its recovery from microgranite dike at G. El Sela area, south Eastern Desert, Egypt. Arab. J. Geosci. 2015, 8, 4565–4580. [Google Scholar] [CrossRef]
- Abdel Gawad, A.E.; Ibrahim, E.M. Activity ratios as a technique for studying uranium mobility at El Sela shear zone, southeastern Desert, Egypt. Int. J. Environ. Anal. Chem. 2016, 308, 129–142. [Google Scholar] [CrossRef]
- Abdel Gawad, A.E. Geochemical behaviour of trace and rare earth elements during hydrothermal alteration at El Sela shear zone, Egypt. In VIII Young Geoscientists School, New Knowledge about Ore-Forming Processes; IGEM RAS: Moscow, Russia, 2018; pp. 439–442. [Google Scholar]
- Ghoneim, M.M.; Abdel Gawad, A.E. Vein-type uranium mineralization in the Eastern Desert of Egypt. N. Ural. State Min. Univ. 2018, 1, 33–38. [Google Scholar] [CrossRef]
- Ghoneim, M.M.; Abdel Gawad, A.E.; Awad, H.A.; Zakaly, H.M.H.; Mira, H.I.; El-Taher, A. Distribution patterns of natural radioactivity and rare earth elements in intrusive rocks (El Sela area, Eastern Desert, Egypt). Int. J. Environ. Anal. Chem. 2021, 1–14. [Google Scholar] [CrossRef]
- Ghoneim, M.M.; Panova, E.G.; Abdel Gawad, A.E. Natural radioactivity and geochemical aspects of radioactive mineralisation in El Sela, South Eastern Desert, Egypt. Int. J. Environ. Anal. Chem. 2021, 1–22. [Google Scholar] [CrossRef]
- UNSCEAR. Sources and Effects of Ionizing Radiation—Exposures of the Public and Workers from Various Sources of Radiation; UNSCEAR 2008 Report; United Nations Publication: New York, NY, USA, 2010; Volume 1, ISBN 9789211422740. [Google Scholar]
- Nagar, M.S.; Bayoumi, B.M.; Morsy, W.M. Characteristics and Evaluation of Leaching Behavior of Uranium Mineralization in Qash Amir granite, South Eastern Desert, Egypt. Am. J. Appl. Ind. Chem. 2021, 5, 7–16. [Google Scholar] [CrossRef]
- Hanfi, M.Y.; Abdel Gawad, A.E.; Eliwa, H.; Ali, K.; Taki, M.M.; Sayyed, M.I.; Khandaker, M.U.; Bradley, D.A. Assessment of radioactivity in Granitoids at Nikeiba, Southeastern Desert, Egypt; radionuclides concentrations and radiological hazard parameters. Radiat. Phys. Chem. 2022, 110113. [Google Scholar] [CrossRef]
- Ravisankar, R.; Chandrasekaran, A.; Vijayagopal, P.; Venkatraman, B.; Senthilkumar, G.; Eswaran, P.; Rajalakshmi, A. Natural radioactivity in soil samples of Yelagiri Hills, Tamil Nadu, India and the associated radiation hazards. Radiat. Phys. Chem. 2012, 81, 1789–1795. [Google Scholar] [CrossRef]
- Abdel Gawad, A.E.; Ali, K.; Eliwa, H.; Sayyed, M.I.; Khandaker, M.U.; Bradley, D.A.; Osman, H.; Elesawy, B.H.; Hanfi, M.Y. Radiological Investigation on Sediments: A Case Study of Wadi Rod Elsayalla the Southeastern Desert of Egypt. Appl. Sci. 2021, 11, 11884. [Google Scholar] [CrossRef]
- Ali, K.G.; Eliwa, H.A.; Masoud, S.M.; Murata, M.; Abdel Gawad, A.E. Structural evolution of Wadi Road El-Sayalla area, Eastern Desert, Egypt. N. Ural. State Min. Univ. 2018, 4, 7–17. [Google Scholar] [CrossRef]
- Abdel Gawad, A.E. Mineral chemistry (U, Th, Zr, REE) in accessory minerals from Wadi Rod Elsayalla granitoids, South Eastern Desert, Egypt. Arab. J. Geosci. 2021, 14, 1–17. [Google Scholar] [CrossRef]
- Grasty, R.L.; Holman, P.B.; Blanchard, Y.B. Transportable Calibration Pads for Ground and Airborne Gammaray Spectrometers; Geological Survey of Canada: Ottawa, ON, Canada, 1991; Volume 90. [Google Scholar]
- Clark, S.P.J.; Peterman, Z.E.; Heier, K.S. Abundances in uranium, thorium and potassium. In Handbook of Physical Constants; Memoir; Geological Society of America: Boulder, CO, USA, 1966; Volume 97, pp. 521–541. [Google Scholar]
- Kimura, J.-I.; Yamada, Y. Evaluation of major and trace element XRF analyses using a flux to sample ratio of two to one glass beads. J. Mineral. Petrol. Econ. Geol. 1996, 91, 62–72. [Google Scholar] [CrossRef] [Green Version]
- Galbraith, J.H.; Saunders, D.F. Rock classification by characteristics of aerial gamma ray measurements. J. Geochem. Explor. 1983, 18, 49–73. [Google Scholar] [CrossRef]
- Middlemost, E.A.K. Naming Materials in the Magma/Igneous Rock System. Earth-Sci. Rev. 1994, 37, 215–244. [Google Scholar] [CrossRef]
- Rickwood, P.C. Boundary line within petrologic diagrams which use oxides of major and minor elements. Lithos 1989, 22, 247–263. [Google Scholar] [CrossRef]
- Maniar, P.D.; Piccoli, P.M. Tectonic discrimination of granitoids. Geol. Soc. Am. Bull. 1989, 101, 635–643. [Google Scholar] [CrossRef]
- Pearce, J.A.; Harris, N.B.W.; Tindle, G. Trace elements discrimination diagram for the tectonic interpretation of granitic rocks. J. Petrol. 1984, 25, 956–983. [Google Scholar] [CrossRef] [Green Version]
- Whalen, J.B.; Currie, K.L.; Chappell, B.W. A-type granites: Geochemical characteristics, discrimination and petrogenesis. Contrib. Min. Petrol. 1987, 95, 407–419. [Google Scholar] [CrossRef]
- Sylvester, P.J. Post-collisional alkaline granites. J. Geol. 1989, 97, 261–280. [Google Scholar] [CrossRef]
- Vidal, P.; Dosso, L.; Bowden, P.; Lameyre, J. Strontium isotope geochemistry in syenite-alkaline granite complexes. In Origin and Distribution of the Elements (2nd Symposium); Ahrens, L.H., Ed.; Pergamon Press: Oxford, UK, 1979; pp. 223–231. [Google Scholar]
- O’Halloran, D.A. Ras ed Dom migrating complex: A-type granites and syenites from the Bauda Desert, Sudan. J. Afr. Earth Sci. 1985, 3, 61–75. [Google Scholar] [CrossRef]
- Shaw, D.M. A review of K/Rb fractionation trends by covariance analysis. Geochim. Cosmochim. Acta 1968, 32, 573–601. [Google Scholar] [CrossRef]
- Mason, B. Principles of Geochemistry, 3rd ed.; John Wiely: New York, NY, USA, 1966; 310p. [Google Scholar]
- Sun, S.S.; McDnough, W.F. Chemical and isotopic systematics of oceanic basalts: Implications for mantle composition and processes. In Magmatism in the Ocean Basins; Saunders, A.D., Norry, M.J., Eds.; Special Publications; Geological Society: London, UK, 1989; Volume 42, pp. 313–345. [Google Scholar]
- Gaafar, I.M.; Ali, K.G.; Meira, M.I. Integration of airborne and carborne gamma-ray spectrometric surveys, Wadi Elgidami area, Central Eastern Desert, Egypt. Egypt Geophys. Soc. J. 2014, 12, 65–78. [Google Scholar]
- Abdel Gawad, A.E.; Ghoneim, M.M.; El-Taher, A.; Ramadan, A.A. Mineral chemistry aspects of U-, Th-, REE-, Cu-bearing minerals at El-Regeita shear zone, South Central Sinai, Egypt. Arab. J. Geosci. 2021, 14, 1356. [Google Scholar] [CrossRef]
- Awad, M.; El Mezayen, A.M.; El Azab, A.; Alfi, S.M.; Ali, H.H.; Hanfi, M.Y. Radioactive risk assessment of beach sand along the coastline of Mediterranean Sea at El-Arish area, North Sinai, Egypt. Mar. Pollut. Bull. 2022, 177, 113494. [Google Scholar] [CrossRef] [PubMed]
- Hanfi, M.Y.; Emad, B.M.; Sayyed, M.I.; Khandaker, M.U.; Bradley, D.A. Natural radioactivity in the prospecting tunnel in Egypt: Dose rate and risk assessment. Radiat. Phys. Chem. 2021, 187, 109555. [Google Scholar] [CrossRef]
- Abdel-Razek, Y.A.; Masoud, M.S.; Hanfi, M.Y.; El-Nagdy, M.S. Effective radiation doses from natural sources at Seila area South Eastern Desert, Egypt. J. Taibah Univ. Sci. 2016, 10, 271–280. [Google Scholar] [CrossRef] [Green Version]
- Asaduzzaman, K.; Mannan, F.; Khandaker, M.U. Assessment of natural radioactivity levels and potential radiological risks of common building materials used in bangladeshi dwellings. PLoS ONE 2015, 10, e0140667. [Google Scholar] [CrossRef] [Green Version]
- U.S. Environmental Protection Agency. Radiogenic Cancer Risk Models and Projections for the U.S. Population; EPA 402-R-11-001; U.S. Environmental Protection Agency: Washington, DC, USA, 2011.
- Sivakumar, S.; Chandrasekaran, A.; Senthilkumar, G.; Suresh Gandhi, M.; Ravisankar, R. Determination of radioactivity levels and associated hazards of coastal sediment from south east coast of Tamil Nadu with statistical approach. Iran. J. Sci. Technol. Trans. A Sci. 2018, 42, 601–614. [Google Scholar] [CrossRef]
- Qureshi, A.A.; Tariq, S.; Kamal, U.; Manzoor, S.; Calligaris, C.; Waheed, A. ScienceDirect Evaluation of excessive lifetime cancer risk due to natural radioactivity in the rivers sediments of Northern Pakistan. J. Radiat. Res. Appl. Sci. 2014, 7, 438–447. [Google Scholar] [CrossRef] [Green Version]
- O’Brien, K.; Sanna, R. The Distribution of Absorbed Dose-rates in Humans from Exposure to Environmental Gamma Rays. Health Phys. 1976, 30, 71–78. [Google Scholar] [CrossRef]
- International Commission on Radiological Protection. Age-Dependent Doses to Members of the Public from Intake of Radionuclides—Part 4 Inhalation Dose Coefficients; ICRP Report; International Commission on Radiological Protection Publication: Pergamon, Turkey, 1996; Volume 71. [Google Scholar]
- Ababneh, Z.Q.; Alyassin, A.M.; Aljarrah, K.M.; Ababneh, A.M. Measurement of natural and artificial radioactivity in powdered milk consumed in Jordan and estimates of the corresponding annual effective dose. Radiat. Prot. Dosim. 2009, 138, 278–283. [Google Scholar] [CrossRef] [PubMed]

 alkali feldspar granite and
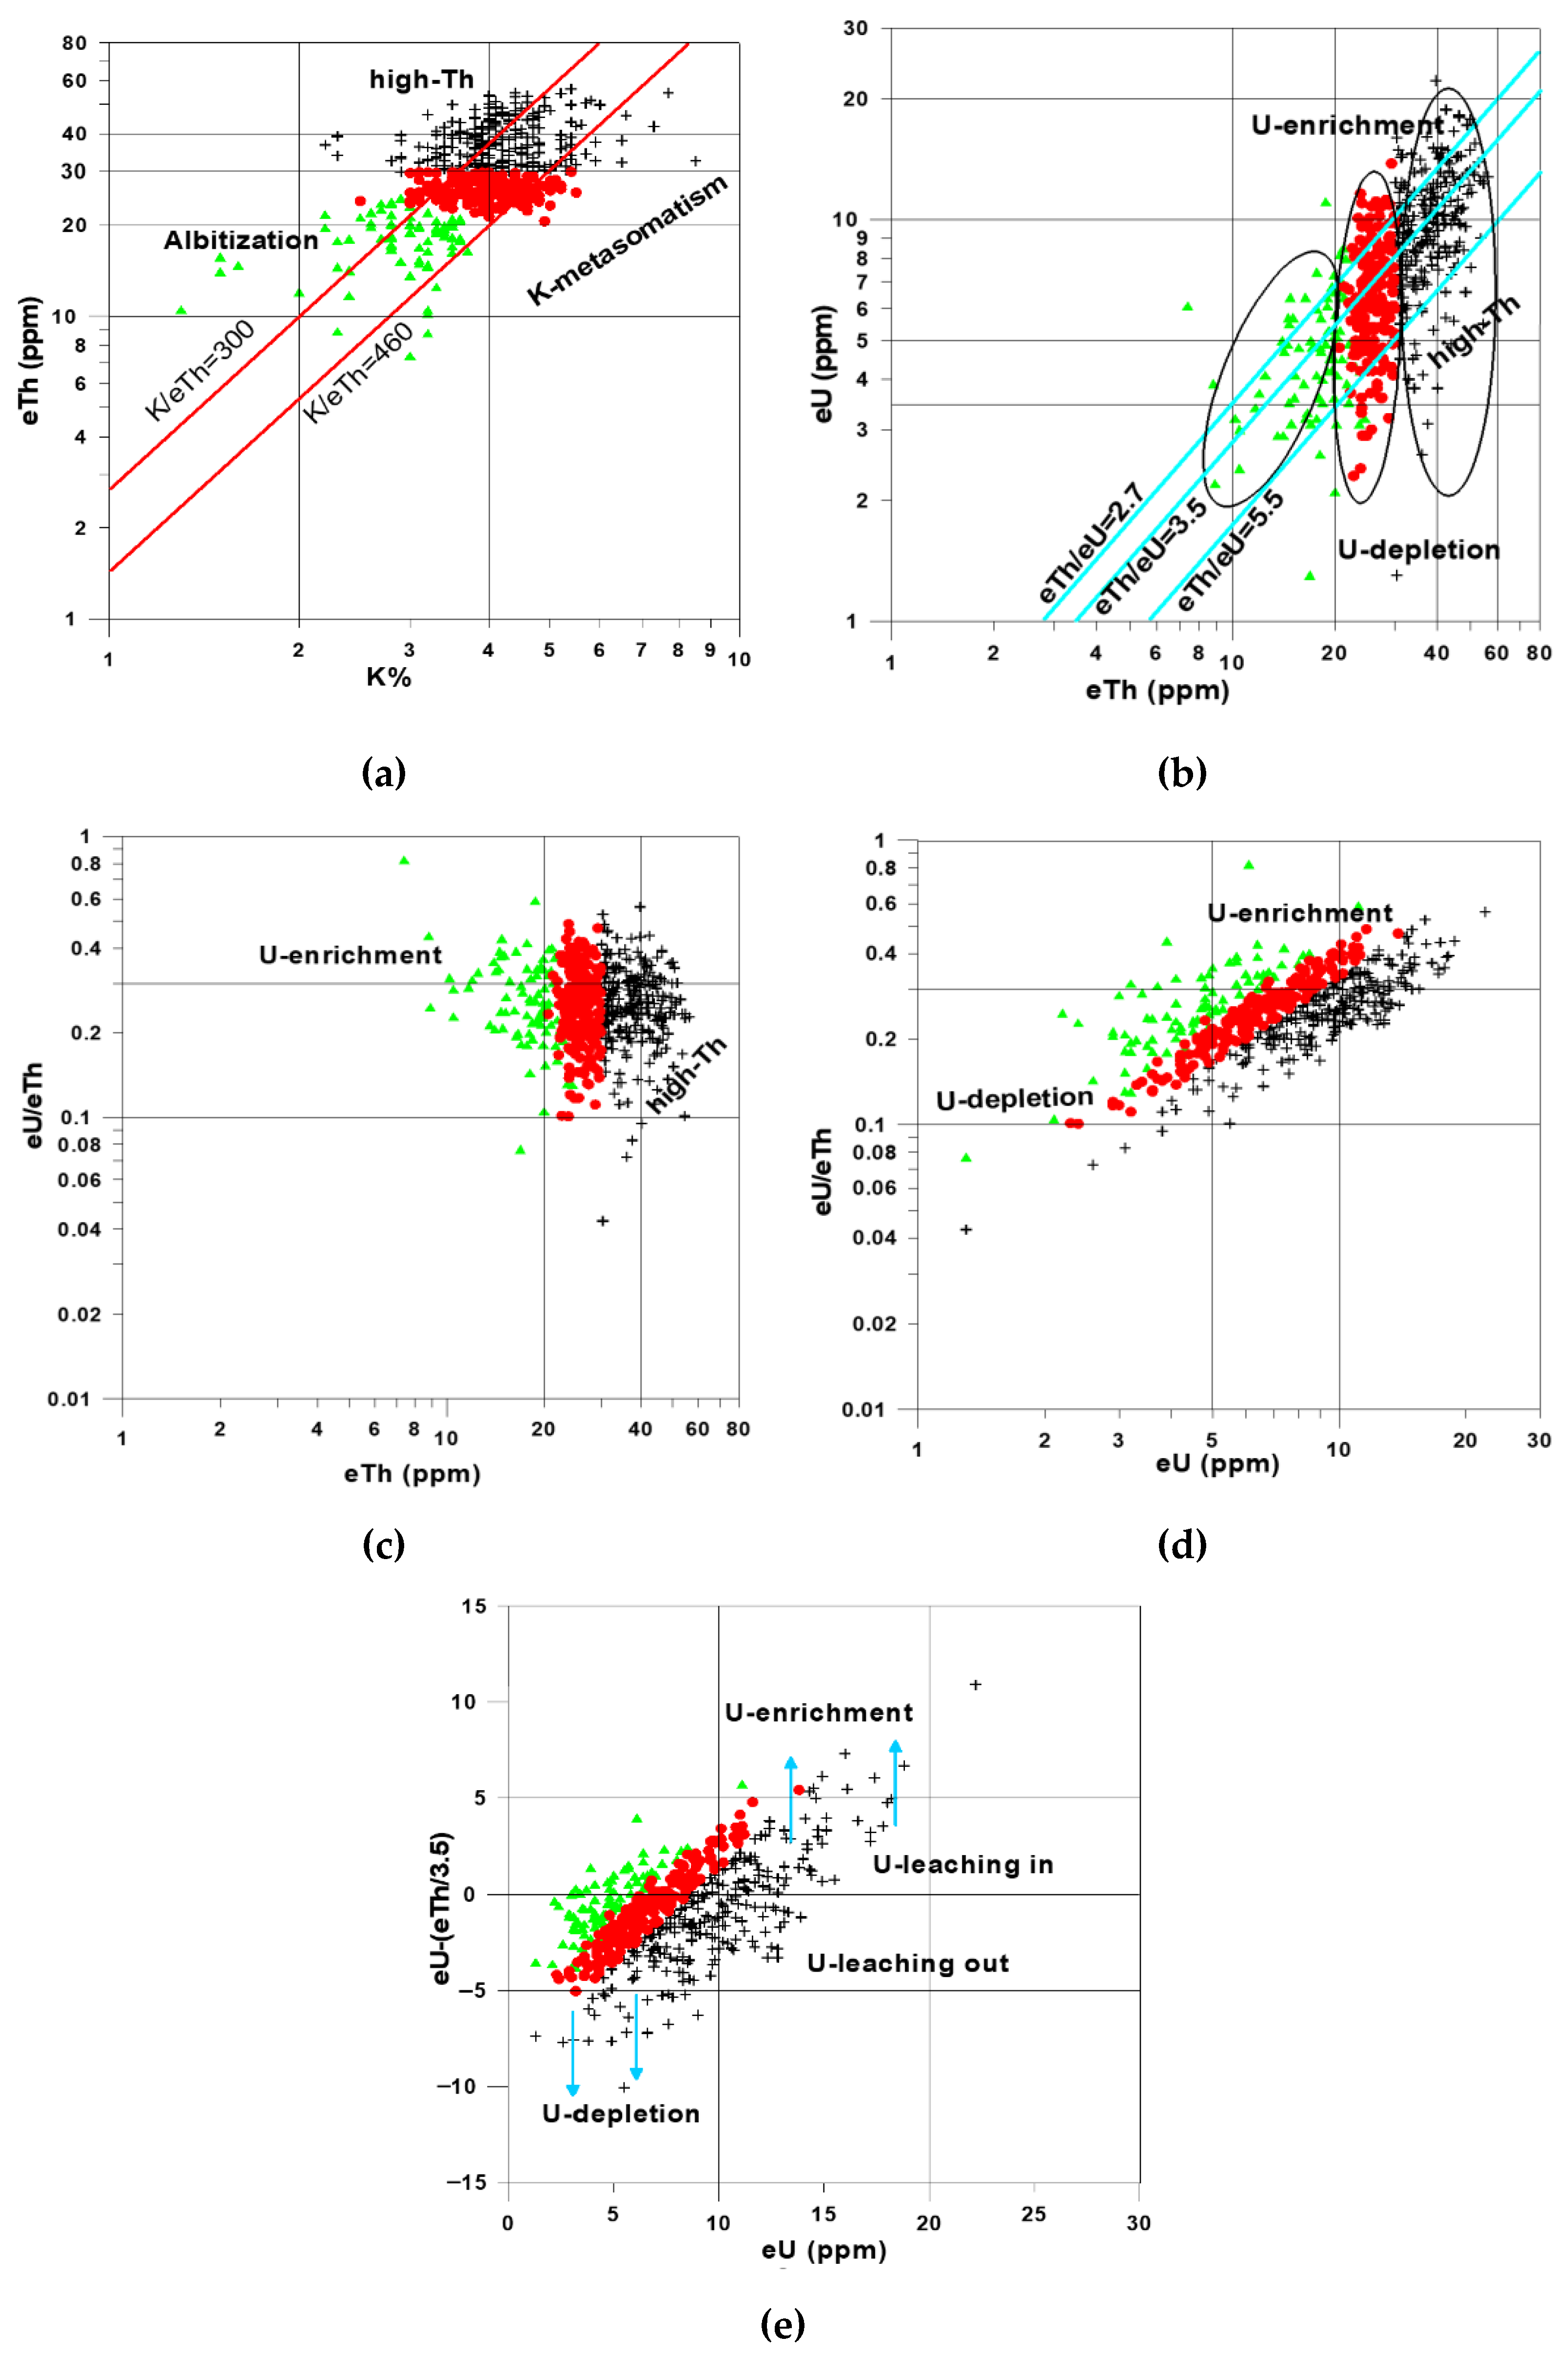
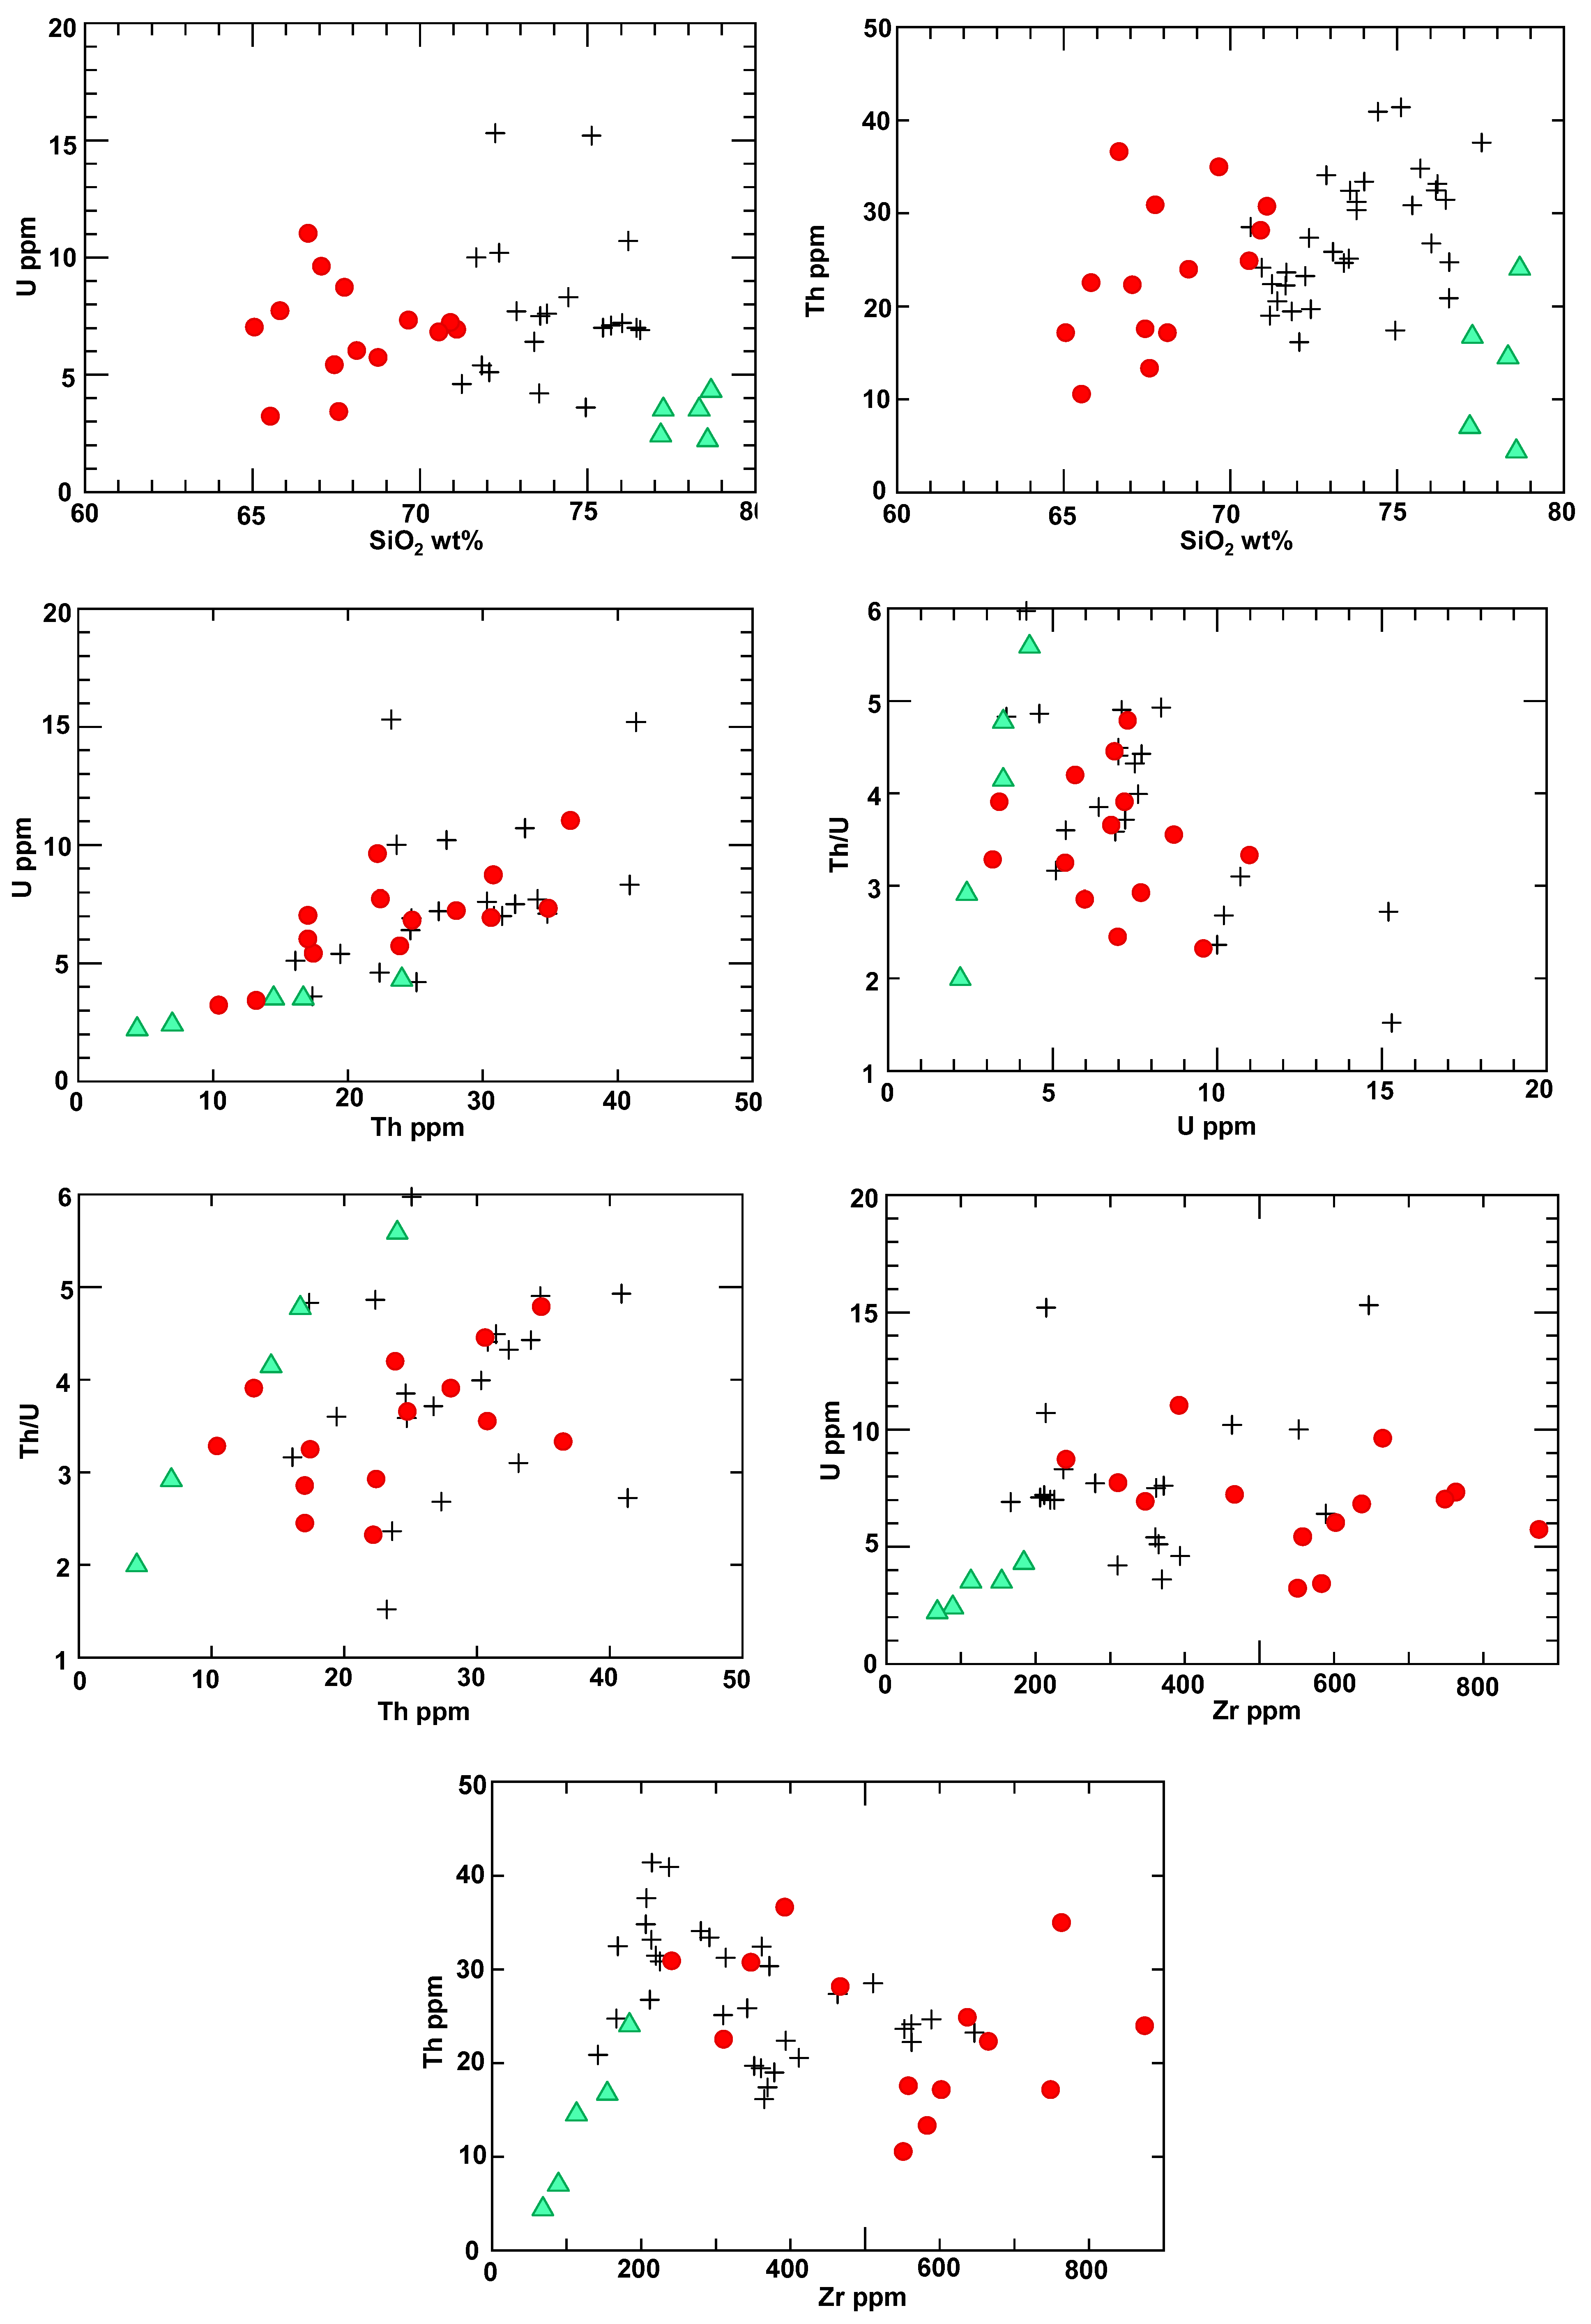
  quartz syenite); diagram axes indicate data plots in logarithmic scale. (a) eTh (ppm) vs. K %; (b) eU (ppm) vs. eTh (ppm); (c) eU/eTh ratio vs. eTh (ppm); (d) eU/eTh ratio vs. eU (ppm); (e) eU-(eTh/3.5) vs. eU (ppm) binary diagrams.
alkali feldspar granite and quartz syenite); diagram axes indicate data plots in logarithmic scale. (a) eTh (ppm) vs. K %; (b) eU (ppm) vs. eTh (ppm); (c) eU/eTh ratio vs. eTh (ppm); (d) eU/eTh ratio vs. eU (ppm); (e) eU-(eTh/3.5) vs. eU (ppm) binary diagrams.
quartz syenite); diagram axes indicate data plots in logarithmic scale. (a) eTh (ppm) vs. K %; (b) eU (ppm) vs. eTh (ppm); (c) eU/eTh ratio vs. eTh (ppm); (d) eU/eTh ratio vs. eU (ppm); (e) eU-(eTh/3.5) vs. eU (ppm) binary diagrams.
alkali feldspar granite and quartz syenite); diagram axes indicate data plots in logarithmic scale. (a) eTh (ppm) vs. K %; (b) eU (ppm) vs. eTh (ppm); (c) eU/eTh ratio vs. eTh (ppm); (d) eU/eTh ratio vs. eU (ppm); (e) eU-(eTh/3.5) vs. eU (ppm) binary diagrams. alkali feldspar granite and quartz syenite).
alkali feldspar granite and quartz syenite).
alkali feldspar granite and quartz syenite).
 alkali feldspar granite and quartz syenite).
alkali feldspar granite and quartz syenite).
alkali feldspar granite and quartz syenite).
 alkali feldspar granite and quartz syenite).
alkali feldspar granite and quartz syenite).
alkali feldspar granite and quartz syenite).
 alkali feldspar granite and quartz syenite).
alkali feldspar granite and quartz syenite).
alkali feldspar granite and quartz syenite). alkali feldspar granite and quartz syenite).
alkali feldspar granite and quartz syenite).
alkali feldspar granite and quartz syenite). alkali feldspar granite and quartz syenite).
alkali feldspar granite and quartz syenite).
alkali feldspar granite and quartz syenite).


| Radioelements/St. Par. | K% | eU (ppm) | eTh (ppm) | eU/eTh | eTh/K | eU-(eTh/3.5) (ppm) |
|---|---|---|---|---|---|---|
| Syenogranite | ||||||
| Min. | 2.20 | 1.30 | 25.60 | 0.04 | 3.82 | −10.04 |
| Average | 4.24 | 9.88 | 38.36 | 0.26 | 9.30 | −1.08 |
| Max. | 8.50 | 22.20 | 56.30 | 0.56 | 17.09 | 10.89 |
| S.D. | 0.83 | 3.28 | 6.48 | 0.08 | 2.04 | 3.05 |
| No. | 246 | |||||
| Alkali feldspar granite | ||||||
| Min. | 1.30 | 1.30 | 7.40 | 0.10 | 2.50 | −3.80 |
| Average | 2.90 | 4.70 | 17.80 | 0.30 | 6.20 | −0.30 |
| Max. | 3.70 | 6.80 | 24.50 | 0.80 | 10.50 | 5.70 |
| S.D. | 0.50 | 1.60 | 3.70 | 0.10 | 1.60 | 1.70 |
| No. | 82 | |||||
| Quartz syenite | ||||||
| Min. | 2.50 | 2.3 | 20.60 | 0.10 | 4.2 | −5.03 |
| Average | 4.00 | 6.67 | 25.95 | 0.26 | 6.61 | −0.75 |
| Max. | 5.50 | 13.8 | 30.00 | 0.49 | 9.9 | 5.43 |
| S.D. | 0.54 | 2.12 | 2.19 | 0.08 | 1.07 | 2.07 |
| No. | 182 | |||||
| Microgranite dikes | ||||||
| Min. | 1.30 | 6.50 | 28.70 | 0.001 | 3.70 | −83.60 |
| Average | 5.20 | 17.20 | 107.2 | 0.20 | 36.10 | −13.40 |
| Max. | 11.30 | 41.30 | 371.1 | 0.60 | 185.6 | 16.70 |
| S.D. | 3.10 | 8.50 | 88.20 | 0.10 | 43.40 | 22.60 |
| No. | 48 | |||||
| Rock | Syenogranite | ||||||||||||||||
|---|---|---|---|---|---|---|---|---|---|---|---|---|---|---|---|---|---|
| S. No. | 1 | 3 | 4 | 5 | 6 | 8 | 10 | 11 | 13 | 16 | 17 | 18 | 19 | 20 | 25 | 27 | 30 |
| Major oxides (wt%) | |||||||||||||||||
| SiO2 | 71.85 | 72.07 | 71.19 | 71.25 | 71.41 | 72.42 | 73.79 | 73.56 | 76.56 | 75.7 | 76.17 | 77.54 | 73.79 | 70.61 | 70.94 | 73.08 | 76.57 |
| TiO2 | 0.19 | 0.15 | 0.18 | 0.18 | 0.19 | 0.13 | 0.14 | 0.12 | 0.06 | 0.07 | 0.07 | 0.07 | 0.14 | 0.19 | 0.18 | 0.17 | 0.08 |
| Al2O3 | 14.4 | 14.51 | 14.76 | 14.62 | 14.62 | 14.42 | 13.95 | 13.82 | 12.69 | 12.97 | 12.76 | 12.67 | 13.55 | 14.73 | 14.61 | 13.68 | 12.63 |
| Fe2O3 * | 2.74 | 2.40 | 2.71 | 2.77 | 2.84 | 2.26 | 1.95 | 1.97 | 1.50 | 1.50 | 1.39 | 0.43 | 2.16 | 2.95 | 2.83 | 2.53 | 1.37 |
| MnO | 0.06 | 0.05 | 0.06 | 0.06 | 0.06 | 0.06 | 0.04 | 0.04 | 0.02 | 0.04 | 0.03 | 0.01 | 0.04 | 0.07 | 0.09 | 0.05 | 0.02 |
| MgO | 0.15 | 0.08 | 0.12 | 0.12 | 0.13 | 0.07 | 0.13 | 0.08 | 0.02 | 0.03 | 0.03 | 0.02 | 0.12 | 0.12 | 0.04 | 0.12 | 0.00 |
| CaO | 0.80 | 0.66 | 0.90 | 1.06 | 0.91 | 0.63 | 0.63 | 0.74 | 0.33 | 0.55 | 0.56 | 0.49 | 0.73 | 0.85 | 0.71 | 0.83 | 0.29 |
| Na2O | 5.12 | 5.39 | 5.30 | 5.26 | 5.18 | 5.25 | 4.24 | 5.15 | 4.95 | 4.74 | 4.78 | 4.68 | 4.95 | 5.80 | 5.26 | 5.11 | 4.70 |
| K2O | 4.66 | 4.66 | 4.74 | 4.66 | 4.65 | 4.73 | 5.12 | 4.50 | 3.87 | 4.39 | 4.20 | 4.08 | 4.48 | 4.67 | 5.33 | 4.38 | 4.34 |
| P2O5 | 0.03 | 0.02 | 0.03 | 0.03 | 0.03 | 0.02 | 0.02 | 0.01 | 0.01 | 0.02 | 0.02 | 0.01 | 0.03 | 0.02 | 0.01 | 0.03 | 0.01 |
| Total | 100 | 99.99 | 99.99 | 100 | 100 | 99.99 | 100 | 99.99 | 100 | 99.99 | 99.99 | 99.99 | 99.99 | 100 | 100 | 99.98 | 100 |
| * CIPW norm | |||||||||||||||||
| Qz | 22.65 | 21.73 | 20.58 | 21.00 | 21.73 | 22.64 | 28.02 | 25.2 | 32.36 | 30.8 | 31.84 | 34.04 | 26.61 | 17.86 | 19.03 | 25.25 | 32.19 |
| Or | 27.54 | 27.54 | 28.01 | 27.54 | 27.48 | 27.95 | 30.29 | 26.59 | 22.87 | 25.97 | 24.85 | 24.14 | 26.47 | 27.6 | 31.5 | 25.88 | 25.65 |
| Ab | 43.32 | 45.61 | 44.85 | 44.51 | 43.83 | 44.42 | 35.84 | 43.58 | 41.89 | 40.06 | 40.4 | 39.56 | 41.89 | 49.08 | 44.51 | 43.24 | 39.77 |
| An | 2.55 | 1.63 | 2.48 | 2.52 | 2.91 | 1.81 | 3.13 | 1.30 | 0.98 | 1.11 | 0.92 | 1.48 | 1.52 | 0.36 | 0.51 | 1.45 | 0.55 |
| Cor | 0 | 0 | 0 | 0 | 0 | 0 | 0.27 | 0 | 0 | 0 | 0 | 0 | 0 | 0 | 0 | 0 | 0 |
| Di/en | 0.62 | 0.43 | 0.64 | 0.64 | 0.70 | 0.38 | 0.00 | 0.43 | 0.11 | 0 | 0 | 0 | 0.64 | 0.64 | 0.21 | 0.64 | 0 |
| Hy | 0.08 | 0 | 0 | 0 | 0 | 0 | 0 | 0 | 0 | 0 | 0 | 0 | 0 | 0 | 0 | 0 | 0 |
| Di/wo | 0 | 0.26 | 0.24 | 0.55 | 0.04 | 0.2 | 0 | 0.62 | 0.16 | 0.09 | 0.09 | 0.06 | 0.31 | 1.05 | 1.00 | 0.52 | 0.29 |
| Ac | 0 | 0 | 0 | 0 | 0 | 0 | 0 | 0 | 0 | 0.08 | 0.08 | 0.05 | 0 | 0 | 0 | 0 | 0 |
| Ilm | 0.13 | 0.11 | 0.13 | 0.13 | 0.13 | 0.13 | 0 | 0.09 | 0.04 | 0 | 0 | 0 | 0.09 | 0.15 | 0.19 | 0.11 | 0.04 |
| Hm | 2.74 | 2.40 | 2.71 | 2.77 | 2.84 | 2.26 | 0.33 | 1.97 | 1.50 | 0 | 0 | 0 | 2.16 | 2.95 | 2.83 | 2.53 | 1.37 |
| Ap | 0.07 | 0.05 | 0.07 | 0.07 | 0.07 | 0.05 | 0.13 | 0.02 | 0 | 0.13 | 0.10 | 0.03 | 0.07 | 0.05 | 0.02 | 0.07 | 0 |
| Tn | 0.30 | 0.23 | 0.28 | 0.28 | 0.30 | 0.15 | 1.86 | 0.18 | 0.09 | 1.41 | 1.32 | 0.41 | 0.23 | 0.27 | 0.19 | 0.28 | 0.14 |
| Ru | 0 | 0 | 0 | 0 | 0 | 0 | 0 | 0 | 0 | 0 | 0 | 0 | 0 | 0 | 0 | 0 | 0 |
| Elements (ppm) | |||||||||||||||||
| Ce | 155.80 | 175.00 | 135.30 | 143.70 | 155.20 | 146.80 | 128.20 | 110.90 | 27.90 | 76.40 | 56.70 | 51.90 | 105.90 | 138.50 | 252.40 | 128.30 | 41.20 |
| Th | 19.44 | 16.12 | 18.98 | 22.36 | 20.53 | 19.68 | 30.32 | 25.09 | 20.85 | 34.79 | 32.45 | 37.57 | 31.22 | 28.49 | 24.13 | 25.84 | 24.72 |
| U | 5.40 | 5.10 | 4.60 | 7.60 | 4.20 | 7.10 | 6.90 | ||||||||||
| Cr | 86.00 | 50.30 | 95.40 | 129.5 | 96.40 | 120.20 | 153.0 | 75.20 | 168.2 | 139.2 | 71.30 | 104.9 | 115.0 | 107.6 | 69.2 | 84.60 | 139.4 |
| Y | 42.70 | 39.80 | 45.00 | 46.10 | 45.40 | 47.10 | 56.40 | 46.80 | 36.80 | 55.00 | 49.10 | 45.70 | 52.10 | 51.40 | 54.90 | 49.00 | 48.40 |
| Nb | 96.92 | 76.18 | 85.99 | 87.20 | 85.36 | 90.85 | 141.1 | 102.5 | 110.5 | 113.3 | 102.6 | 104.5 | 125.6 | 130.8 | 88.37 | 116.5 | 151.5 |
| Zr | 360.7 | 365.00 | 378.6 | 394.0 | 411.8 | 351.6 | 371.7 | 310.0 | 142.5 | 206.4 | 169. | 207.2 | 313.5 | 511.0 | 562.1 | 342.3 | 166.8 |
| Ni | 0.30 | 2.00 | 0.70 | 1.20 | 0.30 | 0.60 | 3.20 | 1.30 | 1.50 | 0.60 | 0.20 | 0.70 | 0.20 | 0.30 | 0.70 | 0.50 | 0.10 |
| Ba | 338.7 | 414.5 | 467.0 | 435.1 | 450.2 | 382.8 | 260.3 | 285.3 | 66.10 | 88.50 | 79.50 | 86.60 | 200.3 | 297.0 | 156.0 | 237.2 | 74.40 |
| Pb | 9.80 | 7.80 | 9.70 | 9.40 | 8.70 | 7.00 | 10.50 | 9.10 | 7.30 | 8.20 | 6.70 | 6.70 | 8.10 | 11.40 | 10.70 | 8.70 | 5.00 |
| Rb | 147.4 | 149.5 | 151.3 | 151.8 | 142.4 | 154.2 | 215.5 | 173.6 | 122.6 | 239.0 | 203.3 | 208.8 | 198.1 | 209.0 | 138.8 | 177.3 | 160.5 |
| Sr | 83.90 | 91.10 | 103.70 | 98.80 | 98.70 | 76.10 | 86.00 | 60.40 | 7.90 | 14.90 | 18.80 | 17.70 | 50.00 | 78.10 | 31.30 | 66.10 | 8.80 |
| Rock | Syenogranite | Alkali Feldspar Granite | |||||||||||||||
| S. No. | 32 | 33 | 34 | 38 | 45 | 46 | 47 | 49 | 55 | 57 | 58 | 59 | 61 | 62 | 84 | 15 | 39 |
| Major oxides (wt%) | |||||||||||||||||
| SiO2 | 76.03 | 75.46 | 76.46 | 76.21 | 71.66 | 73.41 | 72.25 | 73.59 | 72.88 | 74.43 | 72.36 | 74.95 | 71.68 | 75.12 | 74.02 | 78.68 | 77.18 |
| TiO2 | 0.09 | 0.08 | 0.07 | 0.07 | 0.16 | 0.14 | 0.17 | 0.15 | 0.19 | 0.15 | 0.16 | 0.14 | 0.19 | 0.10 | 0.13 | 0.04 | 0.06 |
| Al2O3 | 12.59 | 12.95 | 12.58 | 12.87 | 14.19 | 13.43 | 13.63 | 13.58 | 13.89 | 13.27 | 15.4 | 13.51 | 13.95 | 13.14 | 13.49 | 12.01 | 12.5 |
| Fe2O3 * | 1.61 | 1.65 | 1.45 | 1.36 | 2.84 | 2.51 | 3.10 | 2.33 | 2.63 | 2.18 | 1.32 | 1.92 | 3.01 | 1.50 | 2.07 | 0.70 | 1.09 |
| MnO | 0.05 | 0.04 | 0.03 | 0.02 | 0.07 | 0.07 | 0.08 | 0.06 | 0.04 | 0.04 | 0.02 | 0.02 | 0.08 | 0.03 | 0.04 | 0.02 | 0.01 |
| MgO | 0.05 | 0.03 | 0.02 | 0.04 | 0.05 | 0.02 | 0.07 | 0.08 | 0.17 | 0.13 | 0.02 | 0.03 | 0.05 | 0.05 | 0.10 | 0.05 | 0.01 |
| CaO | 0.56 | 0.48 | 0.39 | 0.35 | 0.67 | 0.71 | 0.75 | 0.67 | 0.82 | 0.69 | 0.20 | 0.30 | 0.68 | 0.70 | 0.70 | 0.23 | 0.18 |
| Na2O | 4.67 | 4.81 | 4.83 | 4.77 | 5.18 | 4.88 | 5.32 | 5.03 | 4.77 | 4.59 | 4.69 | 4.24 | 5.49 | 4.65 | 4.96 | 4.66 | 4.85 |
| K2O | 4.34 | 4.49 | 4.16 | 4.31 | 5.17 | 4.8 | 4.61 | 4.48 | 4.57 | 4.50 | 5.80 | 4.87 | 4.87 | 4.68 | 4.47 | 3.62 | 4.12 |
| P2O5 | 0.01 | 0.02 | 0.01 | 0.01 | 0.01 | 0.01 | 0.02 | 0.02 | 0.04 | 0.03 | 0.03 | 0.02 | 0.01 | 0.02 | 0.02 | 0.01 | 0.02 |
| Total | 99.99 | 99.99 | 99.99 | 100 | 100 | 99.98 | 100 | 99.99 | 100 | 100 | 100 | 100 | 100 | 99.99 | 100 | 100 | 100 |
| CIPW norm | |||||||||||||||||
| Qz | 31.46 | 29.64 | 31.92 | 31.32 | 20.92 | 25.76 | 22.91 | 26.11 | 25.92 | 29.12 | 22.51 | 31.02 | 20.74 | 28.54 | 26.90 | 37.18 | 39.00 |
| Or | 25.65 | 26.53 | 24.58 | 25.47 | 30.55 | 28.37 | 27.24 | 26.47 | 27.01 | 26.59 | 34.27 | 28.78 | 28.78 | 28.72 | 26.42 | 39.43 | 32.96 |
| Ab | 39.52 | 40.70 | 40.87 | 40.36 | 43.83 | 41.29 | 44.44 | 42.56 | 40.36 | 38.84 | 39.69 | 35.88 | 44.64 | 39.35 | 41.97 | 21.39 | 24.35 |
| An | 0.57 | 0.48 | 0.36 | 0.98 | 0.20 | 0.56 | 0 | 1.24 | 2.99 | 2.31 | 0.80 | 1.36 | 0 | 0.63 | 1.34 | 1.08 | 1.04 |
| Cor | 0 | 0 | 0 | 0 | 0 | 0 | 0 | 0 | 0 | 0 | 1.11 | 0.77 | 0 | 0 | 0 | 0.03 | 0.17 |
| Di/en | 0.27 | 0.16 | 0.11 | 0.21 | 0.27 | 0.11 | 0.38 | 0.43 | 0.24 | 0.43 | 0 | 0 | 0.27 | 0.27 | 0.54 | 0 | 0 |
| Hy | 0 | 0 | 0 | 0 | 0 | 0 | 0 | 0 | 0.31 | 0.13 | 0.05 | 0.07 | 0 | 0 | 0 | 0.12 | 0.05 |
| Di/wo | 0.73 | 0.66 | 0.55 | 0.13 | 1.02 | 1.06 | 1.18 | 0.46 | 0 | 0 | 0 | 0 | 1.09 | 0.89 | 0.42 | 0 | 0 |
| Ac | 0 | 0 | 0 | 0 | 0 | 0.00 | 0.51 | 0 | 0 | 0 | 0 | 0 | 1.60 | 0 | 0 | 0 | 0.20 |
| Ilm | 0.11 | 0.09 | 0.06 | 0.04 | 0.15 | 0.15 | 0.17 | 0.13 | 0.09 | 0.09 | 0.04 | 0.04 | 0.17 | 0.06 | 0.09 | 0.04 | 0 |
| Hm | 1.61 | 1.65 | 1.45 | 1.36 | 2.84 | 2.51 | 2.93 | 2.33 | 2.63 | 2.18 | 1.32 | 1.92 | 2.46 | 1.50 | 2.07 | 0.70 | 0.02 |
| Ap | 0 | 0 | 0 | 0 | 0.02 | 0.02 | 0.05 | 0.05 | 0.09 | 0.07 | 0.07 | 0.05 | 0.02 | 0.05 | 0.05 | 0.02 | 1.09 |
| Tn | 0.08 | 0.09 | 0.09 | 0.12 | 0.20 | 0.15 | 0.20 | 0.20 | 0.36 | 0.26 | 0 | 0 | 0.25 | 0.16 | 0.21 | 0 | 0 |
| Ru | 0 | 0 | 0 | 0 | 0 | 0 | 0 | 0 | 0 | 0 | 0 | 0 | 0 | 0 | 0 | 0 | 0.12 |
| Elements (ppm) | |||||||||||||||||
| Ce | 79.00 | 72.60 | 64.10 | 57.10 | 214.0 | 221.9 | 184.4 | 164.2 | 107.2 | 102.2 | 67.80 | 32.60 | 184.3 | 76.80 | 88.00 | 28.30 | 52.10 |
| Th | 26.73 | 30.83 | 31.44 | 33.13 | 22.21 | 24.64 | 23.22 | 32.41 | 34.07 | 40.89 | 27.33 | 17.38 | 23.62 | 41.36 | 33.38 | 24.01 | 6.99 |
| U | 7.20 | 7.00 | 7.00 | 10.70 | 6.40 | 15.30 | 7.50 | 7.70 | 8.30 | 10.20 | 3.60 | 10.00 | 15.20 | 4.30 | 2.40 | ||
| Cr | 98.70 | 166.0 | 111.5 | 80.80 | 52.40 | 194.9 | 129.6 | 72.50 | 118.5 | 159.8 | 72.10 | 150.7 | 83.80 | 66.50 | 140.4 | 108.0 | 237.0 |
| Y | 65.80 | 60.50 | 57.70 | 44.60 | 44.10 | 46.10 | 47.40 | 51.70 | 40.30 | 35.70 | 43.70 | 37.80 | 49.10 | 51.40 | 51.20 | 33.30 | 55.60 |
| Nb | 145.2 | 183.6 | 169.4 | 162.0 | 102.1 | 103.5 | 117.9 | 124.9 | 78.47 | 67.43 | 164.5 | 75.13 | 125.6 | 117.5 | 125.3 | 137.7 | 76.02 |
| Zr | 211.5 | 225.5 | 219.8 | 213.9 | 562.5 | 589.1 | 646.7 | 361.6 | 280.0 | 237.6 | 463.6 | 369.4 | 552.8 | 214.4 | 291.7 | 184.5 | 89.40 |
| Ni | 2.50 | 1.00 | 1.20 | 0.20 | 1.50 | 0.30 | 7.80 | 0.30 | 1.00 | 0.10 | 1.50 | 0.70 | 2.60 | 1.30 | 1.20 | 1.10 | 3.80 |
| Ba | 91.70 | 88.30 | 76.40 | 73.90 | 187.8 | 141.2 | 224.0 | 234.6 | 257.4 | 232.2 | 335.0 | 316.0 | 218.3 | 141.5 | 178.5 | 81.40 | 43.90 |
| Pb | 8.80 | 13.70 | 15.20 | 4.80 | 5.30 | 3.90 | 5.00 | 5.40 | 6.10 | 5.40 | 5.30 | 3.80 | 9.10 | 6.50 | 9.90 | 2.20 | 3.00 |
| Rb | 175.6 | 191.4 | 205.3 | 204.0 | 140.5 | 136.2 | 183.2 | 195.80 | 204.2 | 212.8 | 208.3 | 151.8 | 201.0 | 265.2 | 205.0 | 172.0 | 231.7 |
| Sr | 12.40 | 9.30 | 10.00 | 6.50 | 38.20 | 24.00 | 48.00 | 72.00 | 73.40 | 63.90 | 137.8 | 74.00 | 41.10 | 30.70 | 44.10 | 7.60 | 3.10 |
| Rock | Alkali Feldspar Granite | Quartz Syenite | |||||||||||||||
| S. No. | 41 | 42 | 43 | 22 | 23 | 26 | 44 | 48 | 50 | 51 | 56 | 63 | 64 | 67 | 75 | 76 | 68c |
| Major oxides (wt%) | |||||||||||||||||
| SiO2 | 77.26 | 78.33 | 78.58 | 67.47 | 67.6 | 68.14 | 65.56 | 69.68 | 65.85 | 66.69 | 71.12 | 70.93 | 67.08 | 70.58 | 65.08 | 67.77 | 68.77 |
| TiO2 | 0.06 | 0.06 | 0.05 | 0.26 | 0.27 | 0.29 | 0.26 | 0.21 | 0.38 | 0.36 | 0.22 | 0.22 | 0.27 | 0.20 | 0.32 | 0.30 | 0.26 |
| Al2O3 | 12.04 | 11.54 | 11.47 | 15.72 | 15.65 | 15.17 | 17.14 | 15.01 | 15.83 | 15.20 | 14.5 | 14.55 | 15.72 | 14.37 | 16.64 | 14.93 | 15.93 |
| Fe2O3 * | 1.73 | 1.68 | 1.36 | 4.05 | 4.04 | 4.24 | 3.90 | 3.19 | 5.09 | 5.19 | 3.05 | 3.10 | 4.29 | 3.25 | 4.71 | 4.68 | 3.83 |
| MnO | 0.06 | 0.03 | 0.02 | 0.12 | 0.09 | 0.10 | 0.10 | 0.08 | 0.15 | 0.14 | 0.07 | 0.06 | 0.10 | 0.08 | 0.11 | 0.10 | 0.03 |
| MgO | 0.02 | 0.02 | 0.02 | 0.08 | 0.09 | 0.15 | 0.13 | 0.06 | 0.09 | 0.08 | 0.20 | 0.16 | 0.08 | 0.07 | 0.17 | 0.03 | 0.11 |
| CaO | 0.23 | 0.25 | 0.21 | 1.21 | 1.22 | 1.21 | 1.54 | 0.86 | 1.19 | 1.14 | 0.94 | 0.82 | 1.18 | 0.80 | 1.68 | 1.03 | 0.27 |
| Na2O | 4.31 | 4.34 | 4.61 | 6.18 | 6.11 | 5.96 | 6.49 | 5.67 | 5.82 | 5.43 | 5.20 | 5.56 | 6.42 | 5.78 | 6.68 | 5.90 | 4.83 |
| K2O | 4.29 | 3.77 | 3.66 | 4.88 | 4.90 | 4.68 | 4.86 | 5.23 | 5.57 | 5.75 | 4.66 | 4.55 | 4.83 | 4.86 | 4.57 | 5.20 | 5.96 |
| P2O5 | 0.01 | 0.01 | 0.01 | 0.02 | 0.03 | 0.05 | 0.03 | 0.01 | 0.03 | 0.02 | 0.05 | 0.04 | 0.03 | 0.02 | 0.04 | 0.01 | 0.03 |
| Total | 100 | 100 | 99.98 | 99.99 | 100 | 99.99 | 100 | 100 | 100 | 100 | 100 | 99.99 | 100 | 100 | 100 | 99.95 | 100 |
| CIPW norm | |||||||||||||||||
| Qz | 37.02 | 38.05 | 39.04 | 11.30 | 11.74 | 13.94 | 6.70 | 15.67 | 9.18 | 11.76 | 11.27 | 19.83 | 9.99 | 17.9 | 6.32 | 12.89 | 17.21 |
| Or | 35.32 | 35.17 | 35.59 | 28.84 | 28.96 | 27.66 | 28.72 | 30.91 | 32.92 | 33.98 | 27.54 | 26.89 | 28.54 | 28.72 | 27.01 | 30.73 | 35.22 |
| Ab | 23.35 | 22.28 | 21.63 | 52.29 | 51.70 | 50.43 | 54.92 | 47.98 | 49.25 | 45.95 | 44.00 | 47.05 | 53.97 | 46.86 | 56.52 | 47.84 | 40.87 |
| An | 1.47 | 1.72 | 1.62 | 0.74 | 0.80 | 0.82 | 3.28 | 0.06 | 0.62 | 0.12 | 2.46 | 1.31 | 0 | 0 | 1.92 | 0 | 1.14 |
| Cor | 0.84 | 0.87 | 0 | 0 | 0 | 0 | 0 | 0 | 0 | 0 | 0 | 0 | 0 | 0 | 0 | 0 | 1.11 |
| Di/en | 0 | 0 | 0 | 0.43 | 0.48 | 0.81 | 0.70 | 0.32 | 0.48 | 0.43 | 11.07 | 0.86 | 0.43 | 0.38 | 0.91 | 0.16 | 0 |
| Hy | 0.11 | 0.11 | 0.11 | 0 | 0 | 0 | 0 | 0 | 0 | 0 | 0 | 0 | 0 | 0 | 0 | 0 | 0.27 |
| Di/wo | 0 | 0 | 0 | 1.73 | 1.60 | 1.34 | 1.15 | 1.38 | 1.56 | 1.73 | 0 | 0.36 | 1.90 | 1.24 | 1.79 | 1.75 | 0 |
| Ac | 0.07 | 0.06 | 0.34 | 0 | 0 | 0 | 0 | 0 | 0 | 0 | 0 | 0.00 | 0.31 | 1.81 | 0.00 | 1.83 | 0 |
| Ilm | 0 | 0 | 0.34 | 0.26 | 0.19 | 0.21 | 0.21 | 0.17 | 0.32 | 0.30 | 0.15 | 0.13 | 0.21 | 0.17 | 0.24 | 0.21 | 0.06 |
| Hm | 0.11 | 0.06 | 0.04 | 4.05 | 4.04 | 4.24 | 3.90 | 3.19 | 5.09 | 5.19 | 3.05 | 3.10 | 4.18 | 2.63 | 4.71 | 4.05 | 3.83 |
| Ap | 1.73 | 1.68 | 1.24 | 0.05 | 0.07 | 0.12 | 0.07 | 0.02 | 0.07 | 0.05 | 0.12 | 0.09 | 0.07 | 0.05 | 0.09 | 0.02 | 0.07 |
| Tn | 0 | 0 | 0 | 0.31 | 0.41 | 0.44 | 0.36 | 0.29 | 0.52 | 0.50 | 0.35 | 0.37 | 0.39 | 0.27 | 0.48 | 0.46 | 0 |
| Ru | 0 | 0.06 | 0.07 | 0 | 0 | 0 | 0 | 0 | 0 | 0 | 0 | 0 | 0 | 0 | 0 | 0 | 0.29 |
| Elements (ppm) | |||||||||||||||||
| Ce | 97.70 | 62.10 | 38.20 | 211.2 | 194.5 | 213.9 | 107.7 | 301.9 | 326.9 | 527.7 | 120.6 | 141.4 | 204.4 | 189.4 | 239.7 | 469.7 | 78.70 |
| Th | 16.70 | 14.50 | 4.38 | 17.50 | 13.26 | 17.09 | 10.48 | 34.90 | 22.47 | 36.55 | 30.67 | 28.08 | 22.24 | 24.81 | 17.10 | 30.84 | 23.89 |
| U | 3.50 | 3.50 | 2.20 | 5.40 | 3.40 | 6.00 | 3.20 | 7.30 | 7.70 | 11.0 | 6.90 | 7.20 | 9.60 | 6.80 | 7.00 | 8.70 | 5.70 |
| Cr | 140.6 | 198.2 | 121.9 | 65.60 | 54.90 | 88.70 | 53.00 | 80.90 | 30.60 | 50.90 | 121.9 | 124.5 | 74.50 | 85.70 | 39.10 | 83.80 | 85.00 |
| Y | 42.60 | 37.90 | 50.60 | 37.50 | 45.10 | 44.70 | 31.80 | 58.90 | 42.70 | 59.40 | 37.80 | 46.60 | 43.30 | 46.90 | 40.70 | 56.50 | 56.00 |
| Nb | 102.4 | 80.63 | 60.07 | 99.08 | 100.8 | 113.17 | 79.39 | 148.9 | 98.97 | 179.5 | 75.22 | 125.3 | 126.17 | 114.9 | 95.90 | 168.5 | 245.3 |
| Zr | 154.7 | 113.7 | 68.40 | 558.9 | 584.4 | 603.1 | 552.1 | 764.1 | 311.4 | 393.4 | 348.1 | 467.7 | 666.3 | 638.1 | 749.8 | 241.9 | 875.6 |
| Ni | 0.30 | 1.70 | 1.40 | 1.30 | 1.60 | 0.20 | 2.60 | 1.10 | 2.80 | 0.10 | 0.50 | 0.60 | 0.80 | 1.70 | 2.10 | 1.60 | 1.60 |
| Ba | 57.80 | 39.30 | 50.70 | 577.9 | 537.2 | 454.5 | 829.2 | 153.5 | 453.0 | 131.4 | 328.3 | 292.8 | 567.6 | 271.3 | 697.6 | 129.0 | 277.7 |
| Pb | 10.90 | 5.30 | 3.90 | 7.50 | 6.20 | 6.80 | 5.80 | 6.10 | 13.00 | 5.80 | 4.00 | 4.80 | 7.70 | 6.00 | 5.60 | 6.60 | 11.10 |
| Rb | 244.2 | 202.9 | 206.0 | 129.8 | 109.5 | 130.0 | 115.6 | 167.70 | 135.3 | 160.3 | 208.9 | 197.2 | 130.0 | 179.5 | 101.7 | 162.4 | 192.5 |
| Sr | 5.50 | 7.50 | 5.50 | 116.0 | 104.2 | 122.4 | 231.8 | 27.60 | 80.10 | 29.40 | 94.70 | 90.60 | 109.4 | 55.20 | 220.8 | 17.50 | 96.40 |
| Sample | 238U | 232Th | 40K | Dair | AEDout | AEDin | AGDE | ELCRout | ELCRin | ELCRt |
|---|---|---|---|---|---|---|---|---|---|---|
| Bq·kg−1 | Bq·kg−1 | Bq·kg−1 | (nGy/h) | (mSv/y) | (mSv/y) | (mSv/y) | ||||
| Syenogranite | ||||||||||
| S1 | 75 | 122 | 1033 | 150.7 | 0.18 | 0.7 | 1.07 | 0.6 | 2.6 | 3.2 |
| S2 | 158 | 229 | 1690 | 280.4 | 0.34 | 1.4 | 1.97 | 1.2 | 4.8 | 6.0 |
| S3 | 100 | 155 | 1315 | 193.8 | 0.24 | 1.0 | 1.37 | 0.8 | 3.3 | 4.2 |
| S4 | 106 | 145 | 1628 | 203.3 | 0.25 | 1.0 | 1.45 | 0.9 | 3.5 | 4.4 |
| S5 | 184 | 174 | 1753 | 262.1 | 0.32 | 1.3 | 1.85 | 1.1 | 4.5 | 5.6 |
| S6 | 47 | 162 | 1221 | 169.8 | 0.21 | 0.8 | 1.21 | 0.7 | 2.9 | 3.6 |
| S7 | 116 | 133 | 1189 | 182.8 | 0.22 | 0.9 | 1.29 | 0.8 | 3.1 | 3.9 |
| S8 | 162 | 207 | 1440 | 258.6 | 0.32 | 1.3 | 1.82 | 1.1 | 4.4 | 5.5 |
| S9 | 184 | 125 | 1252 | 211.6 | 0.26 | 1.0 | 1.48 | 0.9 | 3.6 | 4.5 |
| S10 | 177 | 185 | 1502 | 254.8 | 0.31 | 1.2 | 1.79 | 1.1 | 4.4 | 5.5 |
| Ave | 131 | 164 | 1402 | 217 | 0.27 | 1.06 | 1.53 | 0.93 | 3.72 | 4.65 |
| SD | 49 | 35 | 239 | 44 | 0.05 | 0.22 | 0.31 | 0.19 | 0.76 | 0.95 |
| Min | 47 | 122 | 1033 | 151 | 0.18 | 0.74 | 1.07 | 0.65 | 2.59 | 3.23 |
| Max | 184 | 229 | 1753 | 280 | 0.34 | 1.38 | 1.97 | 1.20 | 4.81 | 6.02 |
| Alkali feldspar granite | ||||||||||
| AF1 | 40 | 41 | 1002 | 84 | 0.10 | 0.41 | 0.61 | 0.36 | 1.45 | 1.81 |
| AF2 | 91 | 72 | 1002 | 127 | 0.16 | 0.62 | 0.90 | 0.54 | 2.18 | 2.72 |
| AF3 | 62 | 57 | 470 | 82 | 0.10 | 0.40 | 0.58 | 0.35 | 1.41 | 1.76 |
| AF4 | 65 | 84 | 1096 | 126 | 0.15 | 0.62 | 0.90 | 0.54 | 2.16 | 2.70 |
| AF5 | 79 | 67 | 1002 | 118 | 0.14 | 0.58 | 0.84 | 0.51 | 2.02 | 2.53 |
| AF6 | 52 | 97 | 876 | 118 | 0.15 | 0.58 | 0.84 | 0.51 | 2.03 | 2.54 |
| AF7 | 61 | 76 | 939 | 113 | 0.14 | 0.55 | 0.80 | 0.48 | 1.93 | 2.42 |
| AF8 | 86 | 85 | 1127 | 138 | 0.17 | 0.68 | 0.98 | 0.59 | 2.36 | 2.95 |
| AF9 | 51 | 51 | 1033 | 96 | 0.12 | 0.47 | 0.69 | 0.41 | 1.66 | 2.07 |
| AF10 | 68 | 60 | 1002 | 108 | 0.13 | 0.53 | 0.77 | 0.47 | 1.86 | 2.33 |
| Ave | 65 | 69 | 955 | 111 | 0.14 | 0.54 | 0.79 | 0.48 | 1.91 | 2.38 |
| SD | 16 | 17 | 184 | 18 | 0.02 | 0.09 | 0.13 | 0.08 | 0.32 | 0.39 |
| Min | 40 | 41 | 470 | 82 | 0.10 | 0.40 | 0.58 | 0.35 | 1.41 | 1.76 |
| Max | 91 | 97 | 1127 | 138 | 0.17 | 0.68 | 0.98 | 0.59 | 2.36 | 2.95 |
| Quartz syenite | ||||||||||
| Q1 | 59 | 84 | 1534 | 141 | 0.17 | 0.69 | 1.01 | 0.60 | 2.42 | 3.02 |
| Q2 | 64 | 122 | 1690 | 173 | 0.21 | 0.85 | 1.24 | 0.74 | 2.96 | 3.70 |
| Q3 | 111 | 117 | 1158 | 169 | 0.21 | 0.83 | 1.20 | 0.73 | 2.91 | 3.64 |
| Q4 | 98 | 97 | 1064 | 148 | 0.18 | 0.72 | 1.04 | 0.63 | 2.53 | 3.17 |
| Q1 | 52 | 102 | 1502 | 147 | 0.18 | 0.72 | 1.06 | 0.63 | 2.52 | 3.15 |
| Q2 | 59 | 93 | 1440 | 143 | 0.18 | 0.70 | 1.03 | 0.61 | 2.45 | 3.07 |
| Q3 | 74 | 111 | 1377 | 158 | 0.19 | 0.77 | 1.13 | 0.68 | 2.71 | 3.39 |
| Q4 | 86 | 121 | 1033 | 155 | 0.19 | 0.76 | 1.10 | 0.67 | 2.66 | 3.33 |
| Q1 | 78 | 97 | 1189 | 143 | 0.18 | 0.70 | 1.02 | 0.61 | 2.46 | 3.07 |
| Q2 | 74 | 104 | 970 | 137 | 0.17 | 0.67 | 0.97 | 0.59 | 2.35 | 2.94 |
| Ave | 76 | 105 | 1296 | 151 | 0.19 | 0.74 | 1.08 | 0.65 | 2.60 | 3.25 |
| SD | 19 | 13 | 245 | 12 | 0.01 | 0.06 | 0.09 | 0.05 | 0.21 | 0.26 |
| Min | 52 | 84 | 970 | 137 | 0.17 | 0.67 | 0.97 | 0.59 | 2.35 | 2.94 |
| Max | 111 | 122 | 1690 | 173 | 0.21 | 0.85 | 1.24 | 0.74 | 2.96 | 3.70 |
| St. Par. | Syenogranite | Alkali Feldspar Granite | Quartz Syenite | ||||||
|---|---|---|---|---|---|---|---|---|---|
| 238U | 232Th | 40K | 238U | 232Th | 40K | 238U | 232Th | 40K | |
| Average | 131 | 164 | 1402 | 65 | 69 | 955 | 76 | 105 | 1296 |
| SD | 49 | 35 | 239 | 16 | 17 | 184 | 19 | 13 | 245 |
| Skewness | −0.4 | 0.6 | 0.1 | 0.2 | −0.0001 | −2.3 | 0.7 | −0.1 | 0.2 |
| Kurtosis | −1.1 | −0.5 | −1.2 | −0.7 | −0.8 | 6.4 | −0.1 | −1.0 | −1.4 |
| GM | 121 | 160 | 1384 | 160 | 67 | 104 | 1384 | 932 | 1275 |
| 238U | 232Th | 40K | Dair | AEDout | AEDin | AGDE | ELCRout | ELCRin | ELCRt | |
|---|---|---|---|---|---|---|---|---|---|---|
| 238U | 1 | |||||||||
| 232Th | 0.40 | 1 | ||||||||
| 40K | 0.58 | 0.67 | 1 | |||||||
| Dair | 0.82 | 0.83 | 0.83 | 1 | ||||||
| AEDout | 0.82 | 0.83 | 0.83 | 1 | 1 | |||||
| AEDin | 0.82 | 0.83 | 0.83 | 1 | 1 | 1 | ||||
| AGDE | 0.62 | 0.96 | 0.74 | 0.94 | 0.94 | 0.94 | 1 | |||
| ELCRout | 0.82 | 0.83 | 0.83 | 1 | 1 | 1 | 0.94 | 1 | ||
| ELCRin | 0.82 | 0.83 | 0.83 | 1 | 1 | 1 | 0.94 | 1 | 1 | |
| ELCRt | 0.82 | 0.83 | 0.83 | 1 | 1 | 1 | 0.94 | 1 | 1 | 1 |
| 238U | 232Th | 40K | Dair | AEDout | AEDin | AGDE | ELCRout | ELCRin | ELCRt | |
|---|---|---|---|---|---|---|---|---|---|---|
| 238U | 1 | |||||||||
| 232Th | 0.39 | 1 | ||||||||
| 40K | 0.23 | 0.19 | 1 | |||||||
| Dair | 0.72 | 0.80 | 0.61 | 1 | ||||||
| AEDout | 0.72 | 0.80 | 0.61 | 1 | 1 | |||||
| AEDin | 0.72 | 0.80 | 0.61 | 1 | 1 | 1 | ||||
| AGDE | 0.94 | 0.56 | 0.48 | 0.90 | 0.90 | 0.90 | 1 | |||
| ELCRout | 0.72 | 0.80 | 0.61 | 1 | 1 | 1 | 0.90 | 1 | ||
| ELCRin | 0.72 | 0.80 | 0.61 | 1 | 1 | 1 | 0.90 | 1 | 1 | |
| ELCRt | 0.72 | 0.80 | 0.61 | 1 | 1 | 1 | 0.90 | 1 | 1 | 1 |
| 238U | 232Th | 40K | Dair | AEDout | AEDin | AGDE | ELCRout | ELCRin | ELCRt | |
|---|---|---|---|---|---|---|---|---|---|---|
| 238U | 1 | |||||||||
| 232Th | 0.39 | 1 | ||||||||
| 40K | −0.69 | −0.12 | 1 | |||||||
| Dair | 0.38 | 0.81 | 0.27 | 1 | ||||||
| AEDout | 0.38 | 0.81 | 0.27 | 1 | 1 | |||||
| AEDin | 0.38 | 0.81 | 0.27 | 1 | 1 | 1 | ||||
| AGDE | 0.92 | 0.58 | −0.37 | 0.71 | 0.71 | 0.71 | 1 | |||
| ELCRout | 0.38 | 0.81 | 0.27 | 1 | 1 | 1 | 0.71 | 1 | ||
| ELCRin | 0.38 | 0.81 | 0.27 | 1 | 1 | 1 | 0.71 | 1 | 1 | |
| ELCRt | 0.38 | 0.81 | 0.27 | 1 | 1 | 1 | 0.71 | 1 | 1 | 1 |
Publisher’s Note: MDPI stays neutral with regard to jurisdictional claims in published maps and institutional affiliations. |
© 2022 by the authors. Licensee MDPI, Basel, Switzerland. This article is an open access article distributed under the terms and conditions of the Creative Commons Attribution (CC BY) license (https://creativecommons.org/licenses/by/4.0/).
Share and Cite
Abdel Gawad, A.E.; Eliwa, H.; Ali, K.G.; Alsafi, K.; Murata, M.; Salah, M.S.; Hanfi, M.Y. Cancer Risk Assessment and Geochemical Features of Granitoids at Nikeiba, Southeastern Desert, Egypt. Minerals 2022, 12, 621. https://0-doi-org.brum.beds.ac.uk/10.3390/min12050621
Abdel Gawad AE, Eliwa H, Ali KG, Alsafi K, Murata M, Salah MS, Hanfi MY. Cancer Risk Assessment and Geochemical Features of Granitoids at Nikeiba, Southeastern Desert, Egypt. Minerals. 2022; 12(5):621. https://0-doi-org.brum.beds.ac.uk/10.3390/min12050621
Chicago/Turabian StyleAbdel Gawad, Ahmed E., Hassan Eliwa, Khaled G. Ali, Khalid Alsafi, Mamoru Murata, Masoud S. Salah, and Mohamed Y. Hanfi. 2022. "Cancer Risk Assessment and Geochemical Features of Granitoids at Nikeiba, Southeastern Desert, Egypt" Minerals 12, no. 5: 621. https://0-doi-org.brum.beds.ac.uk/10.3390/min12050621