Article

Suitability of Clinker Replacement by a Calcined Common Clay in Self-Consolidating Mortar—Impact on Rheology and Early Age Properties

by
Abubakar Muhammad
*,
Karl-Christian Thienel
and
Ricarda Sposito
Institute for Construction Materials, University of the Bundeswehr Munich, 85577 Neubiberg, Germany
*
Author to whom correspondence should be addressed.
Submission received: 7 April 2022 / Revised: 10 May 2022 / Accepted: 11 May 2022 / Published: 14 May 2022
(This article belongs to the Special Issue Blended Cements Incorporating Calcined Clay and Limestone)

Abstract

:
The use of a high amount of calcined clays as cement replacement presents a great challenge in designing self-consolidating concrete. This current attempt evaluates the influence of cement replacement with up to 40 vol.% by a calcined common clay (CC), dominated by 2:1 phyllosilicates in combination with a fixed limestone powder (LP) content on fresh and hardened properties of self-consolidating mortar (SC-M). The fresh properties of SC-M were investigated by mini-slump flow, V-funnel and rotational viscometer measurements. Setting and hardening behavior were observed via dynamic modulus of elasticity and plastic shrinkage. Hydration mechanisms were determined by isothermal calorimetry and thermal analysis. Hardened properties of SC-M were evaluated using compressive strength tests and mercury intrusion porosimetry (MIP). The results revealed a decreased rate of deformability in SC-M when cement is substituted increasingly by CC and a rising superplasticizer (SP) demand, but indicated an improved stability of SC-M even at a higher dosage of SP and hardly any impact on the setting behavior. CC enhanced the precipitation of monocarboaluminate phases and thereby refined the pore size distribution of the binder matrix. SC-M can be produced with up to 40 vol.% CC as cement replacement without having effect on its 28 days mechanical properties.

1. Introduction

Rapid urbanization and a higher annual population growth rate increases the demand for housing and other concrete-based infrastructures, especially in emerging economies worldwide [1,2]. Concrete remains the most widely used construction material to provide the needed infrastructures [3]. The integrity and ease of handling concrete determines its lifespan and application. Self-consolidating concrete (SCC) is one of the concreting techniques developed to provide durable and self-deformable concrete without the need for external compaction [4,5]. In this concreting technique, the proportion of the coarse aggregate is reduced while the fine aggregate (FA) is increased to ease the rate of deformability of the concrete. Increasing the proportion of fines (powder) or the use of viscosity modifying admixtures can improve segregation resistance in the SCC [4,5,6]. Consequently, higher amounts of cement in SCC lead to more cement consumption and hence increase the greenhouse gas emissions related to cement production.
Cement production worldwide accounted for about 8% of the world’s greenhouse gas emissions [7]. The research trend in the cement industry is currently geared towards establishing the potential of blended cements produced with the use of supplementary cementitious materials (SCMs) as a substitute to cement. Fly ash, ground-granulated blast furnace slag (GGBFS), silica fume, natural pozzolans and heat-treated agro-waste are the most commonly used SCMs as partial substitutes to cement [8,9,10]. However, there is a drawback in the use of some of these SCMs as, for instance, fly ash production declined with the reduction in coal combustion. GGBFS is not readily available especially in countries with less industrial development. The use of silica fume in concrete is also limited due to some technical and economic reasons [11].
Limestone powder (LP) is one of the natural SCMs that can be used as a partial replacement to cement, especially for the production of SCC. LP is capable of substituting up to 35 wt.% of clinker without an adverse effect on the 28 days performance of SCC. It is less expensive than cement and its use in SCC was found to reduce the cement interparticle friction, thereby providing some more free mixing water and decreasing the flow resistance [12,13,14].
LP performs better in the presence of aluminum-rich SCMs, and promotes the reaction of C3S and the formation of AFm phases (hemi/monocarboaluminate) [15,16]. An effort has recently been directed towards establishing the potentials of blending LP and calcined (mostly kaolinite-rich) clays as partial clinker replacement for the production of concrete in the proportions of 50 wt.% ground clinker, 30 wt.% calcined clay, 15 wt.% LP and 5 wt.% gypsum (LC3-50) [15,16]. The use of calcined kaolinite-rich clays, however, is expensive, as in many countries the price of pure metakaolin is almost two to three times the cost of cement [16]. The suitability of using common clays instead that contain other phyllosilicates and further components has been established recently [17,18,19,20,21] and should be extended to their application in SCC as well.
Unlike the conventional vibrated concrete, SCC has no standardized method for its mix design due to its susceptibility to nuances in material characteristics and other environmental factors. The empirical method was initially adopted in order to produce SCC [4,5]. In this method, the water to powder ratio as well as the dosage of SP are both adjusted to achieve the required degree of deformability, followed by the determination of the volume of FA required to produce self-consolidating mortar (SC-M). Finally, the required volume of coarse aggregate (CA) is determined. Other methods used to achieve self-consolidation include the yield stress and plastic viscosity method (rheometer method) and aggregate packing method [22,23,24]. Various limits have been set in order to achieve the desired deformability, viscosity, and segregation resistance of SCC based on the empirical design method [4,5].
The use of metakaolin as partial replacement to cement for concrete production decreases the deformability of concrete and increases its viscosity [25,26]. This is due to its higher water demand and higher specific surface area compared to cement [20,27,28] and leads to the use of high dosages of superplasticizer (SP) to liquify the system and to keep the viscosity within the specified limit. Furthermore, unlike cement particles, calcined clay particles have, overall, a negatively charged surface, which can cause flocculation when added to the heterogeneously charged cement, and therefore require more SP to deflocculate the cementitious system [28,29]. SCC is a very fragile mixture, which requires a perfectly optimized mix design to obtain a sufficient deformability but also to achieve an excellent stability.
Therefore, the current effort is directed towards determining the influence of a higher percentage of cement replacement with both LP and a CC dominated by 2:1 phyllosilicates on self-consolidation and early age properties of SC-M, also under the consideration of increased demand for SP. Numerous studies have already been carried out in this field, especially with calcined kaolinite-rich clays and mainly for the production of vibrated concrete [15,16,25,26]. In this study, the potential of a calcined low-grade kaolinite clay (CC) in combination with LP as a substitute for up to 55 vol.% of cement for the production of SC-M was determined. The limits for the self-compactability of mortar specified in [4,30,31] were reviewed and modified to cover the use of CC in the production of SCC.

2. Materials and Methods

2.1. Materials and Mix Design

2.1.1. Materials

Ordinary Portland cement (OPC) CEM I 42.5 R conforming to DIN EN 197-1 [32] was used. It contained (wt.%) 61.6 C3S, 18.2 C2S, 5.8 C3A, 9.0 C4AF, 3.2 sulfates and 0.6 calcite as mineralogical phases according to supplier’s information. The cement was substituted by 15 vol.% of LP in order to simulate a Portland limestone cement (PLC). The LP contained 99.8 wt.% calcite and 0.2 wt.% quartz, as determined by X-ray diffraction. This basic mixture of OPC and LP (forming, PLC) was partly substituted with 10 to 40 vol.% of a calcined common clay (CC). The raw material for CC was an Amaltheen common clay originating from southern Germany, which was calcined on industrial scale at 750 °C. It contained (wt.%) 60.8 amorphous phase, 16.2 quartz, 2.2 muscovite, 0.6 calcite, 4.6 illite and 1.6 sulfates. The characterization of the CC was described thoroughly in [33,34,35]. Table 1 and Table 2 show the chemical and physical characteristics of the powder materials, respectively. The oxide composition of LP and CC was determined by using inductively coupled plasma optical emission spectrometry (ICP-OES) according to DIN EN ISO 11885 [36]. An industrial isoprenyl oxy poly (ethylene glycol)-type polycarboxylatether-based superplasticizer (SP) with acrylic acid as anchor group and additional vinyloxybutyl poly(ethylene glycol) macromonomer was used in this study as it showed excellent performance in a previous study [37]. It has a solid content of 38.6 wt.%, an anionic charge density of 1390 µmol/g, a molecular weight of 25,992 g/mol and a side-chain length of nEO = 31, according to the supplier’s information. The respective SP dosages were determined as wt.% of binder. The results on rheological and early ageing properties presented in this report are specific to this SP, and other SPs may produce different results, e.g., in terms of dosage increase, influence on rheology and early ageing properties. Sand with bulk density of 2.87 g/cm3 and having 7.6 wt.% passing of 125 μm sieve was used as an FA. Figure 1 shows the particle size distribution of the FA.

2.1.2. Mix Design

SC-M was designed by using the empirical method developed by Okamura and Ozawa [4]. The paste phase of the mortar was first designed by determining the volumetric water-to-powder ratio (Vw/Vp) at which the paste systems cease to deform. A range of Vw/Vp was established by using Equation (1) to determine the most suitable Vw/Vp for the different SC-M systems that satisfied both the deformability and segregation resistance requirements. Effect of cement replacement with CC on the relative flow area (Γm) of the SC-P was determined using a constant Vw/Vp of 0.850 and varying the SP dosage. Γm was calculated by using Equation (2):
Vw/Vp = [0.8 to 0.9] Γm0
where Γm0 is the zero relative flow area:
Γm = (d/d0)2 − 1
Here, d = (d1 + d2)/2 with d1 = largest diameter of the flow and d2 = diameter perpendicular to d1 and d0 = the initial diameter (= diameter of the cone).
The volume of FA (Vs) was fixed at 40 vol.% of the total SC-M volume (Vm) to achieve the final SC-M control mix design. Self-consolidating paste (SC-P) was mixed according to DIN EN 196-1 using a mortar mixer produced by Testing Bluhm and Feuerherdt GmbH, Berlin, Germany. The binder materials, mixing water and the SP were added together and mixed for 4 min. These mixtures at different SP dosages were used for the determination of SP saturation dosage, thermogravimetric measurements, and MIP. The SC-P was mixed manually for isothermal calorimetric measurements.
The same mixer was used to produce SC-M with a total mixing time of 8 min. In the first stage, the binder, FA and two-thirds of the mixing water were mixed for 2 min, followed by a break of 1 min to enable the addition of the remaining mixing water and SP. The whole mixture was then mixed for 5 more minutes. SC-M mixtures were used to determine the effect of varying Vw/Vp and different SP dosages on the deformability and viscosity of SC-M, its dynamic modulus of elasticity, plastic shrinkage and compressive strength.

2.2. Experimental Program

2.2.1. Paste and Mortar Tests

Flowability of the SC-M was determined by using a mini slump cone, and the mini V-funnel [4,45] was used to assess the segregation resistance of the SC-M. The Γm of the SC-M and the relative flow velocity (Rf) were calculated by using Equations (2) and (3), respectively. A range of Γm = 4.76 to 5.76 (equally to 24 cm to 26 cm) was used to assess the flowability and the viscosity (Rf) ranges from 0.91 to 1.43 s−1 (7 to 11 s) [4,30]. The measurements were performed 15 min after the addition of water. Effects of cement replacement with CC on Γm and Rf were determined to serve as a basis for the SCC mix design later on:
Rf = 10/t
where t = mini V-funnel time measured in sec.
Shear stress (τ) and plastic viscosity (µ) of the SC-M were determined via rotational rheometer Viskomat NT (Schleibinger Testing Systems) at a constant temperature of 20 °C. The measurement started 15 min after water addition with a maximum rotational speed of 12 rpm for 80 s and decreased in 14 steps of 20 s each to eliminate the effect due to thixotropy [46]. Shear stress (τ) and shear rate ( γ ˙ ) were derived from the measured torque (T) and rotational speed (N), respectively, as presented in Equations (4) and (5). The dynamic yield stress (τ0) and plastic viscosity (η) were calculated according to the Bingham model [47,48] as presented in Equation (6):
Shear stress (τ) = 0.95 × T
Shear   rate   ( γ ˙ ) = 0.584 × N
T = g + N × h
where T = torque ≈ τ; g = y-intercept of the flow curve ≈ τ0; N = velocity ≈ γ ˙ ; and h = the slope of the curve ≈ η.

2.2.2. Early Age Paste and Mortar Tests

The early hydration behavior of selected binder systems was monitored by isothermal calorimetric measurements. The tests were conducted with a TAM AIR eight-channel isothermal calorimeter (TA instruments, New Castle, DE, USA). The materials required for this test were stored in a closed chamber at a temperature of 25 °C for at least 24 h before the test. For the reference system (SC-P), 4.25 g OPC and 0.75 g LP were manually homogenized for 60 s and mixed with distilled water (w/cm = 0.29) for a further 60 s. For SC-P-20CC and SC-P-40CC, the OPC and LP was equally reduced and 1.0 g and 2.0 g, respectively, of CC were added to the cement. About 2 g of the paste were filled in plastic ampoules and subsequently inserted into the calorimeter. The heat flow was measured up to 48 h, and the result was normalized to g of cement.
The setting and hardening behavior of the SC-M was monitored according to EN 12504-4:2004 [49], using a Vikasonic apparatus integrated with a datalogger (Schleibinger Testing Systems, Buchbach, Germany). The tests were conducted in a climate chamber at 20 °C/65% relative humidity. Fresh SC-M was placed to set between two ultrasonic transducers, which are supplied with 0.25 s pulse per s at a frequency of 54 kHz. The ultrasound speed was monitored for 48 h starting 15 min after water addition. The dynamic modulus of elasticity (Edyn) was determined based on the density (ρ) of the SC-M and the recorded ultrasonic velocity (v), as presented in Equation (7). This is used to delineate points of a complete crystalline structural change in the system [43,50]:
Edyn = ρ × v2
The plastic shrinkage of SC-M was assessed contactless via a shrinkage cone (Schleibinger Testing Systems, Buchbach, Germany) with a volume/height sample container of 682 cm3/125 mm and equipped with a Class 2 laser having a power of <1 mW at 670 nm according to DIN EN 60825-1:2015-07 [51]. The measurement was also conducted in a climate chamber (20 °C/65% relative humidity) for 48 h to eliminate external influences. A wall fraction effect was avoided by using a polypropylene foil between the shrinkage cone, and the SC-M. Thermocouples were attached to measure the specimen temperature.

2.2.3. Hardened Paste and Mortar Tests

For thermogravimetric measurements (TG) and MIP, the paste phase of the SC-M designed in Section 3.2 were produced and filled into 40 × 40 × 160 mm3 steel molds and stored in a moist condition for 48 h. After demolding, the prisms were cured under water until testing. The proportioning of the paste constituents is provided in Table 3.
Thermogravimetric measurements were conducted with Netzsch STA 449 F3 Jupiter equipment at the hydration ages of 2 and 28 days. A representative of the sample was manually chipped out from the inner part of the paste prisms and crushed to <1 mm size using laboratory mortar and pestle. Binder hydration was stopped by solvent exchange method [52] and dried in a ventilated oven at 60 °C for 12 h. About 300 mg of the pulverized hardened binder paste was loaded into alumina crucibles and heated from 25 to 1000 °C at a heating rate of 2 K/min under nitrogen atmosphere. Tangent method according to Marsh and Day [53] was used to quantify the portlandite in the hydration phase from the mass loss between the temperatures of 400 °C and 490 °C.
MIP was employed to assess the effect of CC on the pore structure of the binder at 28 days of hydration according to DIN 66133 [54]. Approximately 1 cm3 of the hardened binder paste was manually chipped from the inner part of the paste prisms. The samples were stored in isopropanol for at least three days and subsequently dried at 70 °C in a ventilated oven. After drying, they were cooled and stored in a desiccator and tested by using ThermoFisher mercury intrusion porosimeter with a high pressure unit (400 MPa) to measure up to 2 nm pore radii and a low pressure unit (400 kPa) for up to 2 μm radii. Mercury density of 13.54 g/cm3 with a surface tension of 0.48 N/m and a contact angle of 140° were used as parameters for the MIP experiments. The SC-P pore sizes were classified as gel pores (0–30 nm), microcapillary pores (30 nm–1 µm), capillary pores (1 µm–50 µm) and air voids (>50 µm).
The compressive strength of the SC-M specimens was determined according to DIN EN 196–1 [55] at 2, 7 and 28 days of curing. 40 × 40 × 160 mm3 specimens were cast into steel molds. They were covered and stored in a moist condition for 48 h and subsequently cured underwater until the date of testing. The compressive strength test was conducted on the Form + Test Prüfsysteme Alpha 1-3000 with an increased uniform loading rate of 2400 ± 200 N/s until failure.

3. Results and Discussion

3.1. Flow Behavior of the Studied Binders

Figure 2 shows the Vw/Vp at which the different binder systems cease to deform (zero relative flow area: Γm0). These points are denoted as the amount of water confined by the binder particles [4]. The Vw/Vp confined by the cement was 1.03. This value increased to 1.19 at 40 vol.% cement replacement with CC. Here, it is worth mentioning that an increasing cement substitution with CC increased the water confined by the system in a non-linear manner. This non-linearity is more pronounced with CC substitution beyond 20 vol.%. The combined effect of high water demand of CC compared to cement and its particle shape led to the increased interparticle friction, and hence more water is entrapped in the system with large volume of CC. On average, Vw/Vp between 0.850 and 0.925 was selected as a basis for SC-M design. These values were calculated from the Vw/Vp for Γm0 using Equation (1).
Figure 3 shows the effect of CC on the Γm of SC-P at a constant Vw/Vp of 0.850 and varying SP dosages. More SP was required to deform a binder system with CC, especially at cement replacement beyond 20 vol.%. This was attributed to the higher specific surface area and water demand of CC compared to cement (Table 2). Furthermore, it is known that the negatively charged CC particles cause flocculation when added to cement [20,28,56]. The required dosage of SP to achieve the same deformability of the cement matrix with 40 vol.% CC was almost 65% greater than the SP required for cement without CC replacement. At 0.3 wt.% SP, 7.5 Γm was achieved for PLC only. This declined already to 4.0 Γm with the replacement of 10 vol.% CC. Further replacement of cement with CC reduced Γm to almost zero, meaning no flowablity at all. By increasing the percentage of SP to 0.4 wt.% influenced less significantly the Γm of PLC substituted with up to 30 vol.% CC. With 40 vol.% CC, at least 0.5 wt.% SP dosage was required to achieve the required deformability of the system. At this SP dosage, cement replacement with CC beyond 20 vol.% had no significant impact on the relative flow area of the system, as shown in Figure 3.

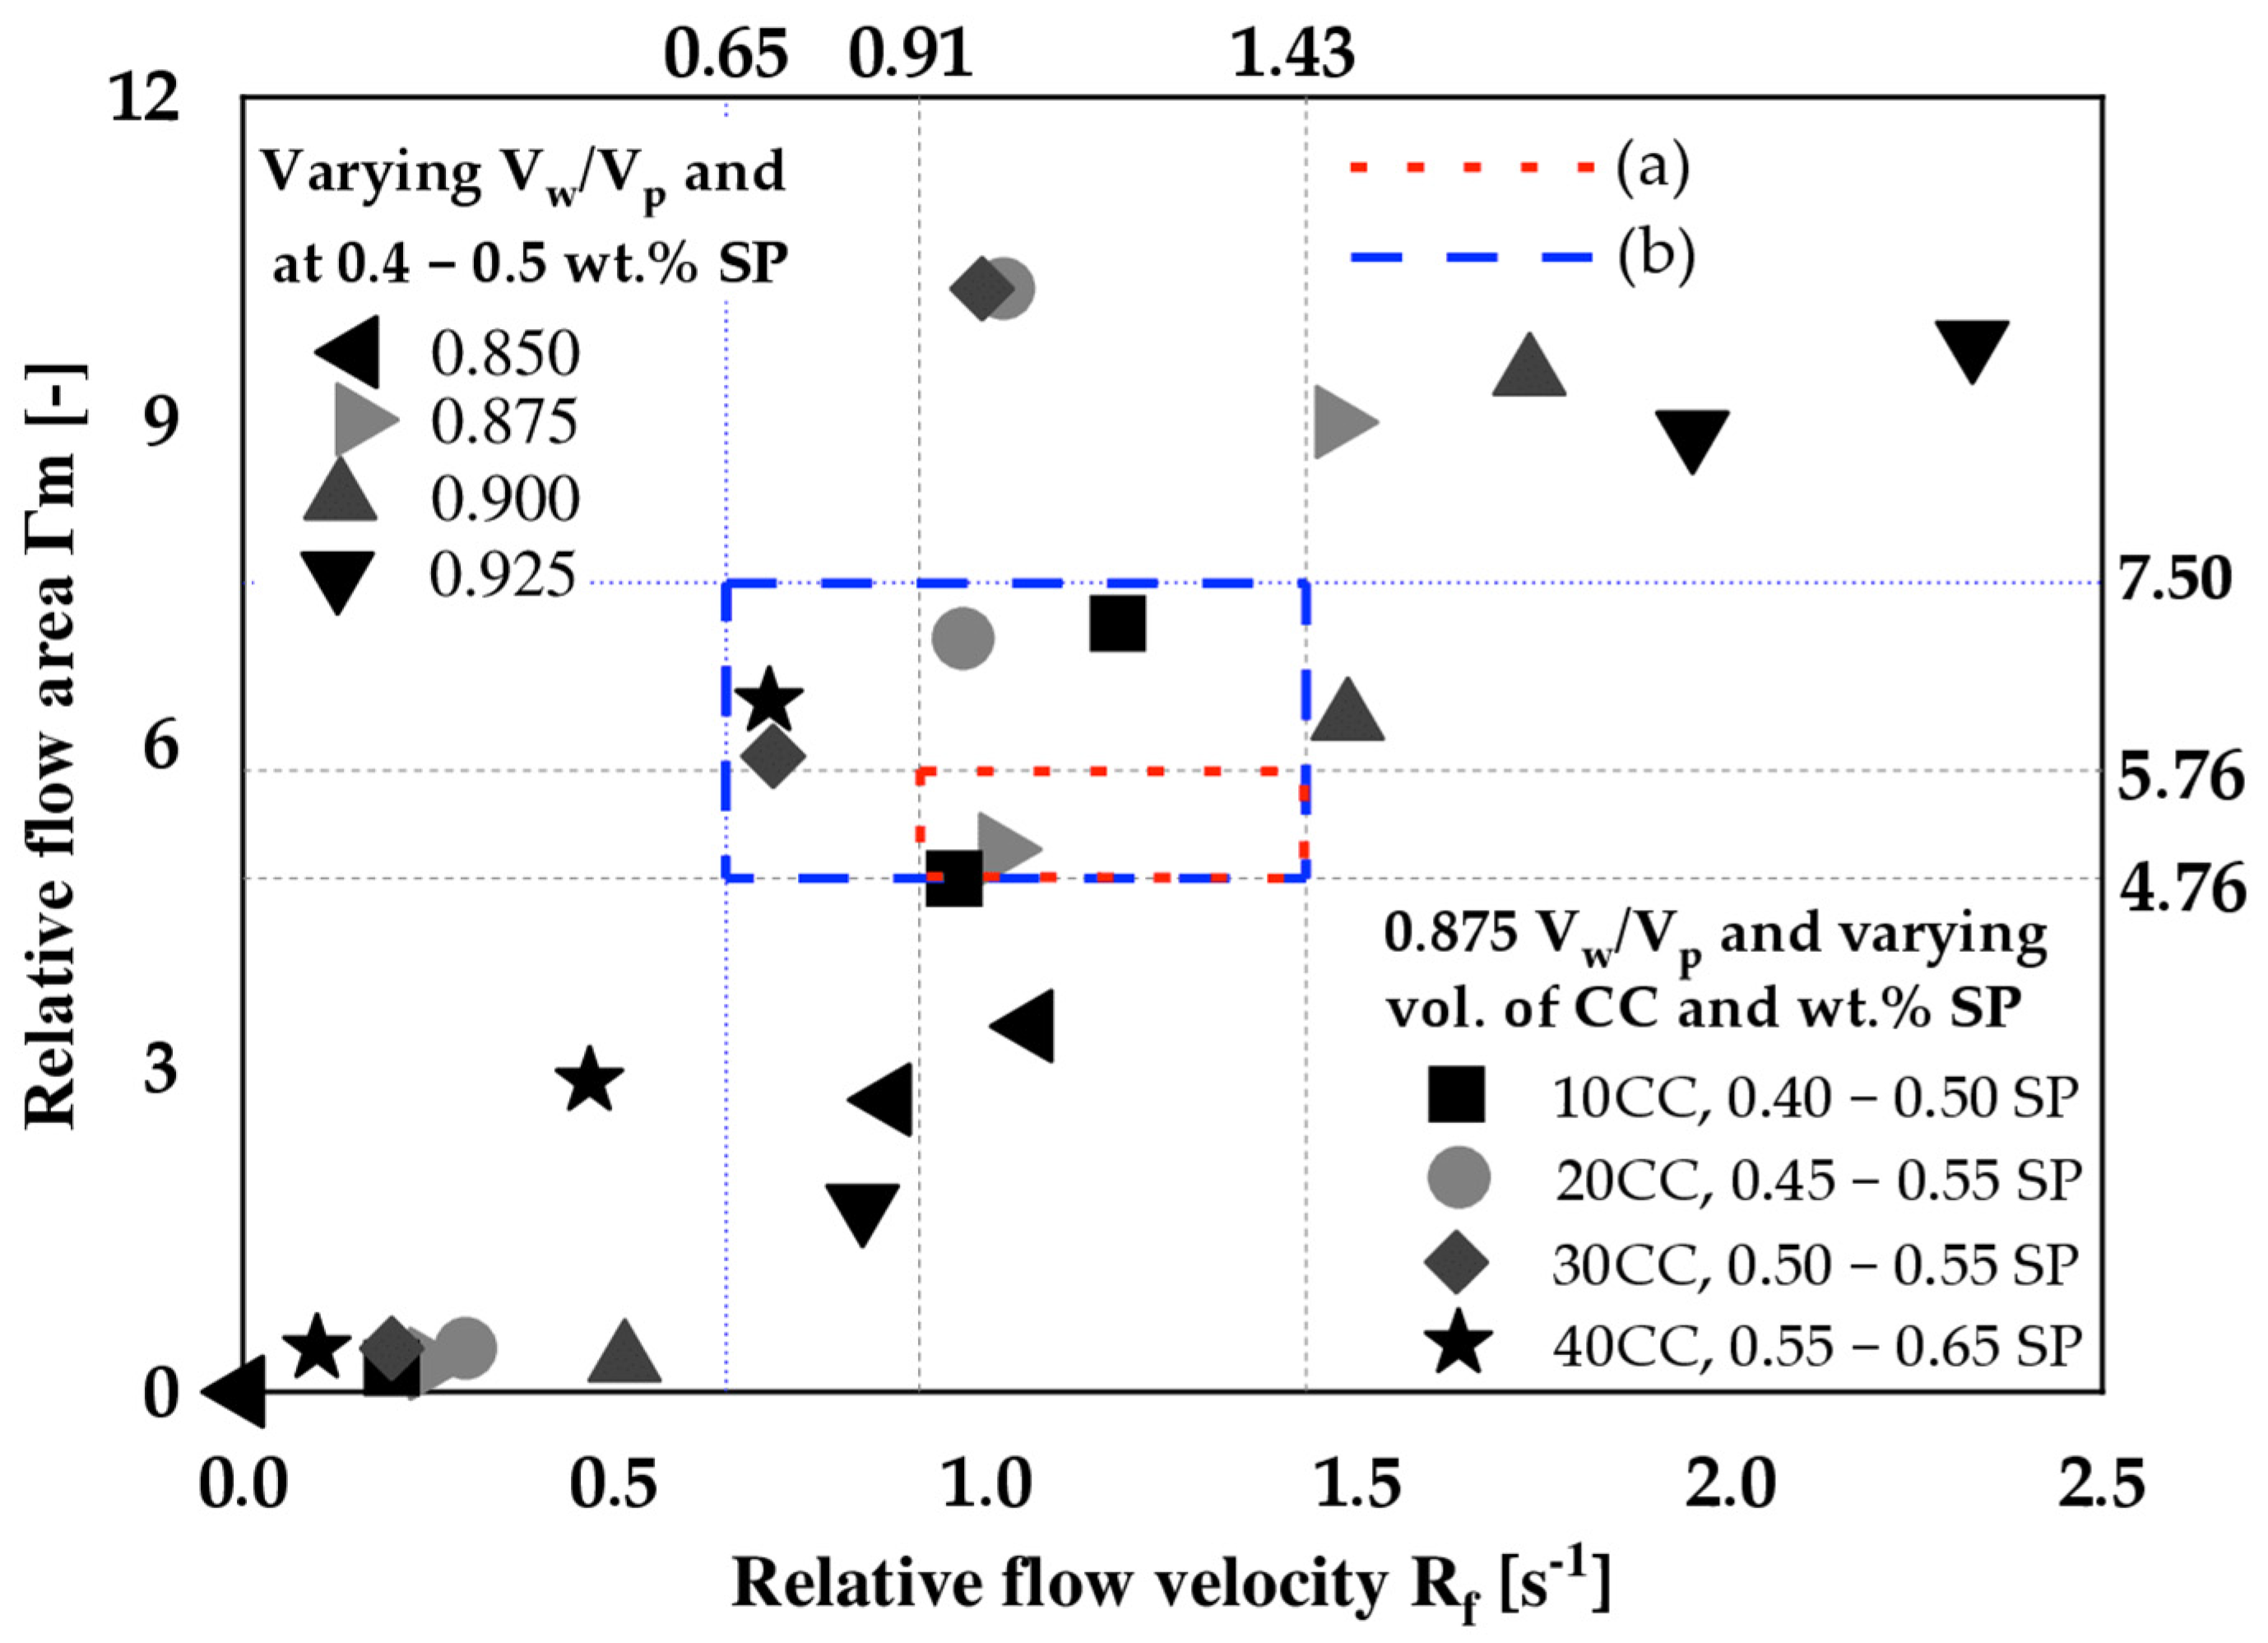
3.2. Design of Self-Consolidating Mortar

Figure 4 shows the effect of varying the Vw/Vp and SP dosages on the relative flow area (Γm) and the relative flow velocity (Rf) of SC-M produced with 40 vol.% FA (Vs = 0.4). The Γm and Rf increased both with increasing Vw/Vp and SP dosage. At 0.4 wt.% SP dosage, the variation in Vw/Vp up to 0.90 had less impact on the Γm but affected the Rf values significantly. Increasing the SP dosage to 0.45 wt.% and beyond caused a significant increase in both the Γm and Rf.
The combination Vw/Vp and SP dosage that satisfied the thresholds of both the Γm (4.76 to 5.76) and Rf (0.91 to 1.43 s−1) [4,30] was selected as a start for the subsequent increasing replacement of cement by CC. For constant Vs = 0.4, this was accomplished with Vw/Vp = 0.875 and 0.45 wt.% SP and is denoted from here on as SC-M-1. When cement is substituted with CC, the volumetric proportion of the CC used will be added in front of this designation. By increasing the volume of the CC as cement replacement, the fluidity of the mixture decreased, and the viscosity increased. This necessitated the addition of higher dosages of SP (0.5 and 0.6 wt.%, respectively) to maintain the deformability of SC-M. Figure 5 shows the influence of varying the Vw/Vp and the replacement of cement with CC on Γm and Rf of the SC-M. The aforementioned thresholds of Γm and Rf were used to classify the SC-M into different viscosities. Increasing the Vw/Vp led to a decrease in viscosity with a high tendency of segregation. On the other hand, increasing the cement replacement level by CC resulted in a decreased Γm and increased Rf of the SC-M. With replacement levels beyond 20 vol.%, a higher dosage of SP is required to improve the deformability of the SC-M. The established Rf values were difficult to achieve with replacement levels beyond 10 vol.%. Nonetheless, the Γm were achieved with cement replacement up to 40 vol.% CC as depicted in Figure 5. Therefore, these limits need to be adjusted to accommodate the effect of CC at higher replacement levels. The major concern is an even lower limit of Rf, which is at 0.91 s−1 for cement and other SCMs that have a similar deformability rate compared to cement [4,30]. The CC used in this context behaved differently from cement due to its slow deformability rate and, therefore, a new lower Rf limit of 0.65 s−1 is proposed based on the experimental results obtained to accommodate up to 40 vol.% cement replacement by CC. The upper limit of Rf (1.43 s−1) remains unchanged. Consequently, the established Γm upper limit has to be adjusted to achieve the proposed Rf limits. A window with Rf = 0.65 to 1.43 s−1 and Γm = 4.76 to 7.50 is proposed to accommodate cement replacement with up to 40 vol.% CC as shown in Figure 5.
SC-M was designed using an empirical method and the influence of cement replacement with CC was determined. The rate of deformability of the SC-M decreased with increased CC content. As consequence, a new window for Rf and Γm was derived to accommodate cement replacement with up to 40 vol.% CC. For ease of identification of the mix designs, Table 4 summarizes the proportioning of the SC-M constituents.

3.3. Rheological Properties of SC-M Blended with CC

To further characterize the behavior of the SC-M produced, the rheological behavior was closely monitored by using a rotational viscometer. At a constant Vw/Vp of 0.875 and SP dosage of 0.5, a higher volume of cement replacement with CC significantly increased the shear stress at both low and high shear rate values, as depicted in Figure 6. At low shear rate values, for instance, the addition of CC increased the shear stress of the system in a non-linear way by 26% and 171% at the 20 and 40 vol.% replacement levels, respectively. Similarly, by increasing the shear rate, the shear stress increased. Hence, an increased content in CC resulted in higher plastic viscosity and reduced the deformation rate.
The adjustment of SP dosage is urgently required to control the degree of deformity of SC-M with increasing the volume of CC as cement replacement. Figure 7 shows the influence of increasing SP dosage on dynamic yield stress and plastic viscosity of SC-M produced with a varying volume of CC. A higher SP dosage decreased both the yield stress and plastic viscosity of the mortar with and without CC. This decrease was more pronounced in the control mixture, resulting in a higher tendency of segregation, as observed also in Figure 5. For instance, about 0.5 wt.% SP dosage was required to deform the control mixture and to reduce the dynamic yield stress from 10.6 Pa to 3.1 Pa, while the corresponding plastic viscosity dropped from 20 Pa·s to 12 Pa·s. For the SC-M with CC replacement at 20 and 40 vol.%, the required dosage of SP increased to 0.55 and 0.60 wt.% SP in order to achieve the same degree of deformability, respectively. The corresponding plastic viscosities, however, remained at 19 and 22 Pa·s, respectively. At 40 vol.% CC, the viscosity of the SC-M increased relatively to the other mixes, whereas the yield stress values remained in a similar range. This was related to a higher SP dosage used to deform the system with CC. Furthermore, it clearly indicated that the stability of the CC blended systems is less affected despite the adjustment of SP dosage and that the deformability rate of SC-M with CC is very slow compared to the control mixture due to their lower relative flow velocity.
The rheological measurements of SC-M showed that a sufficient reduction in yield stress and plastic viscosity values is possible by adjusting the SP dosages. Once similar fresh properties are achieved with up to 40 vol.% cement replacement with CC as for mixtures without CC, the question arises how it affects the properties of SC-P and SC-M within the first 48 h after water addition.

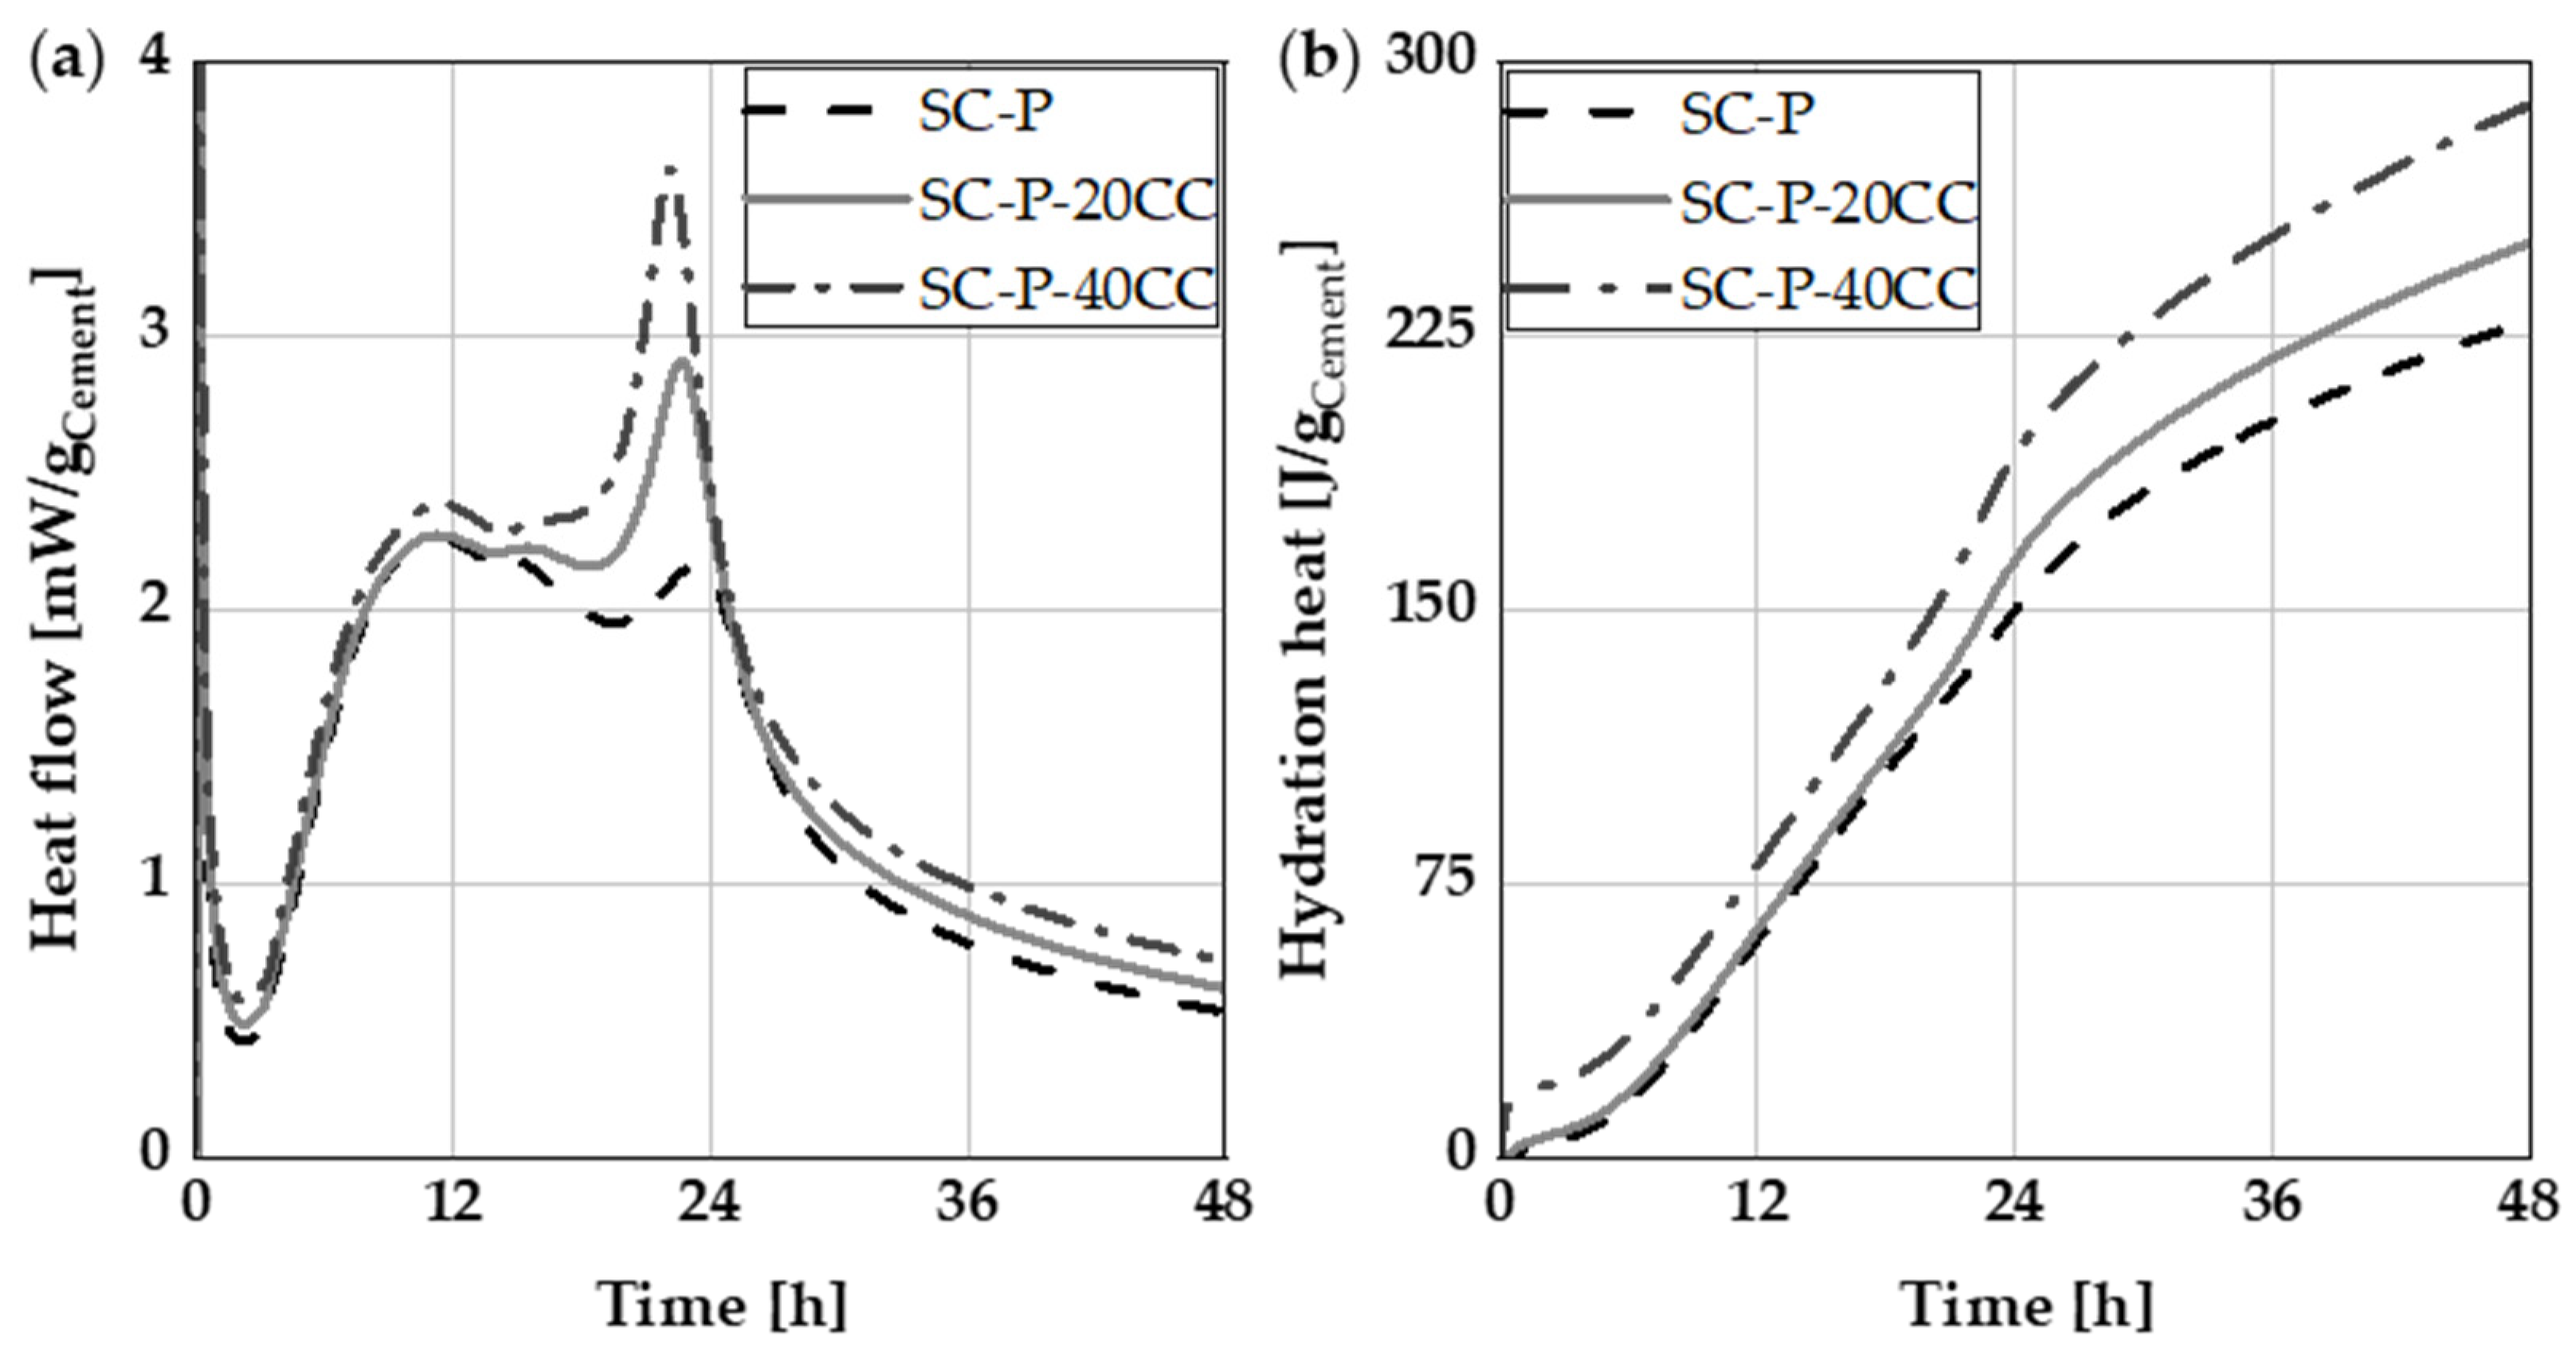
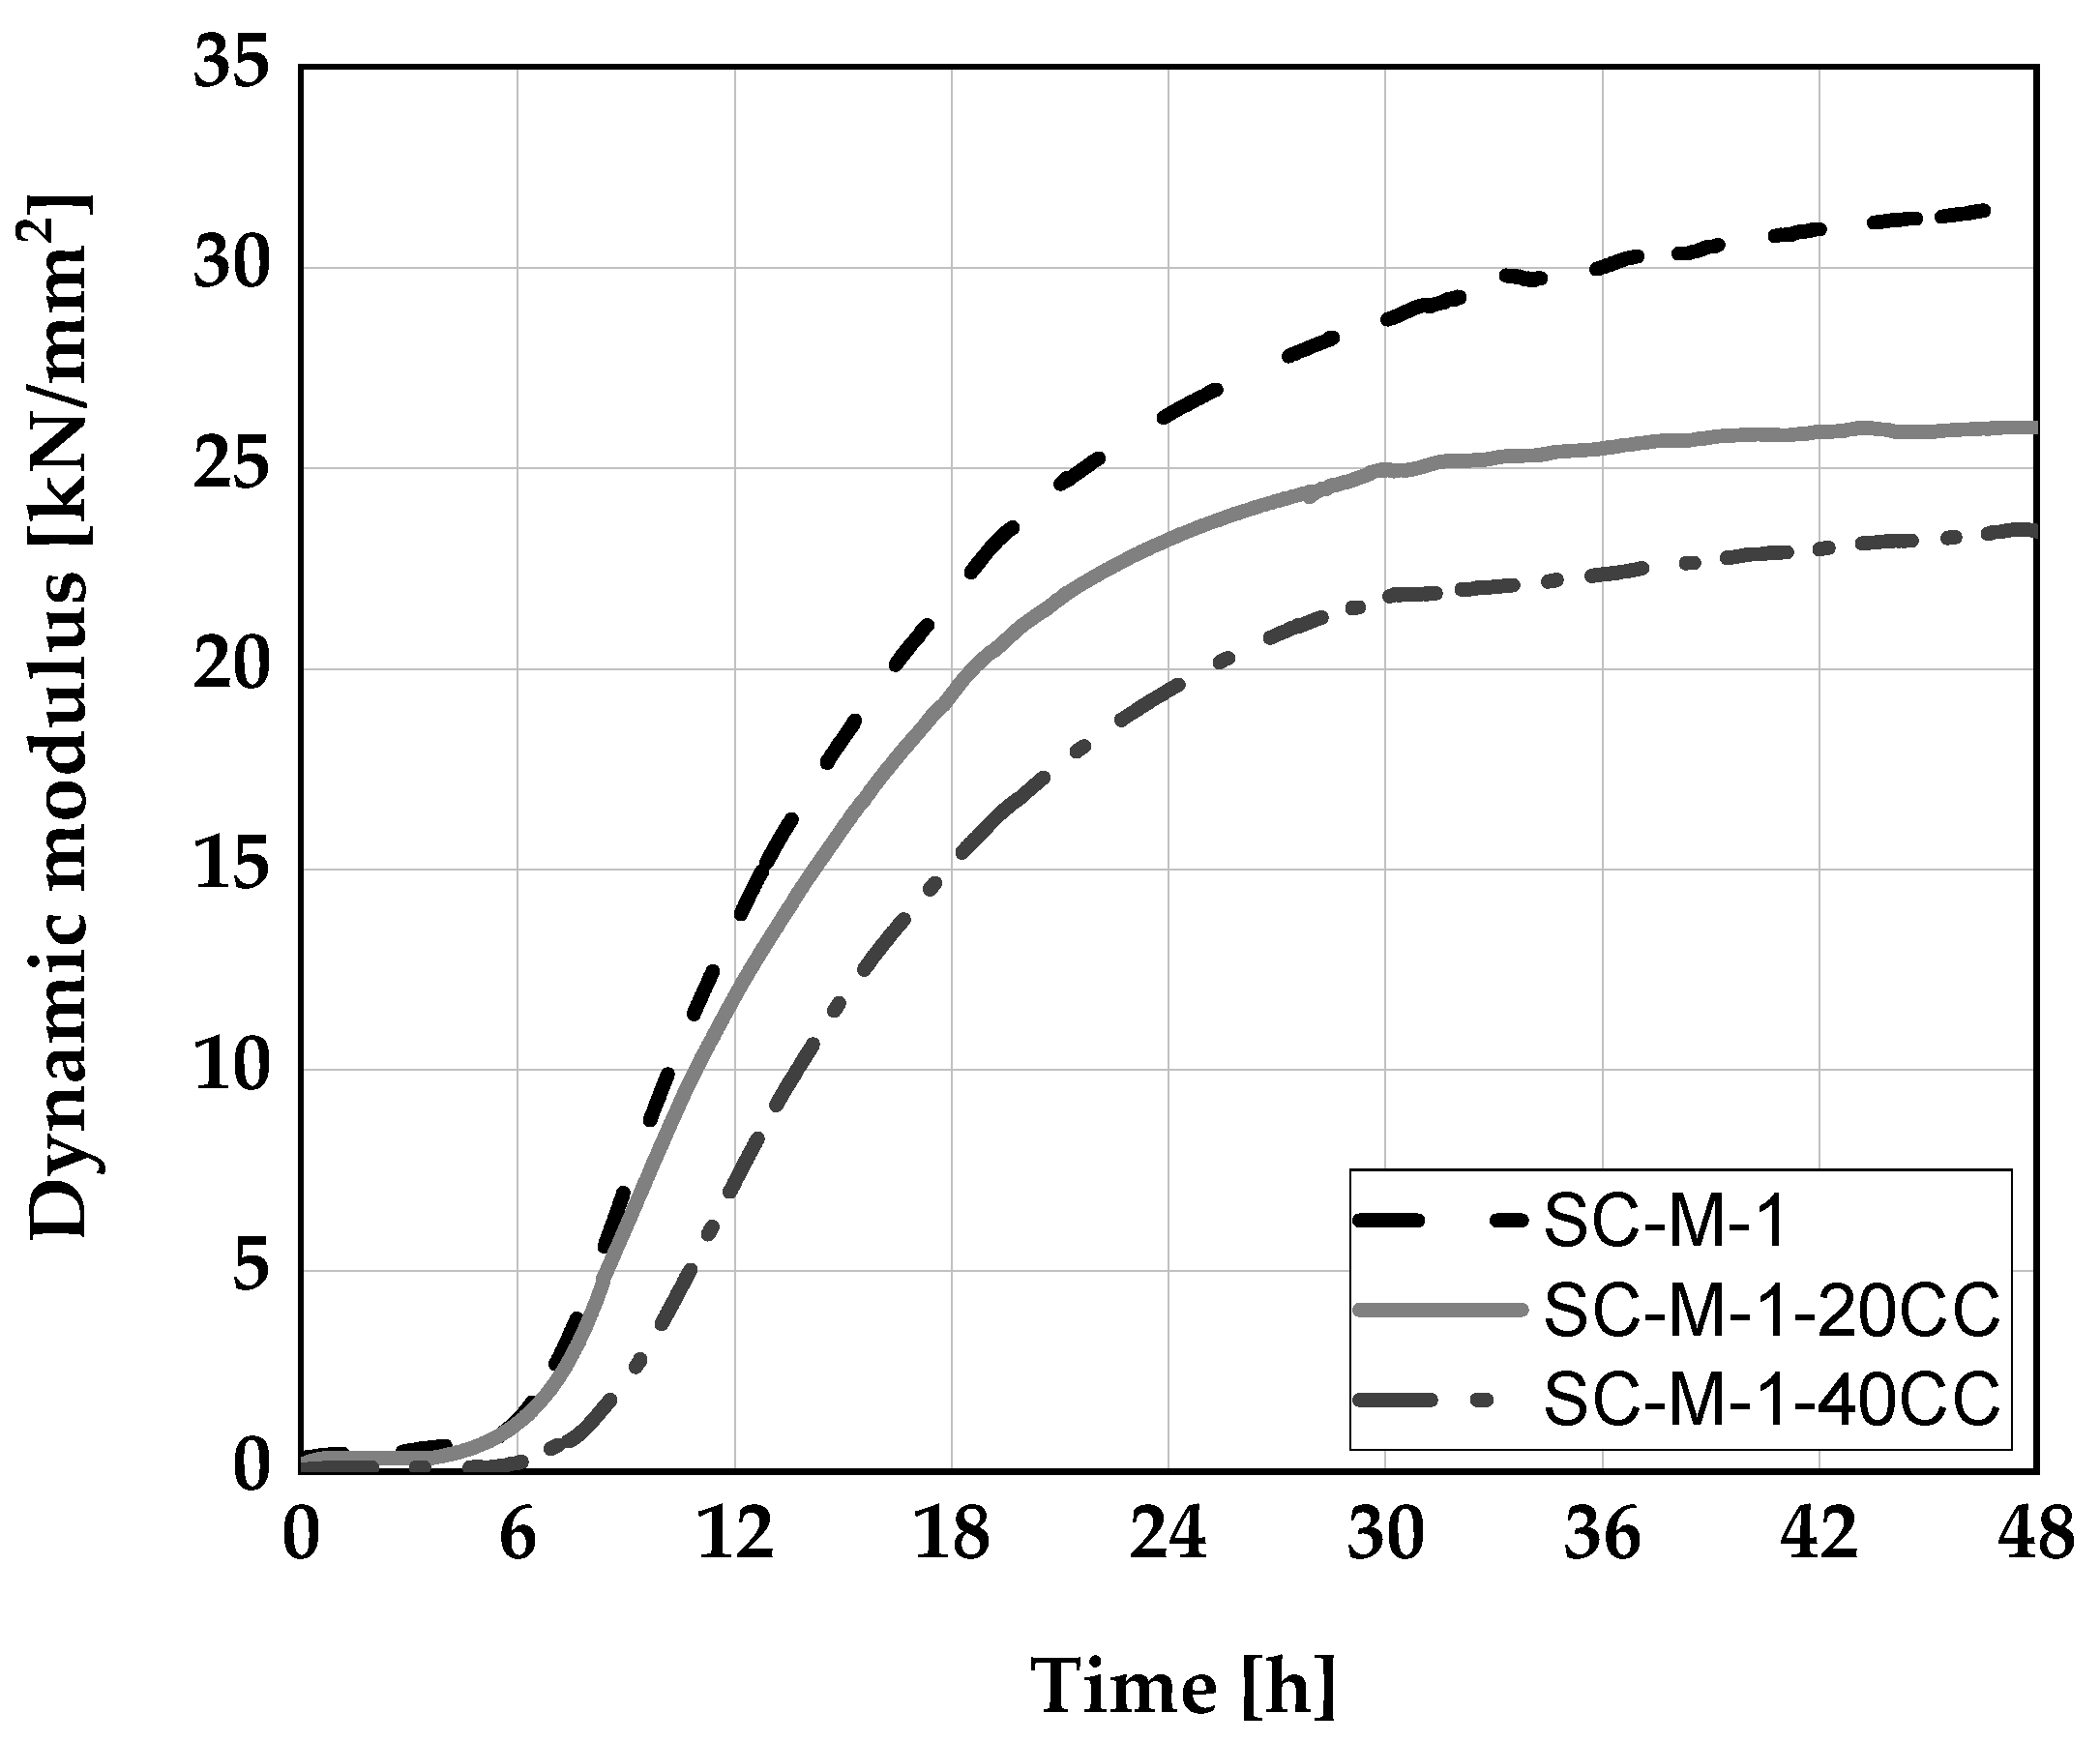
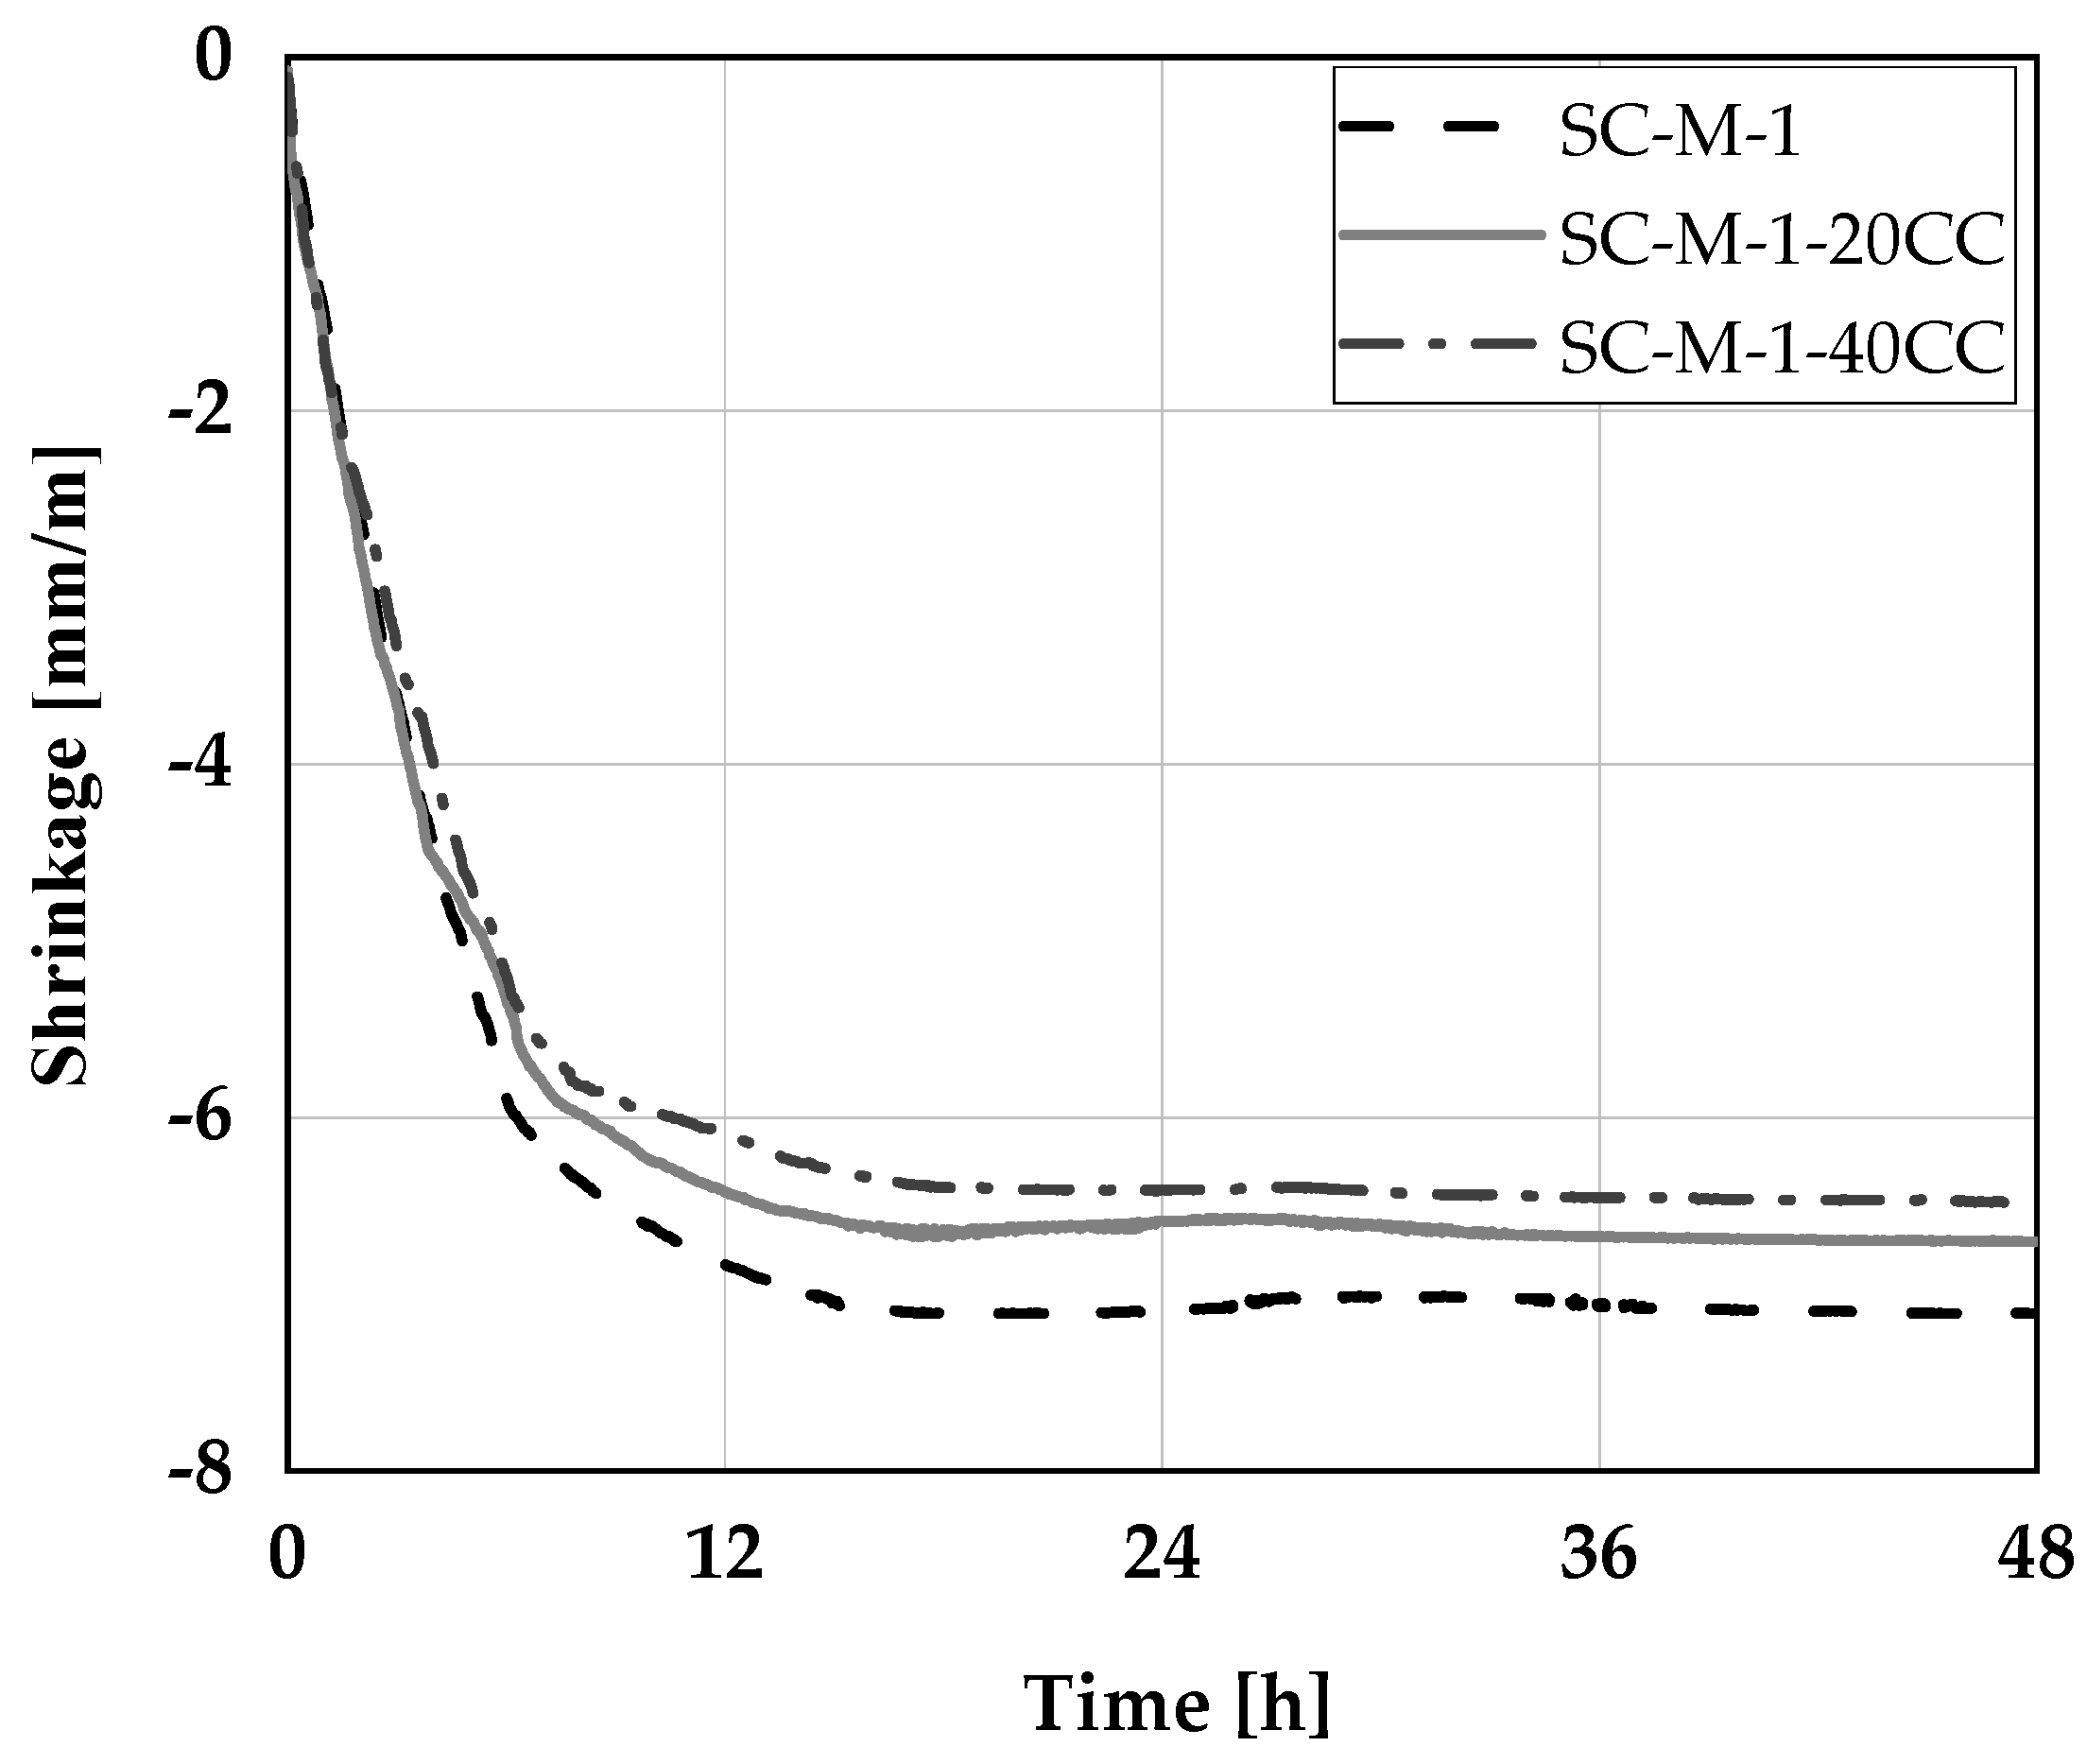
3.4. Early Age Characteristics of Self-Consolidating Paste and Mortar

Early age properties of SC-P and SC-M were closely monitored using isothermal calorimetry, ultrasonic pulse velocity (UPV) and plastic shrinkage measurements. Figure 8a,b show the heat flow and hydration heat curves of cement with 0, 20 and 40 wt.% CC. The heat flow curves exhibited four exothermic peaks. The first peak occurred due to the mixing reaction between the binder and water leading to the initial formation of ettringite and the release of a considerable amount of energy. This was followed by the dormant period and subsequent formation of the second peak after 7 h of hydration. The use of CC as cement replacement at both 20 and 40 vol.% had no significant impact on the formation and duration of the dormant period. The formation of the second peak (alite peak) is commonly related to the dissolution of C3S and precipitation of C-S-H [57,58]. Again, the cement replacement by CC had no significant effect on the shape and occurrence of this peak, although it was slightly higher for SC-P-40CC. The third peak appeared shortly after the alite peak due to the depletion of sulfate in the system leading to the fast dissolution of C3A and precipitation of ettringite. At about 23 h of hydration, it was assumed that ettringite converted with carbonate ions from LP to hemicarboaluminate (AFm-Hc). The presence of CC in these systems enhanced the formation of this fourth peak and increased its intensity significantly from 2.2 mW/gcement to 3.6 mW/gcement. This was due to the presence of more aluminum ions in the systems with CC, which further reacted with the carbonate ions to form more AFm-Hc [18]. As shown in Figure 8b, the addition of CC enhanced the hydration heat. This effect can be explained in two stages. First, from 0 to about 24 h of hydration, the CC increased the nucleation sites and improved the hydration rate by acting as filler [59,60]. Second, from 24 to 48 h of hydration, the reaction between the aluminum ions and the carbonate ions was enhanced due to the presence of more aluminate in the system with CC, which promoted the formation of ettringite and conversion to AFm-Hc and consequently lead to a higher hydration heat [18,61].
Figure 9 shows the dynamic modulus of elasticity of SC-M as deduced from UPV. A constant value of dynamic modulus of <1.5 kN/mm2 was recorded for up to 7 h. At this stage, the SC-M experienced a transition from fluid to solid state and the addition of 20 wt.% CC had only minor influence on the setting behavior of the cement. The addition of 40 wt.% CC, however, prolonged the period of constant dynamic modulus by an hour. The measured UPV value corresponded to the velocity passed through the aggregate grains [62] during the dormant period of the mixtures, as observed in Figure 8a. Consequently, the formation of densifying hydration products was yet to begin. It was characterized by gradual loss of slump and described the time of initial setting according ASTM 1679-13 [63], as also observed by Sposito et al. [43]. From 7 to almost 24 h, the dynamic modulus of elasticity increased rapidly in all the SC-M specimens. The SC-M at this stage experienced a transition from semi-rigid to a rigid state due to the formation of C-S-H, leading to the densification of its microstructure. Once the setting process of SC-M was completed, the growth of dynamic modulus of elasticity slowed down in all specimens beyond 24 h. The use of CC reduced the dynamic modulus of elasticity at 48 h of hydration by 18 and 26% at replacement levels of 20 and 40 wt.%, respectively.
The mechanism of plastic shrinkage could also be divided in three stages. During the first stage, which was from water addition to about 7 h of hydration, the SC-M experienced a rapid increase in plastic shrinkage (up to −6 mm/m as shown in Figure 10). This was attributed to the settlement of the SC-M solid particles and the evaporation of water from the surface of the SC-M. A further yet significantly slowed down course of plastic shrinkage was observed between 7 h and 16 h of hydration. Here, the effect of CC became more obvious, as its addition decreased plastic shrinkage by up to 15%. This corresponded to the combined effect of SC-M particles settlement, evaporation, and the continuous water consumption by hydration products and the calcined clay itself. This confirmed findings of Beuntner and Thienel [17] who explained a lower plastic shrinkage with a lower effective water-to-cement ratio and a better particle packing in the mortar. Beyond 16 h of hydration, the plastic shrinkage was almost constant up to the end of the measurement at 48 h. A slight expansion was observed after 24 h of hydration, which was related to the formation of voluminous AFm-Hc and an along-going reduction in plastic shrinkage.
Based on the early age investigations, the addition of CC to SC-M enhanced the formation of AFm-Hc, reduced the dynamic modulus of elasticity but also the plastic shrinkage of the SC-M.

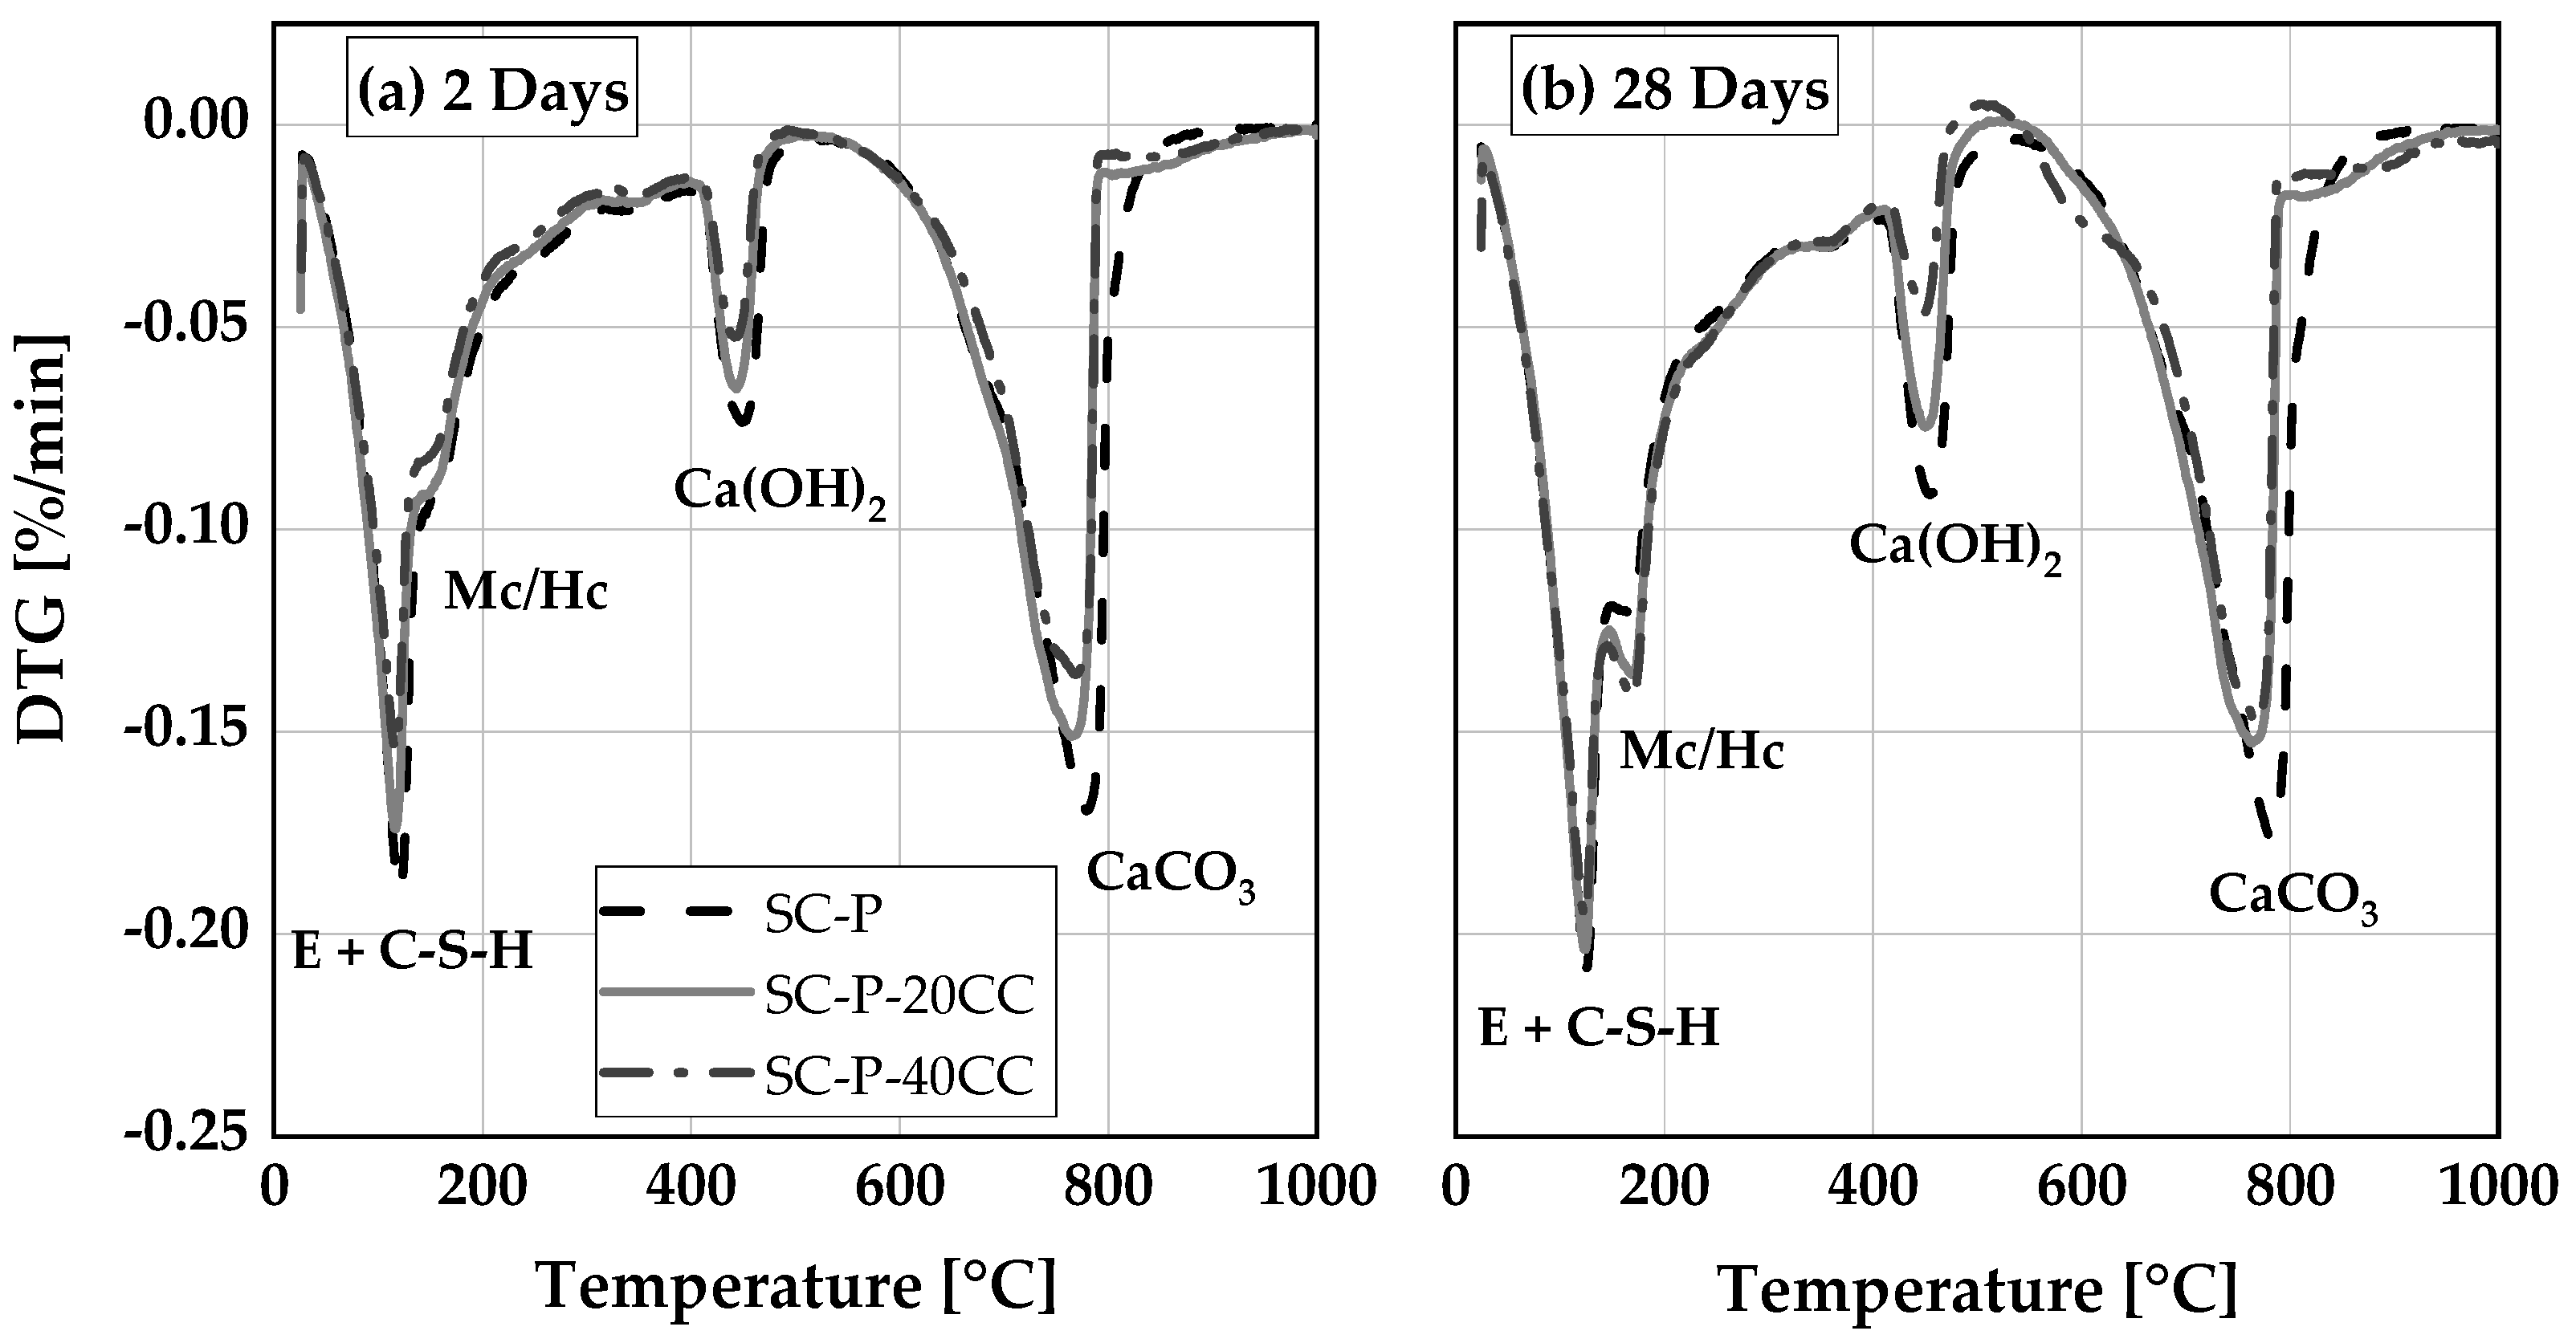
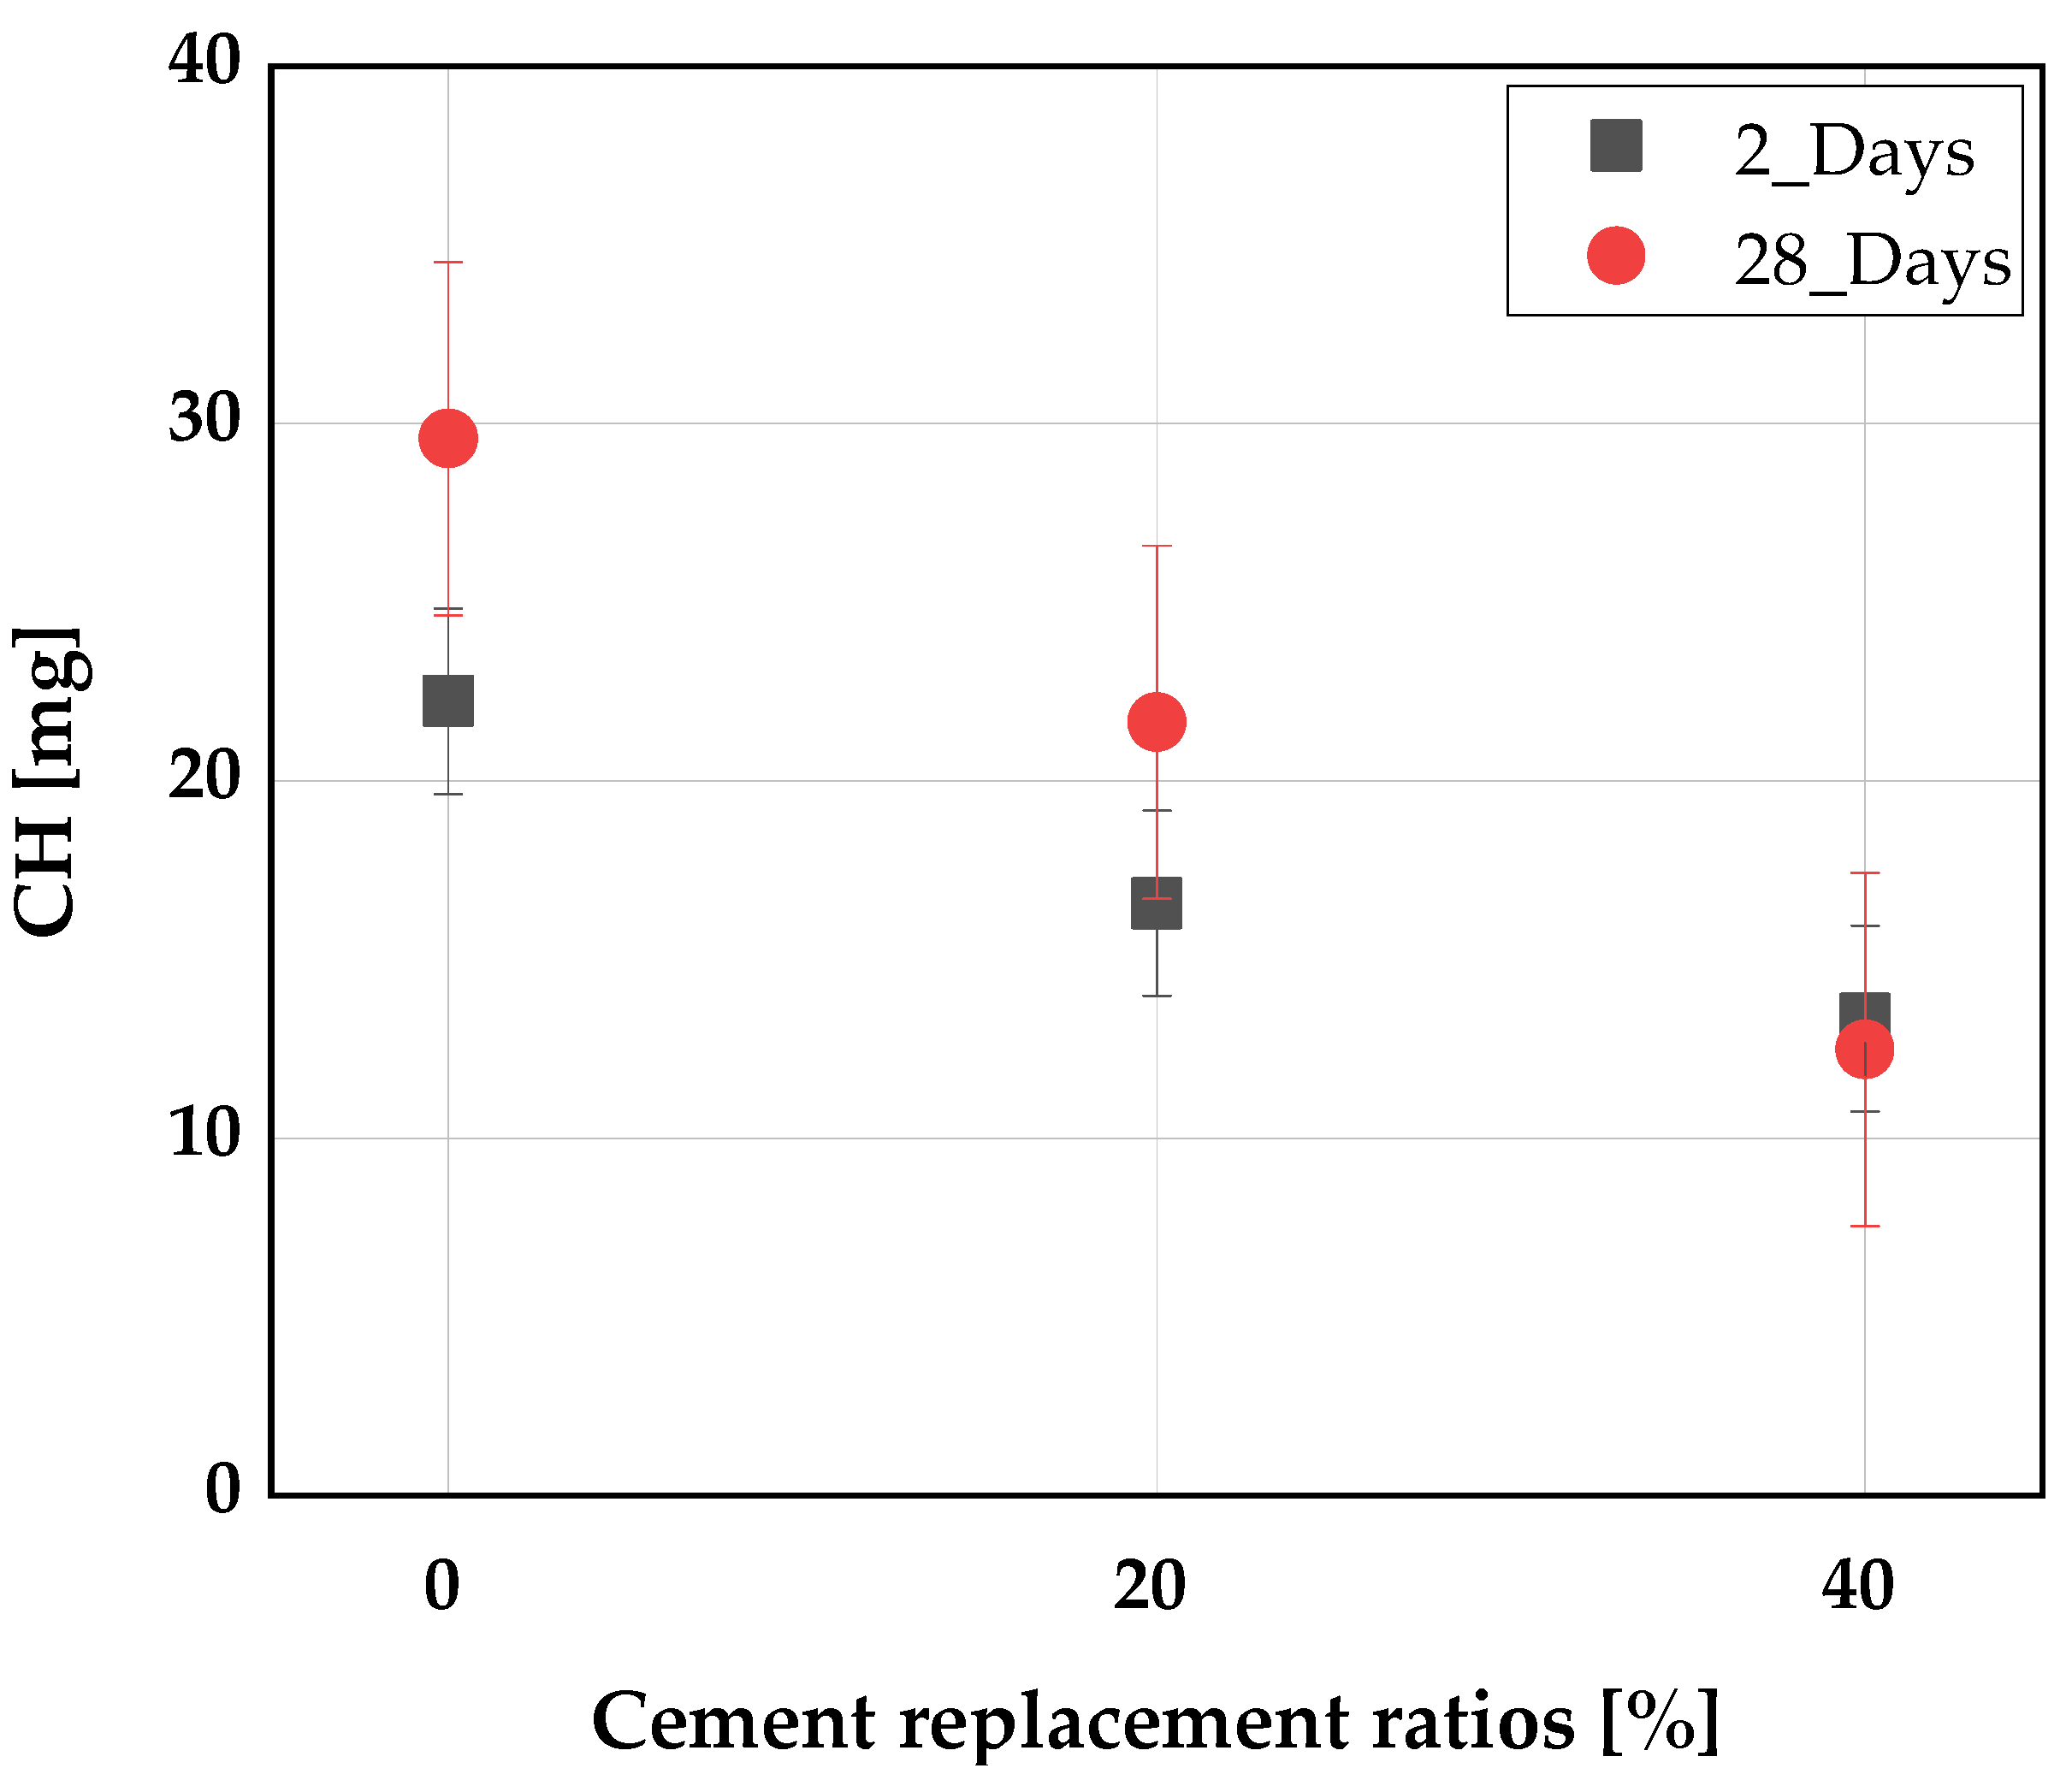
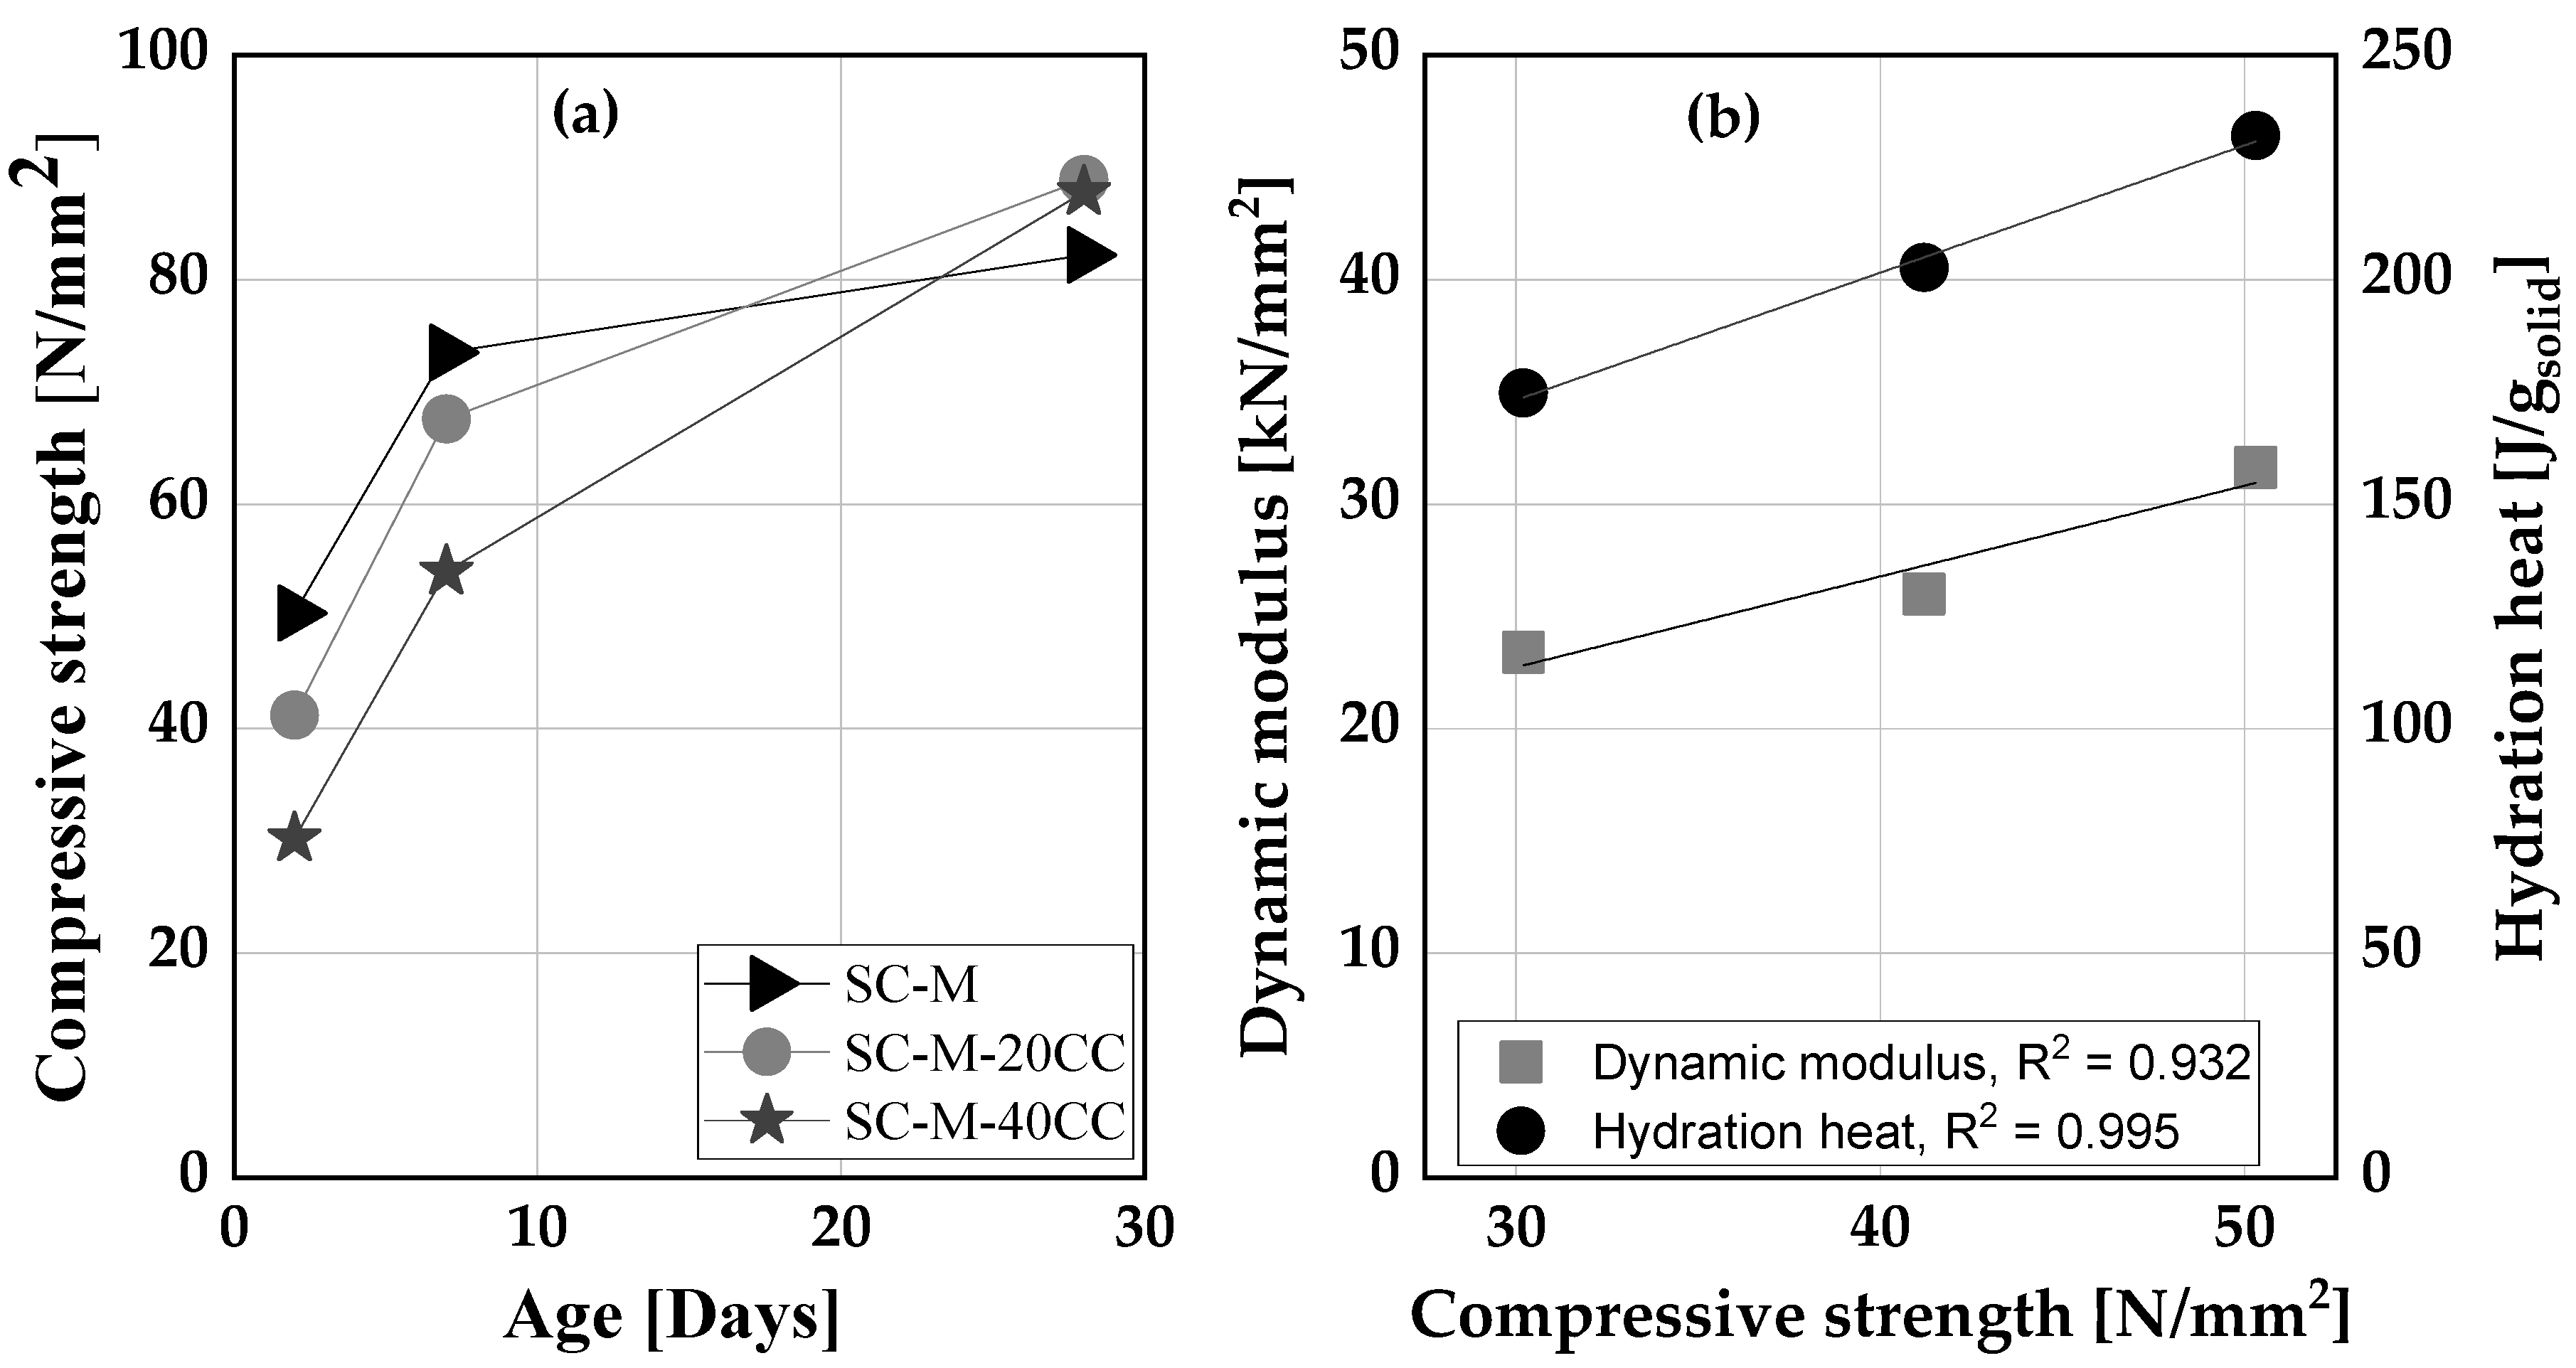
3.5. Hardened Properties of Self-Consolidating Paste and Mortar

The hardened properties of SC-M were studied by using thermogravimetric analysis, mercury intrusion porosity and compressive strength tests. Figure 11a,b depict the differential thermal analysis (DTA) curves of SC-P conducted at 2 and 28 days of hydration, respectively.
Four distinct stages were identified from the DTG curves. A reduced mass loss was observed at all four stages at 2 days of hydration when CC was used as a cement replacement. This reduction was due to the effect of cement replacement by the CC thereby reducing the rate of precipitation of the hydrate phases in the system. The first peak occurred between T = 50 °C and 140 °C and was mainly related to the dehydration of ettringite (E) and C-S-H [64,65,66,67]. The second mass loss between 140 °C and 190 °C was associated with the dehydration of carboaluminates, both AFm-Mc (short: Mc) and AFm-Hc (Hc), which were formed from the reaction of aluminate and carbonate ions in the PLC systems [64,65]. This peak was more pronounced at 28 days and increased with higher replacement by CC. Another mass loss was observed between T = 450 °C and 550 °C due to the decomposition of Ca(OH)2 [64,65,66,67]. Cement replacement with CC led at both ages to a reduction in the quantity of portlandite in the system as depicted in Figure 12. At 2 days of hydration, the reduced amount of portlandite in the systems with CC was due to there being less cement to produce hydrate phases compared to the reference. The physical presence of CC at this stage acted as a filler, thereby providing more nucleation sites for C-S-H to precipitate [59,60]. At 28 days of hydration, the pozzolanic reaction of the CC led to the further reduction (here: consumption) in portlandite in the system. Between T = 600 °C and 800 °C, the decomposition of calcium carbonate (CaCO3) occurred due to the presence of unreacted calcite in the system stemming from LP [64,65,66,67]. The peak decreased with the increasing replacement level, as more carboaluminates were formed from LP and CC.
Figure 13 shows the specific pore volume of SC-P produced with and without CC as measured by MIP at 28 days of hydration. At 20 vol.% cement replacement by CC, the cumulative intruded volume of the mercury decreased by 4%, which is assumed to be within the deviation range of measurements, while at 40 vol.% cement replacement, the total intruded volume of the mercury increased by 18%. This is due to the higher accessible porosity of the 40 vol.% CC compared to both the 0 and 20 vol.% CC. The volume fraction of the gel pores in the systems with CC was greater than the reference, whereas the fraction of capillary pores was smaller. This pore size refinement was related to the pozzolanic reaction and the formation of more AFm phases in the binder systems with CC, as observed, e.g., by [17,68,69,70,71].
The compressive strength of SC-M was measured at ages of 2, 7 and 28 days (Figure 14a). Good correlations were observed between the 2 days compressive strength of the SC-M and its dynamic modulus of elasticity and hydration heat of the respective SC-P at 48 h, as shown in Figure 14b. At 2 and 7 days, the compressive strength values of the SC-M with CC were lower than that of the SC-M without CC due to the dilution effect by the CC. Nonetheless, the strength activity index of the SC-M with 20 and 40 vol.% CC at 7 days were 0.91 and 0.74, respectively, which was enough to consider the latter as SCM in concrete according to ASTM C311-18 [72]. At 28 days of curing, the pozzolanic reactivity of the CC led to the formation of more AFm phases and densification of the SC-M microstructure, as presented by thermal analysis and MIP. Consequently, higher values of compressive strength were achieved as depicted in Figure 14a. The strength activity index of the SC-M with 20 and 40 vol.% CC at this age were 1.08 and 1.07, respectively.
The influence of CC on hardened properties of SC-M was studied. The use of CC as a cement replacement at an early age of hydration (2 days) led to the reduction of the compressive strength, and limited the precipitation of hydrate phases. At later age of hydration, namely 28 days, the pozzolanic reactivity of CC led to specific pore volume refinement and improved the compressive strength of the SC-M.

4. Summary and Conclusions

The current study evaluated the potential of a calcined low-grade kaolinite clay as an alternative for metakaolin and for the production of SC-M and its future application in SCC. Although the calcined clay used in this experiment had a lower water demand than metakaolin, its specific surface area and water demand still surpassed that of cement. As a consequence, the calcined clay increased the viscosity of cementitious systems, and increased dosages of SP were necessary to deform the system and to achieve the targeted SC-M viscosity with up to 40 vol.% calcined clay as cement replacement. Based on the well-established SCC mix design method by Okamura, it was found that new thresholds are required for calcined clay blended SC-M. During the first two days of hydration, the calcined clay mainly acts as filler, leading to lower dynamic modulus of elasticity and compressive strength values. On the other hand, plastic shrinkage is reduced due to the higher water demand of calcined clay. Later on, the enhanced formation of carboaluminates and the consumption of portlandite to form C-S-H, AFt and AFm phases leads to both pore size refinement and higher compressive strength values. Based on the results obtained, these calcined common clays represent an attractive alternative for metakaolin in regions where kaolin is scarce and for high replacement levels. SC-M can be produced with up to 40 vol.% binder replacement with calcined common clay when adjusting the rheological properties by adding higher amounts of suitable superplasticizers. Further investigations will concentrate on determining the influence of these calcined clays on the rheology and durability of SCC. Therefore, the following new knowledge will be considered:
Replacing cement with calcined clay (CC) by up to 40 vol.% increased the water demand of SC-M by up to 16%. Thus, the required amount of superplasticizer increased by up to 65% to maintain the deformability of the cement matrix. High dosages of superplasticizer enabled a significant reduction in yield stress, while the plastic viscosity remained constant.
Higher values of relative flow area up to 10.2 (-) were achieved with up to 40 vol.% CC. The established lower value for relative flow velocity (Rf = 0.91 s−1), as obtained from the Okamura method, is not feasible with cement replacement beyond 10 vol.% of CC. The common thresholds for Γm (4.76 to 5.76), however, were conveniently achieved with replacement levels up to 40 vol.% of CC. An adjustment of the lower Rf thresholds could require shifting the upper limits of the Γm as well. The lower limit of the Rf requires an adjustment from 0.91 s−1 to 0.65 s−1 and the upper limit of the Γm from 5.76 to 7.50 to accommodate up to 40 vol.% cement replacement with CC.
The addition of CC had no significant effect on the time of initial setting and hardening of the cement. At 48 h of cement hydration, it reduced the dynamic modulus of elasticity by 14 and 24% at replacement levels of 20 and 40 vol.%, respectively.
The presence of CC in the cement system led to lower early strength values due to filler and dilution effects but also reduced plastic shrinkage tendency. This is of special interest for SCCs, as they commonly contain a higher amount of binder compared to conventional concrete and tend therefore to increased shrinkage and cracks.
At later ages, the pozzolanic activity was evident, shown in terms of portlandite consumption and an increased amount in AFm and C-S-H phases. The formation of AFm phases in the presence of CC was responsible for specific pore size reduction. Especially the microcapillary pore fraction of SC-P with 20 and 40 vol.% replacement levels was 71.4 and 77.8% lower, respectively, than for the reference. The gel pore fractions of SC-P with 20 and 40 vol.% cement replacement, instead, were 23.8 and 53.2% greater, respectively. The accessible porosity of the SC-P decreased by 6.8% at 20 vol.% CC, while at 40 vol.% CC, it increased by 11.4%. At 28 days, the addition of CC at 20 and 40 vol.% could improve the compressive strength values by up to 8.1 and 6.8%, respectively.

Author Contributions

Conceptualization, A.M.; writing—original draft preparation, A.M.; writing—review and editing, A.M., K.-C.T. and R.S.; supervision, K.-C.T. All authors have read and agreed to the published version of the manuscript.

Funding

The first author was funded by the German Academic Exchange Service (DAAD) and the Nigerian Petroleum Technology Development Fund (PTDF). We acknowledge financial support by University of the Bundeswehr Munich.

Data Availability Statement

Not applicable.

Conflicts of Interest

The authors declare no conflict of interest.

References

  1. Tangtinthai, N.; Heidrich, O.; Manning, D.A.C. Role of policy in managing mined resources for construction in Europe and emerging economies. J. Environ. Manag. 2019, 236, 613–621. [Google Scholar] [CrossRef] [PubMed]
  2. Schandl, H.; Fischer-Kowalski, M.; West, J.; Giljum, S.; Dittrich, M.; Eisenmenger, N.; Geschke, A.; Lieber, M.; Wieland, H.; Schaffartzik, A.; et al. Global material flows and resource productivity forty years of evidence. J. Ind. Ecol. 2018, 22, 827–838. [Google Scholar] [CrossRef]
  3. Schneider, M.; Romer, M.; Tschudin, M.; Bolio, H. Sustainable cement production—present and future. Cem. Concr. Res. 2011, 41, 642–650. [Google Scholar] [CrossRef]
  4. Okamura, H.; Ozawa, K. Mix-design for self-compacting concrete. Proc. JSCE 1995, 25, 107–120. [Google Scholar]
  5. Okamura, H. Self-Compacting High-Performance Concrete. Concr. Int. 1997, 19, 50–54. [Google Scholar]
  6. Shi, C.; Wu, Z.; Lv, K.; Wu, L. A review on mixture design methods for self-compacting concrete. Constr. Build. Mater. 2015, 84, 387–398. [Google Scholar] [CrossRef]
  7. Lamb, W.F.; Wiedmann, T.; Pongratz, J.; Andrew, R.; Crippa, M.; Olivier, J.G.J.; Wiedenhofer, D.; Mattioli, G.; Khourdajie, A.A.; House, J.; et al. A review of trends and drivers of greenhouse gas emissions by sector from 1990 to 2018. Environ. Res. Lett. 2021, 16, 073005. [Google Scholar] [CrossRef]
  8. Memon, S.A.; Shaikh, M.A.; Akbar, H. Utilization of Rice Husk Ash as viscosity modifying agent in Self Compacting Concrete. Constr. Build. Mater. 2011, 25, 1044–1048. [Google Scholar] [CrossRef]
  9. Yazici, H. The effect of silica fume and high-volume Class C fly ash on mechanical properties, chloride penetration and freeze-thaw resistance of self-compacting concrete. Constr. Build. Mater. 2008, 22, 456–462. [Google Scholar] [CrossRef]
  10. Bouzoubaâ, N.; Lachemi, M. Self-compacting concrete incorporating high volumes of class F fly ash: Preliminary results. Cem. Concr. Res. 2001, 31, 413–420. [Google Scholar] [CrossRef]
  11. Miller, S.A.; John, V.M.; Pacca, S.A.; Horvath, A. Carbon dioxide reduction potential in the global cement industry by 2050. Cem. Concr. Res. 2018, 114, 115–124. [Google Scholar] [CrossRef]
  12. Yahia, A.; Tanimura, M.; Shimoyama, Y. Rheological properties of highly flowable mortar containing limestone filler-effect of powder content and W/C ratio. Cem. Concr. Res. 2005, 35, 532–539. [Google Scholar] [CrossRef]
  13. Uysal, M.; Sumer, M. Performance of self-compacting concrete containing different mineral admixtures. Constr. Build. Mater. 2011, 25, 4112–4120. [Google Scholar] [CrossRef]
  14. Ghezal, A.; Khayat, K.H. Optimizing self-consolidating concrete with limestone filler by using statistical factorial design methods. ACI Mater. J. 2002, 99, 264–272. [Google Scholar] [CrossRef]
  15. Avet, F.; Scrivener, K. Hydration Study of Limestone Calcined Clay Cement (LC3) Using Various Grades of Calcined Kaolinitic Clays. In Calcined Clays for Sustainable Concrete—Proceedings of the 2nd International Conference on Calcined Clays for Sustainable Concrete; Martirena, F., Favier, A., Scrivener, K., Eds.; Springer Nature: La Havanna, Cuba, 2018; pp. 35–40. [Google Scholar]
  16. Scrivener, K.; Martirena, F.; Bishnoi, S.; Maity, S. Calcined clay limestone cements (LC3). Cem. Concr. Res. 2018, 114, 49–56. [Google Scholar] [CrossRef]
  17. Beuntner, N.; Thienel, K.-C. Performance and properties of concrete made with calcined clays. In Proceedings of the ACI SP 320-10th ACI/RILEM International Conference on Cementitious Materials and Alternative Binders for Sustainabe Concrete, Montreal, QC, Canada, 2–4 October 2017; pp. 7.1–7.12. [Google Scholar] [CrossRef]
  18. Scherb, S.; Beuntner, N.; Köberl, M.; Thienel, K.-C. The early hydration of cement with the addition of calcined clay—From single phyllosilicate to clay mixture. In Proceedings of the 20. Internationale Baustofftagung ibausil, Weimar, Germany, 12–14 September 2018; pp. 658–666. [Google Scholar]
  19. Maier, M.; Beuntner, N.; Thienel, K.-C. An approach for the evaluation of local raw material potential for calcined clay as SCM, based on geological and mineralogical data: Examples from German clay deposits. In Calcined Clays for Sustainable Concrete—Proceedings of the 3rd International Conference on Calcined Clays for Sustainable Concrete; Bishnoi, S., Ed.; RILEM Bookseries; Springer: Singapore, 2020; Volume 25, pp. 37–47. [Google Scholar] [CrossRef]
  20. Schmid, M.; Plank, J. Dispersing Performance of Different Kinds of Polycarboxylate (PCE) Superplasticizers in Cement Blended With a Calcined Clay. Constr. Build. Mater. 2020, 258, 119576. [Google Scholar] [CrossRef]
  21. Cardinaud, G.; Rozière, E.; Martinage, O.; Loukili, A.; Barnes-Davin, L.; Paris, M.; Deneele, D. Calcined clay—Limestone cements: Hydration processes with high and low-grade kaolinite clays. Constr. Build. Mater. 2021, 277, 122271. [Google Scholar] [CrossRef]
  22. Su, N.; Hsu, K.C.; Chai, H.W. A simple mix design method for self-compacting concrete. Cem. Concr. Res. 2001, 31, 1799–1807. [Google Scholar] [CrossRef]
  23. Sedran, T.; de Larrard, F.; Hourst, F.; Contamines, C. Mix Design of Self-Compacting Concrete (SCC). In Production Methods and Workability of Concrete, 1st ed.; Bartos, P.J.M., Cleland, D.J., Marrs, D.L., Eds.; CRC Press: London, UK, 1996; p. 12. [Google Scholar]
  24. Petersson, O.; Billberg, P.; Van, B.K. A Model for Self-Compacting Concrete. In Production Methods and Workability of Concrete, 1st ed.; Bartos, P.J.M., Cleland, D.J., Marrs, D.L., Eds.; CRC Press: London, UK, 1996; p. 10. [Google Scholar]
  25. Kannan, V. Relationship between ultrasonic pulse velocity and compressive strength of self compacting concrete incorporate rice husk ash and metakaolin. Asian J. Civ. Eng. 2015, 16, 1077–1088. [Google Scholar]
  26. Madandoust, R.; Mousavi, S.Y. Fresh and hardened properties of self-compacting concrete containing metakaolin. Constr. Build. Mater. 2012, 35, 752–760. [Google Scholar] [CrossRef]
  27. Pierkes, R.; Schulze, S.E.; Rickert, J. Durability of Concretes Made with Calcined Clay Composite Cements. In Proceedings of the Calcined Clays for Sustainable Concrete—Proceedings of the 2nd International Conference on Calcined Clays for Sustainable Concrete, La Havanna, Cuba, 5–7 December 2017; pp. 366–371. [Google Scholar] [CrossRef]
  28. Li, R.; Lei, L.; Sui, T.; Plank, J. Effectiveness of PCE superplasticizers in calcined clay blended cements. Cem. Concr. Res. 2021, 141, 106334. [Google Scholar] [CrossRef]
  29. Sposito, R.; Maier, M.; Beuntner, N.; Thienel, K.-C. Evaluation of zeta potential of calcined clays and time-dependent flowability of blended cement with customized polycarboxylate-based superplasticizers. Constr. Build. Mater. 2021, 308, 125061. [Google Scholar] [CrossRef]
  30. EFNARC. The European Guidelines for Self Compacting Concrete. Specif. Prod. Use 2005, 22, 563. [Google Scholar]
  31. EFNARC. Europäische Richtlinie für Spritzbeton/European Specification for Sprayed Concrete; EFNARC: Farnham, UK, 1997; p. 32. [Google Scholar]
  32. DIN EN 197-1; Zement—Teil 1: Zusammensetzung, Anforderungen und Konformitätskriterien von Normalzement (Cement—Part 1: Composition, Specifications and Conformity Criteria for Common Cements). DIN: Berlin, Germany, 2011; p. 8. [CrossRef]
  33. Beuntner, N.; Thienel, K.-C. Properties of Calcined Lias Delta Clay—Technological Effects, Physical Characteristics and Reactivity in Cement. In Calcined Clays for Sustainable Concrete—Proceedings of the 1st International Conference on Calcined Clays for Sustainable Concrete; Scrivener, K., Favier, A., Eds.; RILEM Bookseries; Springer: Dordrecht, The Netherlands, 2015; Volume 10, pp. 43–50. [Google Scholar] [CrossRef]
  34. Gmür, R.; Thienel, K.-C.; Beuntner, N. Influence of aging conditions upon the properties of calcined clay and its performance as supplementary cementitious material. Cem. Concr. Compos. 2016, 72, 114–124. [Google Scholar] [CrossRef]
  35. Sposito, R.; Schmid, M.; Beuntner, N.; Scherb, S.; Plank, J.; Thienel, K.-C. Early hydration behavior of blended cementitious systems containing calcined clays and superplasticizer. In Proceedings of the 15th International Congress on the Chemistry of Cement, Prague, Czech Republic, 16–20 September 2019; p. 10. [Google Scholar]
  36. DIN EN ISO 11885; Water Quality—Determination of Selected Elements by Inductively Coupled Plasma Optical Emission Spectrometry (ICP-OES). DIN: Berlin, Germany, 2009; p. 37.
  37. Sposito, R.; Maier, M.; Beuntner, N.; Thienel, K.-C. Physical and mineralogical properties of calcined common clays as SCM and their impact on flow resistance and demand for superplasticizer. Cem. Concr. Res. 2022, 154, 106743. [Google Scholar] [CrossRef]
  38. DIN ISO 9277; Determination of the Specific Surface Area of Solids by Gas Adsorption—BET Method. DIN: Berlin, Germany, 2003; p. 19.
  39. DIN EN 196-3; Prüfverfahren für Zement—Teil 3: Bestimmung der Erstarrungszeiten und der Raumbeständigkeit (Methods of Testing Cement—Part 3: Determination of Setting Times and Soundness). DIN: Berlin, Germany, 2009; p. 17.
  40. Puntke, W. Wasseranspruch von feinen Kornhaufwerken. Beton 2002, 52, 242–248. [Google Scholar]
  41. DIN EN ISO 17892-3; Geotechnical Investigation and Testing—Laboratory Testing of Soil—Part 3: Determination of Particle Density. DIN: Berlin, Germany, 2015; p. 21.
  42. ISO 13320; Particle Size Analysis—Laser Diffraction Methods. ISO: Geneva, Switzerland, 2020; p. 59.
  43. Sposito, R.; Beuntner, N.; Thienel, K.-C. Rheology, setting and hydration of calcined clay blended cements in interaction with PCE-based superplasticisers. Mag. Concr. Res. 2021, 73, 785–797. [Google Scholar] [CrossRef]
  44. DIN EN 933-1; Pru“fverfahren fu“r Geometrische Eigenschaften von Gesteinskörnungen—Teil 1: Bestimmung der Korngrößenverteilung—Siebverfahren (Tests for Geometrical Properties of Aggregate—Part 1: Determination of Particle size Distribution—Sieving Method). DIN: Berlin, Germany, 2012; p. 19.
  45. Okamura, H.; Ouchi, M. Self-Compacting Concrete. J. Adv. Concr. Technol. 2003, 1, 5–15. [Google Scholar] [CrossRef]
  46. Le, H.T.; Kraus, M.; Siewert, K.; Ludwig, H.M. Effect of macro-mesoporous rice husk ash on rheological properties of mortar formulated from self-compacting high performance concrete. Constr. Build. Mater. 2015, 80, 225–235. [Google Scholar] [CrossRef]
  47. Barnes, H.A.; Walters, K. The yield stress myth? Rheologica Acta 1985, 24, 323–326. [Google Scholar] [CrossRef]
  48. Hackley, V.A.; Ferraris, C.F. Guide to Rheological Nomenclature—Measurements in Ceramic Particulate Systems; National Institute of Standards and Technology: Gaithersburg, MD, USA, 2001; Volume 3, p. 29. [Google Scholar]
  49. DIN EN 12504-4; Prüfung von Beton in Bauwerken—Teil 4: Bestimmung der Ultraschallgeschwindigkeit (Testing concrete in structures—Part 4: Determination of ultrasonic pulse velocity). DIN: Berlin, Germany, 2004; p. 15.
  50. Lootens, D.; Bentz, D.P. On the relation of setting and early-age strength development to porosity and hydration in cement-based materials. Cem. Concr. Compos. 2016, 68, 9–14. [Google Scholar] [CrossRef] [PubMed] [Green Version]
  51. DIN EN 60825-1; Sicherheit von Lasereinrichtungen—Teil 1: Klassifizierung von Anlagen und Anforderungen (Safety of Laser Products—Part 1: Equipment Classification and Requirements). DIN: Berlin, Germany, 2015; p. 15.
  52. Snellings, R.; Chwast, J.; Cizer, Ö.; Belie, N.; Dhandapani, Y.; Durdziński, P.; Elsen, J.; Haufe, J.; Hooton, D.; Patapy, C.; et al. RILEM TC-238 SCM recommendation on hydration stoppage by solvent exchange for the study of hydrate assemblages. Mater. Struct. 2018, 51, 1–4. [Google Scholar] [CrossRef]
  53. Marsh, B.K.; Day, R.L. Pozzolanic and cementitious reactions of fly ash in blended cement pastes. Cem. Concr. Res. 1988, 18, 301–310. [Google Scholar] [CrossRef]
  54. DIN 66133; Bestimmung der Porenvolumenverteilung und der spezifischen Oberfläche von Feststoffen durch Quecksilberintrusion (Determination of Pore Volume Distribution and Specific Surface Area of Solids by Mercury Intrusion). DIN: Berlin, Germany, 1993; p. 3.
  55. DIN EN 196-1; Prüfverfahren für Zement—Teil 1: Bestimmung der Festigkeit (Methods of Testing Cement—Part 1: Determination of Strength). DIN: Berlin, Germany, 2016; p. 31.
  56. Sposito, R.; Schmid, M.; Plank, J.; Thienel, K.-C. An approach to the rheological behavior of cementitious systems blended with calcined clays and superplasticizers. In Proceedings of the ACI SP 349 11th International Conference on Cementitious Materials and Alternative Binders for Sustainable Concrete, Online, 28 April 2021; pp. 659–685. [Google Scholar]
  57. Zunino, F.; Scrivener, K. Studying the Influence of the Filler Effect of SCMs on the Sulfate Requirement of Blended Cements. In Proceedings of the ACI SP 349 11th International Conference on Cementitious Materials and Alternative Binders for Sustainable Concrete, Online, 22 April 2021; pp. 117–124. [Google Scholar]
  58. Andrade Neto, J.D.S.; De la Torre, A.G.; Kirchheim, A.P. Effects of sulfates on the hydration of Portland cement—A review. Constr. Build. Mater. 2021, 279, 122428. [Google Scholar] [CrossRef]
  59. Berodier, E.; Scrivener, K. Understanding the Filler Effect on the Nucleation and Growth of C-S-H. J. Am. Ceram. Soc. 2014, 97, 3764–3773. [Google Scholar] [CrossRef]
  60. Thomas, J.J.; Jennings, H.M.; Chen, J.J. Influence of nucleation seeding on the hydration mechanisms of tricalcium silicate and cement. J. Phys. Chem. C 2009, 113, 4327–4334. [Google Scholar] [CrossRef] [Green Version]
  61. Hesse, C.; Goetz-Neunhoeffer, F.; Neubauer, J. A new approach in quantitative in-situ XRD of cement pastes: Correlation of heat flow curves with early hydration reactions. Cem. Concr. Res. 2011, 41, 123–128. [Google Scholar] [CrossRef]
  62. Barluenga, G.; Puentes, J.; Palomar, I. Early age monitoring of self-compacting concrete with mineral additions. Constr. Build. Mater. 2015, 77, 66–73. [Google Scholar] [CrossRef]
  63. ASTM C1679-17; Standard Practice for Measuring Hydration Kinetics of Hydraulic Cementitious Mixtures Using Isothermal Calorimetry. ASTM International: West Conshehoken, PA, USA, 2018; p. 13.
  64. Palou, M.; Boháč, M.; Kuzielová, E.; Novotný, R.; Žemlička, M.; Dragomirová, J. Use of calorimetry and thermal analysis to assess the heat of supplementary cementitious materials during the hydration of composite cementitious binders. J. Therm. Anal. Calorim. 2020, 142, 97–117. [Google Scholar] [CrossRef]
  65. Ma, J.; Yu, Z.; Shi, H.; Zhang, Y.; Shen, X. Long-term hydration behavior and pore structure development of cement–limestone binary system. J. Therm. Anal. Calorim. 2021, 143, 843–852. [Google Scholar] [CrossRef]
  66. Qin, L.; Gao, X.; Zhang, A. Potential application of Portland cement-calcium sulfoaluminate cement blends to avoid early age frost damage. Constr. Build. Mater. 2018, 190, 363–372. [Google Scholar] [CrossRef]
  67. Ye, G.; Liu, X.; De Schutter, G.; Poppe, A.M.; Taerwe, L. Influence of limestone powder used as filler in SCC on hydration and microstructure of cement pastes. Cem. Concr. Compos. 2007, 29, 94–102. [Google Scholar] [CrossRef]
  68. Laidani, Z.E.-A.; Benabed, B.; Abousnina, R.; Gueddouda, M.K.; Kadri, E.-H. Experimental investigation on effects of calcined bentonite on fresh, strength and durability properties of sustainable self-compacting concrete. Constr. Build. Mater. 2020, 230, 117062. [Google Scholar] [CrossRef]
  69. San Nicolas, R.; Cyr, M.; Escadeillas, G. Performance-based approach to durability of concrete containing flash-calcined metakaolin as cement replacement. Const.r Build. Mater. 2014, 55, 313–322. [Google Scholar] [CrossRef]
  70. Vejmelková, E.; Koňáková, D.; Doleželová, M.; Scheinherrová, L.; Svora, P.; Keppert, M.; Reiterman, P.; Černý, R. Effect of calcined Czech claystone on the properties of high performance concrete: Microstructure, strength and durability. Constr. Build. Mater. 2018, 168, 966–974. [Google Scholar] [CrossRef]
  71. Tironi, A.; Sposito, R.; Cordoba, G.P.; Zito, S.V.; Rahhal, V.; Thienel, K.-C.; Irassar, E.F. Influence of different calcined clays to the water transport performance of concretes. Mag. Concr. Res. 2022, 12, 1–13. [Google Scholar] [CrossRef]
  72. ASTM C311-22; Standard Test Method for Sampling and Testing Fly Ash or Natural Pozzolans for Use in Portland-Cement Concrete. ASTM International: West Conshehoken, PA, USA, 2022; p. 11.
Figure 1. Particle size distribution of fine aggregate determined according to DIN EN 933-1 [44].
Minerals 12 00625 g001
Figure 2. Volumetric water to powder ratio for zero relative flow area depending on the CC substitution rate.
Minerals 12 00625 g002
Figure 3. Influence of CC on the Γm of SC-P.
Minerals 12 00625 g003
Figure 4. Γm and Rf of SC-M with varying Vw/Vp ratios of 0.850 to 0.925 and constant Vs = 0.4.
Minerals 12 00625 g004
Figure 5. Γm and Rf of SC-M, (a) = Γm and Rf thresholds recommended by Okamura and (b) = proposed Γm and Rf thresholds.
Minerals 12 00625 g005
Figure 6. Shear stress of SC-M with varying Vcc, at constant Vw/Vp = 0.875 and SP dosage of 0.50.
Minerals 12 00625 g006
Figure 7. Comparison of yield stress and plastic viscosity of SC-M-1 with varying Vcc and SP dosages.
Minerals 12 00625 g007
Figure 8. Heat flow (a) and Hydration heat (b) of SC-P with and without CC.
Minerals 12 00625 g008
Figure 9. Dynamic modulus of elasticity of SC-M specimens.
Minerals 12 00625 g009
Figure 10. Plastic shrinkage of SC-M specimens.
Minerals 12 00625 g010
Figure 11. DTA curves of SC-P at 2 days (a) and 28 days (b) of hydration (E = ettringite, Mc = monocarboaluminat, Hc = hemicarboaluminate).
Minerals 12 00625 g011
Figure 12. Portlandite (CH) in [mg] at 2 and 28 days of hydration.
Minerals 12 00625 g012
Figure 13. Pore size distribution of SC-P at 28 days of hydration.
Minerals 12 00625 g013
Figure 14. (a) Compressive strength development of SC-M specimens, (b) Correlation between the compressive strength at 2 days with dynamic modulus and hydration heat at 2 days of hydration.
Minerals 12 00625 g014
Table 1. Oxide compositions of OPC, LP and CC (wt.%).
Binder MaterialsSiO2Al2O3CaOFe2O3MgOSO3TiO2Na2OLOI
OPC20.15.460.72.91.83.40.30.651.80
LP0.60.156.40.10.20.00.00.042.60
CC53.222.26.58.02.72.01.00.40.02
Table 2. Physical properties of OPC, LP and CC.
PropertiesMethodologyOPCLPCC
Specific surface area, m2/gDIN ISO 9277 [38]1.01.63.9
Water demand, wt.%DIN EN ISO 196-3 [39] for OPC and Puntke method for LP and CC [40]28.9 *2038
Particle density, g/cm3DIN EN ISO 17892-3 [41]3.172.712.63
d10, µmISO 13320 [42]4.11.74.0
d50, µm15.85.113.2
d90, µm46.013.037.0
* data taken from Sposito et al. [43].
Table 3. Proportioning of the paste constituents for TG and MIP.
Mix DesignationVw/VpConstituent
(Measured in dm3/m3)
Constituent
(Measured in kg/m3)
OPCLPCCWaterOPCLPCCWaterSP
[wt.%]
SC-P0.87545380-4671405218-4670.2
SC-P-20CC0.8753636410746711241752834670.3
SC-P-40CC0.875272482134678431315654670.4
Table 4. SC-M mix designation.
Mix DesignationVw/VpConstituent
(Measured in dm3/m3)
Constituent
(Measured in kg/m3)
OPCLPCCFAWaterOPCLPCCFAWaterSP
[wt.%]
SC-M-10.87527248-400280843131-1112800.40–0.55
SC-M-1-10CC0.8752454332400280759118851112800.40–0.55
SC-M-1-20CC0.87521838644002806751051701112800.45–0.60
SC-M-1-30CC0.8751903496400280590922541112800.45–0.60
SC-M-1-40CC0.87516329128400280506793391112800.45–0.65
Publisher’s Note: MDPI stays neutral with regard to jurisdictional claims in published maps and institutional affiliations.

