
Microwave Dewatering of Gibbsite-Type Bauxite Ores: Permittivities, Heating Behavior and Strength Indices

Robert M. Buchan Department of Mining, Queen’s University, Kingston, ON K7L 3N6, Canada
*
Author to whom correspondence should be addressed.
Minerals 2022, 12(5), 648; https://0-doi-org.brum.beds.ac.uk/10.3390/min12050648
Submission received: 30 March 2022
/
Revised: 12 May 2022
/
Accepted: 17 May 2022
/
Published: 20 May 2022
(This article belongs to the Section Mineral Processing and Extractive Metallurgy)
Abstract
:Microwave radiation is a relatively new energy source that is being considered for several applications in mineral processing and extractive metallurgy. In the present research, various gibbsite-type bauxite ores were subjected to microwave radiation. The main objective was to assess the effect of microwave dewatering on the compressive strength indices of the ores and to compare the results obtained to those for conventional heating. Firstly, the fundamental interactions of the microwaves with the ores were evaluated by determining both the real and the imaginary permittivities as a function of temperature, and these were related to the water content. Secondly, the microwave heating behavior was modeled using a 24 factorial statistical analysis. Thirdly, the effect of dewatering by microwave heating on the compressive strength indices of roughly spherical bauxite ore pisoids was studied, and these results were compared to those obtained using conventional heating. Fourthly, the effect of particle size on the compressive strengths of irregular-shaped single particles of bauxite ore was investigated using both heating techniques. Finally, the energy requirements for dewatering of the ores, and hence reducing their compressive strengths, were compared for both processes. On the laboratory scale, the results showed that in comparison to conventional dewatering, microwave dewatering resulted in lower strength indices at both lower moisture removals and energy inputs.
1. Introduction
In the metallurgical industry, bauxite ores are the main source of alumina, which is the primary feedstock for aluminum production. The majority of the world’s bauxite is used to produce alumina via the Bayer process, which is then converted into aluminum via the Hall-Heroult process [1]. Bauxite is a mixture of three different aluminum hydroxides in varying amounts, with some oxide impurities. As shown in Table 1, the three aluminum hydroxides commonly found in bauxite ores are gibbsite (γ-Al(OH)3), boehmite (γ-AlOOH) and diaspore (α-AlOOH). It can be noted that boehmite and diaspore are dimorphous. The most frequently occurring oxide impurity minerals are: goethite (FeO(OH)), aluminum-substituted goethite ((Alx,Fe1−x)OOH), hematite (Fe2O3), anatase (TiO2), kaolinite (Al4Si4O10(OH)8) and quartz (SiO2). Consequently, the major oxide impurities are Fe2O3, TiO2 and SiO2. Based on the amounts of the different aluminum hydroxides that are present, bauxite can be classified into three different types: gibbsite-type bauxite, boehmite-type bauxite or diaspore-type bauxite. The thermal dewatering of bauxite ores mainly involves the removal of the loosely bound water at low temperatures, and this is followed by the more strongly bonded water as the temperature increases. Loosely bound water or free water would be expected to be removed by about 100 °C, and this would be followed by the more strongly bonded water and the dewatering of the major minerals, such as gibbsite (Al(OH)3), followed by boehmite (γ-AlO(OH)) or diaspore (α-AlO(OH)). In some cases, other hydroxylated minor minerals, such as goethite (FeO(OH)) and kaolinite (Al2Si2O5(OH)4), may also be present in the bauxite ores.

Table 1.
Major mineralogical components in a typical bauxite ore (adapted from Ref [2]).
Table 1.
Major mineralogical components in a typical bauxite ore (adapted from Ref [2]).
| Minerals | Formula |
|---|---|
| Gibbsite | γ-Al (OH)3 |
| Boehmite | γ-AlOOH |
| Diaspore | α-AlOOH |
| Goethite | FeOOH |
| Aluminum Goethite | (Alx,Fe1−x)OOH |
| Anatase/Rutile | TiO2 |
| Kaolinite/Halloysite | Al4Si4O10(OH)8 |
| Quartz | SiO2 |
Numerous experimental studies have been conducted on the thermal decomposition processes of the various bauxite ores [3,4,5,6,7,8,9,10,11,12]. Typically, these studies have utilized thermogravimetric analysis (TGA) and/or differential thermal analysis (DTA) techniques. These results exhibit considerable variability, as they are dependent on both sample and equipment factors, such as: impurity content, particle size, degree of crystallinity, heating rate, atmospheric conditions, gas flowrate, ambient pressure and water vapor pressure. It is generally accepted that the thermal decomposition of gibbsite proceeds via two stages as the temperature increases. Firstly, at relatively low temperatures of up to about 270 °C, the gibbsite is converted into boehmite as follows:
Al(OH)3 = AlO(OH) + H2O(g)
Based on this stoichiometry, the theoretical mass loss for this process is 23.1%. Secondly, at somewhat higher temperatures of up to about 500 °C, the boehmite is converted into alumina (Al2O3) as follows:
2AlO(OH) = Al2O3 + H2O(g)
Here, the stoichiometric mass loss would be 11.5%, and thus, the overall mass loss would be 34.6%. For finer and/or less crystalline bauxite ores, it has been found that these two processes can occur simultaneously to some degree at about 270 °C, and any remaining more stable boehmite may decompose at higher temperatures [13,14,15,16]. On the other hand, for coarser and/or more crystalline ores, the two dewatering stages can be more distinct [13,14,15,16].
Gibbsite contains hydroxyl groups, and the basic layered structure consists of stacked sheets of aluminum hydroxide octahedrons (Al(OH)6). Each octahedron consists of six hydroxyl anions (OH−) that are octahedrally shared with two aluminum cations (Al3+), and one octahedral site is vacant. On the other hand, boehmite is composed of sheets of edge-sharing Al-(O,OH) octahedrons. Oxygen is at the corners of four of the octahedra, and the hydroxyl ion is at the corners of two of the octahedra. During dehydroxylation, the smaller protons diffuse and combine with the larger hydroxyl ions to form water vapor according to the following reaction [17]:
H+ + OH− = H2O(g)
As a result of the distinct bonding mechanisms in gibbsite and boehmite, the interactions of the electromagnetic field during microwave dewatering of these minerals would be expected to be different.
1.1. Microwave Fundamentals
Microwave radiation is the part of the electromagnetic spectrum where frequencies are relatively low, ranging from 300 MHz to 300 GHz, and wavelengths are relatively large, ranging from about 1 mm to 1 m. For domestic applications, 2.45 GHz is used and 915 MHz for industrial applications. The interaction of a microwave field with a given material is dependent on both the magnetic permeabilities and the electrical permittivities of the material. For most ores and minerals, the contribution of the magnetic permeability is not significant, and therefore, the interaction can be adequately described by the complex permittivity (ε) as follows:
In Equation (4), ε′ is the real permittivity or the dielectric constant; ε″ is the imaginary permittivity or the dielectric loss; j is the imaginary component in the + j-axis direction . Equation (4) can be converted into Equation (5), where εo is the permittivity of free space or in vacuum with a value of 8.86 × 10⁻¹² F/m; is the relative real permittivity or relative dielectric constant; and is the relative imaginary permittivity or relative dielectric loss. The real permittivity is a measure of the capacitance and is related to the polarizability of the material and hence its ability to store electrical energy from the external field. The imaginary permittivity is a measure of the material’s ability to dissipate the electrical energy from the electromagnetic field, typically as heat. Usually, the imaginary permittivity is much smaller than the real permittivity. Additionally, since the imaginary permittivity is greater than zero, most materials will heat to some extent. The imaginary permittivity is a function of electrical conductivity (σ) and frequency (f) as follows:
Thus, the imaginary permittivity increases with conductivity and decreases with frequency. Additionally, since the conductivities of minerals increase with temperature, particularly at higher temperatures, then the imaginary permittivity would be expected to exhibit a similar behavior.
An important intrinsic material property in microwave processing is the ratio of the imaginary permittivity to the real permittivity, and this is referred to as the loss tangent or dissipation factor as follows:
The loss tangent is a measure of the energy transferred from the field into the material, which is converted into heat. For efficient microwave heating, the imaginary permittivity should be high, and the real permittivity should have an intermediate value.
1.2. Microwaves and Minerals
Microwaves have the ability to heat materials by various mechanisms, such as dipolar polarization, ionic polarization, atomic polarization and surface polarization. A number of studies have been performed on the microwave heating behaviors of materials of interest, in particular compounds and minerals. Ford and Pei observed that darker colored materials heated more readily than lighter ones [18]. Chen et al. concluded that the heating behaviors of minerals in a microwave field are composition dependent [19]. A review by the Atomic Energy of Canada Limited in 1990 divided materials into four groups based on the heating rate in a microwave field [20]. In comparison to conventional heating involving radiation, conduction and convection, microwave heating has several unique characteristics. Being a form of electromagnetic radiation, microwaves can potentially penetrate into the interior of a material, and thus, any limitations due to low thermal conductivity can be overcome to some extent. Another unique characteristic of microwave processing of multiphase materials is the potential for selective heating. Since the microwave absorption characteristics are material dependent, then some degree of selective heating can be achieved in heterogeneous materials, where one phase heats faster than another phase. Of particular interest for the microwave processing of ores or concentrates is the effect of the field on the individual heterogeneous particles. Minerals exhibit different microwave absorption characteristics, and therefore, they can have dissimilar heating behaviors. This phenomenon of anisothermal conditions or localized heating has been confirmed by measurement of the temperatures of the individual phases in multiphase materials [21]. The degree of this selective heating would be expected to depend on a number of material properties, such as the size and the composition of the phases and their thermal conductivities.
A number of attempts have been made to utilize selective heating for various applications in mineral processing [22,23,24,25,26]. Perhaps the most researched application is microwave pretreatment in comminution, which has been widely reported in the literature as a method to reduce the overall energy consumed [27,28,29,30,31]. Usually, ores are highly heterogeneous and are composed of at least two mineral components, and one of these phases will heat more readily than the others, and this leads to thermal stress fracturing along the grain boundaries. This is particularly relevant for ores where a sulphide phase, which is a good microwave absorber, is in an oxide matrix, which is a poor absorber. One method to investigate the effect of selective heating in heterogeneous ores is to determine the change in the strength of the material after microwave processing. This weakening of the structure can potentially reduce the energy requirements in subsequent crushing and grinding operations. The reported benefits of microwave treatment for comminution in the literature include reduced ore competency, improved liberation and reduced mill wear and maintenance [32,33,34].
On the other hand, there is a paucity of information regarding the effect of microwave heating on the strength reduction of ores or minerals as a result of dewatering. Water in the bulk form is a very good microwave absorber, and the interaction depends on the strength of the hydrogen bonded network and any ions that are present. Therefore, it would be expected that some degree of selective heating could be achieved when water is present in an ore or concentrate. However, this water can be more strongly bonded than bulk water, and therefore, its behavior in these materials can be quite different. However, there is a dearth of information regarding the interaction of microwaves with the different types of water that are present and also the effects of temperature and frequency. The interaction depends on the ability of the microwaves to polarize the water molecules, and this, in turn, depends on the bond strength between the water molecules and the substrate. Water trapped in pores or cracks can be relatively free and thus would be expected to absorb microwaves. On the other hand, adsorbed water, which is strongly bonded, would have less of an interaction, with water multilayers being more absorbent than a monolayer. This type of water is removed at about 100 °C, while hydrated water (·nH2O) requires a few hundred degrees to remove. The hydroxyl ion (OH−), which is bonded to a cation in the crystal structure, will require even higher temperatures to be converted into water. Thus, in general, for minerals and ores, the type of water can be ranked in terms of increasing interaction with the microwaves as follows: hydroxylated water < hydrated water < adsorbed monolayer < adsorbed multilayers < bulk water.
There is very little information in the literature regarding the effects of microwave dewatering of ores or minerals on their mechanical properties. Peinsitt et al. have investigated the properties of both dry and water saturated granite, basalt and sandstone using uniaxial compressive strength and P-wave velocity testing [35]. After microwave irradiation, the water saturated samples were weaker, and this was more significant for sandstone than for granite, and there was no effect for basalt. Large cracks and bursting were observed to occur in the sandstone. These results would indicate that the weakening effect was more pronounced for the porous rocks. In some materials such as coal, it has been shown that microwaves can facilitate fracturing and hence lower the mechanical strength of the material [36,37,38]. Huang et al. have reported that water saturation levels between 25% and 50% can provide optimum microwave fracturing in coal [39]. In general, this phenomenon can occur by at least three mechanisms. Firstly, selective heating of different phases in the coal can result in thermal stress fracturing along grain boundaries. Secondly, the microwaves can cause microdamage of the pore structure. This damage can accumulate and become macrodamage, which can ultimately result in crack formation. This method of crack formation is different than in conventional heating, and also, the crack formation can be more extensive. Thirdly, water trapped in pores and cracks below the surface can be heated above its boiling point, and the resulting internal pressures can induce fracturing.
In the present research, the major objective was to perform a comparative study of the dewatering and weakening of gibbsite-type bauxite ores by both conventional and microwave heating processes. In order to understand the interaction of the microwaves with the ores, permittivity studies were conducted, and also, the heating behavior was determined. The changes in the properties of the ore as a result of dewatering were evaluated using the compressive strength index. Roughly spherical bauxite ore pisoids were utilized to study the effects of conventional and microwave processing on the compressive strength indices. There is considerable controversy regarding the effect of particle size on the microwave heating behaviors of materials. Consequently, single particle compressive strength index studies were performed to investigate the effect of particle size. Finally, based on the compressive strength reductions for both conventional and microwave processing, a laboratory-scale energy comparison for the two processes is given.
2. Experimental Section
2.1. Raw Materials
Chemical and Mineralogical Compositions
Three different bauxite ores (1,2,3) were obtained from Alcan International Limited operations for this study. Bauxite (1) was used in the TGA, permittivity and the microwave heating behavior studies, while bauxite (2) and bauxite (3) were utilized to investigate the effect of microwaves on the ore strength. The chemical compositions of the three bauxite ore samples were determined by X-ray fluorescence (XRF), and the results are shown in Table 2. It can be seen that the alumina content was in the range of 49% to 55%, and the loss on ignition (LOI) varied from about 25% to 28%. The iron oxide content varied quite widely from about 5% to 19%. With bauxite (1) and bauxite (2), the major impurities were iron oxide, followed by silica and then titanium oxide. For the bauxite (3) sample, the amount of iron oxide was much lower than that of the other bauxite samples. For all the ores, the major impurities, in order of decreasing weight percentage, were iron oxide, silica and titanium oxide.
Table 3 shows the major minerals in the bauxite ore samples, as determined by X-ray diffraction (XRD). The results indicated that all the samples were the gibbsite (γ-Al(OH)3)-type bauxite with a small amount of kaolinite (Al4Si4O10(OH)8). In addition, some boehmite (γ-AlOOH) was found in bauxite (2) and bauxite (3). The iron oxide in all of the bauxite samples was present as hematite. The titanium oxide was present as anatase (TiO2) in all the bauxites.
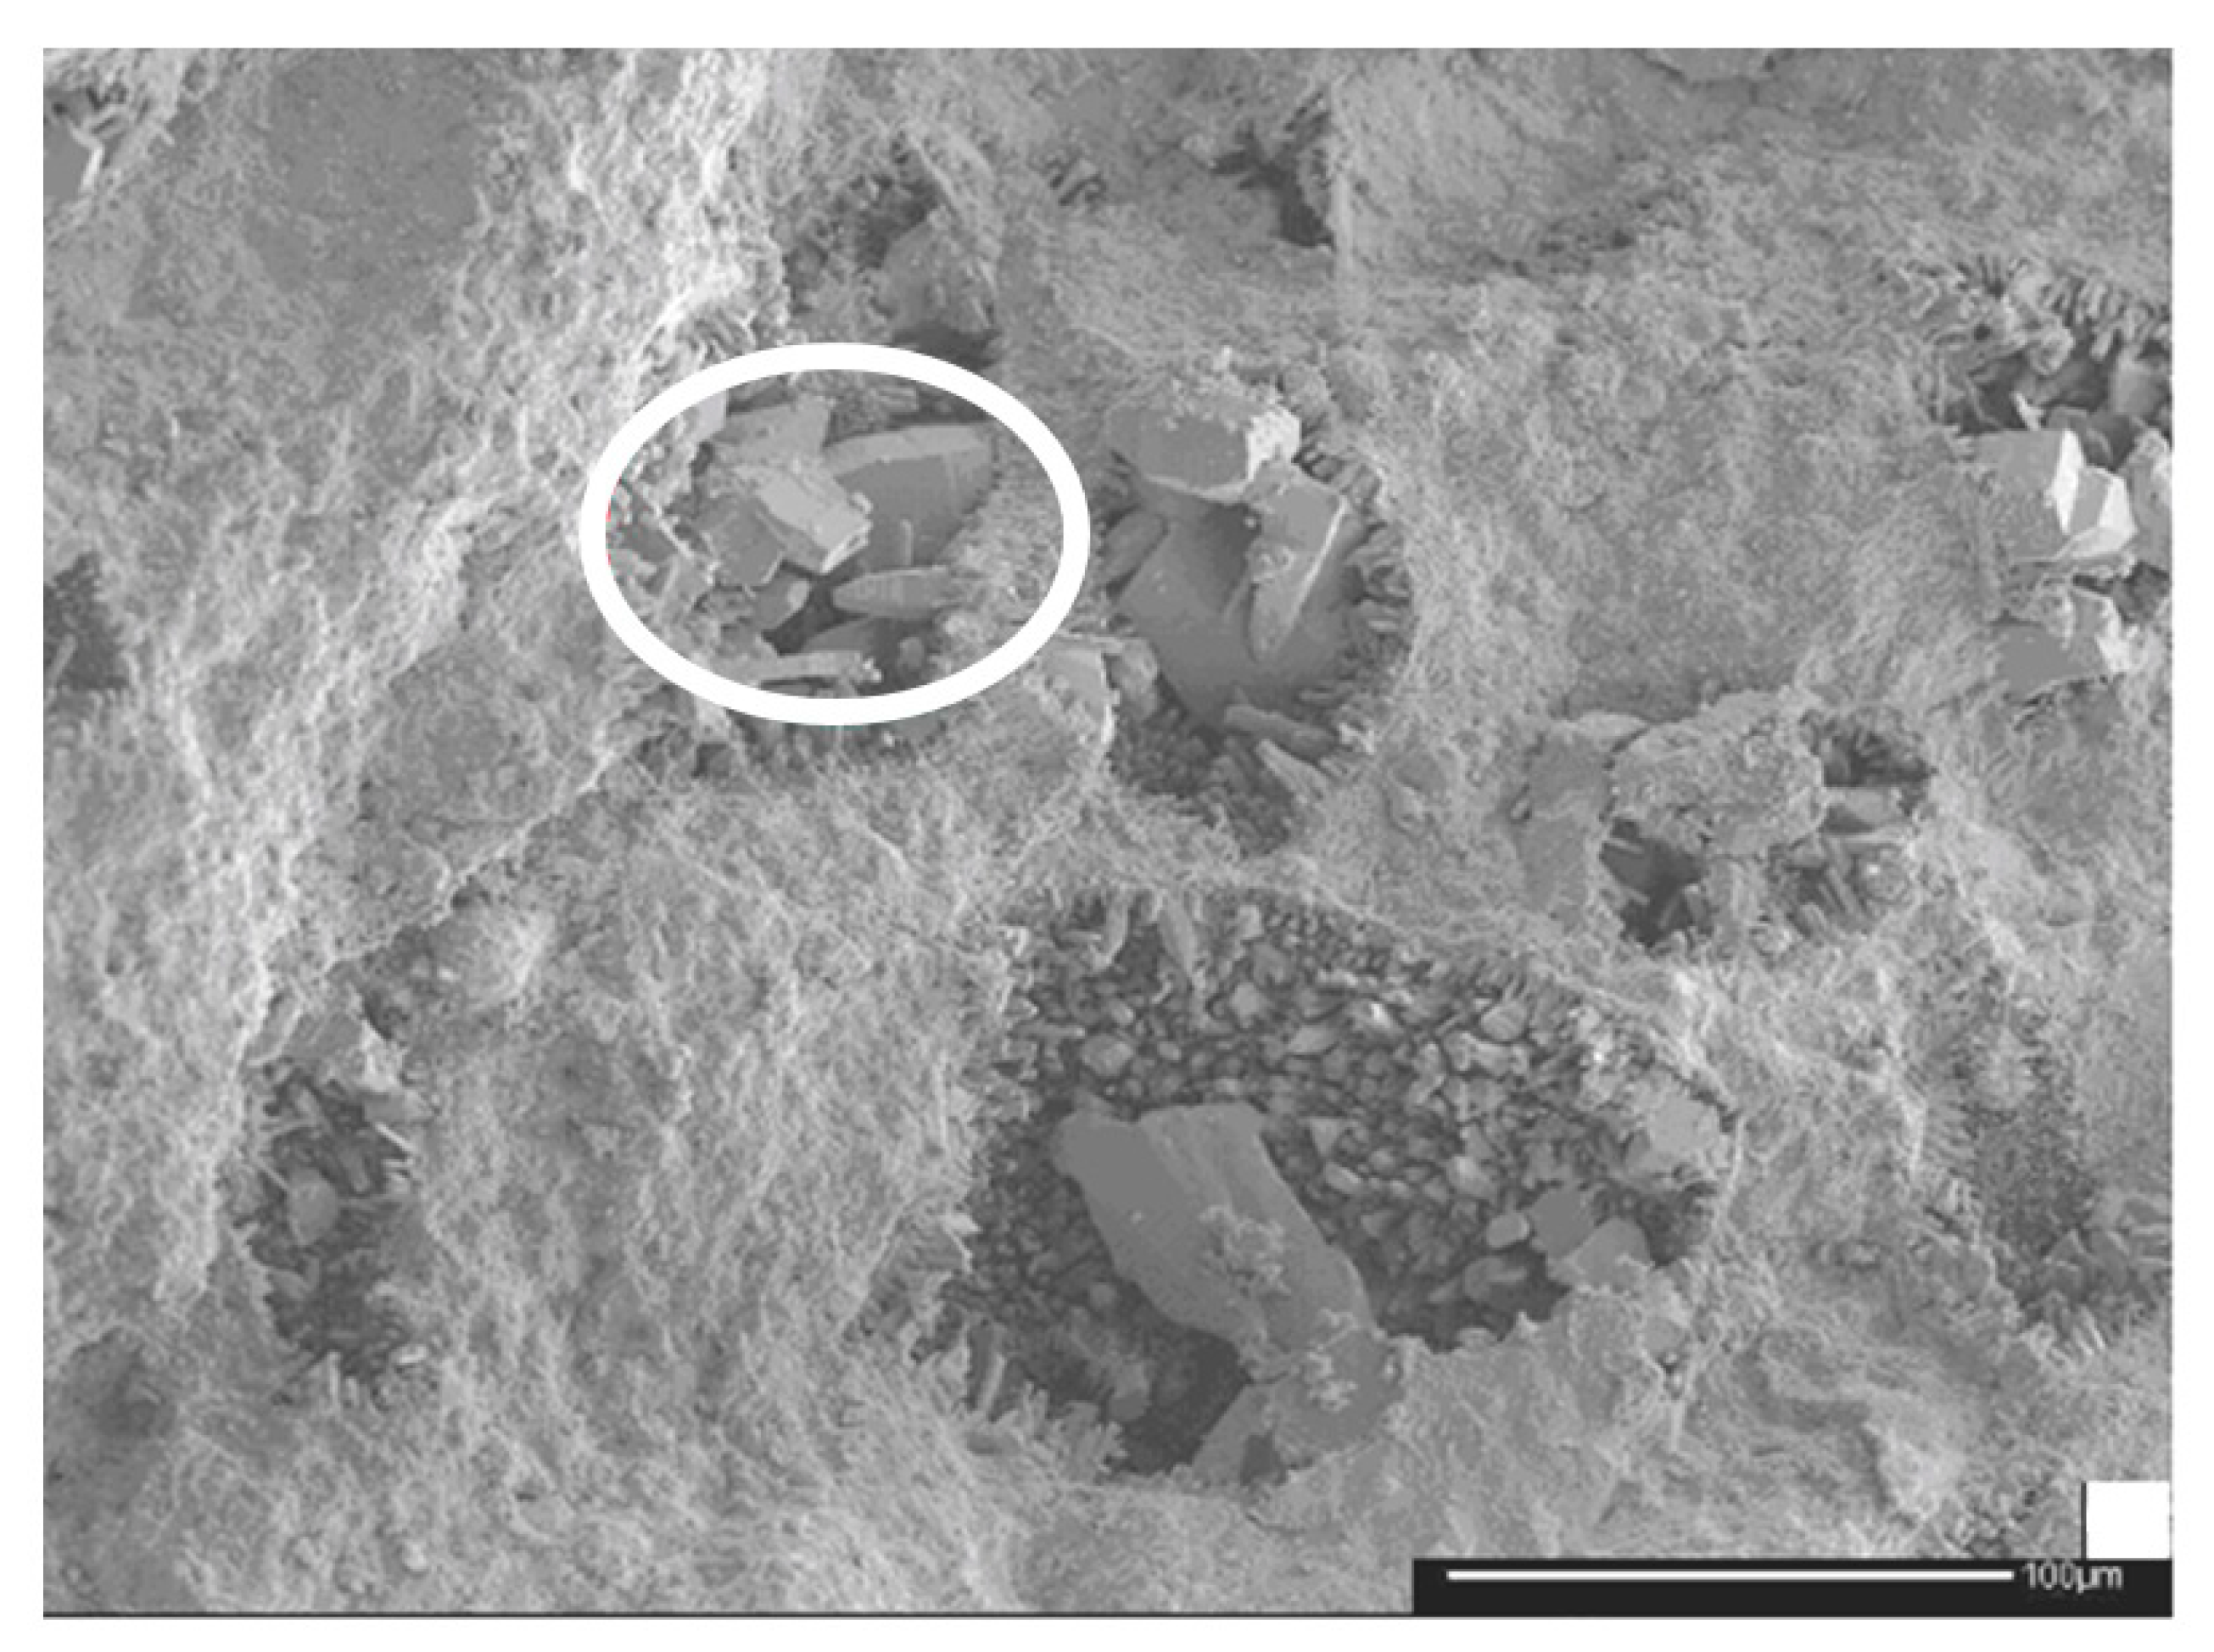
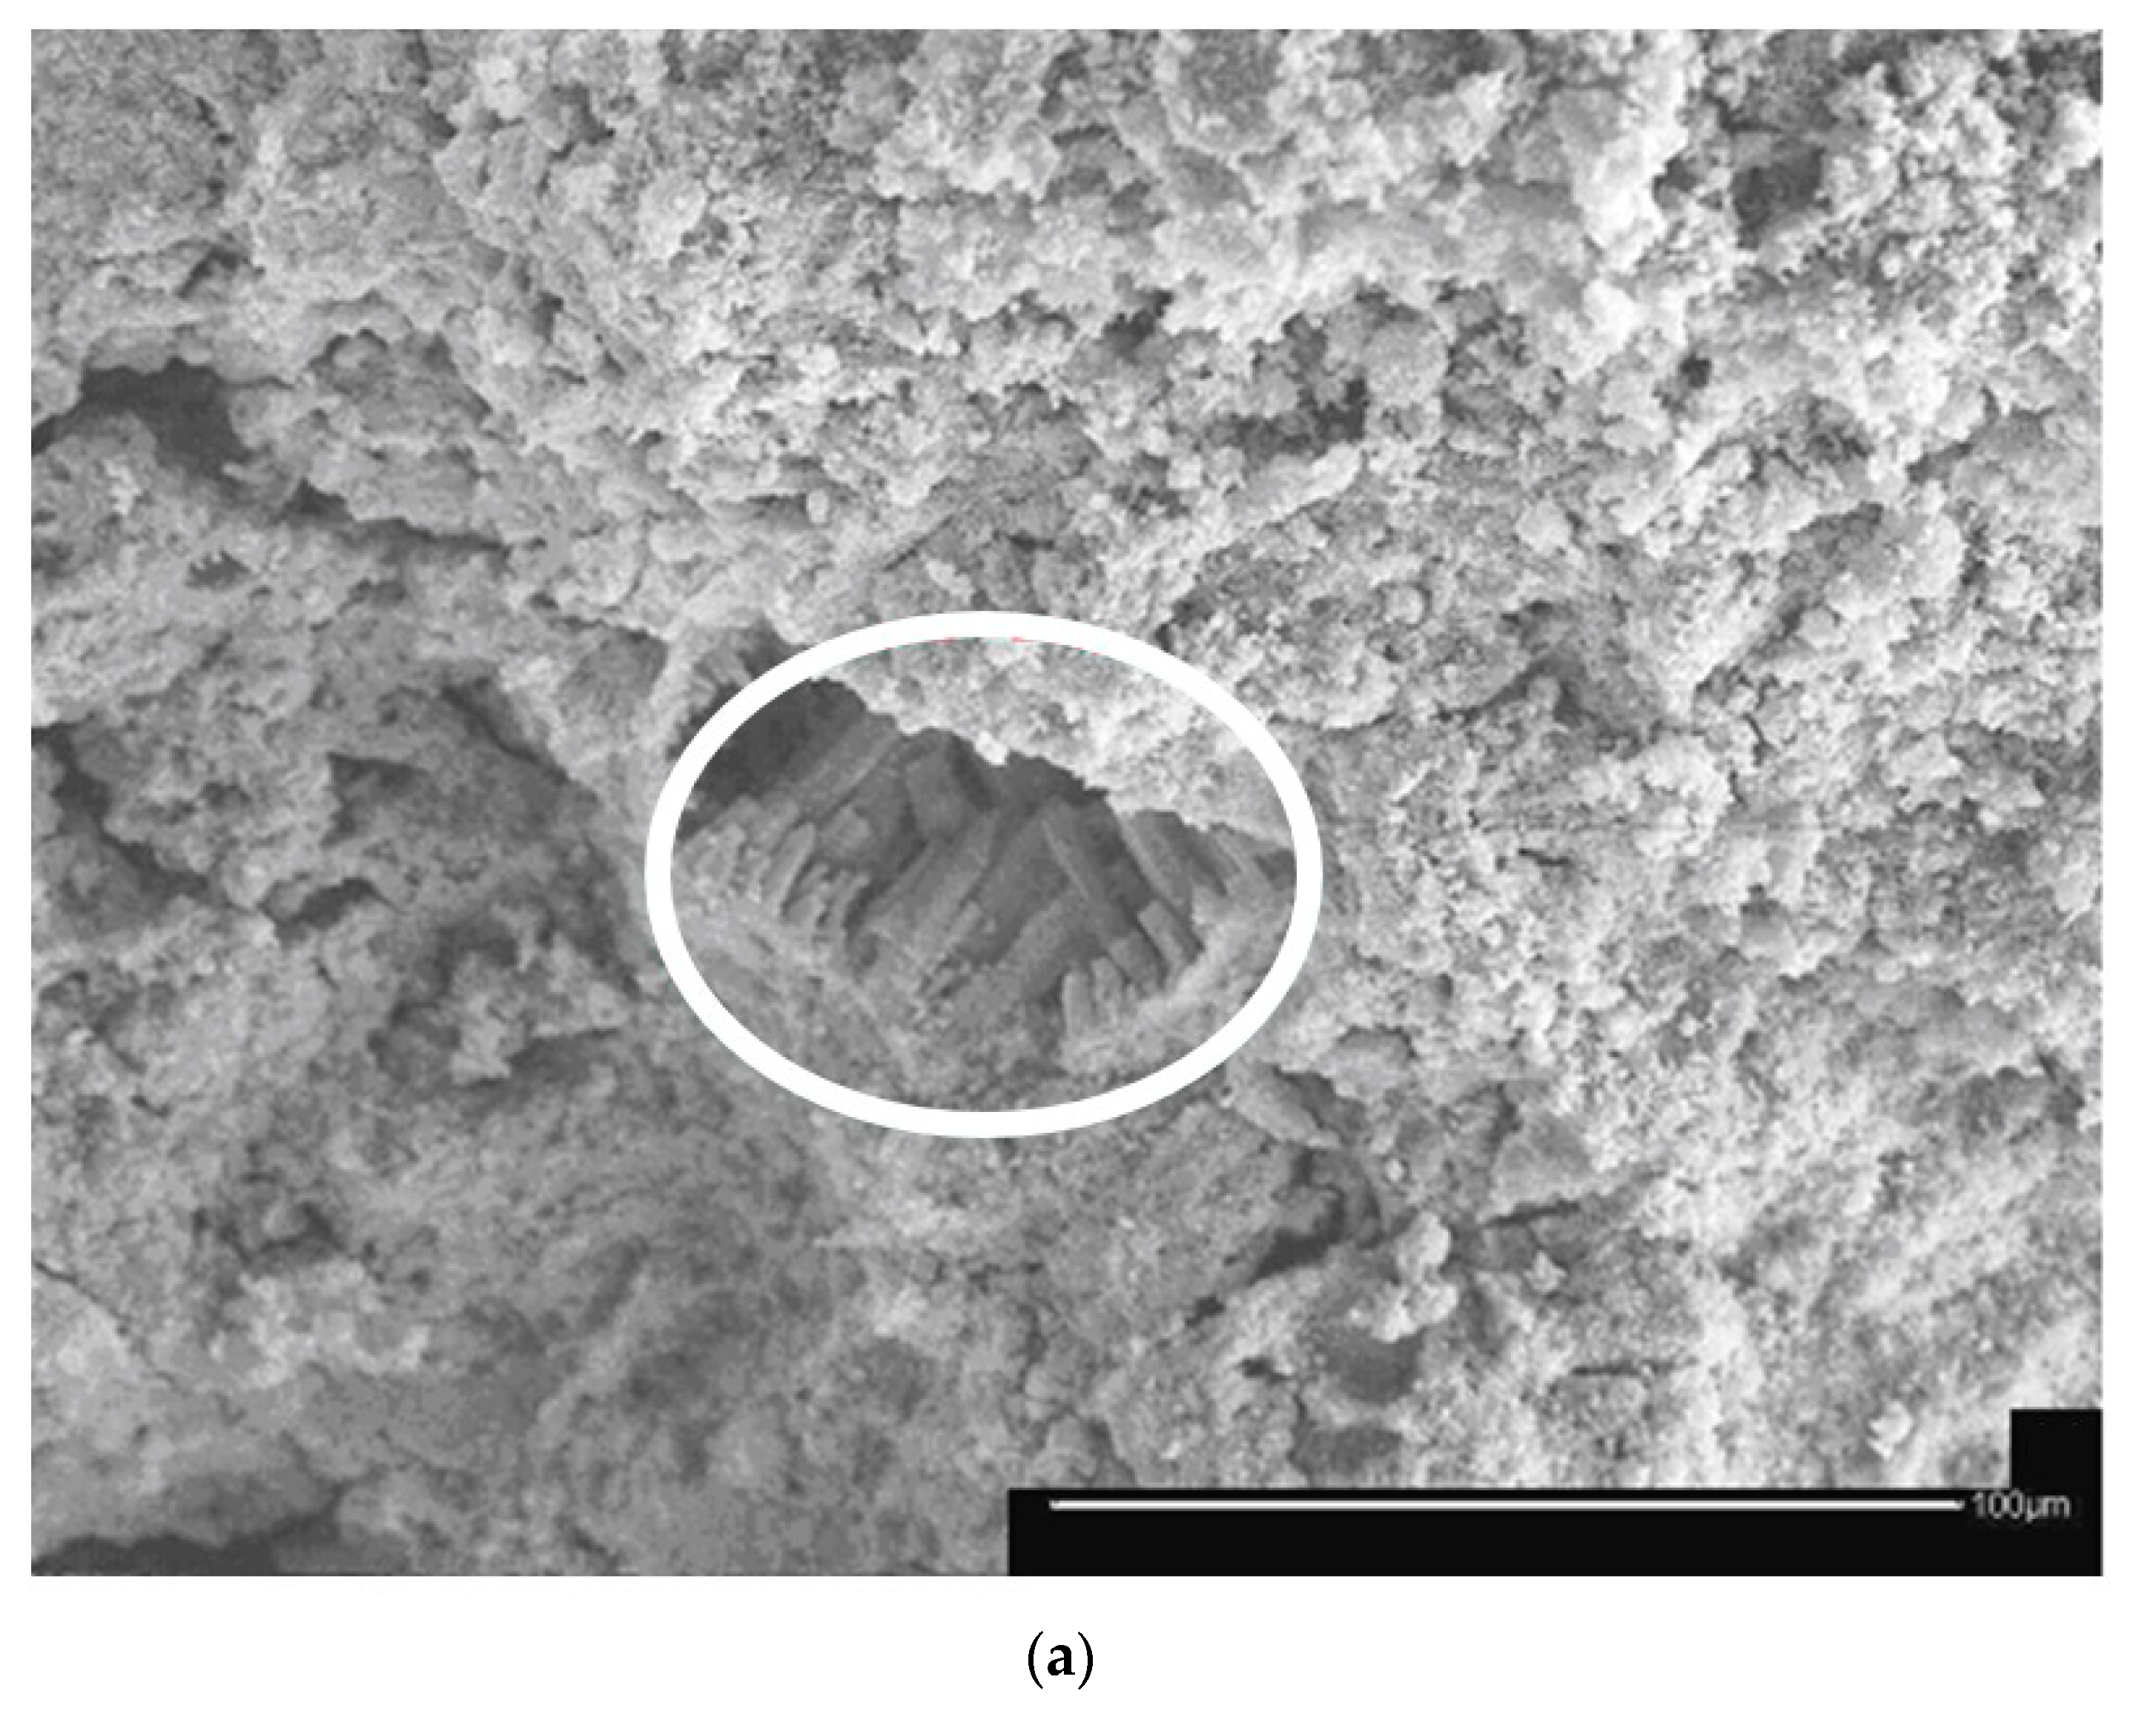
Figure 1 shows a scanning electron microscope (SEM) image of the surface of a fractured as-received bauxite (2) sample. The highlighted area was analyzed by energy dispersive X-ray spectroscopy (EDS) and demonstrated that it contained a large amount of aluminum, as well as some iron. This would indicate that these crystals are gibbsite.
2.2. Physical Characteristics
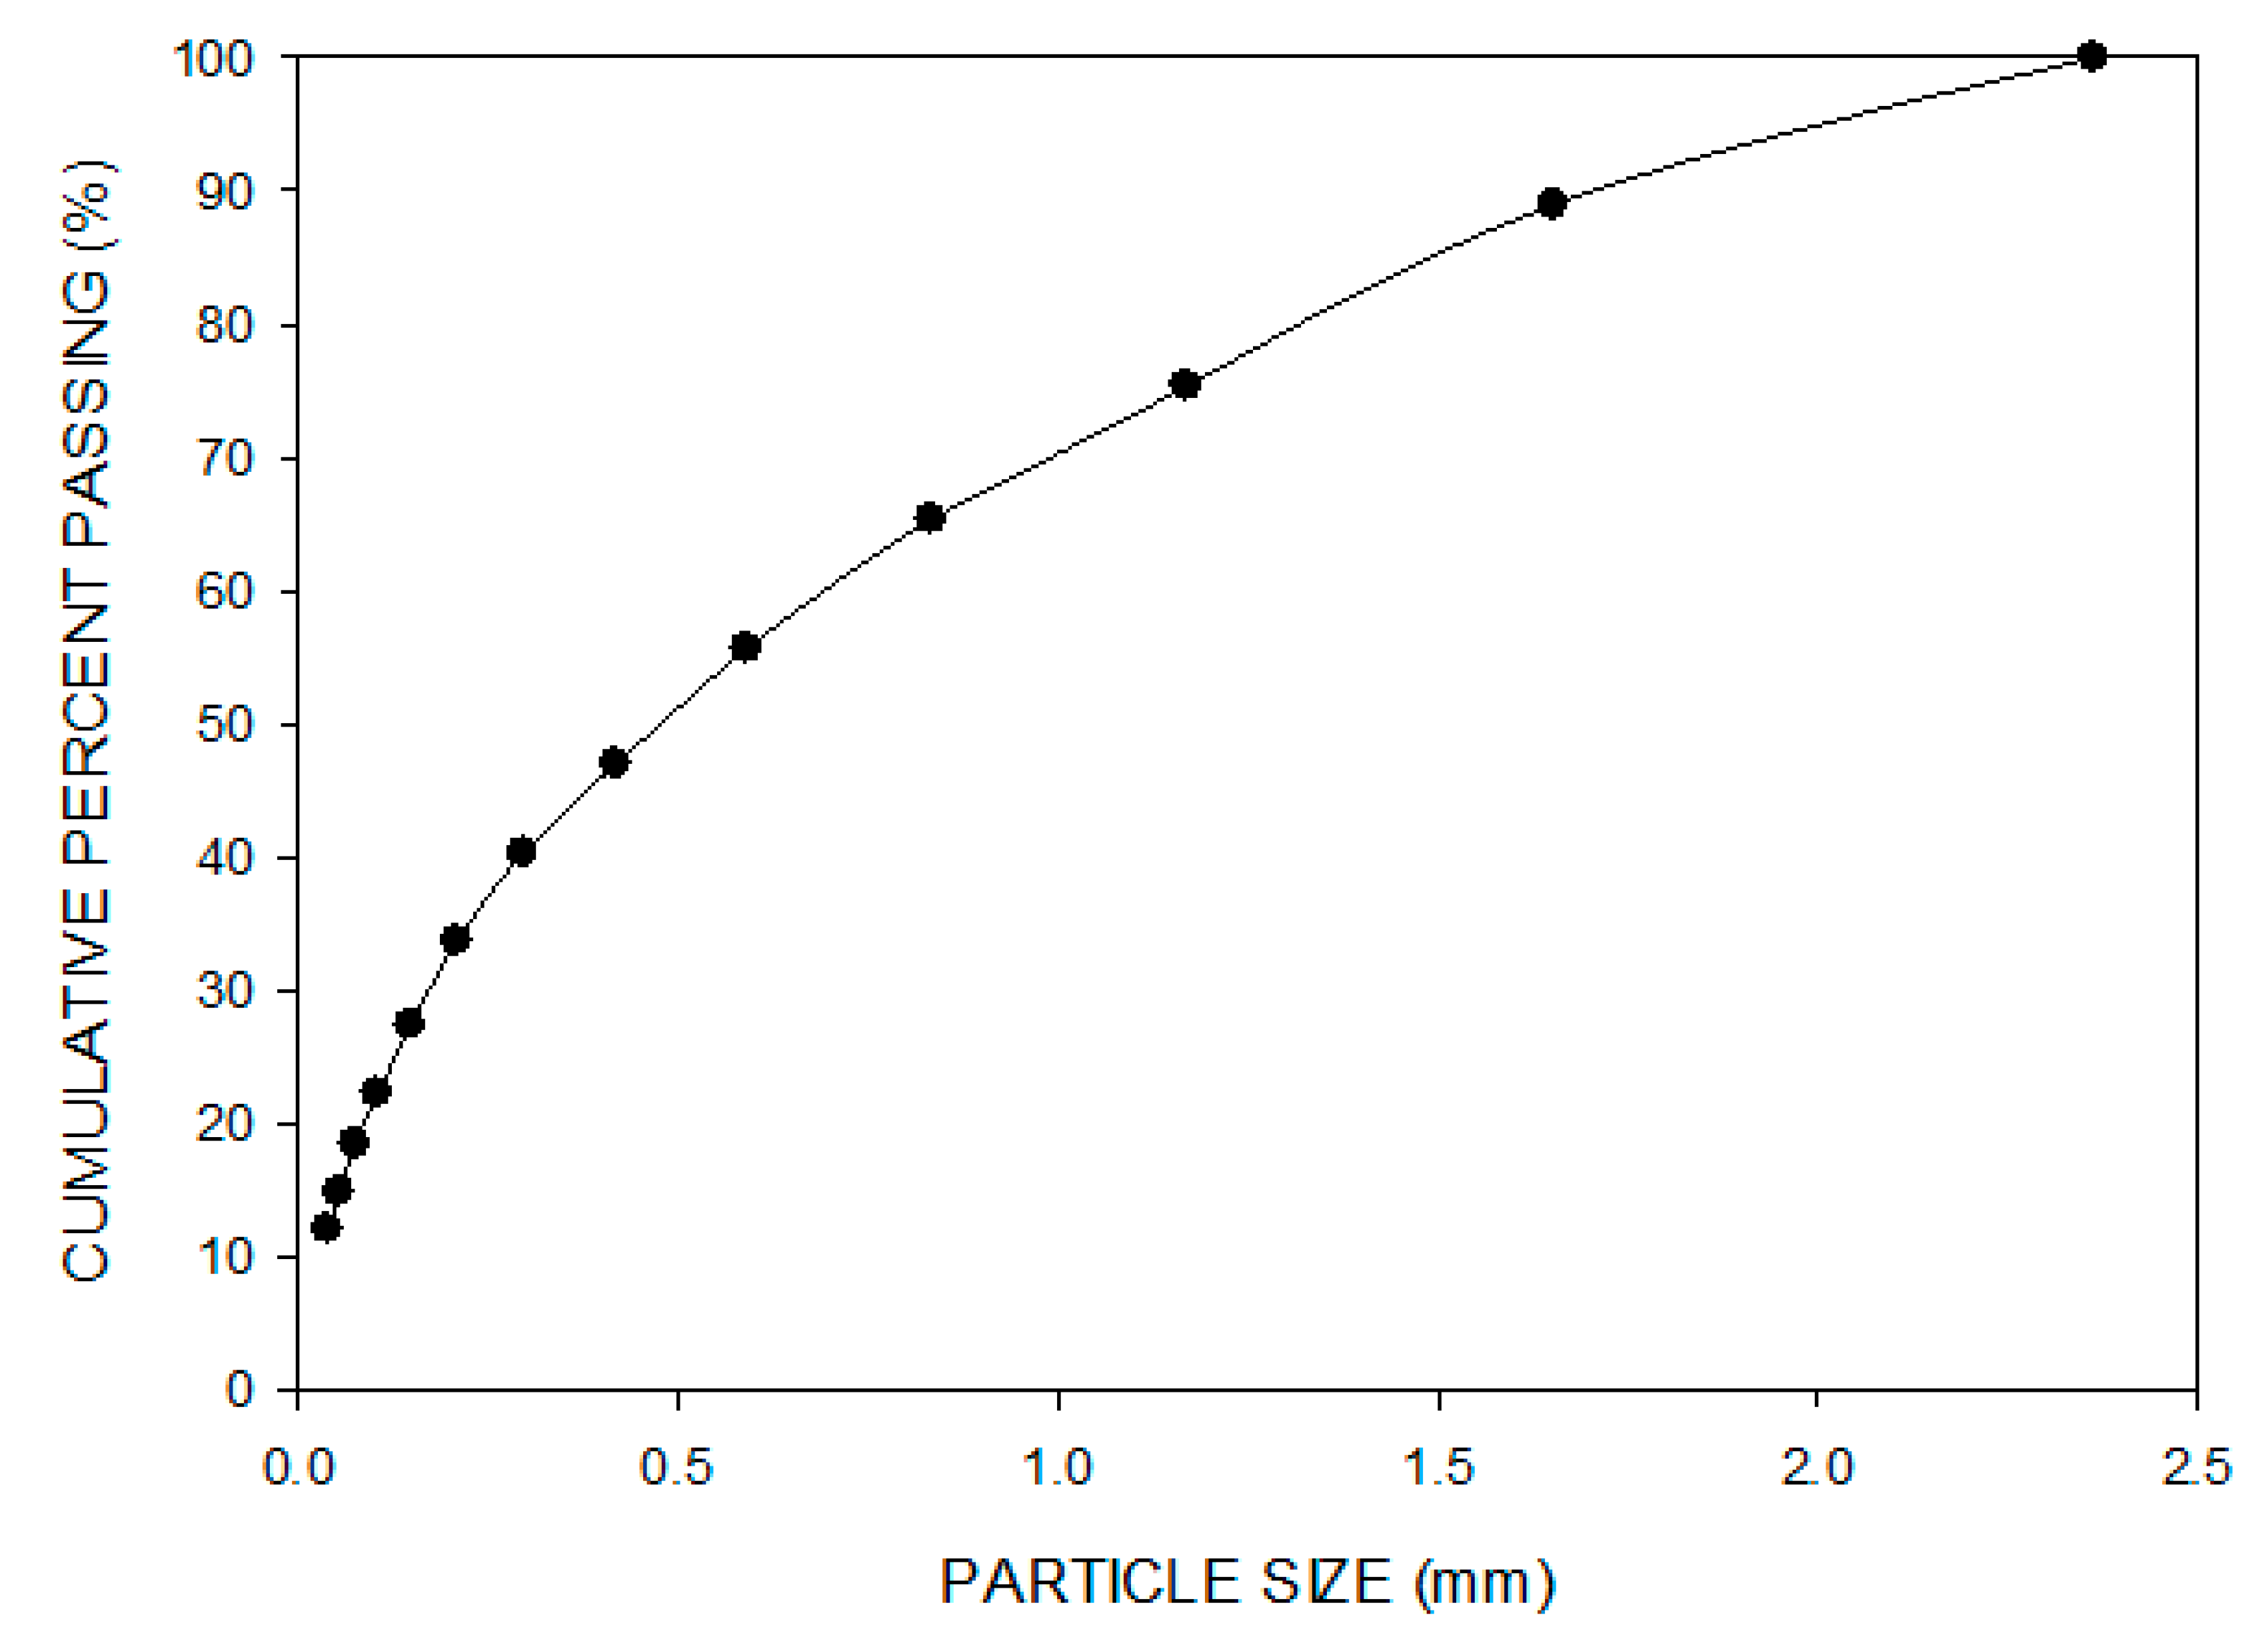
Since the chemical compositions and the mineralogies of the ores were similar, then their utilization for the various aspects of the experimental work was mainly determined by their physical characteristics. Bauxite (1) was composed of relatively fine irregular particles with a wide particle size distribution and was used in the TGA, permittivity and heating behavior studies. The particle size distribution of this bauxite was analyzed by dry sieving using Tyler screens in a vibrating sieve shaker, and the results are shown in Figure 2. The particle size was below 2.362 mm, and the sample mass in each size fraction was relatively uniform. The pisolitic bauxite ore (2) was employed for the compressive strength index studies, as it was approximately spherical. The particle size range of −6.680 + 4.699 mm was utilized in the tests, and this size range was obtained by dry sieving. The bauxite (3) sample was relatively coarse and was used to investigate the effect of sample size on the compressive strength. It was crushed and sized into three coarse size ranges of −4.5 + 3.5 cm, −3.5 + 3.0 cm and −3.0 + 2.5 cm.
2.3. Thermogravimetric Analysis (TGA)
Thermogravimetric analysis (TGA) was employed to study the dewatering of bauxite ore (1). The particle size of the samples was reduced to less than 0.038 mm by pulverizing. Samples of 10 g were heated to 1000 °C in air at 25 °C intervals at a heating rate of 0.02 °C/min. At each temperature, the samples were held for 24 h in order to ensure that equilibrium was achieved. Then, the samples were weighed using an electronic balance (Model SC 4020). The results were plotted as mass loss percentage versus time, and also, derivative thermogravimetric analysis (DTGA) curves were generated.
2.4. Real and Imaginary Permittivities/
The real and the imaginary permittivities of bauxite ore (1) were determined at different temperatures and frequencies using the cavity perturbation method. An iron-rich fraction (1-Fe) of bauxite ore (1) was separately measured. This ore (1-Fe) contained 27.6% Fe, and the LOI was 20.6%. The cavity perturbation technique has been described previously in the literature [40,41], and only a summary of the important features is given here. The measurement is based on the determination of the quality factor Q and also the resonant frequency in a high electric field cavity, both with and without the sample. For a sample with a small mass, the shifts of the Q factor and the resonant frequency are related to the complex susceptibility (χ) of the sample, which is also a function of the complex permittivities (χ = ε − 1). Using these complex permittivities, both the real and the imaginary permittivities were calculated. By using the multimode (n = 6) cavity, the real and the imaginary permittivities of the sample can be measured at the various frequencies. In addition, the sample temperature could be varied from room temperature up to 1000 °C.
For the measurements, the samples in powdered form were first compressed in a tungsten carbide lined die in a uniaxial press to produce briquettes. Subsequently, the sample briquette was placed in a high-purity amorphous silica tube sample holder, which was cleaned, dried and heated to 500 °C before each test. The sample in the holder at room temperature was inserted into the thick-walled, well-cooled multimode cavity. Typically, about two seconds was required for the measurements at a given frequency. Measurements could be performed at 912 MHz, 1499 MHz, 1977 MHz, 2466 MHz and 2986 MHz. The resonance frequency and the loaded quality factor Q of the cavity with the sample in the holder were recorded by a Hewlett-Packard 8753 network analyzer, and data analysis was performed offline. This included subtracting the resonant frequency and the quality factor of the sample in the cavity from the values for the sample holder alone in the cavity.
For the measurements at temperatures higher than 24 °C, the holder with sample was heated in a conventional furnace in an air atmosphere at the desired temperature for at least 5 min. The heating rate of bauxite ore (1) was set as 2.9 °C/min, and the studied temperatures ranged from 25 °C to 977 °C. For the iron-rich fraction (1-Fe), the heating rate was 4.0 °C/min, and the temperature varied from 24 °C to 397 °C. The hot sample in the holder was then rapidly removed from the furnace and returned to the cavity for the next series of measurements. As a result, both the real and the imaginary permittivitites of bauxite (1) and the iron-rich fraction (1-Fe) were determined at different temperatures and frequencies, and also, the loss tangents could be calculated using Equation (7).
2.5. Microwave Heating Behavior Studies
In the microwave heating behavior studies, the sample temperature was measured by inserting a type-K thermocouple into the powdered sample along the vertical centerline and at the bottom of the sample. This position corresponded with the location where the maximum temperature was attained. A thermocouple wire diameter of 0.5 mm was employed because this wire size has both a relatively fast response time and a long lifetime. In order to eliminate any interference from the microwaves, the power was turned off during the measurement.
Sintering can affect the compressive strength of the particles, particularly in microwave processing where thermal runaway can occur. Therefore, the microwave heating behavior of bauxite ore (1) was studied using a single replicate 24 factorial experiment. The four factors were heating time, microwave power, sample mass and sample bulk density, and the factor levels used in the design are shown in Table 4. The three- and four-factor interactions were utilized as an estimate of error. The design experiments were performed randomly. The test results were used to estimate the factor effects and to provide an initial linear model of the sample temperature as a function of the significant factors and/or the two-factor interactions. From the obtained test conditions, a steep ascent method was employed to reach the desired operating temperature.
2.6. Conventional and Microwave Heating Systems
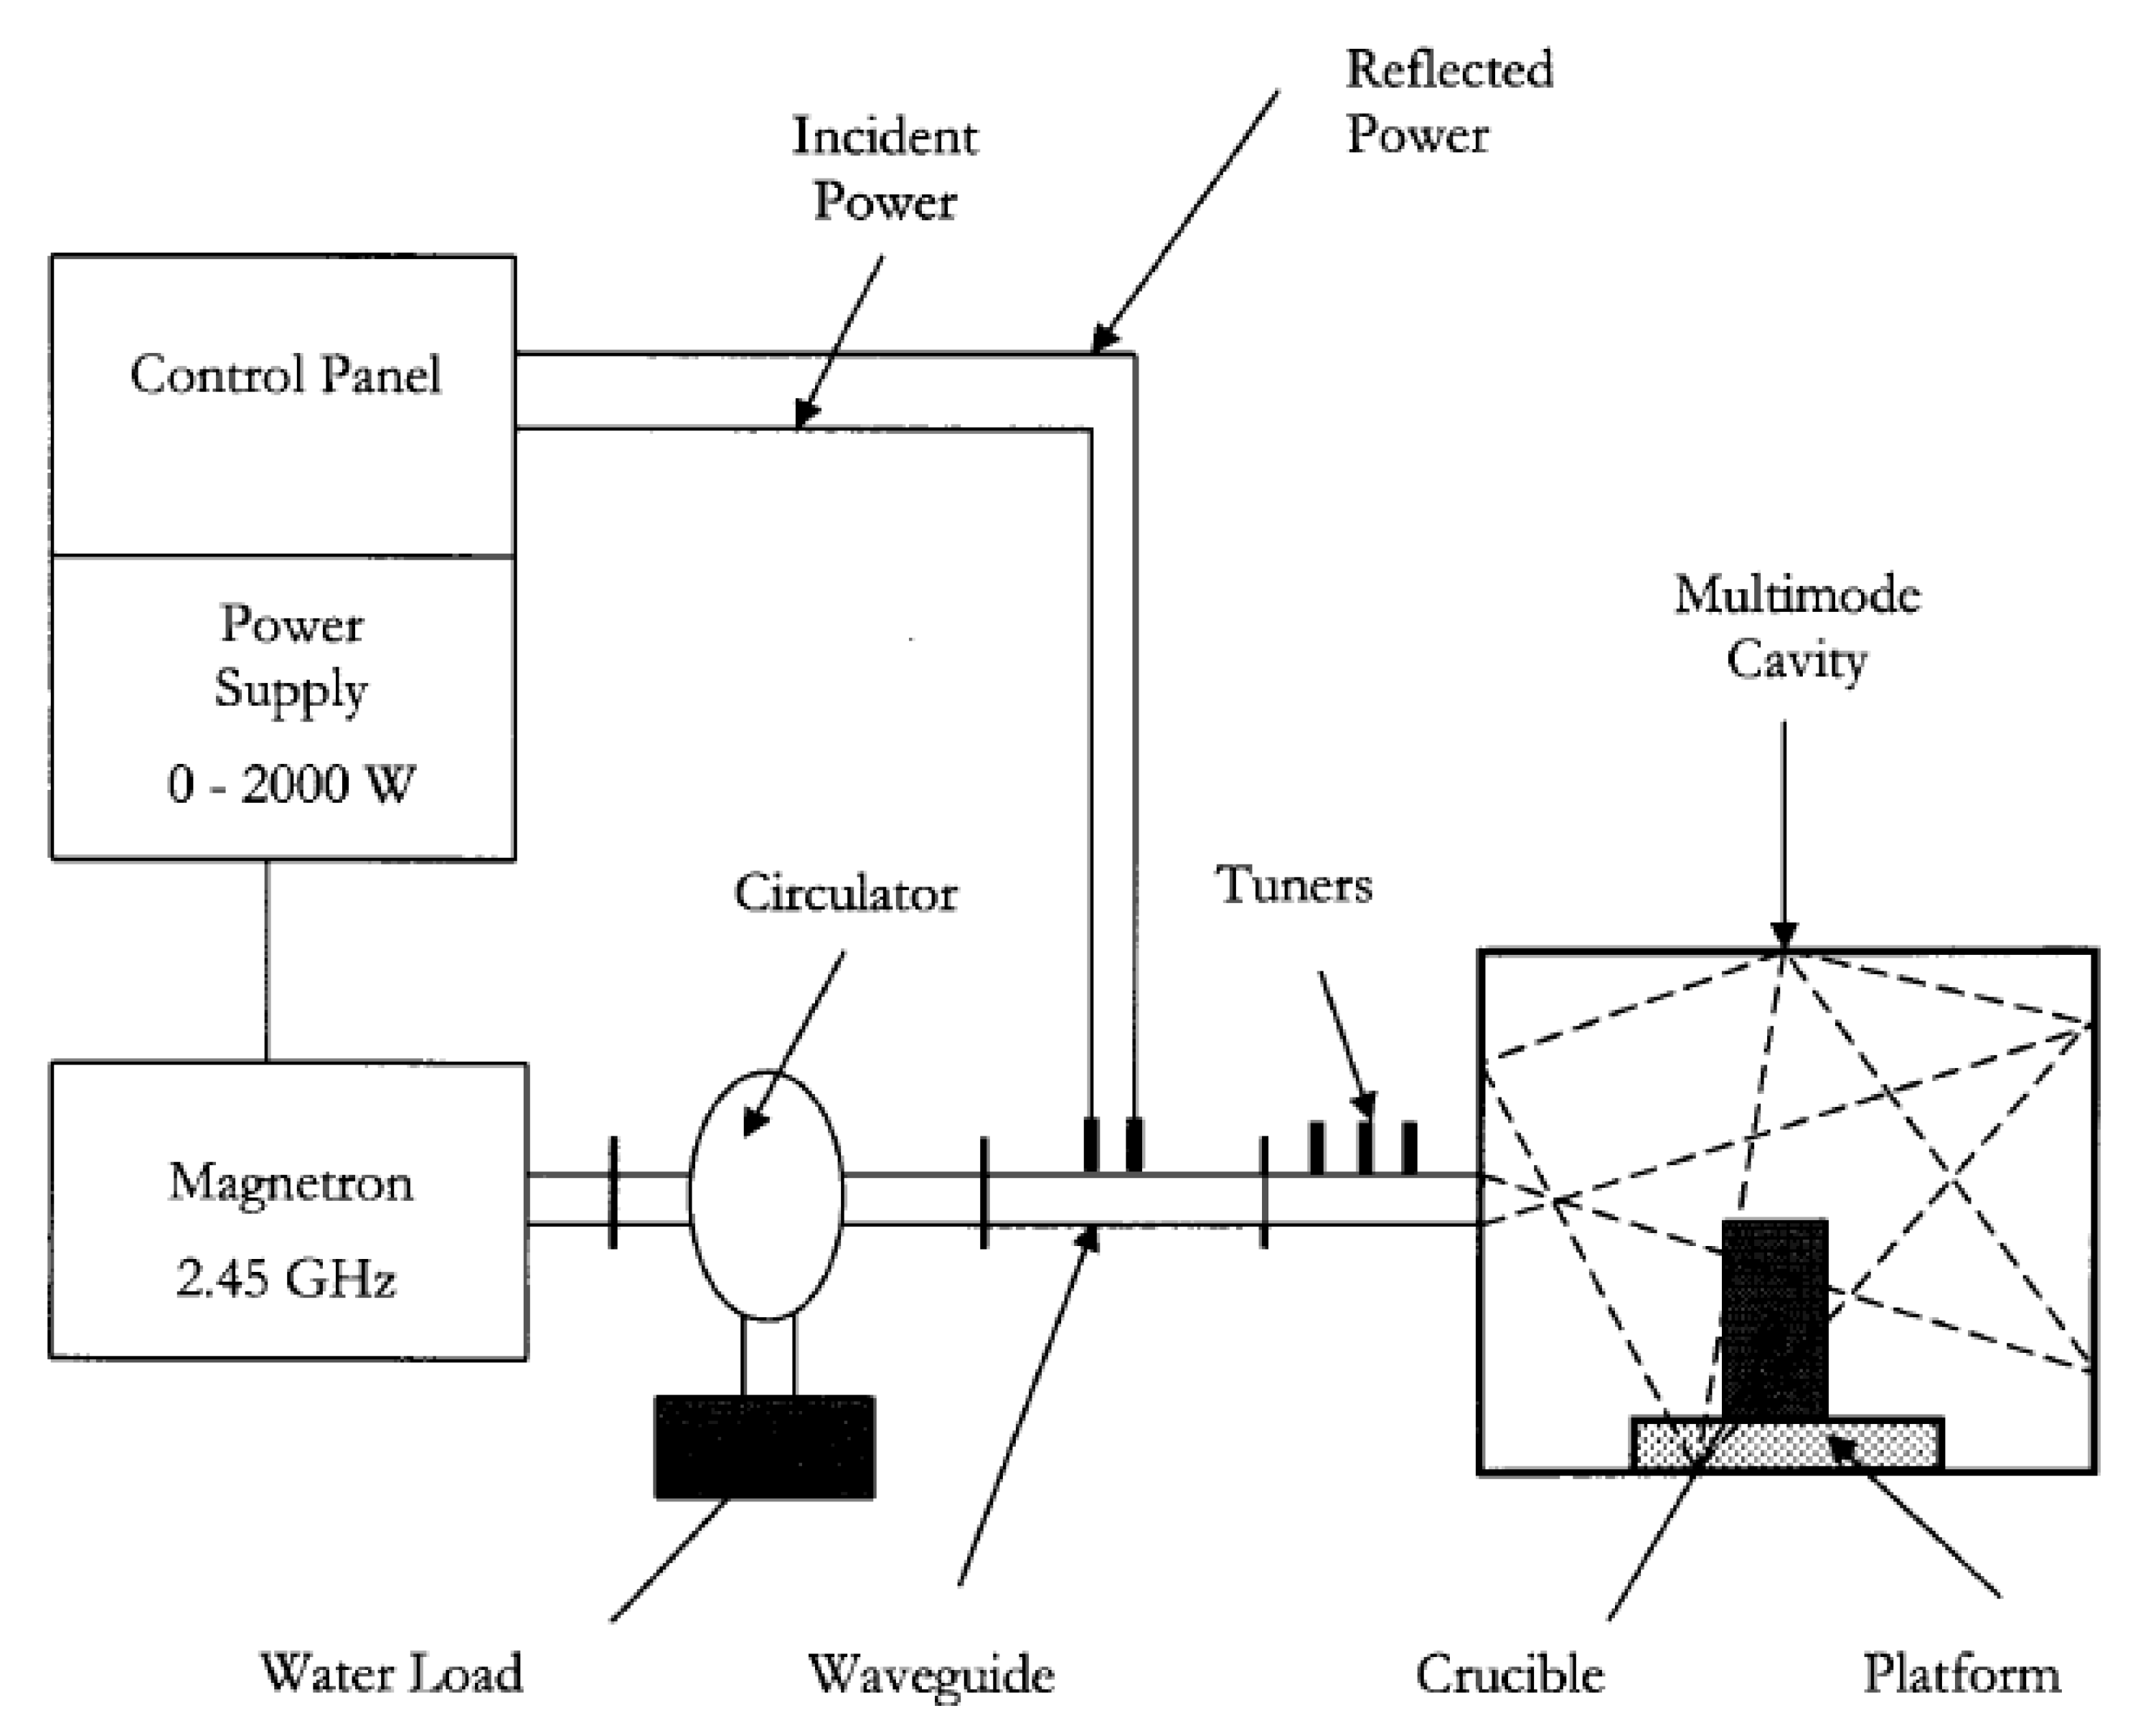
Prior to the compressive strength studies, the bauxite ores (2 or 3) were preheated either in a conventional laboratory resistance furnace or in a microwave cavity. The maximum power of the conventional furnace was 1200 W (120 V, 10 A). Figure 2 shows a schematic diagram of the microwave system employed in this work. The major features were a power supply, a control panel, a 2.45 GHz air-cooled magnetron, a rectangular aluminum waveguide, a circulator and a multimode cavity containing the sample to be processed. The Model P2000L power supply was manufactured by Conversion Technology Corporation (CTC, Southlake, TX, USA). The incident power could be varied continuously from 0 to 2000 W, and the microwaves traveled along the rectangular waveguide to the cavity. The cavity dimensions were 26 cm in height, 40 cm in width and 40 cm in length. The samples to be processed were placed in a cylindrical quartz crucible on a platform, at the center of the base. The cylindrical quartz crucible had the following dimensions: 37 mm in height, 28 mm in diameter and 1.5 mm in thickness. The microwave transparent platform was made from 80% Al2O3 and 20% SiO2. As illustrated by the dashed lines in the cavity, the microwaves can be absorbed, reflected or transmitted by the sample but only reflected by the walls. Any microwaves not absorbed by the sample will eventually return back down the waveguide and will be absorbed by the water load. Additionally, both the incident and the reflected microwave power were monitored using two detectors installed in the waveguide. The three stub tuners in the waveguide were utilized to manually adjust the incident microwave power in order to minimize the reflected power by matching the incident power with the load.
2.7. Conventional and Microwave Heating of Spherical Pisoids
For these tests, bauxite (2) was utilized due to its roughly spherical shape, and the particle size range was relatively small at −6.680 mm +4.699 mm. Ten-gram samples were heated for 20 min at 200 °C, 500 °C, 700 °C and 900 °C. Additionally, a fifty-gram sample was heated for 2 min at 900 °C. During the heating process, the sample temperature was measured by inserting the tip of the Type-K thermocouple into the middle of the sample. The temperatures were recorded as a function of heating time. After heating, the mass loss was calculated, and this was related to the moisture content. For the microwave heating tests, fifty-gram samples were microwaved for 2 min at 825 W, 1000 W and 1200 W. Again, the mass loss was determined.
2.8. Compressive Strengths of Spherical Pisoids and Single Particle Studies
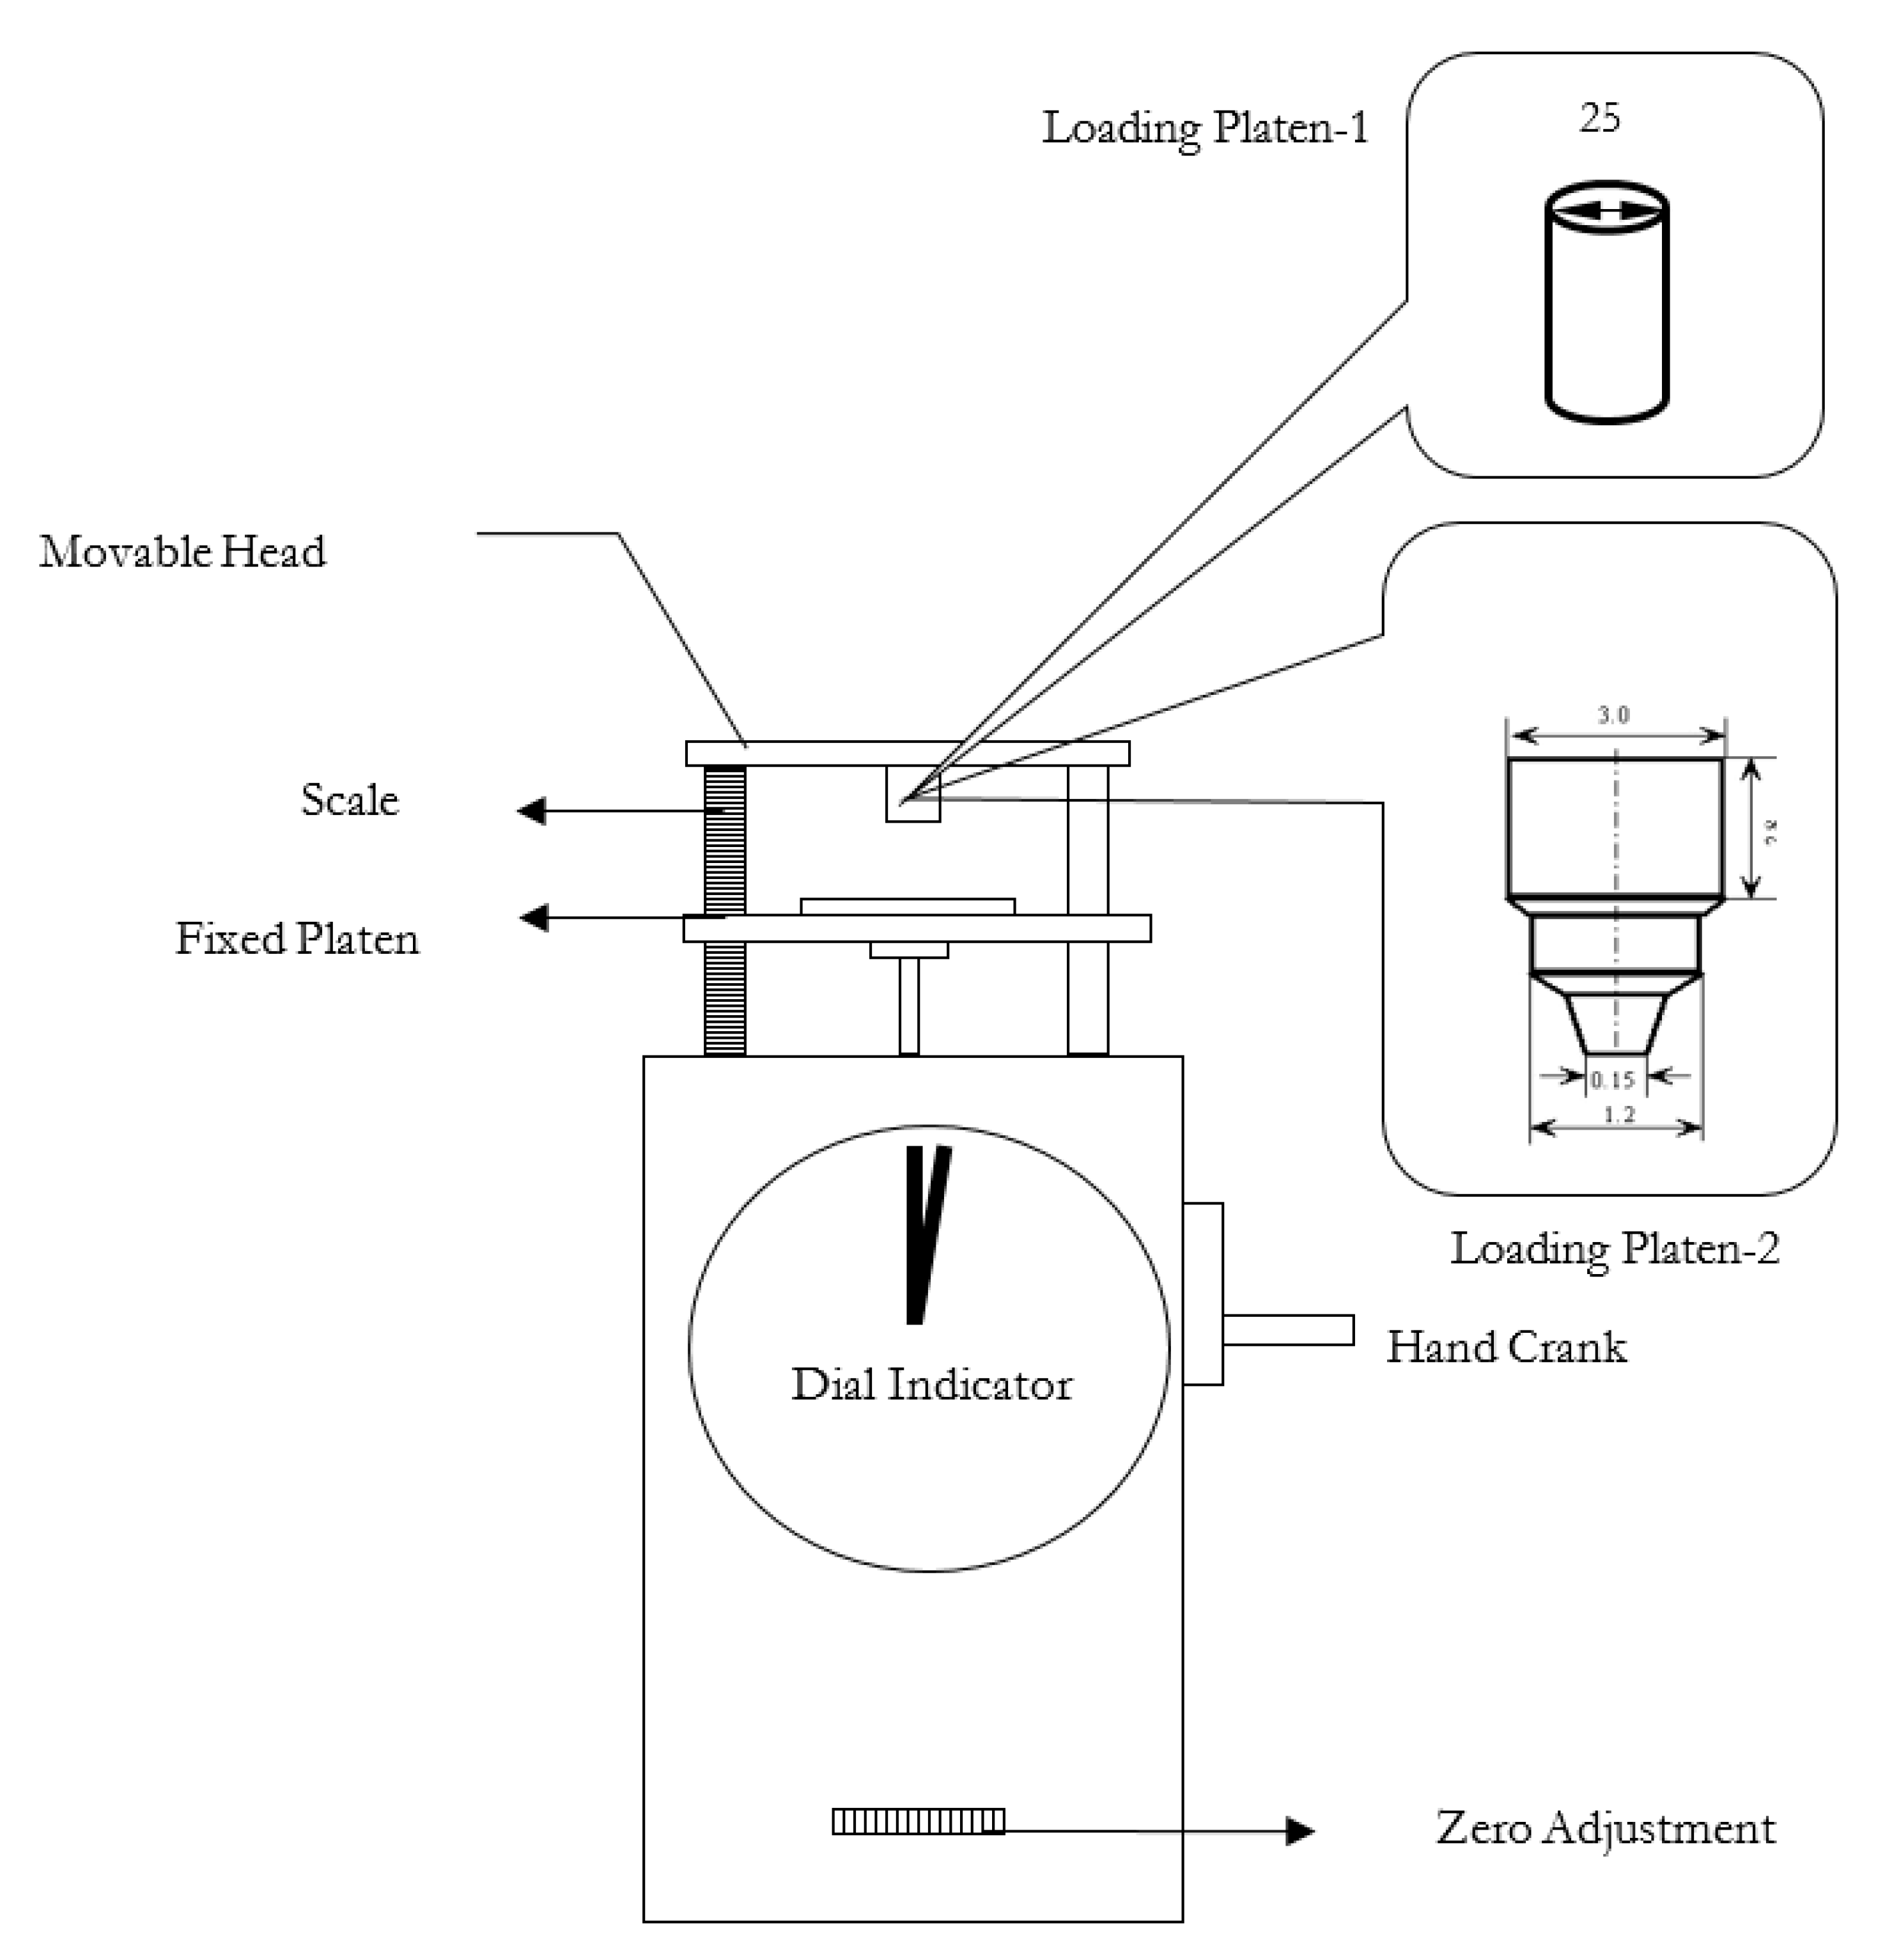
The compressive strengths of the bauxite ore (2) pisoids after both conventional and microwave heating were measured. Additionally, for comparison purposes, the strength index of the as-received bauxite ore was determined. The compressive strengths were measured using a Chatillon compression pellet tester, as shown in Figure 3. The tester consisted of a movable head, a loading platen, a fixed platen and a dial indicator to show the load at failure. The sample was placed between the loading and the fixed platen and was compressed uniaxially. The cylindrical loading platen had a diameter of 25 mm, and the sample height could be measured using a scale. The zero adjustment was utilized to set the load to zero before the sample was compressed.
For both conventional and microwave processing, eighty bauxite particles within the particle size range of −6.68 mm + 4.70 mm were selected randomly for each strength index test. Since the particles were roughly spherical, then the contact area between the sample and the platens was a small constant value, and therefore, the compression could be considered as a point load. For a sample with a regular geometry, the failure load is only related to the square of the sample height [42]. Consequently, the ratio of the failure load to the square of the sample height was utilized to evaluate the strength of the bauxite particles using the following equation:
where P is the failure load (kN), h is the sample height (m), and I is the strength index (kN/m2).
There is considerable controversy regarding the effect of particle size on the microwave heating behaviors of materials. Consequently, compressive strength index measurements were carried out on individual bauxite particles after conventional and microwave treatment as a function of processing time, and hence, moisture content. The conventional and microwave experiments were performed for various times at 900 °C and 1200 W, respectively. For these studies, relatively large individual particles of bauxite (3) were randomly selected from within the three size ranges of −4.5 cm + 3.5 cm, −3.5 cm + 3.0 cm and −3.0 cm + 2.5 cm. For each size range, ten microwave experiments were performed over a range of times and also for ten conventional microwave times. For the strength indices, since the bauxite (3) particles were irregular, then loading platen-2 was employed to reduce the influence of surface area on the measurements. As shown in Figure 4, loading platen-2 had a very small contact area with a diameter of 1.5 mm. In these tests, each sample was placed on the fixed platen in a manner such that the sample was most stable. The sample heights between the loading platen and the fixed platen were set at 3.4 cm, 3.5 cm and 3.7 cm for samples of −3.0 + 2.5 cm, −3.5 + 3.0 cm and −4.5 + 3.5 cm, respectively. The sample failure strength was measured, and the sample strength index was calculated using Equation (8). Additionally, the sample mass was measured both before and after the experiment, and thus, the moisture loss could be determined for a particular processing time.
3. Results and Discussion
3.1. Thermogravimetric Analysis and Permittivity Studies
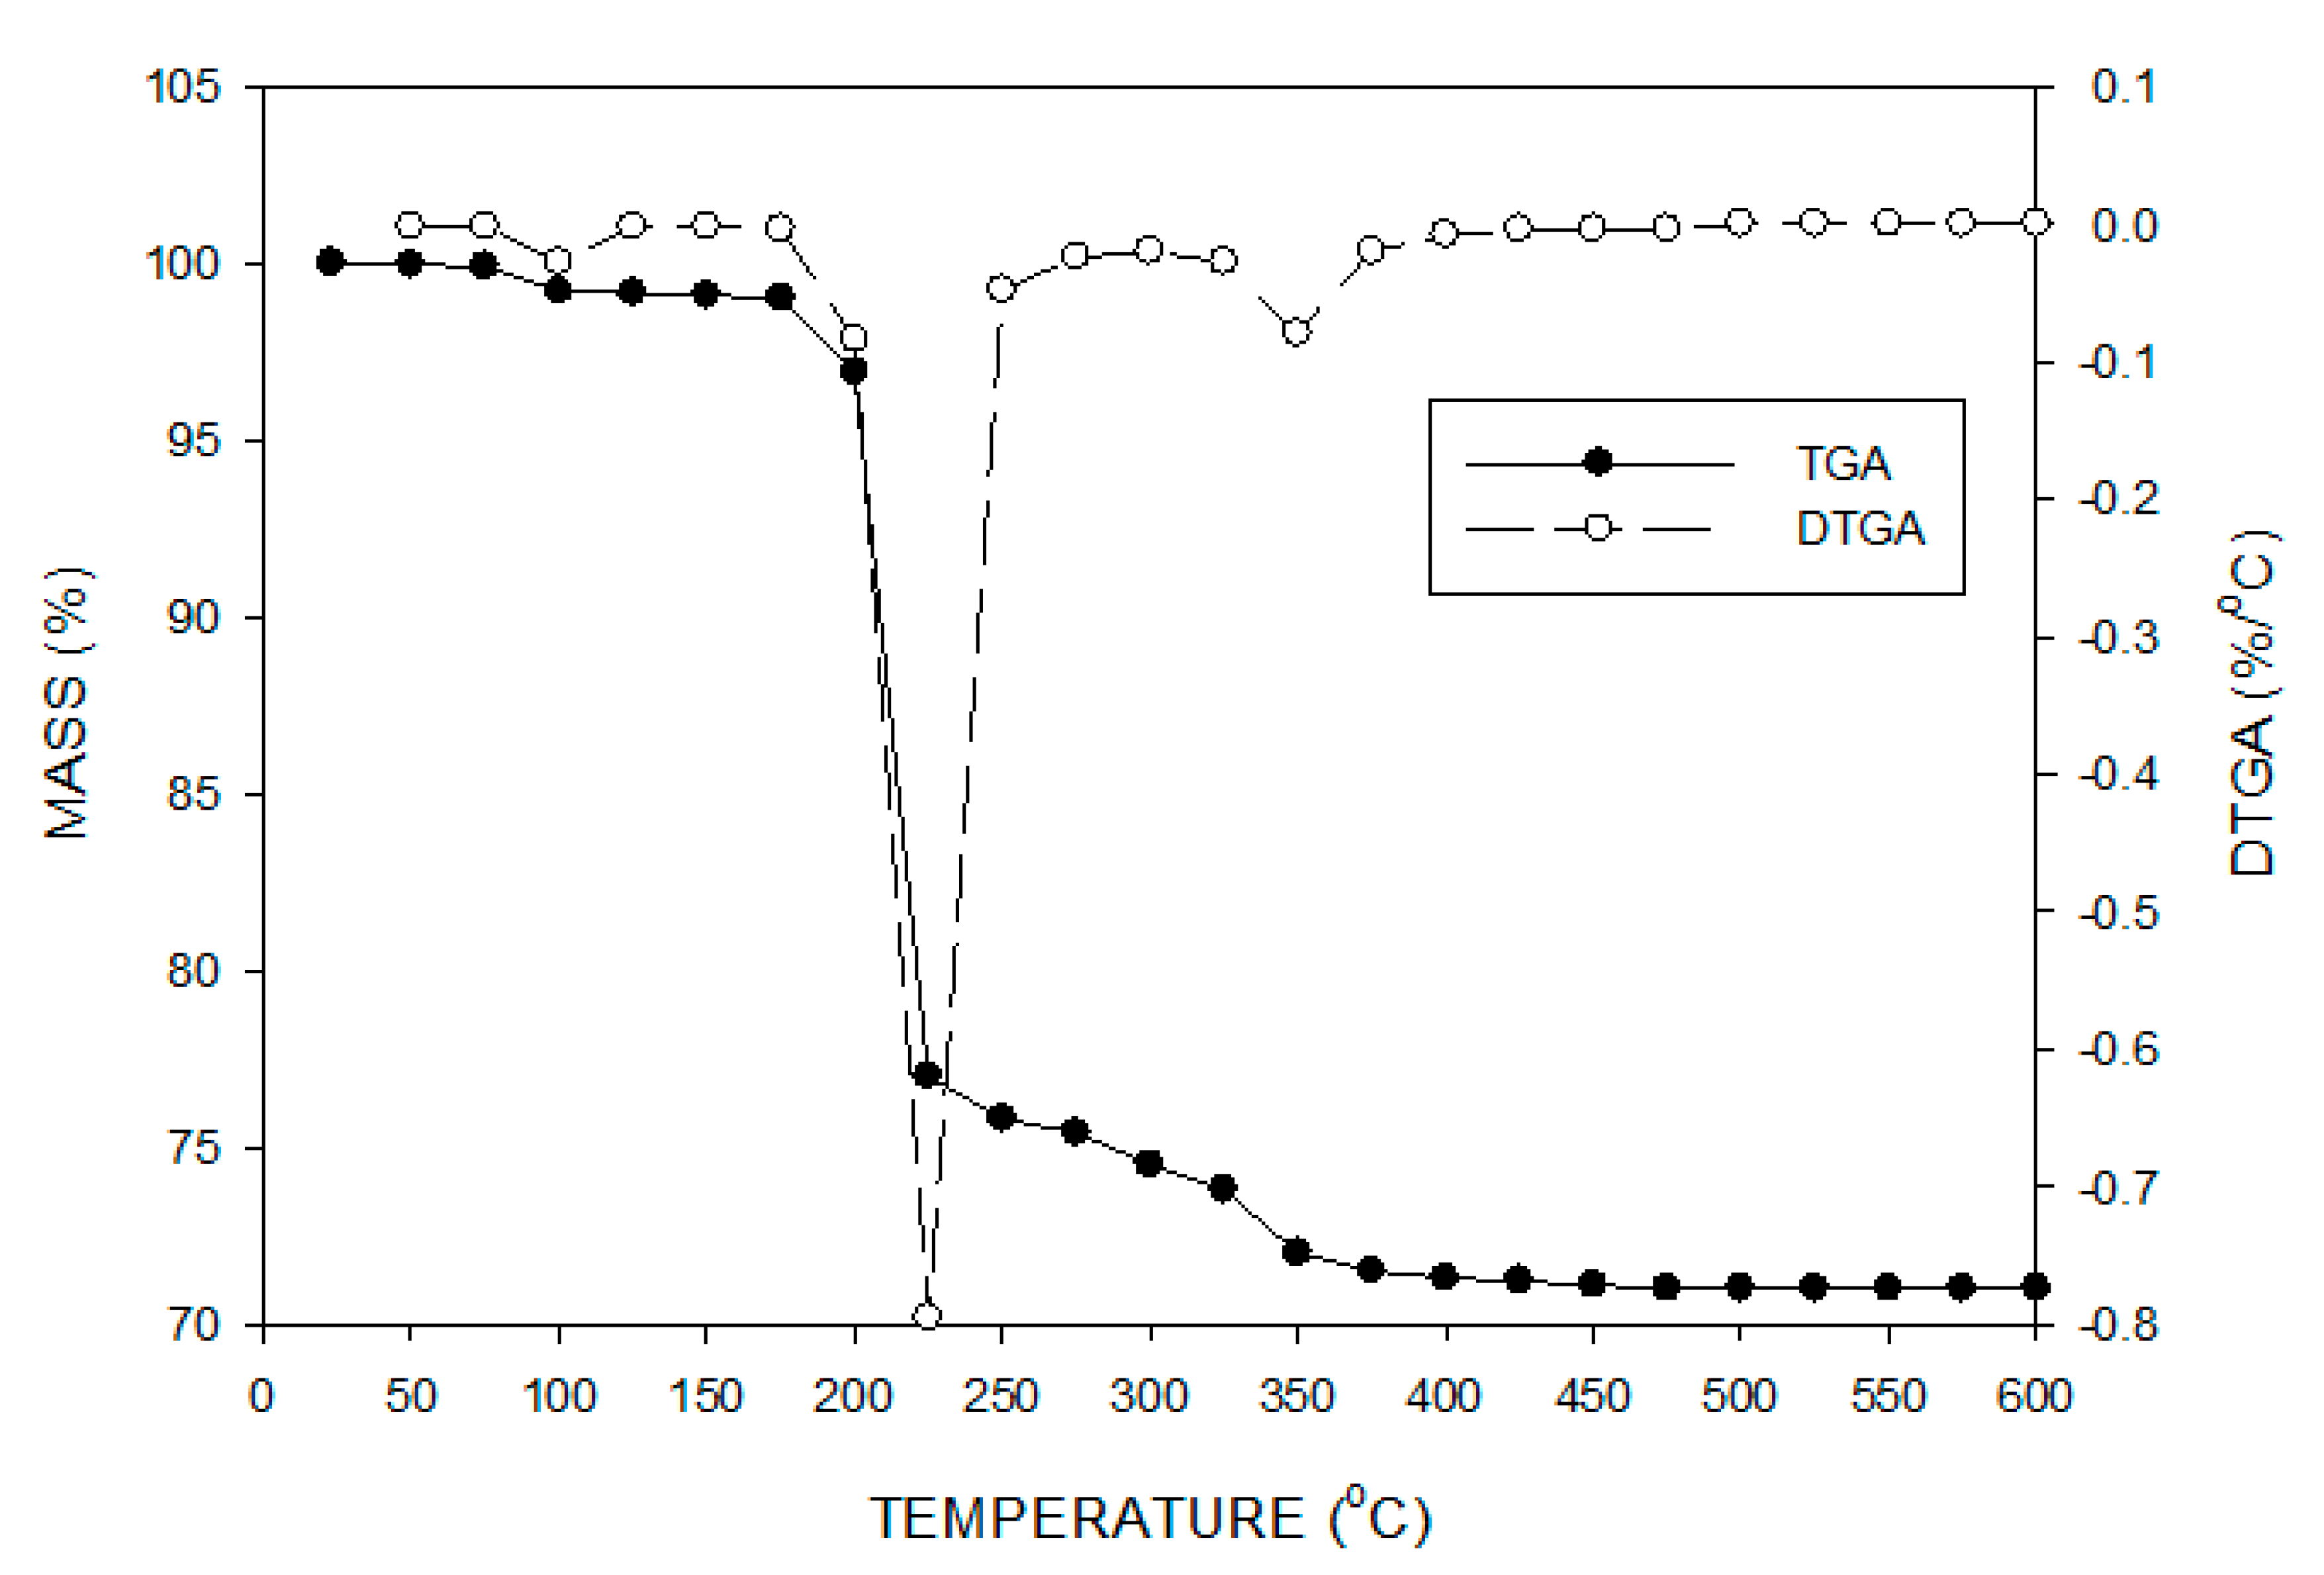
In order to define the decomposition processes for the bauxite ores, and consequently, their effects on the permitivities, thermogravimetric analysis (TGA) studies were performed. The results for bauxite ore (1) are shown in Figure 5 and include the DTGA calculations. For bauxite ore (1), from room temperature, about 1% free water was removed with the rate of removal reaching a maximum at about 100 °C. Subsequently, the mass loss remained relatively constant before increasing slowly at 175 °C, then more rapidly, and reaching a maximum rate at about 225 °C. Then, the rate decreased rapidly to about 250 °C and then more slowly. From 175 °C to 250 °C, the mass loss for the ore was about 23% as compared to the theoretical value of 18.5% for the gibbsite in the ore and 23.1% for pure gibbsite for decomposition to boehmite. These values would indicate that the gibbsite in the ore decomposed into boehmite, but also, some alumina was produced. As the temperature increased further, the rate leveled off but increased once more at about 300 °C, reached a maximum at about 350 °C and eventually began to approach a very slow rate at 400 °C. Over this temperature range, the mass loss was about 4.5%, and here, the remaining more stable boehmite was converted into alumina. The rate of mass change became zero above 475 °C. The total mass loss was 29%, which was in good agreement with the LOI of about 28%.
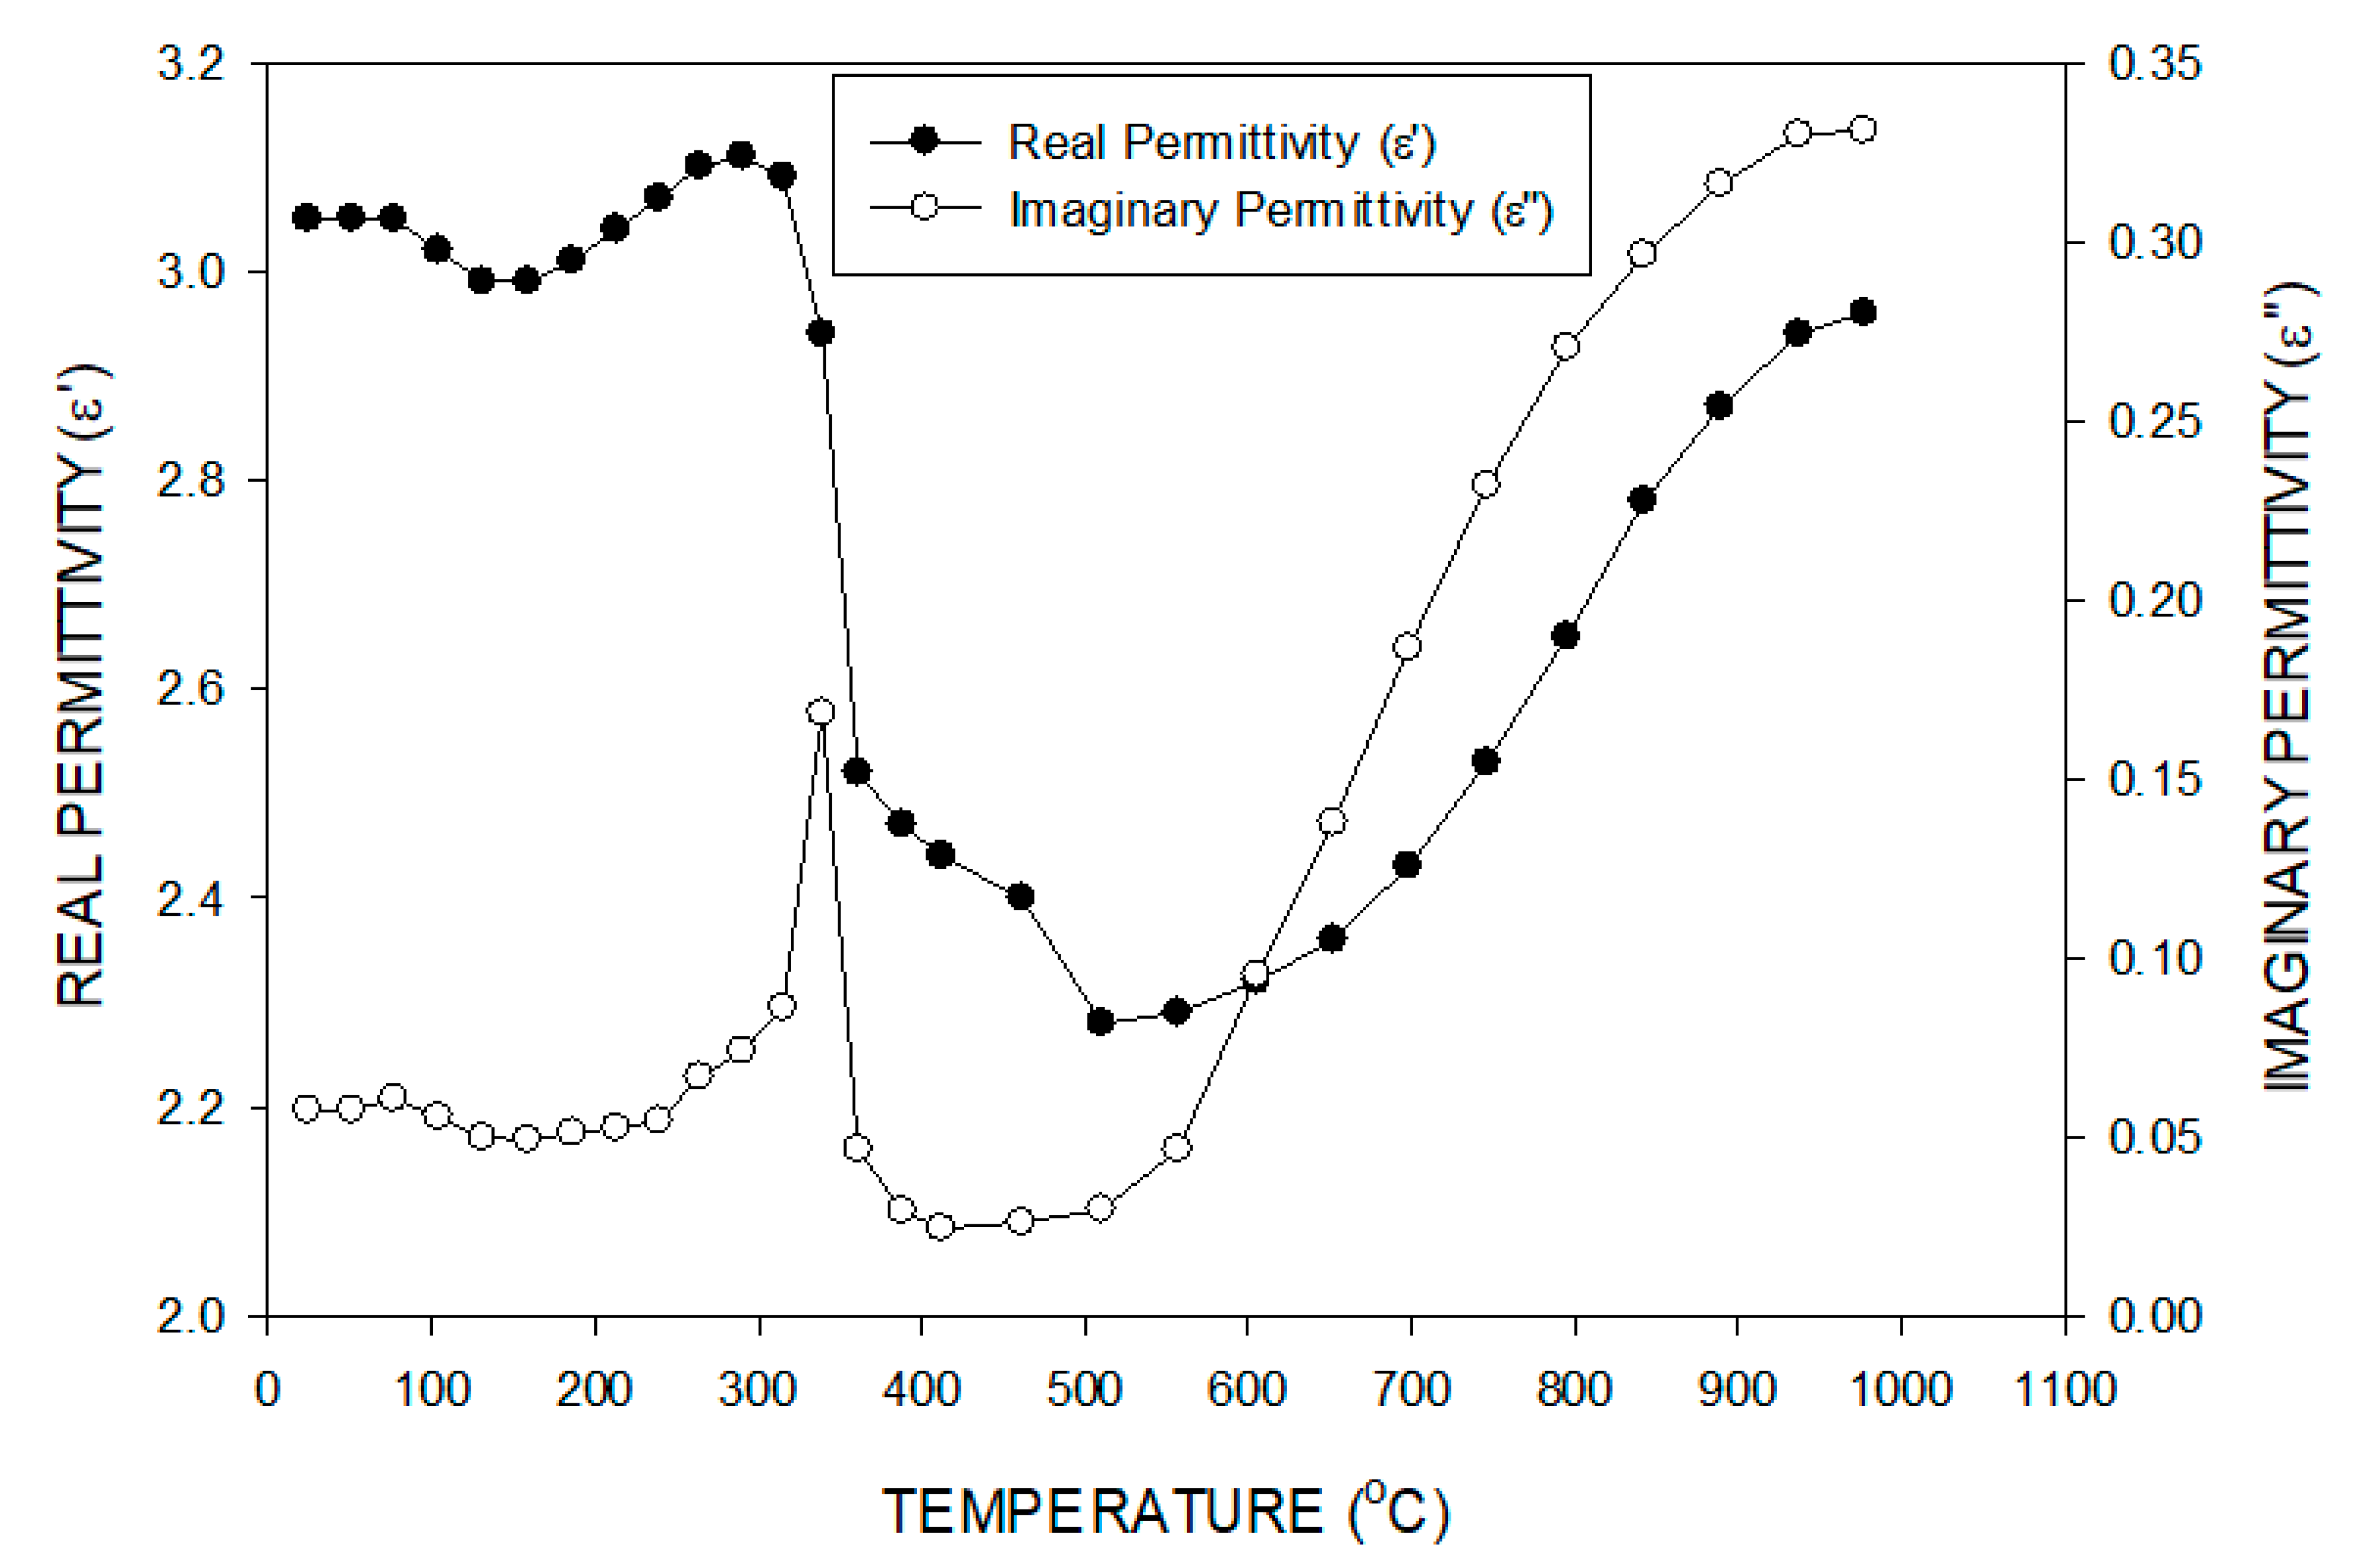
Figure 6 shows the real and imaginary permitivities of bauxite ore (1) as a function of temperature at 2460 MHz. At room temperature, the real and imaginary permitivities were 3.05 and 0.0574, respectively. In general, both the real and the imaginary permittivities exhibited similar behaviors as a function of temperature. From room temperature to about 100 °C, both permitivities remained relatively constant but then began to drop after the free water was removed. At about 150 °C, both permitivities began to increase slowly and then more quickly up to maximums at about 290 °C for the real permittivity and 330 °C for the imaginary permittivity. Here, as shown by the TGA results in Figure 5, the majority of the water had been removed, and the decomposition of gibbsite to boehmite had occurred, with very little impact on the permitivities. Consequently, the significant increases in the permitivities would be attributed to the conversion of boehmite to alumina. This dehydroxylation process involves the migration of protons, which combine with hydroxyl ions to form water vapor, and this results in an increase in the permitivities. Subsequently, both permitivities dropped precipitously, as the rates of dewatering decreased. The imaginary permittivity leveled off at about 300 °C and the real permittivity at about 500 °C. Thereafter, both the real and the imaginary permitivities increased slowly with temperature and then more rapidly. As the temperature approached 1000 °C, the rate of rise of the permitivities began to decrease. The imaginary permittivity shows much larger changes than the real permittivity during dewatering. Additionally, the effect of temperature is more significant, as it is directly related to conductivity, as given by Equation (6). The real and the imaginary permitivities after cooling down to room temperature were 2.14 and 0.0468. Compared to the initial values, this decrease reflects the loss of water from the sample, in particular the removal of hydroxyl ions, and thus, the higher permittivities of the water-containing ores. Additionally, it can be noted that the real permitivities did not change significantly over the whole temperature range, and the value at 1000 °C was lower than the room temperature value. On the other hand, the imaginary permittivities increased dramatically from room temperature up to 1000 °C.
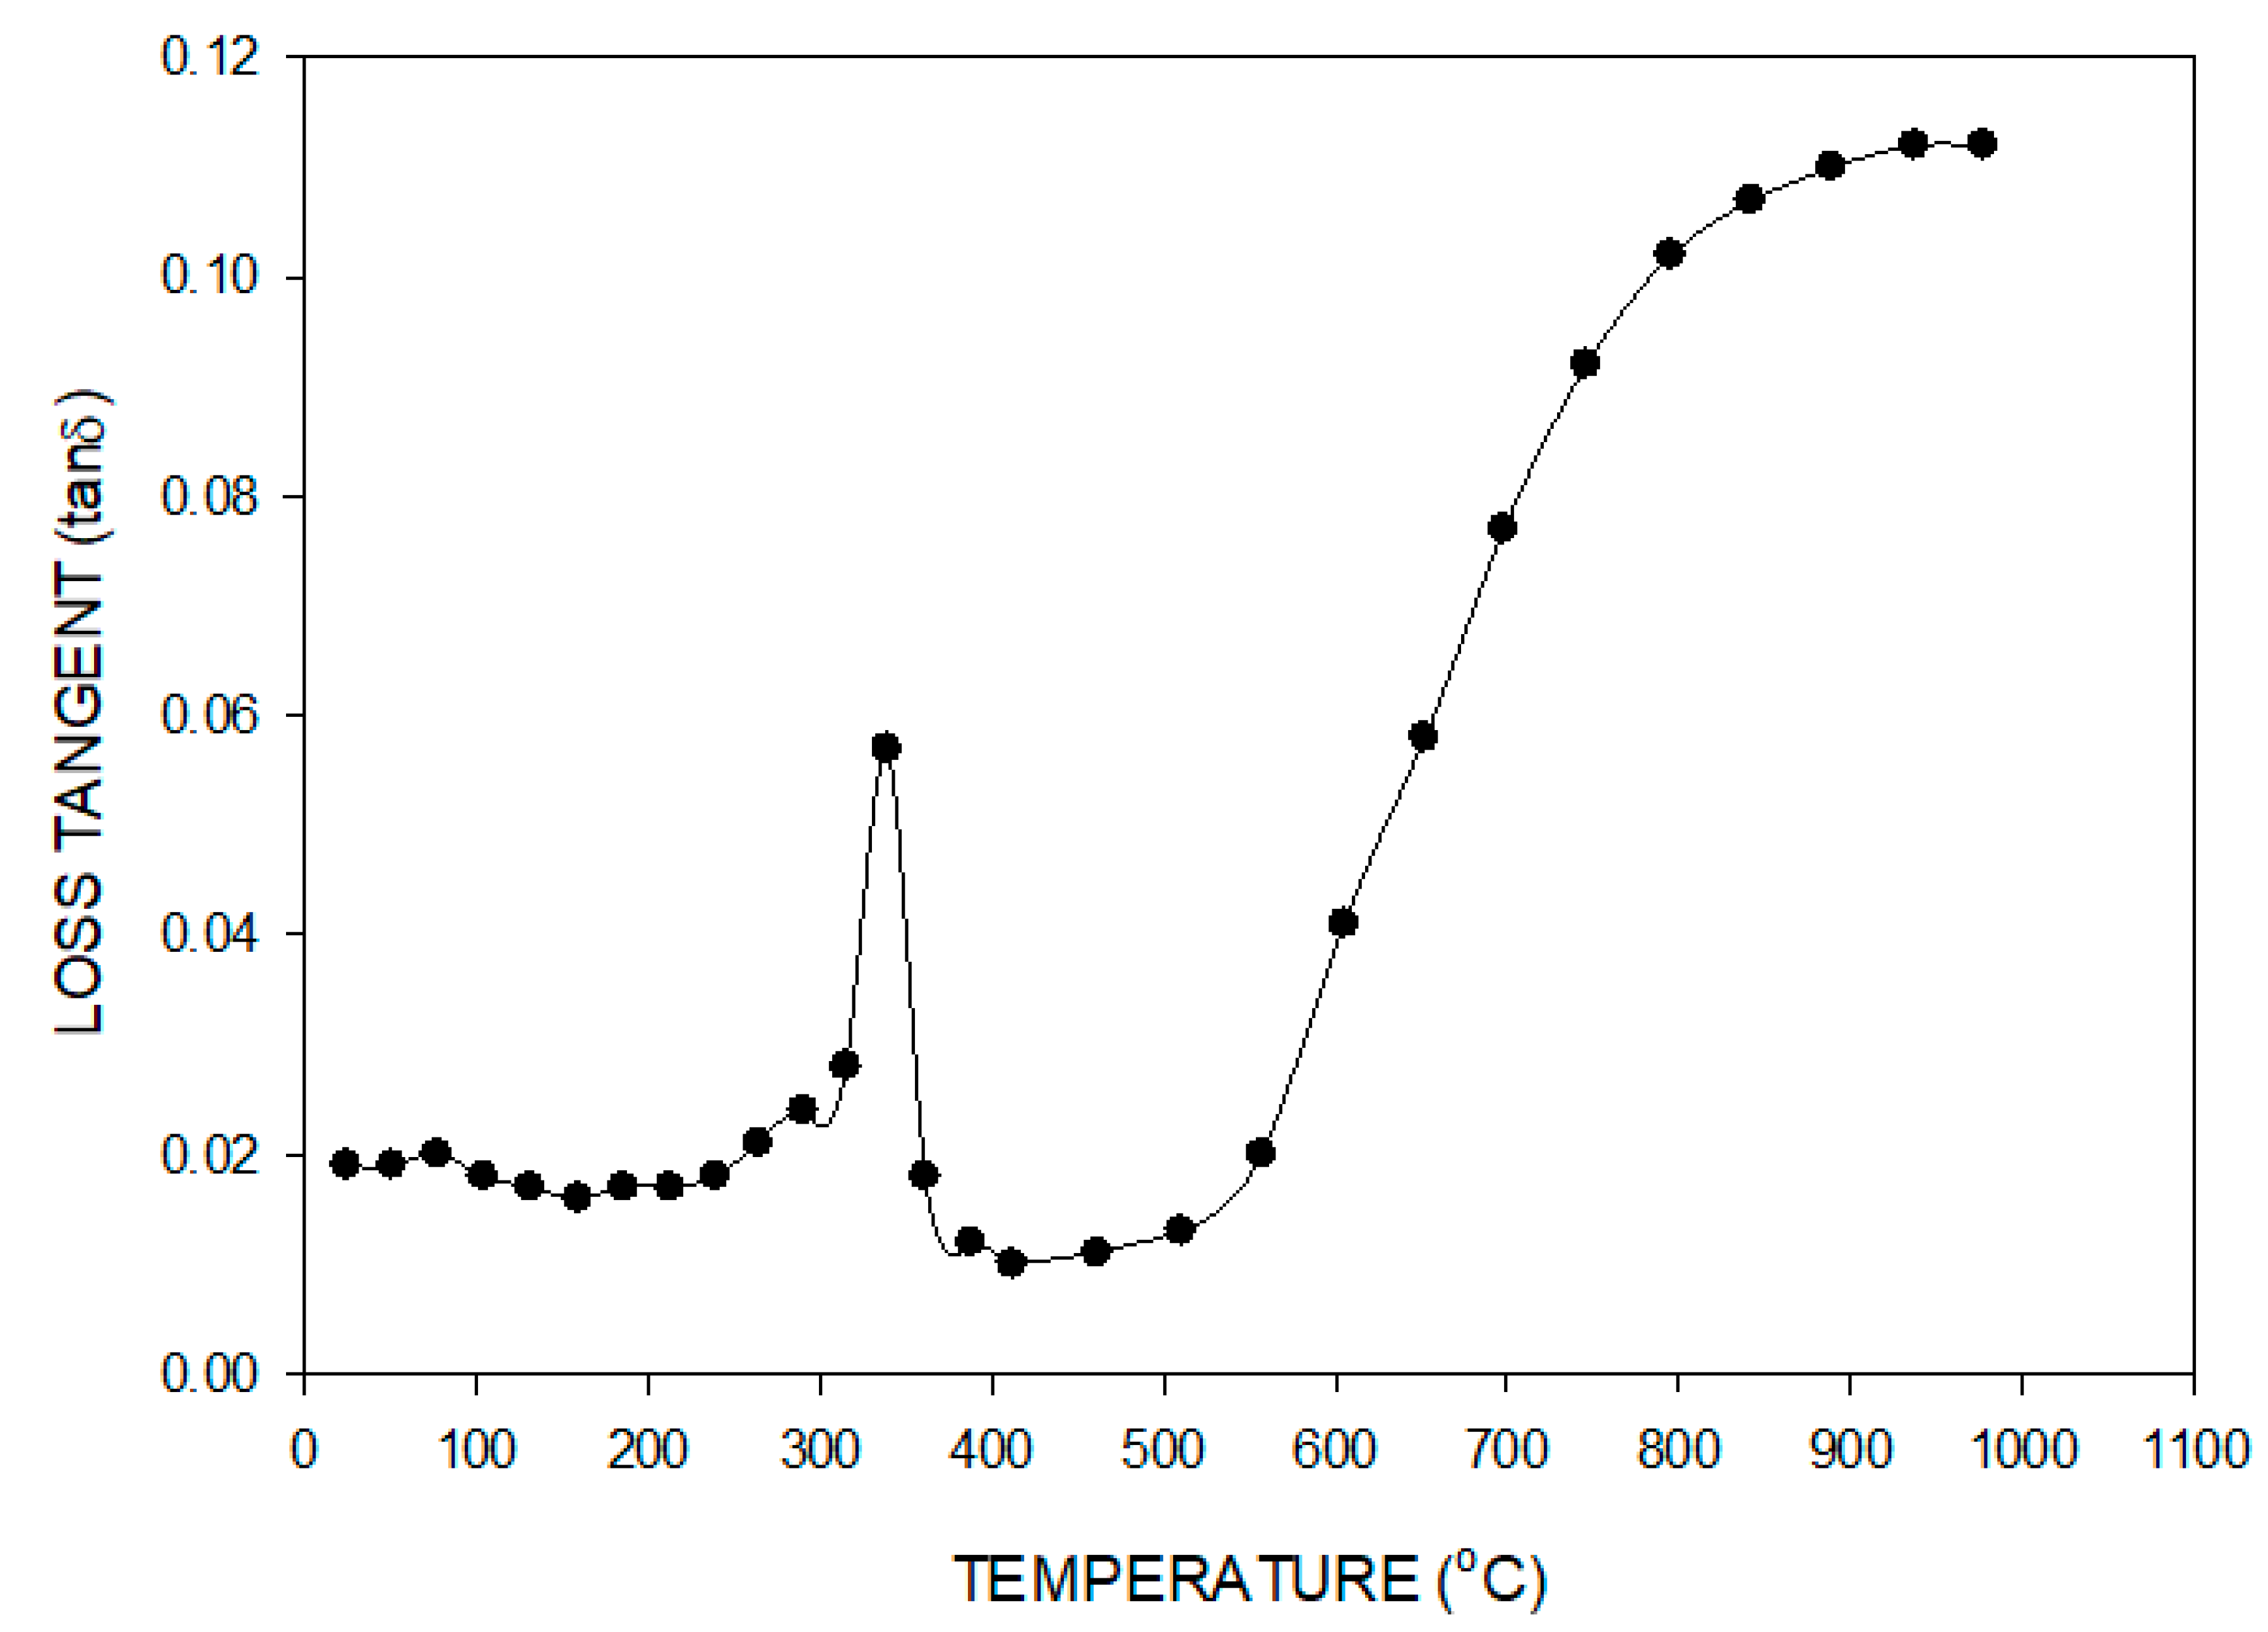
The loss tangent of bauxite (1) was calculated using Equation (7) and is shown in Figure 7. Here, it can be seen that the behavior of the loss tangent was very similar to that of the imaginary permittivity, since the numerical value of the real permittivity did not change significantly across the whole temperature range. There are two regions where the loss tangent underwent significant changes. Firstly, from about 200 °C, the loss tangent increased slowly, then more rapidly, reached a maximum of 0.057 at 340 °C and then decreased before leveling off at about 400 °C. This peak was mainly attributed to the dehydroxylation of boehmite. In comparison to the imaginary permittivity, the peak for the loss tangent was shifted to somewhat higher temperatures. Secondly, above 400 °C, the loss tangent increased slowly and then more rapidly before leveling off at 0.112 at about 1000 °C. This increase with temperature was due to the increase in the imaginary permittivity due to the increase of conductivity with temperature.
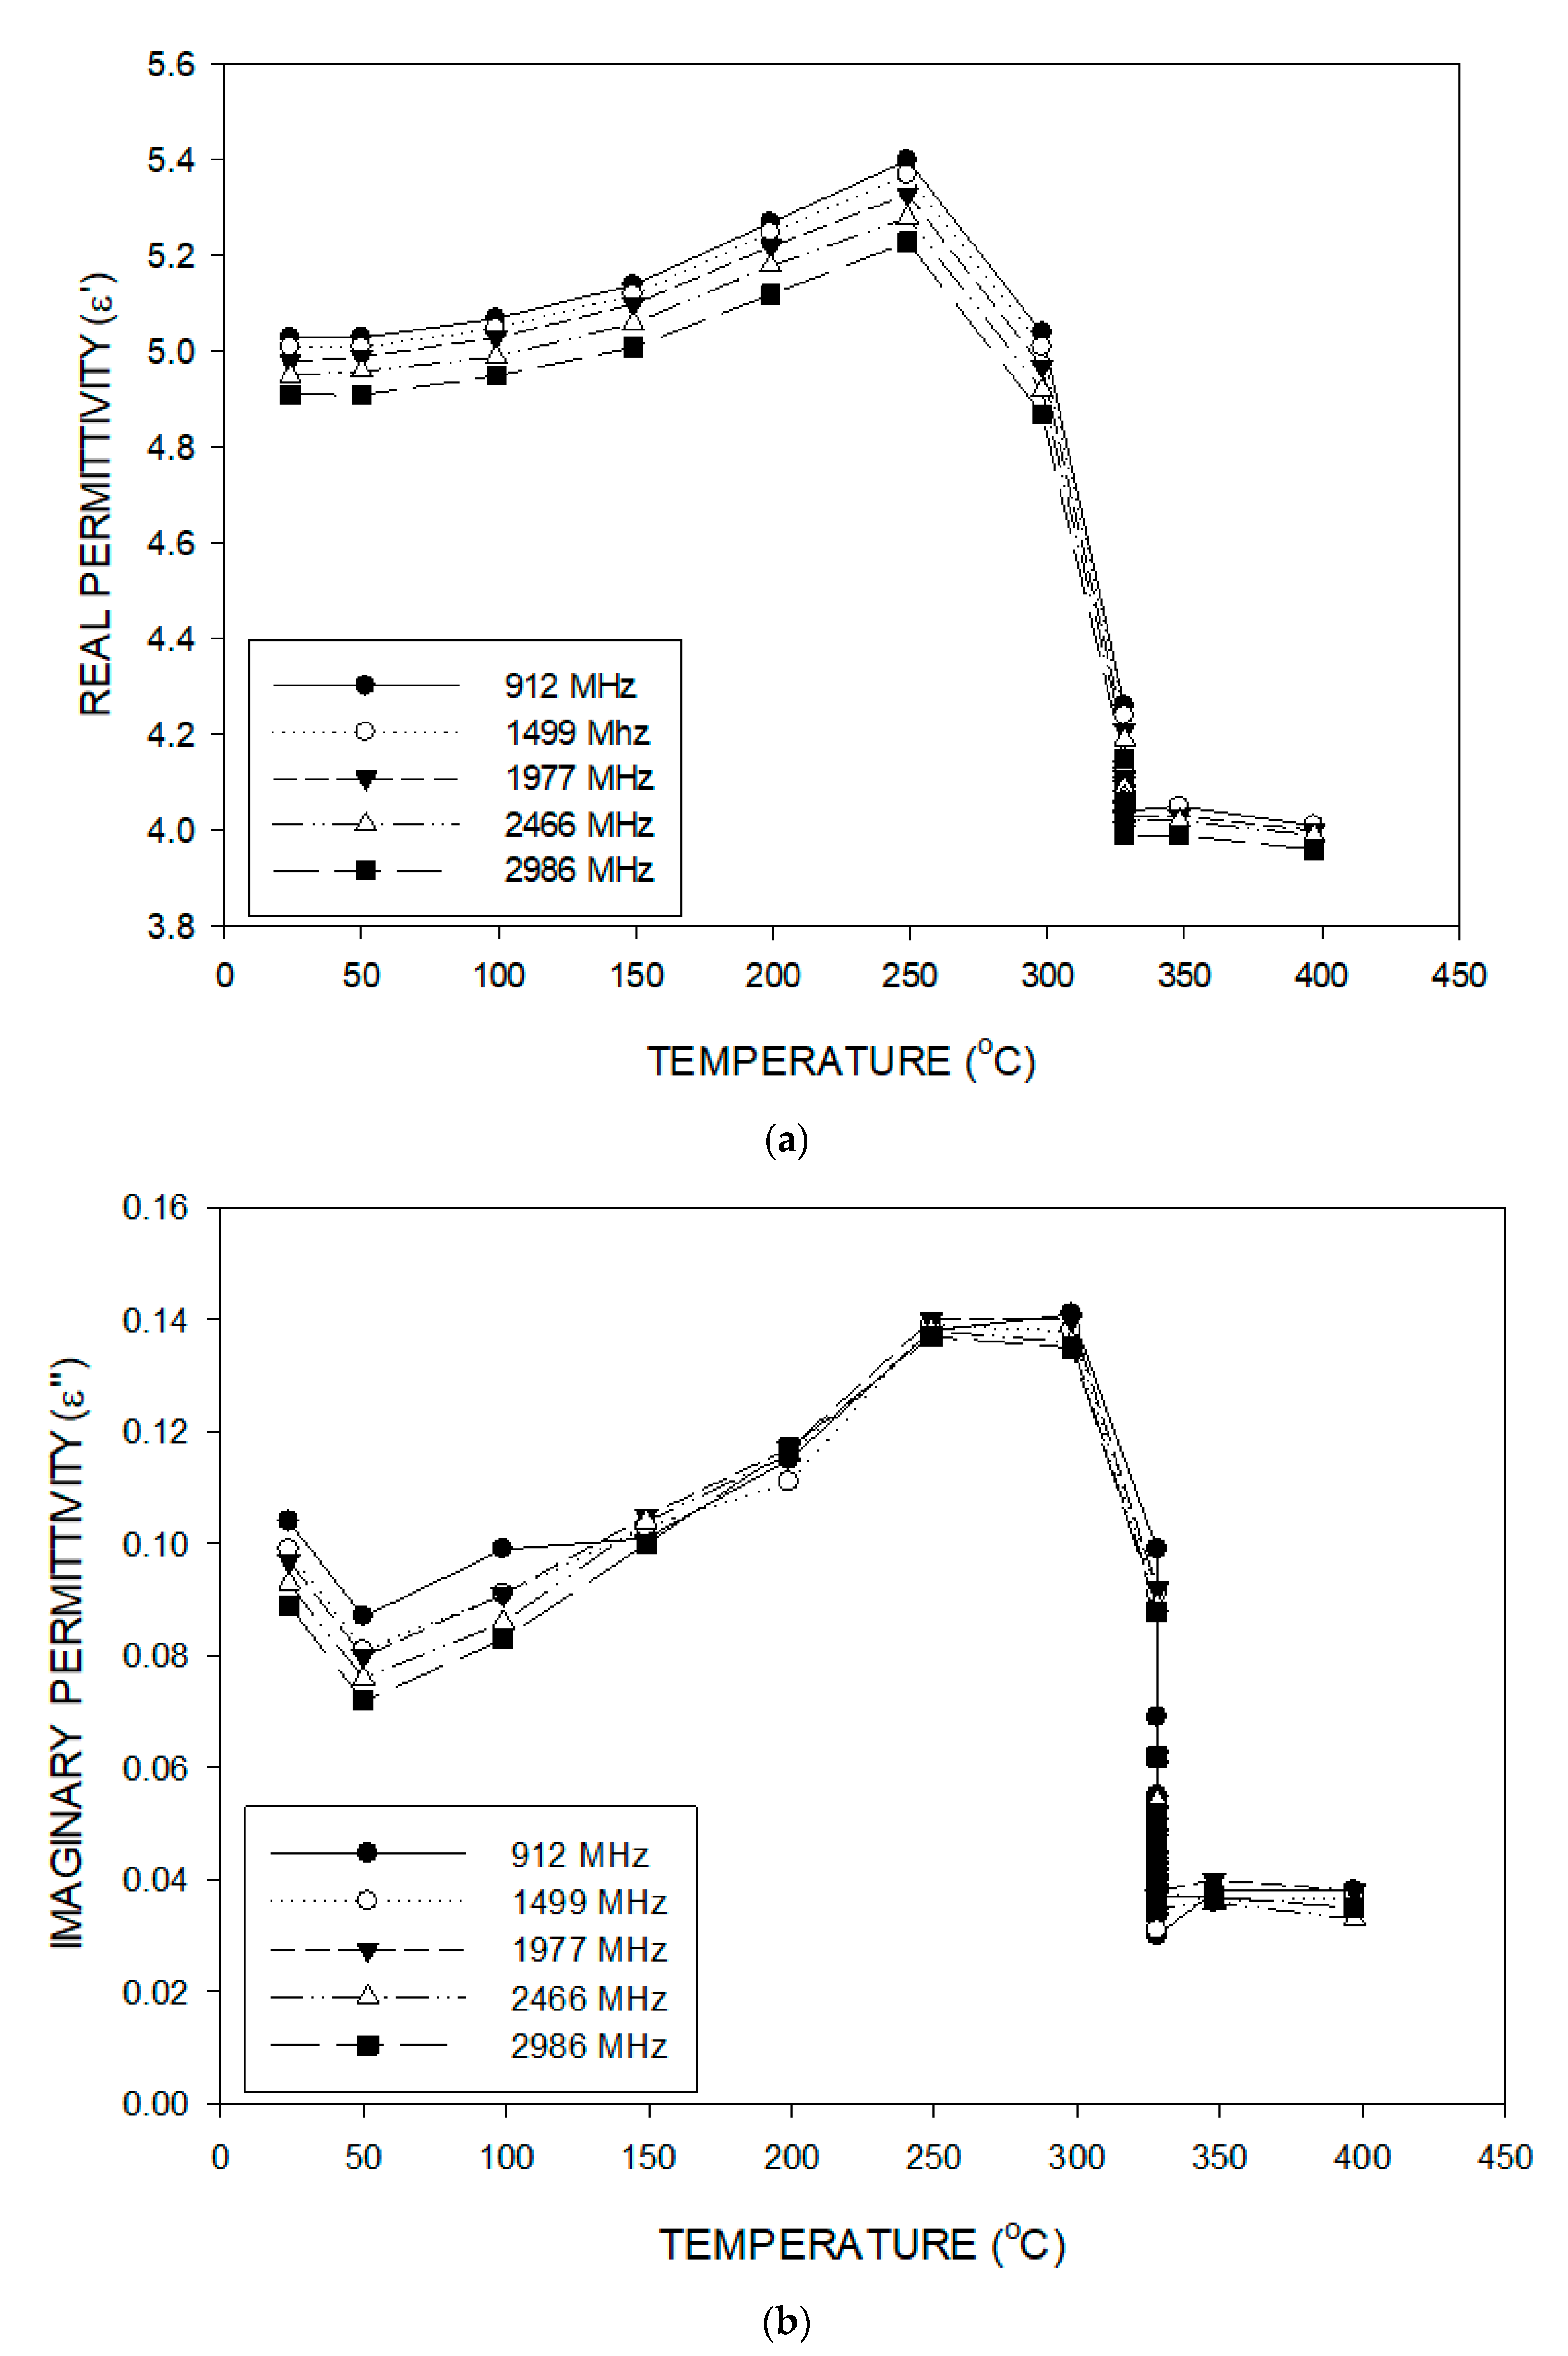
Both the real and the imaginary permittivities of the iron-rich fraction (1-Fe) were measured in the temperature range of 24 °C to 400 °C as a function of temperature at various frequencies, as shown in Figure 8a,b, respectively. This temperature range was chosen so that the dewatering processes could be studied in detail as a function of frequency. Again, both permittivites behaved in a similar manner, and also, the general trends were comparable to those observed for bauxite (1). However, the permittivity values were greater than those for bauxite ore (1) due to the higher density and iron content. At room temperature, the real permittivities varied with frequency in the range of 4.91 to 5.03, while the imaginary permitivities ranged from 0.089 to 0.104. Up to 50 °C, the imaginary permittivity decreased, while the real permittivity remained constant. Here, some free water was removed, and once more, the imaginary permittivity was more sensitive to the changes in free water content. Subsequently, above 100 °C, both permittivities increased relatively rapidly, with the real permittivity reaching a maximum at about 250 °C and the imaginary permittivity at the somewhat higher temperature of about 300 °C. Once more, these increases can be attributed to the removal of the more strongly bonded water, as gibbsite is converted into boehmite, and then boehmite into alumina. Subsequently, as the rate of water removal decreased, then the permitivities decreased. Again, the imaginary permittivity was more sensitive to the changes in the moisture content.
With regard to the effect of frequency, below the maximum and up to about 300 °C, the real permittivity increased with decreasing frequency. From 300 °C, there was a diminishing frequency effect up to about 325 °C, and subsequently, the real permittivity increased with decreasing frequency. In general, during the temperature range over which dewatering occurred, frequency did not have a significant effect on the real permitivities. For the imaginary permitivities, there was a frequency dependency below about 150 °C, and in a manner similar to the real permittivity, the imaginary permittivity decreased with increasing frequency. This frequency dependency below about 150 °C could be attributed to the presence of free or weakly bonded water. However, above 150 °C, there was very little frequency dependency for the imaginary permittivity.
3.2. Microwave Heating Behavior
Sintering of the ore during microwave processing could result in spurious increases in the compressive strengths, which were not attributable to dewatering. Consequently, it was important to determine the heating behaviors of these ores, and hence, to determine the significance of the various operating factors and any possible interactions. A 24 factorial statistical analysis was performed for bauxite (1), and, based on multiple regressions, a linear relationship was developed as follows:
where Y is the measured sample temperature, X1 is the coded form for the heating time, X2 is the coded form for the power level, X3 is the coded form for the sample mass, X4 is the coded form for the sample bulk density, and is the random error with zero mean. It was established that all four variables were significant, with the heating time being the most significant, followed by sample mass and power level. In this coded form, bulk density had a negative effect on the sample temperature. The interaction between the sample mass and the sample density was critical. In order to evaluate the model fitness, the predicted temperatures were subtracted from the measured temperatures for each of the four factors. Then, the residuals were plotted against the predicted sample temperature, heating time, sample mass, microwave power and bulk density. No trends were observed for any of the variables, and therefore, the residuals were considered random noise, and thus, the present model was considered to adequately describe the sample temperature.
In the current experiments, the desired objective would be to dewater the ore and achieve a significant reduction in the compressive strength index. This can be accomplished by attaining a stable and uniform temperature of at least 500 °C in the microwave system. The steepest ascent method can be utilized to achieve this desired objective at the fastest rate by changing all the significant factors and interactions at the same time. However, in the present research, there are limits for some of the variables. Bulk density has a negative influence on the sample temperature and was fixed at the lowest value of 0.6048 g/cm3. Power has a positive effect but was limited by the equipment at 1300 W. The maximum sample mass of 35 g was the maximum crucible capacity. The heating time could be varied without limit. The substitution of 0.6048 for X4 in Equation (9) gives the following regression model:
According to this equation, the steepest path involves moving 28.38 units in the X3 direction for every 19.25 units in the X1 direction and 10.13 units in the X2 direction. Thus, the path of steepest ascent has a slope of 1 for X3, 19.25/28.38 for X1 and 10.13/28.38 for X2. Using an incremental change in mass of 5 g as one coded unit, then the corresponding changes in the other two variables would be as given in Table 5.
Using the central point in the 24 factorial statistical analysis, a new series of experiments was conducted along the designed steepest path, as shown in Table 6, in order to obtain the desired temperature. The central point conditions were a 15 g sample with a bulk density of 0.6048g/cm3, and the sample was microwave heated at 912.5 W for 4 min. Each new test condition was obtained by increasing the sample mass by 5 g, the heating time by 0.6785 min and the microwave power by 31.22 W. The results are shown in Table 6.
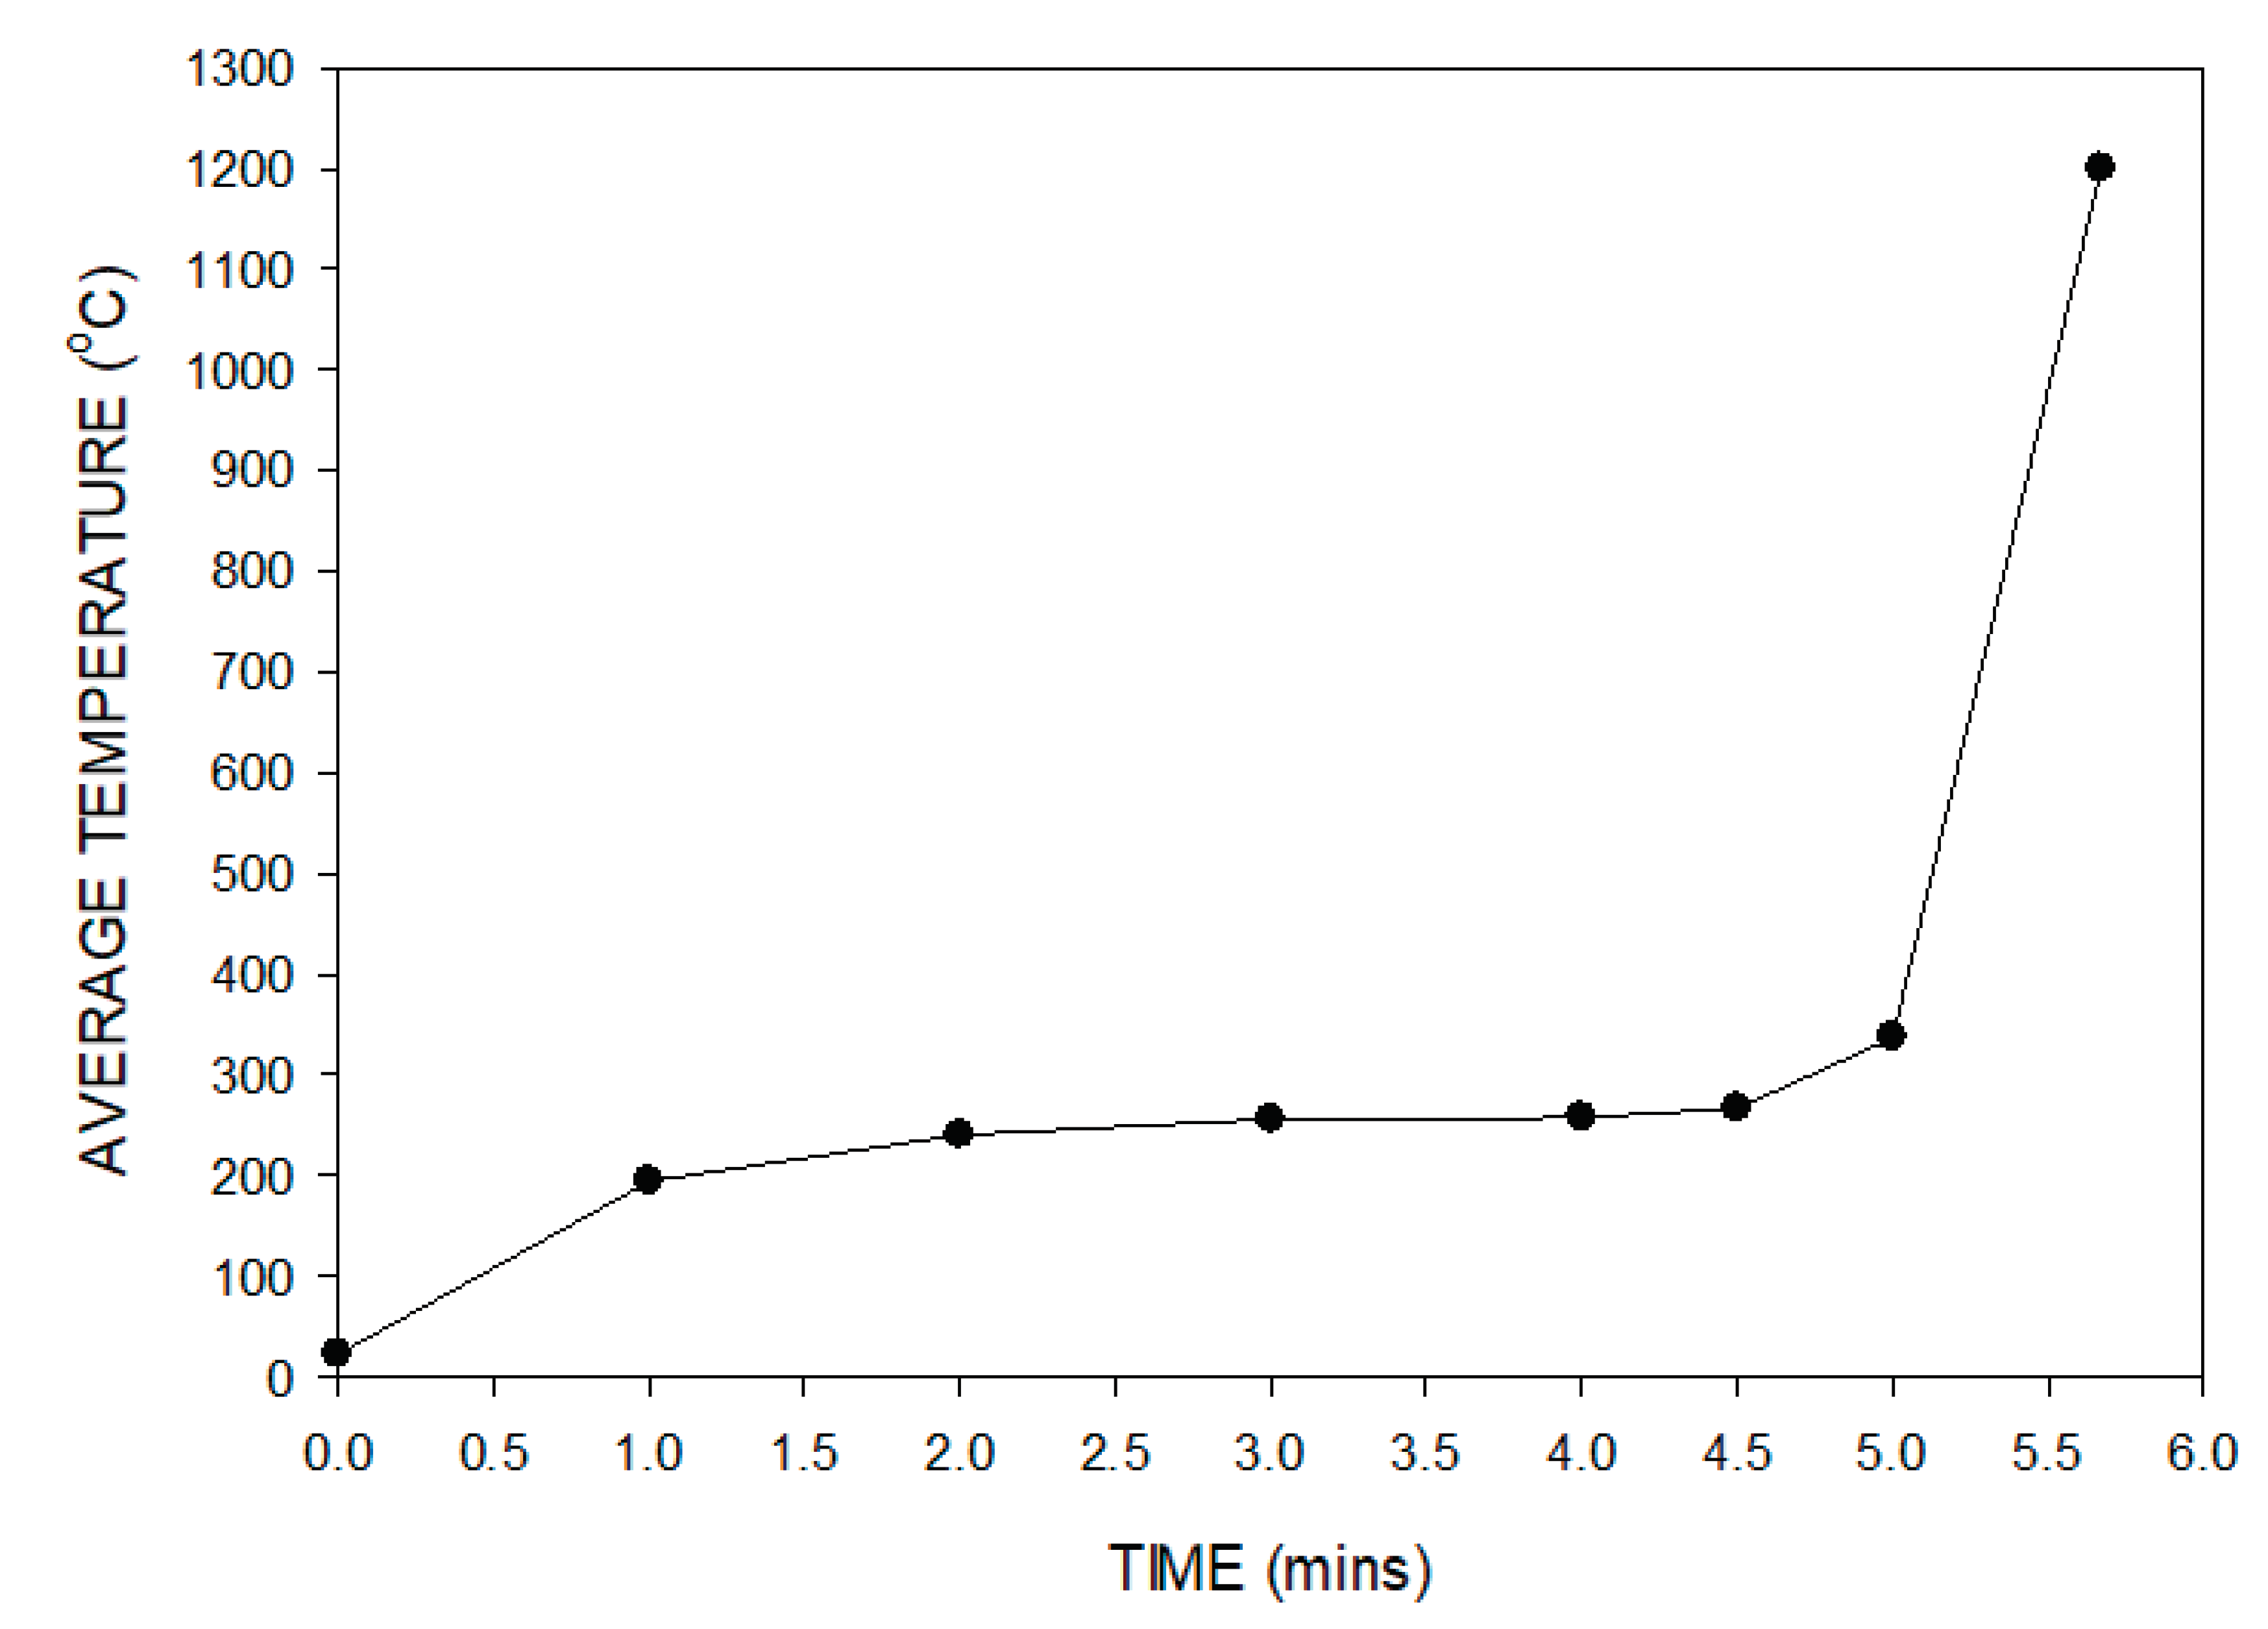
From Table 6, it can be seen that for sample masses below 25 g, times of 5.34 min and microwave powers of 974 W, the temperatures were lower than about 260 °C. At slightly higher conditions of 27.5 g, 5.67 min and 990 W, the temperature increased rapidly to more than 1200 °C, and the sample sintered. Since this temperature was far higher than the desired one of 500 °C, then calculations were performed in order to obtain the lower temperature of 500 °C by changing the heating time only. These results are plotted in Figure 9 and demonstrate that the change in the sample temperature was very small when the heating time varied from 1 min to 5 min. As the heating time increased to 6 min, the sample temperature increased rapidly from 337 °C to 1200 °C. Therefore, it was not possible to reach the desired temperature under the current test conditions due to the non-uniform microwave heating behavior. Thus, because of the inevitable thermal runaway, it was necessary to identify when sintering occurred in the strength index tests.
3.3. Compressive Strength Indices of Pisolitic Bauxite: Conventional versus Microwave
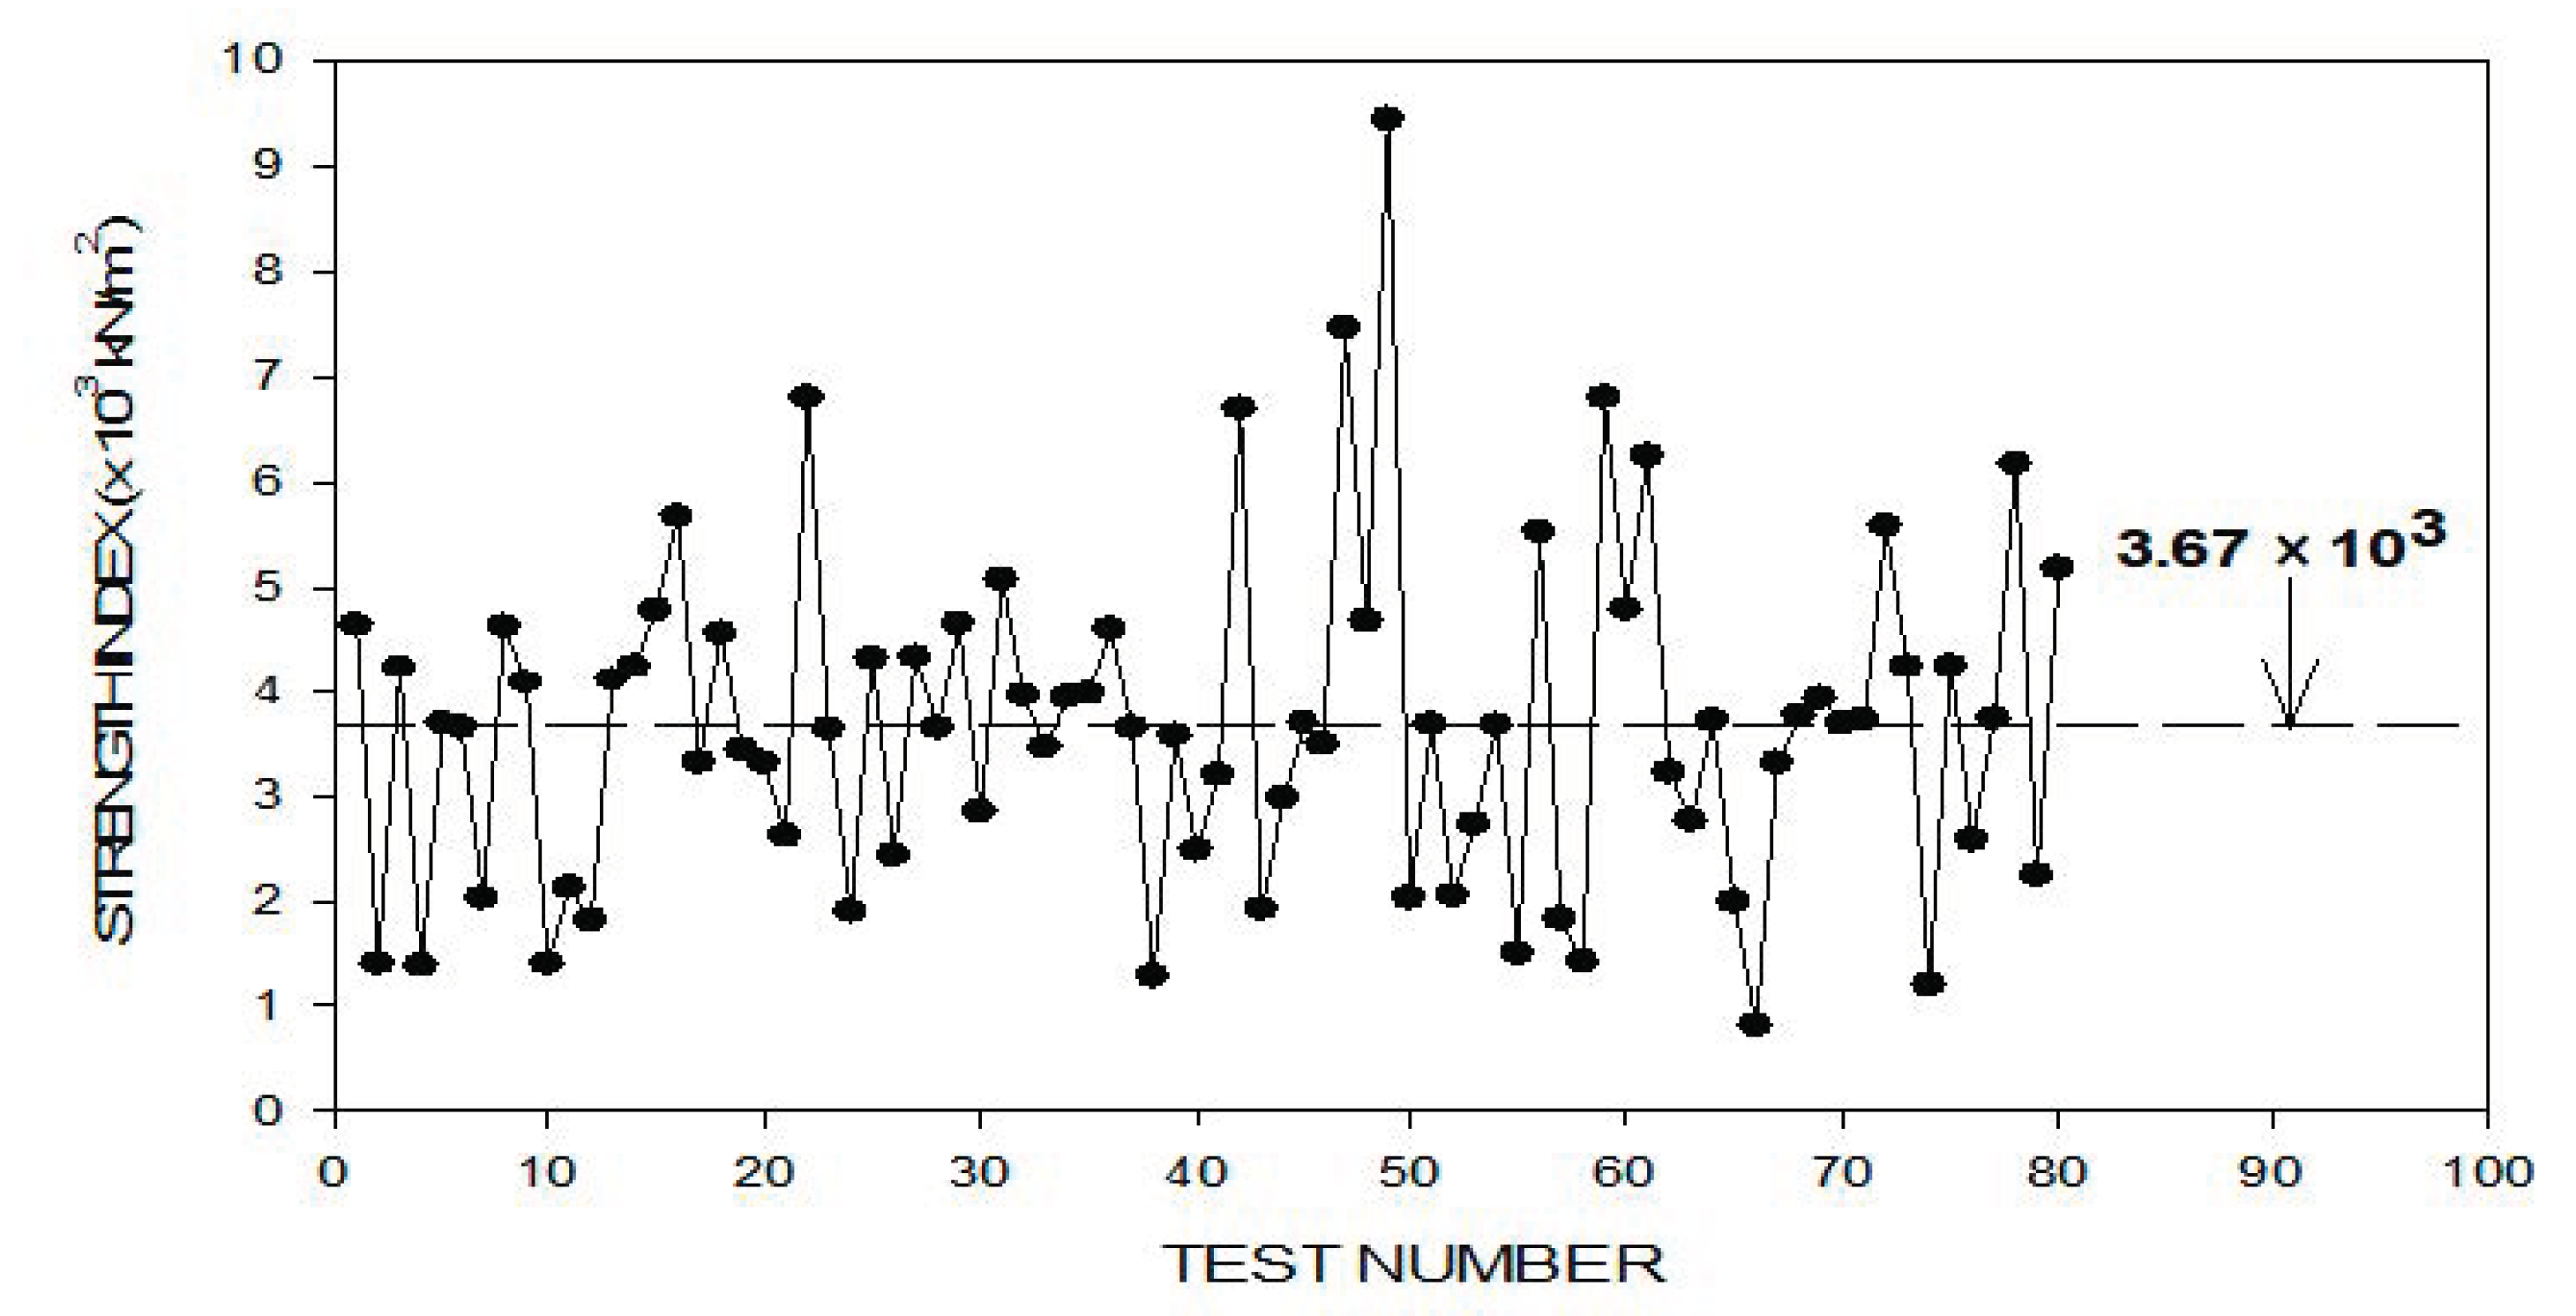
As mentioned previously, in these tests, the bauxite (2) pisoids were utilized because of their approximate spherical shape. Here, the particle size was small and in the range of 0.25 mm in diameter. The compressive strengths of the eighty samples of the as-received bauxite are shown in Figure 10. The average value for the eighty tests was 3.67 × 10³ kN/m2. These values exhibited a considerable range, with a minimum of 0.81 × 10³ kN/m2 and a maximum of 9.44 × 10³ kN/m2. This variation was attributed to the inherent differences in the mineralogies of the particles, and also, since the particles were not truly spherical, then there could have been some contact area with either one or both of the loading platens instead of just at a single point.
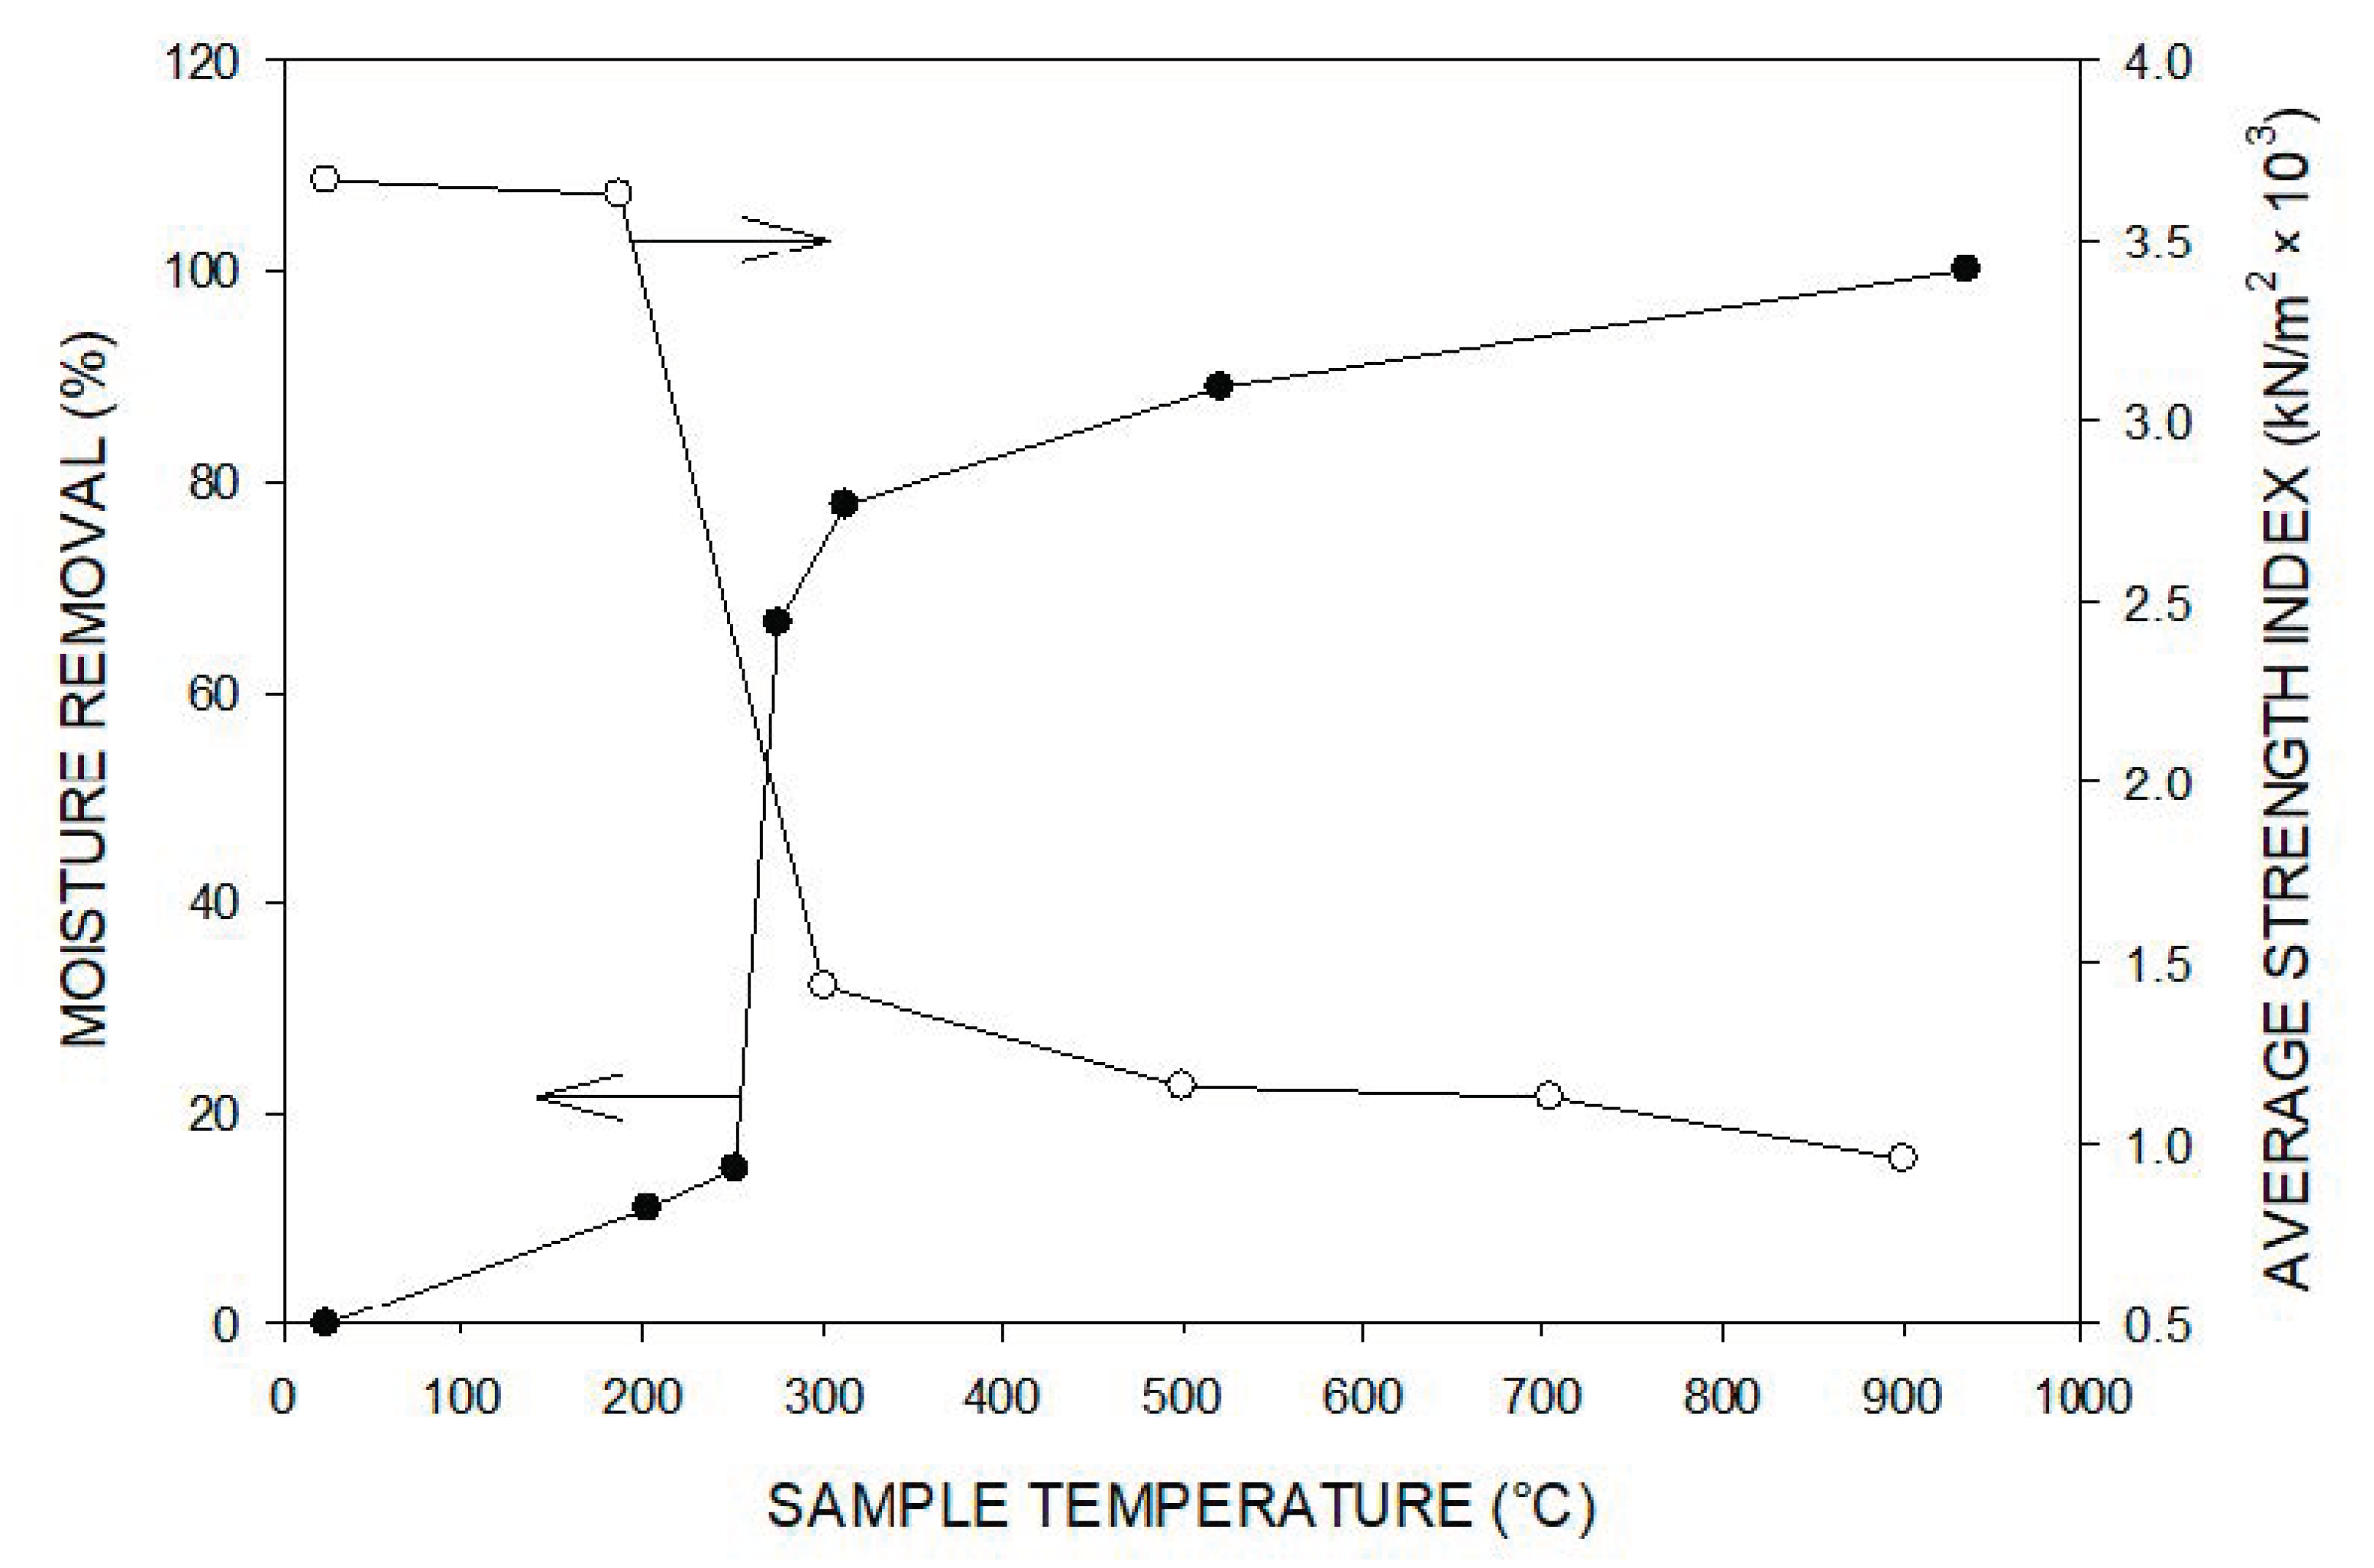
In order to define a baseline for the compressive strength indices of the microwaved samples, the strength indices of conventionally heated bauxite samples were determined at 200 °C, 300 °C, 500 °C, 700 °C and 900 °C for processing times of twenty minutes. As mentioned previously, only visibly cracked particles were selected for the strength index tests. Figure 11 shows the average compressive strengths and the moisture contents (based on mass loss) of the conventionally heated samples as a function of temperature. For conventional heating at 200 °C, the average value for eighty particles was 3.63 × 10³ kN/m2, indicating that there was no reduction in the compressive strength. On the other hand, at 300 °C, 500 °C, 700 °C and 900 °C, the average strength indices were 1.44 × 10³ kN/m2, 1.16 × 10³ kN/m2, 1.13 × 10³ kN/m2 and 0.96 × 10³ kN/m2, respectively. Thus, in comparison to the as-received material, there was a significant reduction in the compressive strengths at these temperatures. It can be seen that up to about 200 °C, there was a mass loss of about 12%, due mainly to the removal of some loosely bonded water and some decomposition of gibbsite to boehmite, which did not significantly affect the compressive strength. However, from about 200 °C to 300 °C, the mass loss was about seventy percent, and the removal of this more strongly bonded water resulted in a decrease in strength of about sixty percent. Above 300 °C, the mass loss continued to decrease but more slowly, with the rate decreasing with increasing temperature up to 900 °C. This moisture loss resulted in additional decreases in compressive strength of about fourteen percent. Thus, although there was some reduction in strength at the higher temperatures, the majority of the strength reduction occurred from about 200 °C to 300 °C during the decomposition of gibbsite to boehmite to alumina.
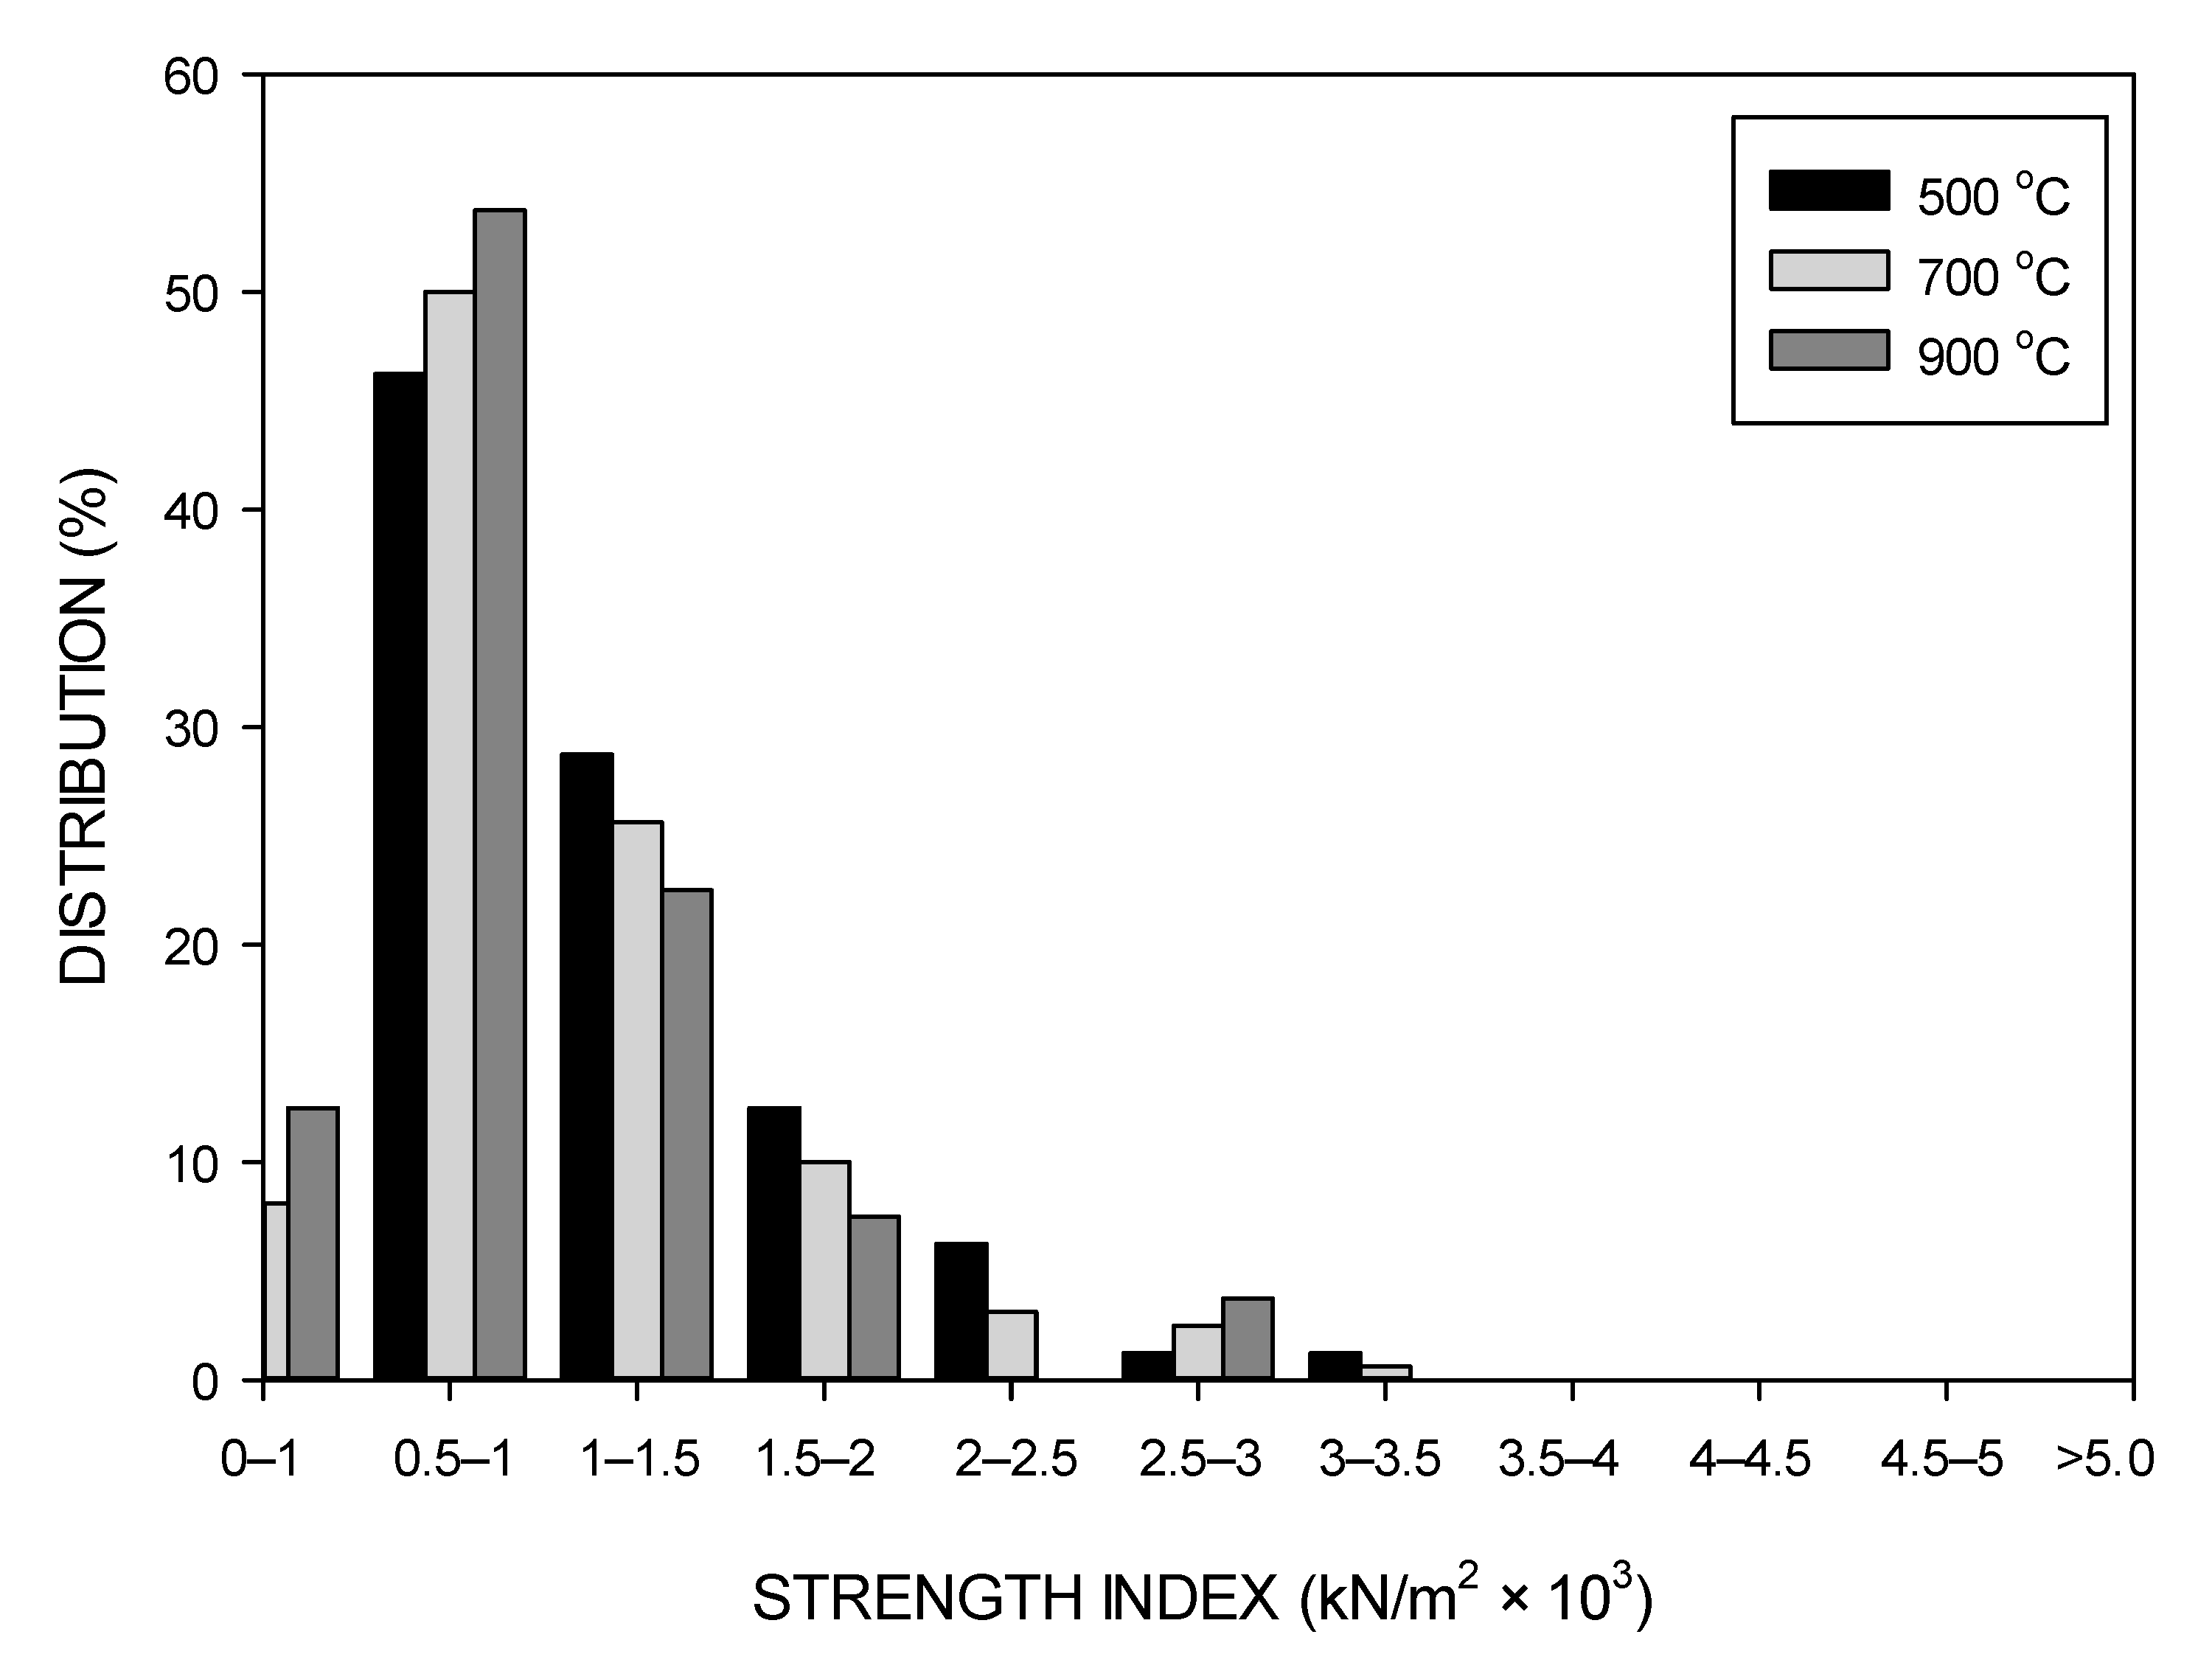
Figure 12 shows the combined distributions of the strength indices for the conventional samples heated to 500 °C, 700 °C and 900 °C for twenty minutes. These temperatures are well above the decomposition temperature range for bauxite, and thus, the majority of the water had been removed. It can be seen that the strength indices were significantly reduced as compared to the as-received material (Figure 10). Additionally, the distribution shifts to slightly larger amounts of particles in the lower strength ranges with increasing temperature. About fifty percent of the particles have strength indices in the range of 0.5−1.0 × 10³ kN/m2 and about another twenty-five percent in the range of 1.0−1.5 × 10³ kN/m2. Thus, about seventy-five percent of the particles have strength indices of less than 1.5 × 10³ kN/m2, which corresponds to an over sixty percent reduction in strength.
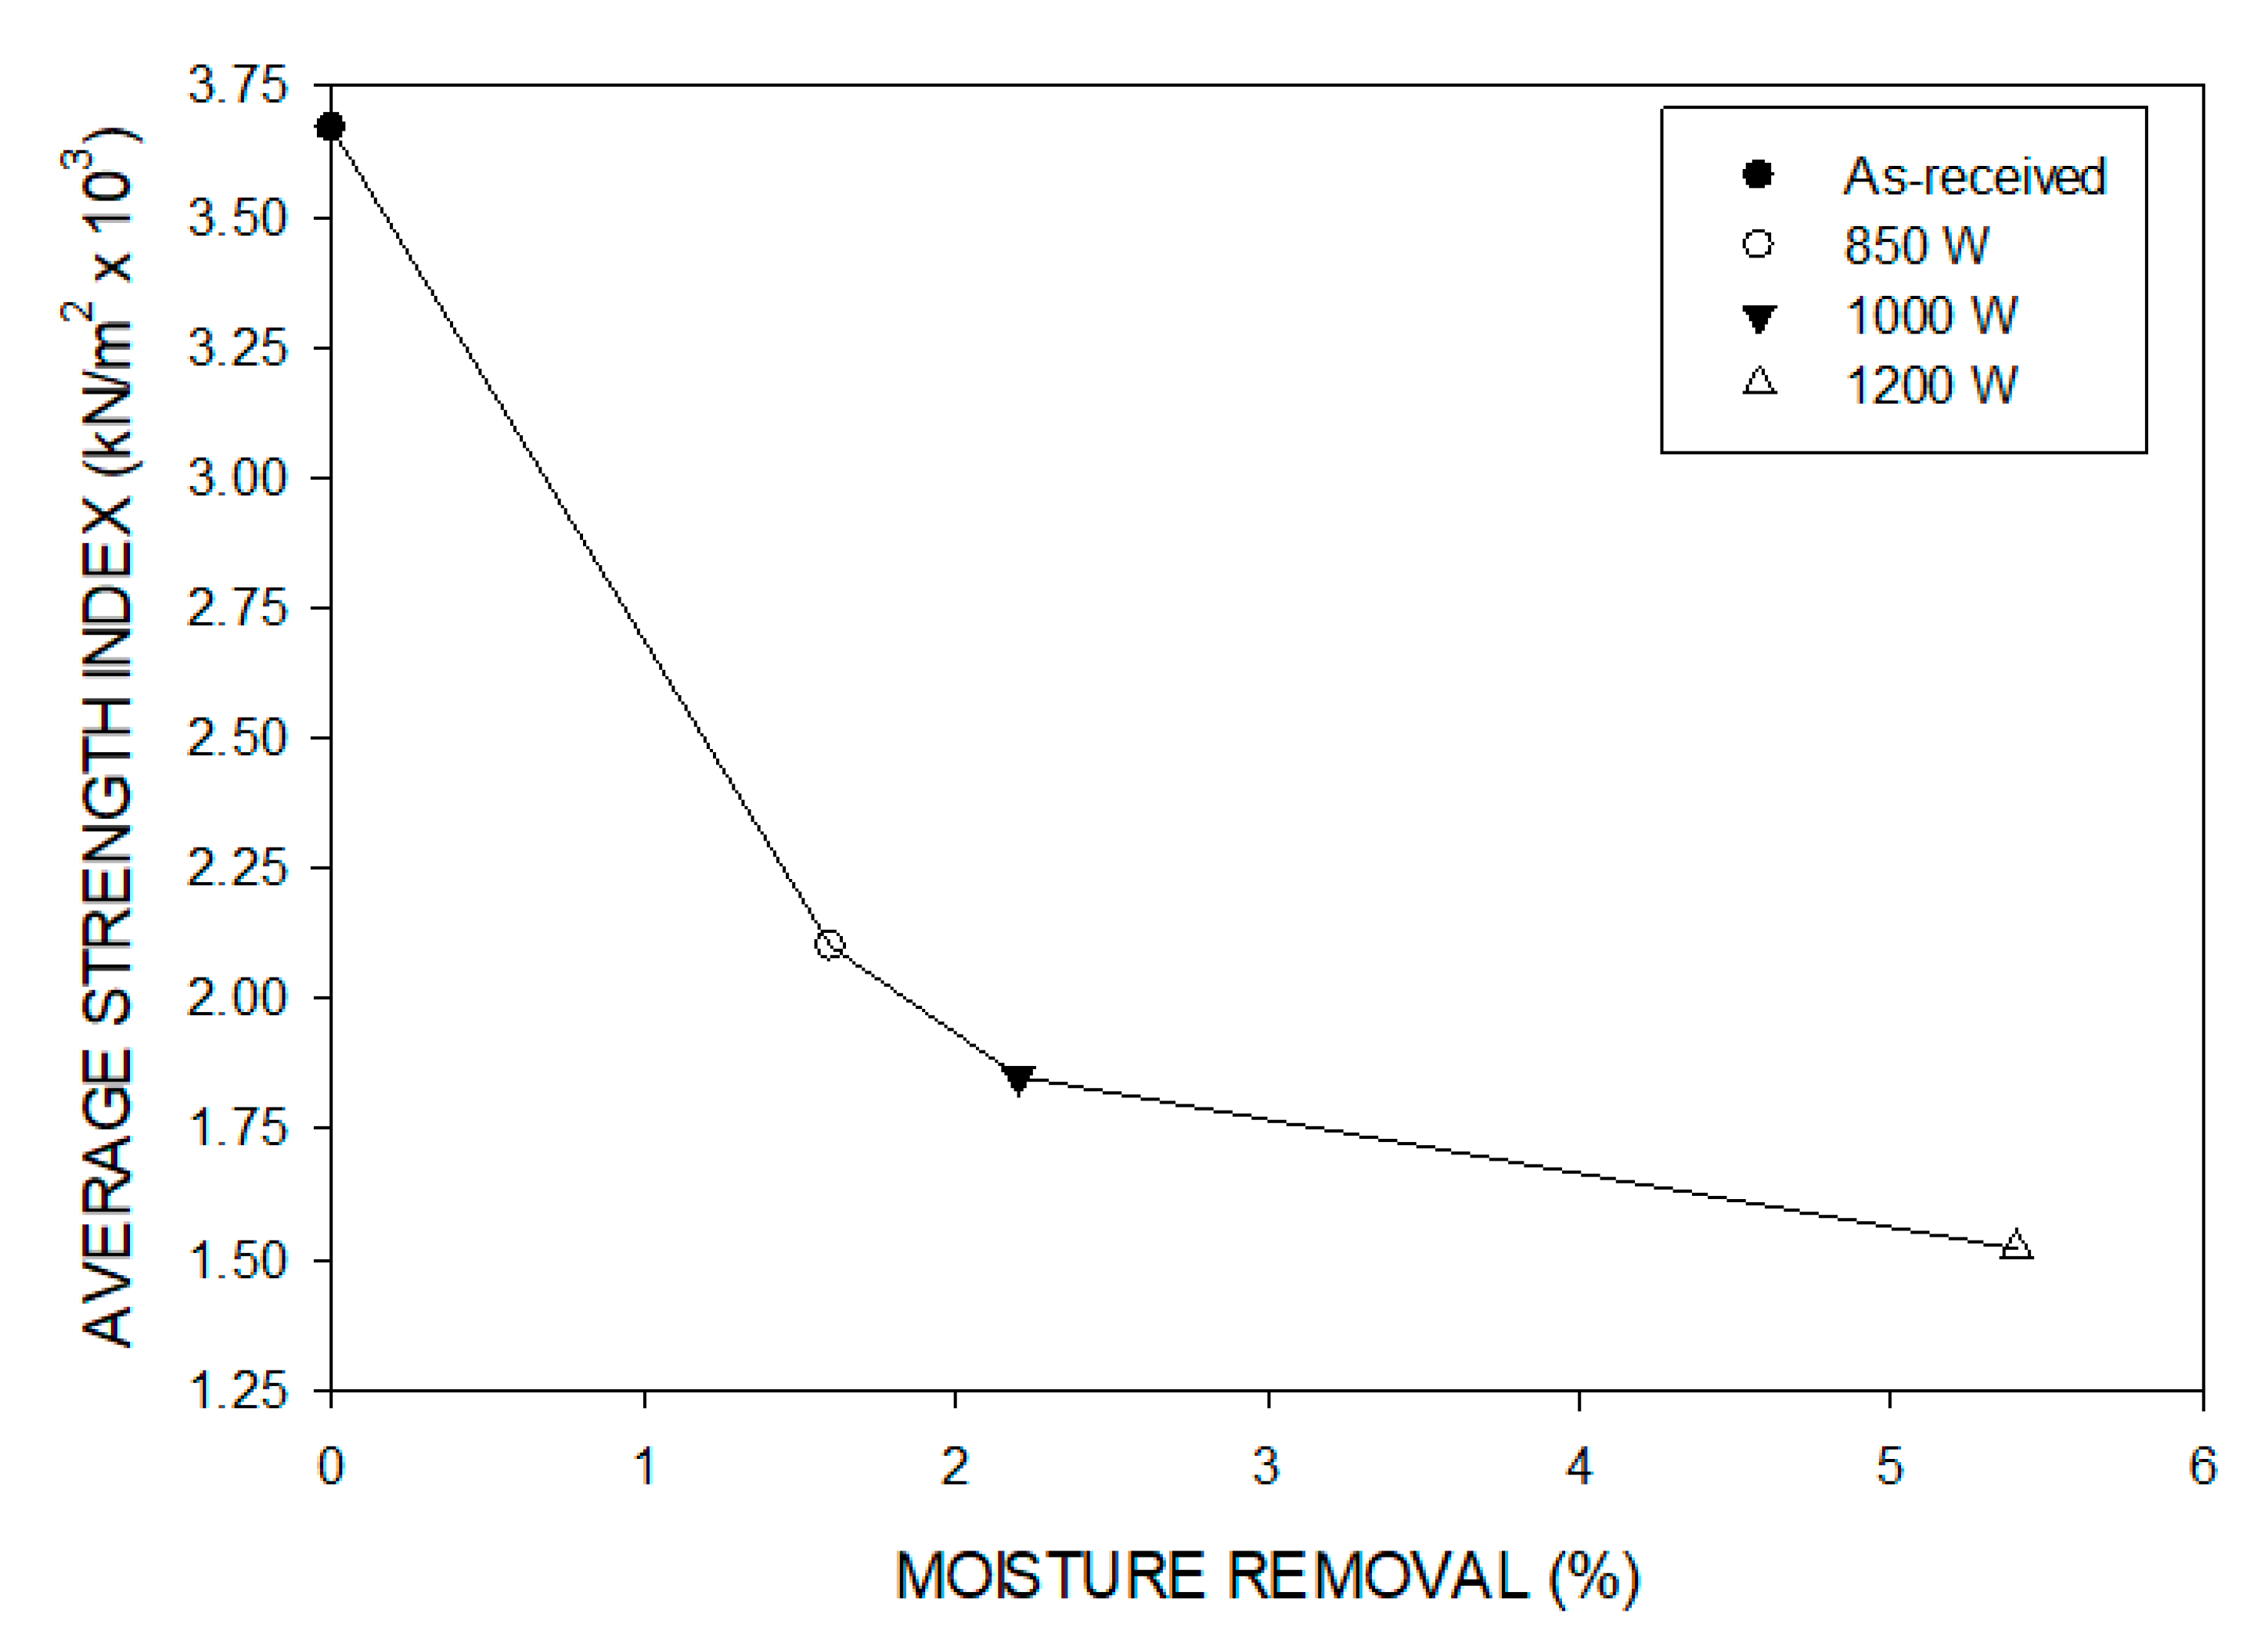
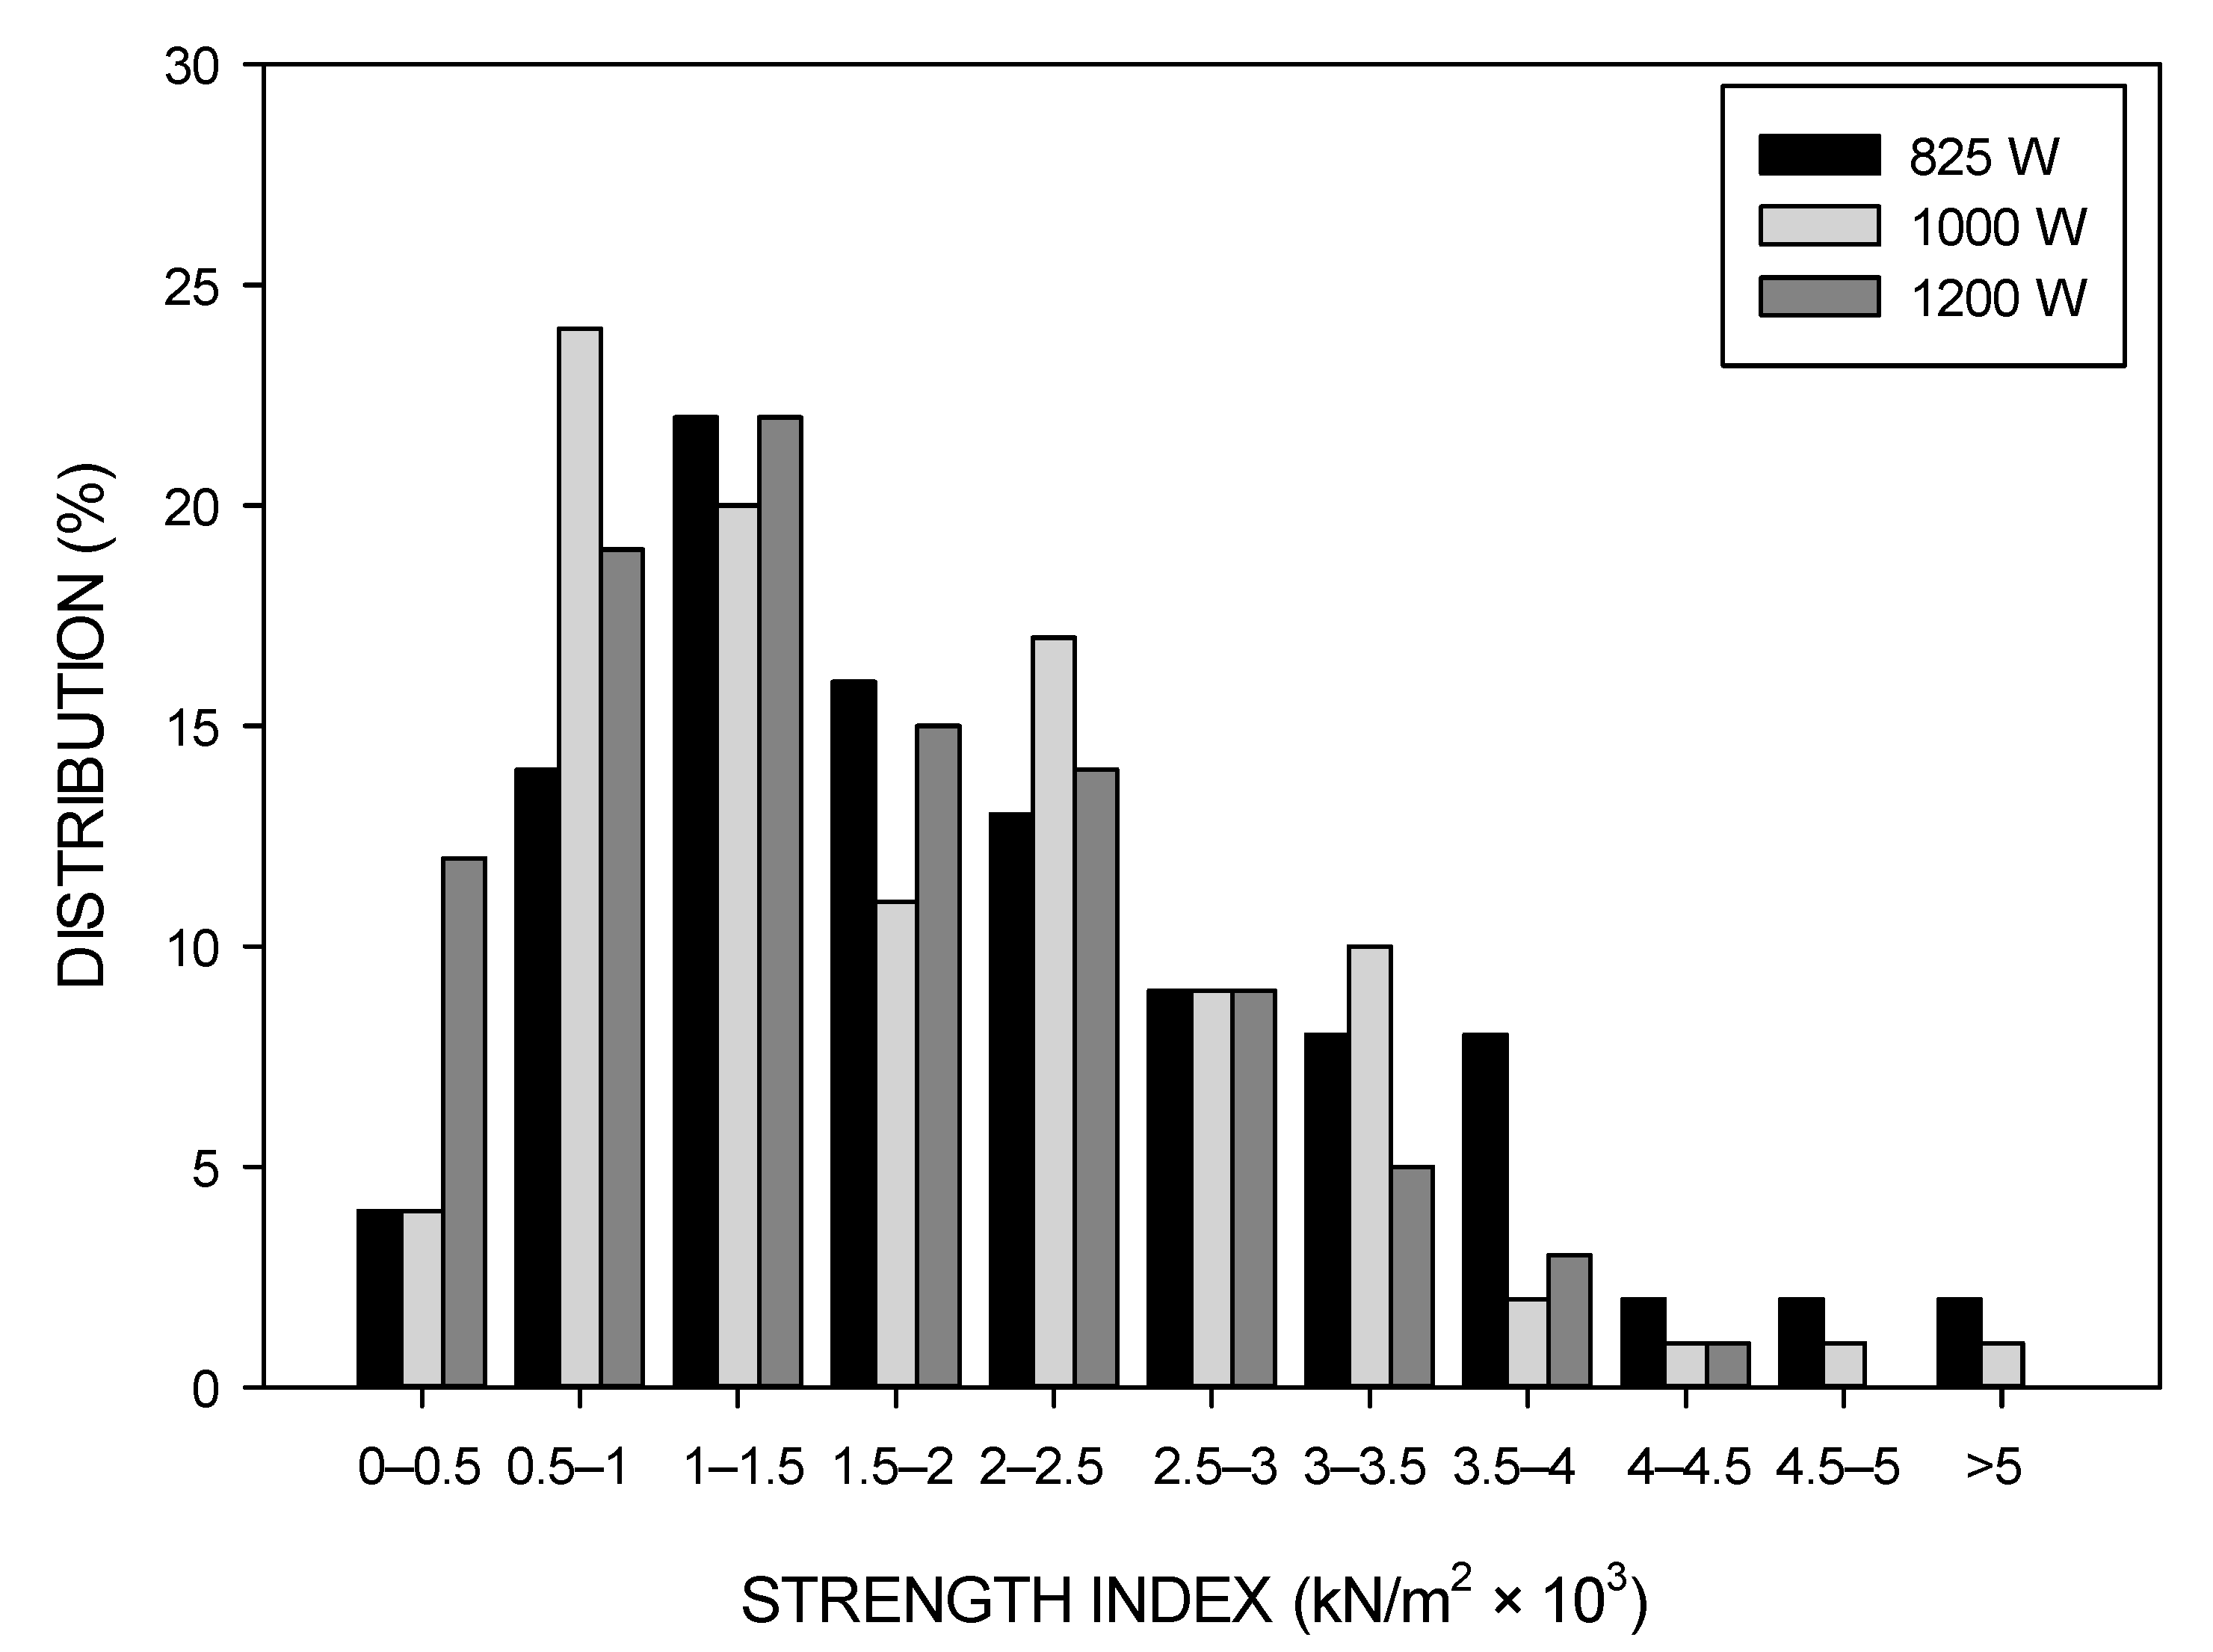
For the microwave tests, the samples were processed at 825 W, 1000 W and 1200 W for 2 min, and the strength indices are shown as a function of moisture content in Figure 13. It can be seen that the strength indices are in the range of 1.52 to 2.10 × 10³ kN/m2. Additionally, it can be seen that the overall sample moisture losses were low and in the range of 1.6% to 5.4%, indicating that only a fraction of the particles were heated. For conventional heating, the corresponding moisture loss for this range of strength indices would be about 35% to 50%. The distributions of the strength indices are shown in Figure 14 for these microwave power values. In comparison to the as-received material and in agreement with the results for conventional heating, there was a significant shift of the strength indices to lower values, with the shift increasing with increasing power. Only about twenty percent of the particles had strength indices in the range of 0.5–1.0 × 10³ kN/m2 as compared to fifty percent for the conventionally heated samples. Similarly, only about forty-five percent of the particles had strength indices of less than 1.5 × 10³ kN/m2 as compared to seventy-five percent for the conventionally heated samples.
For comparison purposes, the data for the average values of the strength indices for the conventionally heated samples at the three temperatures of 500 °C, 700 °C and 900 °C and the microwave-heated samples at 825 W, 1000 W and 1200 W were fitted to a modified Gaussian five-parameter equation as follows:
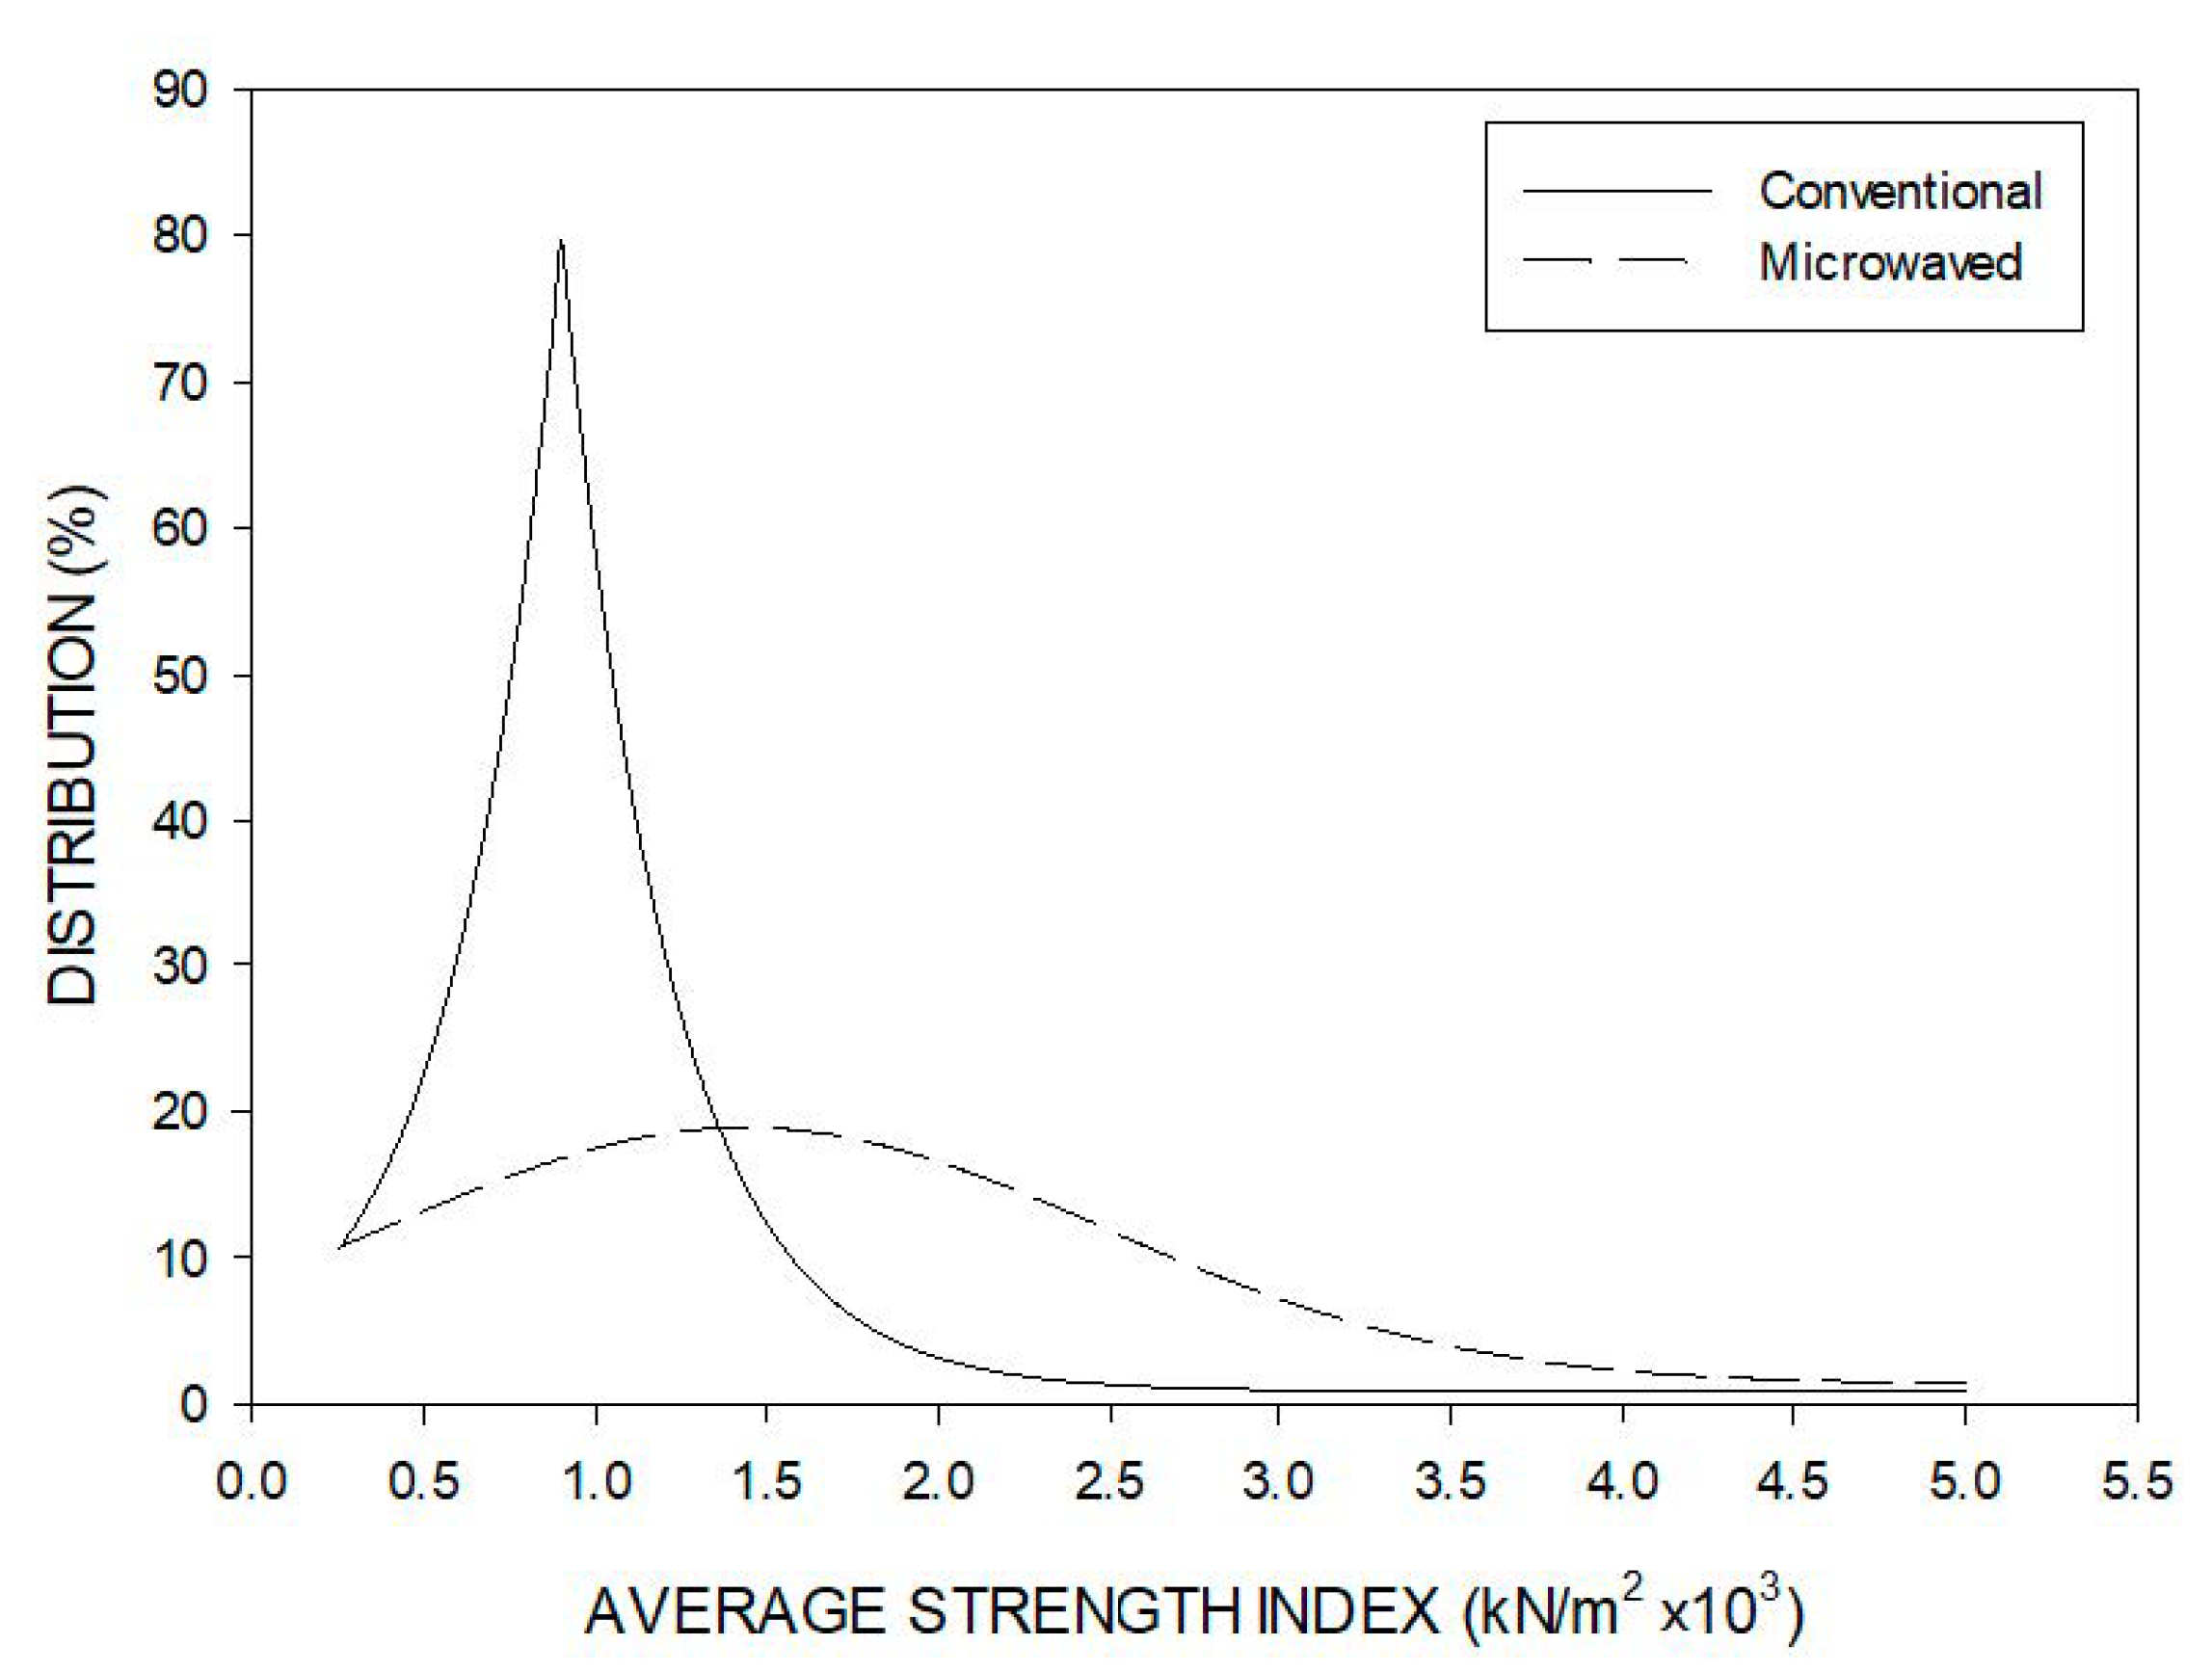
The results are shown in Figure 15 for the conventionally heated and microwaved samples. It can be seen that conventional heating of the bauxite resulted in a significant lowering of the strength index distributions, with a very significant peak in the Gaussian plot at a strength index of about 0.9 and a distribution of 80%. On the other hand, although the Gaussian plot for microwave heating was shifted to lower strength indices in comparison to the as-received material, the indices were higher, and the plot extended across a much wider range than for the conventionally heated bauxite. Again, this reflects the non-uniform heating behavior observed for microwave heating in comparison to conventional heating.
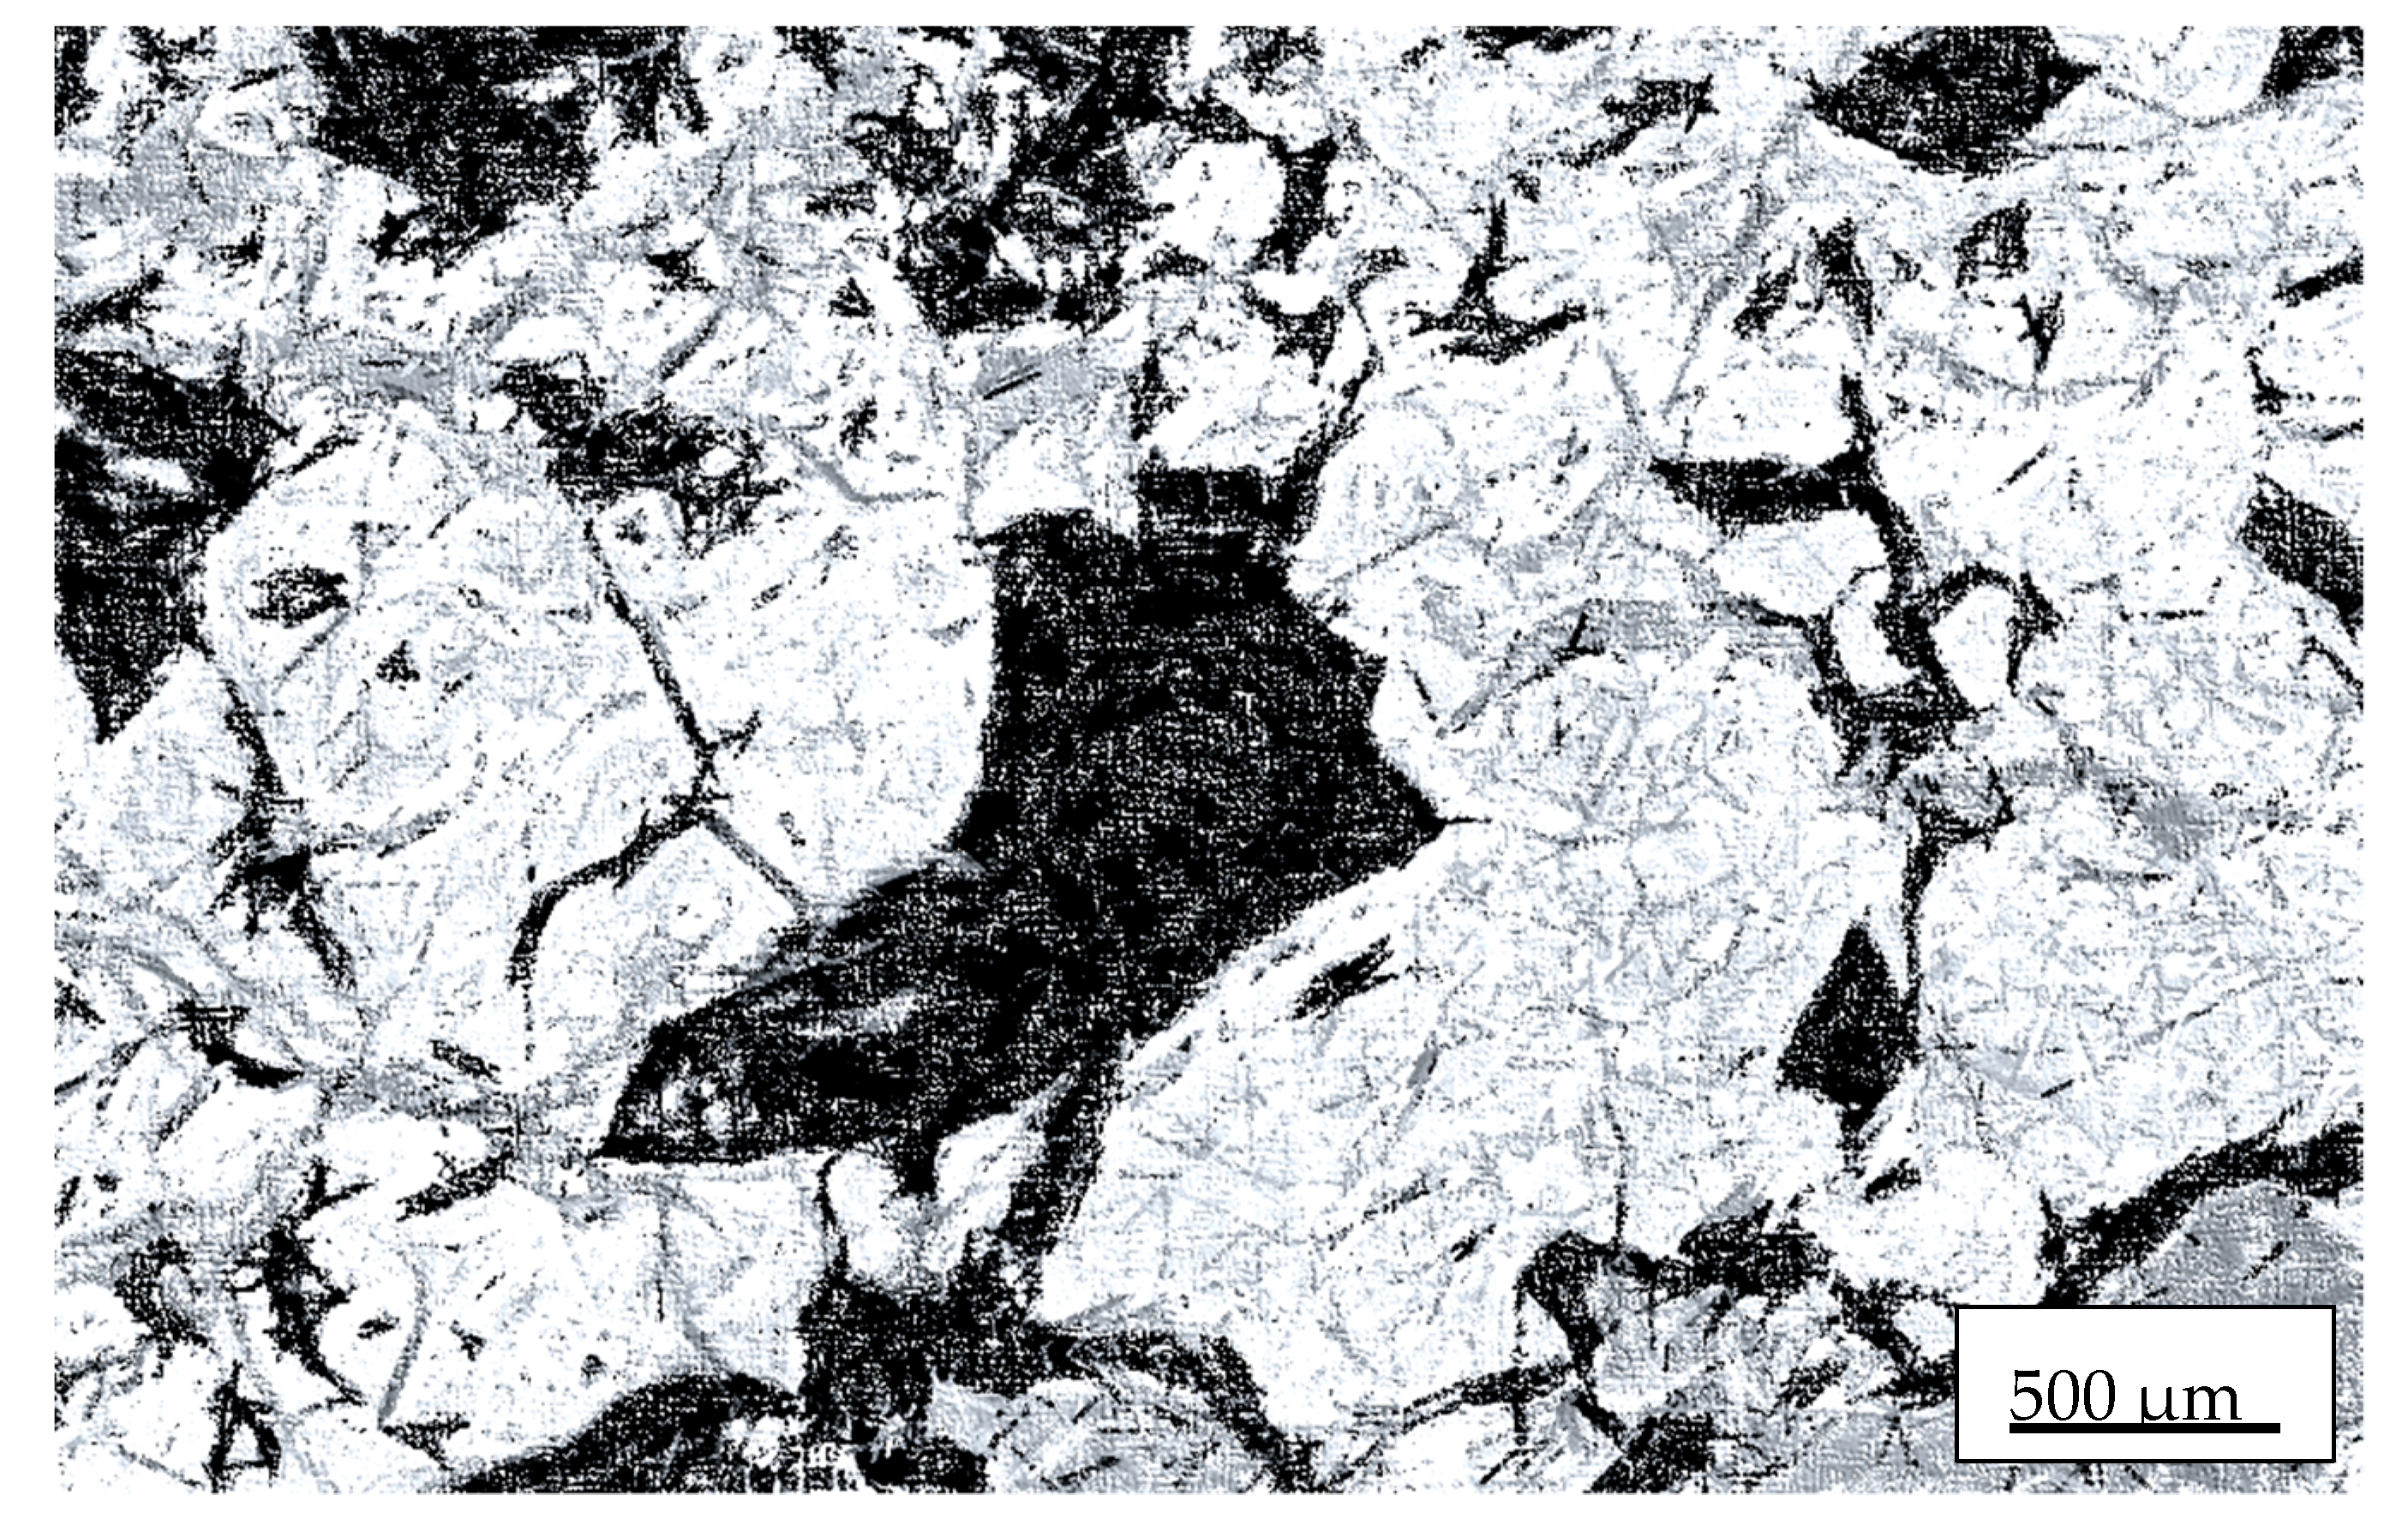
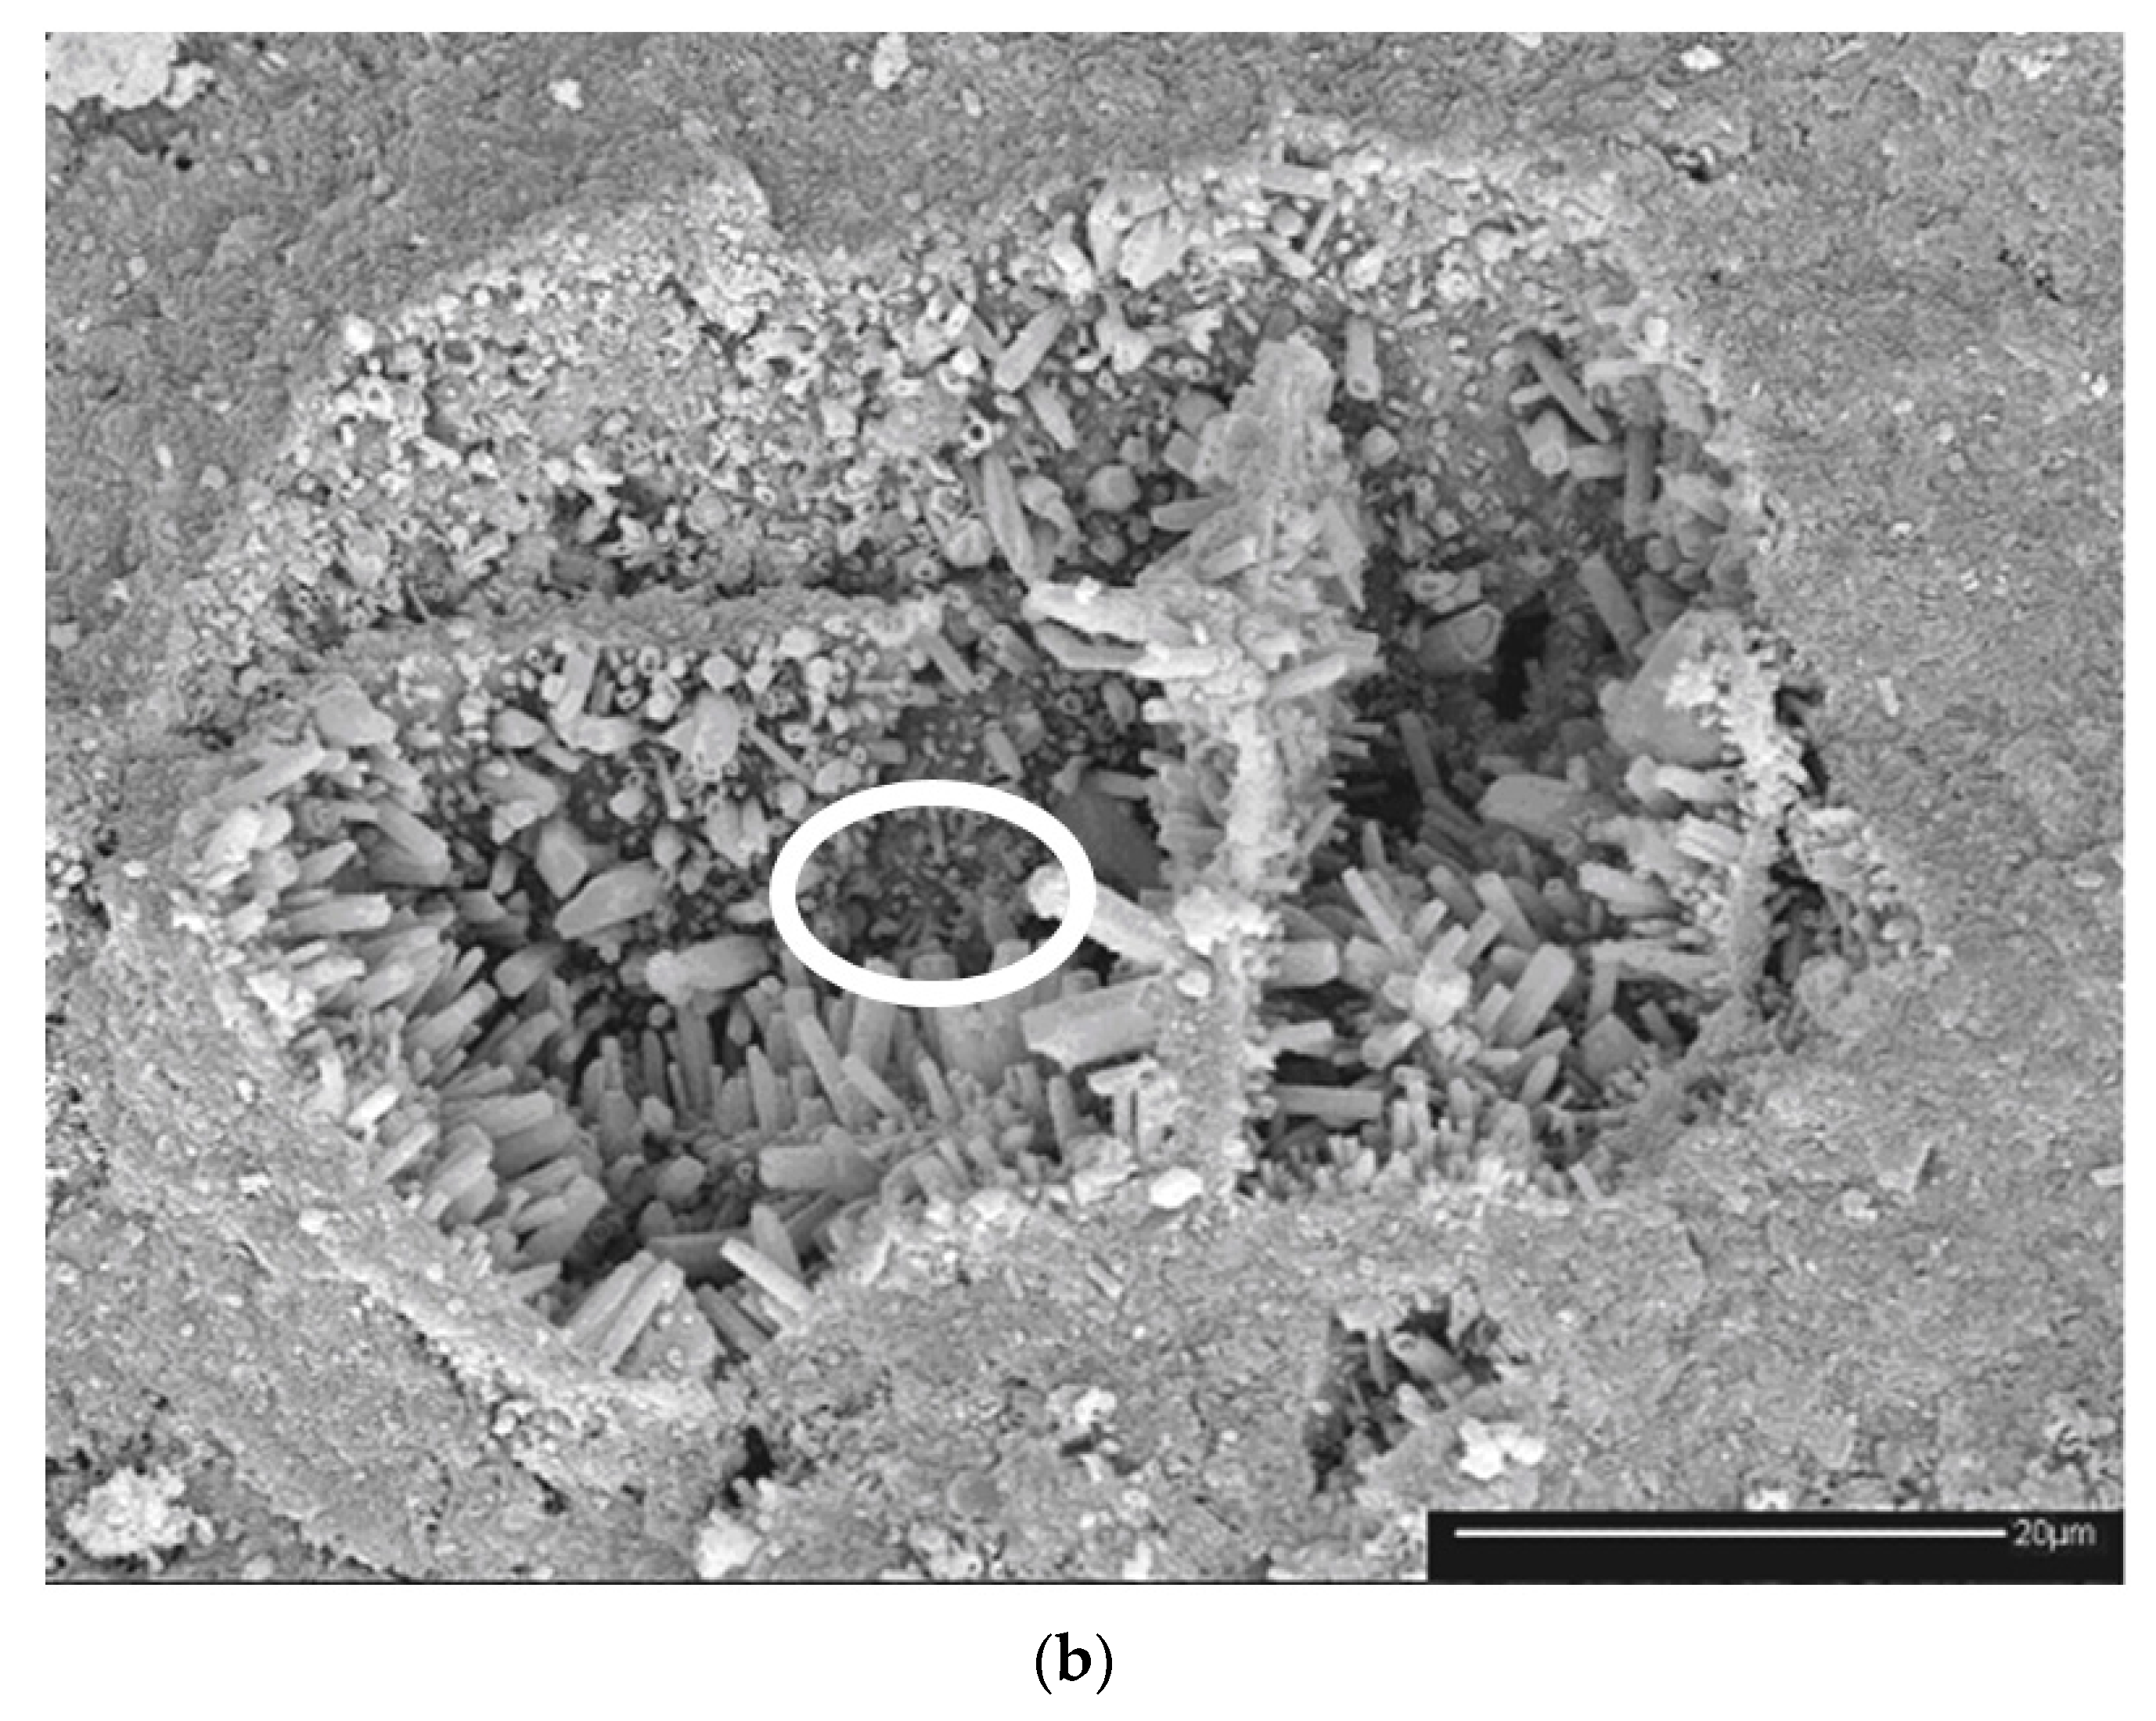
Figure 16 shows the typical microstructure of a microwaved sample of bauxite ore (2). The observed cracks are largely responsible for the decrease in strength.
3.4. Compressive Strength Indices: Effect of Particle Size
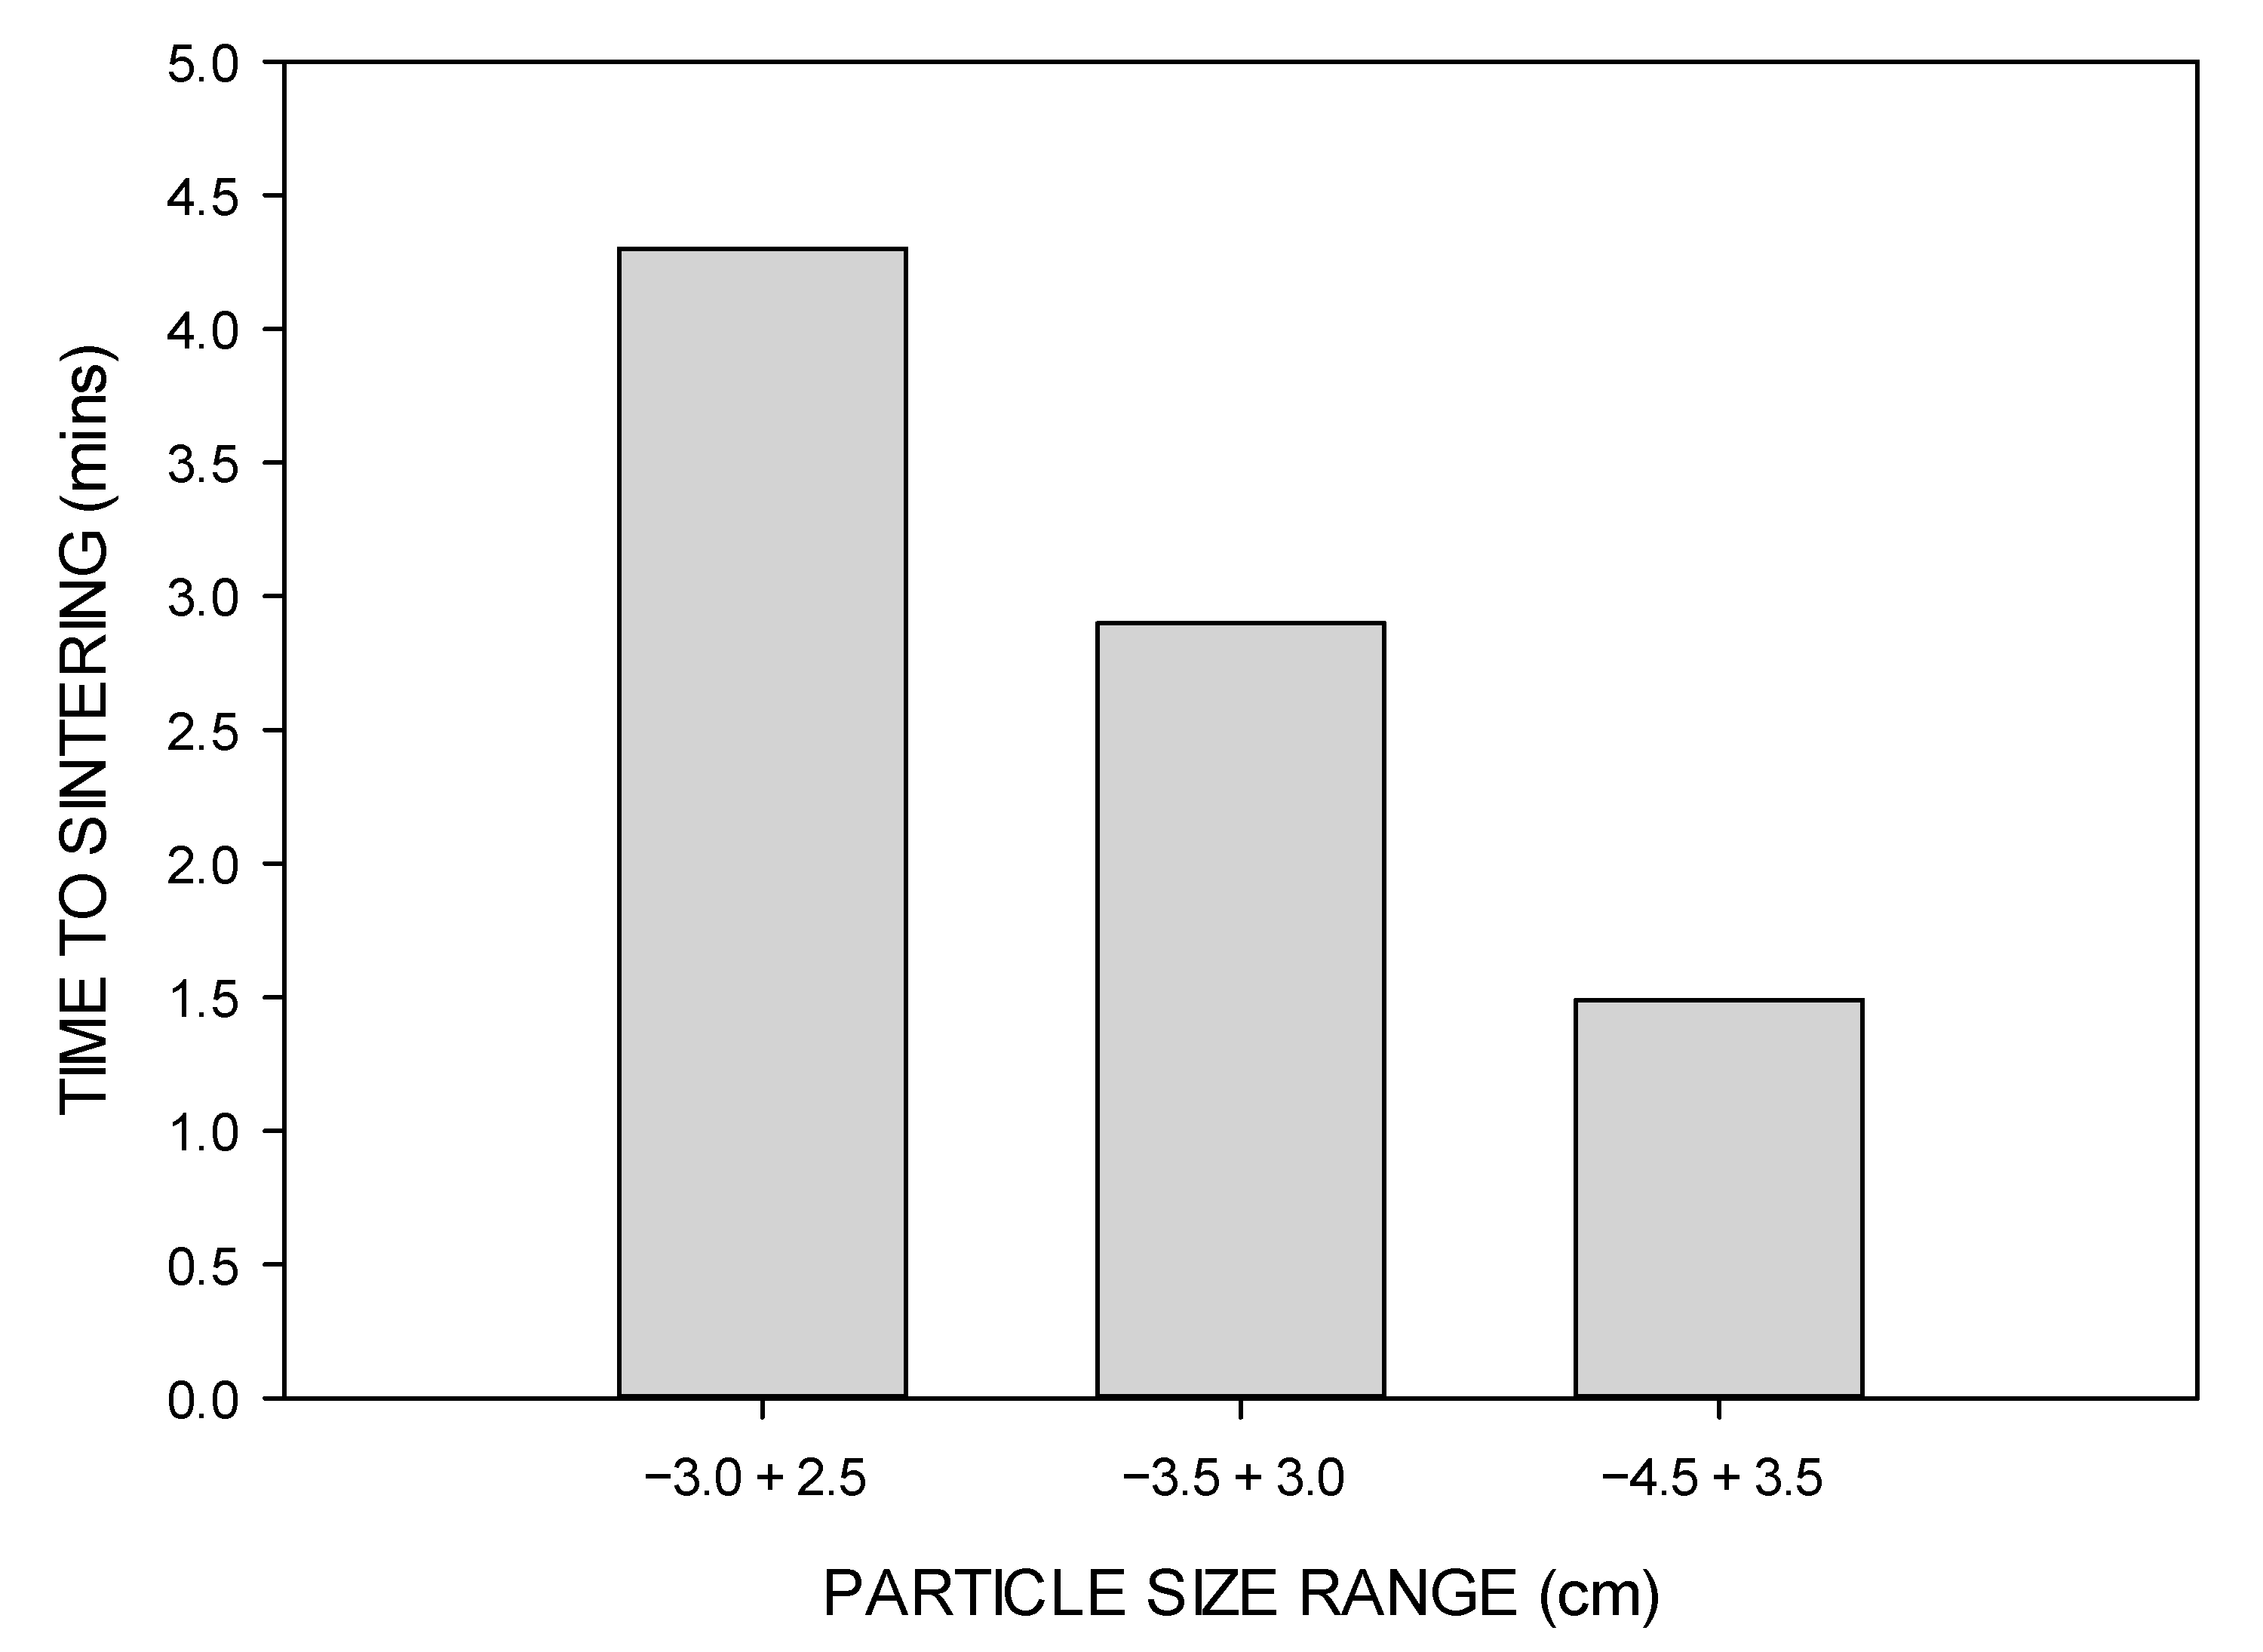
There is considerable controversy regarding the effect of particle size on the microwave heating behaviors of materials. Consequently, heating behavior experiments were conducted on conventionally heated and microwave-heated particle size groups of bauxite (3) as follows: −3.0 + 2.5 cm, −3.5 + 3.0 cm and −4.5 + 4.0 cm. However, as mentioned previously, if sintering occurs in the particles, then this will affect the compressive strength values. Therefore, the microwave heating time for sintering for each size group was determined by increasing the microwaving time until sintering was observed. These results are shown in Figure 17, and it can be seen that the smallest sample size had a time to sintering of 4.30 min, the intermediate size sample had a time of 2.90 min, and the larger sample had a time of 1.49 min. These results demonstrated that the larger-sized bauxite particles heated more rapidly than the smaller-sized particles in the microwave field. All subsequent microwave experiments regarding strength index determination were performed before sintering occurred for each particle size range.
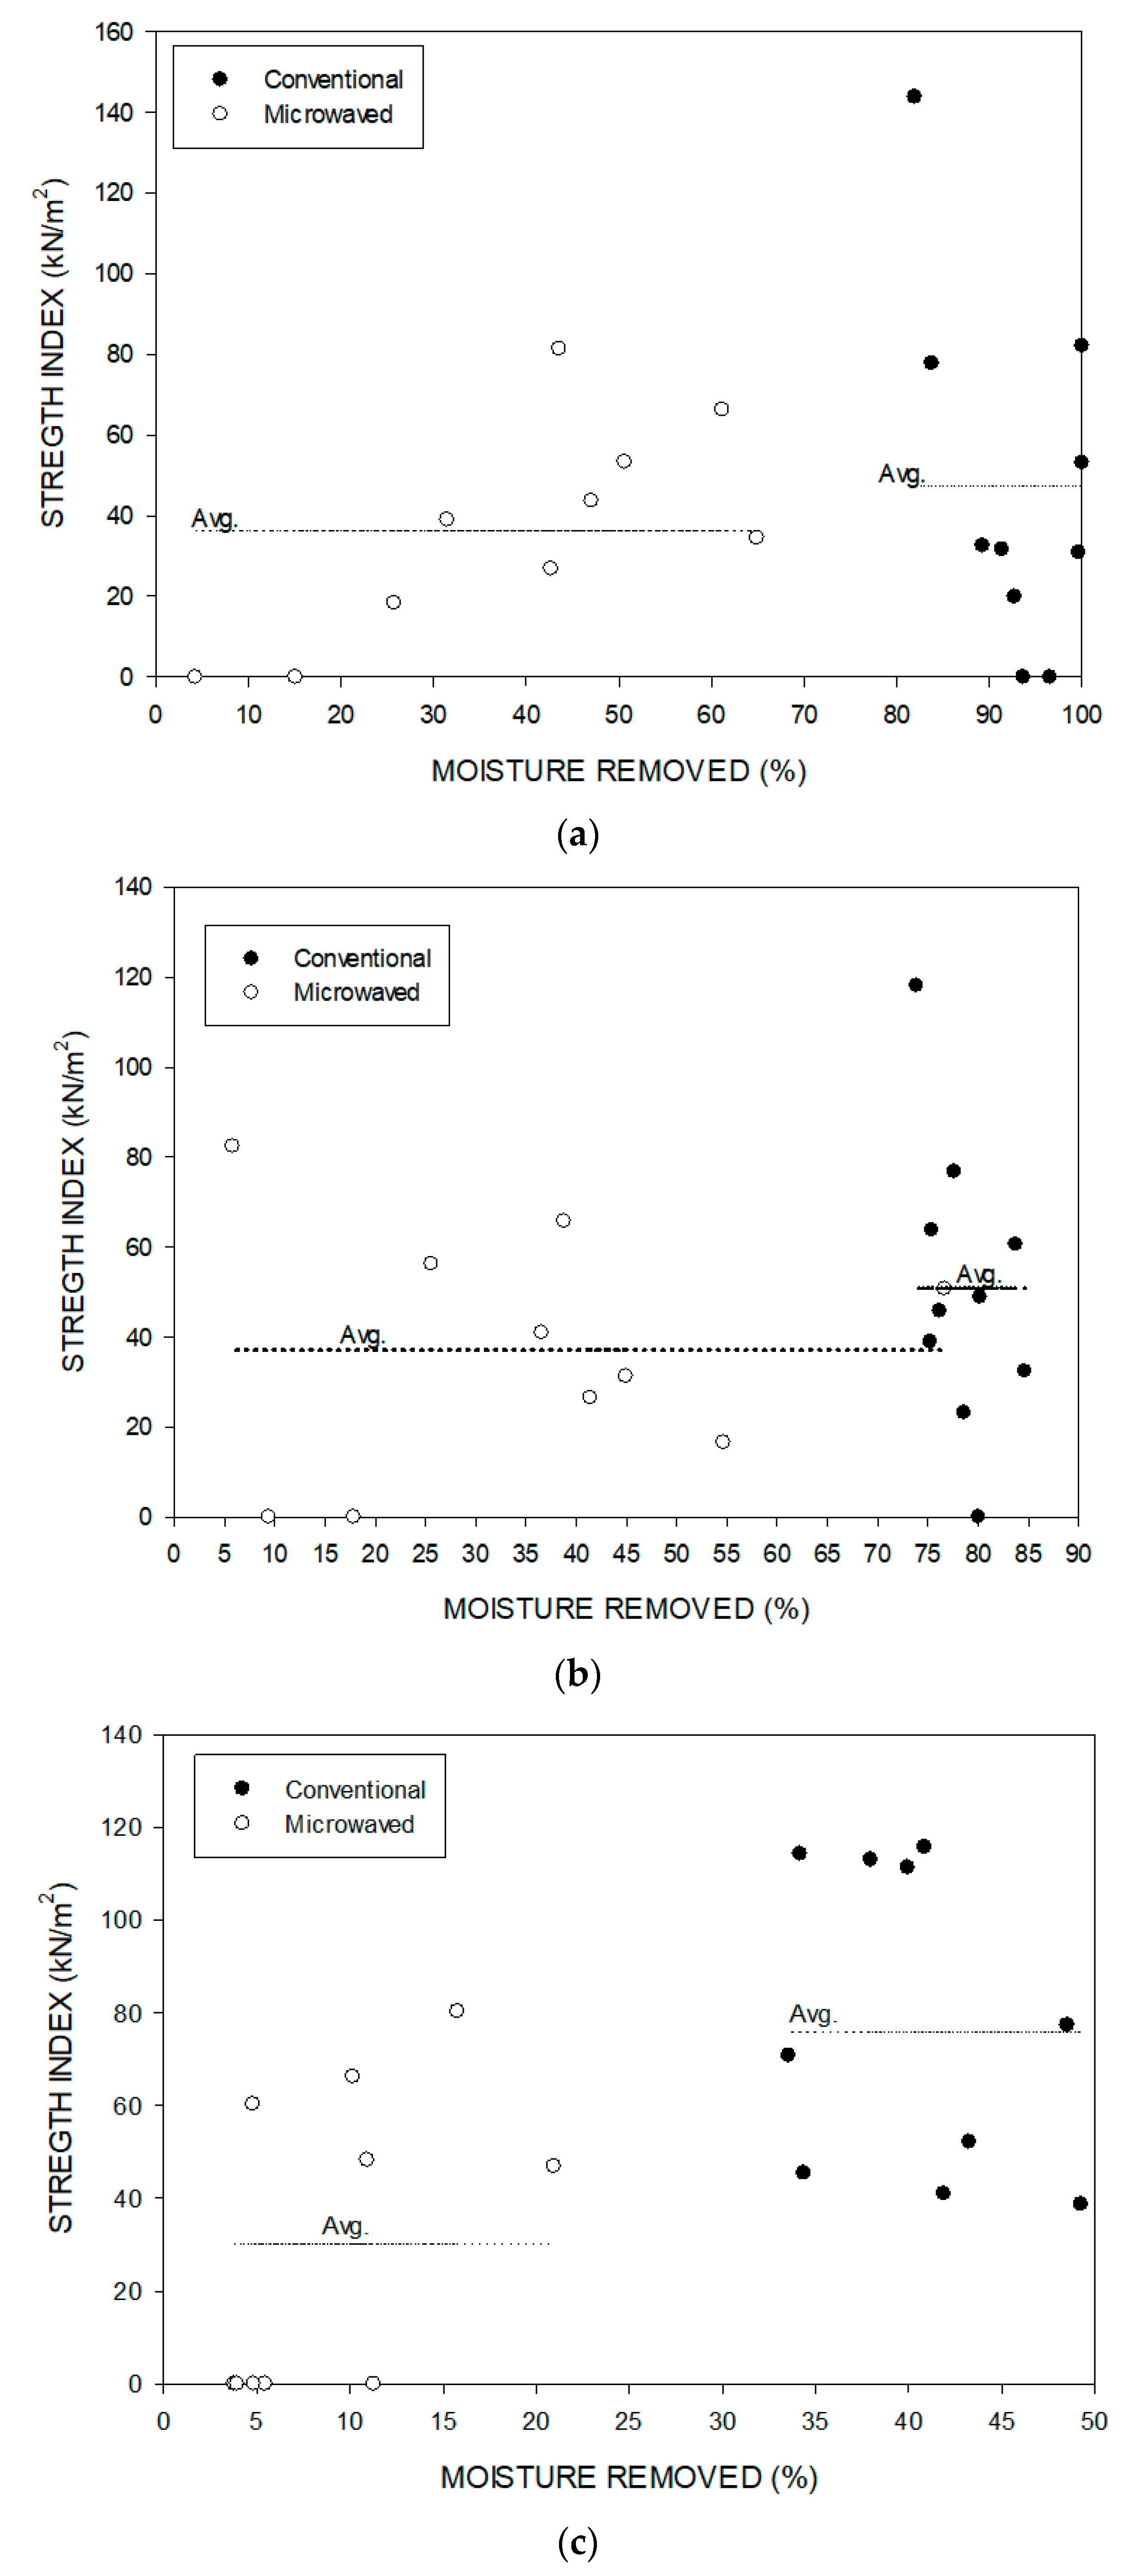
The average strength indices of the three as-received particle size ranges of −3.0 + 2.5 cm, −3.5 + 3.0 cm and −4.5 + 3.5 cm were 102.1 kN/m2, 98.8 kN/m2 and 88.8 kN/m2. It can be seen that the strength index decreased with increasing particle size. Figure 18a–c show the strength indices and the average strength indices as a function of moisture loss for both microwave and conventional heating for the three particle size ranges. It can be seen that, in all cases, there was a significant reduction in the average strength of the particles in comparison to the as-received values, and the reduction in strength was more significant for the microwaved particles than for the conventionally heated samples. Additionally, as mentioned previously, the moisture loss was lower for the microwaved samples than for the conventionally heated samples. This would indicate that the treatment with microwaves resulted in more significant strength reductions, perhaps due to high internal water vapor pressures, which resulted in increased fracturing.
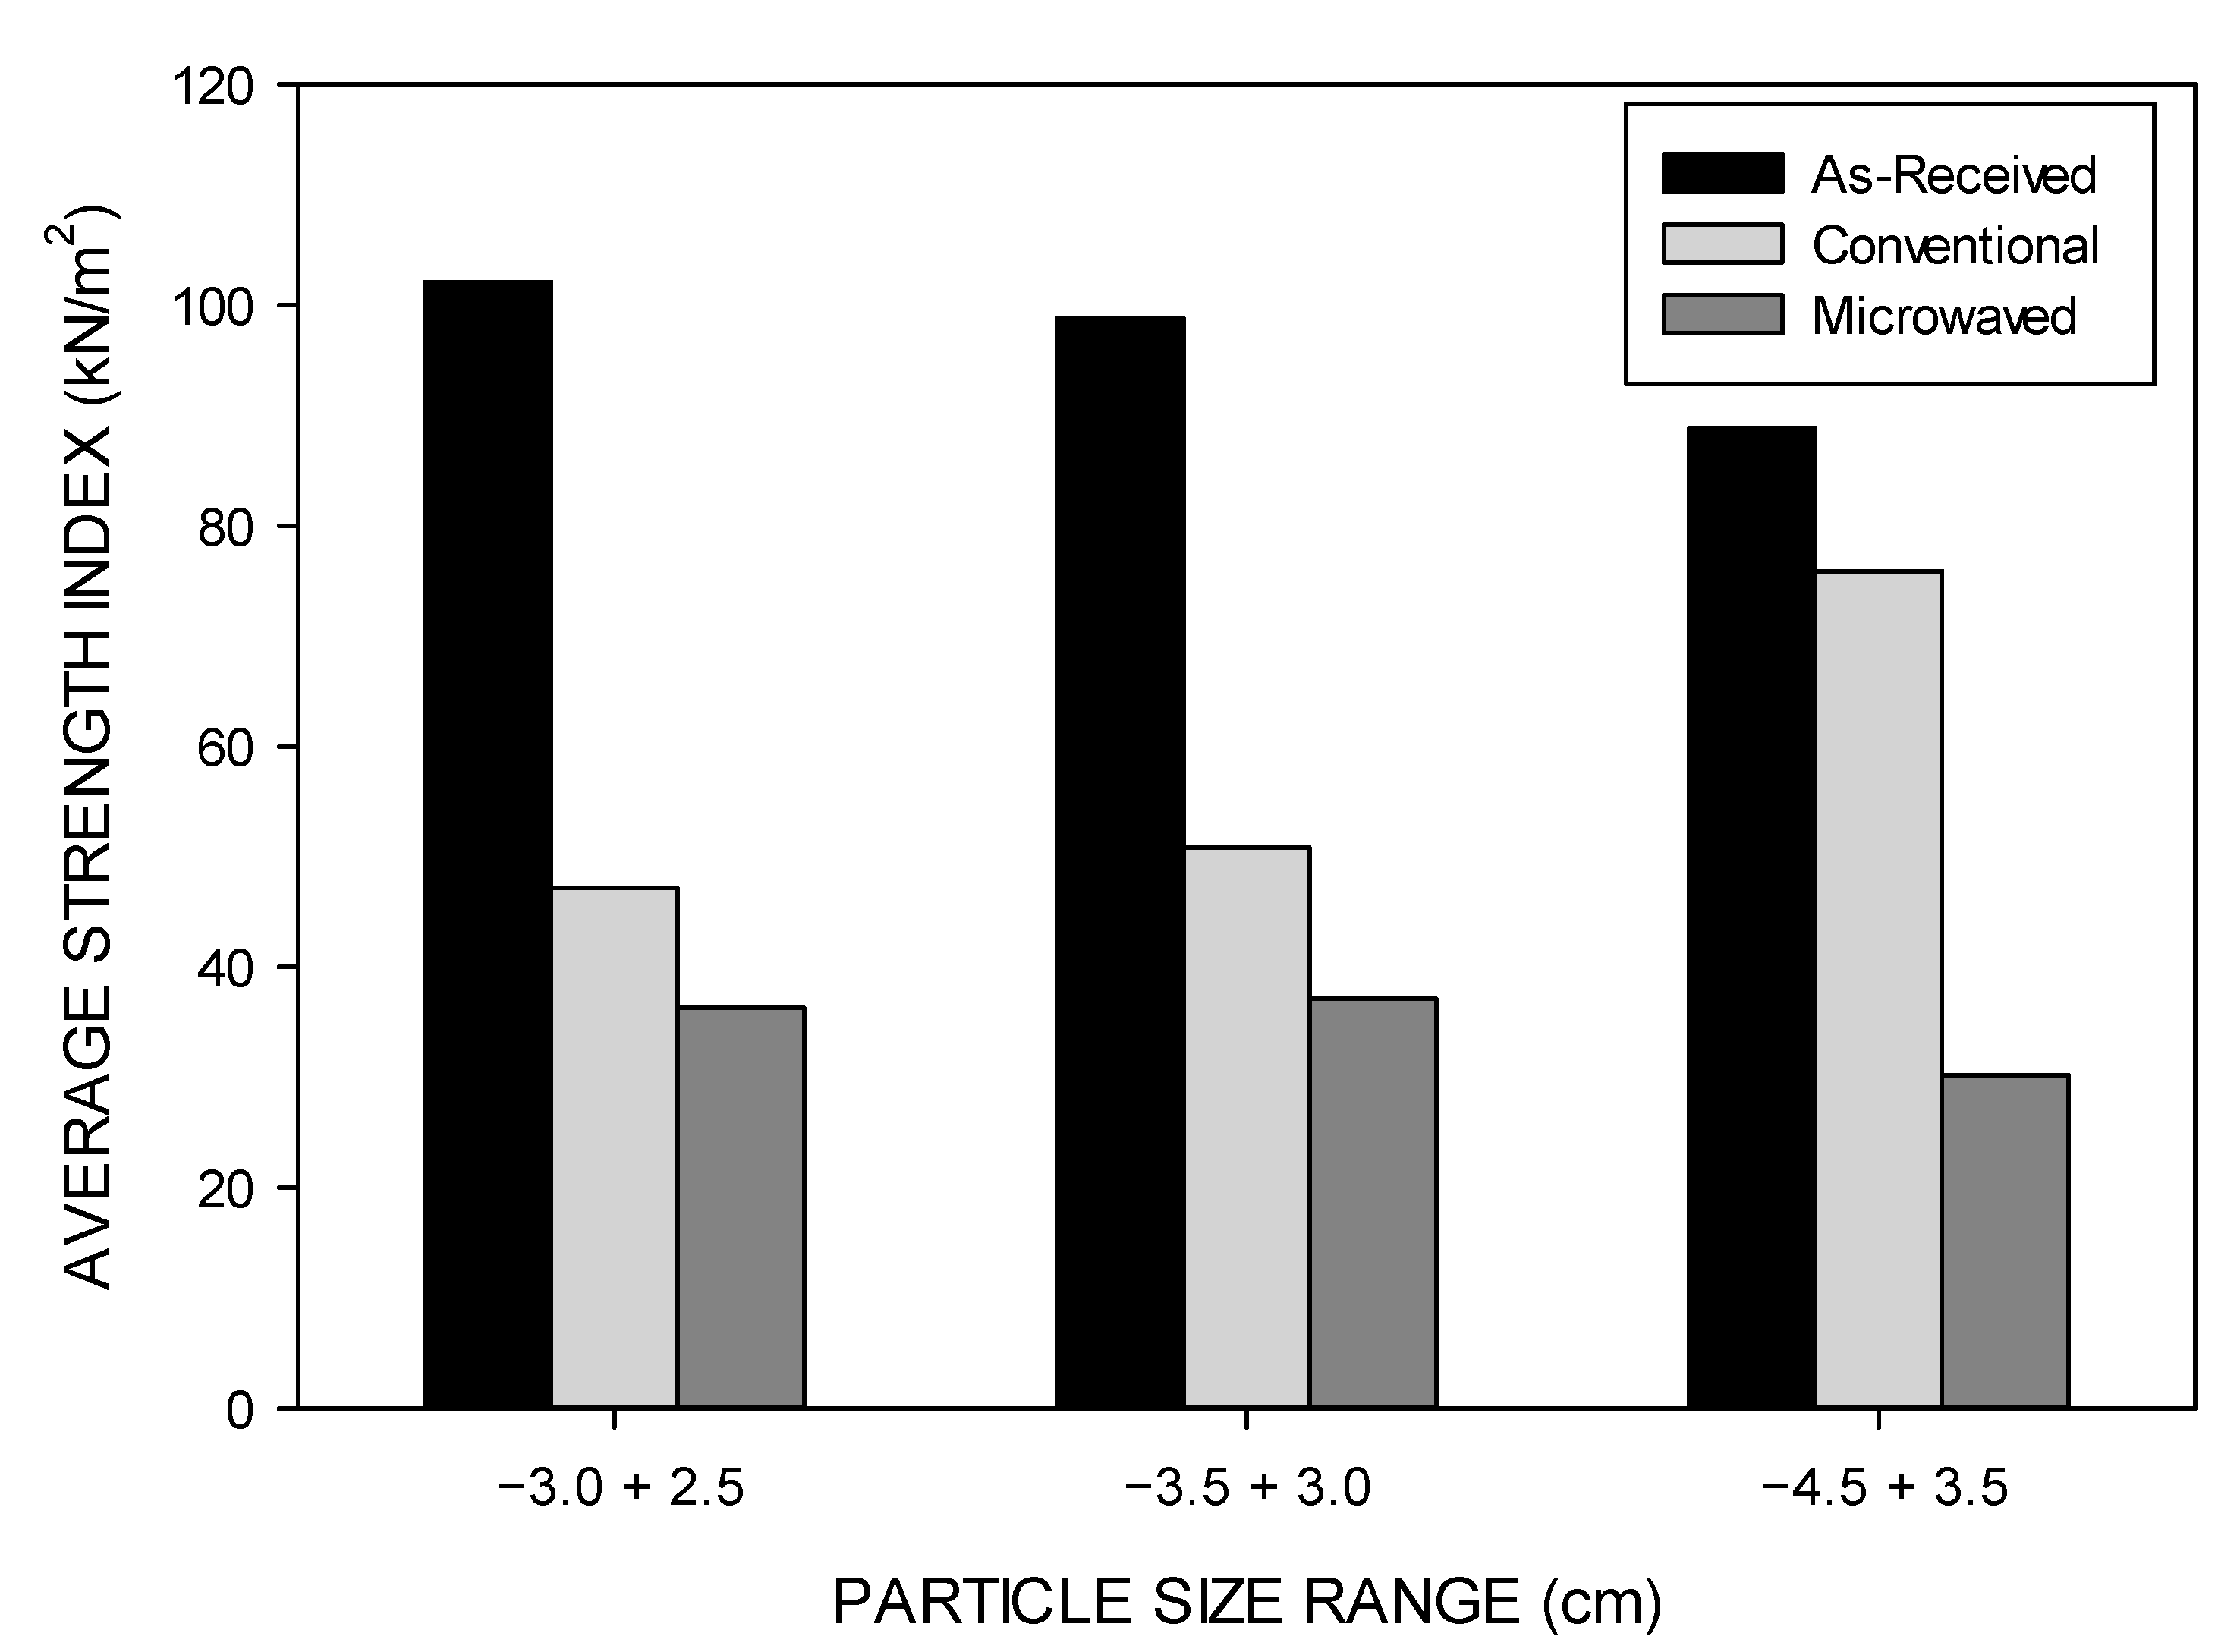
Figure 19 compares the average strength indices for the as-received, conventionally heated and microwaved samples as a function of particle size. For the as-received material, it can be seen that the average strength index decreased with increasing particle size. In contrast, for conventional heating, although the strength index was reduced in comparison to the as-received material, it increased with decreasing particle size. At the large particle size, there was only a small difference between the conventionally heated sample and the as-received sample. On the other hand, the microwaved samples had lower strength indices than the conventionally heated samples, and the strength index decreased with increasing particle size. This reflects the increased microwave absorption of the larger-sized particles.
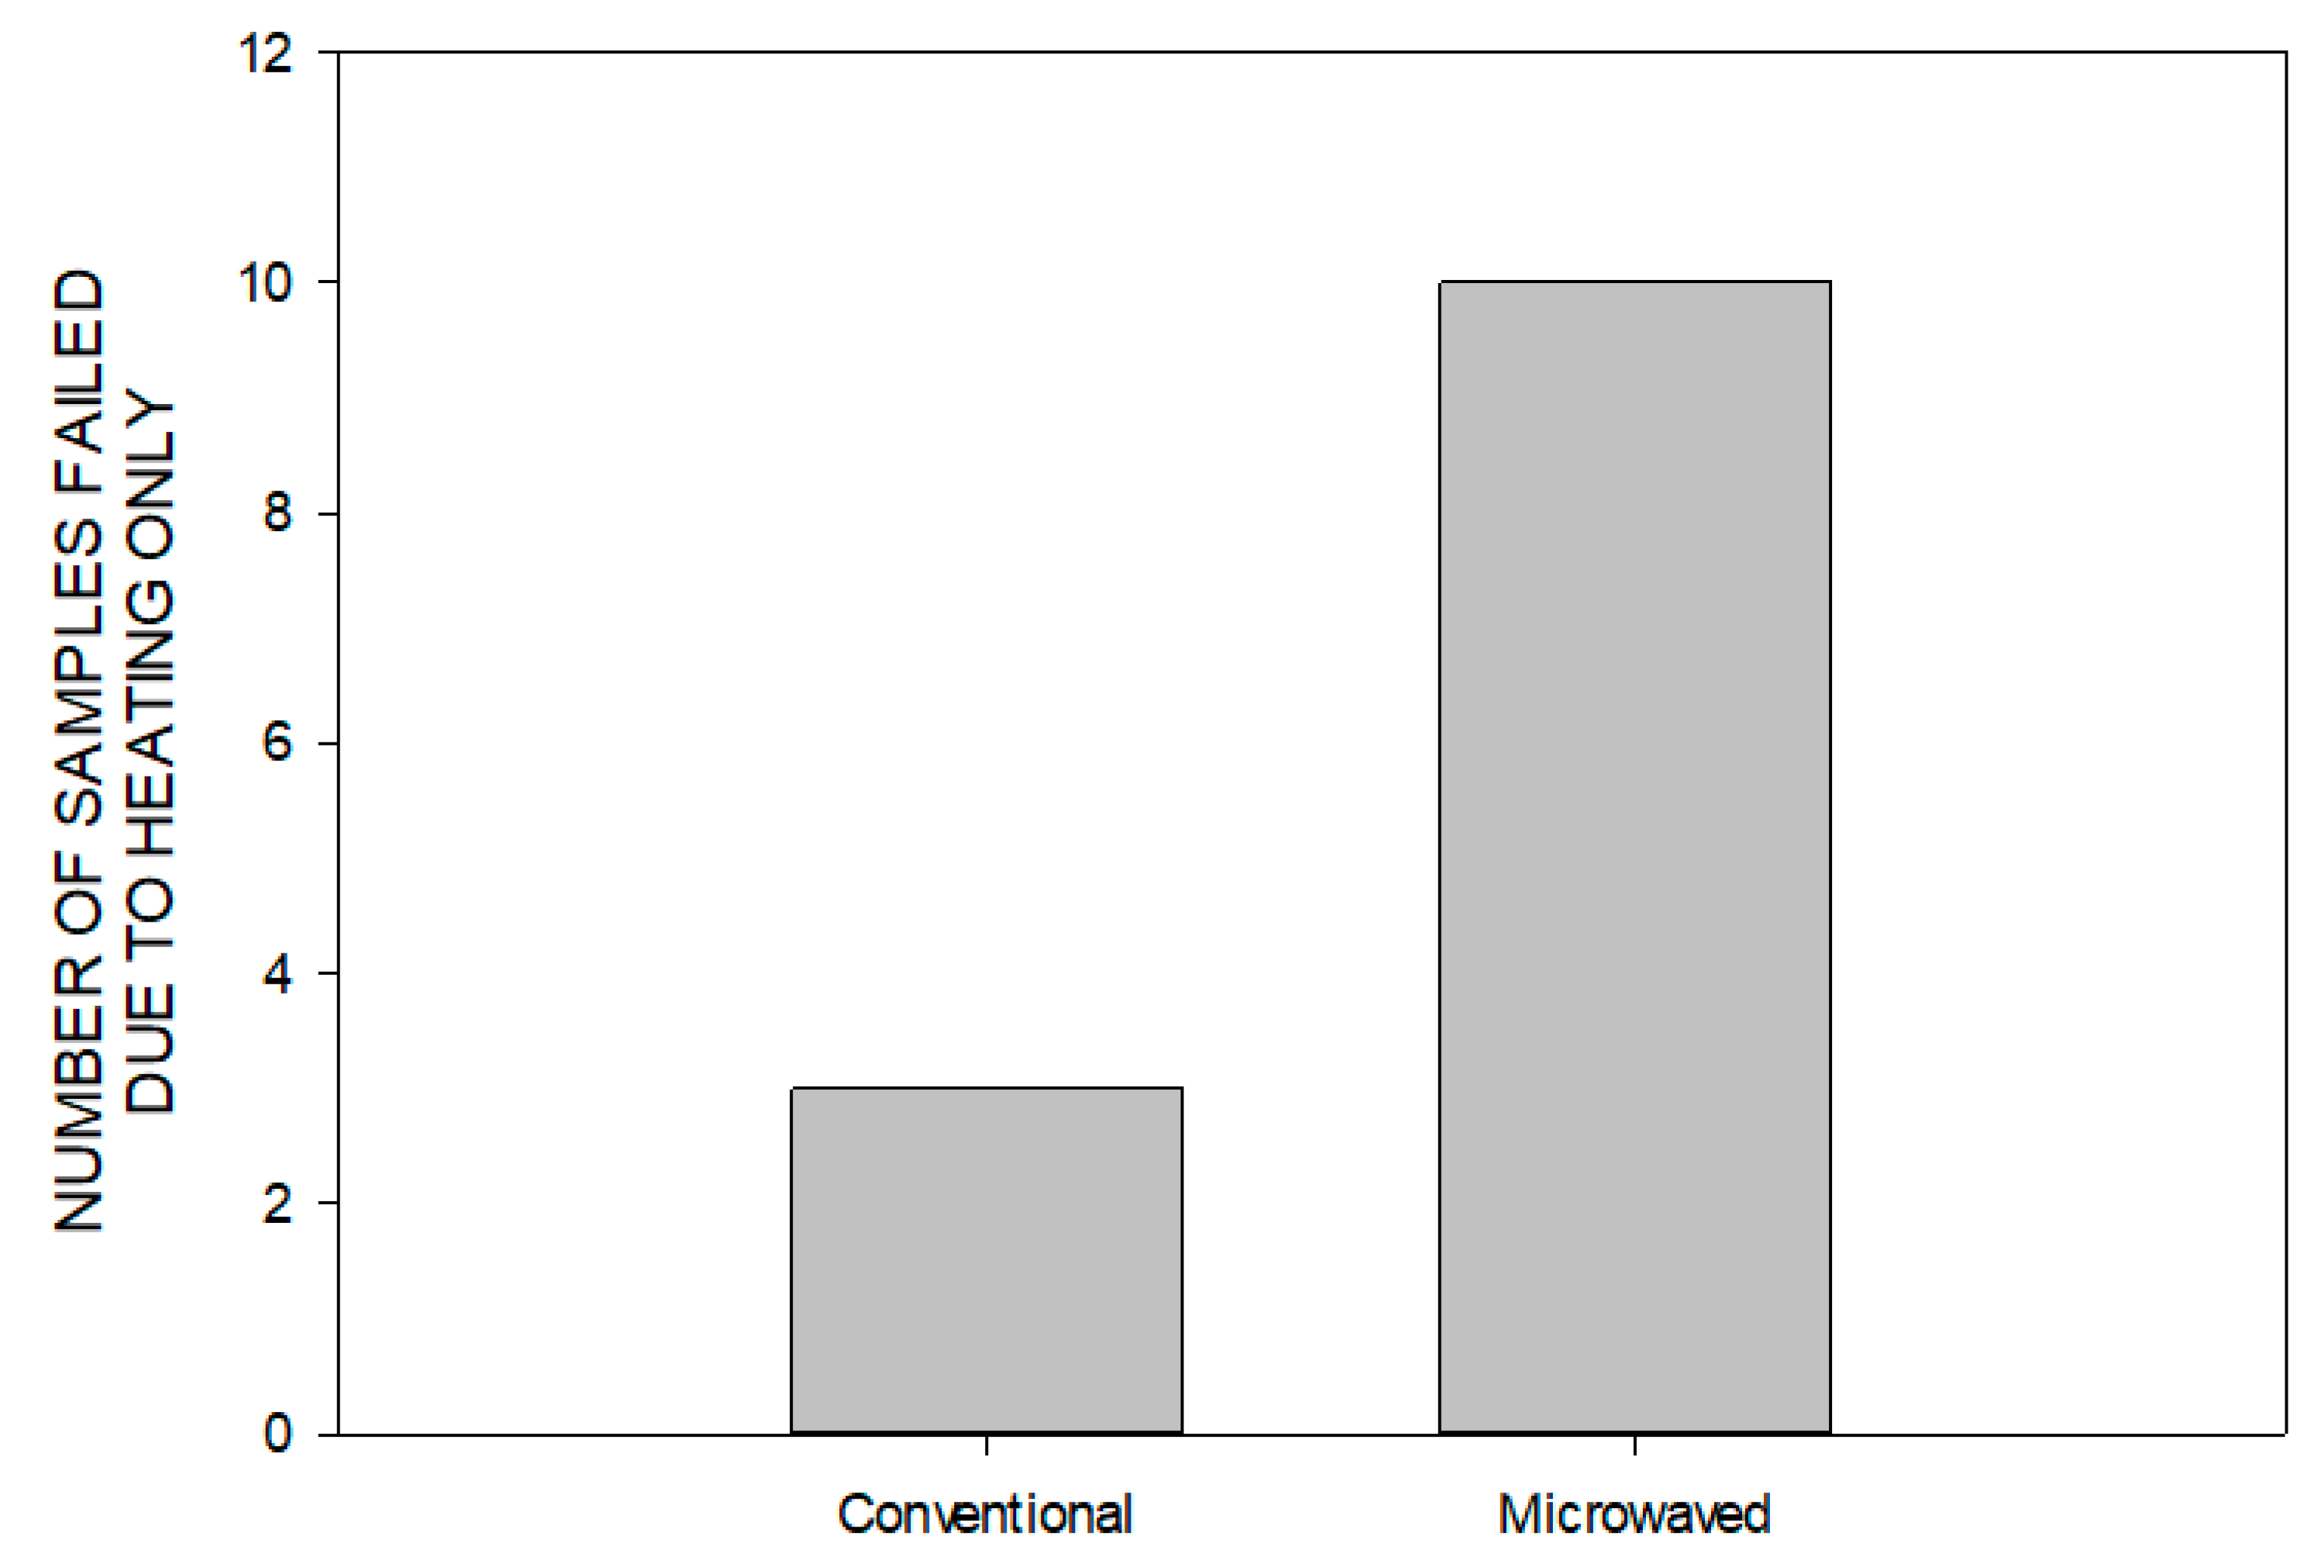
It was observed in the tests that a large number of particles failed as a result of heating only, and thus, the strength index was zero. In this regard, the microwave results are compared to the conventionally heated samples in Figure 20. Here, it can be seen that the number of particles that failed due to heating only was significantly higher for the microwaved samples than for the conventionally heated samples. Additionally, some of the microwaved samples that failed only due to heating occurred at very low moisture removals.
3.5. Energy Consumption Comparison
An important aspect regarding the application of microwaves is the comparison of the energy requirements for microwave heating as compared to conventional heating. Clearly, if the two heating processes are evaluated based on different energy inputs, then the comparison will not be valid. On the laboratory scale, the conventional energy requirements will tend to be excessive, since the conventional furnace has to be brought up to temperature before the samples can be processed. This requires heating a large thermal mass just to heat a small amount of sample. Thus, this severely disadvantages the energy requirements for conventional heating. Additionally, conventional heating would be expected to be more uniform than microwave heating.
The total energy requirement (ET in kWh) for heating consists of two parts as follows:
where ESa (kWh) is the energy required to heat only the sample, and ESurr (kWh) is the energy required to heat the surroundings. For conventional heating, ESa is low relative to ESurr, while for microwave processing, ESurr is low compared to ESa. For the microwave strength index tests, ET was taken to be equal to ESa, and for conventional heating, ET was taken to be equal to ESurr. The specific energy consumption was defined as follows:
where P is the input power in kW, t is the time in hours, and S is the sample mass in kilograms.
ESa = (P × t)/S
In order to compare the energy requirements for microwaving and conventional heating, tests were performed for the same time period of two minutes for the same power input (1200 W) and for a fifty-gram sample. The results for the change in sample mass and the percentage of cracked particles are shown in Table 7. The conditions in microwave heating were 1200 W, and thus, the specific energy consumption for two minutes was 0.8 kWh/kg. For conventional heating, the time in the furnace to reach temperature was 15 min, and this was considered as the total time for heating, and therefore, the energy consumption was 6 kWh/kg. This energy consumption is over seven times higher than the microwave energy consumption. The strength indices for the conventional and microwaved samples were 1.60 × 10³ kN/m2 and 1.36 × 10³ kN/m2, respectively. Assuming linear relationships between the percentage of cracked particles and the energy input and also the strength indices and the energy input, the microwave energy consumption can be adjusted to a value of 1.13 kWh/kg, which is still significantly lower than the value of 6 kWh/kg for conventional heating.
Figure 21a,b show scanning electron micrographs of the fracture surfaces of the bauxite ore samples processed by conventional and microwave heating, respectively. In both cases, energy dispersive X-ray spectroscopy analysis results showed that the highlighted region contained significant amounts of aluminum and some iron. This would indicate that the crystals are mainly aluminum oxide, which formed as a result of the decomposition of gibbsite to boehmite and finally alumina.
4. Conclusions
(1) The decomposition processes of a gibbsite-type bauxite ore were investigated using thermogravimetric analysis (TGA), and the results showed that the decomposition occurred in two stages. Firstly, a small amount of about 1% loosely bonded water was removed up to about 100 °C. From about 175 °C to 300 °C, the mass loss was about 22%, which was greater than that for the decomposition of gibbsite to boehmite. Thus, gibbsite decomposed to boehmite and also to alumina. From about 300 °C up to 400 °C, the remaining more stable boehmite was converted into alumina. At higher temperatures, there was no mass change, indicating that all the water had been removed.
(2) The permitivities of the gibbsite-type bauxite ore were determined. The removal of the free water resulted in a slight increase in the permittivities, and this was followed by a slight decrease up to about 175 °C. Subsequently, the permitivities increased slowly and then more rapidly, reaching a maximum at 290 °C for the real permittivity and 330 °C for the imaginary permittivity. Thereafter, the permitivities dropped rapidly and then more slowly to 500 °C for the real permittivity and 400 °C for the imaginary permittivity. Then, the permitivities increased slowly and then more rapidly with increasing temperature, before leveling off at about 1000 °C. Here, the imaginary permittivity increased more rapidly with temperature due to its dependency on conductivity. The frequency dependency for both permitivities was relatively weak.
(3) Microwave heating behavior studies were performed for the bauxite ore using the single replicate 24 factorial technique in an attempt to obtain a stable microwave dewatering temperature. The major factors considered were: heating time, sample mass, microwave power and sample bulk density. These variables could be ranked in terms of increasing positive influence on the sample temperature as follows: microwave power < sample mass < heating time. In the coded form, bulk density had a negative effect. An attempt was made to utilize the model to predict the conditions for thermal processing of the bauxite at 500 °C. However, the model predicted that thermal runaway would occur, resulting in excessively high temperatures and sintering. Consequently, compressive strength indices were measured below the sintering temperature, unless noted.
(4) In order to delineate the potential decreases in the strength indices with microwave processing, tests were performed on samples of a pisolitic bauxite ore, which were heated in a conventional furnace to various temperatures. From room temperature to 250 °C, there was only a slight decrease in the strength index, with the major decrease occurring over the temperature range from 200 °C to 400 °C. This temperature range corresponded to that observed in the TGA studies for the conversion of gibbsite to boehmite and alumina. At higher temperatures up to 1000 °C, there were only modest decreases in the strength index. Thus, the major decrease in strength could be attributed to the decomposition of gibbsite to alumina.
(5) With microwave processing, strength index decreases approaching those obtainable in conventional heating could be attained at relatively short processing times and high microwave powers. In comparison to conventional heating, the microwave treatment was not uniform, and although some particles were affected by the microwave radiation, others were not. Correspondingly, significant decreases in the strength indices of some particles could be achieved at very low bulk sample moisture removals, indicating that only a fraction of the particles were being selectively microwave treated. The strength index decreased with increasing microwave power, but at high powers, some sintering occurred, which resulted in an increased strength index.
(6) To further understand the effects of microwave radiation, single particle studies were performed for both conventional and microwave heating. For all sizes, the strength indices of the microwaved samples were lower than the conventionally heated samples. These lower strength indices occurred at lower water removals than for the conventionally heated samples. This would indicate that water removal process with microwave heating resulted in high internal water vapor pressures, which resulted in additional weakening. For microwave processing, the strength index decreased with increasing particle size, reflecting the increased microwave absorption. Additionally, some particles failed as a result of thermal processing only, and this effect was more significant for the microwaved samples.
(7) A laboratory-scale energy comparison was made between conventional heating and microwave heating for the same input power, sample mass and strength index reduction. With conventional heating, there was a significant thermal load associated with the requirement to heat the furnace up to the operating temperature. Consequently, heating of the surroundings is more significant than heating of the sample for conventional heating. On the other hand, for microwave processing only, the sample is heated, and very little heat is lost to the surroundings. Consequently, for the laboratory tests reported in this research, the energy requirements for microwave processing were significantly lower than those for conventional heating.
Author Contributions
Conceptualization, C.P. and T.L.; methodology, T.L.; software, T.L; validation, T.L.; formal analysis, C.P. and T.L.; investigation, T.L.; resources, C.P.; data curation, T.L.; writing—original draft preparation, T.L.; writing—review and editing, C.P.; visualization, T.L.; supervision, C.P.; project administration, C.P.; funding acquisition, C.P. All authors have read and agreed to the published version of the manuscript.
Funding
This research was funded by the Natural Sciences and Engineering Research Council of Canada grant number NSERC RGPIN-2019-04698.
Data Availability Statement
The results presented in this paper are mainly based on the M.A.Sc. thesis of T. Lu entitled “Microwave Pretreatment of Bauxite”, Department of Mining Engineering, Queen’s University, Kingston, Ontario, Canada.
Acknowledgments
The authors acknowledge the Natural Sciences and Engineering Research Council of Canada (NSERC) for their support of this research.
Conflicts of Interest
The authors declare no conflict of interest.
References
- Andrews, H.W. Use and specifications of bauxite, In Bauxite, Proceedings of the Bauxite Symposium, Los Angeles, CA, USA, 27 February–1 March 1984; Jacob, L., Jr., Ed.; The Society for Mining, Metallurgy and Exploration: Englewood, CO, USA, 1984; pp. 49–66. [Google Scholar]
- Authier-Martin, M.; Forte, G.; Ostap, S.; See, J. The mineralogy of bauxite for producing smelter-grade alumina. JOM 2001, 53, 36–40. [Google Scholar] [CrossRef]
- Beretka, J.; Ridge, M.J. Dehydration products of aluminum hydroxides. J. Chem. Soc. A Inorg. Phys. Theor. 1967, 2106–2109. [Google Scholar] [CrossRef]
- Ingram-Jones, V.J.; Slade, R.C.T.; Davies, T.W.; Southern, J.C.; Salvador, S. Dehydroxylation sequences of gibbsite and boehmite: Study of differences between soak and flash calcination and of particle-size effects. J. Mater. Chem. 1996, 6, 73–79. [Google Scholar] [CrossRef]
- Digne, M.; Sautet, P.; Raybaud, P.; Toulhoat, H.; Artacho, E. Structure and stability of aluminum hydroxides: A theoretical study. J. Phys. Chem. B. 2002, 106, 5155–5162. [Google Scholar] [CrossRef]
- Li, W.; Numako, C.; Koto, K.; Toshihiro, M.; Nakabayashi, I. A new intermediate phase in the early stage of dehydration of gibbsite. Int. J. Mod. Phys. B 2003, 17, l464–l1469. [Google Scholar] [CrossRef]
- Kloprogge, J.T.; Ruan, H.D.; Frost, R.L. Thermal decomposition of bauxite minerals: Infrared emission spectroscopy of gibbsite, boehmite and diaspore. J. Mater. Sci. 2002, 37, 1121–1129. [Google Scholar] [CrossRef] [Green Version]
- Whittington, B.; Ilievski, D. Determination of the gibbsite dehydration reaction pathway at conditions relevant to Bayer refineries. Chem. Eng. J. 2004, 98, 89–97. [Google Scholar] [CrossRef]
- de Aquino, T.F.; Riella, H.G.; Bernardin, A.M. Mineralogical and physical-chemical characterization of a bauxite ore from Lages, Santa Catarina, Brazil, for Refractory Production. Miner. Process. Extr. Metall. Rev. 2011, 32, 137–149. [Google Scholar] [CrossRef]
- Silva, F.A.N.G.; Sampaio, J.A.; Garrido, F.M.S.; Medeiros, M.E. Study on the characterization of marginal bauxite from Para/Brazil. In Light Metals 2011; The Minerals, Metals and Materials Society (TMS); Lindsay, S.J., Ed.; Springer International Publishing: Cham, Switzerland, 2011; pp. 13–18. [Google Scholar]
- Earnest, C.M.; Gann, K.; Strong, B. Improved quantification of gibbsite in bauxite ores by thermogravimetric methods (TGA and DTG). Adv. Appl. Chem. Biochem. 2018, 1, 9–17. [Google Scholar]
- Earnest, C.M. Thermal Analysis in the alumina industry. Part 1: Measurements, observations and instrumentation. Adv. Appl. Chem. Biochem. 2019, 1, 40–54. [Google Scholar]
- MacKenzie, R.C.; Berggren, G. Oxides and hydroxides of higher valency elements. In Differential Thermal Analysis; MacKenzie, R.D., Ed.; Academic Press: New York, NY, USA, 1970; Volume 1, pp. 279–286. [Google Scholar]
- Sanders, S.R. Determination of alumina and iron phases in bauxite by DTG analysis. AIME Proceeding 1981, 32, 29–43. [Google Scholar]
- Taylor, R.M. The aluminum oxide group of minerals. In Chemistry of Clays and Clay Minerals, Mineralogical Society Monograph; Newman, A.C.D., Ed.; Wiley Interscience: New York, NY, USA, 1987; pp. 161–169. [Google Scholar]
- Peden, K.W. Bauxite Mineral Analysis, Senior Thesis; Berry College: Mount Berry, GA, USA, 1983. [Google Scholar]
- Freund, F. Dehydration of gibbsite and the formation of boehmite. Ber. Dtsch. Keram. Ges. 1967, 44, 141–147. [Google Scholar]
- Ford, J.D.; Pei, D.C.T. High temperature chemical processing via microwave absorption. J. Microw. Power 1967, 2, 61–64. [Google Scholar] [CrossRef]
- Chen, T.T.; Dutrizac, J.E.; Haque, K.E.; Wyslouzil, W.; Kashyap, S. The relative transparency of minerals to microwave radiation. Can. Metall. Q. 1984, 23, 349–351. [Google Scholar] [CrossRef]
- Atomic Energy of Canada Limited Research Company and Voss Associates Engineering Ltd. Microwaves and Minerals: I. Technology Review and II. In Tests of Ontario’s Minerals; Ontario Ministry of Northern Development and Mines: Ontario, ON, Canada, 1990; pp. 1–77. [Google Scholar]
- Sabelström, N.; Hayashi, M.; Watanabe, T.; Nagata, K. Observation of localized heating phenomena during microwave heating of mixed powders using in situ x-ray diffraction technique. J. Appl. Phys. 2014, 116, 164902. [Google Scholar] [CrossRef]
- Kingman, S.W.; Rowson, N.A. Microwave treatment of minerals-A review. Miner. Eng. 1988, 11, 1081–1087. [Google Scholar] [CrossRef]
- Lova, M.; Znamenackova, I.; Zubrik, A.; Kovacova, M.; Dolinska, S. The application of microwave energy in mineral processing-A review. Acta Montan. Slovaka Roc. 2011, 16, 137–148. [Google Scholar]
- Lu, G.; Zhou, J.; Li, Y.; Zhang, X.; Gao, W. The influence of minerals on the mechanism of microwave-induced fracturing of rocks. J. Appl. Geophys. 2020, 180, 104123. [Google Scholar] [CrossRef]
- Teimoori, K.; Hassani, F. Twenty years of experimental and numerical studies on microwave-assisted breakage of rocks and minerals—A review. arXiv 2020, arXiv:2011.14624. [Google Scholar]
- Pressacco, M.; Kanga, J.J.J.; Saksala, T. Numerical modelling of microwave heating assisted rock fracture. Rock Mech. Rock Eng. 2022, 55, 481–503. [Google Scholar] [CrossRef]
- Kingman, S.; Jackson, K.; Bradshaw, S.; Greenwood, R. An investigation into the influence of microwave treatment on mineral ore comminution. Powder Technol. 2004, 146, 176–184. [Google Scholar] [CrossRef]
- Kingman, S.W.; Jackson, K.; Cumbane, A.; Bradshaw, S.M.; Rowson, N.; Greenwood, R. Recent developments in microwave assisted comminution. Int. J. Miner. Process. 2004, 74, 71–83. [Google Scholar] [CrossRef]
- Kumar, P.; Sahoo, B.K.; De, S.; Kar, D.D.; Chakraborty, S.; Meikap, B.K. Iron ore grindability improvement by microwave pre-treatment. J. Ind. Eng. Chem. 2010, 16, 805–812. [Google Scholar] [CrossRef]
- Batchelor, A.R.; Jones, D.A.; Plint, S.; Kingman, S.W. Increasing the grind size for effective liberation and flotation of a porphyry copper ore by microwave treatment. Miner. Eng. 2016, 94, 61–75. [Google Scholar] [CrossRef]
- Bobicki, E.R.; Liu, Q.; Xu, Z. Microwave treatment of ultramafic nickel ores: Heating behavior, mineralogy, and comminution effects. Minerals 2018, 8, 524. [Google Scholar] [CrossRef] [Green Version]
- Wills, B.A.; Parker, R.H.; Binns, D.G. Thermally assisted liberation of cassiterite. Min. Metall. Explor. 1987, 4, 94–96. [Google Scholar] [CrossRef]
- Kingman, S.W.; Vorster, W.; Rowson, N.A. The influence of mineralogy on microwave assisted grinding. Miner. Eng. 2000, 13, 313–327. [Google Scholar] [CrossRef]
- Orumwense, O.A.; Negeri, T.; Lastra, R. Effect of microwave pretreatment on the liberation characteristics of a massive sulfide ore. Miner. Metall. Process. 2004, 21, 77–85. [Google Scholar] [CrossRef]
- Peinsitt, T.; Kuchar, F.; Hartlieb, P.; Moser, P.; Kargl, H.; Restner, U.; Sifferlinger, N. Microwave heating of dry and water saturated basalt, granite and sandstone. Int. J. Miner. Eng. 2010, 2, 18. [Google Scholar] [CrossRef]
- Lester, E.; Kingman, S. Effect of microwave heating on the physical and petrographic characteristics of a U.K. coal. Energy Fuels 2004, 18, 140–147. [Google Scholar] [CrossRef]
- Lester, E.; Kingman, S.; Dodds, C. Increased coal grindability as a result of microwave pretreatment at economic energy inputs. Fuel 2005, 84, 423–427. [Google Scholar] [CrossRef]
- Yao, J.; Zhang, J.; Zhang, X.; Guan, W. Effects of microwave heating paths on pores and cracks in bituminous coal. ACS Omega 2021, 6, 24493–24501. [Google Scholar] [CrossRef] [PubMed]
- Huang, J.; Hu, G.; Xu, G.; Nie, B.; Yang, N.; Xu, J. The development of microstructure of coal by microwave irradiation stimulation. J. Nat. Gas Sci. Eng. 2019, 66, 86–95. [Google Scholar] [CrossRef]
- Hutcheon, R.M.; De Jong, M.S.; Adams, F.P.; Lucuta, P.G.; McGregor, J.E.; Bahen, L. RF and microwave dielectric measurement to 1400 °C and dielectric loss mechanisms. Volume 269: Symposium L—Microwave Processing of Materials III. MRS Online Proc. Libr. (OPL) 1992, 269, 541–551. [Google Scholar] [CrossRef]
- Hutcheon, R.M.; Mouris, J.; Pickles, C.A.; Hayward, P. Scanning dielectric analysis: A tool for materials studies. In Proceedings of the 38th Annual Microwave Symposium, Toronto, ON, Canada, 14–16 July 2004; pp. 15–19. [Google Scholar]
- Broch, E.; Franklin, J.A. The point-load strength test. Int. J. Rock Mech. Min. Sci. 1972, 9, 669–697. [Google Scholar] [CrossRef]
Figure 1.
Scanning electron microscope image of the fractured surface of an as-received bauxite (2) particle (×300). The highlighted area was analyzed by energy dispersive X-ray spectroscopy (EDS) and consisted of mainly aluminum with some iron.
Figure 1.
Scanning electron microscope image of the fractured surface of an as-received bauxite (2) particle (×300). The highlighted area was analyzed by energy dispersive X-ray spectroscopy (EDS) and consisted of mainly aluminum with some iron.

Figure 2.
Particle size distribution of bauxite (1), which was used in the TGA, permittivity and heating behavior studies.
Figure 2.
Particle size distribution of bauxite (1), which was used in the TGA, permittivity and heating behavior studies.

Figure 3.
Microwave system.

Figure 4.
Schematic diagram of the Chatillon compression tester with two loading platens. Platen-1 was used for the bauxite (2) spherical pisoid samples, and platen-2 was used for the bauxite (3) irregular-shaped single particle studies.
Figure 4.
Schematic diagram of the Chatillon compression tester with two loading platens. Platen-1 was used for the bauxite (2) spherical pisoid samples, and platen-2 was used for the bauxite (3) irregular-shaped single particle studies.

Figure 5.
TGA and DTGA of bauxite ore (1).

Figure 6.
Real and imaginary permitivities of bauxite ore (1) as a function of temperature at 2460 MHz. The density was 1.50 gm/cc before processing and 1.07 gm/cc after.
Figure 6.
Real and imaginary permitivities of bauxite ore (1) as a function of temperature at 2460 MHz. The density was 1.50 gm/cc before processing and 1.07 gm/cc after.

Figure 7.
Loss tangent of bauxite ore (1) as a function of temperature at 2460 MHz. The density was 1.50 gm/cc before processing and 1.07 gm/cc after.
Figure 7.
Loss tangent of bauxite ore (1) as a function of temperature at 2460 MHz. The density was 1.50 gm/cc before processing and 1.07 gm/cc after.

Figure 8.
(a): Real permittivity of bauxite (1-Fe) as a function of temperature at various frequencies. The density was 2.09 gm/cc before processing and 1.67 gm/cc after. (b): Imaginary permittivity of bauxite (1-Fe) as a function of temperature at various frequencies. The density was 2.09 gm/cc before processing and 1.67 gm/cc after.

Figure 9.
Calculated sample temperature as function of time for a sample mass of 27.5 g and 990 W. The bulk density was 0.6048 g/cm3.
Figure 9.
Calculated sample temperature as function of time for a sample mass of 27.5 g and 990 W. The bulk density was 0.6048 g/cm3.

Figure 10.
Measured strength indices of the as-received bauxite (2) pisoids.

Figure 11.
Percent moisture removal and average strength index versus sample temperature for conventionally heated bauxite (2) pisoid samples.
Figure 11.
Percent moisture removal and average strength index versus sample temperature for conventionally heated bauxite (2) pisoid samples.

Figure 12.
Distribution of the average strength indices for conventionally heated bauxite (2) pisoid samples at 500 °C.
Figure 12.
Distribution of the average strength indices for conventionally heated bauxite (2) pisoid samples at 500 °C.

Figure 13.
Effect of moisture removal on the average strength index for the as-received sample and for microwave-heated bauxite (2) pisoid samples at 850 W, 1000 W and 1200 W for 2 min.
Figure 13.
Effect of moisture removal on the average strength index for the as-received sample and for microwave-heated bauxite (2) pisoid samples at 850 W, 1000 W and 1200 W for 2 min.

Figure 14.
Distribution of the average strength indices for microwave-heated bauxite (2) pisoid samples at 825 W, 1000 W and 1200 W for 2 min.
Figure 14.
Distribution of the average strength indices for microwave-heated bauxite (2) pisoid samples at 825 W, 1000 W and 1200 W for 2 min.

Figure 15.
Modified five-parameter Gaussian distribution plots for conventional and microwaved bauxite (2) pisoid samples.
Figure 15.
Modified five-parameter Gaussian distribution plots for conventional and microwaved bauxite (2) pisoid samples.

Figure 16.
Typical microstructure of a microwaved sample of bauxite ore (2) showing the cracks (×450).
Figure 16.
Typical microstructure of a microwaved sample of bauxite ore (2) showing the cracks (×450).

Figure 17.
Time to microwave sintering for the three different particle size ranges.

Figure 18.
Strength index as a function of moisture content for the three particle size ranges: (a) −3.0 + 2.5 cm, (b) −3.5 + 3.0 cm and (c) −4.5 + 3.5 cm.
Figure 18.
Strength index as a function of moisture content for the three particle size ranges: (a) −3.0 + 2.5 cm, (b) −3.5 + 3.0 cm and (c) −4.5 + 3.5 cm.

Figure 19.
Strength index of the as-received, conventional and microwaved samples for the three particle size ranges: −3.0 + 2.5 cm, −3.5 + 3.0 cm and −4.5 + 3.5 cm.
Figure 19.
Strength index of the as-received, conventional and microwaved samples for the three particle size ranges: −3.0 + 2.5 cm, −3.5 + 3.0 cm and −4.5 + 3.5 cm.

Figure 20.
Number of samples that failed due to heating only for both conventional and microwave heating.
Figure 20.
Number of samples that failed due to heating only for both conventional and microwave heating.

Figure 21.
Scanning electron microscope image of fracture surface of (a) conventionally heated bauxite (2) for 2 min at 900 °C in air (×500) and (b) microwave heated for 2 min at 1200 W in air (×1500). The highlighted areas were analyzed by energy dispersive X-ray spectroscopy (EDS) and consisted of mainly aluminum.


Table 2.
Chemical analysis of bauxite ore samples (wt%).
| Chemical Compositions (%) | Bauxite (1) | Bauxite (2) | Bauxite (3) |
|---|---|---|---|
| Al2O3 | 52.23 | 49.26 | 54.89 |
| Fe2O3 | 13.76 | 18.65 | 5.20 |
| SiO2 | 4.32 | 3.62 | 8.02 |
| TiO2 | 2.21 | 2.90 | 2.71 |
| Na2O | 0.02 | 0.02 | 0.05 |
| CaO | 0.01 | <0.01 | 0.23 |
| MgO | <0.01 | <0.01 | <0.01 |
| K2O | 0.03 | 0.03 | 0.04 |
| MnO | <0.01 | <0.01 | 0.17 |
| P2O5 | 0.03 | 0.09 | 0.62 |
| Cr2O3 | 0.02 | 0.02 | <0.01 |
| LOI | 27.55 | 25.55 | 27.95 |
| Sum | 100.10 | 100.10 | 99.83 |
Table 3.
XRD analysis of the three gibbsite-type bauxite ore samples. The minerals are listed in order of decreasing intensity.
Table 3.
XRD analysis of the three gibbsite-type bauxite ore samples. The minerals are listed in order of decreasing intensity.
| Bauxite Ore | Major Mineral |
|---|---|
| 1 | Gibbsite, Hematite, Anatase and Kaolinite |
| 2 | Gibbsite, Hematite, Anatase, Kaolinite and Boehmite |
| 3 | Gibbsite, Hematite, Anatase, Kaolinite and Boehmite |
Table 4.
The 24 factorial experimental design and results.
| Designed Test Number | Time | Power | Mass | Density | Temperature (°C) |
|---|---|---|---|---|---|
| 1 | −1 | −1 | −1 | −1 | 75 |
| 2 | 1 | −1 | −1 | −1 | 103 |
| 3 | −1 | 1 | −1 | −1 | 80 |
| 4 | 1 | 1 | −1 | −1 | 110 |
| 5 | −1 | −1 | 1 | −1 | 115 |
| 6 | 1 | -1 | 1 | −1 | 160 |
| 7 | −1 | 1 | 1 | −1 | 122 |
| 8 | 1 | 1 | 1 | −1 | 198 |
| 9 | −1 | −1 | −1 | 1 | 50 |
| 10 | 1 | −1 | −1 | 1 | 75 |
| 11 | −1 | 1 | −1 | 1 | 65 |
| 12 | 1 | 1 | −1 | 1 | 102 |
| 13 | −1 | −1 | 1 | 1 | 60 |
| 14 | 1 | −1 | 1 | 1 | 80 |
| 15 | −1 | 1 | 1 | 1 | 78 |
| 16 | 1 | 1 | 1 | 1 | 125 |
Table 5.
Steepest path determination.
| Sample Mass X3 | Time X1 | Power X2 | |
|---|---|---|---|
| Regression Coefficient | 28.375 | 19.25 | 10.125 |
| Value of one coded unit | 5 g | 1 min | 87.5 W |
| Steps | 1 | 0.6785 | 0.3568 |
| Path | 5 g | 0.6785 min | 31.22 W |
Table 6.
Sample temperature of the experiment carried along the steepest path.
| Sample Mass | Heating Time | Power | Sample Temperature (°C) | ||
|---|---|---|---|---|---|
| (g) | (min) | (W) | (I) | (II) | Average |
| 15 | 4 | 912 | 112 | 120 | 116 |
| 20 | 4.68 | 943 | 250 | 246 | 248 |
| 25 | 5.34 | 974 | 255 | 258 | 256.5 |
| 27.5 | 5.67 | 990 | Sinter | Sinter | >1200 |
Table 7.
The percent mass change and the percent of fractured particles after conventional and microwave preheating. The samples were heated for 2 min in the conventional (120 V and 10 A) and microwave systems (1200 W).
Table 7.
The percent mass change and the percent of fractured particles after conventional and microwave preheating. The samples were heated for 2 min in the conventional (120 V and 10 A) and microwave systems (1200 W).
| Heating Method | Mass Change (%) | Fractured Strength Particles (%) Index (kN/m2) | |
|---|---|---|---|
| Conventional | 11.6% | 38.6 | 1.36 × 10³ |
| Microwave | 5.4% | 24.2 | 1.60 × 10³ |
Publisher’s Note: MDPI stays neutral with regard to jurisdictional claims in published maps and institutional affiliations. |
© 2022 by the authors. Licensee MDPI, Basel, Switzerland. This article is an open access article distributed under the terms and conditions of the Creative Commons Attribution (CC BY) license (https://creativecommons.org/licenses/by/4.0/).
Share and Cite
MDPI and ACS Style
Pickles, C.; Lu, T. Microwave Dewatering of Gibbsite-Type Bauxite Ores: Permittivities, Heating Behavior and Strength Indices. Minerals 2022, 12, 648. https://0-doi-org.brum.beds.ac.uk/10.3390/min12050648
AMA Style
Pickles C, Lu T. Microwave Dewatering of Gibbsite-Type Bauxite Ores: Permittivities, Heating Behavior and Strength Indices. Minerals. 2022; 12(5):648. https://0-doi-org.brum.beds.ac.uk/10.3390/min12050648
Chicago/Turabian StylePickles, Christopher, and Ting Lu. 2022. "Microwave Dewatering of Gibbsite-Type Bauxite Ores: Permittivities, Heating Behavior and Strength Indices" Minerals 12, no. 5: 648. https://0-doi-org.brum.beds.ac.uk/10.3390/min12050648
Note that from the first issue of 2016, this journal uses article numbers instead of page numbers. See further details here.