
An Experimental Investigation of the Environmental Risk of a Metallurgical Waste Deposit

 , , and
Abstract
:1. Introduction
2. Materials and Methods
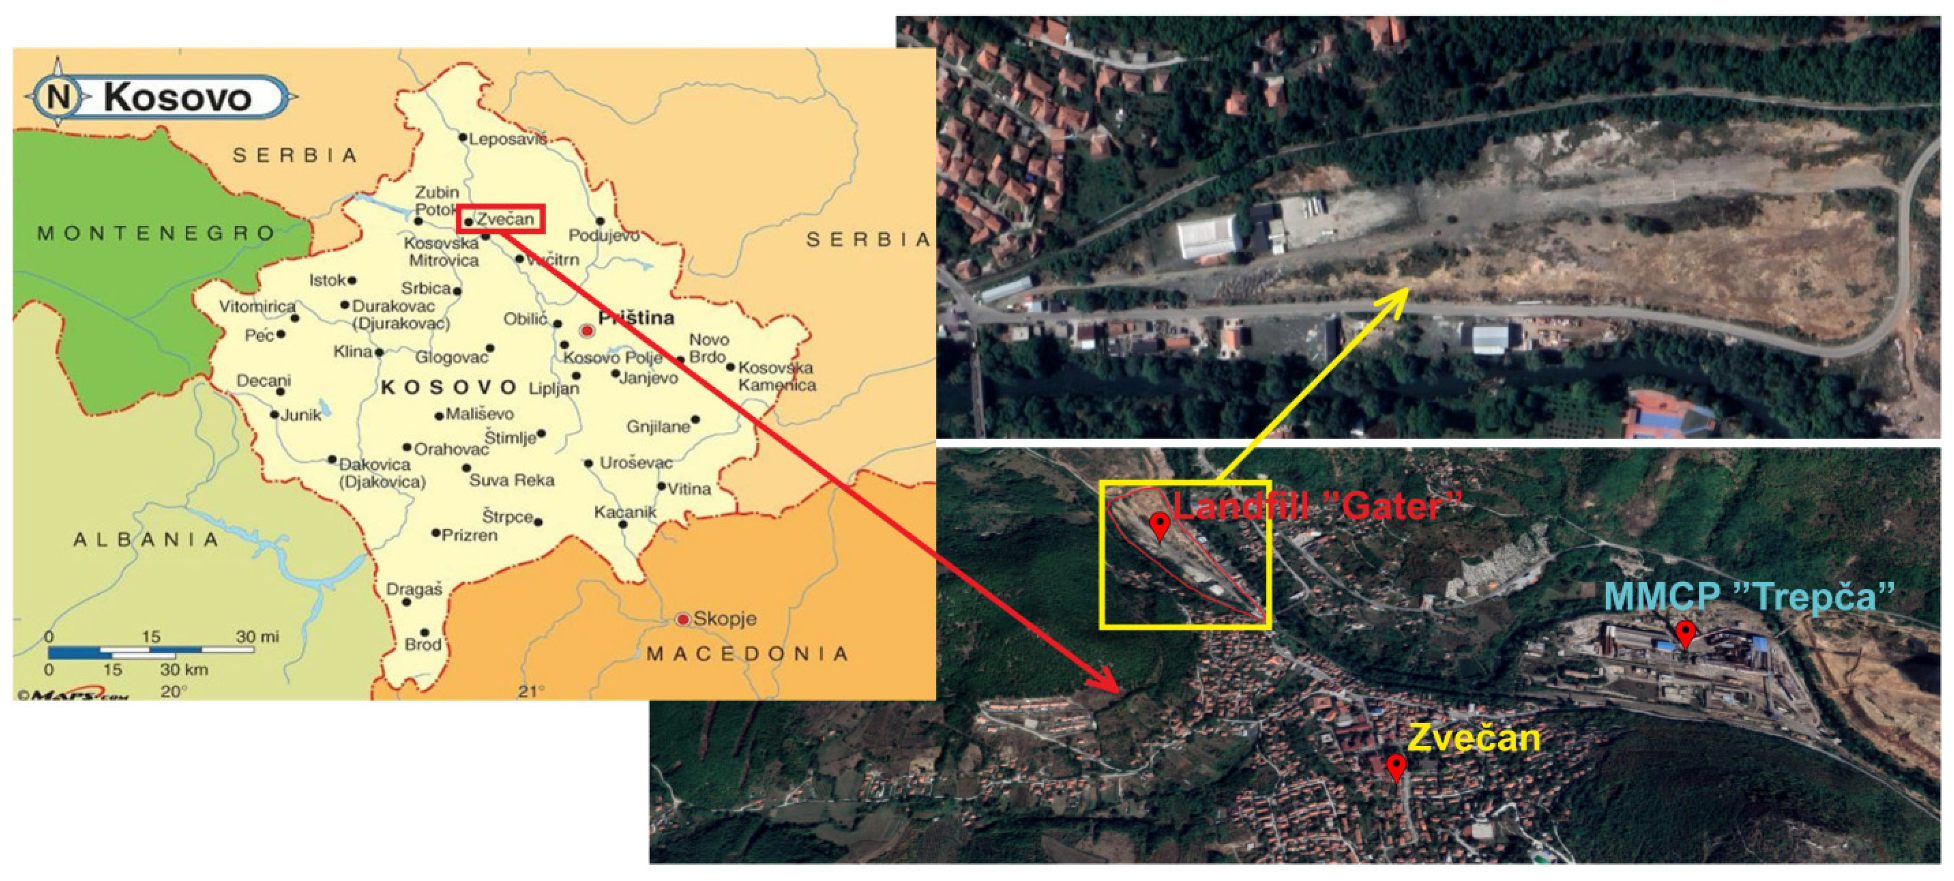
2.1. Study Area
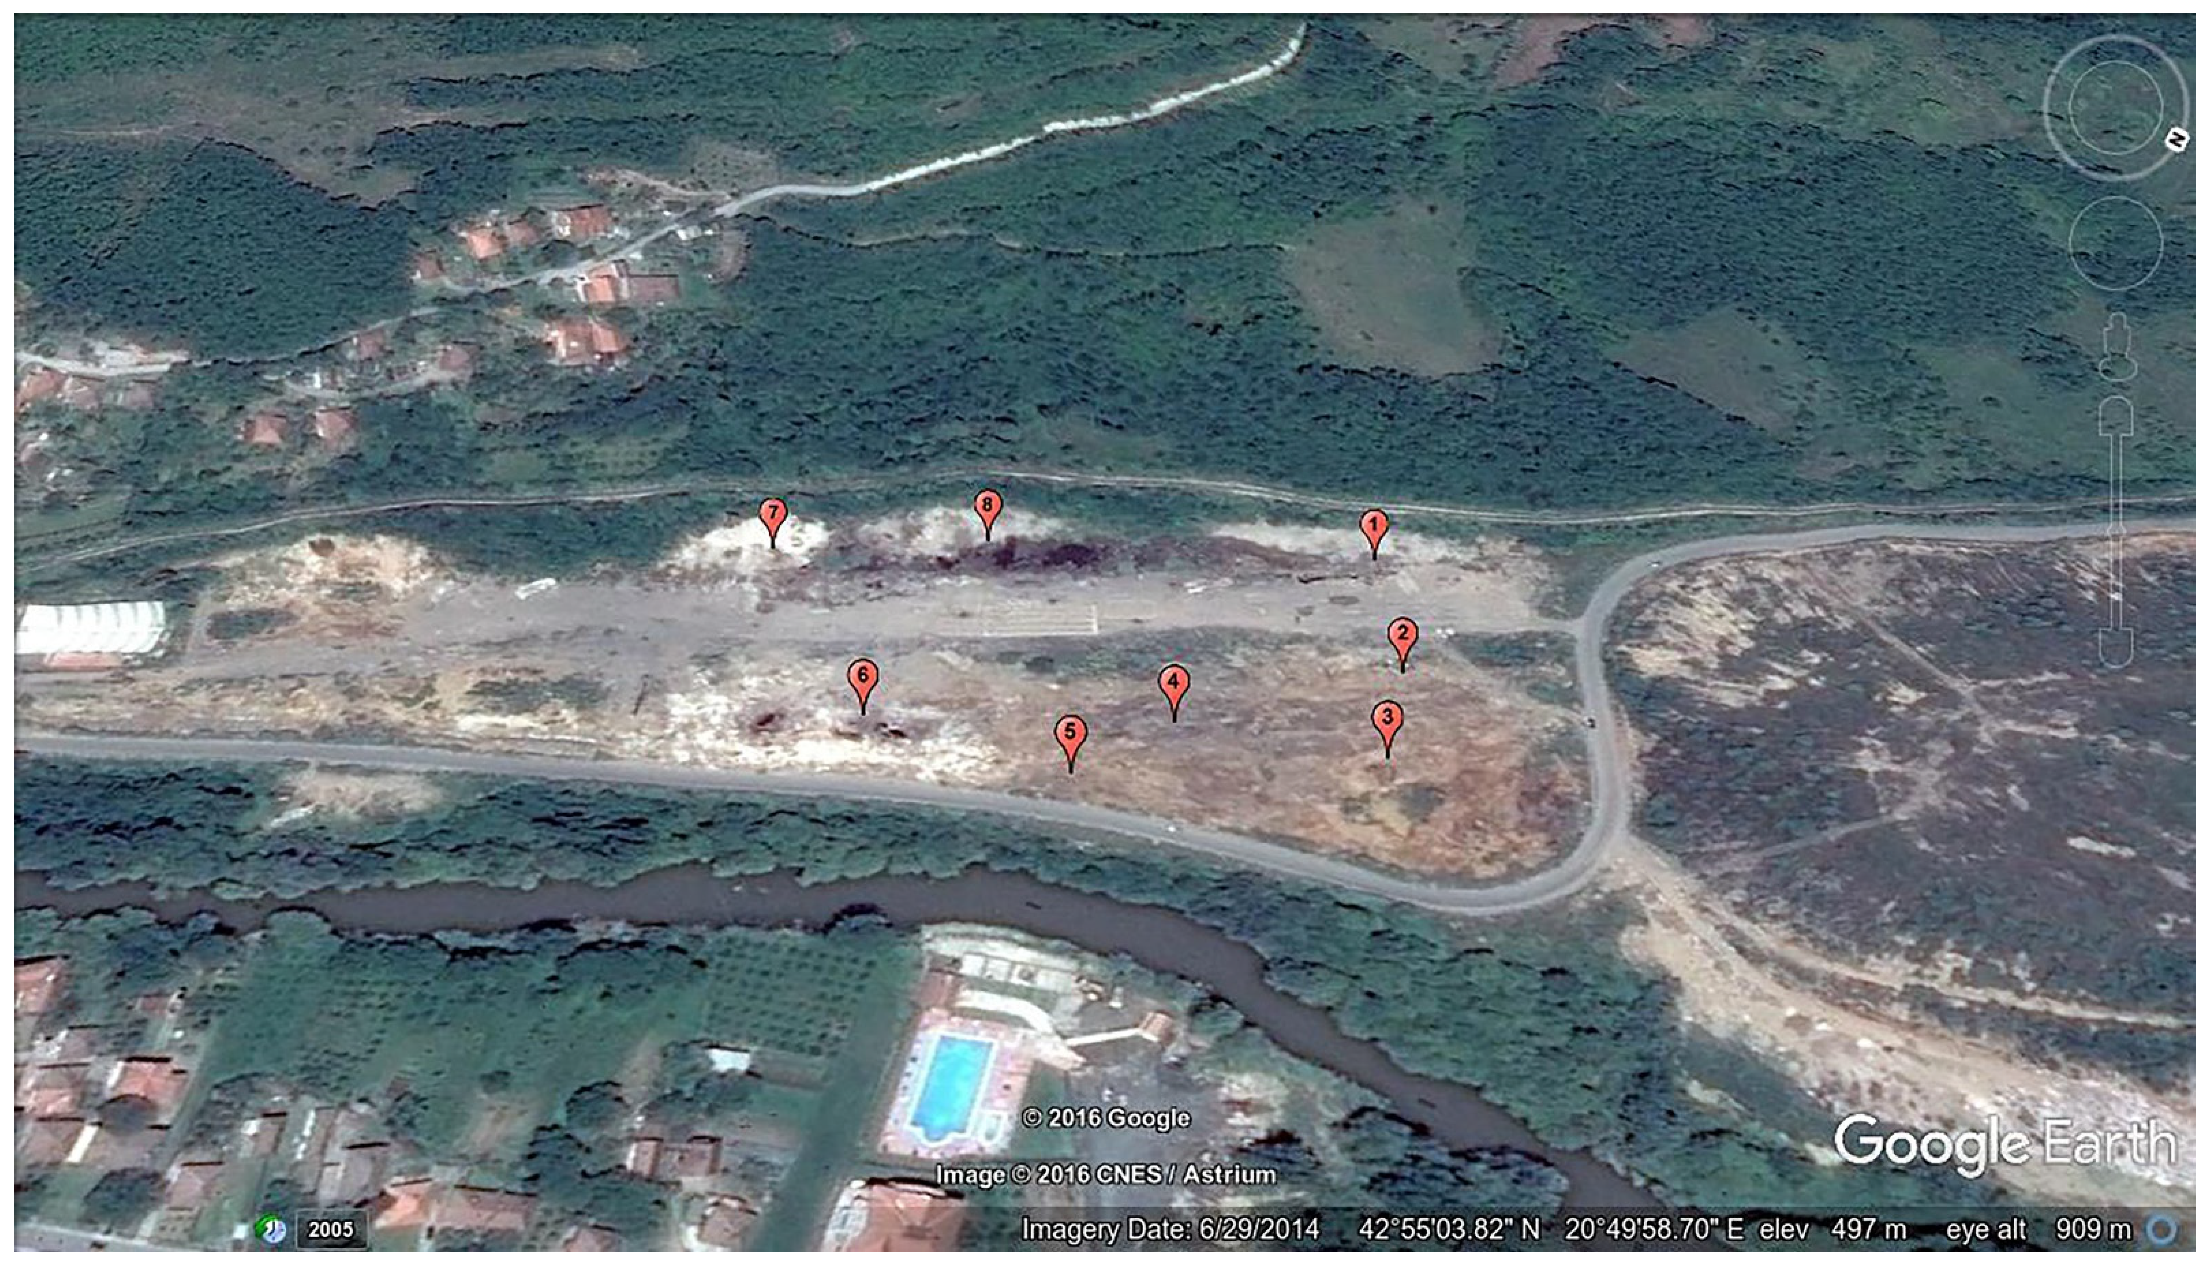
2.2. Soil Sampling
2.3. Sample Analyses
2.4. BCR Sequential Extraction
2.5. Quality Assurance of Data
2.6. Potential Ecological Risk of Metals
3. Results and Discussion
3.1. Physical and Chemical Analysis
3.2. Pseudototal
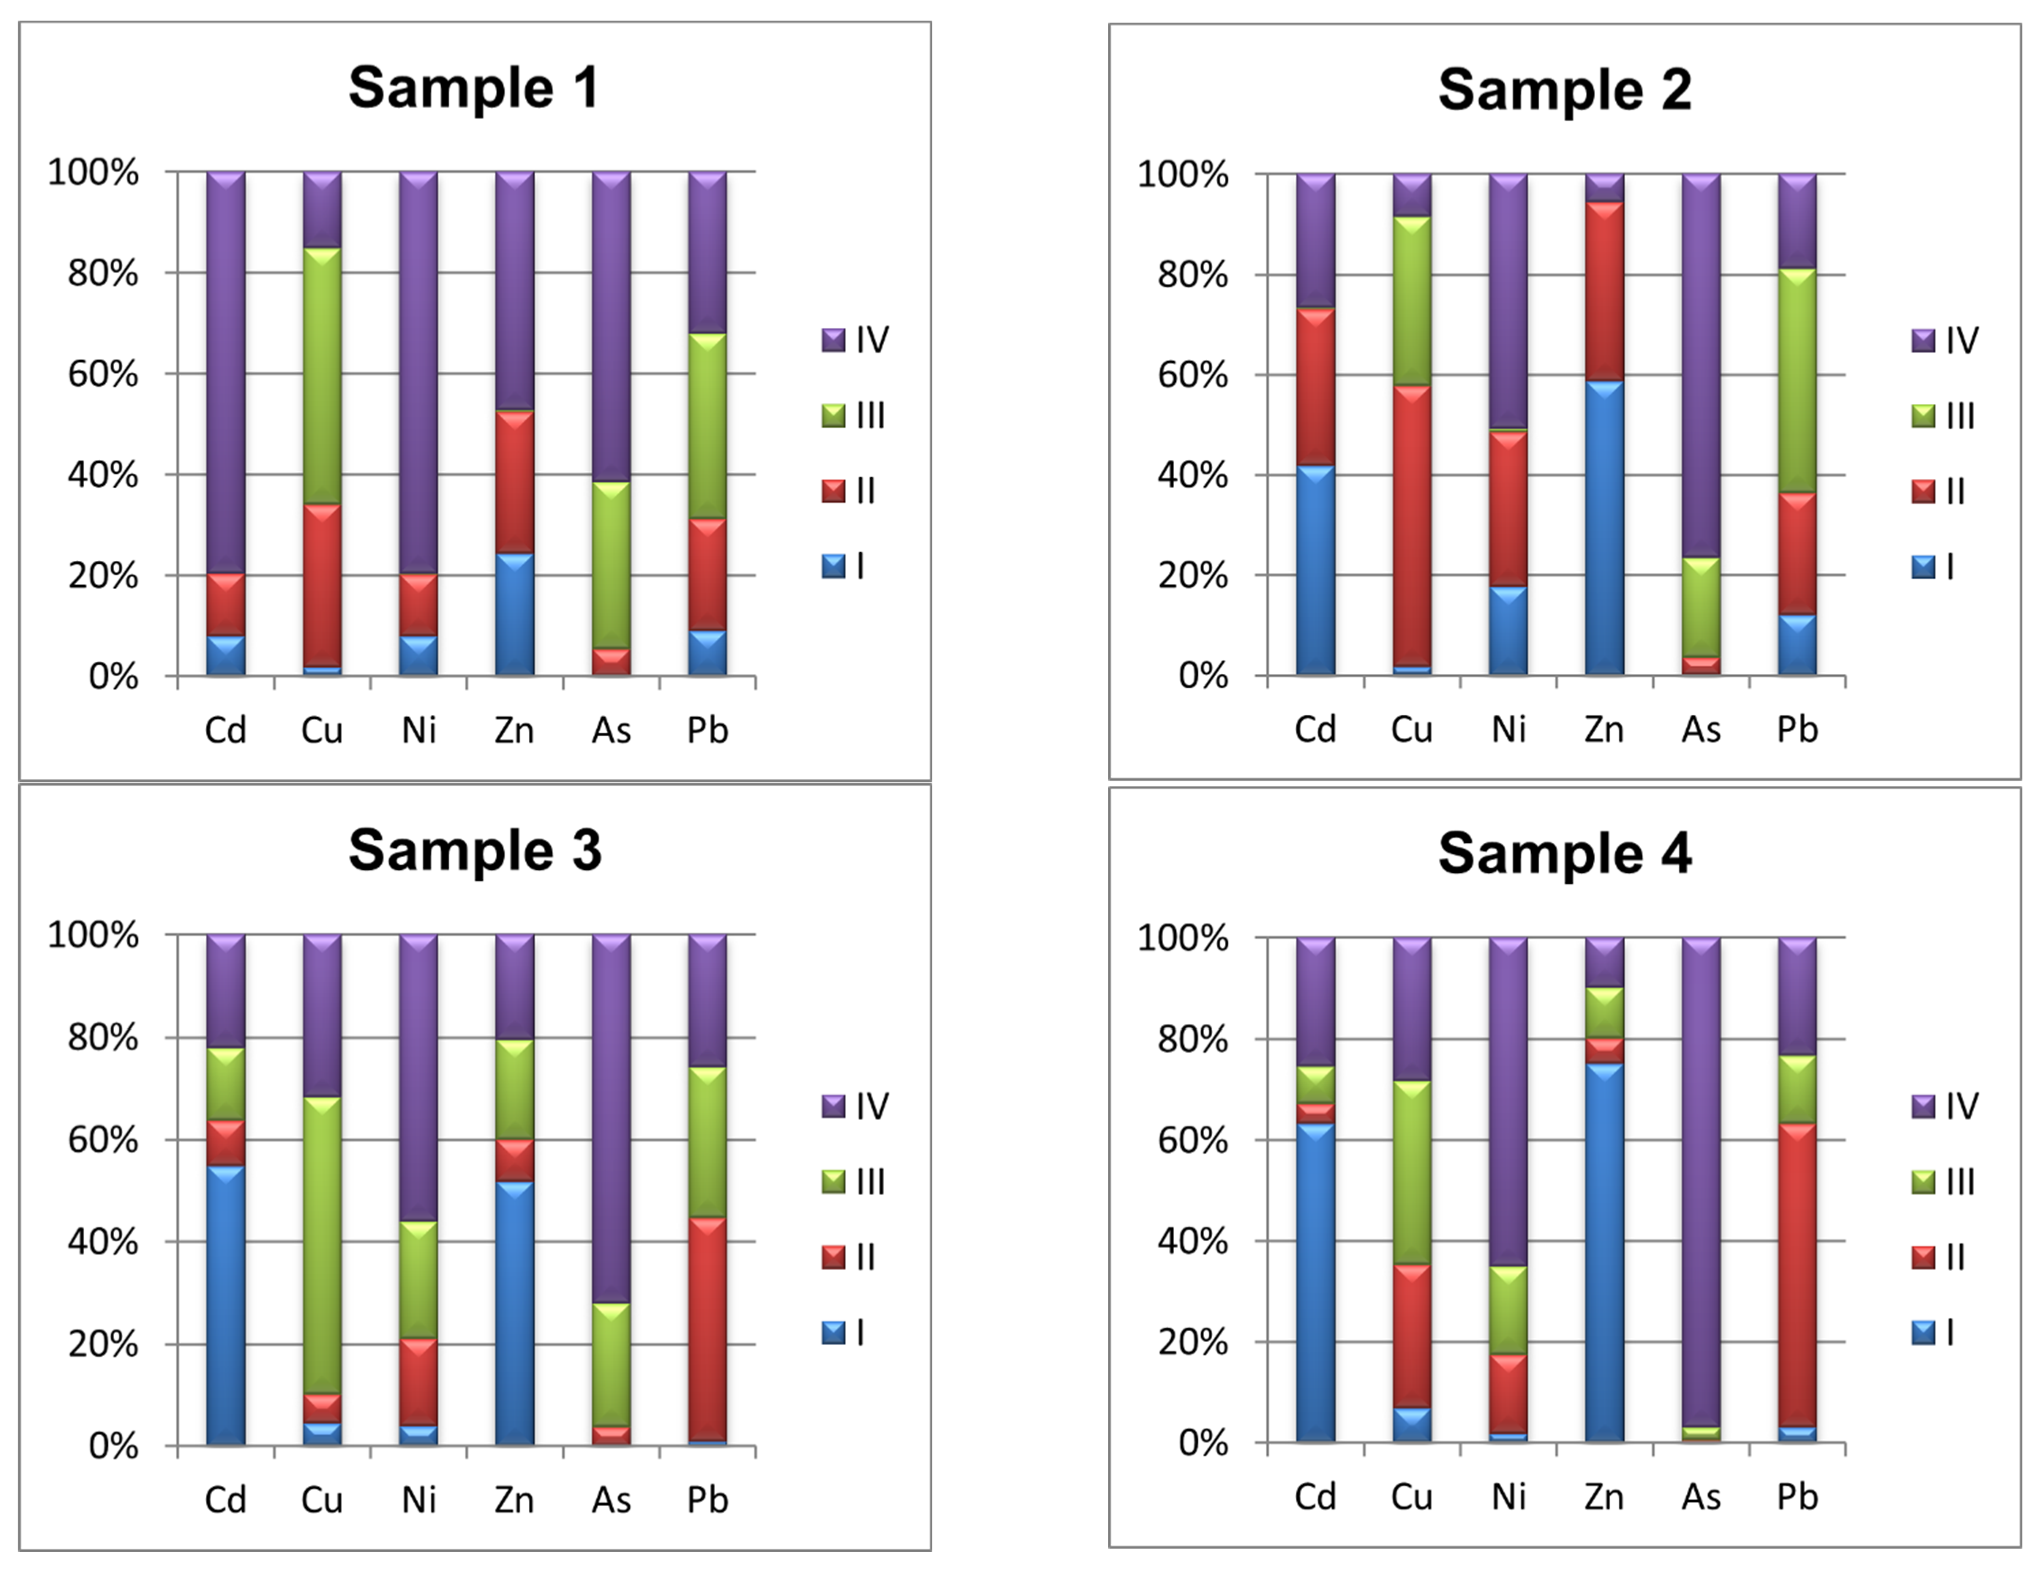
3.3. Sequential Extraction Results
3.4. Environmental Implications
4. Conclusions
Author Contributions
Funding
Acknowledgments
Conflicts of Interest
References
- Lassin, A.; Piantone, P.; Burnol, A.; Bodénan, F.; Chateau, L.; Lerouge, C.; Crouzet, C.; Guyonnet, D.; Bailly, L. Reactivity of waste generated during lead recycling: An integrated study. J. Hazard. Mater. 2007, 139, 430–437. [Google Scholar] [CrossRef] [PubMed]
- Ellis, T.W.; Mirza, A.H. The refining of secondary lead for use in advanced lead-acid batteries. J. Power Sources 2010, 195, 4525–4529. [Google Scholar] [CrossRef]
- Sahu, K.K.; Agrawal, A.; Pandey, B.D. Recent trends and current practices for secondary processing of zinc and lead. Part II: Zinc recovery from secondary sources. Waste Manag. Res. J. Int. Solid Wastes Public Clean. Assoc. Iswa 2004, 22, 248–254. [Google Scholar] [CrossRef]
- Liu, J.Y.; Huang, S.J.; Sun, S.Y.; Ning, X.A.; He, R.Z.; Li, X.M.; Chen, T.; Luo, G.Q.; Xie, W.M.; Wang, Y.J. Effects of sulfur on lead partitioning during sludge incineration based on experiments and thermodynamic calculations. Waste Manag. 2015, 38, 336–348. [Google Scholar] [CrossRef]
- Štulović, M.; Radovanović, D.; Kamberović, Ž.; Korać, M.; Anđić, Z.; Ranitović, M. Leaching of toxic elements from secondary alkaline lead slag and stabilized/solidified products. J. Mater. Cycles Waste Manag. 2019, 21, 1402–1413. [Google Scholar] [CrossRef]
- Okada, T.; Tojo, Y.; Tanaka, N.; Matsuto, T. Recovery of zinc and lead from fly ash from ash-melting and gasification-melting processes of MSW-comparison and applicability of chemical leaching methods. Waste Manag. 2007, 27, 69–80. [Google Scholar] [CrossRef] [PubMed]
- Li, Y.; Tang, C.; Chen, Y.; Yang, S.; Guo, L.; He, J.; Tang, M. One-Step Extraction of Lead from Spent Lead-Acid Battery Paste via Reductive Sulfur-Fixing Smelting: Thermodynamic Analysis. In Proceedings of the 8th International Symposium on High-Temperature Metallurgical Processing, San Diego, CA, USA, 26 February–2 March 2017; Springer: Cham, Switzerland, 2017; pp. 767–777. [Google Scholar] [CrossRef]
- Sun, Z.; Cao, H.; Zhang, X.; Lin, X.; Zheng, W.; Cao, G.; Sun, Y.; Zhang, Y. Spent lead-acid battery recycling in China—A review and sustainable analyses on mass flow of lead. Waste Manag. 2017, 64, 190–201. [Google Scholar] [CrossRef]
- Min, L.I.; Lin, Y.S. Lead pollution and its impact on human health in urban area. Adm. Tech. Environ. Monit. 2006, 5, 6–10. [Google Scholar]
- Mishra, K.P.; Singh, V.K.; Rani, R.; Yadav, V.S.; Chandran, V.; Srivastava, S.P.; Seth, P.K. Effect of lead exposure on the immune response of some occupationally exposed individuals. Toxicology 2003, 188, 251–259. [Google Scholar] [CrossRef]
- Shen, H.; Forssberg, E. An overview of recovery of metals from slags. Waste Manag. 2003, 23, 933–949. [Google Scholar] [CrossRef]
- Kim, A.; Hesbach, P. Comparison of fly ash leaching methods. Fuel 2009, 88, 926–937. [Google Scholar] [CrossRef]
- Tessier, A.; Campbell, P.G.C.; Bisson, M. Sequential extraction procedure for the speciation of particulate trace metals. J. Anal. Chem. 1979, 51, 844–850. [Google Scholar] [CrossRef]
- Rauret, G.; Lopez-Sanchez, J.F.; Sahuquillo, A.; Rubio, R.; Davidson, C.; Ure, A. Improvement of the BCR three step sequential extraction procedure prior to the certification of new sediment and soil reference materials. J. Environ. Monit. Assess. 1999, 1, 57–61. [Google Scholar] [CrossRef]
- Håkanson, L. An ecological risk index for aquatic pollution control: A sediment logical approach. Water Res. 1980, 14, 975–1001. [Google Scholar] [CrossRef]
- Anju, M.; Banerjee, D.K. Comparison of two sequential extraction procedures for heavy metal partitioning in mine tailings. Chemosphere 2010, 78, 1393–1402. [Google Scholar] [CrossRef]
- Ferati, F.; Kerolli-Mustafa, M.; Kraja-Ylli, A. Assessment of heavy metal contamination in water and sediments of Trepça and Sitnica rivers, Kosovo, using pollution indicators and multivariate cluster analysis. J. Environ. Monit. Assess. 2015, 187, 338–353. [Google Scholar] [CrossRef]
- Saffari, M.; Yasrebi, J.; Karimian, N.; Shan, X.Q. Evaluation of three sequential extraction methods for fractionation of zinc in calcareous and acidic soils. Res. J. Biol. Sci. 2009, 4, 848–857. [Google Scholar]
- Conesa, H.M.; Robinson, B.H.; Schulin, R.; Nowack, B. Metal extractability in acidic and neutral mine tailings from Cartagena-La Union Mining District (SE Spain). Appl. Geochem. 2008, 23, 1232–1240. [Google Scholar] [CrossRef]
- Min, X.; Xie, X.; Chai, L.; Liang, Y.; Li, M.; Ke, Y. Environmental availability and ecological risk assessment of heavy metals in zinc leaching residue. Trans. Nonferrous Met. Soc. China 2013, 23, 208–218. [Google Scholar] [CrossRef]
- Yang, J.S.; Lee, J.Y.; Baek, K.; Kwon, T.S.; Choi, J. Extraction behavior of As, Pb, and Zn from mine tailings with acid and base solutions. J. Hazard. Mat. 2009, 171, 443–451. [Google Scholar] [CrossRef]
- Chen, C.; Lu, Y.; Hong, J.; Ye, M.; Wang, Y.; Lu, H. Metal and metalloid contaminant availability in Yundang Lagoon sediments, Xiamen Bay, China, after 20 years continuous rehabilitation. J. Hazard. Mater. 2010, 175, 1048–1055. [Google Scholar] [CrossRef] [PubMed]
- Margui, E.; Salvado, V.; Queralt, I.; Hidalgo, M. Comparison of three-stage sequential extraction and toxicity characteristic leaching test to evaluate the mobility in mining wastes. Anal. Chim. Acta. 2004, 524, 151–159. [Google Scholar] [CrossRef]
- Pan, Y.; Wu, Z.; Zhou, J.; Zhao, J.; Ruan, X.; Liu, J.; Qjan, G. Chemical characteristics and risk assessment of typical municipal solid waste inercation (MSWI) fly ash in China. J. Hazard. Mater. 2013, 261, 269–276. [Google Scholar] [CrossRef] [PubMed]
- Meers, E.; Samson, R.; Tack, F.M.G.; Ruttens, A.; Vangegehuchte, M.; Vangronsveld, J.; Verloo, M.G. Phytoavailability assessment of heavy metals in soils by single extractions and accumulation by Phaseolus vulgaris. Environ. Exp. Bot. 2007, 60, 385–396. [Google Scholar] [CrossRef]
- Harmsen, J. Measuring bioavailability: From a scientific approach to standard methods. J. Environ. Qual. 2007, 36, 1420–1428. [Google Scholar] [PubMed]
- Harmsen, J. Soil Quality—Requirements and Guidance for the Selection and Application of Methods for the Assessment of Bioavailability of Contaminants in Soil and Soil Materials; Werkgroep ISO/DIS17402; Soil Quality: Geneva, Switzerland, 2008. [Google Scholar]
- Kim, R.Y.; Yoon, J.K.; Kim, T.S.; Yang, J.E.; Owens, G.; Kim, K.R. Bioavailability of heavy metals in soils: Definitions and practical implementation—A critical review. Environ. Geochem. Health 2015, 37, 1041–1061. [Google Scholar] [CrossRef] [PubMed]
- Kerolli–Mustafa, M.; Fajković, H.; Rončević, H.; Ćurković, L. Assessment of metal risks from different depths of jarosite tailing waste of Trepça Zinc Industry, Kosovo based on BCR procedure. J. Geochem. Explor. 2015, 148, 161–168. [Google Scholar]
- European Union. Heavy Metals in Wastes, European Commission on Environment. Available online: http://ec.europa.eu/environment/waste/studies/pdf/heavymetalsreport.pdf (accessed on 20 August 2013).
- Qinna, Z.; Qixin, X.; Kai, Y. Application of Potential Ecological Risk Index in Soil Pollution of Typical Polluting Industries. J. Eastchina Norm. Univ. (Nat. Sci.) 2005, 1, 110–115. [Google Scholar]
- Haby, V.A.; Russelle, M.P.; Skogley, E.O. Testing soils for potassium, calcium, and magnesium. In Soil Testing and Plant Analysis, 3rd ed.; Westerman, R.L., Ed.; ASA-SSSA: Madison, WI, USA, 1990. [Google Scholar]
- Official Gazette of the Republic of Serbia, No. 23/94. Ordinance on Permitted Quantities of Harmful and Dangerous Substances in the Soil. Available online: https://www.pravno-informacioni-sistem.rs/SlGlasnikPortal/eli/rep/sgrs/ministarstva/pravilnik/1994/23/1/reg (accessed on 20 May 2022).
- Sierra, C.; Ruíz-Barzola, O.; Menéndez, M.; Demey, J.R.; Vicente-Villardón, J.L. Geochemical interactions study in surface river sediments at an artisanal mining area by means of Canonical (MANOVA)-Biplot. J. Geochem. Explor. 2017, 175, 72–81. [Google Scholar] [CrossRef]
- Rogan, N.; Dolenec, T.; Serafimovski, T.; Tasev, G.; Dolenec, M. Distribution and mobility of heavy metals in paddy soils of the Kocani Field in Macedonia. Environ. Earth Sci. 2010, 61, 899–907. [Google Scholar] [CrossRef] [Green Version]
- Li, X.; Thornton, I. Chemical partitioning of trace and major elements in soils contaminated by mining and smelting activities. Appl. Geochem. 2001, 16, 1693–1706. [Google Scholar] [CrossRef]
- Amponsah-Dacosta, F. A field-scale performance evaluation of erosion control measures for slopes of mine tailings dams. In Proceedings of the 10th International Conference on Acid Rock Drainage and IMWA Annual Conference, Santiago, Chile, 21–24 April 2015. [Google Scholar]
- Lindsay, M.B.J.; Moncur, M.C.; Bain, J.G.; Jambor, J.L.; Ptacek, C.J.; Blowes, D.W. Geochemical and mineralogical aspects of sulfide mine tailings. Appl. Geochem. 2015, 57, 157–177. [Google Scholar] [CrossRef]
- Anju, M.; Banerjee, D. Associations of Cadmium, Zinc, and Lead in Soils from a Lead and Zinc MiningArea as Studied by Single and Sequential Extractions. Environ. Monit. Assess. 2011, 176, 67–85. [Google Scholar] [CrossRef] [PubMed]
- Manouchehri, N.; Nguyen, T.M.L.; Besancon, S.; Le, L.A.; Bermond, A. Use of Sequential, Single and Kinetic Extractive Schemes to Assess Cadmium (Cd) and Lead (Pb) Availability in Vietnamese Urban Soils. Am. J. Anal. Chem. 2014, 5, 1214–1227. [Google Scholar] [CrossRef] [Green Version]
- Gholizadeh, A.; Borůvka, L.; Seberioon, M.M.; Kozák, J.; Vašát, R.; Němeček, K. Comparing different data pre-processing methods for monitoring soil heavy metals based on soil spectral features. Soil Water Res. 2015, 10, 218–227. [Google Scholar] [CrossRef] [Green Version]
- Liu, B.; Zhang, W.; Chi, G. Distribution and Risk Assessment of Heavy Metals in Sediment from Bohai Bay, China. Minerals 2019, 9, 111. [Google Scholar] [CrossRef] [Green Version]
- Ashraf, M.A.; Maah, M.J.; Yusoff, I. Chemical Speciation and Potential Mobility of Heavy Metals in the Soil of Former Tin Mining Catchment. Sci. World J. 2012, 2012, 125608. [Google Scholar] [CrossRef] [Green Version]
- Gutiérrez, M.; Mickus, K.; Camacho, L.M. Abandoned Pb Zn mining wastes and their mobility as proxy to toxicity: A review. Sci. Total Environ. 2016, 565, 392–400. [Google Scholar] [CrossRef]
- Gonzalez, I.; Galan, E.; Romero, A. Assessing Soil Quality in Areas Affected by Sulfide Mining. Application to Soils in the Iberian Pyrite Belt (SW Spain). Minerals 2011, 1, 73–108. [Google Scholar] [CrossRef] [Green Version]
- Kotoky, P.; Bora, B.J.; Baruah, N.K.; Baruah, J.; Borah, G.C. Chemical fractionation of heavy metals in soils around oil installations, Assam. Chem. Speciat. Bioavailab. 2004, 15, 115–126. [Google Scholar] [CrossRef]
- Lasheen, M.R.; Ammar, N.S. Speciation of some heavy metals in River Nile sediments, Cairo, Egypt. Environmentalist 2009, 29, 8–16. [Google Scholar] [CrossRef]
- Xing, W.; Zhang, H.; Scheckel, K.G.; Li, L. Heavy metal and metalloid concentrations in components of 25 wheat (Triticum aestivum) varieties in the vicinity of lead smelters in Henan province, China. Environ. Monit. Assess. 2016, 188, 23. [Google Scholar] [CrossRef] [PubMed]
- Opara, C.B.; Kutschke, S.; Pollmann, K. Fractionation of Metal(loid)s in Three European Mine Wastes by Sequential Extraction. Separations 2022, 9, 67. [Google Scholar] [CrossRef]
- Kontopoulos, A.; Komnitsas, K.; Xenidis, A.; Papassiopi, N. Environmental characterisation of the sulphidic tailings in Lavrion. Miner. Eng. 1995, 8, 1209–1219. [Google Scholar] [CrossRef]
- Jabłońska-Czapla, M. Antimony, Arsenic and Chromium Speciation Studies in Biała Przemsza River (Upper Silesia, Poland) Water by HPLC-ICP-MS. Int. J. Environ. Res. Public Health 2015, 12, 4739–4757. [Google Scholar] [CrossRef] [Green Version]
- Landrum, J.T.; Bennett, P.C.; Engel, A.S.; Alsina, M.A.; Pasten, P.A.; Miliken, K. Partitioning geochemistry of arsenic and antimony, El Tatio Geyser, Chile. App. Geochem. 2009, 24, 664–676. [Google Scholar] [CrossRef]


| Serial Number | Altitude, m | N, ° | E, ° |
|---|---|---|---|
| 1. | 499 | 42.91833 | 20.83206 |
| 2. | 495 | 42.91859 | 20.83264 |
| 3. | 494 | 42.91868 | 20.83312 |
| 4. | 495 | 42.91808 | 20.83332 |
| 5. | 495 | 42.91792 | 20.83377 |
| 6. | 495 | 42.91790 | 20.83382 |
| 7. | 498 | 42.91686 | 20.83277 |
| 8. | 498 | 42.01671 | 20.83284 |
| Extraction Step | Solid Phase | Extraction Procedure |
|---|---|---|
| BCR 1 | Exchangeable, water, acid-soluble fraction | 1 g of a soil sample, 40 mL of 0.11 mol/L CH3COOH, shake 16 h at room temperature. |
| BCR 2 | Reducible fraction | 40 mL of 0.5 mol/L NH2OH·HCl (pH = 1.5, 2 mol HNO3), shake 16 h at room temperature. |
| BCR 3 | Oxidizing fraction | 5 mL of 8.8 mol/L H2O2 (pH 2), shake for 2 h at 85 °C, cool, then 25 mL of 1 mol/L CH3COONH4 (pH = 2, HNO3 conc.), shake 16 h, room temperature. |
| Residual | Residual fraction | The pseudo-total minus the three fractions. The pseudo-total: digestion of 1 g sample in aqua regia (3 mL HCl + 1 mL HNO3), shake for 16 h. |
| Element | Certified Value | Measured Value |
|---|---|---|
| mg/kg ± σ (mg/kg) | mg/kg ± σ (mg/kg) | |
| Cd | 0.09 ± 0.03 | 0.09 ± 0.05 |
| Cu | 23.2 ± 2.2 | 22.2 ± 0.5 |
| Pb | 29.2 ± 3.2 | 29.3 ± 1.8 |
| Ni | 27.6 ± 2.8 | 28.1 ± 1.1 |
| Zn | 72.8 ± 4.5 | 70.9 ± 1.3 |
| As |
| Extraction Step | Element | Certified Value (mg/kg) (Mean ± U) | Measured Value (mg/kg) (Mean ± U) |
|---|---|---|---|
| BCR 1 | Cd | 7.3 ± 0.4 | 8.44 ± 0.03 |
| Cr | 2.26 ± 0.16 | 2.37 ± 0.06 | |
| Cu | 49.3 ± 1.7 | 63.0 ± 1.1 | |
| Ni | 15.4 ± 0.9 | 16.9 ± 0.1 | |
| Pb | 3.18 ± 0.21 | 3.54 ± 0.03 | |
| Zn | 205 ± 6 | 217 ± 4 | |
| BCR 2 | Cd | 3.77 ± 0.28 | 3.87 ± 0.06 |
| Cr | 45.7 ± 2 | 44.8 ± 0.3 | |
| Cu | 124 ± 3 | 122 ± 2 | |
| Ni | 26.6 ± 1.3 | 27.1 ± 0.2 | |
| Pb | 126 ± 3 | 121 ± 2.5 | |
| Zn | 114 ± 5 | 108 ± 0.9 | |
| BCR 3 | Cd | 0.27 ± 0.06 | 0.28 ± 0.03 |
| Cr | 143 ± 7 | 161 ± 3 | |
| Cu | 55 ± 4 | 53 ± 1.1 | |
| Ni | 15.3 ± 0.9 | 14.81 ± 0.07 | |
| Pb | 9.3 ± 2 | 8.61 ± 0.4 | |
| Zn | 46 ± 4 | 43 ± 2 | |
| INDICATIVE | Cd | 0.13 ± 0.08 | 0.12 ± 0.2 |
| Cr | 63 ± 8 | 50 ± 10 | |
| Cu | 39 ± 12 | 36 ± 4 | |
| Ni | 41 ± 4 | 38 ± 2 | |
| Pb | 11 ± 6 | 9 ± 4.5 | |
| Zn | 95 ± 13 | 94 ± 6 |
| Scope of Potential | Ecological Risk of Single-Factor Pollution | Scope of Potential Toxicity Index I | General Level of Potential Ecological Risk |
|---|---|---|---|
| < 40 | Low | R < 150 | Low grade |
| 40≤ < 80 | Moderate | 150 ≤ R < 300 | Moderate |
| 80≤ < 160 | Higher | 300 ≤ R < 600 | Severe |
| 160≤ < 320 | High | 600 ≤ R | Serious |
| 320 ≤ | Serious |
| Sample | pH | EC | K | Na | Ca | Mg |
|---|---|---|---|---|---|---|
| H2O | (μS/cm) | mg/kg | mg/100 g | |||
| 1 | 5.23 | 318. | 1229.44 | 418.05 | 287.41 | 262.53 |
| 2 | 7.15 | 236. | 1383.30 | 1578.65 | 2637.24 | 525.49 |
| 3 | 6.67 | 1075. | 808.21 | 5537.64 | 1798.97 | 178.50 |
| 4 | 4.27 | 1273. | 1472.32 | 176.51 | 402.51 | 328.41 |
| 5 | 2.86 | 2630. | 1283.85 | 8.21 | 307.50 | 325.99 |
| 6 | 2.80 | 2110. | 595.76 | 116.93 | 513.47 | 149.12 |
| 7 | 6.43 | 61.5 | 599.42 | 2808.69 | 1014.11 | 235.71 |
| 8 | 7.34 | 124.3 | 655.90 | 3458.07 | 2476.89 | 277.22 |
| Sample | Cd | Cu | Ni | Zn | As | Pb |
|---|---|---|---|---|---|---|
| mg/kg | mg/kg | mg/kg | mg/kg | mg/kg | mg/kg | |
| 1 | 5.40 | 714.98 | 40.27 | 633.96 | 3870.40 | 25,036.82 |
| 2 | 10.57 | 986.66 | 68.48 | 8212.99 | 5237.38 | 30,339.74 |
| 3 | 49.84 | 700.16 | 114.67 | 2584.52 | 39,102.38 | 10,079.91 |
| 4 | 17.77 | 268.03 | 57.31 | 2428.09 | 8583.59 | 7273.48 |
| 5 | 17.27 | 828.31 | 8.21 | 1142.29 | 50,966.14 | 5719.74 |
| 6 | 27.25 | 922.07 | 10.45 | 1513.39 | 52,306.18 | 2348.43 |
| 7 | 2.19 | 0.00 | 7.34 | 58.21 | 3986.73 | 1223.13 |
| 8 | 2.98 | 0.00 | 11.06 | 90.90 | 7586.22 | 1648.01 |
| Sample | ||||||
|---|---|---|---|---|---|---|
| Cd | Zn | Cu | Ni | Pb | As | |
| 1 | 0.121 | 0.460 | 2.242 | 0.032 | 24.181 | 0.004 |
| 2 | 1.325 | 16.062 | 1.375 | 0.130 | 33.544 | 0.192 |
| 3 | 4.367 | 4.396 | 0.142 | 0.187 | 0.543 | 0.573 |
| 4 | 2.632 | 6.262 | 0.350 | 0.112 | 1.360 | 0.121 |
| 5 | 1.023 | 1.211 | 0.421 | 0.031 | 0.133 | 21.885 |
| 6 | 0.961 | 0.273 | 0.165 | 0.007 | 7.981 | 93.383 |
| 7 | 0.003 | 0.008 | 0.000 | 0.004 | 0.090 | 93.625 |
| 8 | 0.021 | 0.140 | 0.041 | 0.014 | 0.682 | 195.814 |
| Sample | |||||||
|---|---|---|---|---|---|---|---|
| Cd | Zn | Cu | Ni | Pb | As | ||
| 1 | 3.62 | 0.46 | 11.28 | 0.15 | 120.91 | 0.04 | 136.15 |
| 2 | 39.10 | 16.06 | 6.85 | 0.54 | 167.73 | 1.91 | 232.01 |
| 3 | 130.82 | 4.39 | 0.73 | 0.93 | 2.74 | 5.75 | 144.47 |
| 4 | 78.02 | 6.26 | 1.75 | 0.55 | 6.85 | 1.00 | 94.36 |
| 5 | 30.61 | 1.21 | 2.14 | 0.15 | 0.55 | 218.87 | 253.36 |
| 6 | 28.83 | 0.27 | 0.83 | 0.035 | 39.90 | 933.81 | 1003.64 |
| 7 | 0.09 | 0.008 | 0.00 | 0.02 | 0.45 | 936.27 | 936.77 |
| 8 | 0.65 | 0.14 | 0.24 | 0.07 | 3.43 | 1958.06 | 1962.41 |
Publisher’s Note: MDPI stays neutral with regard to jurisdictional claims in published maps and institutional affiliations. |
© 2022 by the authors. Licensee MDPI, Basel, Switzerland. This article is an open access article distributed under the terms and conditions of the Creative Commons Attribution (CC BY) license (https://creativecommons.org/licenses/by/4.0/).
Share and Cite
Dedic, J.; Djokic, J.; Galjak, J.; Milentijevic, G.; Lazarevic, D.; Šarkočević, Ž.; Lekic, M. An Experimental Investigation of the Environmental Risk of a Metallurgical Waste Deposit. Minerals 2022, 12, 661. https://0-doi-org.brum.beds.ac.uk/10.3390/min12060661
Dedic J, Djokic J, Galjak J, Milentijevic G, Lazarevic D, Šarkočević Ž, Lekic M. An Experimental Investigation of the Environmental Risk of a Metallurgical Waste Deposit. Minerals. 2022; 12(6):661. https://0-doi-org.brum.beds.ac.uk/10.3390/min12060661
Chicago/Turabian StyleDedic, Jasmina, Jelena Djokic, Jovana Galjak, Gordana Milentijevic, Dragan Lazarevic, Živče Šarkočević, and Milena Lekic. 2022. "An Experimental Investigation of the Environmental Risk of a Metallurgical Waste Deposit" Minerals 12, no. 6: 661. https://0-doi-org.brum.beds.ac.uk/10.3390/min12060661