
The Southwestern Boundary of Cenozoic Qaidam Basin: Constraints from Heavy Mineral Analysis


1
Ministry of Education Key Laboratory of Orogenic Belts and Crustal Evolution, School of Earth and Space Sciences, Peking University, Beijing 100871, China
2
Research Institute of Petroleum Exploration and Development (RIPED), PetroChina, Beijing 100083, China
3
Previously in Research Institute of Exploration and Development, Qinghai Oilfield Company, PetroChina, Dunhuang 736202, China
*
Author to whom correspondence should be addressed.
Minerals 2022, 12(6), 768; https://0-doi-org.brum.beds.ac.uk/10.3390/min12060768
Submission received: 27 April 2022
/
Revised: 9 June 2022
/
Accepted: 14 June 2022
/
Published: 16 June 2022
(This article belongs to the Section Mineral Geochemistry and Geochronology)
Abstract
:The formation of the Qaidam Basin plays an important role in unraveling the growth history of the Tibetan plateau. An extraordinary thick Cenozoic sedimentary succession of the Qaidam Basin is a great contributor to the study of the basin’s evolution history. To date, there has been disagreement on the southwestern boundary of the Paleogene Qaidam Basin. In this study, the method of heavy mineral analysis was adopted to reconstruct the southwestern boundary of the Qaidam Basin. The stable heavy minerals which represent the maturity of detrital sediments can roughly reflect the distance between the source and the deposit area. Therefore, the isogram of the stable heavy mineral index (ZTR = 20) was compiled to infer the location of the source area of the southwestern Qaidam Basin. The isogram shows that the boundary of the southwestern Qaidam Basin stretched southwesterly to the present-day Qiman Tagh Eastern Kunlun Mountains during the Paleogene. Additionally, the isolines present a remarkable northward migration since the late Eocene, which indicates the boundary of the Cenozoic Qaidam Basin that withdrew northward since the late Eocene. The specific location of the southern source area of the Qaidam Basin can be deduced at the Adatan fault, the middle of the present-day Eastern Kunlun Mountains. This result also supports the idea that the Qaidam Basin was an independent basin during the early Cenozoic era, and the Eastern Kunlun Mountains have already been exhumed during that time, serving as a prominent source of clastic sediments in the southwestern Qaidam Basin.
1. Introduction
Due to the effect of the India–Eurasia collision, a series of basin range geomorphological systems have formed in the northeastern Tibet Plateau. Qaidam Basin is the largest continental basin located in the northeastern Tibetan plateau. It contains an exceptionally thick Cenozoic sedimentary succession, with an average thickness of up to 8 km [1,2,3]. Several critical geologic processes such as the growth mechanism and evolution history of the Tibetan Plateau [4,5,6], the initiation and development of the Asian monsoon and of Asian aridification [7,8,9], and the chemical weathering history of the Qaidam Basin [10,11,12] are likely recorded in this thick Cenozoic sedimentary sequence.
A tremendous amount of work on this thick sediment flux has been performed, which refers to the tectonic and paleoclimatic evolution in the Qaidam Basin during the Cenozoic. However, several critical issues related to the evolution of the Qaidam Basin remain controversial, one of which is the southwestern boundary of the Qaidam Basin in the Paleogene [13]. Reconstructing the southwestern boundary of the Qaidam Basin contributes to the understanding of the tectonic evolution of the Qaidam Basin, which may shed light on the deformation pattern of the northern Tibetan plateau. The crux of this highly debated issue is whether the Eastern Kunlun Mountains were exhumed during the Early Cenozoic. Some studies demonstrated that the Eastern Kunlun Mountains did not uplift during Paleogene and the Qaidam Basin was integrated with the Hoh Xil basin and Kumukuli basin, which is described as a wide Paleo-Qaidam Basin with negligible topographic relief in the Eastern Kunlun Mountains [14,15,16]. In contrast, other studies proposed that the Qaidam Basin and the Hoh Xil basin were mutually independent basins during the Paleogene, with the exhumation of the Eastern Kunlun Mountains during the Early Cenozoic [17,18,19,20]. Most studies of reconstructing the morphology of the basin mainly focused on the seismic data and the thickness patterns [14,21,22], while the analyses of clastic deposits are relatively scarce. In addition, a few studies on clastic sediments to reconstruct the boundary of the southwestern Qaidam Basin mainly focused on the comparison of their sedimentary characteristics and sequences between the Qaidam Basin and the adjacent basins [15,23]. However, it is likely that the similar tectonic setting and depositional environment may contribute to the similar sedimentary features, which may lead to the misunderstanding of the reconstruction of the basin boundary.
Heavy mineral analysis has been widely used to analyze the source-sink system of the basin [24,25] and has been successfully applied in sedimentological studies [26,27]. Therefore, additional research associated with heavy minerals is necessary to complement the sedimentology to acquire a comprehensive understanding of the scale of the Qaidam Basin and the structural relations between the Eastern Kunlun Mountains and the Qaidam Basin.
In this study, the method of heavy mineral analyses (including heavy mineral assemblages and ratios), in combination with the studies on the provenance and the evolution of sedimentary facies, was adopted to conduct a comprehensive analysis of the southwestern boundary of the Qaidam Basin. The objectives of this paper are twofold: (1) to reconstruct the southwestern boundary of the Cenozoic Qaidam Basin; (2) to reconstruct the evolution of sedimentary filling of the Qaidam Basin.
2. Geologic Setting and Stratigraphy
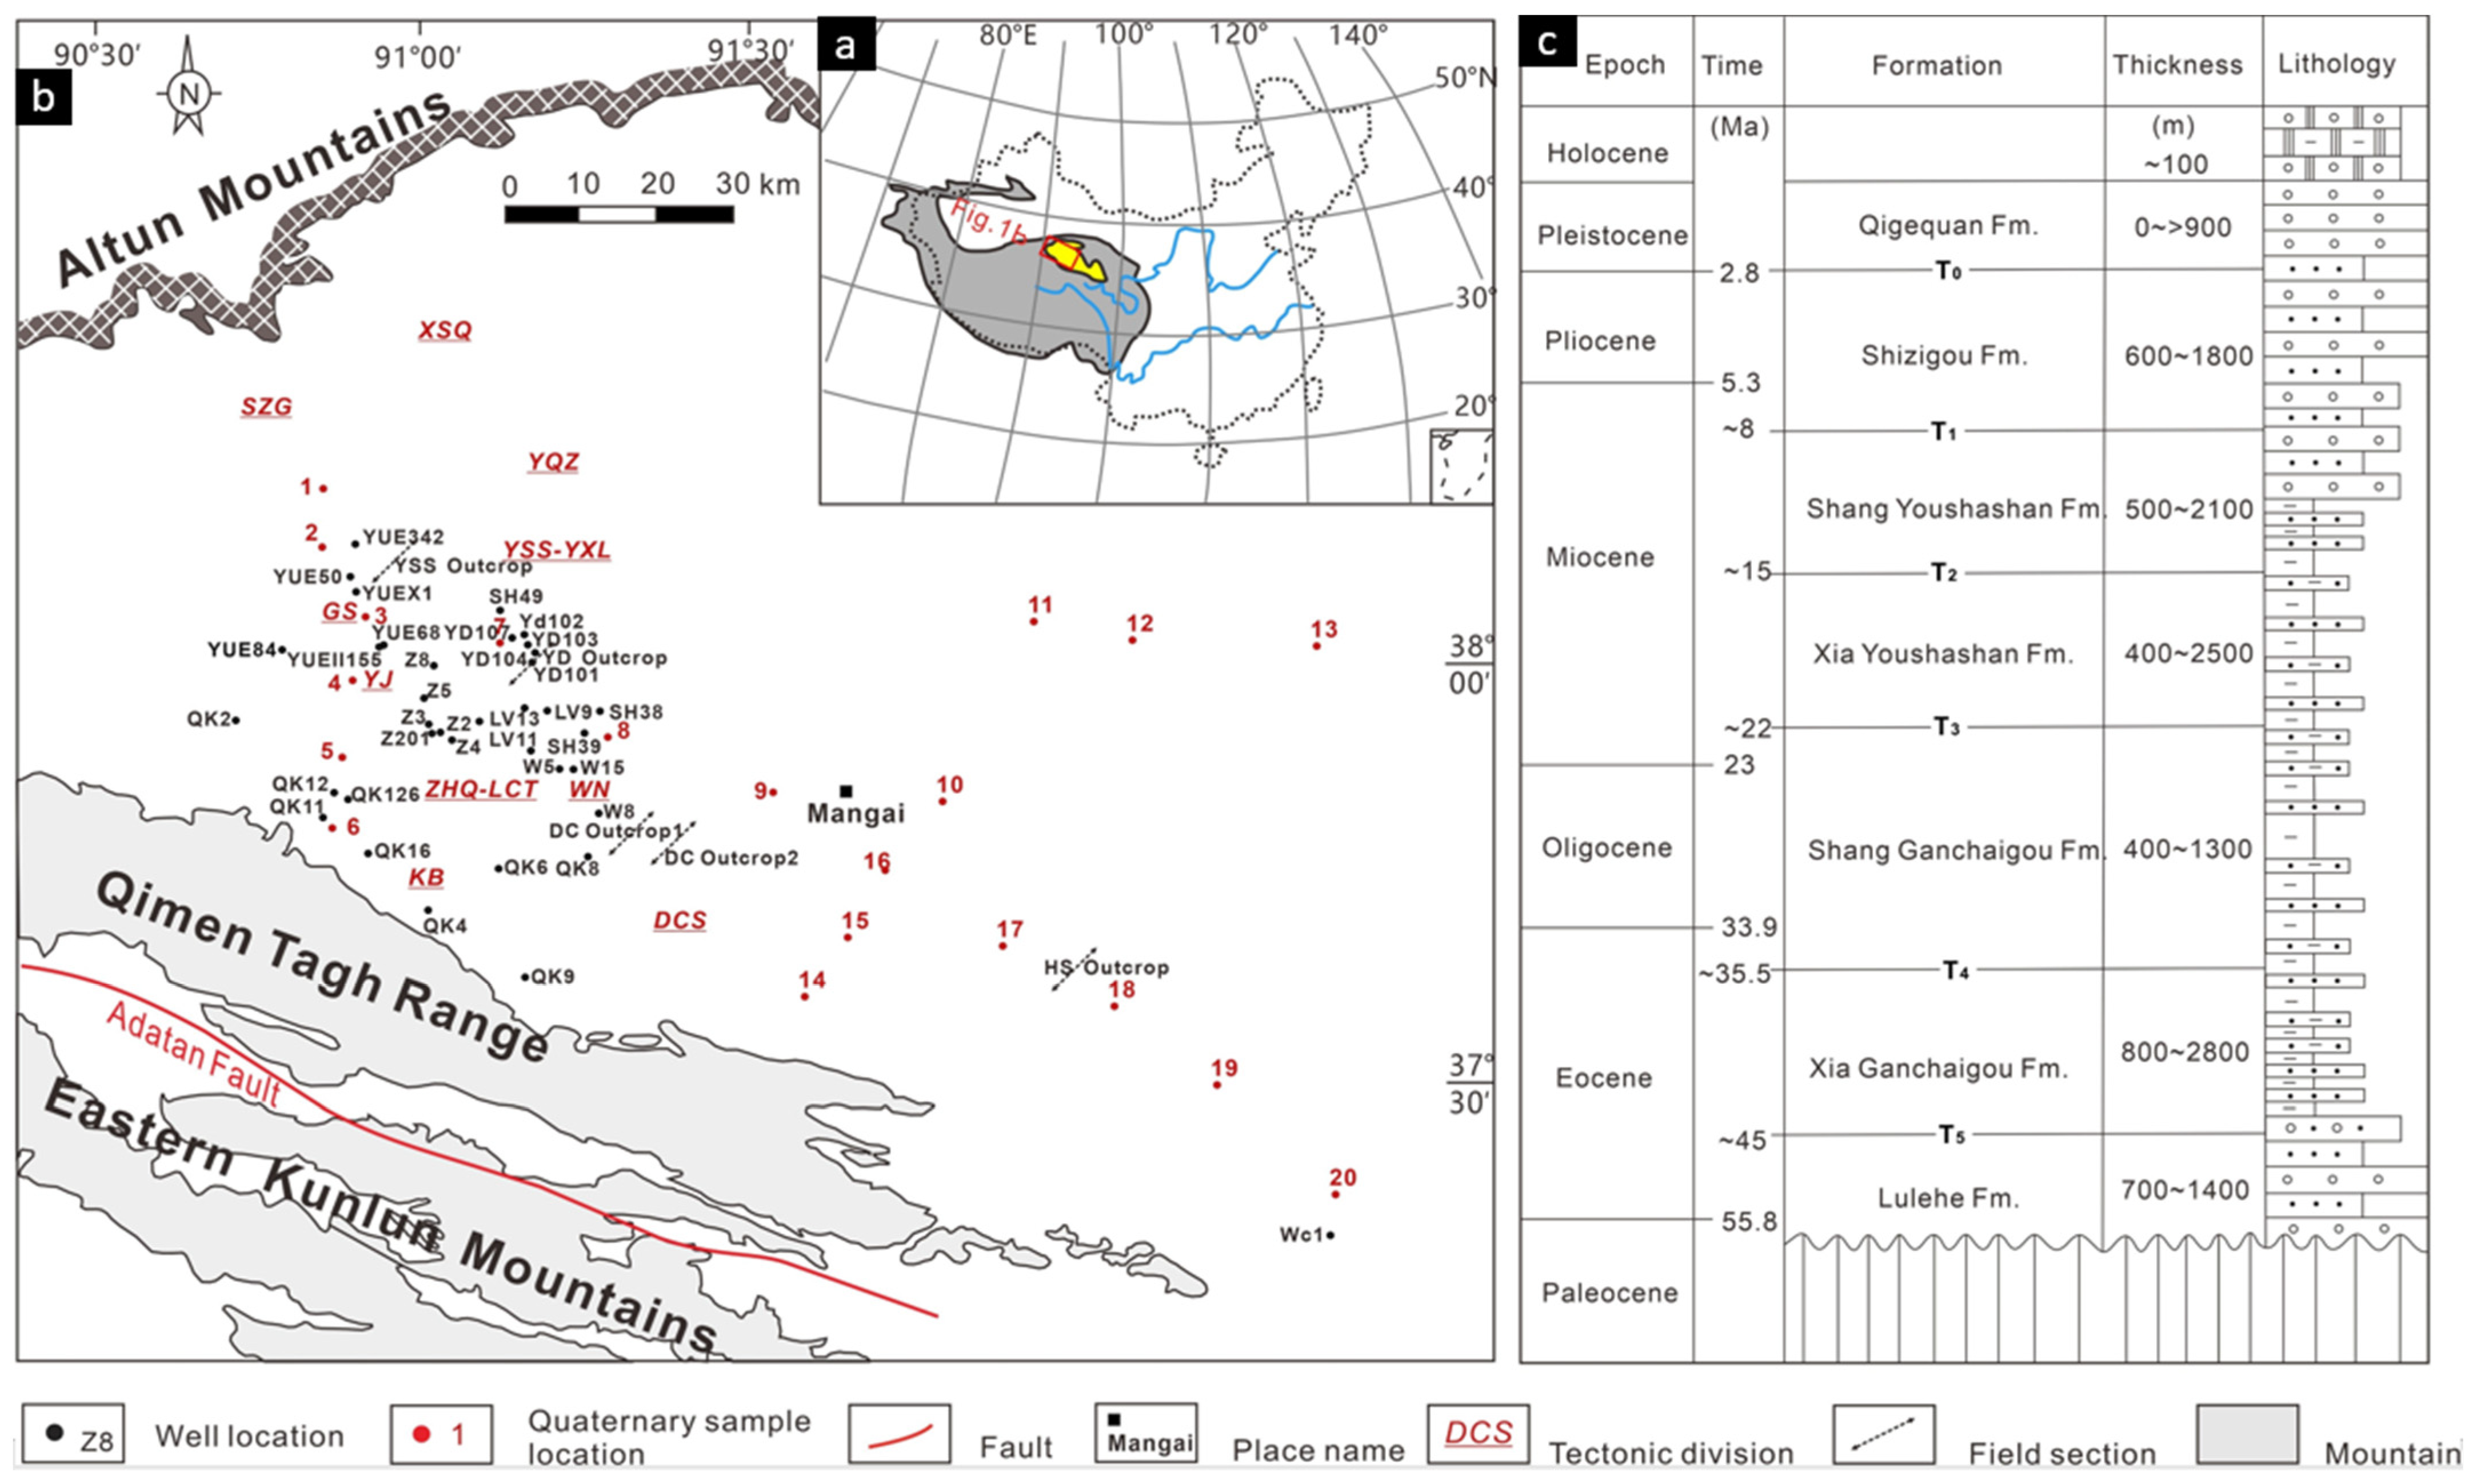
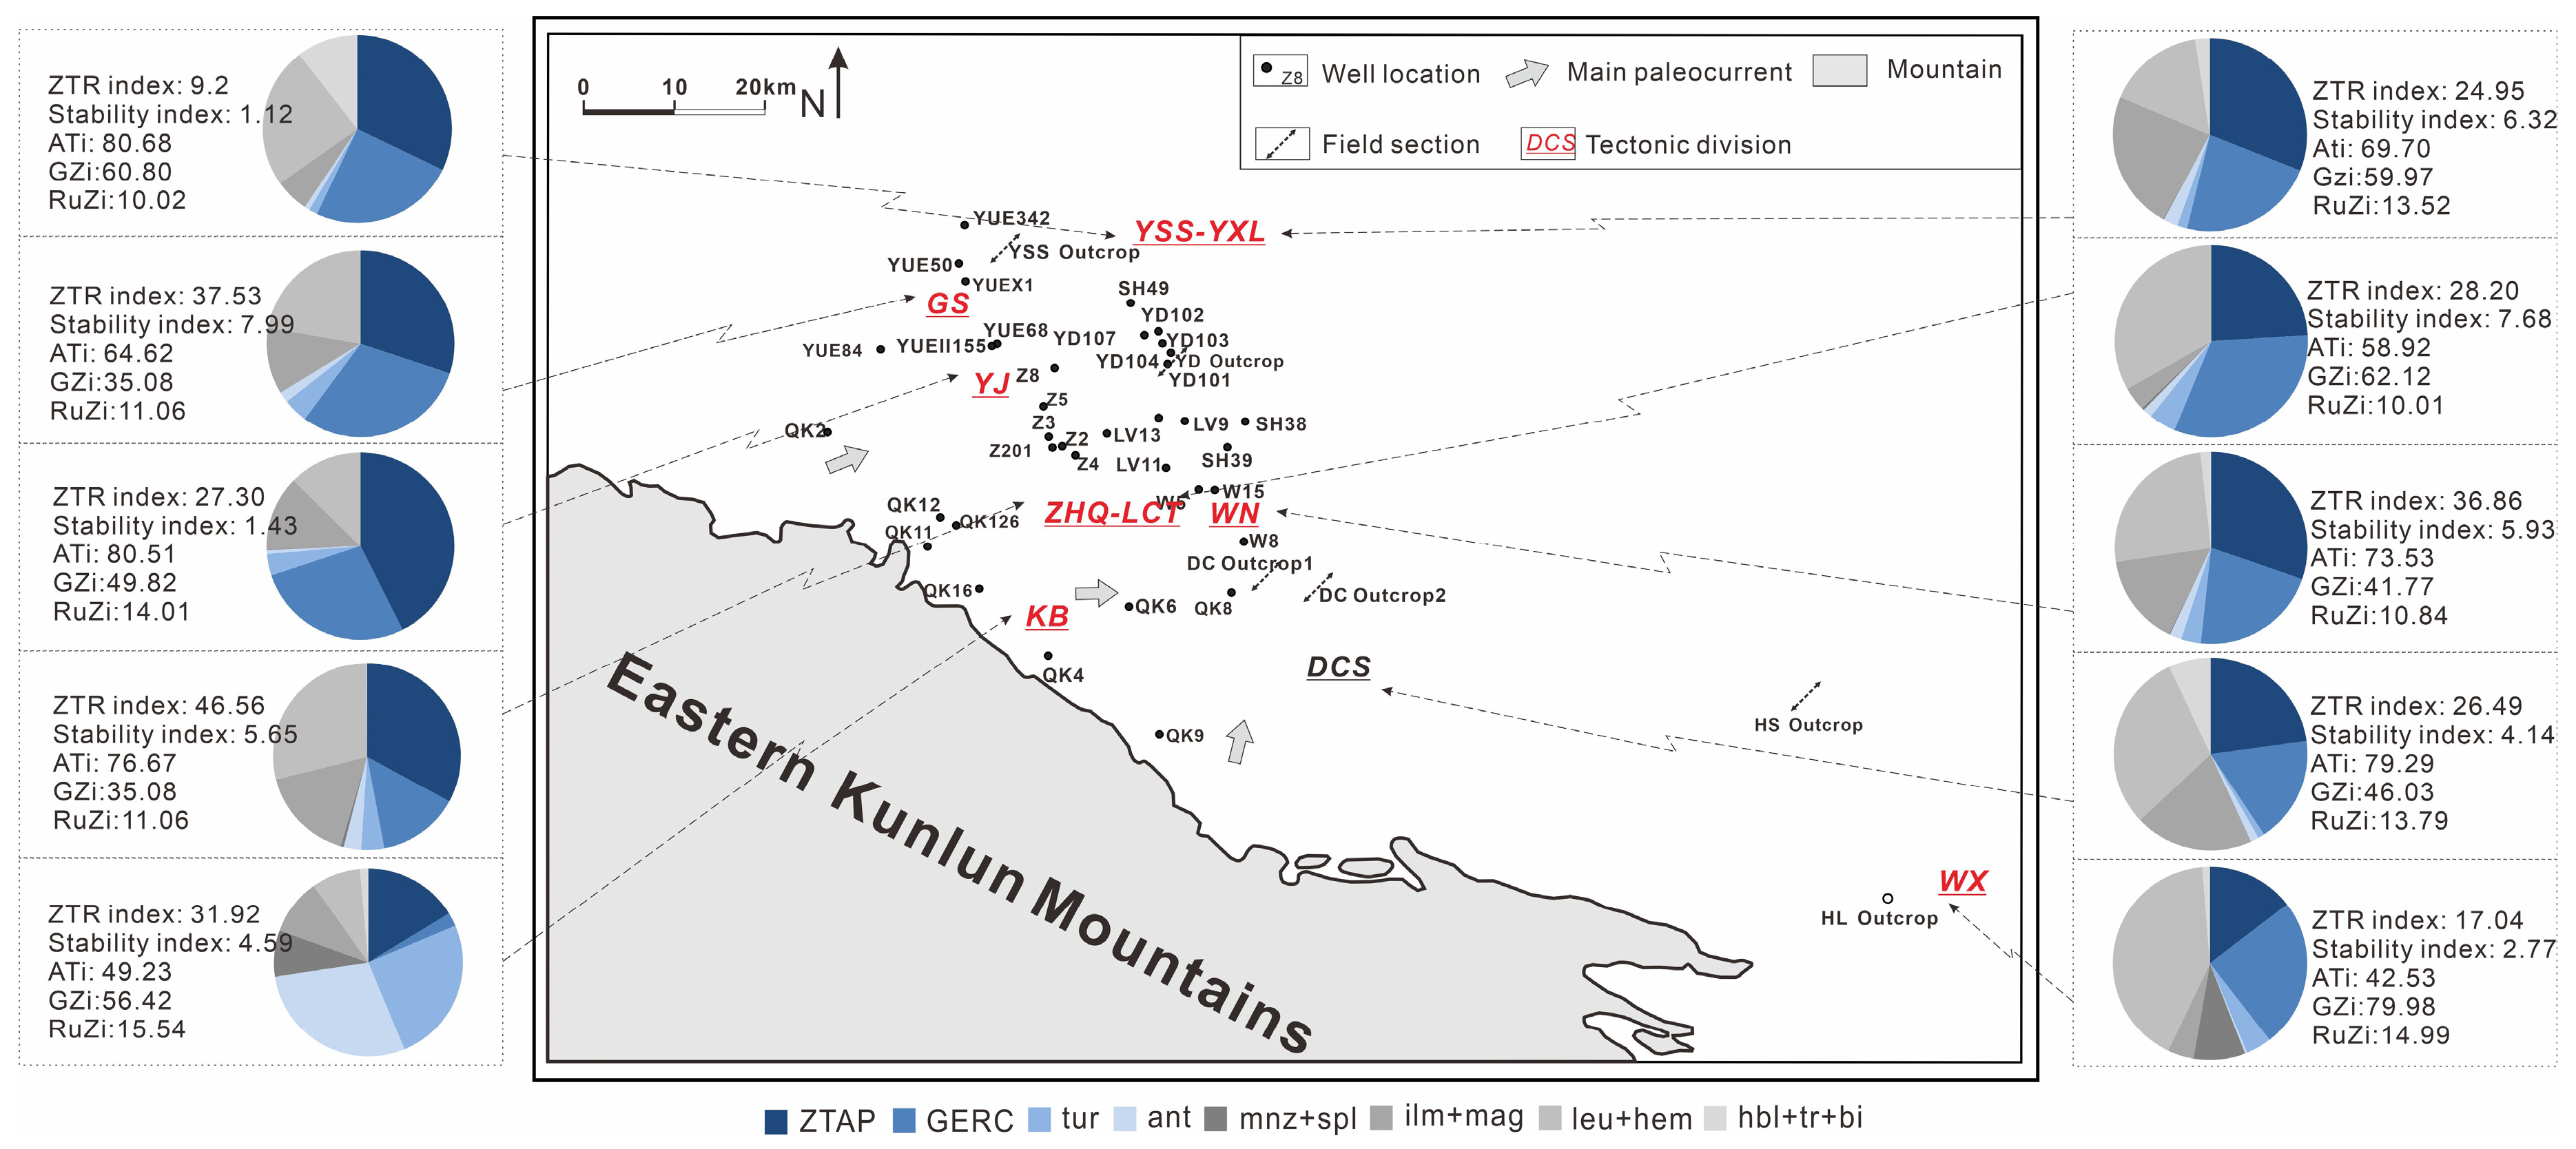
The Qaidam Basin is located in the northeastern Tibetan Plateau (Figure 1a), with altitudes mainly between 2700 and 3200 m [28]. This irregular diamond-shaped basin has a wider western section and a narrower eastern section, with a total area of 121,000 km2. The basin is confined by three mountain ranges: the Altun Mountains to the northwest, the Qilian Mountains to the northeast, and the Eastern Kunlun Mountains to the south. These three large mountain ranges are generally regarded as reliable provenances for the Qaidam Basin [29]. Tectonically, the basin is structurally bounded by three large fault systems: the left lateral strike-slip Altyn Tagh Fault to the northwest [3,30,31]; the South Qilian Shan-Nan Shan thrust belt to the northeast [32,33,34], and the Kunlun thrust belt to the south [35,36]. The Qimen Tagh Range was located in the northern part of the Eastern Kunlun Mountains, and the left-lateral strike-slip of the Qimen Tagh fault systems was initiated during the Pleistocene [36]. The main part of the Qimen Tagh Range and the Eastern Kunlun Mountains were separated by the Adatan Fault (Figure 1b).
Generally, the Cenozoic sediments directly lie over the pre-Mesozoic basement in the southwestern Qaidam Basin. According to the studies on paleomagnetism, paleontology, geochronology, and petrology [37,38,39], the Cenozoic strata of the Qaidam Basin can be successively divided into seven stratigraphic units compared with seismic reflectors (T0–T5 in Figure 1c). The lithostratigraphic formations from oldest to youngest are listed as follows: the Lulehe Formation (Paleocene to early Eocene, ?–~45 Ma); the Xia Ganchaigou Formation (middle to late Eocene, ~45 Ma–~35.5 Ma); the Shang Ganchaigou Formation (late Eocene to Oligocene, ~35.5–~22 Ma); the Xia Youshashan Formation (early to middle Miocene, ~22–~15 Ma); the Shang Youshashan Formation (middle to late Miocene, ~15–~8 Ma); the Shizigou Formation (late Miocene to Pliocene, ~8–~2.8 Ma); and the Qigequan Formation (Quaternary, ~2.8 Ma–present).
3. Materials and Methods
Detailed sample collection for petrological and sedimentological analysis was carried out from 2 outcrop sections (Figure 1b, Youshashan Outcrop and Dongchaishan Outcrop) and 7 long-interval exploration wells, which cover most of the study area. Depth corrections for the drilling cores were conducted based on the well logging data. The outcrop sections and rock cores were investigated and described in detail for facies analysis. In addition, the well logging curves were collected to provide supplementary information on the interpretation of sedimentary facies. More than 100 samples were collected and were further ground into thin sections for petrography. Their petrological features, involving mineral composition, grain size, shape, sorting, and fabric, were observed using a polarization microscope.
A total of 110 sandstone samples in this research were collected for heavy mineral analysis from 37 drilling wells and 6 outcrops of 10 exploration areas (Yuejin, Youshashan, Gasi, Yingdong, Zhahaquan, Dongchaishan, Wunan, Lvcaotan, Kunbei, and Wanxi) in the southwestern Qaidam Basin (Figure 1b). These samples are from the Xia Ganchaigou Formation to the Shang Youshashan Formation. Meanwhile, 20 Quaternary samples were collected in the field, the locations of which are shown in Figure 1b.
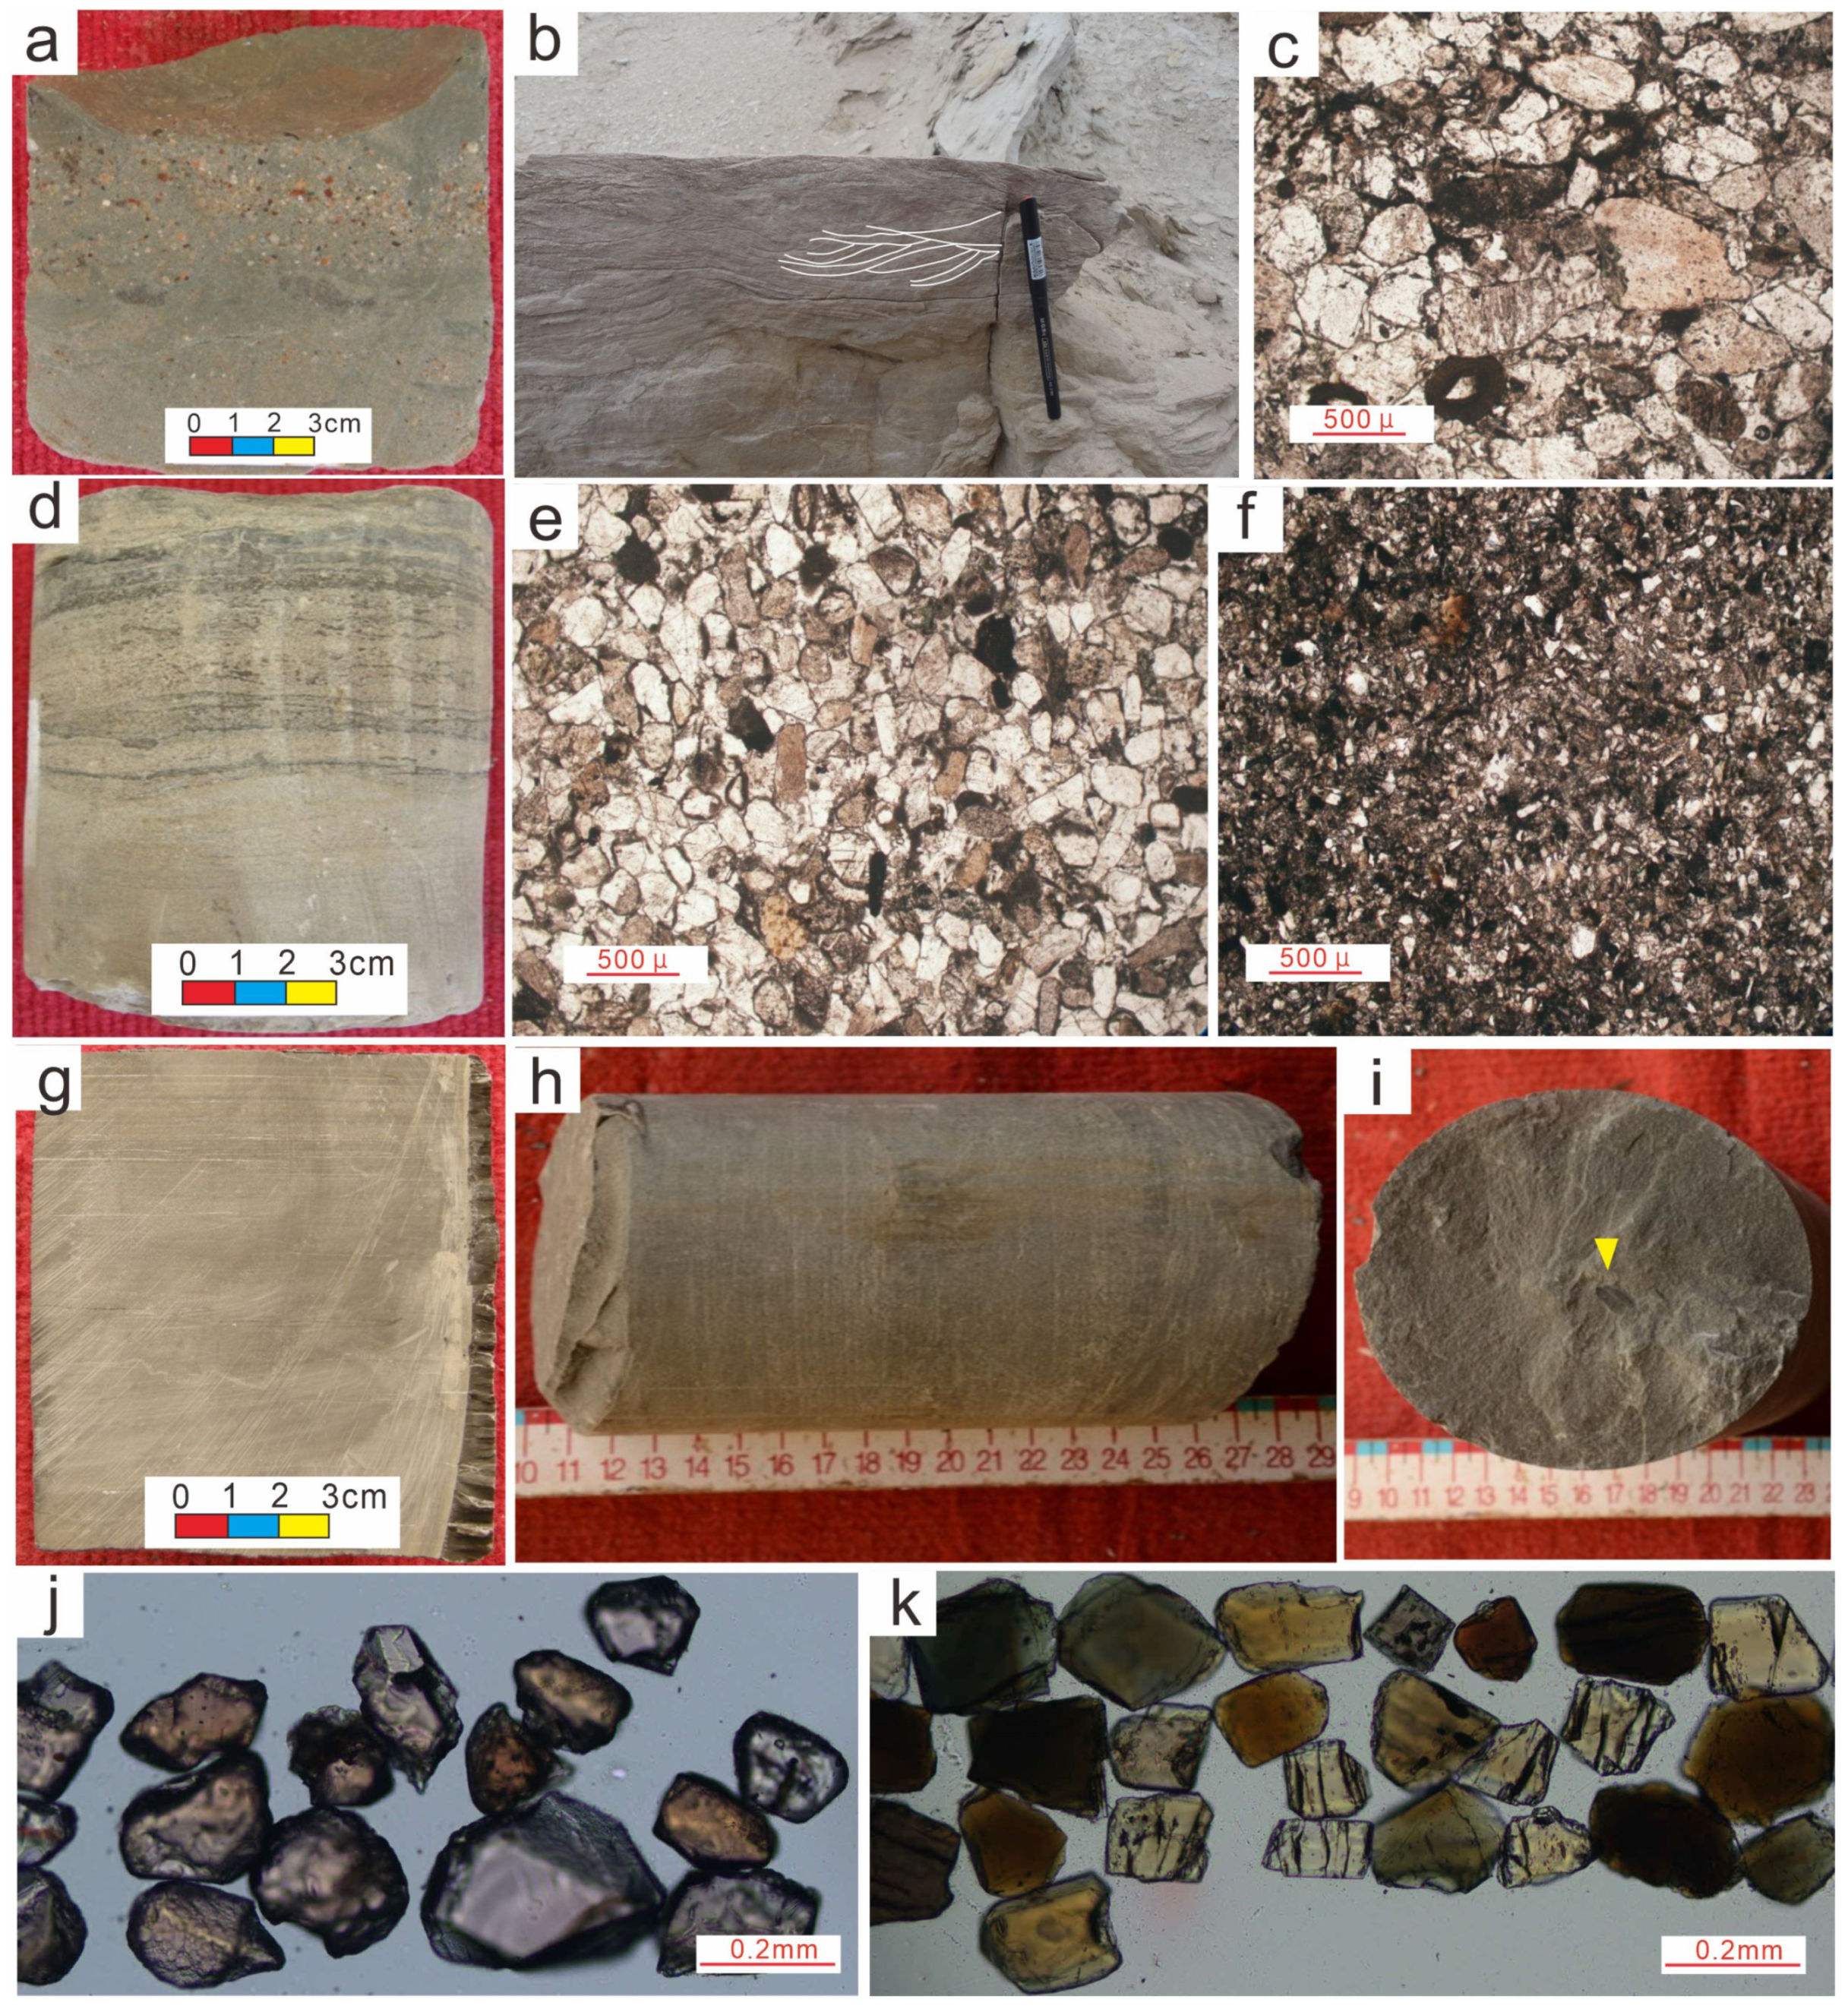
The sandstone samples for heavy mineral analysis were selected from medium- to coarse-grained sandstones with low weathering intensity (Figure 2j,k), which conforms to the requirements of the heavy mineral analysis [40]. Each sample has undergone the processes of crushing, oil removal, acidification, elutriation, drying, heavy mineral separation, and extraction. Subsequently, point-counting method [41] was adopted to calculate the content of heavy minerals under the polarization microscope.
4. Sedimentary Facies Analysis
4.1. Lithofacies
4.1.1. Facies 1: Massive Conglomerates
The massive conglomerate facies are mainly red-brown and gray, with a maximum diameter of 10~30 cm and a minimum diameter of 1–2 mm. The gravel is generally rounded and sub-rounded in shape and exhibits poor sorting. In most cases, the isolated gravel is supported by silt and clay matrix. The composition of the gravel is complex, with visible quartz, feldspar, flint, etc. Trough cross bedding can be seen in some gravel beds (Figure 2a). The conglomerate facies only occur in the Xia Ganchaigou Formation in the study area.
4.1.2. Facies 2: Massive Sandstone and Siltstone
Facies 2 is mainly composed of yellowish medium to fine sandstones with subordinate coarse sandstones and siltstones. In the outcrop and drilling core scale, trough cross-bedding and tabular cross-bedding can be observed (Figure 2b,d). The clasts are mainly composed of quartz, with a small amount of feldspar and lithic fragments (mainly metamorphic) (Figure 2f). Detrital framework grains are mainly sub-rounded and sub-angular in shape, with a largely grain-supported fabric, and show moderate sorting (Figure 2c,e). In general, the textural maturity of the detrital grains is relatively low. Facies 2 is present in the Xia Ganchaigou Formation, Xia Youshashan Formation, and Shang Youshashan Formation.
4.1.3. Facies 3: Massive Mudstone
In the study area, the color of the mudstone is mainly brownish red, purplish red, purplish brown, gray-green, and gray, which reflects the different depositional environments (Figure 2g,h). The mudstone in this study is mainly in a massive structure with limited laminations. Centimeter-sized plant remains and carbon debris are presented in some greyish massive mudstone (Figure 2i). Facies 3 is predominantly present in the Shang Ganchaigou Formation.
4.2. Sedimentary Facies
Based on the associations of lithofacies, five distinct sedimentary facies can be recognized in the study area, i.e., alluvial facies, fan delta facies, fluvial facies, delta facies, and lake facies. The major features of each sedimentary facies are stated as follows.
Alluvial facies are mainly composed of conglomerates, breccia, and argillaceous conglomerates. The gravel is poorly sorted, with an extensive muddy matrix, which is mainly brownish red and purple-red in color. The conglomerates and gravel sandstone are mainly variegated, and the composition of the gravel is complex, including quartz, feldspar, chert, granite, gneiss, limestone, and mudstone.
Fan delta facies mainly consist of medium and coarse-grained clastic rocks, most of which are conglomerates, pebbly sandstones, and coarse sandstones interbedded with mudstones. The composition of the gravel is complex and the roundness is mainly sub-round and angular. Massive bedding, large cross-bedding, and sequence bedding are usually exhibited in the facies.
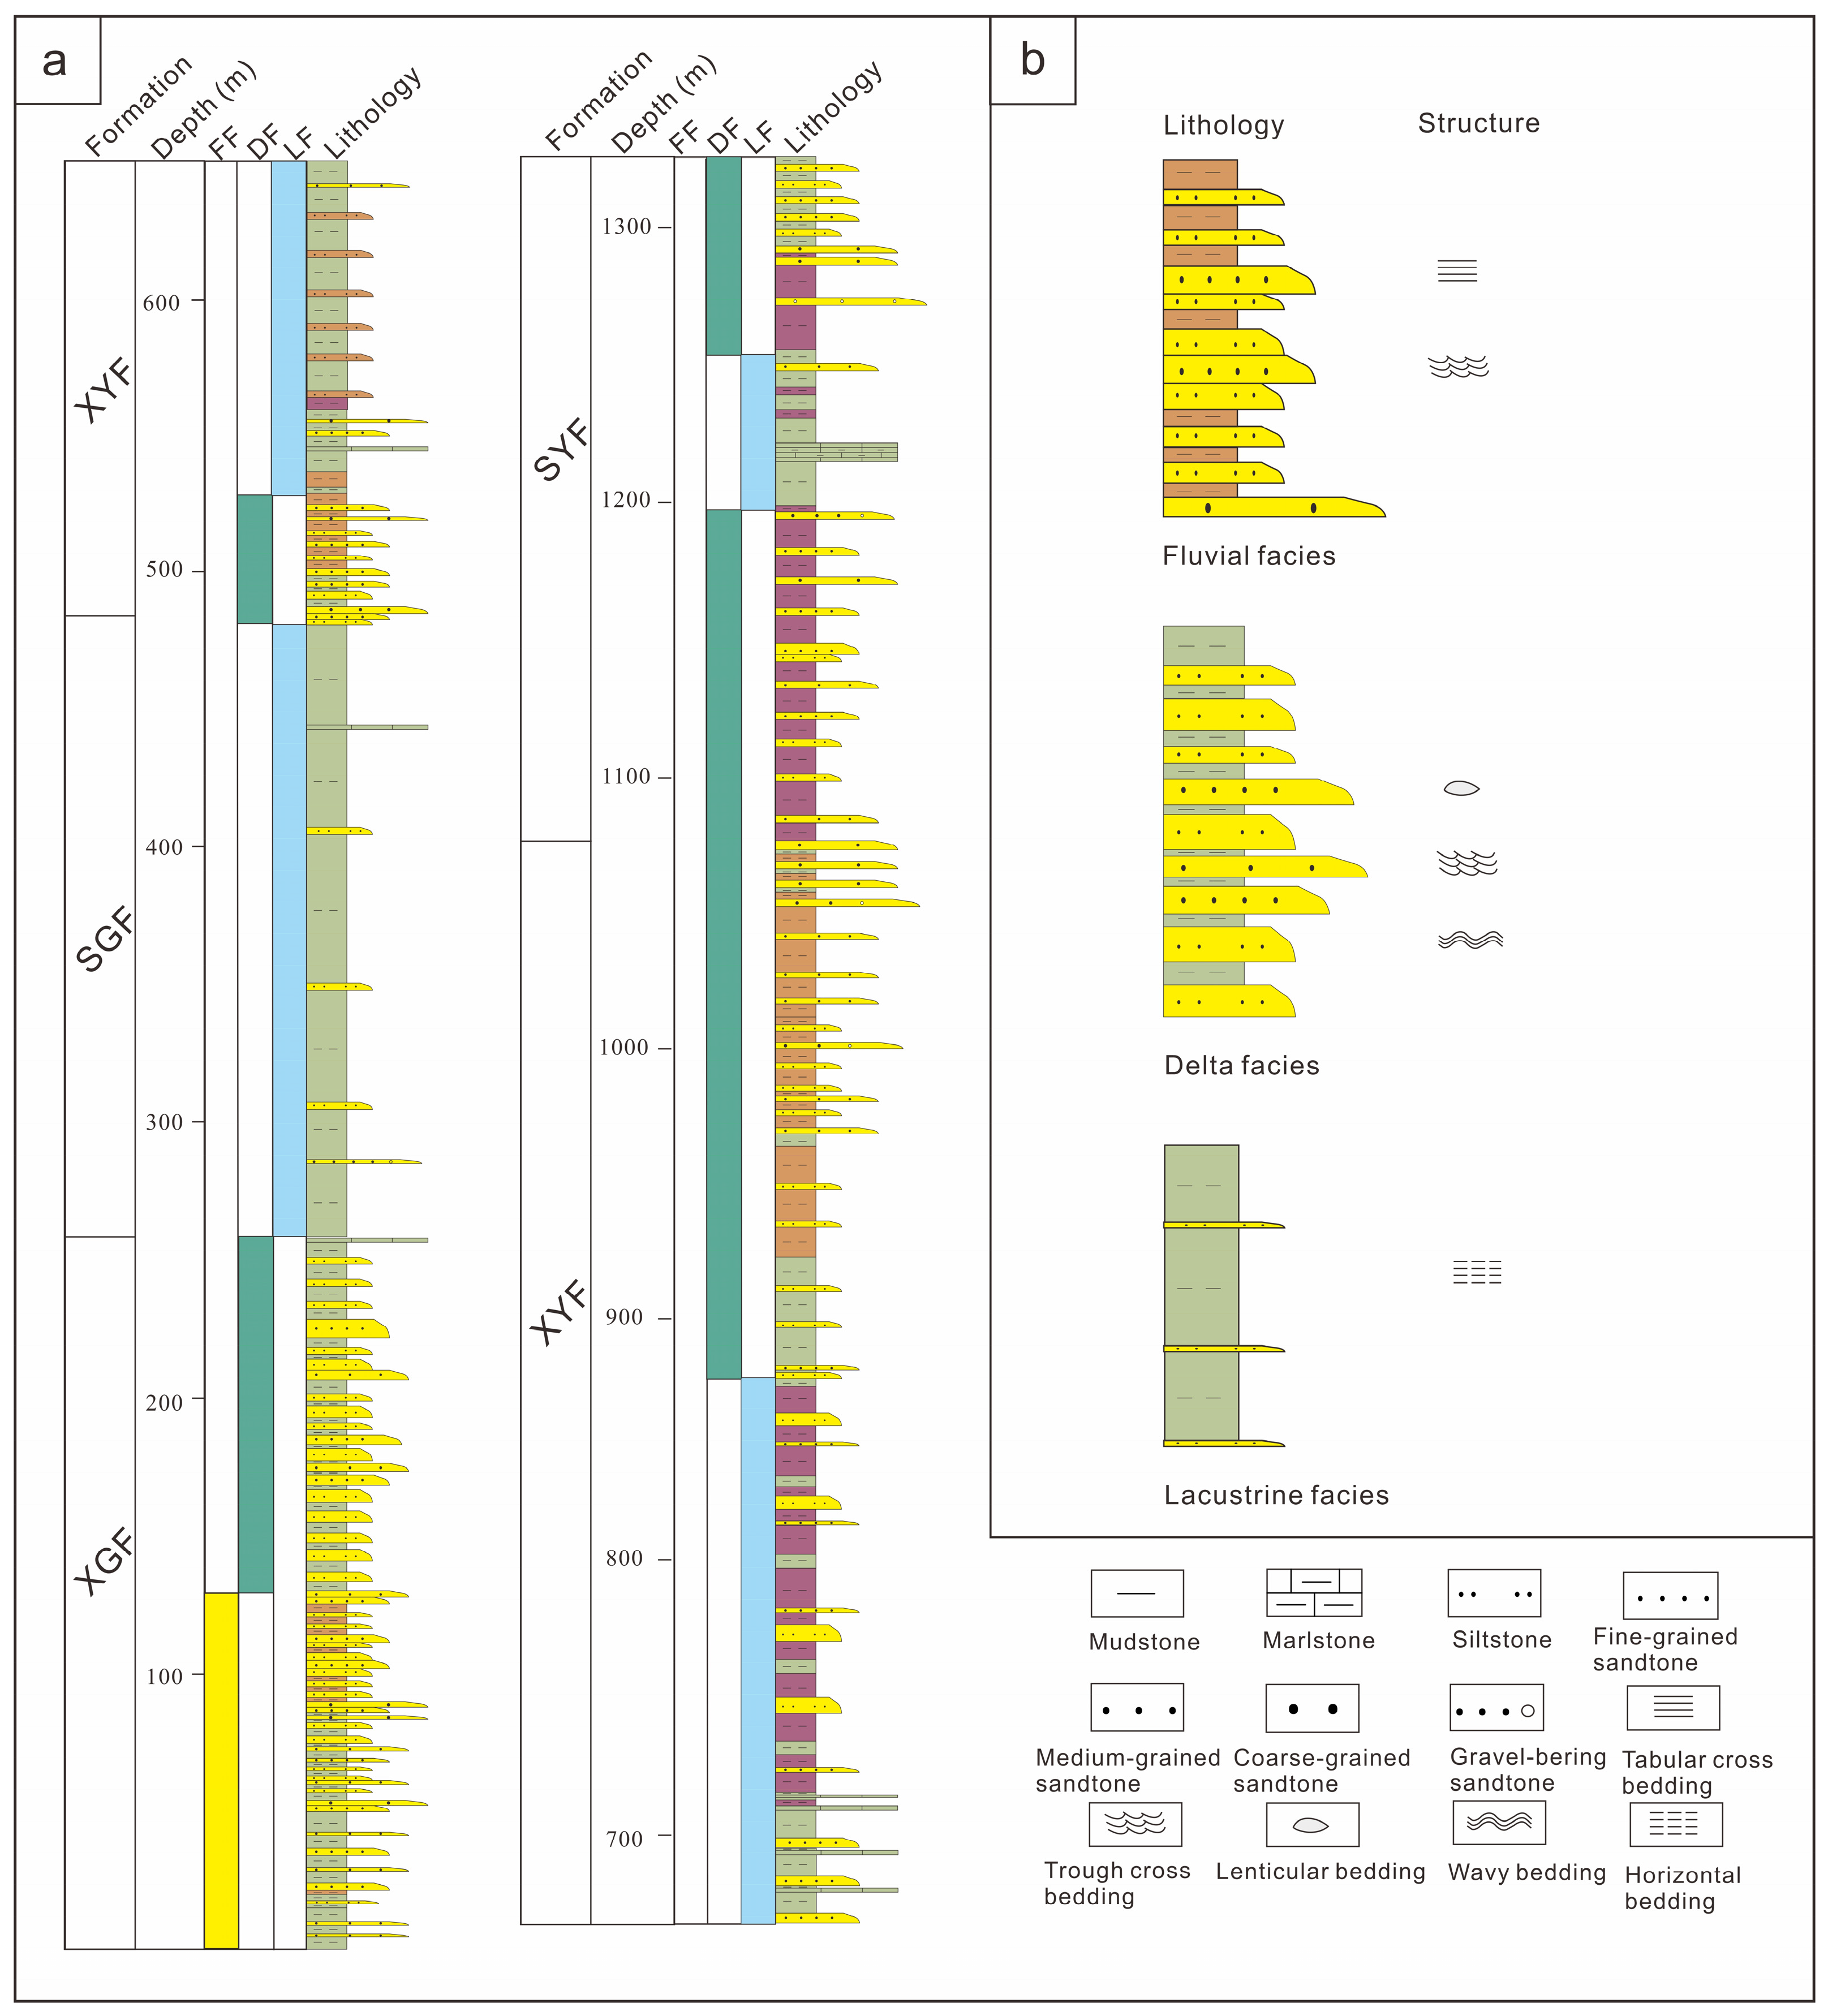
The sediments of the fluvial facies mainly include medium-fine conglomerates, sandstones of different grain sizes, and some mudstones. The conglomerates are mainly retained deposits of the riverbed with an imbricated arrangement and obvious erosion structures at the bottom. The sorting and roundness of fluvial clastic sediments are medium to poor, and the sedimentary structures are rich, including tabular and trough cross-bedding. Compared with the meandering river facies, the braided river is more developed in the study area, which is characterized by coarse-grained sediments and various cross-bedding (Figure 3b).
The rock types of delta facies are mainly composed of medium-fine sandstone, siltstone and mudstone. Delta plain and frontal subfacies mainly represent the overwater part and underwater part. In the delta plain subfacies, the channels mainly consist of conglomerates and interdistributary bays mainly comprise mudstones and siltstones. Deltaic facies are characterized by wavy bedding, horizontal bedding, lenticular bedding, and cross-bedding. During the sedimentary periods, the delta can migrate and swing at times, and there will be multiple erosion surfaces, and the sand bodies of the channel are superposed (Figure 3b).
According to the change in water level, the lacustrine facies can be divided into lakeshore, shallow lakes, semi-deep lakes, and deep lake subfacies. The lakeshore subfacies are often in an exposed environment, so oxidation color, exposed structures, and biological remains can be observed in the sediments. The sediments of shallow lakes are usually gray and grayish white, with fine siltstone and mudstone, and limestone. Wavy bedding, lenticular bedding, and veined bedding are developed in both lakeshore and shallow lakes. Semi-deep and deep lakes mainly consist of gray-black mudstone, and the marl usually developed horizontal bedding (Figure 3b).
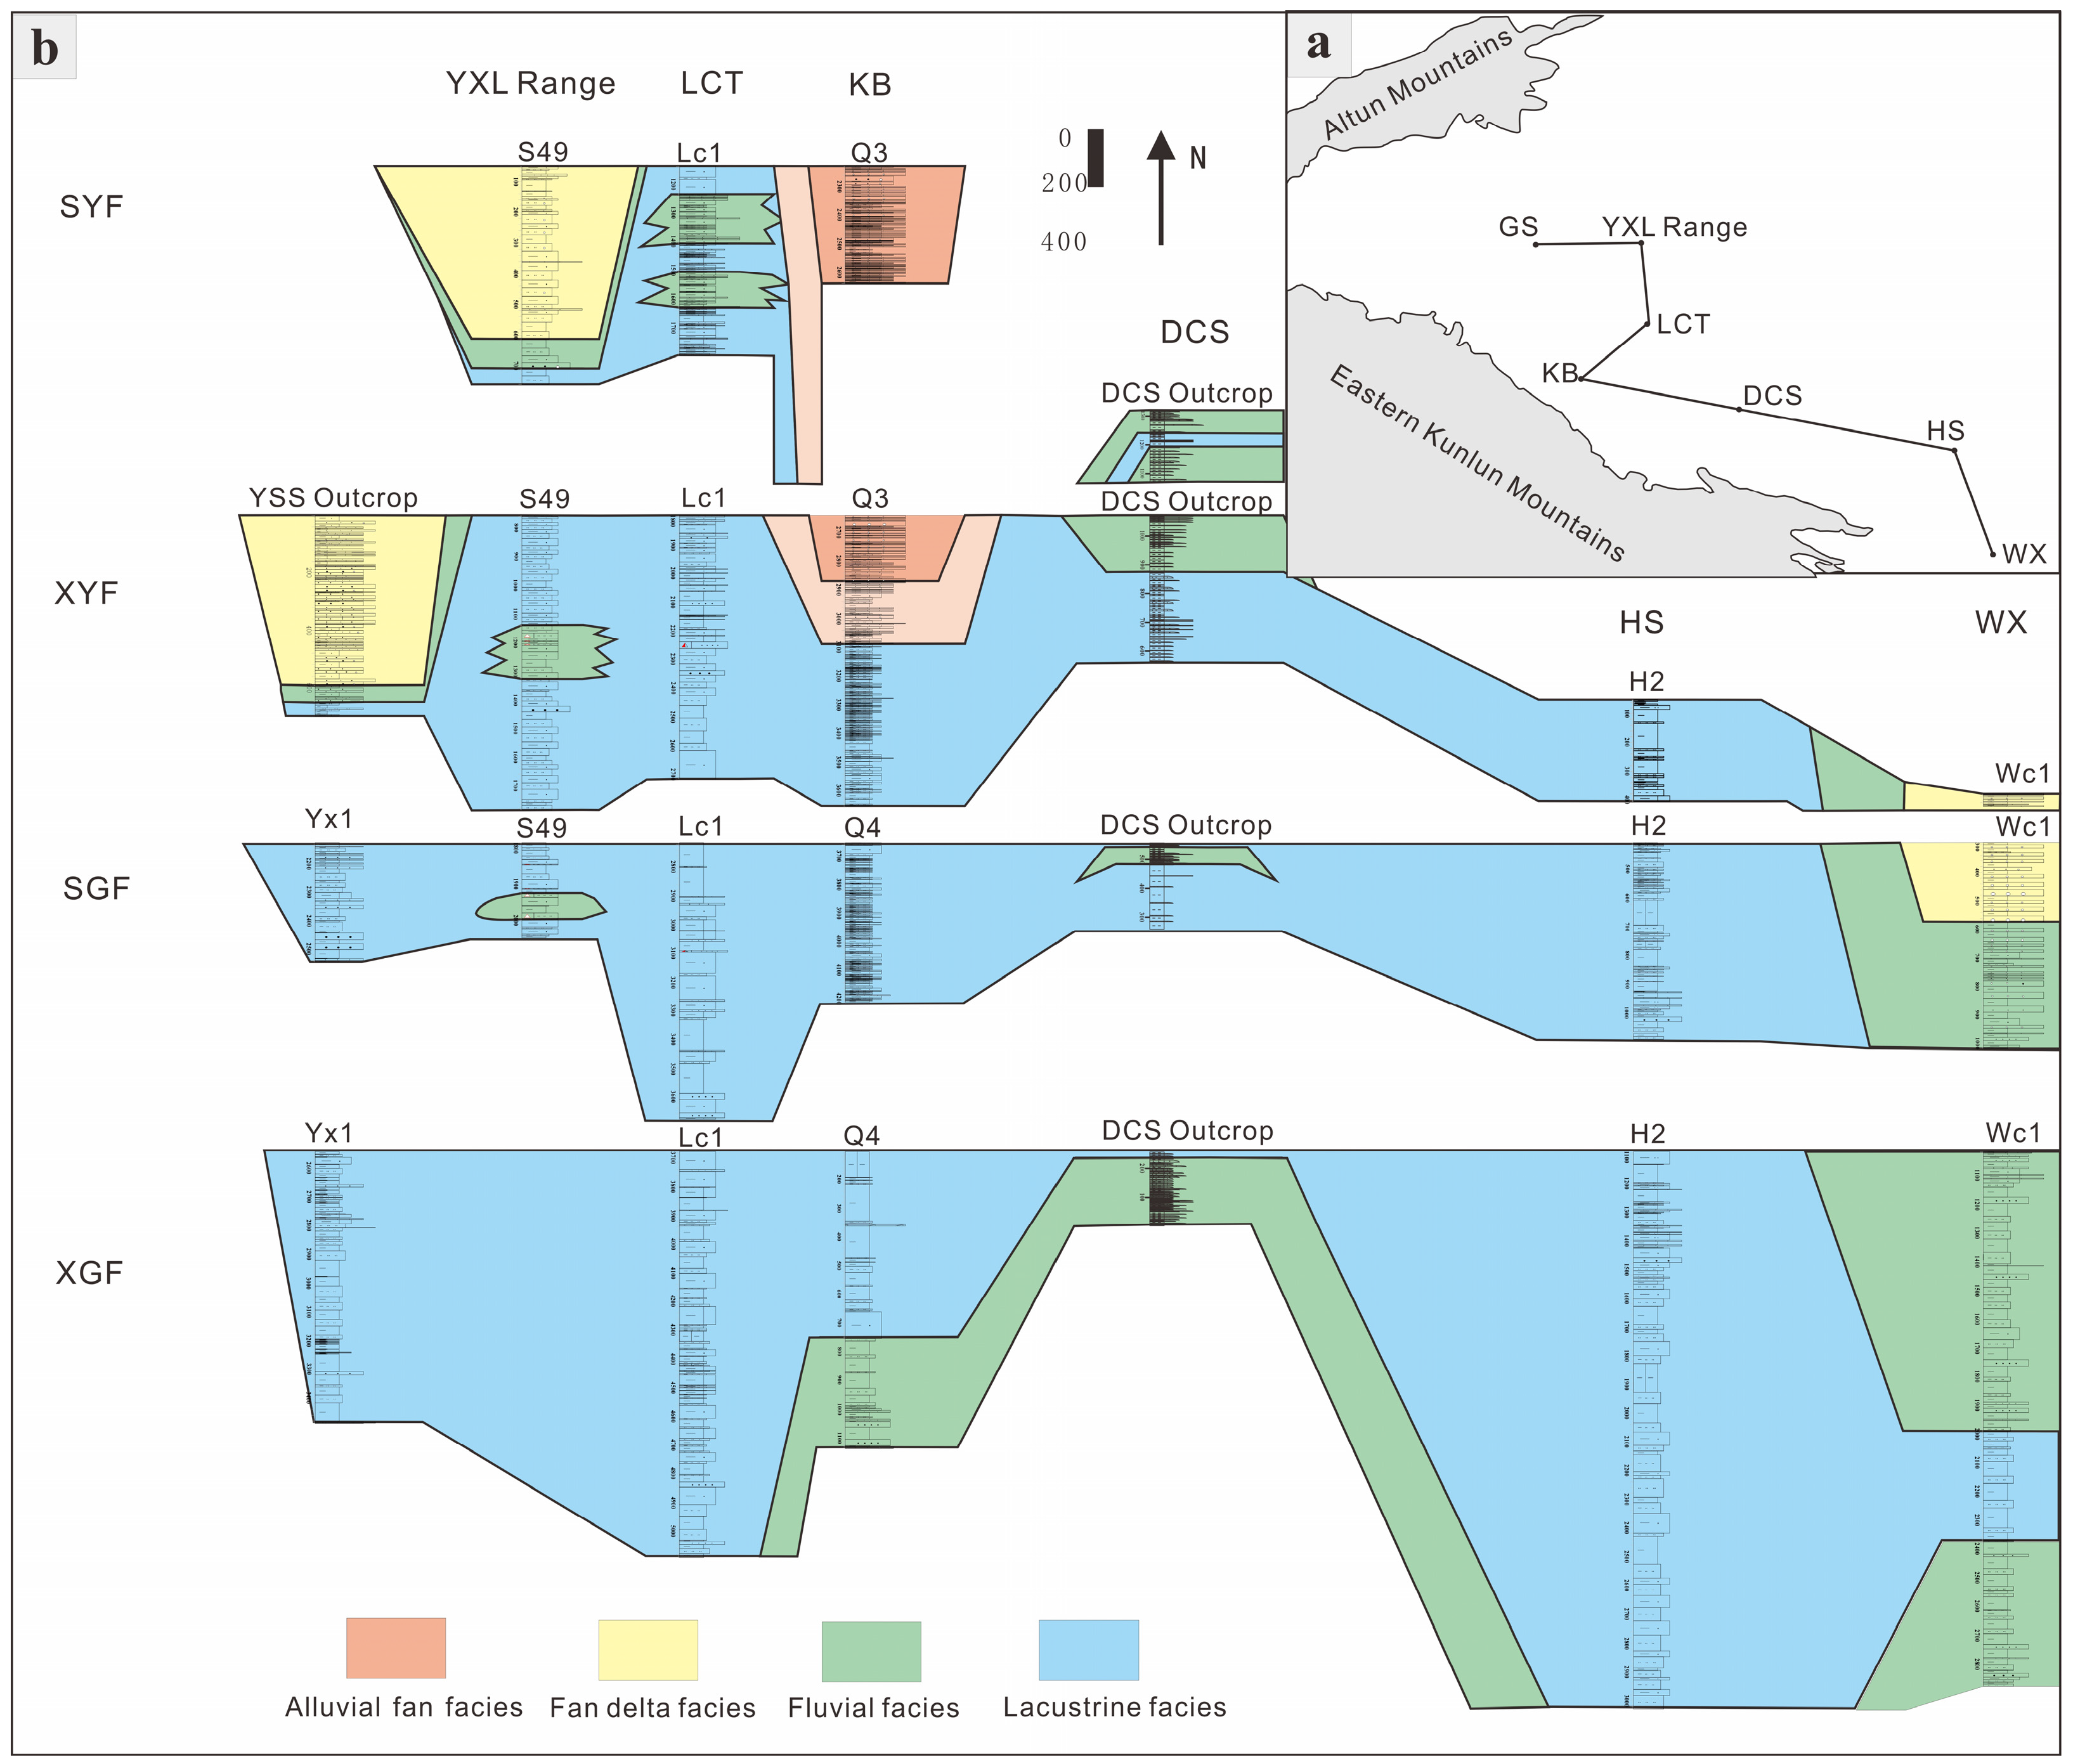
Based on the features of the five sedimentary facies described above, the evolution of the sedimentary facies of the Dongchaishan outcrop section is discussed in this study (Figure 3a). The lower part of the Xia Ganchaigou Formation is mainly composed of yellowish medium-coarse sandstone, as well as greenish and brownish mudstone and siltstone. The typical dual structure indicates the fluvial facies. During the Shang Ganchaigou Formation and the Xia Youshashan Formation, the sedimentary facies evolved into lacustrine facies occasionally interlaced with delta facies, with the increasing proportion of the mudstone. In the upper part of the Xia Youshashan Formation, the contents of the sandstone gradually increased, accompanied by the appearance of the purple-red mudstone. The variation of the lithology indicates the shrinkage of the lake, replaced by the delta facies. The correlation results of different regions in the study area indicate that the lacustrine facies mainly developed in the Xia Ganchaigou Formation and Shang Ganchaigou Formation. Since the Xia Youshashan Formation, the area of the lack contracted, with the appearance of the fan delta, delta, and fluvial facies (Figure 4b).
5. Heavy Mineral Analysis
5.1. Heavy Mineral Assemblages
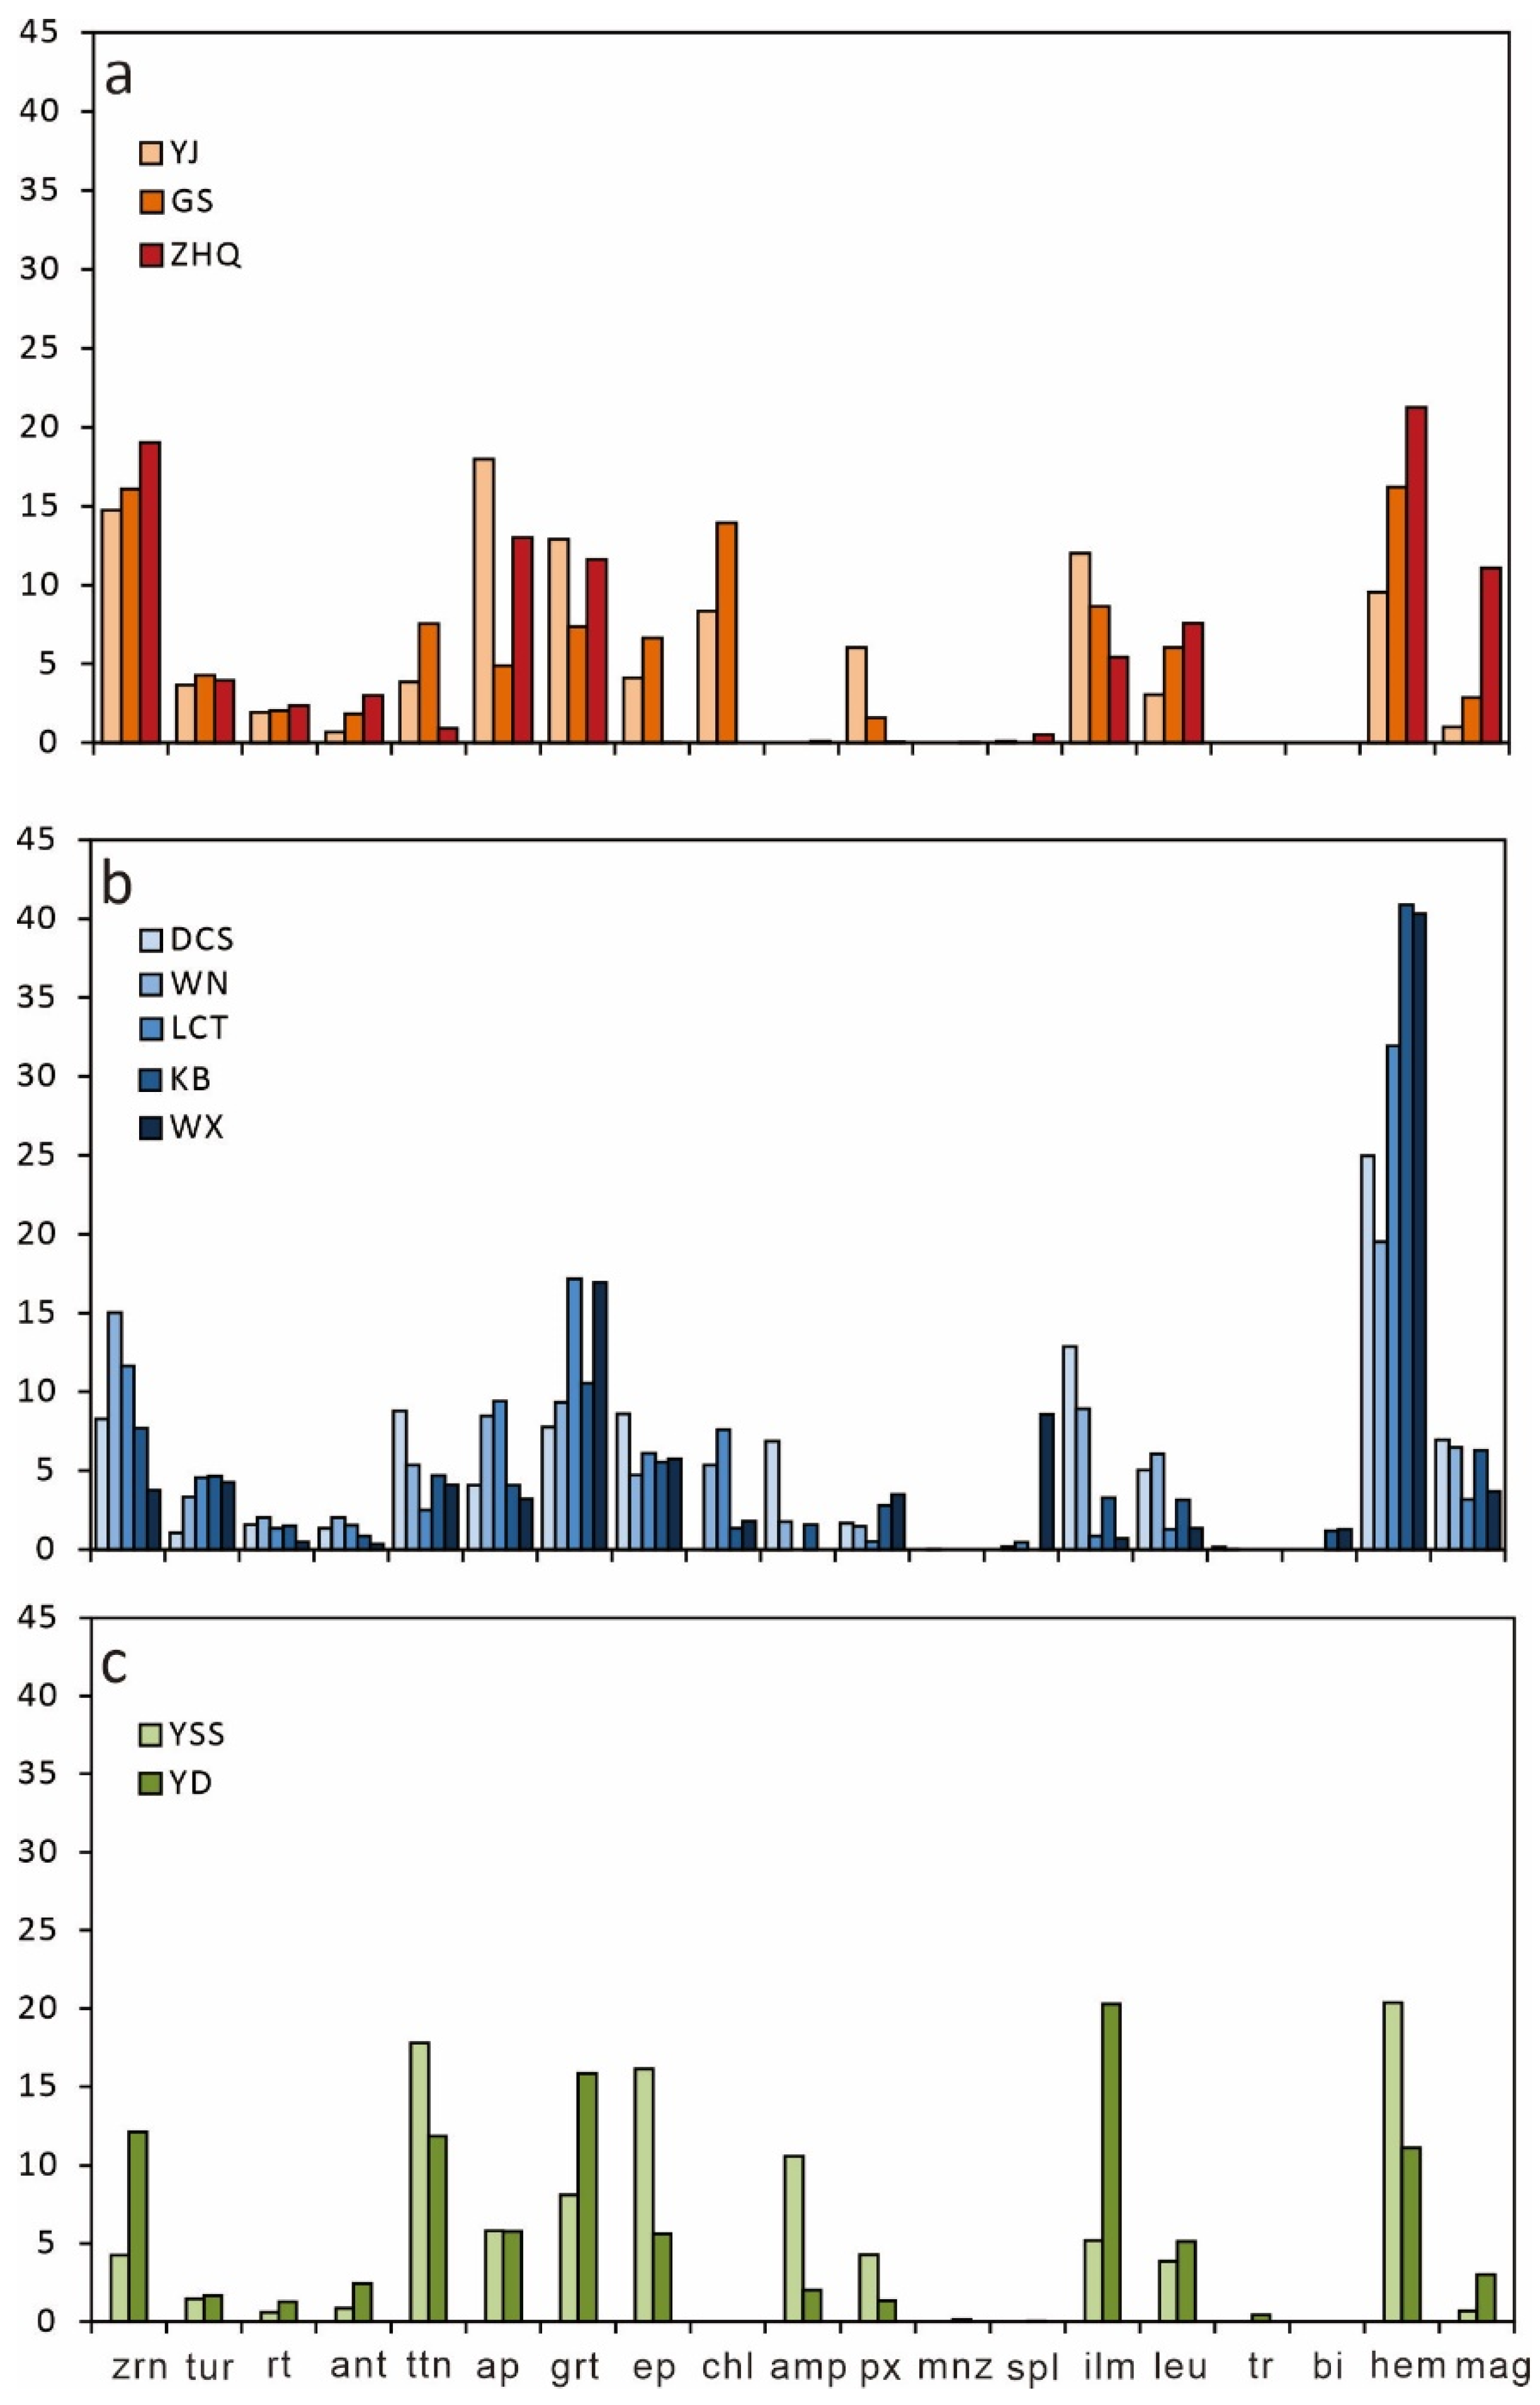
In general, the heavy mineral assemblages can be divided into three groups. The heavy mineral assemblages of sandstone samples from Yuejin, Gasi, and Zhahaquan are dominated by zircon and hematite, with averages of 16.6% and 15.6%, respectively. Garnet and apatite share similar abundances, which comprise a major proportion of the total heavy mineral assemblages, with averages of 10.6% and 11.9%, respectively. Other species including ilmenite, chlorite, leucoxene, titanite, magnetite, epidote, tourmaline, pyroxene, anatase, and rutile display relatively low abundances. While monazite, spinel, tremolite, and hornblende serve as minor constituents, with averages of no more than 1%. Overall, sandstone samples of these three locations are characterized by high abundances of zircon, tourmaline, and rutile (ZTR minerals), with averages of 16.6%, 4.0%, and 2.1%, respectively, Figure 5a.
The heavy mineral assemblages of samples from Dongchaishan, Wunan, Lvcaotan, Kunbei, and Wanxi exhibit the highest contents of hematite, with an average of 32.6%. Garnet and epidote are also major mineral phases, with averages of 11.7% and 8.2%, respectively. In addition, ilmenite and zircon exhibit similar concentrations in these five locations, with averages of 6.1% and 6.9%, respectively. Furthermore, apatite, titanite, magnetite, tourmaline, pyroxene, hornblende, leucoxene, and chlorite serve as subordinate components. Compared with samples in group one (Yuejin, Gasi, and Zhahaquan), the abundances of ZTR minerals in these five locations are relatively low, with averages of 6.9%, 4.1%, and 1.1%, respectively, Figure 5b.
Samples of Youshashan and Yingdong have the highest percentages of hematite, followed by titanite, with an average of 14.2%. Epidote, ilmenite, and garnet, which serve as major components, share similar proportions of total heavy minerals, with averages of 12.3%, 12.5%, and 11.3%. In addition, moderate constituents are comprised of zircon, hornblende, apatite, leucoxene, and pyroxene, with averages between 3% and 10%. The heavy mineral assemblages of this group are distinguished from others by the low content of ZTR minerals, with averages of 7.2%, 1.5%, and 0.9%, respectively, Figure 5c.
5.2. Heavy Mineral Ratios
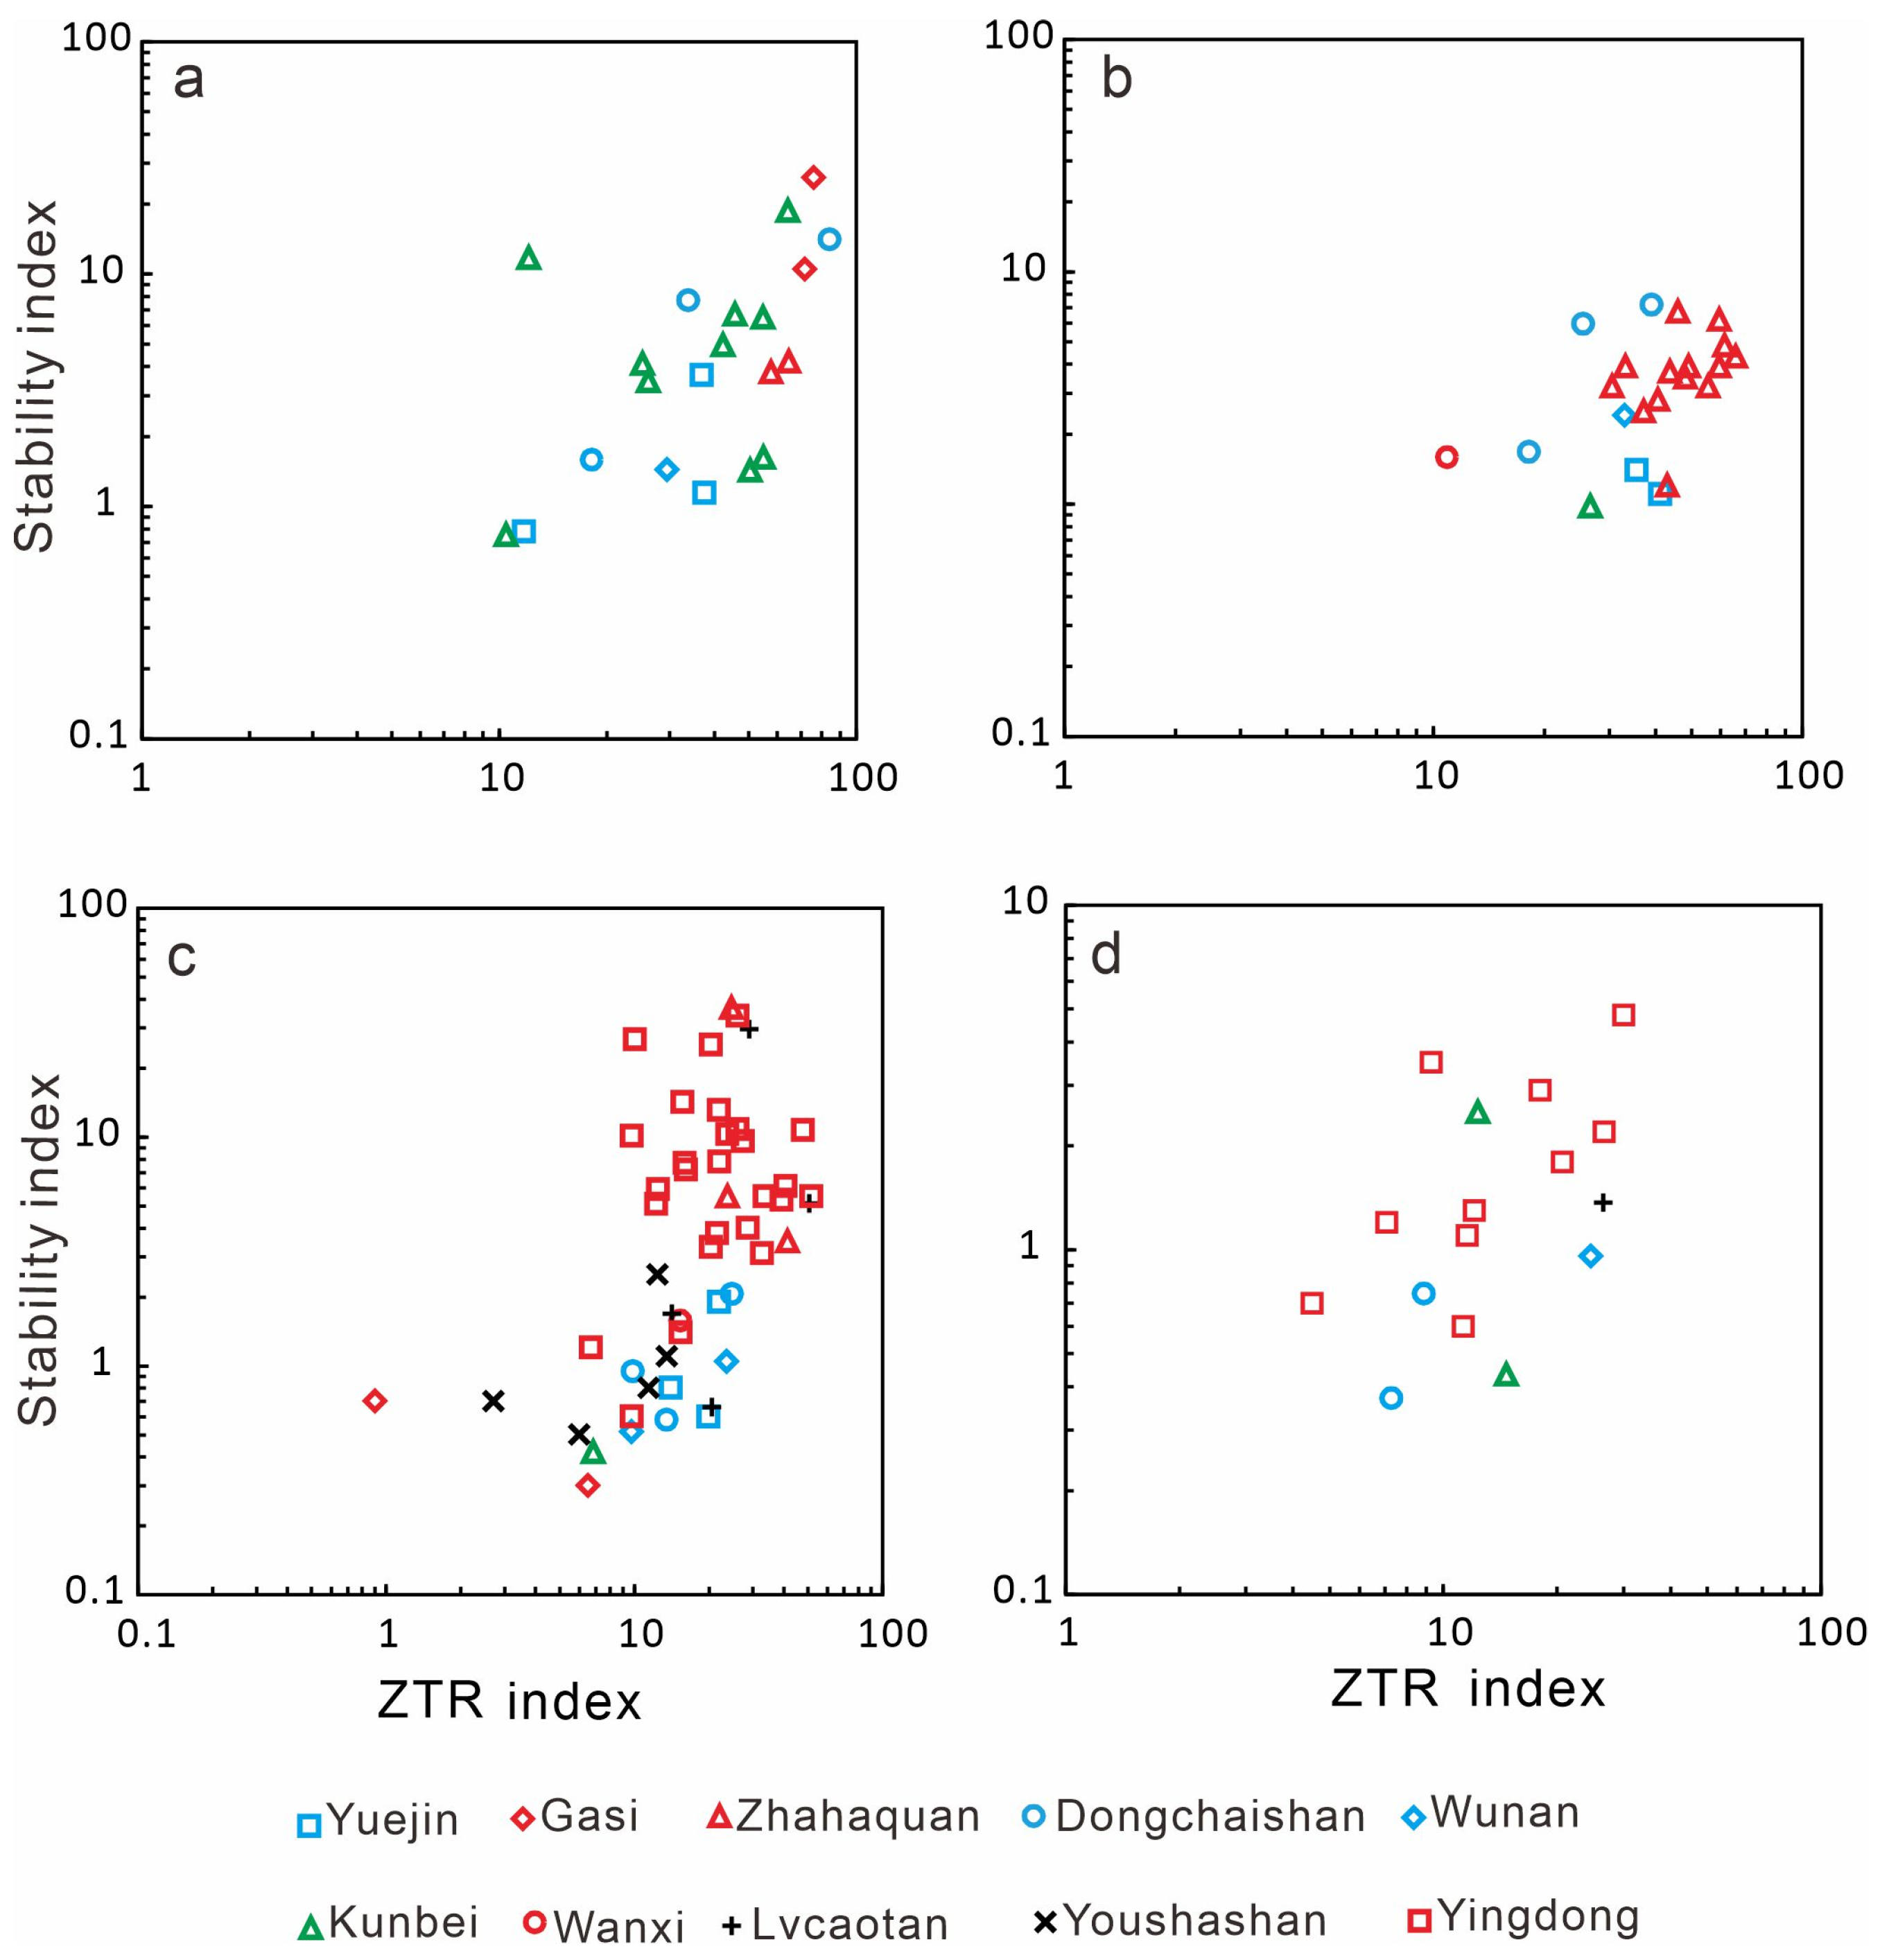
The ZTR index (zircon + tourmaline + rutile/opaque heavy minerals) and stability index (stable heavy minerals/unstable heavy minerals) are able to characterize the maturity of the samples [42,43,44]. According to the heavy minerals in the research area, the stability index of heavy minerals adopted in this paper shall be (zircon + tourmaline + rutile + leucoxene + anatase + titanite + garnet + spinel + monazite)/(apatite + epidote + chlorite + pyroxene + kyanite + hornblende + tremolite). The ZTR index and stability index of the samples for each formation in the research area are shown in Tables S2–S5. Meanwhile, the ratios of all the formations in different areas are shown in Figure 6.
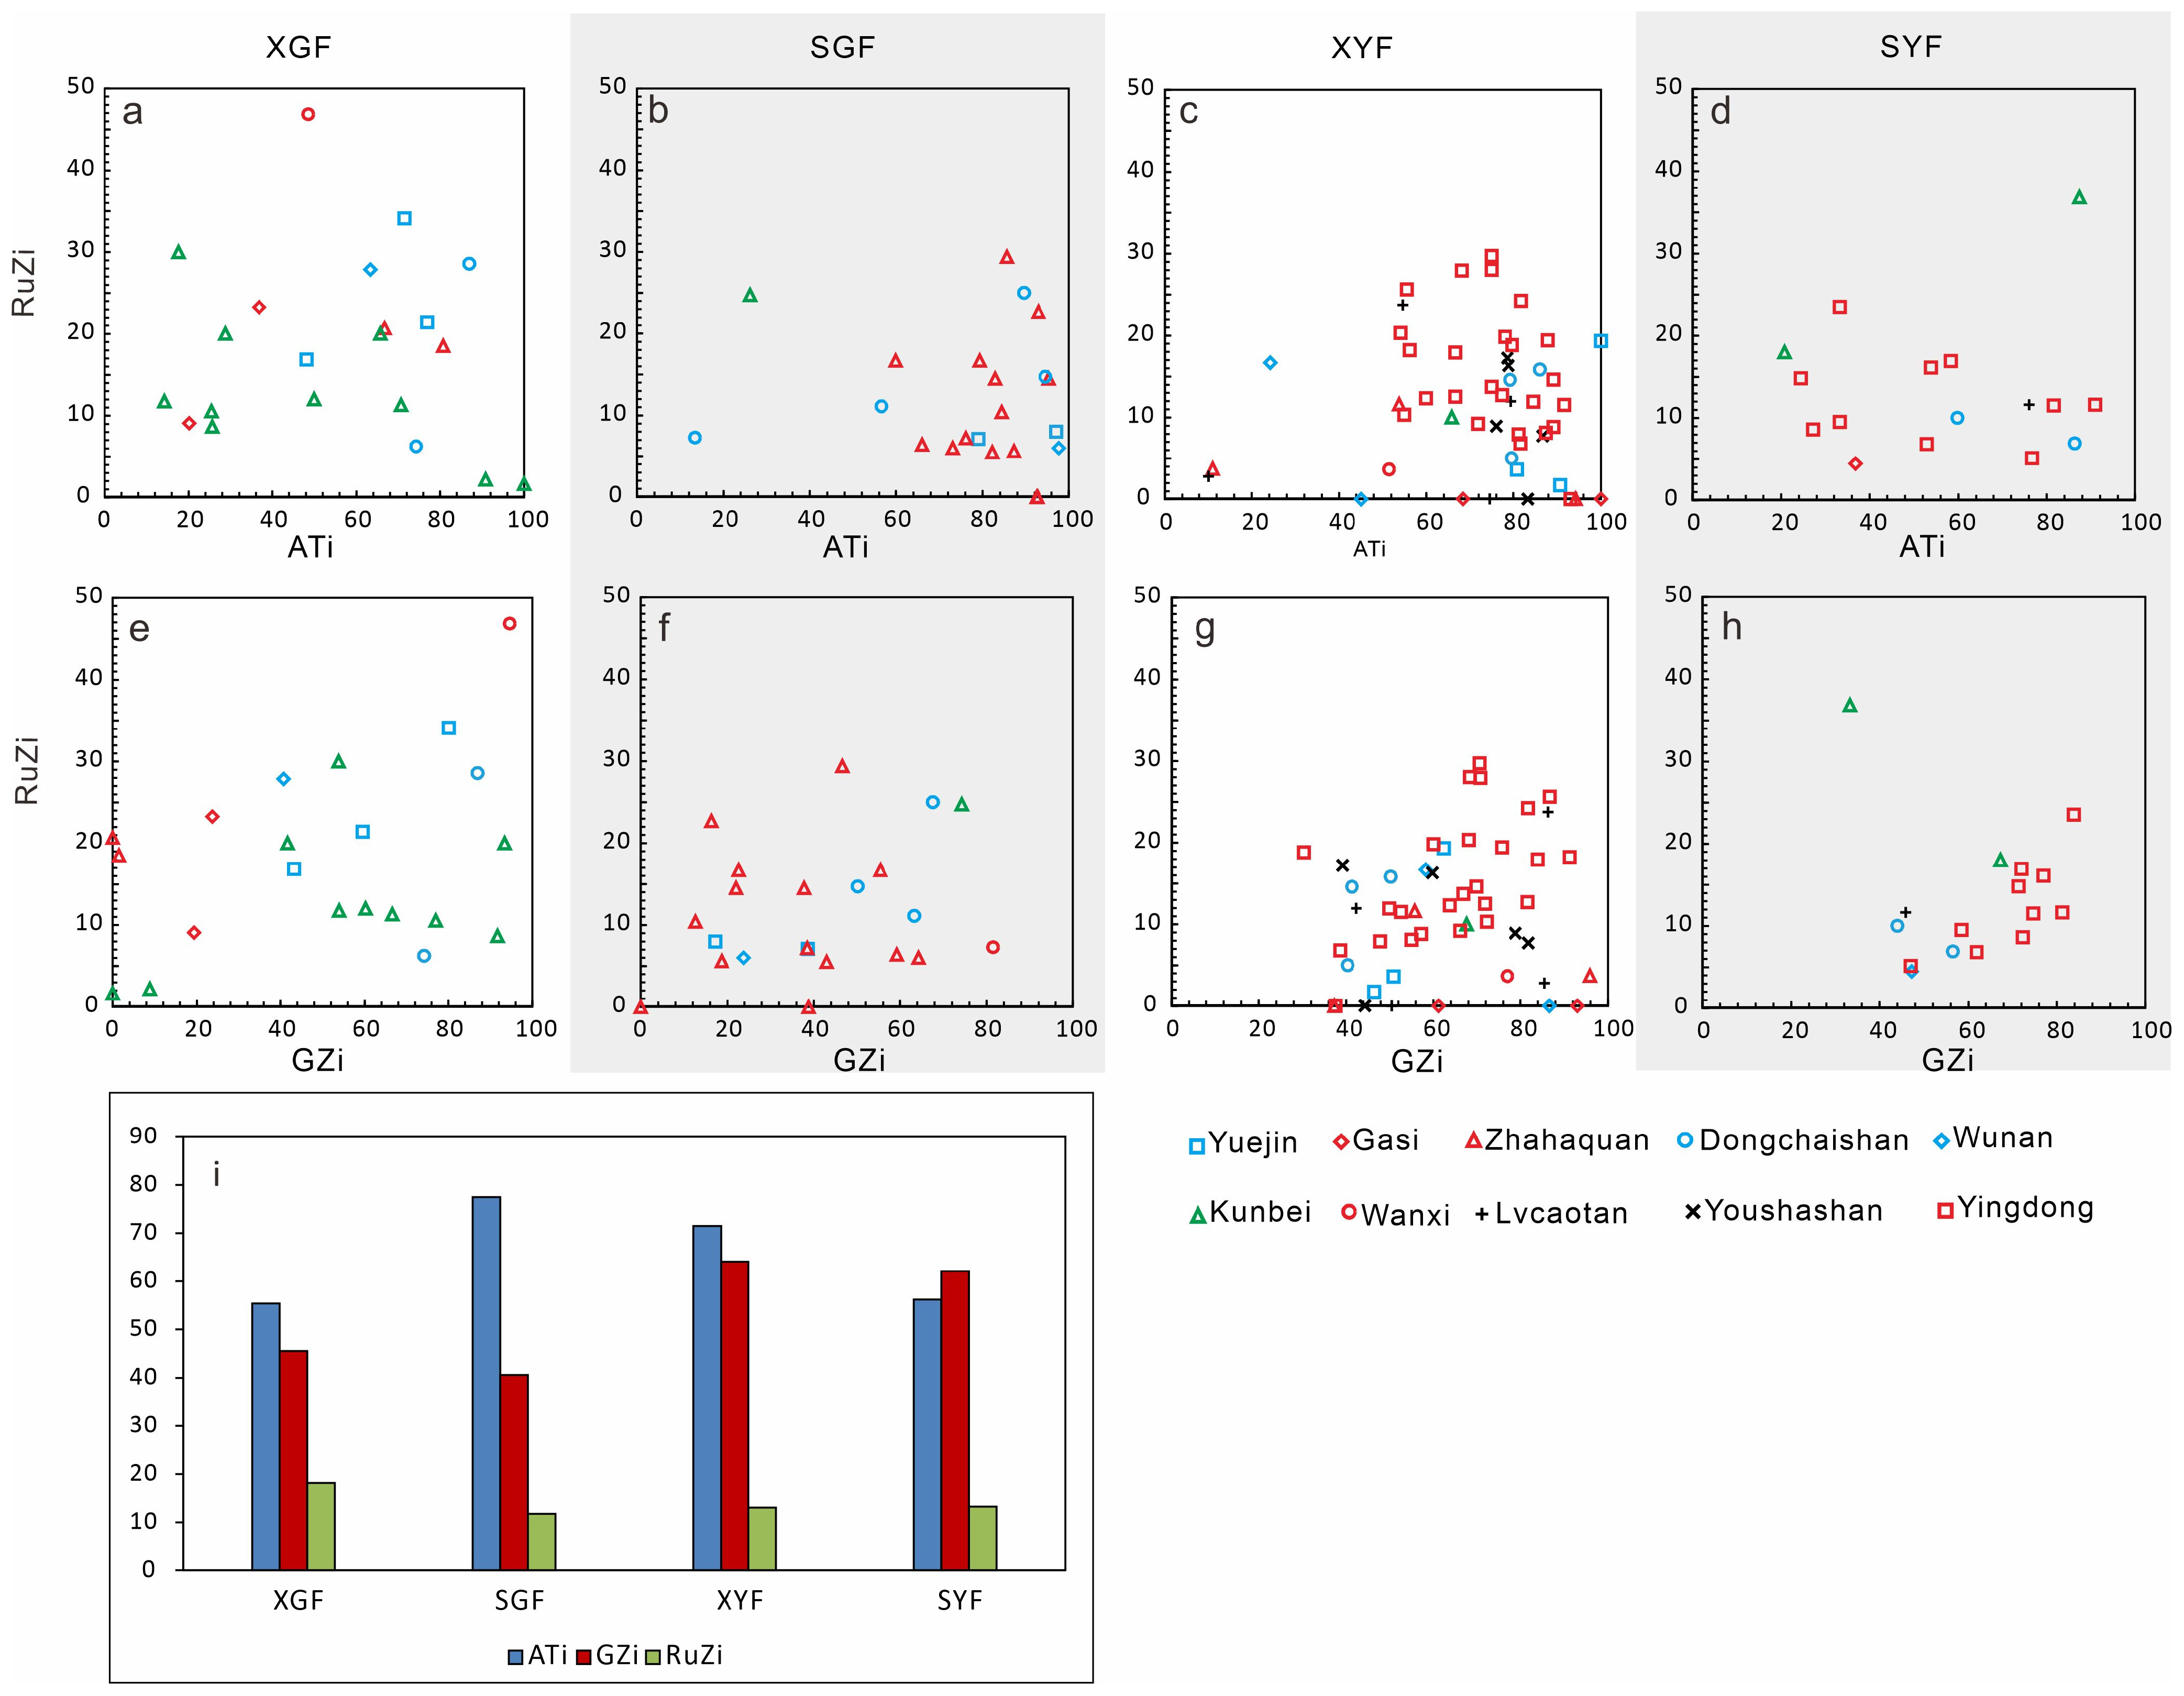
The characteristics of the heavy minerals can reflect the type of source rock [45,46]. However, in some cases, the heavy mineral data will be affected by the process of transportation, weathering, separation, diagenesis, and other factors. In order to reduce such impacts and provide a more accurate provenance result, some researchers [45,47] assembled some stable heavy minerals which display similar densities and stability of burial diagenesis, and further proposed some sorts of heavy mineral ratios that are sensitive to the sources of heavy minerals (such as the ATi index, GZi index and RuZi index), so as to minimize the impact of sedimentary and diagenesis processes. According to the relatively high contents of garnet, apatite, rutile, zircon, and tourmaline in the analyzed sandstone samples in this study, a series of heavy mineral ratios were acquired using stable heavy minerals with similar densities, such as the ATi index (=100 × apatite/the total amount of apatite and tourmaline), the GZi index (=100 × garnet/ the total amount of garnet and zircon) and the RuZi index (=100 × rutile/the total amount of rutile and zircon). The heavy mineral ratios of the samples for each formation are shown in Tables S2–S5. The ratios of all the formations in different areas are shown in Figure 7a–h.
In general, the ATi, GZi, and RuZi indexes in the Xia Ganchaigou Formation range from 14.3 to 100.0, 0 to 94.6, and 1.6 to 46.8, respectively (Figure 7a,e), with an average of 55.4, 45.6 and 18.2, respectively (Figure 7i). The ATi, GZi, and RuZi indexes in the Shang Ganchaigou Formation range from 13.4 to 97.7, 0 to 81.6, and 0 to 29.4, respectively (Figure 7b,f), with an average of 77.5, 40.6 and 11.8, respectively (Figure 7i). The ATi, GZi, and RuZi indexes in the Xia Youshashan Formation range from 10.1 to 100.0, 37.3 to 92, and 0 to 29.7, respectively (Figure 7c,g), with an average of 71.5, 64.1 and 13.0, respectively (Figure 7i). The ATi, GZi, and RuZi indexes in the Xia Youshashan Formation range from 20.8 to 90.9, 33.3 to 83.8, and 4.5 to 36.8 (Figure 7d,h), respectively, with an average of 56.2, 62.1 and 13.3, respectively (Figure 7i).
Since the ZTR index values exhibit greater variation among formations and regions, and the subsequent discussion about basin boundary requires more detailed ZTR index values, the ZTR indexes of each formation in different areas are stated in detail as follows.
5.2.1. Xia Ganchaigou Formation Samples
For the Xia Ganchaigou Formation, 21 effective samples were acquired in seven locations in the study area. In general, the ZTR indexes in the Xia Ganchaigou Formation range from 10.5 to 84.2, with an average of 43.2; the stability indexes range from 0.8 to 26.0, with an average of 6.4 Figure 6a. Sandstone samples of Gasi exhibit high ZTR indexes (ranging from 71.6 to 75.8) and stability indexes (ranging from 10.5 to 26.0). Samples of Yuejin, Dongchaishan, and Kunbei display variable ZTR indexes (ranging from 10.5 to 64.4) and stability indexes (ranging from 0.8 to 18.7). Sandstone samples of Zhahaquan display moderate ZTR indexes (ranging from 57.6 to 64.7) and stability indexes (ranging from 3.8 to 4.2).
5.2.2. Shang Ganchaigou Formation Samples
For the Shang Ganchaigou Formation, 22 effective sandstone samples were collected in six locations. Overall, the ZTR indexes in the Shang Ganchaigou Formation range from 10.9 to 65.9, with an average of 41.0; the stability indexes range from 1.0 to 26.0, with an average of 6.4 Figure 6b. Sandstone samples from this formation are characterized by variable ZTR indexes, especially in Zhahaquan and Dongchaishan (ranging from 18.1 to 65.9). However, the range of stability indexes is quite narrow, and is no more than six.
5.2.3. Xia Youshashan Formation Samples
Fifty effective samples were acquired from the Xia Youshashan Formation in ten locations in the study area. In general, the ZTR indexes in the Lower Youshashan Formation range from 0.9 to 51.9, with an average of 20.5; the stability indexes range from 0.3 to 36.6, with an average of 6.8, Figure 6c. In this formation, most sandstone samples of Yingdong reveal high ZTR indexes (ranging from 6.7 to 51.9) and stability indexes (ranging from 0.6 to 33.9). In contrast, samples of Gasi, Youshashan, and Yuejin display low ZTR indexes (ranging from 0.9 to 21.9) and stability indexes (ranging from 0.3 to 2.5).
5.2.4. Shang Youshashan Formation Samples
For the Upper Youshashan Formation, 17 effective samples were obtained in five locations in the study area. In general, the ZTR indexes in the Upper Youshashan Formation range from 4.5 to 30.1, with an average of 15.4; the stability indexes range from 0.4 to 4.8, with an average of 1.7. Overall, sandstone samples from this formation are characterized by relatively low ZTR indexes and stability indexes, Figure 6d.
6. Discussion
6.1. The Effectiveness of the Heavy Mineral Data
ZTR index and stability index could reflect the compositional maturity of the sandstone samples, which can help to infer the transportation distance of the clastic deposits [43,48]. As the increase in the transportation distance, the relative contents of the stable heavy minerals will rise, which will lead to a high ZTR index and stability index. From the ZTR index and stability index analyses of different formations (Figure 6), we found that the compositional maturity of the sandstone samples in the Xia Ganchaigou Formation and Shang Ganchaigou Formation are generally higher. Since the Miocene (the Xia Youshashan Formation), the values of these two indexes have been gradually declining, displaying the tendency of concentrated distribution, which indicates the distance from the sedimentary area to the source area gradually decreased. As shown in Figure 6, with the increase in the ZTR index, the stability index also increases, which represents a coordinated variation of these two indexes. Therefore, the ZTR index could serve as an effective indicator to represent the compositional maturity features.
It can be observed that the values of the ATi, GZi, and RuZi index of each formation maintain relatively stable with slightly varieties (Figure 7). Therefore, it could be assumed that the heavy minerals in this study are rarely influenced by the sedimentary and diagenetic processes and could be regarded as accurate provenance analysis data.
6.2. Provenance of Southwestern Qaidam Basin in Cenozoic
Before the discussion of the southwestern boundary of the Qaidam Basin, provenance analyses are necessary for two reasons: the first objective is to infer that the Eastern Kunlun Mountains has already been exhumed during the Paleogene time [17,18,19]; the second objective is to determine the direction of the source of the clastic material deposited in southwestern Qaidam Basin, which would ensure the effectiveness of using the heavy mineral ratios to reconstruct the southwestern boundary of the Qaidam Basin. The Altun Mountains and the Eastern Kunlun Mountains are generally regarded as the two reliable provenances for the southwestern Qaidam Basin, according to heavy mineral data [49,50], detrital mineral chemistry [51], and zircon U-Pb ages [52].
Heavy mineral assemblages in the southwestern Qaidam Basin are commonly considered one of the significant indicators of provenance. Meanwhile, topography and landform are closely related to the heavy mineral accumulation in the modern deposit environment [53,54,55], thus, the heavy mineral assemblages in the deposit area may contribute to the understanding of the uplift of the provenance in the Paleogene. Sandstones from the study area have similarities that are dominated by some specific heavy minerals, e.g., zircon, tourmaline, leucoxene, titanite, hematite, garnet, ilmenite, apatite, epidote, and chlorite (Figure 5). In addition, pyroxene mainly occurs in samples from Yuejin, Wunan, and Youshashan. Note that there are extremely variable concentrations of some opaque heavy minerals in these sandstone samples, such as magnetite (maximum 38.4% in Kunbei, minimum of 0 in some areas), owning to the rapid variations of the sedimentary facies in some regions in the southwestern Qaidam Basin. These opaque heavy minerals with great variations in abundances may blur the indications of provenances. Therefore, in this study, we only choose the transparent heavy mineral assemblages to make further analyses.
Zircon, tourmaline, rutile, anatase, titanite, apatite, garnet, epidote, chlorite, pyroxene, and hornblende are the eleven significant transparent heavy minerals in the southwestern Qaidam Basin. Some minerals in the heavy minerals can indicate the specific type of source rock and the nature of the source area. For example, zircon, titanite, and apatite mainly come from the intermediate-acidic magmatic rocks, while pyroxene generally presents in many sorts of ultramafic–intermediate magmatic rocks [41,56]. The Zrn-Ttn-Ap-Px assemblage that originated from the magmatic rocks is called the ZTAP minerals for short. While garnet, epidote, rutile, and chlorite are commonly found in the metamorphic rocks with variable metamorphic grades [41,56], epidote and chlorite are often derived from metamorphic source rocks with medium- to low-grade, particularly, epidote is common in rocks of greenschist and epidote–amphibolite facies [56]. Rutile is mainly found in schist, gneiss, and amphibolite [56]. In general, the Grt-Ep-Rt-Chl assemblage is known as the GERC minerals for short. Among these eleven transparent heavy minerals (the blue part of the pie charts in Figure 8), ZTAP and GERC minerals are the predominant components. In addition, the proportions of these two heavy mineral assemblages are quite similar in all study areas, which reflects the similarity of the provenances for these areas in the southwestern Qaidam Basin. The dominating heavy mineral assemblages of ZTAP and GERC minerals indicate that igneous rocks and metamorphic rocks were the primary sources of these heavy mineral assemblages. The Eastern Kunlun Mountains, located to the south of the southwestern Qaidam Basin, are mainly composed of pre-Cambrian to Paleozoic and Mesozoic intermediate–acidic igneous rocks, Paleozoic to Mesozoic marine sedimentary rocks [52,57,58,59], and the Mesoproterozoic–Neoproterozoic strata had probably experienced a medium to low metamorphism [24]. Thus, the lower Paleozoic and Lower Mesozoic igneous rocks as well as the Mesoproterozoic–Neoproterozoic metamorphism in the Eastern Kunlun Mountains might be the sources of the heavy mineral assemblages of the study area. Although the Altun Mountains also comprise the late Cambrian to Early Devonian intermediate–acidic igneous rocks [37,52,58] as well as the Lower Paleozoic and Paleoproterozoic metamorphic rocks [60,61], the depositional center in the Shizigou area (Figure 1b) in the Xia Ganchaigou Formation and Shang Ganchaigou Formation [9,62] indicates that Altun Mountains could not be a sustainable source for the study area during the Cenozoic period. Therefore, according to the heavy mineral assemblages discussed above and the locations of the study area which are in front of and parallel to the Eastern Kunlun Mountains, the Eastern Kunlun Mountains should be the primary source region for the southwestern part of the Qaidam Basin during the Cenozoic period. Additionally, this provenance result is also supported by the zircon U-Pb ages of the samples in the southwestern Qaidam Basin [49].
The evidence from the paleocurrents indicates an identical result. The past research [39] investigated the paleocurrents of the Mang’ai section (Figure 1b) during Oligocene-early Miocene by measuring imbricated clasts and oscillatory ripples. The result shows a general south–north trending direction, indicating the source area was located in the Eastern Kunlun Mountains. Another study [63] also suggested that the paleocurrent directions of areas in front of the Eastern Kunlun Mountains are the SE-NW and SW-NE, which proves the reliability of the southern provenance. In addition, the sedimentary facies of the Wanxi, Dongchaishan, and Kunbei areas are mainly fluvial facies with coarser sediments in Xia Ganchaigou Formation, while the Lvcaotan and Gasi areas are dominated by lacustrine facies (Figure 4b). The variation of the sedimentary environment from south to north in front of the Eastern Kunlun Mountains also indicate the provenance area derived from the south.
6.3. Southwestern Boundary of Qaidam Basin
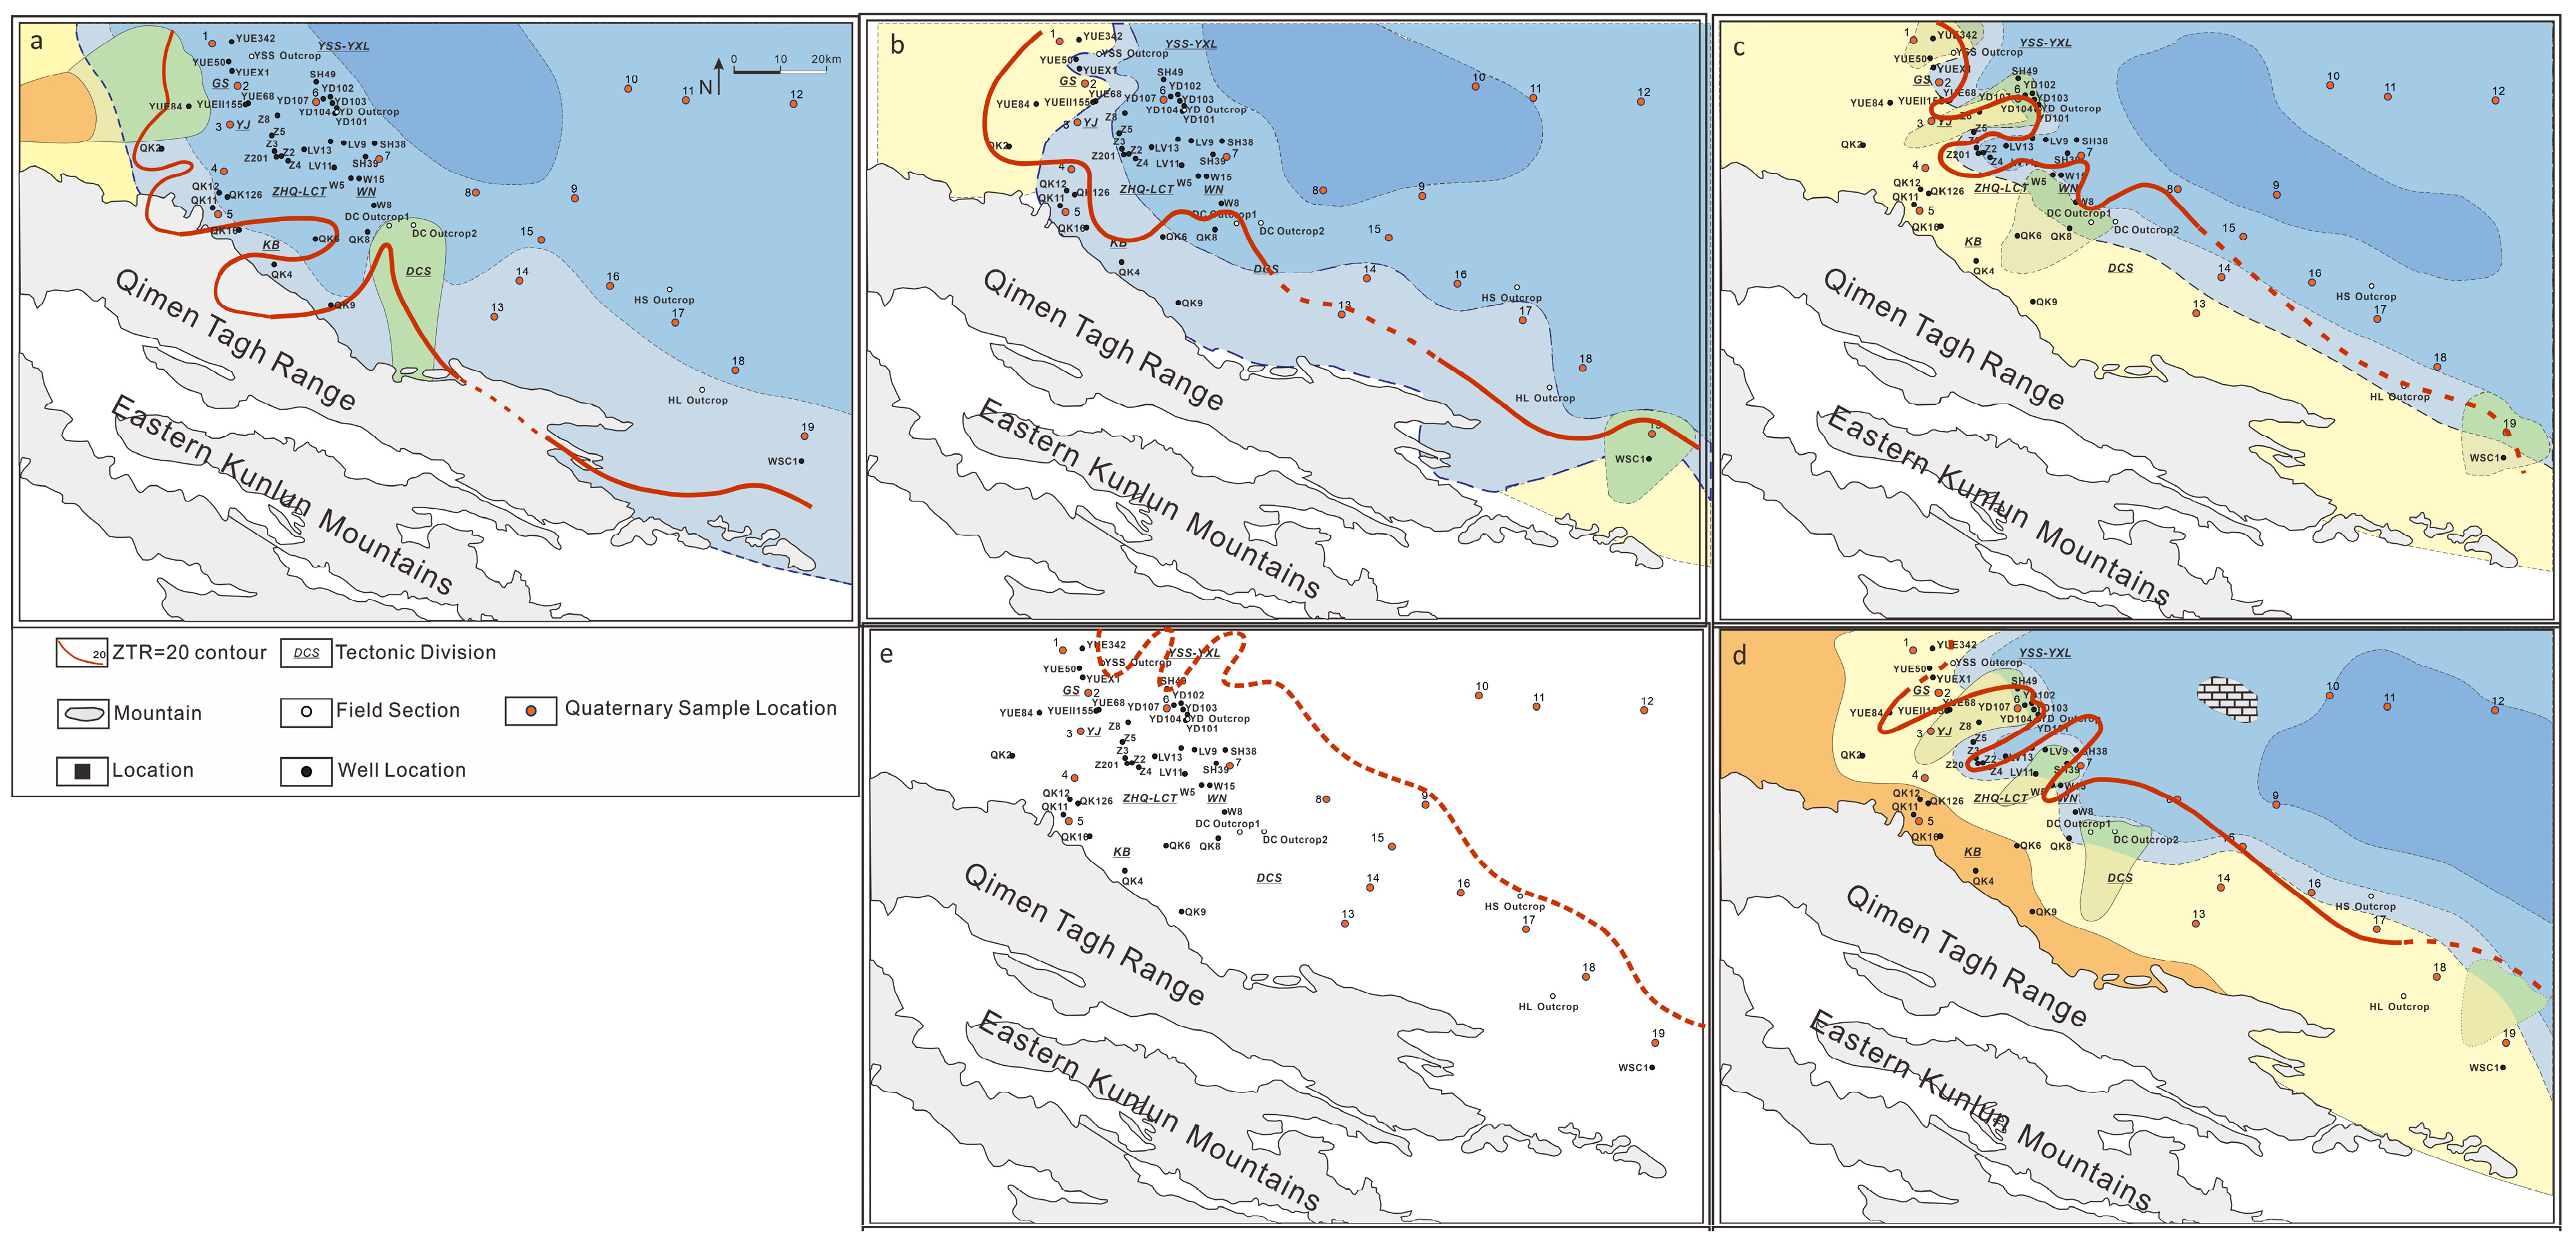
Zircon, tourmaline, and rutile belong to the assemblage of clastic heavy minerals with high mineral maturity [27,45], and this assemblage can reflect the sandstone maturity which is mainly controlled by transportation distance and some other geological processes [45,47]. According to the distribution patterns of the ZTR minerals with spatial changes, the distance to the provenance could be effectively estimated by using the ZTR index. Therefore, the ZTR = 20 contour was selected to characterize the distance from the provenance to the sedimentary area in this study. The southern sedimentary area of the Qaidam Basin had mainly developed the approximate S–N trending paleocurrents system during the Oligocene early Miocene period, at the same time, the southern ancient shoreline was almost in parallel with the Qimen Tagh Range [39].
Based on the provenance direction of the southwestern Qaidam Basin, the contour distribution map of ZTR = 20 is shown in Figure 6. During the late Eocene–Oligocene period, the ZTR index in front of the present Qimen Tagh Range is as high as 20–30. During the period of the Upper Xia Ganchaigou Formation, the ZTR = 20 contour at the southern research area had already reached and even exceeded the present Qimen Tagh Range. However, during the Miocene, the ZTR = 20 contour was generally located in the Yingxiongling–Huangshi area. From the deposition period of Xia Ganchaigou formation to the Quaternary, the contour exhibits a gradual movement towards the interior of the basin. This indicates that the sedimentary stability in the same region may gradually decline over time, while the corresponding source area may gradually withdraw towards the center of the basin.
According to the distance from the ZTR = 20 contour in Quaternary to the current Qiman Tagh Mountain (as shown by the black bidirectional arrow in Figure 9), and in combination with the position of ZTR = 20 during the late Eocene, the position of southern provenance during the late Eocene could be generally inferred. As shown in Figure 9, the southern source area of the basin before the Miocene was located in the southwest of the Adatan fault, and the position of the southwestern boundary of the basin was in the middle of the present Eastern Kunlun Mountains. Therefore, it is inferred that Eastern Kunlun Mountains had already been a relatively stable provenance during the late Eocene–Oligocene and provided sediments to the southwestern Qaidam Basin. This result supports the idea that the Eastern Kunlun Mountains were already exhumed during the Paleogene and separated the Qaidam Basin from the Hoh Xil basin to the south [13,17,18,19].
6.4. Sedimentary Evolution
The study of the sedimentary facies of the southern Qaidam Basin demonstrates that the basin had been in an expansion phase during the late Eocene–Oligocene and had been in the relatively stable phase during the late Oligocene. In general, the sedimentary characteristics from the upper part of the Xia Ganchaigou Formation to the Shang Ganchaigou Formation reflect the transgression of lacustrine facies. The range of the lake is gradually increasing. The maximum flooding period occurred roughly in the middle of the Shang Ganchaigou Formation. After the Miocene, the lake had gradually withdrawn, and the southern shoreline had gradually pushed towards the basin center over time (Figure 10). The movement of the lake shoreline shared a similar trend with the ZTR contour. Therefore, the variation of the ZTR index was subject to the control of the basin’s structural–sedimentary process, which also demonstrated that it is proper to infer the basin boundary by the contour. In combination with the sedimentary facies and heavy mineral analysis, it was found that the southern provenance during the Paleogene was located at the present southwestern Qiman Tagh Mountain and had gradually moved towards the basin during the Neogene.
7. Conclusions
The ZTR index can effectively reflect the maturity of sediments, and further facilitates the inference of the distance to the provenance. This paper intends to reconstruct the position of the southwestern boundary of the southwestern Qaidam Basin during the Paleogene–Neogene period based on the isoline of the ZTR = 20. The study results demonstrated that the southern provenance during the late Eocene was located southwest of the present Eastern Kunlun Mountain, and approximately reached the present Adatan fault of the Middle Eastern Kunlun Mountain. Combining the results of the provenance analysis and the sedimentary facies analysis, the Eastern Kunlun Mountain had already been a relatively stable provenance during the late Eocene–Oligocene period and provided sediments to the southwestern Qaidam Basin. In addition, the distribution pattern of the shoreline and the isogram of the ZTR = 20 indicate the southwestern boundary of the basin has moved towards the northeast direction since the Xia Ganchaigou Formation, which reduced the scope of the basin.
Supplementary Materials
The following supporting information can be downloaded at: www.mdpi.com/article/10.3390/min12060768/s1, Table S1: The heavy minerals of each location during Cenozoic in southwestern Qaidam Basin; Table S2: The heavy minerals of each location in Xia Ganchaigou Formation in southwestern Qaidam Basin; Table S3: The heavy minerals of each location in Shang Ganchaigou Formation in southwestern Qaidam Basin; Table S4: The heavy minerals of each location in Xia Youshashan Formation in southwestern Qaidam Basin; Table S5: The heavy minerals of each location in Shang Youshashan Formation in southwestern Qaidam Basin.
Author Contributions
Validation, formal analysis, writing-original draft preparation, X.D.; conceptualization, methodology, formal analysis, L.F.; writing-review and editing, project administration, P.G.; resources, supervision, D.Z. All authors have read and agreed to the published version of the manuscript.
Funding
This research was funded by the National Key R&D Program of China, grant number 2021YFA0719000, and the National Nature Science Foundation of China, grant number 42141021.
Conflicts of Interest
The authors declare no conflict of interest.
References
- Ding, L.; Xu, Q.; Yue, Y.; Wang, H.; Cai, F.; Li, S. The andean-type gangdese mountains: Paleoelevation record from the paleocene–eocene linzhou basin. Earth Planet. Sci. Lett. 2014, 392, 250–264. [Google Scholar] [CrossRef]
- Jian, X.; Guan, P.; Zhang, D.-W.; Zhang, W.; Feng, F.; Liu, R.-J.; Lin, S.-D. Provenance of Tertiary sandstone in the northern Qaidam basin, northeastern Tibetan Plateau: Integration of framework petrography, heavy mineral analysis and mineral chemistry. Sediment. Geol. 2013, 290, 109–125. [Google Scholar] [CrossRef]
- Yin, A.; Rumelhart, P.; Butler, R.; Cowgill, E.; Harrison, T.; Foster, D.; Ingersoll, R.; Qing, Z.; Xian-Qiang, Z.; Xiao-Feng, W. Tectonic history of the Altyn Tagh fault system in northern Tibet inferred from Cenozoic sedimentation. Geol. Soc. Am. Bull. 2002, 114, 1257–1295. [Google Scholar] [CrossRef]
- Fu, L.; Guan, P.; Jian, X.; Liu, R.; Feng, F.; An, Q.; Fan, Z. Sedimentary genetic types of coarse fragment of Paleogene Lulehe formation in Qaidam Basin and Time limit of the Tibetan Plateau uplift. Nat. Gas Geosci. 2012, 23, 833–840. [Google Scholar]
- Guan, P.; Jian, X. The Cenozoic sedimentary record in Qaidam Basin and its implications for tectonic evolution of the Northern Tibetan Plateau. Acta Sedimentol. Sin. 2013, 31, 824–833. [Google Scholar]
- Jian, X.; Guan, P.; Zhang, W.; Liang, H.; Feng, F.; Fu, L. Late Cretaceous to early Eocene deformation in the northern Tibetan Plateau: Detrital apatite fission track evidence from northern Qaidam basin. Gondwana Res. 2018, 60, 94–104. [Google Scholar] [CrossRef]
- Rieser, A.B.; Bojar, A.-V.; Neubauer, F.; Genser, J.; Liu, Y.; Ge, X.-H.; Friedl, G. Monitoring Cenozoic climate evolution of northeastern Tibet: Stable isotope constraints from the western Qaidam Basin, China. Int. J. Earth Sci. 2009, 98, 1063–1075. [Google Scholar] [CrossRef]
- Zhuang, G.; Hourigan, J.K.; Koch, P.L.; Ritts, B.D.; Kent-Corson, M.L. Isotopic constraints on intensified aridity in Central Asia around 12Ma. Earth Planet. Sci. Lett. 2011, 312, 152–163. [Google Scholar] [CrossRef]
- Bao, J.; Wang, Y.; Song, C.; Feng, Y.; Hu, C.; Zhong, S.; Yang, J. Cenozoic sediment flux in the Qaidam Basin, northern Tibetan Plateau, and implications with regional tectonics and climate. Glob. Planet. Change 2017, 155, 56–69. [Google Scholar] [CrossRef]
- Jian, X.; Guan, P.; Zhang, W.; Feng, F. Geochemistry of Mesozoic and Cenozoic sediments in the northern Qaidam basin, northeastern Tibetan Plateau: Implications for provenance and weathering. Chem. Geol. 2013, 360–361, 74–88. [Google Scholar] [CrossRef]
- Bao, J.; Song, C.; Yang, Y.; Fang, X.; Meng, Q.; Feng, Y.; He, P. Reduced chemical weathering intensity in the Qaidam Basin (NE Tibetan Plateau) during the Late Cenozoic. J. Asian Earth Sci. 2019, 170, 155–165. [Google Scholar] [CrossRef]
- Jian, X.; Zhang, W.; Liang, H.; Guan, P.; Fu, L. Mineralogy, petrography and geochemistry of an early Eocene weathering profile on basement granodiorite of Qaidam basin, northern Tibet: Tectonic and paleoclimatic implications. Catena 2019, 172, 54–64. [Google Scholar] [CrossRef]
- Cheng, F.; Jolivet, M.; Guo, Z.; Wang, L.; Zhang, C.; Li, X. Cenozoic evolution of the Qaidam basin and implications for the growth of the northern Tibetan plateau: A review. Earth-Sci. Rev. 2021, 220, 103730. [Google Scholar] [CrossRef]
- Yin, A.; Dang, Y.-Q.; Zhang, M.; Chen, X.-H.; McRivette, M.W. Cenozoic tectonic evolution of the Qaidam basin and its surrounding regions (Part 3): Structural geology, sedimentation, and regional tectonic reconstruction. Geol. Soc. Am. Bull. 2008, 120, 847–876. [Google Scholar] [CrossRef] [Green Version]
- Cai, X.; Liu, D.; Yuan, M.; Li, D.; Luo, Z. Relationship of the Paleocene-Miocene strata between the Qaidam and Kekexili Basins. J. Stratigr. 2009, 276, 282. [Google Scholar]
- McRivette, M.W.; Yin, A.; Chen, X.; Gehrels, G.E. Cenozoic basin evolution of the central Tibetan plateau as constrained by U-Pb detrital zircon geochronology, sandstone petrology, and fission-track thermochronology. Tectonophysics 2019, 751, 150–179. [Google Scholar] [CrossRef]
- Cheng, F.; Garzione, C.N.; Jolivet, M.; Guo, Z.; Zhang, D.; Zhang, C.; Zhang, Q. Initial deformation of the northern Tibetan Plateau: Insights from deposition of the Lulehe Formation in the Qaidam Basin. Tectonics 2019, 38, 741–766. [Google Scholar] [CrossRef]
- Cheng, F.; Fu, S.; Jolivet, M.; Zhang, C.; Guo, Z. Source to sink relation between the Eastern Kunlun Range and the Qaidam Basin, northern Tibetan Plateau, during the Cenozoic. Bulletin 2016, 128, 258–283. [Google Scholar] [CrossRef]
- Lou, Q.; Xiao, A.; Zhong, N.; Wu, L. A method of prototype restoration of large depressions with terrestrial sediments: A case study from the Cenozoic Qaidam Basin. Acta Petrol. Sin. 2016, 32, 892–902. [Google Scholar]
- Wang, C.; Dai, J.; Zhao, X.; Li, Y.; Graham, S.A.; He, D.; Ran, B.; Meng, J. Outward-growth of the Tibetan Plateau during the Cenozoic: A review. Tectonophysics 2014, 621, 1–43. [Google Scholar] [CrossRef]
- Yin, A.; Dang, Y.; Zhang, M.; McRivette, M.W.; Burgess, W.P.; Chen, X. Cenozoic tectonic evolution of Qaidam basin and its surrounding regions (part 2): Wedge tectonics in southern Qaidam basin and the Eastern Kunlun Range. In Whence the Mountains? Inquiries into the Evolution of Orogenic Systems: A Volume in Honor of Raymond A. Price; The Geological Association of America: Boulder, CO, USA, 2007. [Google Scholar]
- Zhu, L.; Wang, C.; Zheng, H.; Xiang, F.; Yi, H.; Liu, D. Tectonic and sedimentary evolution of basins in the northeast of Qinghai-Tibet Plateau and their implication for the northward growth of the Plateau. Palaeogeogr. Palaeoclimatol. Palaeoecol. 2006, 241, 49–60. [Google Scholar] [CrossRef]
- Liu, Z.; Wang, C. Facies analysis and depositional systems of Cenozoic sediments in the Hoh Xil basin, northern Tibet. Sediment. Geol. 2001, 140, 251–270. [Google Scholar] [CrossRef]
- Li, L.; Guo, Z.; Guan, S.; Zhou, S.; Wang, M.; Fang, Y.; Zhang, C. Heavy mineral assemblage characteristics and the Cenozoic paleogeographic evolution in southwestern Qaidam Basin. Sci. China Earth Sci. 2015, 58, 859–875. [Google Scholar] [CrossRef]
- Zhou, T.; Wu, C.; Yuan, B.; Shi, Z.; Wang, J.; Zhu, W.; Zhou, Y.; Jiang, X.; Zhao, J.; Wang, J.; et al. New insights into multiple provenances evolution of the Jurassic from heavy minerals characteristics in southern Junggar Basin, NW China. Pet. Explor. Dev. 2019, 46, 67–81. [Google Scholar] [CrossRef]
- Garzanti, E.; Doglioni, C.; Vezzoli, G.; Ando, S. Orogenic belts and orogenic sediment provenance. J. Geol. 2007, 115, 315–334. [Google Scholar] [CrossRef] [Green Version]
- Morton, A.; Whitham, A.; Fanning, C. Provenance of Late Cretaceous to Paleocene submarine fan sandstones in the Norwegian Sea: Integration of heavy mineral, mineral chemical and zircon age data. Sediment. Geol. 2005, 182, 3–28. [Google Scholar] [CrossRef]
- Zhang, W.; Jian, X.; Fu, L.; Feng, F.; Guan, P. Reservoir characterization and hydrocarbon accumulation in late Cenozoic lacustrine mixed carbonate-siliciclastic fine-grained deposits of the northwestern Qaidam basin, NW China. Mar. Pet. Geol. 2018, 98, 675–686. [Google Scholar] [CrossRef]
- Métivier, F.; Gaudemer, Y.; Tapponnier, P.; Meyer, B. Northeastward growth of the Tibet plateau deduced from balanced reconstruction of two depositional areas: The Qaidam and Hexi Corridor basins, China. Tectonics 1998, 17, 823–842. [Google Scholar] [CrossRef] [Green Version]
- Meyer, B.; Tapponnier, P.; Bourjot, L.; Metivier, F.; Gaudemer, Y.; Peltzer, G.; Shunmin, G.; Zhitai, C. Crustal thickening in Gansu-Qinghai, lithospheric mantle subduction, and oblique, strike-slip controlled growth of the Tibet plateau. Geophys. J. Int. 1998, 135, 1–47. [Google Scholar] [CrossRef]
- Tapponnier, P.; Zhiqin, X.; Roger, F.; Meyer, B.; Arnaud, N.; Wittlinger, G.; Jingsui, Y. Oblique stepwise rise and growth of the Tibet Plateau. Science 2001, 294, 1671–1677. [Google Scholar] [CrossRef]
- Yin, A.; Dang, Y.-Q.; Wang, L.-C.; Jiang, W.-M.; Zhou, S.-P.; Chen, X.-H.; Gehrels, G.E.; McRivette, M.W. Cenozoic tectonic evolution of Qaidam basin and its surrounding regions (Part 1): The southern Qilian Shan-Nan Shan thrust belt and northern Qaidam basin. Geol. Soc. Am. Bull. 2008, 120, 813–846. [Google Scholar] [CrossRef]
- Wu, H.; Hu, W.; Cao, J.; Wang, X.; Wang, X.; Liao, Z. A unique lacustrine mixed dolomitic-clastic sequence for tight oil reservoir within the middle Permian Lucaogou Formation of the Junggar Basin, NW China: Reservoir characteristics and origin. Mar. Pet. Geol. 2016, 76, 115–132. [Google Scholar] [CrossRef]
- Zuza, A.V.; Wu, C.; Reith, R.C.; Yin, A.; Li, J.; Zhang, J.; Zhang, Y.; Wu, L.; Liu, W. Tectonic evolution of the Qilian Shan: An early Paleozoic orogen reactivated in the Cenozoic. Bulletin 2018, 130, 881–925. [Google Scholar] [CrossRef]
- Clark, M.K.; Farley, K.A.; Zheng, D.; Wang, Z.; Duvall, A.R. Early Cenozoic faulting of the northern Tibetan Plateau margin from apatite (U–Th)/He ages. Earth Planet. Sci. Lett. 2010, 296, 78–88. [Google Scholar] [CrossRef]
- Cheng, F.; Jolivet, M.; Fu, S.; Zhang, Q.; Guan, S.; Yu, X.; Guo, Z. Northward growth of the Qimen Tagh Range: A new model accounting for the Late Neogene strike-slip deformation of the SW Qaidam Basin. Tectonophysics 2014, 632, 32–47. [Google Scholar] [CrossRef] [Green Version]
- Gehrels, G.E.; Yin, A.; Wang, X.F. Magmatic history of the northeastern Tibetan Plateau. J. Geophys. Res. Solid Earth 2003, 108, 2423. [Google Scholar] [CrossRef]
- Wang, X.; Qiu, Z.; Li, Q.; Wang, B.; Qiu, Z.; Downs, W.R.; Xie, G.; Xie, J.; Deng, T.; Takeuchi, G.T. Vertebrate paleontology, biostratigraphy, geochronology, and paleoenvironment of Qaidam Basin in northern Tibetan Plateau. Palaeogeogr. Palaeoclimatol. Palaeoecol. 2007, 254, 363–385. [Google Scholar] [CrossRef]
- Zhuang, G.; Hourigan, J.K.; Ritts, B.D.; Kent-Corson, M.L. Cenozoic multiple-phase tectonic evolution of the northern Tibetan Plateau: Constraints from sedimentary records from Qaidam basin, Hexi Corridor, and Subei basin, northwest China. Am. J. Sci. 2011, 311, 116–152. [Google Scholar] [CrossRef]
- Hallsworth, C.; Chisholm, J. Provenance of late Carboniferous sandstones in the Pennine Basin (UK) from combined heavy mineral, garnet geochemistry and palaeocurrent studies. Sediment. Geol. 2008, 203, 196–212. [Google Scholar] [CrossRef]
- Mange, M.A.; Maurer, H. Heavy Minerals in Colour; Springer Science & Business Media: Berlin/Heidelberg, Germany, 2012. [Google Scholar]
- Ayofe, A.J.; Anthony, I.R. Application of ZTR Index in the Assessment of Maturity of Stream Sediments in Akinmorin Area, Southwestern Nigeria. IRE J. 2020, 3, 98–107. [Google Scholar]
- Hubert, J.F. A zircon-tourmaline-rutile maturity index and the interdependence of the composition of heavy mineral assemblages with the gross composition and texture of sandstones. J. Sediment. Res. 1962, 32, 440–450. [Google Scholar]
- Zhang, C.; Li, Z.; Chen, Q.; Dong, S.; Yu, X.; Yu, Q. Provenance of eolian sands in the Ulan Buh Desert, northwestern China, revealed by heavy mineral assemblages. Catena 2020, 193, 104624. [Google Scholar] [CrossRef]
- Morton, A.C.; Hallsworth, C.R. Processes controlling the composition of heavy mineral assemblages in sandstones. Sediment. Geol. 1999, 124, 3–29. [Google Scholar] [CrossRef]
- von Eynatten, H.; Gaupp, R. Provenance of Cretaceous synorogenic sandstones in the Eastern Alps: Constraints from framework petrography, heavy mineral analysis and mineral chemistry. Sediment. Geol. 1999, 124, 81–111. [Google Scholar] [CrossRef]
- Morton, A.C.; Hallsworth, C. Identifying provenance-specific features of detrital heavy mineral assemblages in sandstones. Sediment. Geol. 1994, 90, 241–256. [Google Scholar] [CrossRef]
- Morton, A.C. Heavy minerals in provenance studies. In Provenance of Arenites; Springer: Berlin/Heidelberg, Germany, 1985; pp. 249–277. [Google Scholar]
- Zhu, W.; Wu, C.; Wang, J.; Zhou, T.; Li, J.; Zhang, C.; Li, L. Heavy mineral compositions and zircon U-Pb ages of Cenozoic sandstones in the SW Qaidam basin, northern Tibetan Plateau: Implications for provenance and tectonic setting. J. Asian Earth Sci. 2017, 146, 233–250. [Google Scholar] [CrossRef]
- Fu, L.; Guan, P.; Zhang, D.; Wang, M.; Zhang, J. Heavy mineral feature and provenance analysis of Paleogene Lulehe Formation in Qaidam Basin. Acta Petrol. Sin. 2013, 29, 2867–2875. [Google Scholar]
- Rieser, A.B.; Neubauer, F.; Liu, Y.; Ge, X. Sandstone provenance of north-western sectors of the intracontinental Cenozoic Qaidam basin, western China: Tectonic vs. climatic control. Sediment. Geol. 2005, 177, 1–18. [Google Scholar] [CrossRef]
- Cowgill, E.; Yin, A.; Harrison, T.M.; Xiao-Feng, W. Reconstruction of the Altyn Tagh fault based on U-Pb geochronology: Role of back thrusts, mantle sutures, and heterogeneous crustal strength in forming the Tibetan Plateau. J. Geophys. Res. Solid Earth 2003, 108, 2346. [Google Scholar] [CrossRef]
- Dill, H.G.; Buzatu, A.; Balaban, S.-I. Coastal morphology and heavy mineral accumulation in an upper-macrotidal environment—A geological-mineralogical approach from source to trap site in a natural placer laboratory (Channel Islands, Great Britain). Ore Geol. Rev. 2021, 138, 104311. [Google Scholar] [CrossRef]
- Dill, H.G.; Buzatu, A. From the aeolian landform to the aeolian mineral deposit in the present and its use as an ore guide in the past. Constraints from mineralogy, chemistry and sediment petrography. Ore Geol. Rev. 2021, 141, 104490. [Google Scholar] [CrossRef]
- Dill, H.G.; Goldmann, S.; Cravero, F. Zr-Ti-Fe placers along the coast of NE Argentina: Provenance analysis and ore guide for the metallogenesis in the South Atlantic Ocean. Ore Geol. Rev. 2018, 95, 131–160. [Google Scholar] [CrossRef]
- Howie, R.; Zussman, J.; Deer, W. An Introduction to the Rock-Forming Minerals; Longman: London, UK, 1992. [Google Scholar]
- Dai, J.; Wang, C.; Hourigan, J.; Santosh, M. Multi-stage tectono-magmatic events of the Eastern Kunlun Range, northern Tibet: Insights from U–Pb geochronology and (U–Th)/He thermochronology. Tectonophysics 2013, 599, 97–106. [Google Scholar] [CrossRef]
- Chen, X.; Wang, X.; George, G.; Yang, Y.; Qin, H.; Chen, Z.; Yang, F.; Chen, B.; Li, X. Early Paleozoic magmatism and gold mineralization in the northern Altun, NW China. Acta Geol. Sin. 2004, 78, 515–523. [Google Scholar]
- Li, W.; Neubauer, F.; Liu, Y.; Genser, J.; Ren, S.; Han, G.; Liang, C. Paleozoic evolution of the Qimantagh magmatic arcs, Eastern Kunlun Mountains: Constraints from zircon dating of granitoids and modern river sands. J. Asian Earth Sci. 2013, 77, 183–202. [Google Scholar] [CrossRef]
- Liu, L.; Wang, C.; Chen, D.; Zhang, A.; Liou, J. Petrology and geochronology of HP–UHP rocks from the South Altyn Tagh, northwestern China. J. Asian Earth Sci. 2009, 35, 232–244. [Google Scholar] [CrossRef]
- Wang, C.; Liu, L.; Yang, W.-Q.; Zhu, X.-H.; Cao, Y.-T.; Kang, L.; Chen, S.-F.; Li, R.-S.; He, S.-P. Provenance and ages of the Altyn Complex in Altyn Tagh: Implications for the early Neoproterozoic evolution of northwestern China. Precambrian Res. 2013, 230, 193–208. [Google Scholar] [CrossRef]
- Wang, J.; Zhang, D.; Yang, S.; Li, X.; Shi, Y.; Cui, J.; Zhang, P.; Wang, Y.; Yi, D.; Chang, H. Sedimentary characteristics and genesis of the salt lake with the upper member of the Lower Ganchaigou Formation from Yingxi sag, Qaidam basin. Mar. Pet. Geol. 2020, 111, 135–155. [Google Scholar] [CrossRef]
- Wang, Y.-q.; Gong, Q.; Xia, Z.; Xiong, S. Provenance analysis of Oligocene sediments in western Qaidam Basin. Geol. China 2012, 39, 426–435. [Google Scholar]
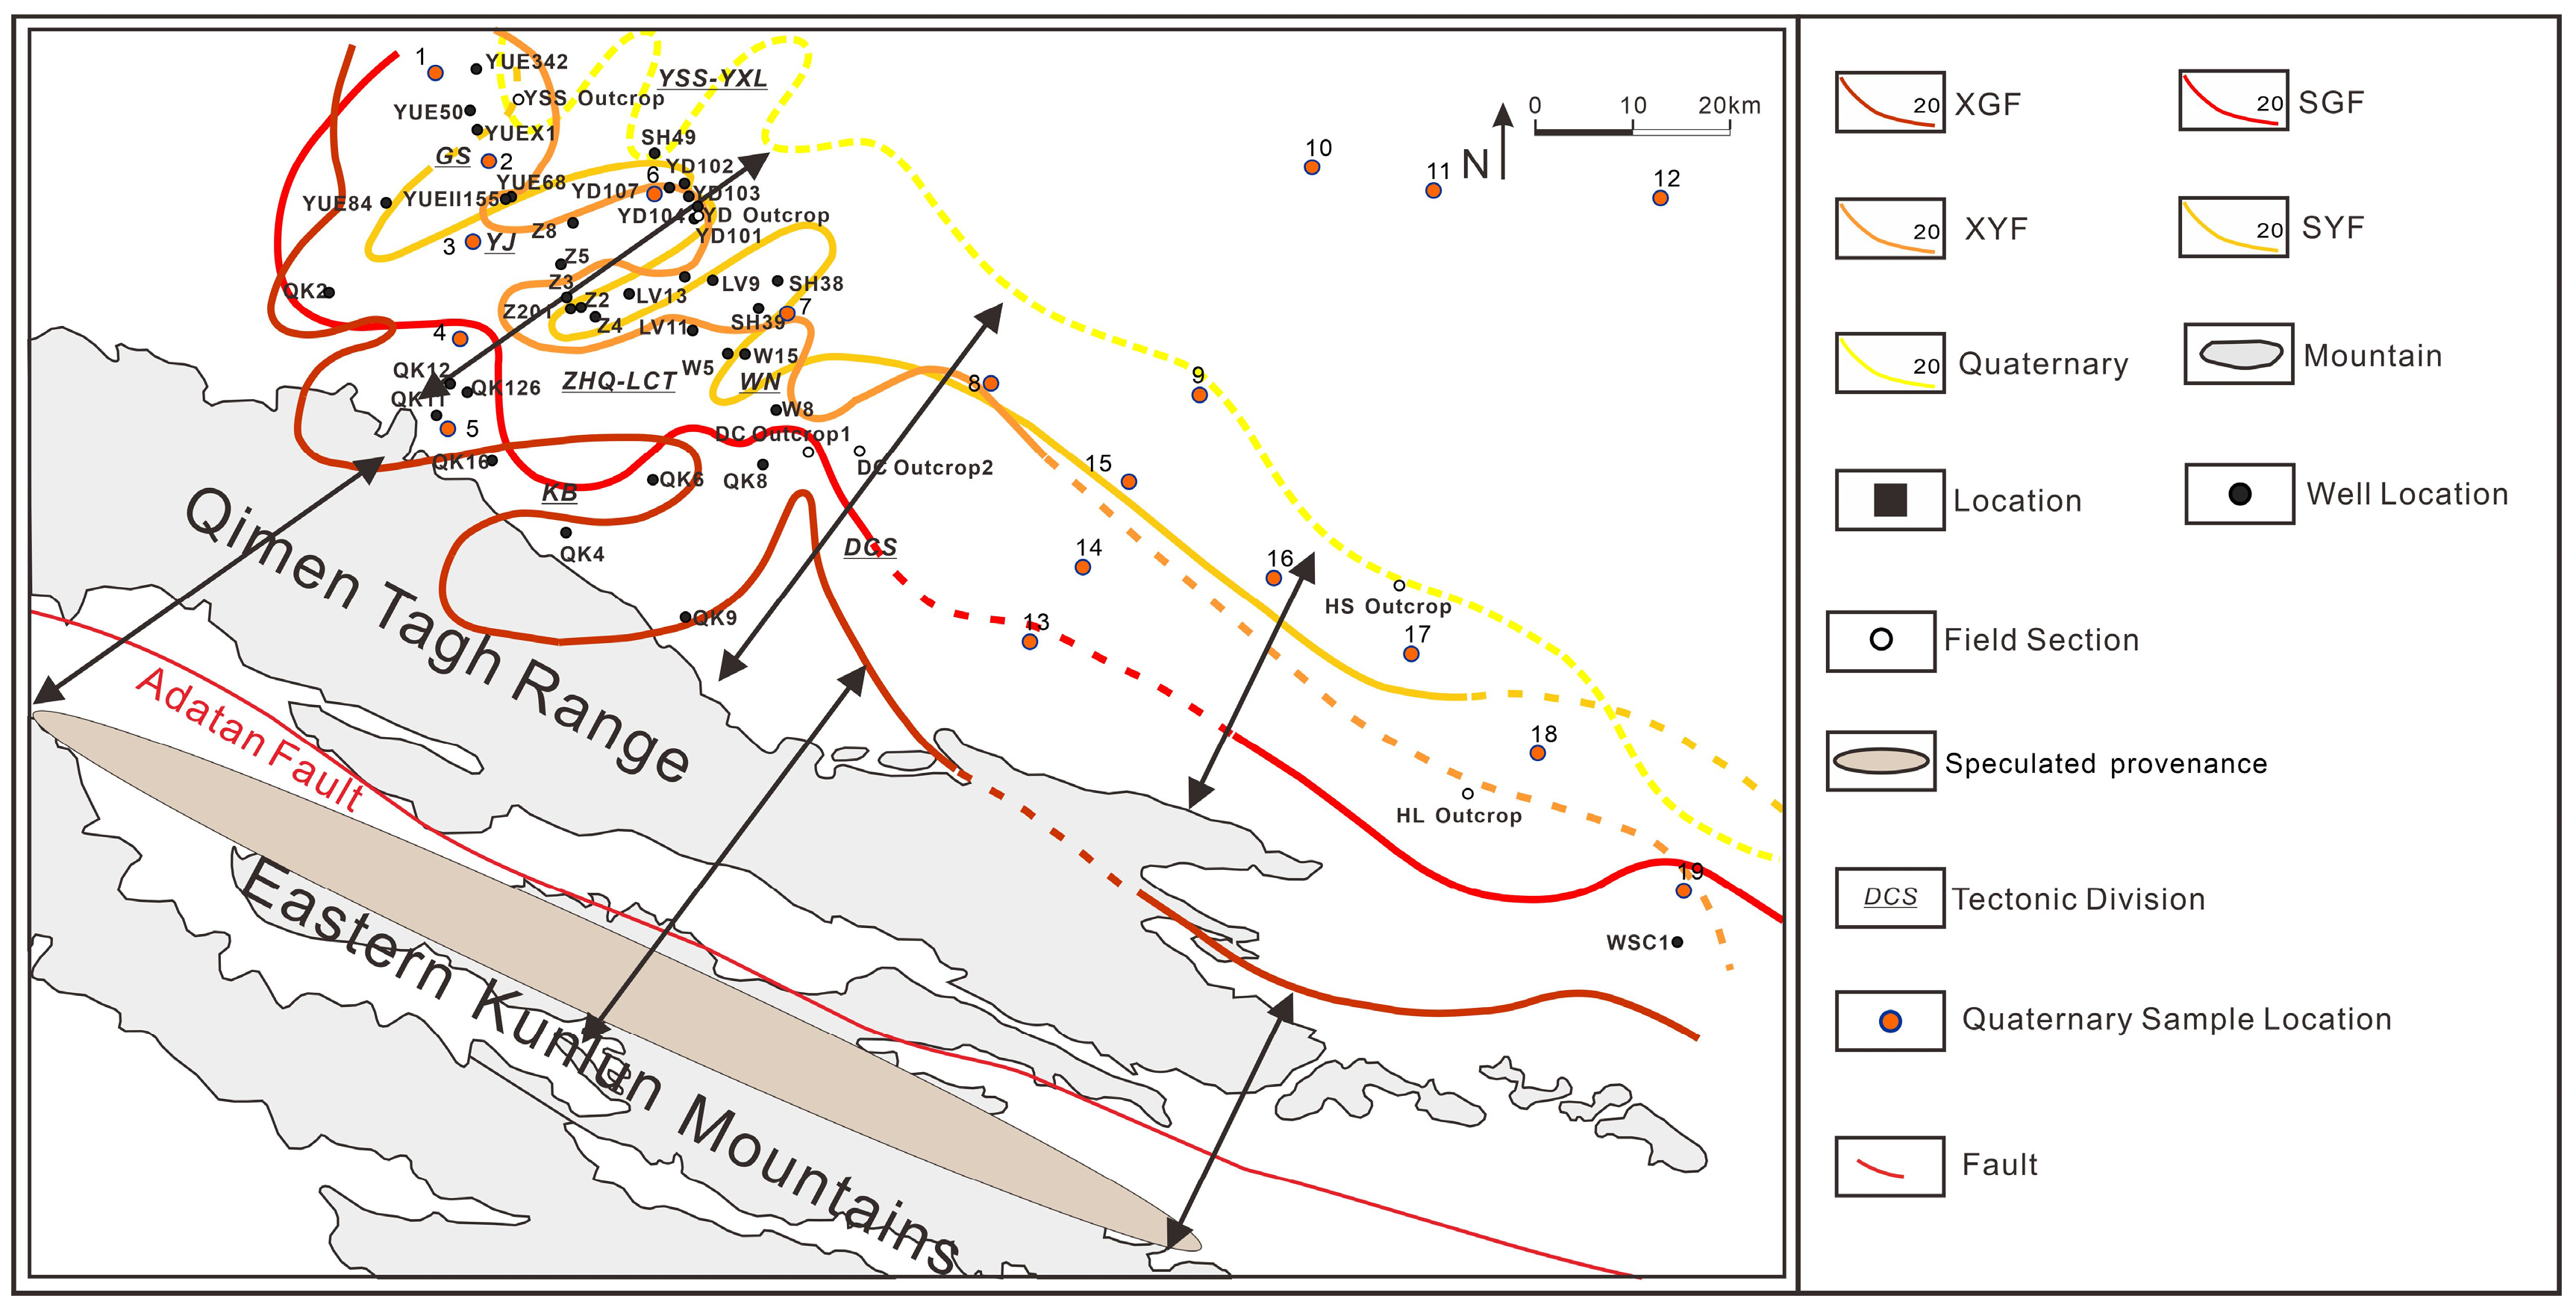
Figure 1.
(a) Location of the Qaidam Basin on the Tibetan Plateau; (b) locations of sampling wells and outcrops in southwestern Qaidam Basin. XSQ: Xianshuiquan; SZF: Shizigou; YQZ: Youquanzi; YSS-YXL: Youshashan-Yingxiongling, GS: Gasi, YJ: Yuejin, ZHQ-LCT: Zhahaquan-Lvcaotan, WN: Wunan, DCS: Dongchaishan, YSS Outcrop: Youshashan Outcrop, YD Outcrop: Yingdong Outcrop, DC Outcrop: Dongchaishan Outcrop, HS Outcrop: Huangshi Outcrop; (c) generalized Cenozoic stratigraphy column and seismic reflectors (T0–T5) (modified after [2]).

Figure 2.
Photographs and micrographs of the sandstones and heavy minerals. (a) Massive conglomerate (Well Yue 68, 2205.5 m); (b) Trough cross-bedding of Dongchaishan outcrop section; (c) coarse sandstone under plane-polarized light, the detrital grains are sub-rounded and sub-angular in shape (Dongchaishan outcrop); (d) fine sandstone, microwave-like bedding in the upper layer and small trough cross-bedding in the lower layer (Well LV13, 2525.5 m); (e) medium sandstone under plane-polarized light with subrounded to rounded grains (Dongchaishan outcrop); (f) fine sandstone under plane-polarized light (Dongchaishan outcrop); (g) brownish-red mudstone, horizontal bedding (Well LV13, 4308.2 m); massive grayish mudstone (h) and carbon debris (i) (Well W15, 3086.8 m); (j) subangular to subrounded shaped garnet grains (Well Z2); (k) subangular to subrounded shaped tourmaline grains (Well YD103).

Figure 3.
(a) Sedimentary facies evolution of Dongchashan outcrop; (b) the associations of the lithofacies representing different sedimentary facies. XGF: Xia Ganchaigou Formation; SGF: Shang Ganchaigou Formation; XYF: Xia Youshashan Formation; SYF: Shang Youshashan Formation.
Figure 3.
(a) Sedimentary facies evolution of Dongchashan outcrop; (b) the associations of the lithofacies representing different sedimentary facies. XGF: Xia Ganchaigou Formation; SGF: Shang Ganchaigou Formation; XYF: Xia Youshashan Formation; SYF: Shang Youshashan Formation.

Figure 4.
(a) The tectonic location of selected wells in southwestern Qaidam Basin; (b) the sedimentary profile of southwestern Qaidam Basin. Note that the well locations in the profile are shown in Figure 1b.
Figure 4.
(a) The tectonic location of selected wells in southwestern Qaidam Basin; (b) the sedimentary profile of southwestern Qaidam Basin. Note that the well locations in the profile are shown in Figure 1b.

Figure 5.
Average heavy mineral assemblages of sandstones from each location. (a) The heavy mineral assemblages of sandstone samples from Yuejin, Gasi, and Zhahaquan. (b) The heavy mineral assemblages of samples from Dongchaishan, Wunan, Lvcaotan, Kunbei, and Wanxi. (c) The heavy mineral assemblages of samples from Youshashan and Yingdong. The data and abbreviations of heavy minerals are shown in Table S1.

Figure 6.
Binary plot of heavy mineral stability indexes (ZTR and stability indexes), (a–d) are for Xia Ganchaigou Formation, Shang Ganchaigou Formation, Xia Youshashan Formation, and Shang Youshashan Formation, respectively. The data are shown in Tables S2–S5.
Figure 6.
Binary plot of heavy mineral stability indexes (ZTR and stability indexes), (a–d) are for Xia Ganchaigou Formation, Shang Ganchaigou Formation, Xia Youshashan Formation, and Shang Youshashan Formation, respectively. The data are shown in Tables S2–S5.

Figure 7.
Heavy mineral ratios (ATi, GZi, and RuZi) of each location for each formation. (a–d) Binary plot of heavy mineral ratios (ATi and RuZi) for each formation. (e–h) Binary plot of heavy mineral ratios (GZi and RuZi) for each formation. (i) The average values of the ATi, GZi, and RuZi index in each formation.

Figure 8.
The proportions of ZTAP, GERC mineral assemblages, and other heavy mineral ratios in different areas.
Figure 8.
The proportions of ZTAP, GERC mineral assemblages, and other heavy mineral ratios in different areas.

Figure 9.
ZTR = 20 contour of heavy minerals in Cenozoic and the reconstruction of southwestern boundary of Qaidam Basin. Note that the position of the mountain in the picture is the location of the present Qimen Tagh Range and Eastern Kunlun Mountains.
Figure 9.
ZTR = 20 contour of heavy minerals in Cenozoic and the reconstruction of southwestern boundary of Qaidam Basin. Note that the position of the mountain in the picture is the location of the present Qimen Tagh Range and Eastern Kunlun Mountains.

Figure 10.
The evolution of sedimentary facies in southwestern Qaidam Basin and ZTR = 20 contour of heavy minerals in each formation. (a–e) represent the sedimentary facies of Xia Ganchaigou, Shang Ganchaigou, Xia Youshashan, and Shang Youshashan Formation, respectively. Note that the position of the mountain in the picture is the location of the present Qimen Tagh Range and Eastern Kunlun Mountains. Note that clear sampling location refer to Figure 1b.

Publisher’s Note: MDPI stays neutral with regard to jurisdictional claims in published maps and institutional affiliations. |
© 2022 by the authors. Licensee MDPI, Basel, Switzerland. This article is an open access article distributed under the terms and conditions of the Creative Commons Attribution (CC BY) license (https://creativecommons.org/licenses/by/4.0/).
Share and Cite
MDPI and ACS Style
Ding, X.; Fu, L.; Guan, P.; Zhang, D. The Southwestern Boundary of Cenozoic Qaidam Basin: Constraints from Heavy Mineral Analysis. Minerals 2022, 12, 768. https://0-doi-org.brum.beds.ac.uk/10.3390/min12060768
AMA Style
Ding X, Fu L, Guan P, Zhang D. The Southwestern Boundary of Cenozoic Qaidam Basin: Constraints from Heavy Mineral Analysis. Minerals. 2022; 12(6):768. https://0-doi-org.brum.beds.ac.uk/10.3390/min12060768
Chicago/Turabian StyleDing, Xiaonan, Ling Fu, Ping Guan, and Daowei Zhang. 2022. "The Southwestern Boundary of Cenozoic Qaidam Basin: Constraints from Heavy Mineral Analysis" Minerals 12, no. 6: 768. https://0-doi-org.brum.beds.ac.uk/10.3390/min12060768
Note that from the first issue of 2016, this journal uses article numbers instead of page numbers. See further details here.