Article

Research on Uniaxial Compression Mechanics of Diorite under Flowing Acidic Solution Scouring

1
Department of Building Engineering, Hunan Institute of Engineering, Xiangtan 411104, China
2
School of Earth Sciences and Spatial Information Engineering, Hunan University of Science and Technology, Xiangtan 411201, China
3
School of Resource, Environment and Safety Engineering, Hunan University of Science and Technology, Xiangtan 411201, China
4
School of Mathematics and Computational Science, Hunan University of Science and Technology, Xiangtan 411201, China
5
School of Energy and Mining Engineering, China University of Mining and Technology (Beijing), Beijing 100083, China
*
Authors to whom correspondence should be addressed.
Submission received: 8 May 2022 / Revised: 8 June 2022 / Accepted: 14 June 2022 / Published: 17 June 2022

Abstract

:
The bedrock used for underground construction has obvious traces of hydrodynamic scouring damage, and the mechanical properties of bedrock especially are severely damaged under a groundwater environment. On this basis, considering the excavated bedrock under various saturations, the uniaxial compression test of diorite is carried out. Meanwhile, scanning electron microscopy (SEM), electron energy spectroscopy (EDS) and X-ray diffraction (XRD) are used in the experiment. The variation law of the elastic p-wave velocity and microstructure and the response characteristics of the strength, deformation and mechanical parameters of rock under different flow rates and pH values are analyzed in detail. The results indicate that: (1) Saturations with a faster flow rate and lower pH value cause greater relative changes in the elastic longitudinal wave velocity of the samples. (2) The uniaxial compressive strength of the samples under various treatment conditions showed a decreasing trend. Compared with the dried samples, the uniaxial compressive strength of the samples under saturation with field flow rate v = 300 mm·s−1 and pH = 1 decreased by 46.08%, and the strength decreased by 35.67% under saturation with a field pH value = 6.56 and flow rate v = 900 mm·s−1. (3) The saturation with a stronger acidity, greater flow rate and longer action time causes the apparent dense structure of the diorite sample to be loose and accompanied by microcracks, which weakens its macromechanical properties. (4) Acid and hydrodynamic saturation produce water–rock chemical and physical effects on diorite, which weaken the connection force between mineral particles and the friction between fracture surfaces, reduce the elastic modulus, increase Poisson’s ratio and accelerate the failure of diorite.

1. Introduction

Rock instability and failure is a type of engineering disaster commonly encountered in underground rock construction [1,2,3], which seriously affects the safety of the project. There are many factors affecting the rock engineering stability, including geological factors such as the initial stress state of the rock mass, the rock mechanical properties and groundwater, as well as engineering factors such as construction methods and support installation time [4,5]. Among them, the decisive factor of rock stability depends on whether the mechanical properties of the rock mass are stable [6,7]. Considering that the underground rock mass project is under various groundwater conditions, most rock mass is susceptible to the chemical properties of the solution. For instance, the sandstone of the reservoir bank slope of the Three Gorges Reservoir Area in China has been gradually corroded by the solution for a long time; the corrosion immersion rate and depth have gradually accelerated [8]. The rock mass of the reservoir area subsidence zone is subject to continuous wet and dry cycles, resulting in the intensified weathering of the rock mass and deterioration of the mechanical properties [9]. Moreover, the ionic component of groundwater is very complex, and the water–rock interaction with the rock mass is diverse; the resultant deterioration in rock mechanical properties has gradually attracted the attention of many scholars.
On the one hand, many scholars have studied the acid solution corrosion of rock mass. Li [10] prepared different water–rock chemical solutions and performed shear strength tests on building bedrocks, the test results showed that the shear strength of the building bedrock in an alkaline condition was less degraded than under an acidic condition. With the increasing degree of water–rock chemical damage, the internal friction angle and cohesion of building bedrocks decreased. Cai et al. [8] conducted uniaxial mechanical tests on sandstones eroded by solutions with various pH values and summarized the effect of different chemical solutions on the uniaxial compressive strength, axial strain corresponding to the peak axial stress and elastic modulus of the samples by generalizing their chemical corrosion mechanisms. Shang et al. [11] conducted direct shear tests on artificial granite fracture samples immersed in chemical solutions with various pH values for different durations. They concluded that the shear characteristics of the fractures are mainly caused by the dissolution effect of acidic solutions, and acidic groundwater is critical for the short-term or long-term stability of fractured rock masses in geological engineering.
On the other hand, the instability failure of rock mass is closely related to the water–rock interaction [12,13,14]. Due to the chemical corrosion after the water–rock interaction, the connection between mineral particles is weakened, and the microstructure of rock mass changes. Therefore, many scholars carried out instability and failure tests on different rocks. Chen et al. [15] have already found that the structure of diorite samples became loose after decreasing the pH, accompanied by microcracks that weakened its macromechanical properties. They also established a strength damage model of diorite considering acidification. Luo et al. [16] studied the triaxial creep characteristics of sandstone under the water–rock interaction for the long-term stability of rock engineering, especially the creep of rock under water action, and established a nonlinear creep intrinsic model to capture the degradation behavior of sandstone due to the cyclic drying and wetting of reservoir water. Jin et al. [17] used typical brittle barite as the object of study and conducted a double torsion test to determine the subcritical crack expansion parameters during the rock interaction. They found that the dispersion and deviation of the rock sample surface datum increased, and the height difference decreased after the water–rock interaction.
The above research provides a solid foundation for explaining the instability effects of rock masses under a hydrostatic state. However, the influence of a hydrodynamic environment on mechanical properties of rock is rarely considered in their experiments. Hence, this paper was based on the previous mechanical experiments, focusing on the hydrodynamic environment; considering the perspective of rock damage evolution under different pH acidification and flow rate scouring, we further analyze the detailed action mechanism of the solution’s acidity and flow rate on the mechanical properties of rocks through experiments. The influence law and action mechanism of dynamic water scouring obtained from the test can provide some theoretical basis for the stability control of bedrock under a hydrodynamic groundwater environment.

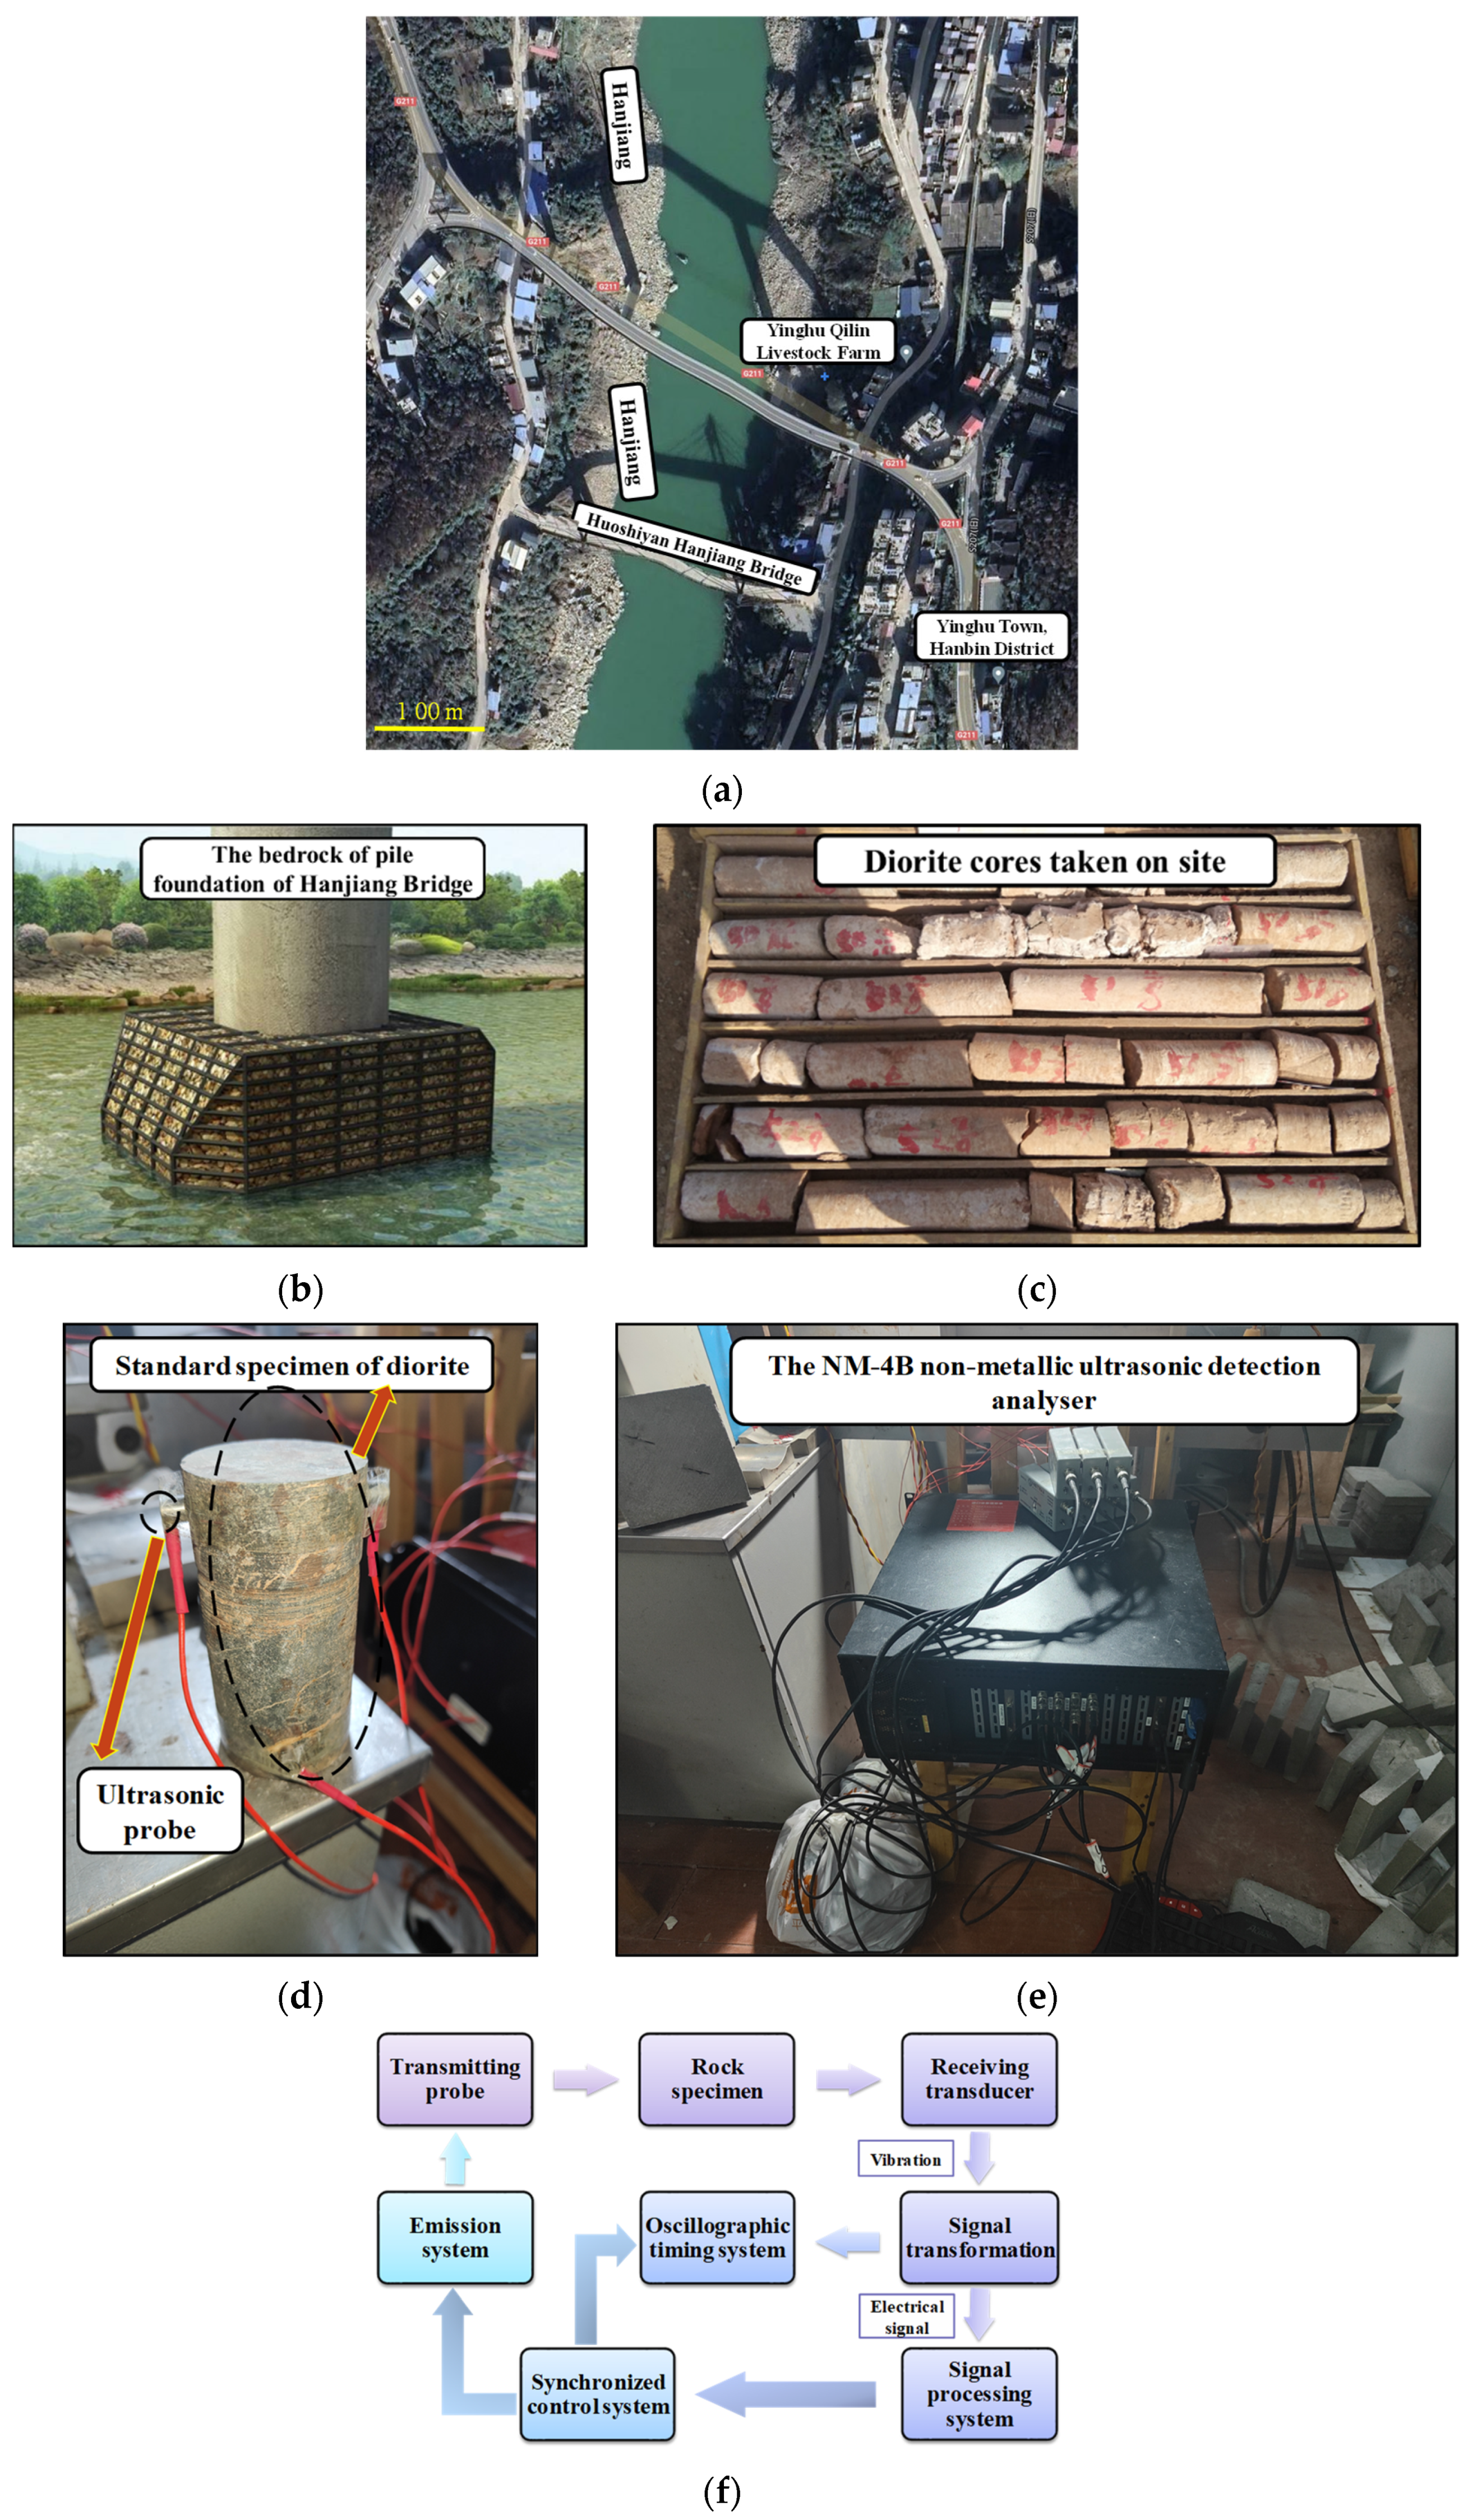
2. Materials and Methods

2.1. Sample Preparation

The rock samples used in the experiment are taken from the diorite bedrock of the pile foundation of Hanjiang Bridge in Ankang City, Shaanxi Province (see Figure 1a,b). To reduce the discreteness of rock samples, the samples were taken from the same large bedrock of Pier #4 at a depth of 80 m below water level, and the cores were drilled uniformly in the sedimentary direction of bedrock with core diameter Φ of 150 mm (see Figure 1c). Cores were taken over an area of 0.5 m2 along the direction of bedrock deposition. In order to improve the reliability and comparability of the test results, the appearance of the processed specimens was screened and samples with obvious apparent defects were removed. The diorite samples were subjected to wave velocity measurements using the NM-4B non-metallic ultrasonic detection analyzer (key laboratory of southern coal mine, Hunan University of Science and Technology, Xiangtan, China) (see Figure 1d,e). The sensitivity of the detector was less than 30 μV, the ultrasonic pulse method was performed with a sampling interval of 0.1 μs. Vaseline was selected as the coupling agent and a pressure of approximately 0.05 MPa was applied to the longitudinal wave transducer.
Wave velocity measurement is essentially the transmission of a mass vibration through a medium. The working principle of wave velocity measurement is shown in Figure 1f. The time distance between emission and reception of the pulse is measured by the time measurement device, and the zero delay time t0 of the wave in the probe detector system is deducted, which gives the wave propagation time t in the medium. The equation for calculating the wave velocity is:
v p = L t p t 0
In Equation (1): vp is the longitudinal wave speed, m/s; L is the distance between the transmit and receive transducer, m; tp is the propagation time of the elastic longitudinal wave, s.
The testing specimens were all diorite, and the longitudinal wave velocity was typically 3000 to 6000 m/s. Samples with similar wave velocities (4000–5000 m/s) were selected for testing [18,19]. Thus, the core collection representative for this object can be guaranteed.
The rock samples obtained by core drilling were then cut and grinded, the ends and sides of samples were cut and smoothed with a cutting machine and ground with sandpaper to ensure the integrity and smoothness of both ends and side of samples, thus avoiding test errors and end effects. According to the specification requirements [20,21,22], the standard cylindrical samples of 50 × 100 mm with smooth surface and no breakage were finally processed.
Before the test, the mineral composition of diorite samples at room temperature was tested by X-ray diffraction, and its mineral composition and mass percentage were analyzed (see Table 1). The main components of diorite were plagioclase and dark minerals, followed by quartz and minor metallic minerals. In addition, the physical parameters of all samples were measured, and samples with similar parameters were selected for testing. For instance, the diameter and height of samples were measured with vernier caliper, weighed by electronic scale and porosity was determined by the specific gravity bottle method (see Equation (2)).
n = ( ρ p ρ d ) / ρ p × 100 %
In Equation (2): n is the porosity; ρp and ρd are the density of the dry rock and the density of the particles, respectively.
Part of the specimens were numbered sequentially from S-1–S-16, and divided into four groups of four samples in each group. The relevant physical parameters of diorite were measured as shown in Table 2.

2.2. Realization of Solution Scouring Environment

The solution scouring test was performed by setting the solution flow rate v as 0, 300, 600 and 900 mm·s−1 with a self-made hydrodynamic scouring device to simulate the natural aqueous solution condition (see Figure 2), where the monitoring flow rate on site was 300 mm·s−1. Combining with the maximum content of cationic root Na+ and anionic root Cl in the groundwater on site, we prepared the NaCl solutions with pH values of 1, 3 and 5 by appropriately increasing the concentration of reactants to simulate the long-term scouring and erosion effects of diorite by weak acidic groundwater on site (pH = 6.56) with a relatively short laboratory test time (60 days) [23] (see Table 3). In addition, the solution of groundwater condition in the practical project (pH = 6.56) was also sampled for the test (see Table 3).
Different aqueous solutions have different chemical compositions [24]; in order to avoid test errors caused by different test solution sampling, the configuration of the test solution is all based on the on-site water for the deployment. The configuration and calibration steps of acidic NaCl solution for this test were as follows:
(1)
Measure a quantity of concentrated hydrochloric acid and add distilled water to dilute one 500 mL hydrochloric acid solution.
(2)
A total of 0.75 g anhydrous sodium carbonate was weighed as the reference substance and dissolved in 300 mL distilled water, then 5 drops of methyl orange indicator were added.
(3)
The sodium carbonate solution in (2) was calibrated with the hydrochloric acid solution configured in (1) until the color turned orange, and the pH value of the solution was determined by the PHS-25 pH meter.
(4)
For (3), slowly adding distilled water in the configuration solution to dilute to the required concentration and pH value of Table 3 and adding an appropriate amount of NaCl powder in the dilution process to fully stir until complete dissolution.

2.3. Laboratory Contents and Methods

The flushing device was used to flush the diorite samples in chemical solutions with pH values of 6.56, 5, 3 and 1 for 60 d at different flow rates, respectively. Then, we conducted uniaxial compression tests with MTS-815, electron microscopy scanning (SEM) with SU3500, energy dispersive spectroscopy (EDS) with SU3500 and X-ray diffraction (XRD) tests with D8 Powder Diffractometeron of the scoured and naturally dried samples. The powder from the surface of the treated specimen was taken and ground. The uniaxial compression test was performed using the MTS-815 electro-hydraulic servo rock mechanics system at the Southern Coal Mining Key Laboratory of Hunan University of Science and Technology (HUST) (see Figure 2c). MTS-815 was developed by American MTS company for rock and concrete, which has three sets of independent closed-loop servo control functions: axial pressure, perimeter pressure and pore water pressure. The physical and mechanical parameters and stress characteristics of diorite were obtained, and the stress–strain curves of rock samples were plotted. In addition, the variation of mechanical parameters, strength and deformation damage processes, microstructure and macroscopic damage patterns of diorite under different conditions were analyzed. Furthermore, the damage mechanisms of diorite under uniaxial compression with different flow rates and pH values were described in detail.

3. Results

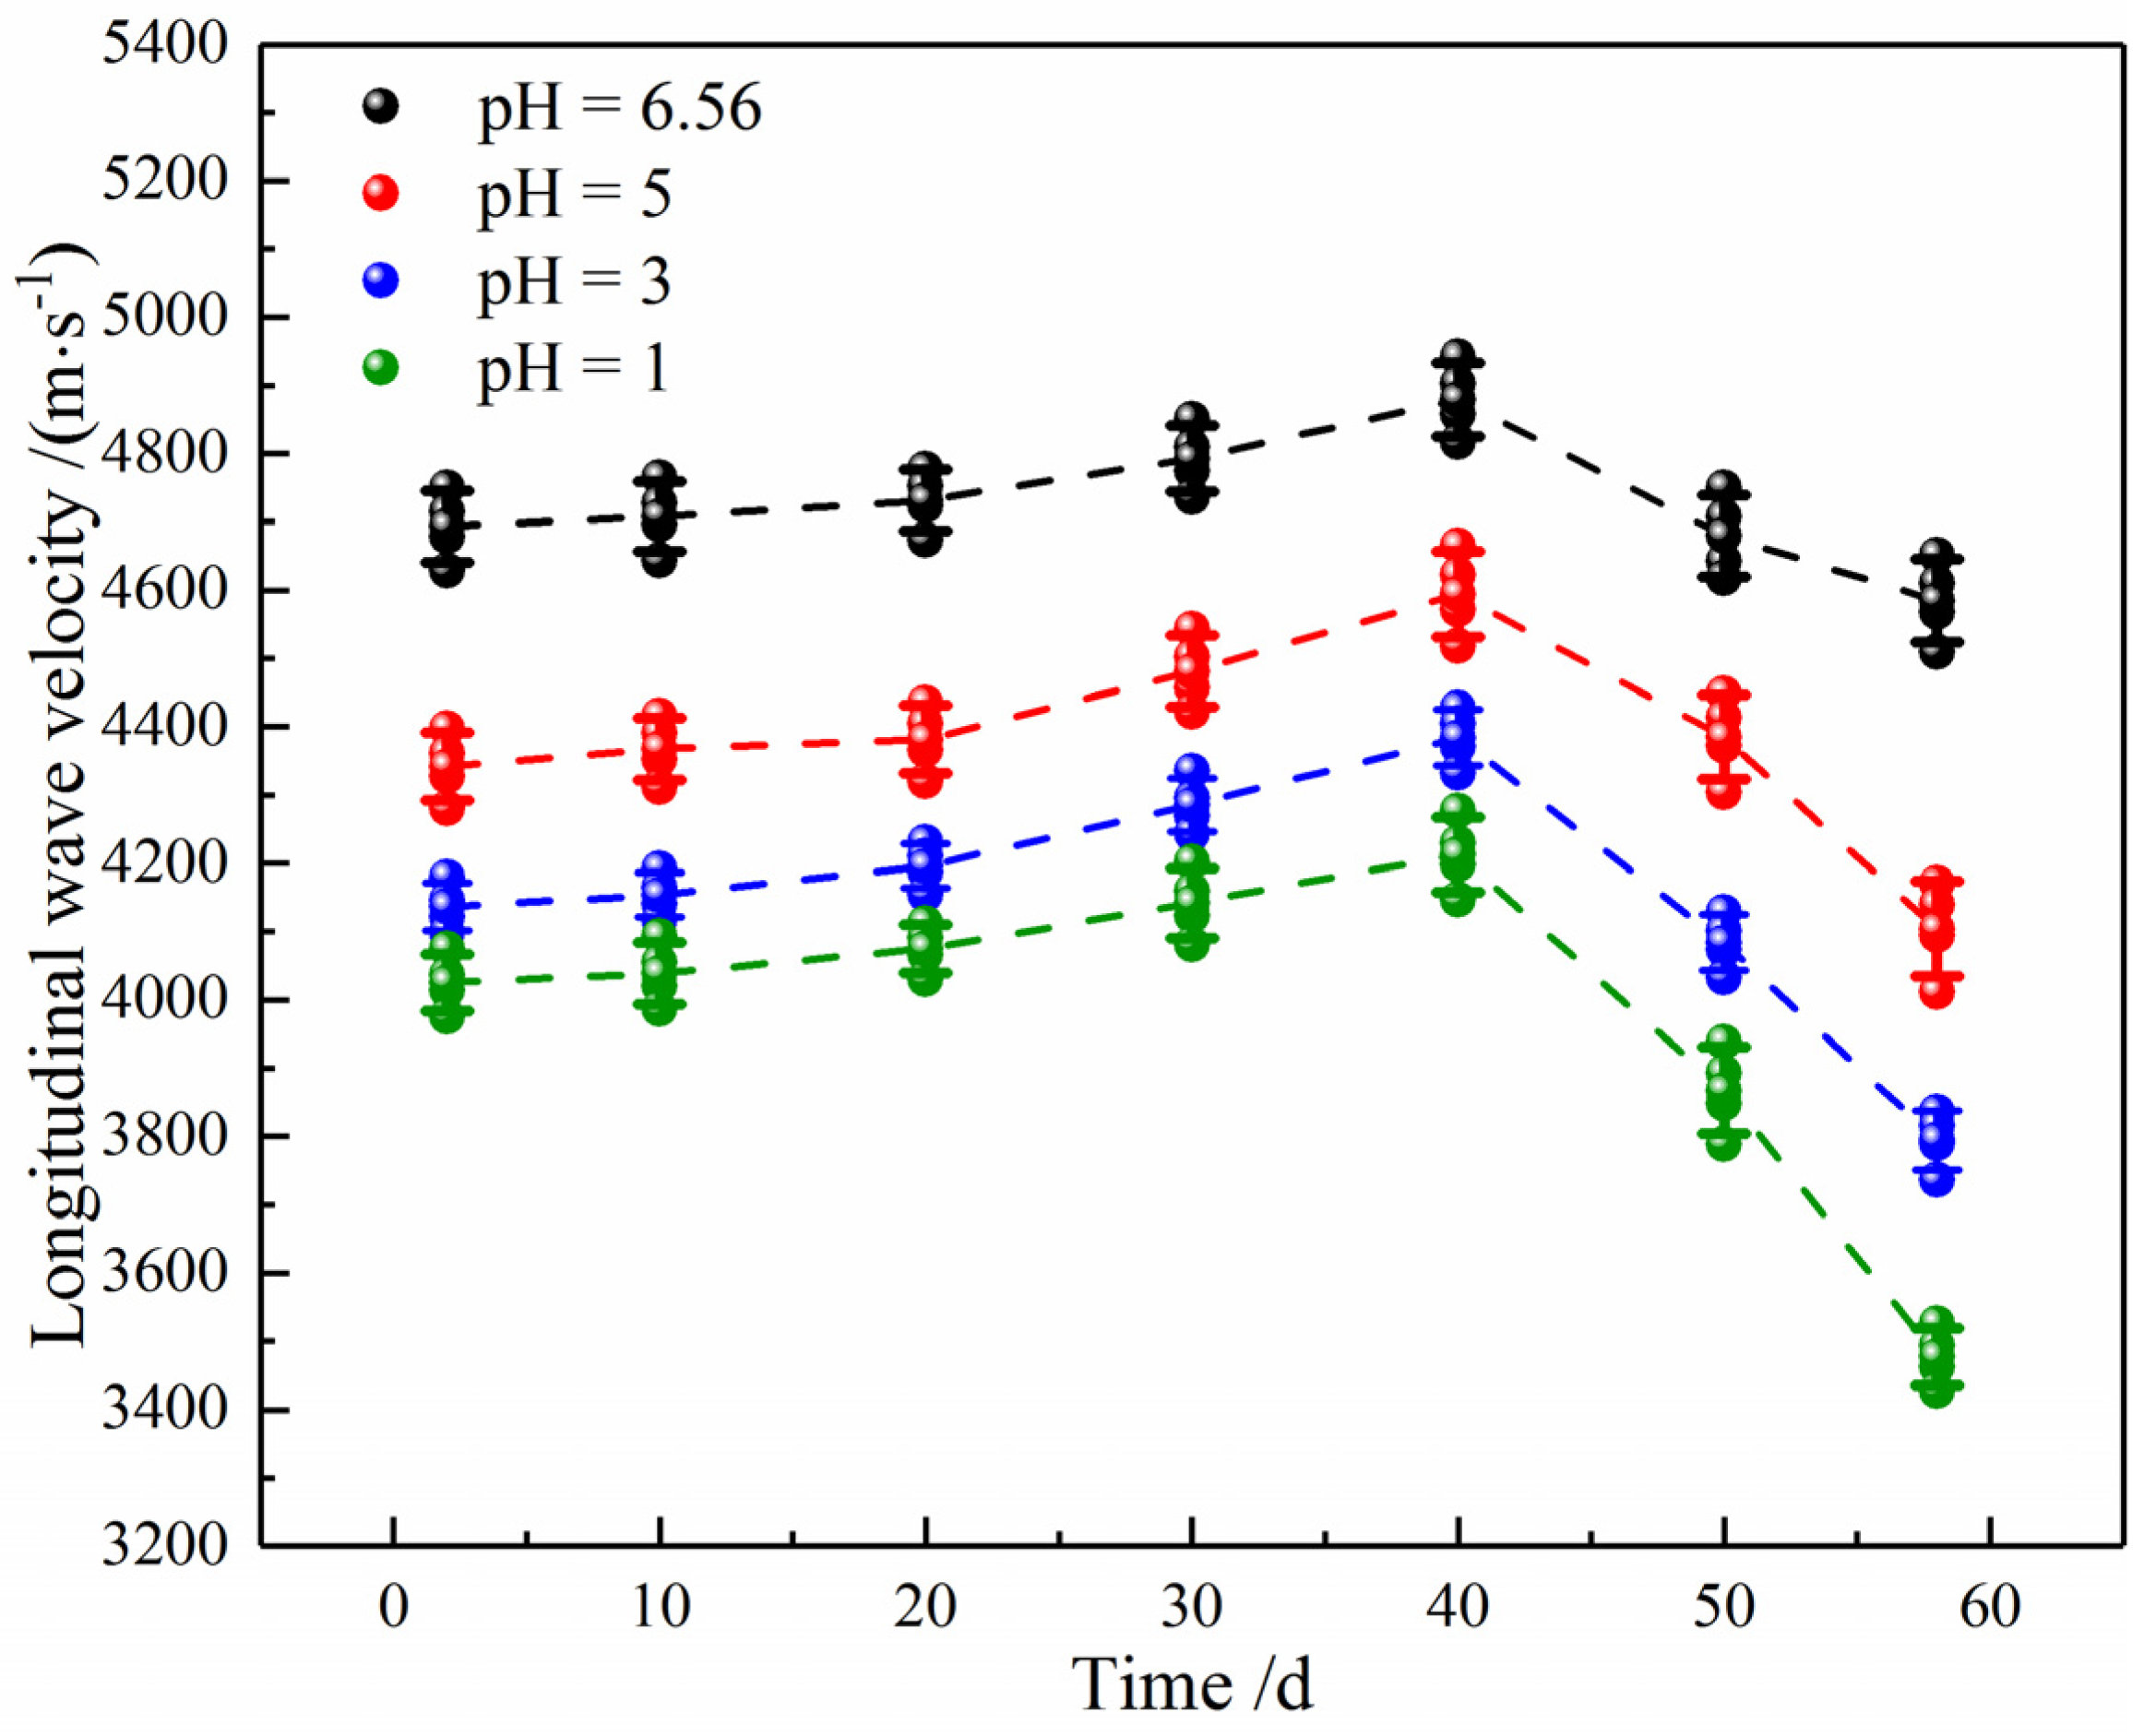
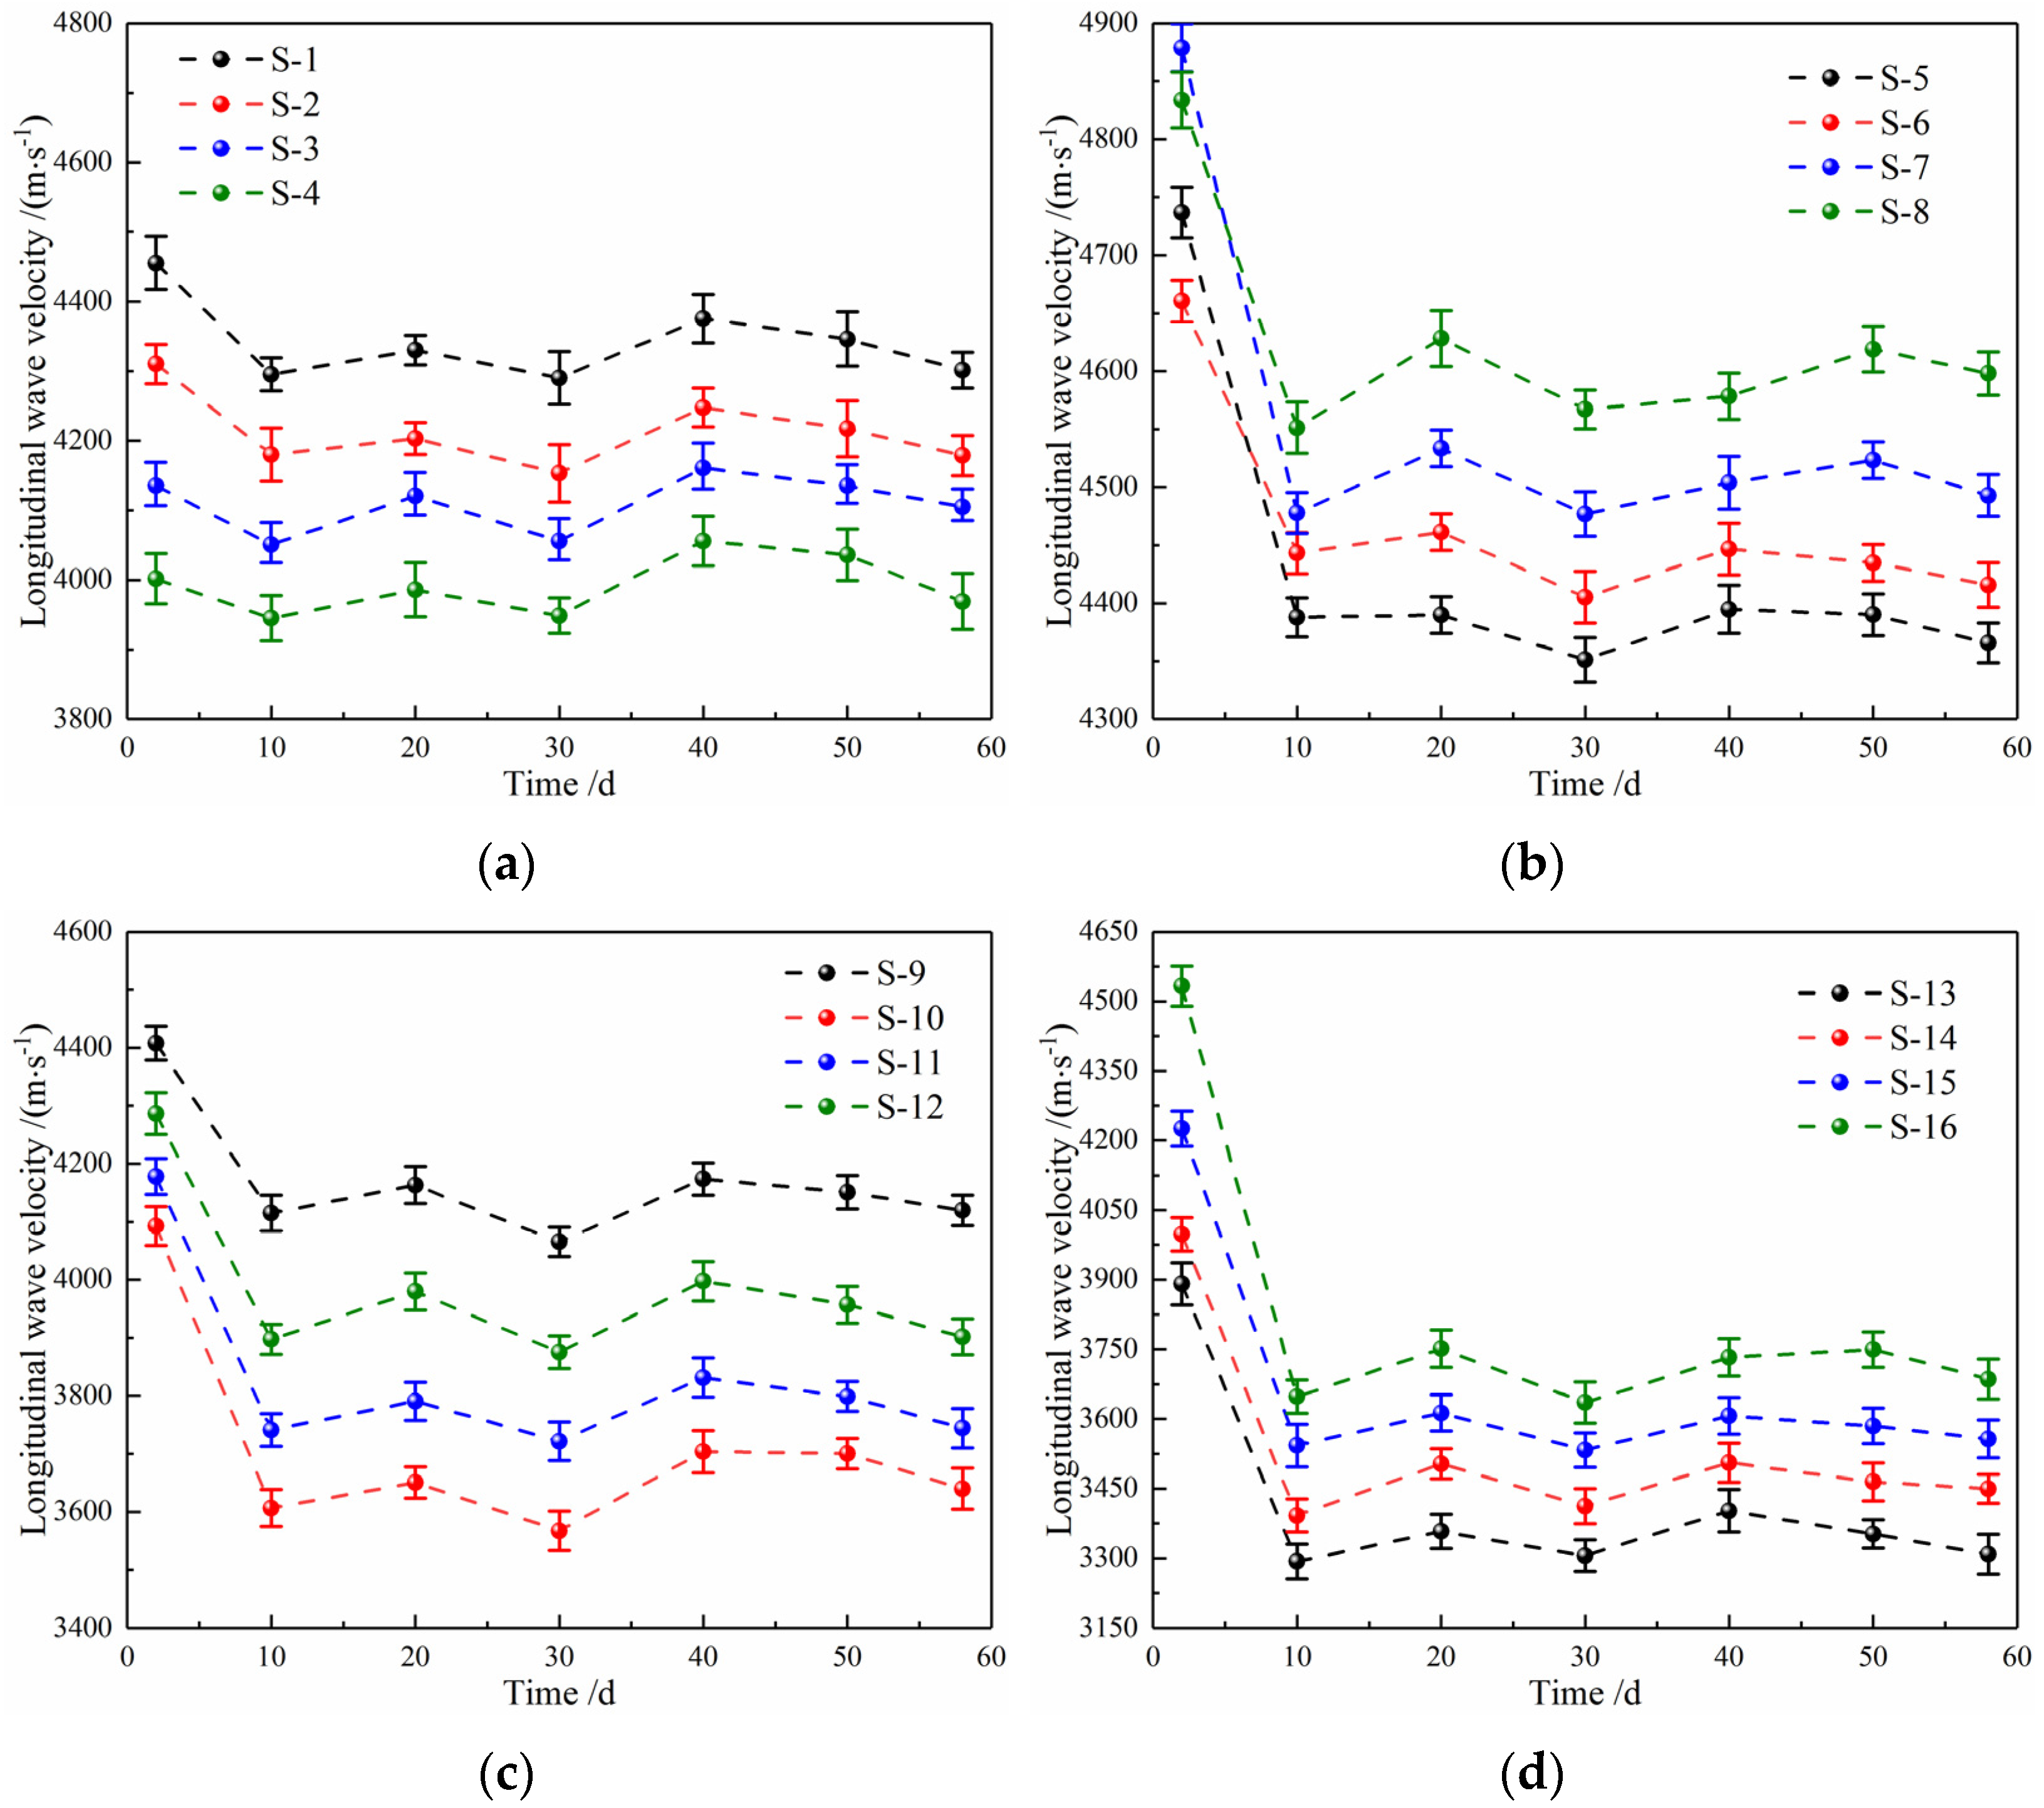
3.1. Effect of Flowing Acid Solution on Elastic Longitudinal Wave of Diorite

  • Analysis of variation with pH
The elastic longitudinal wave velocity of rocks is influenced by elastic parameters, such as rock density, Young’s modulus and Poisson’s ratio. Thus, the factors affecting these physical parameters also influence the elastic longitudinal wave velocity [25]. Conversely, the relevant elastic constants of material can be measured by ultrasonic speed measurement. Therefore, the longitudinal wave velocity reflects the integrity of the rock’s internal structure to a certain extent. Figure 3 shows the change in the elastic longitudinal wave velocity (vp) of diorite after treatment with acidic solutions of different pH values (field flow rate v = 300 mm·s−1).
Figure 3 indicates that the changing trend of diorite specimens’ vp treated by acidic solutions with different pH values is basically the same. The longitudinal wave velocity increases slightly from 0 to 20 d, increases sharply from 20 to 40 d and decreases exquisitely from 40 to 60 d. When the experimental time reaches 40 days, the specimens’ vp dispersion under different pH solutions gradually increases. On the 60th day, the specimens’ vp dispersions are smaller than the 40th day, while the vp distribution was still relatively dispersed.
To quantitatively analyze the influence of the acidic solution on the elastic longitudinal wave velocity of the rock, the damage factor Dp of the rock’s elastic longitudinal wave velocity is defined, and the diorite specimen’s Dp after the flowing acidic saturation is calculated as follows [26,27]:
  D p = v sp v fp v sp × 100 %
In Equation (3): vsp and vfp are the initial and final elastic longitudinal wave velocities of the rock before and after saturation, respectively.
The average elastic longitudinal wave velocity and damage factor Dp of diorite specimens at various time nodes (every 10 days) after saturations with different pH values are shown in Table 4. After 40 d of cyclic scouring in NaCl solution with pH values of 6.56, 5, 3 and 1 (flow rate v = 300 mm·s−1), the vp was the highest, which were 4880, 4594, 4384 and 4213 m s−1, respectively. Among them, after saturation with pH = 1, the vp was the smallest. This indicates that the hydrogen ion concentration in the acidic solution has an impact on the internal structural integrity of diorite specimens. The higher hydrogen ion concentration causes greater corrosion on diorites [28]. Moreover, the damage factor of the longitudinal wave velocity also intuitively reflects that the lower the pH value is, the greater the impact on the rock’s vp is.
  • Analysis of variation with flow velocity
To study the time-dependent variation of the diorite’s vp under different flow rates scouring, the acoustic wave test instrument was used to test diorite specimens every 10 days; the results are shown in Figure 4. When the solution flow rate v = 0 mm·s−1, the specimens’ vp fluctuated slightly and the overall trend was slowly decreasing (see Figure 4a). Figure 4b–d show that at the initial scouring period (first 10 d) with flow rates of v = 300, 600 and 900 mm·s−1, the diorite specimens’ vp decreased significantly with a fluctuation change subsequently. The amplitude of fluctuation decreases with time, while the period of fluctuation increases with time. For instance, after scouring for 60 d with a flow rate v = 900 mm·s−1, the elastic wave velocity decreased from 3891, 3998, 4225 and 4533 m·s−1 to 3308, 3450, 3557 and 3686 m·s−1, respectively, with a decrease of 14.97, 13.71, 15.82 and 18.68%. After scouring for 40 d, the vp of each sample gradually stabilized.
The change in diorite specimens’ vp with time under the hydrochemical action of the flow condition is relatively complex [29,30,31,32]. The following analysis was made by combining the previous research results:
(1) At the initial stage of the flowing acid solution saturation, the active oxides of the intact diorite specimens reacted with the H+ in the solution. It caused the rapid dissolution of the diorite, resulting in increased porosity and decreased wave velocity. Subsequently, as the solution’s pH value gradually tends to neutral, the chemical reaction effect gradually decreased. The water-absorbing effect and precipitation of the products increased the rock’s saturation, the homogeneity gradually improved and the vp showed a trend of slow growth to stability. However, the experimental specimens are heterogeneous materials with some implied tiny cracks, which gradually increase in the process of washing and erosion by the flowing solution. It leads to the generation, development and expansion of new cracks. Furthermore, both the selective variability of the chemical corrosion effects of the rock minerals and the scaled microdistribution effects of the vp changes caused by different saturation levels may lead to fluctuating trends in the vp.
(2) Under flowing conditions, aqueous solutions enter the rock to gradually saturate the micropore space. Moreover, a small amount of CaO and MgO reacts with water to form Ca(OH)2 and Mg(OH)2, and the products filled in the primary cracks and defects of the diorite, which has a certain repairing effect on the primary cracks and defects. Eventually, the vp gradually increases slowly, resulting in a fluctuation phenomenon.
(3) Compared with the static water environment, the migration and scour characteristics of a moving water environment increase the contact area between the specimens and the aqueous solution, so that the mineral components are fully exposed to the acidic environment, which increases the water absorption of the rocks and the randomness and uncertainty of the water–rock chemical reaction. The variation trend of the vp is more obvious than that of a static water environment.
(4) When t = 60 d, the saturation of the specimens by drying treatment decreased, and the vp measured at this time was all lower than at t = 50 d under a water-saturated state. Here, the elastic longitudinal wave velocity damage factor Dp is also used to analyze the vp change in the diorite specimens after the action with the flow chemical solution. The calculated results are shown in Table 5.
In Table 5, although the rock saturation increases after the water–rock interaction, the reaction of the acidic solution H+ ions with diorite active minerals causes rock particles to activate and dissolve, which migrate in combination with the solution scouring. Thus, the crack structure is generated, which increases the porosity and heterogeneity of the specimen, degrades the physical properties of the specimen and finally reduces the vp.

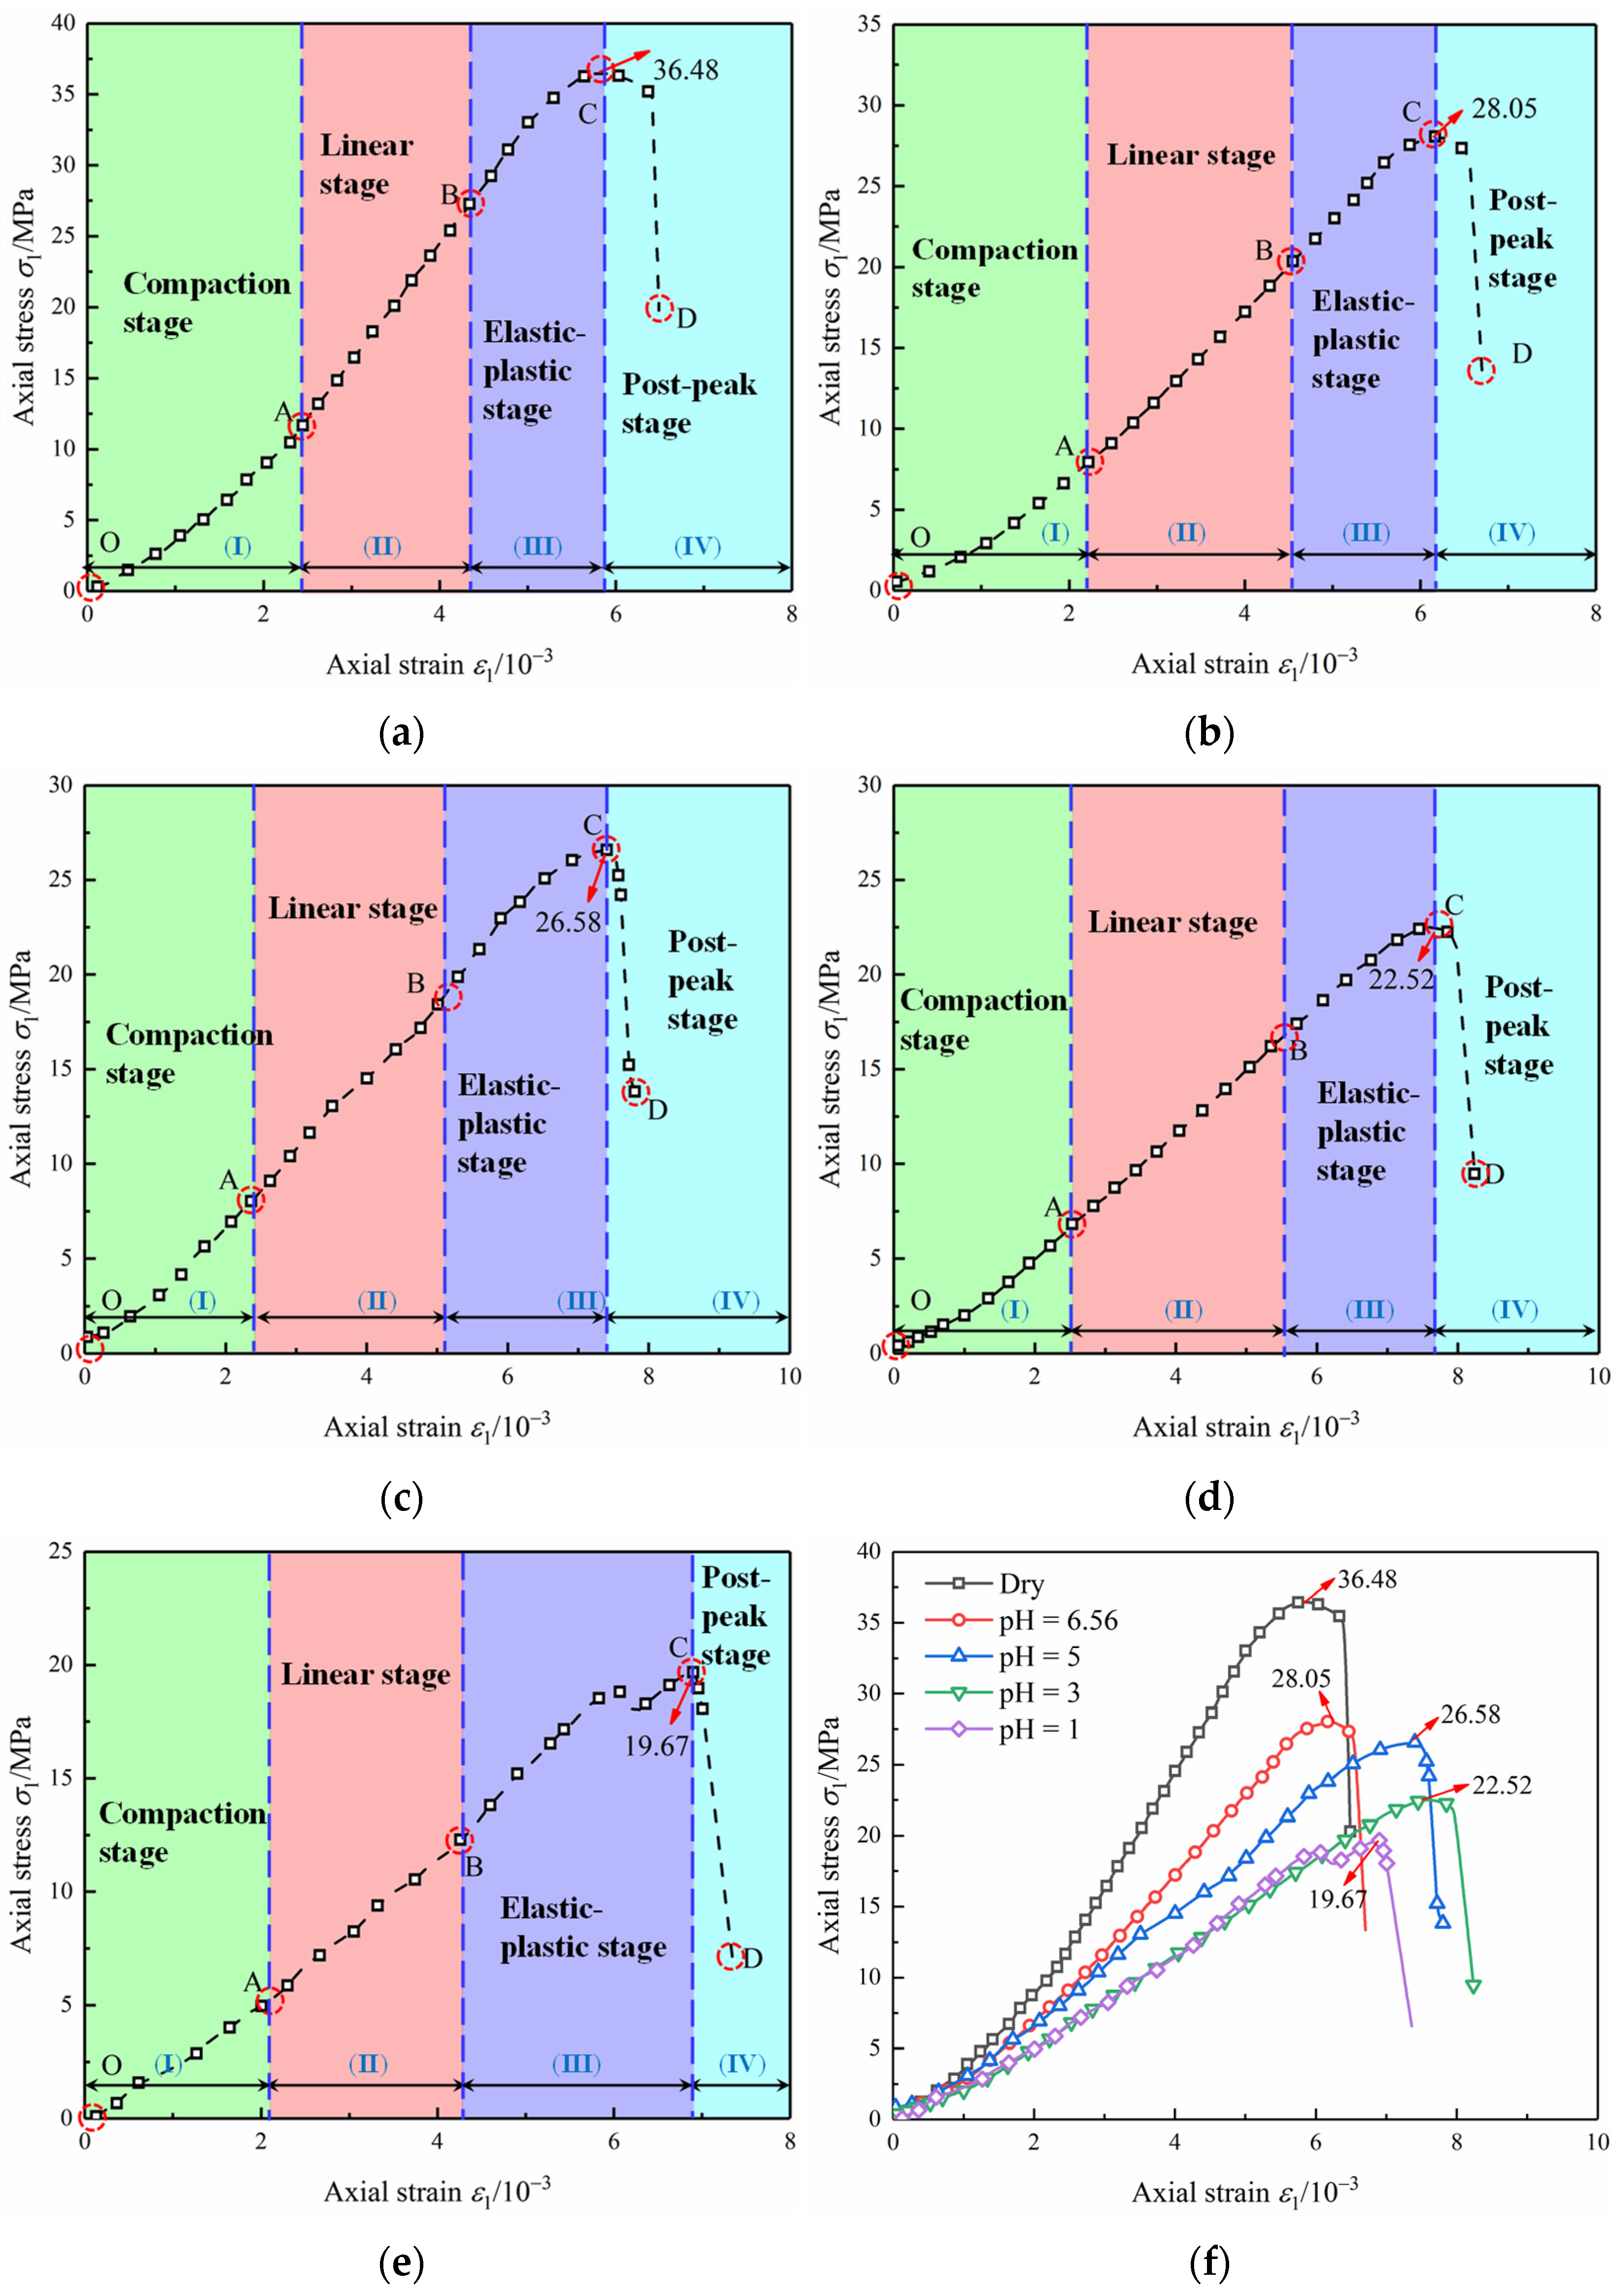
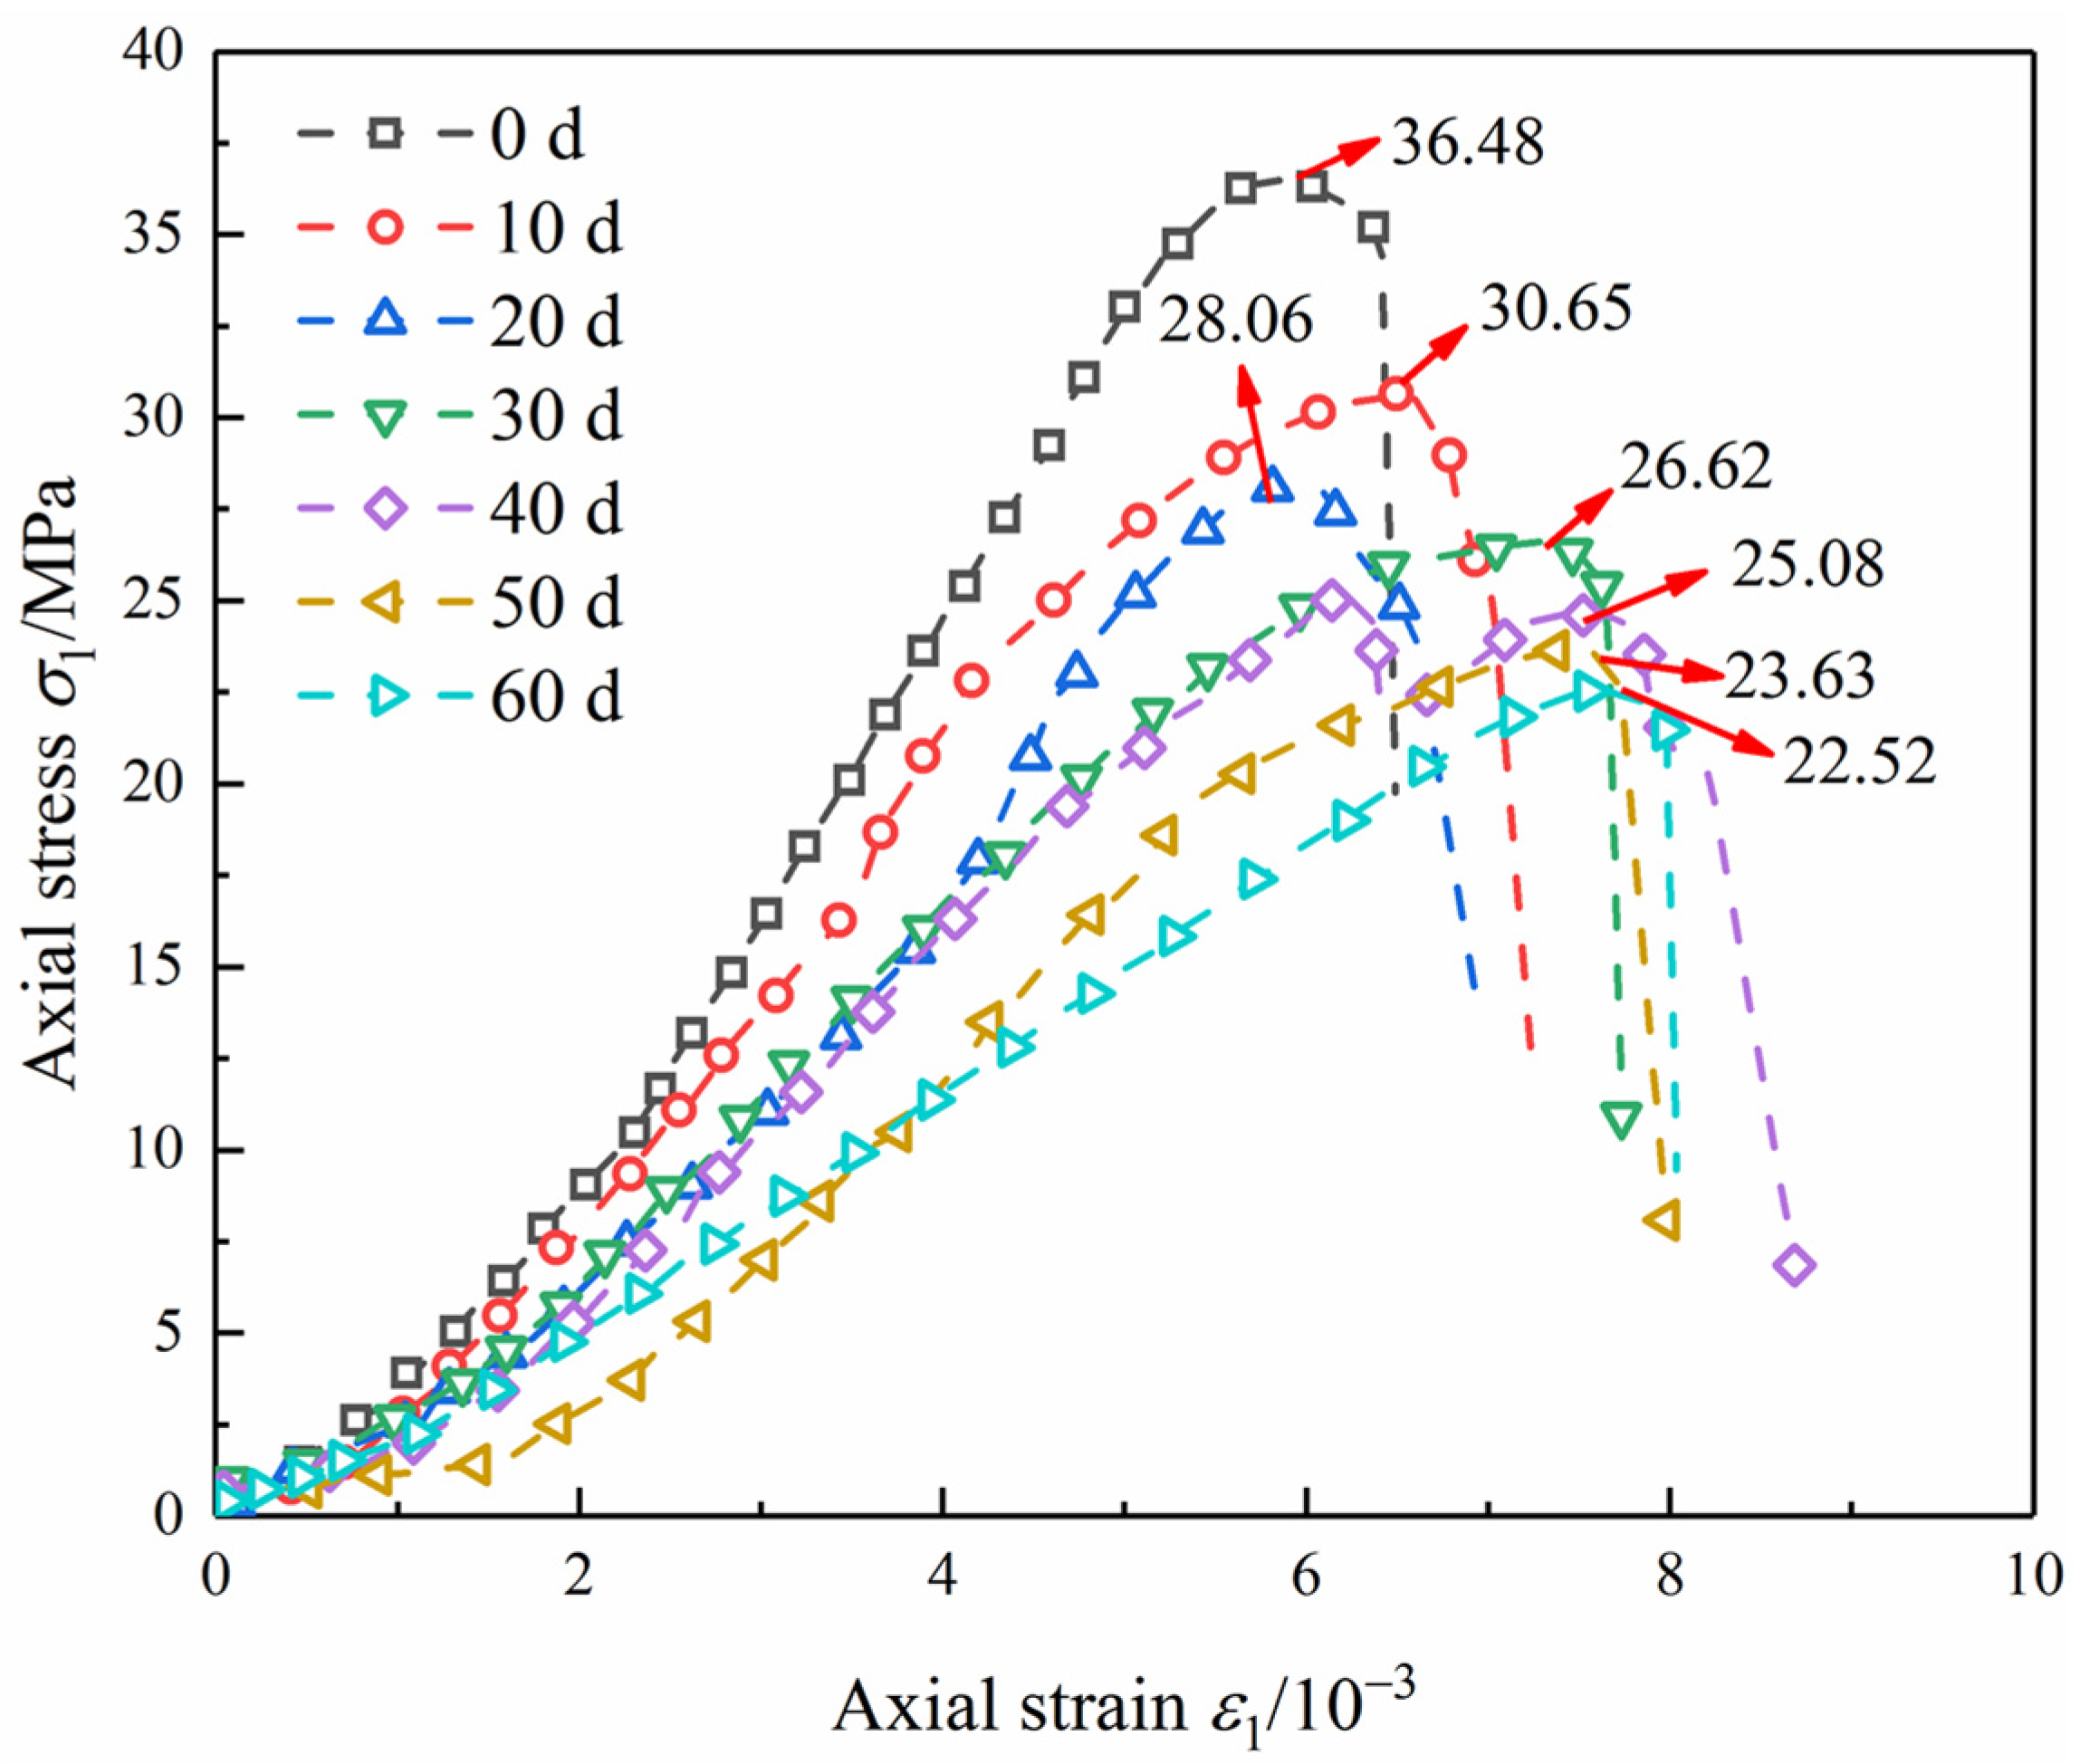
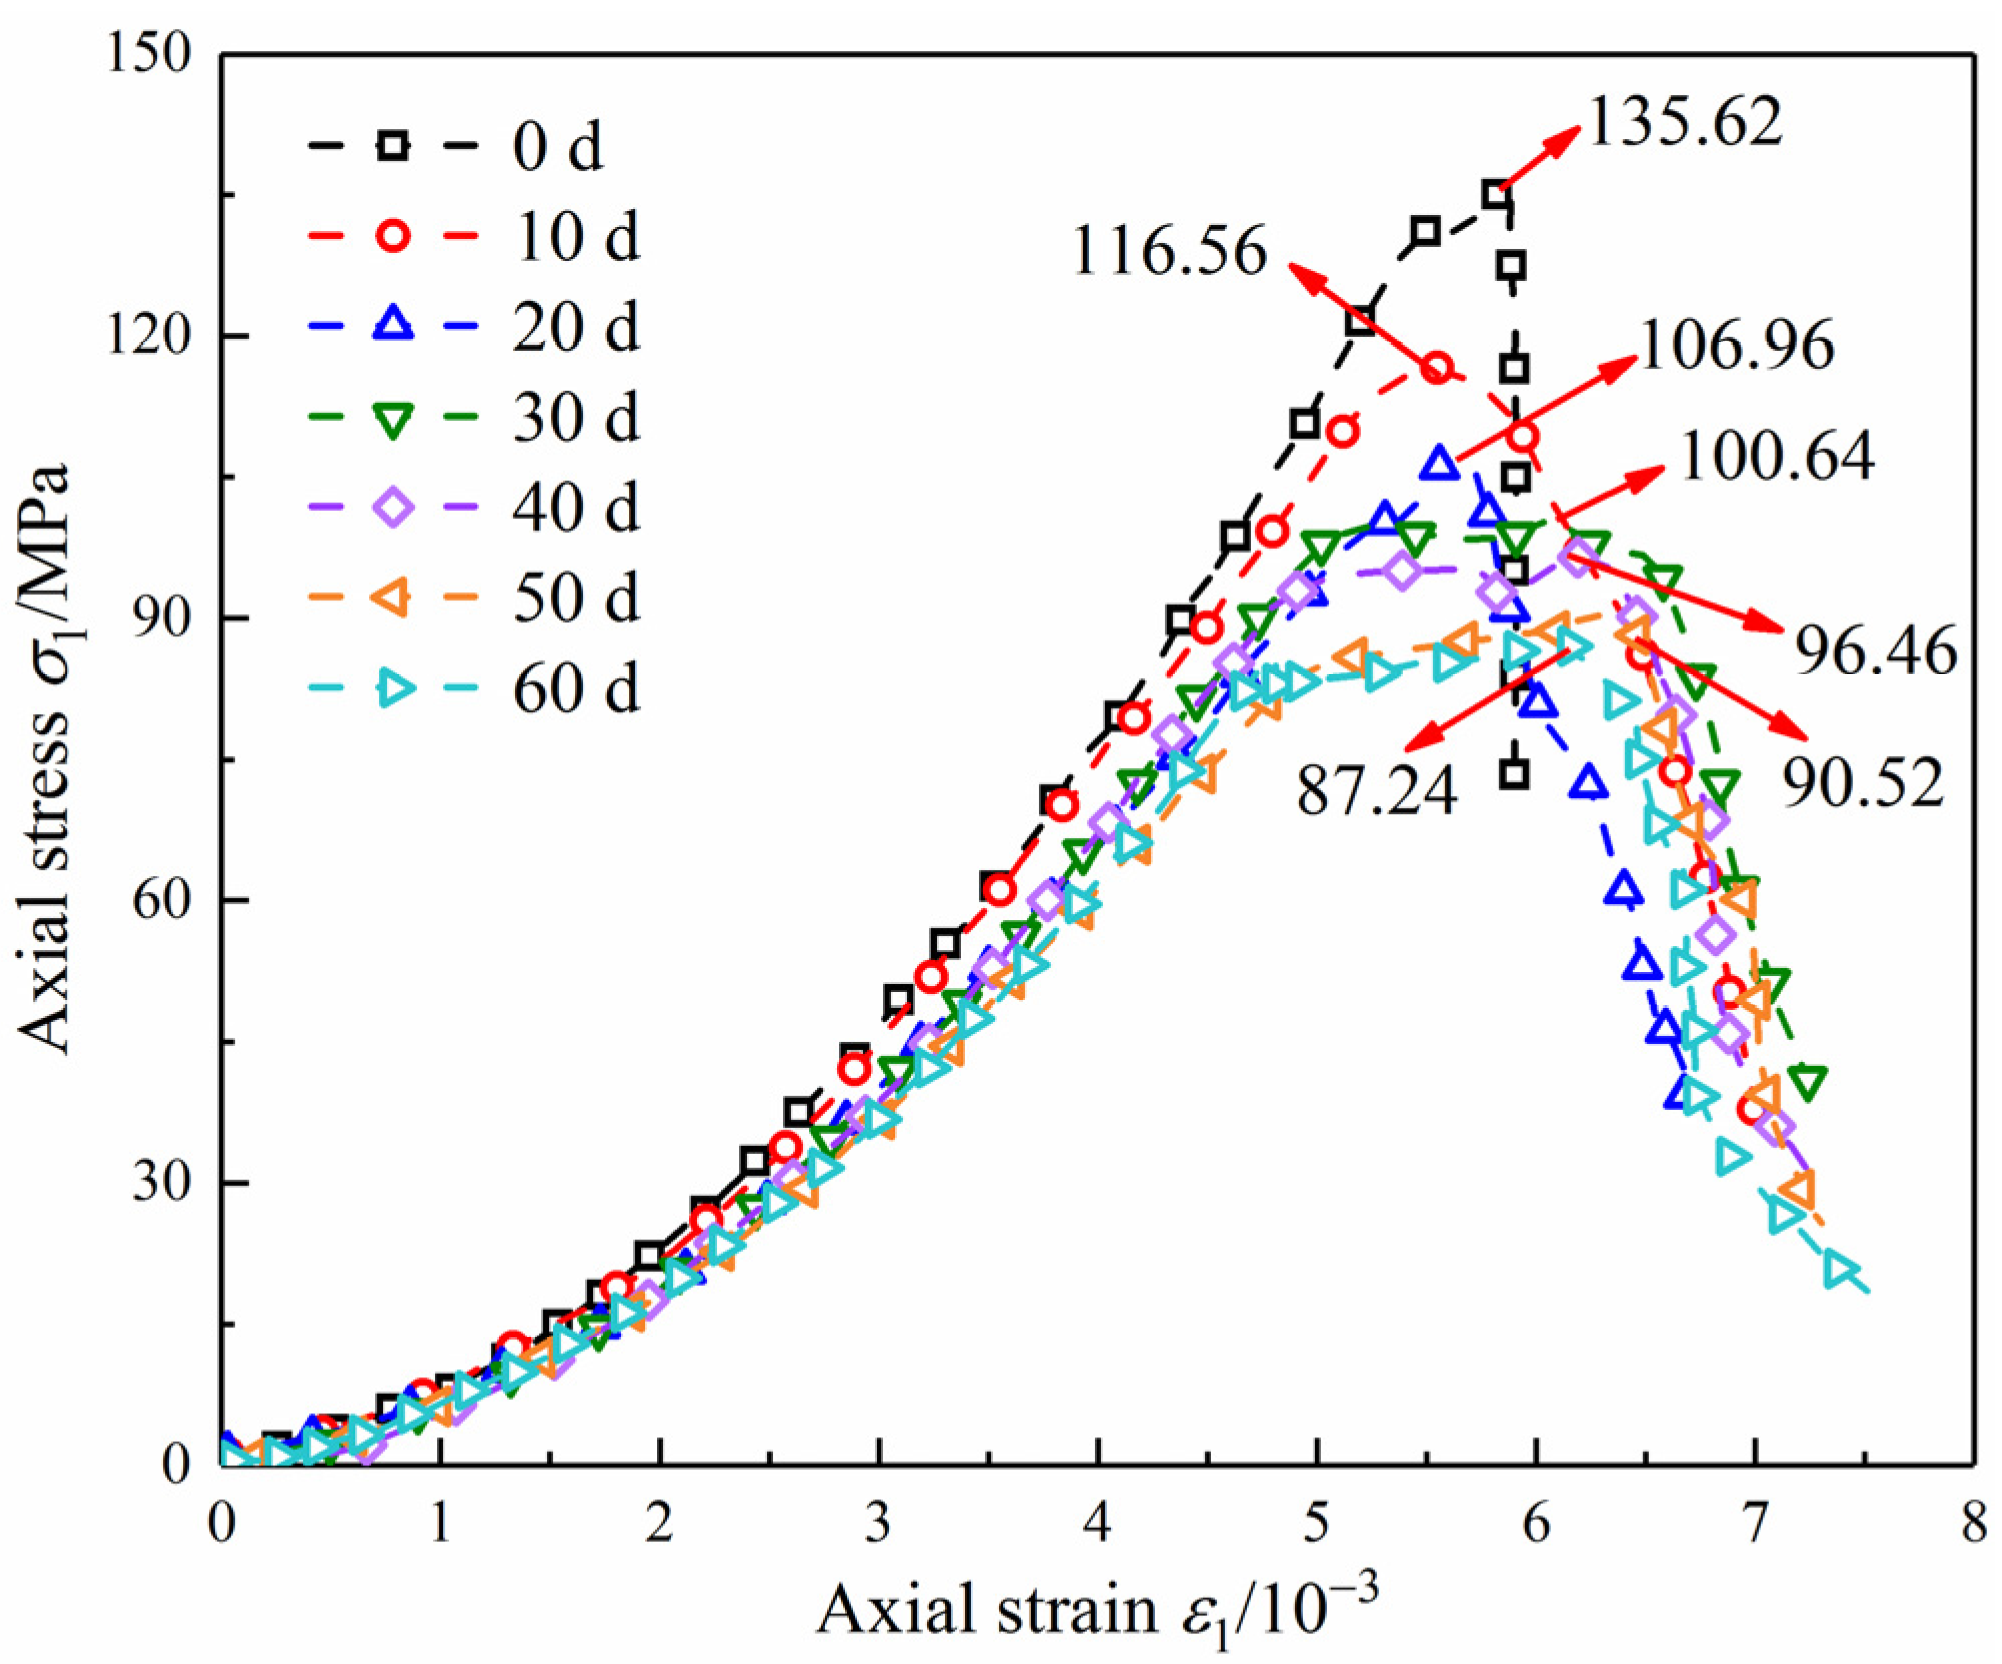
3.2. Analysis of Uniaxial Compression Stress–Strain Curve

3.2.1. Strength and Deformation Characteristics

  • Effect of pH value on strength and deformation of diorite
After the samples were placed in different acidic conditions for 60 d and dried, the stress–strain curves of the samples with a median peak strength in each group were selected, as shown in Figure 5. The uniaxial compressive strength was 36.48 MPa in the dry condition and 19.67 MPa in the pH = 1 condition, which decreased by 46.08%. The compressive strength decreased with the increase in environmental acidity.
Observing Figure 5, it can be seen that during the whole loading and failure process of the diorite specimens, there were four stages: (I) the crack closure and compaction stage, (II) elastic deformation to crack stable expansion stage, (III) crack unstable expansion stage and (IV) post-peak expansion stage [33,34]. Due to the different environmental acidity of the samples, their characteristics were also different: (I) In the initial crack compaction stage, the concave degree of the curve reduces with the decrease in the pH value, and the number of new cracks produced in this stage is also reduced when the load is just loaded. (II) From the elastic deformation to the crack stable expansion stage, the curve’s slope gradually decreases with the increase in acidity, indicating that the elastic modulus also gradually reduces. (III) In the crack unstable expansion stage, compared with the dry samples, the peak stress of the samples after the acid solution treatment decreased significantly, and the stress platform appeared around the peak of this stage, but the duration was short. This is due to the gradual deformation and expansion around the initial fracture [35,36]. (IV) In the post-cracking stage, the dried samples’ stress dropped rapidly and vertically after the peak, showing obvious strong brittleness and low plasticity, indicating that the dried samples are dense. In contrast, the internal structure of the acidified samples is loose due to the water–rock interaction, and the lack of intergranular cement leads to the plasticity becoming significantly enhanced.
Taking pH = 3 as an example, Figure 6 reflects the uniaxial compression stress–strain curve after the specimen was extracted and dried at a time point of 10 d. The increase in the acidification time resulted in the peak stress decreasing significantly from 36.48 MPa (0 d) to 22.52 MPa (60 d), with a decrease of 38.27%. Here, the degradation degree of the uniaxial compressive strength Q(t) [28,37] is defined to quantitatively analyze the time-dependent characteristics of each solution pH on the specimen uniaxial compressive strength deterioration. The expression of Q(t) is given by:
  Q ( t ) = σ d 0 σ d ( t ) σ d 0 × 100 %
In Equation (4): σd0 is the uniaxial compressive strength of diorite under the dried condition, and σd(t) is the uniaxial compressive strength of diorite after t days of acidification.
The variation characteristics of the uniaxial compressive strength deterioration in the rock samples with time for the four acidic conditions are shown in Figure 7. It can be seen that at the same time point, the lower the pH value, the greater the uniaxial compressive strength deterioration of the rock samples. At the same pH value, the degradation degree of the compressive strength gradually increases with time. Meanwhile, the growth rate of the degradation gradually slows down, and the degradation will stabilize after reaching a certain time, which is 25 and 30 d for the rock samples in the pH = 5 and pH = 6.56 conditions, respectively. In the acidic condition of pH = 1 and 3, the rock samples’ degradation gradually slowed down within 60 d, but there is still an upward trend. Therefore, they will converge to 0 at some time point greater than 60 d.
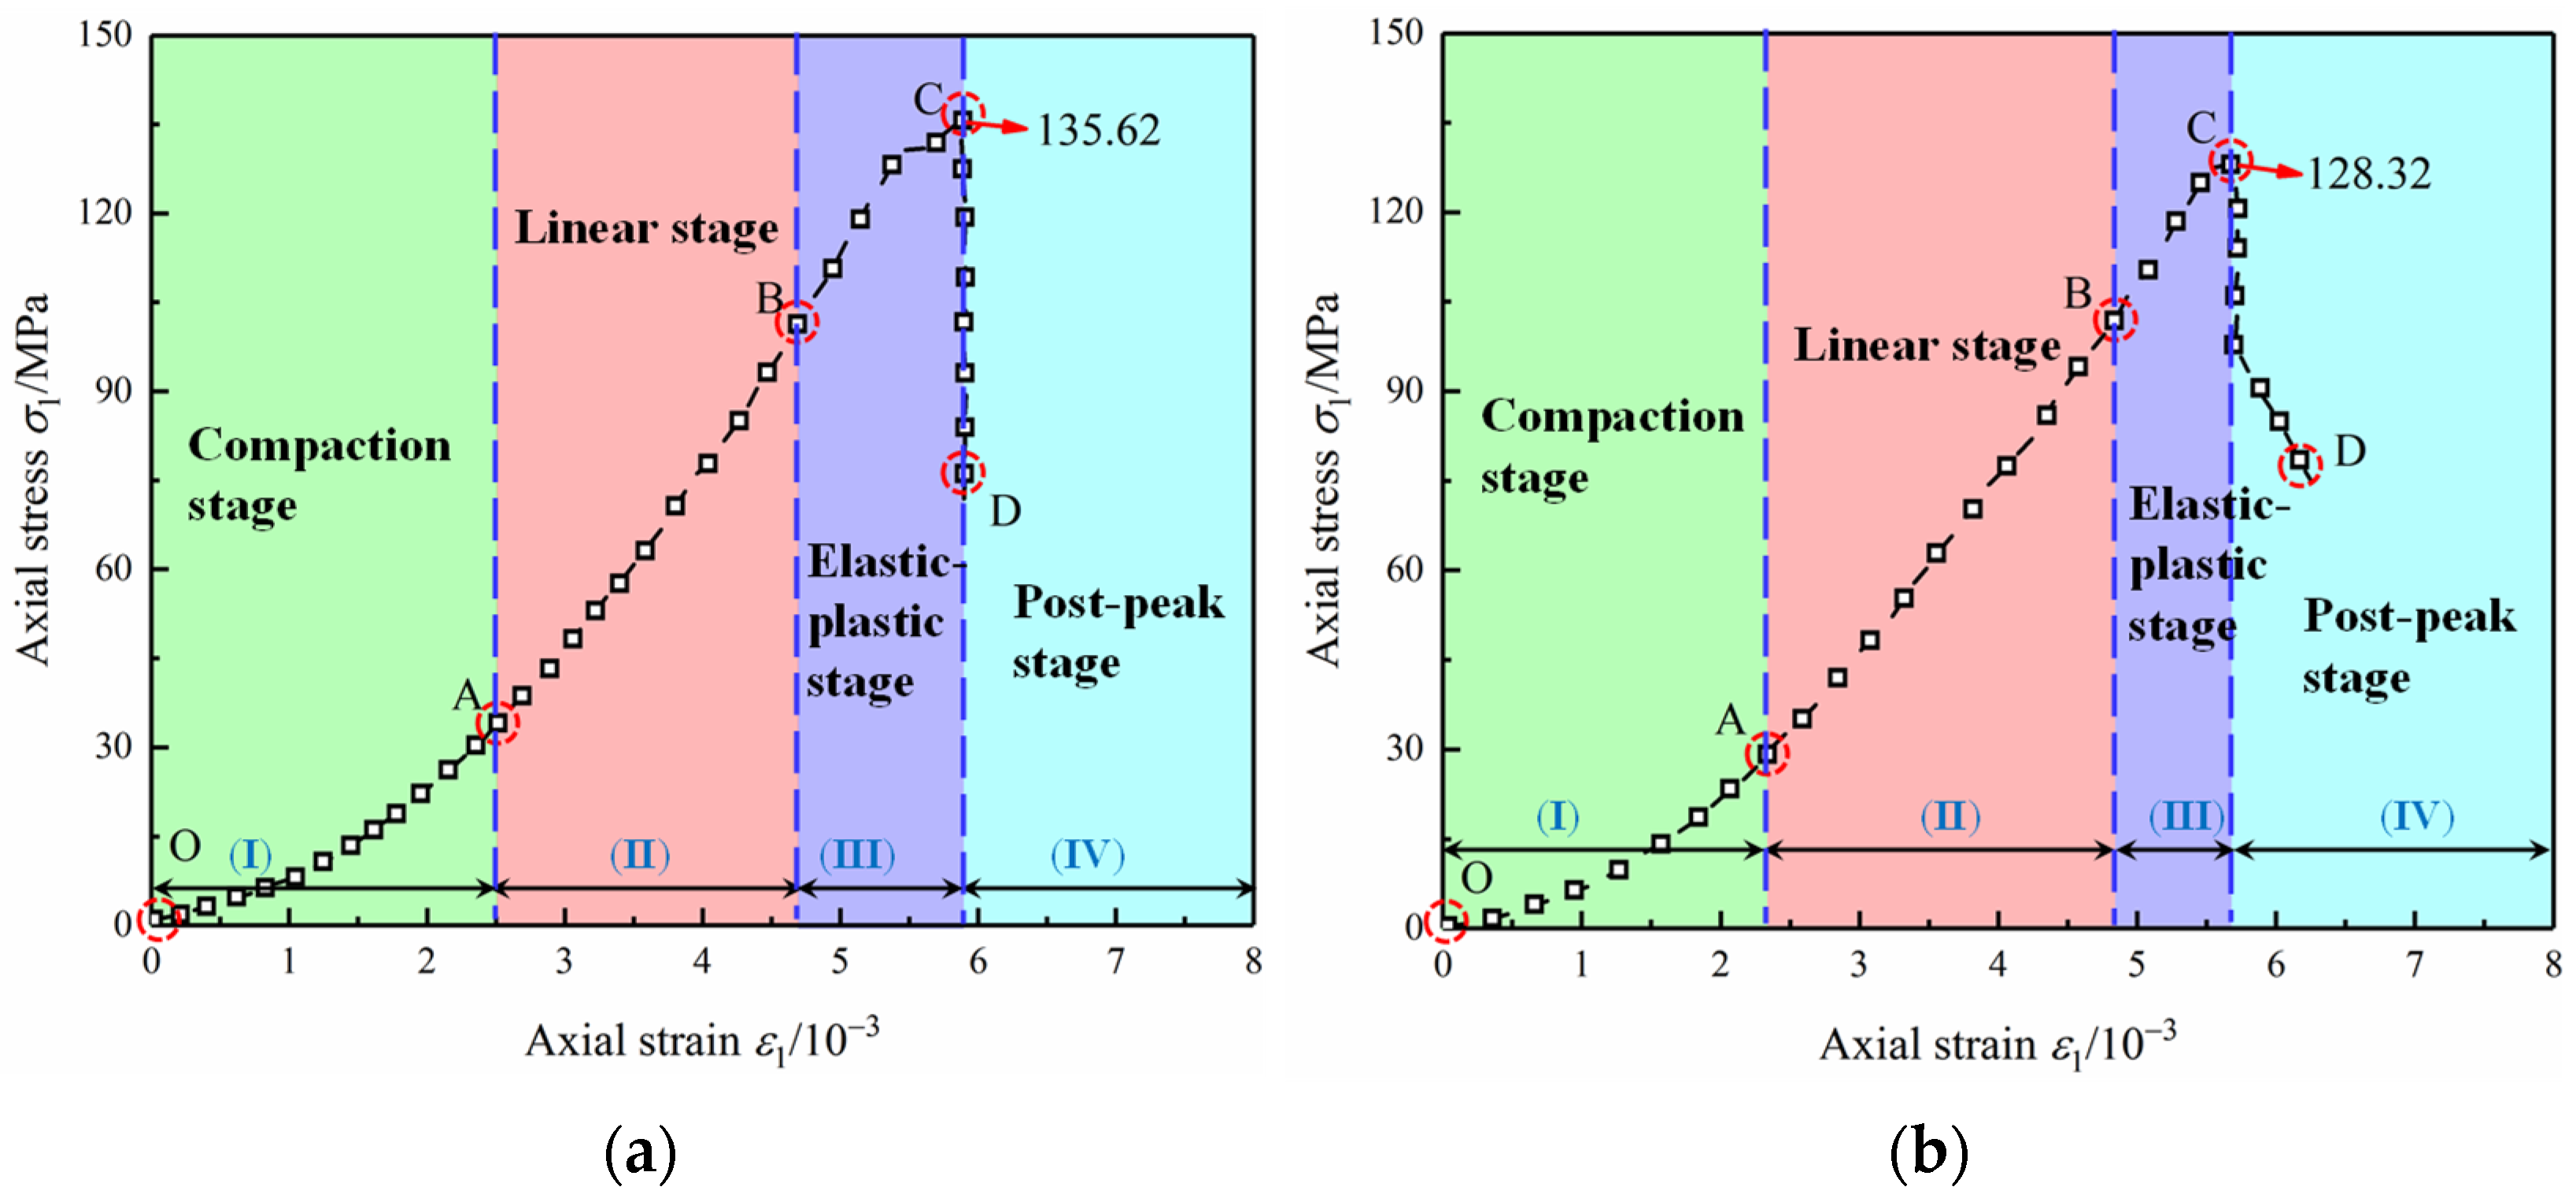
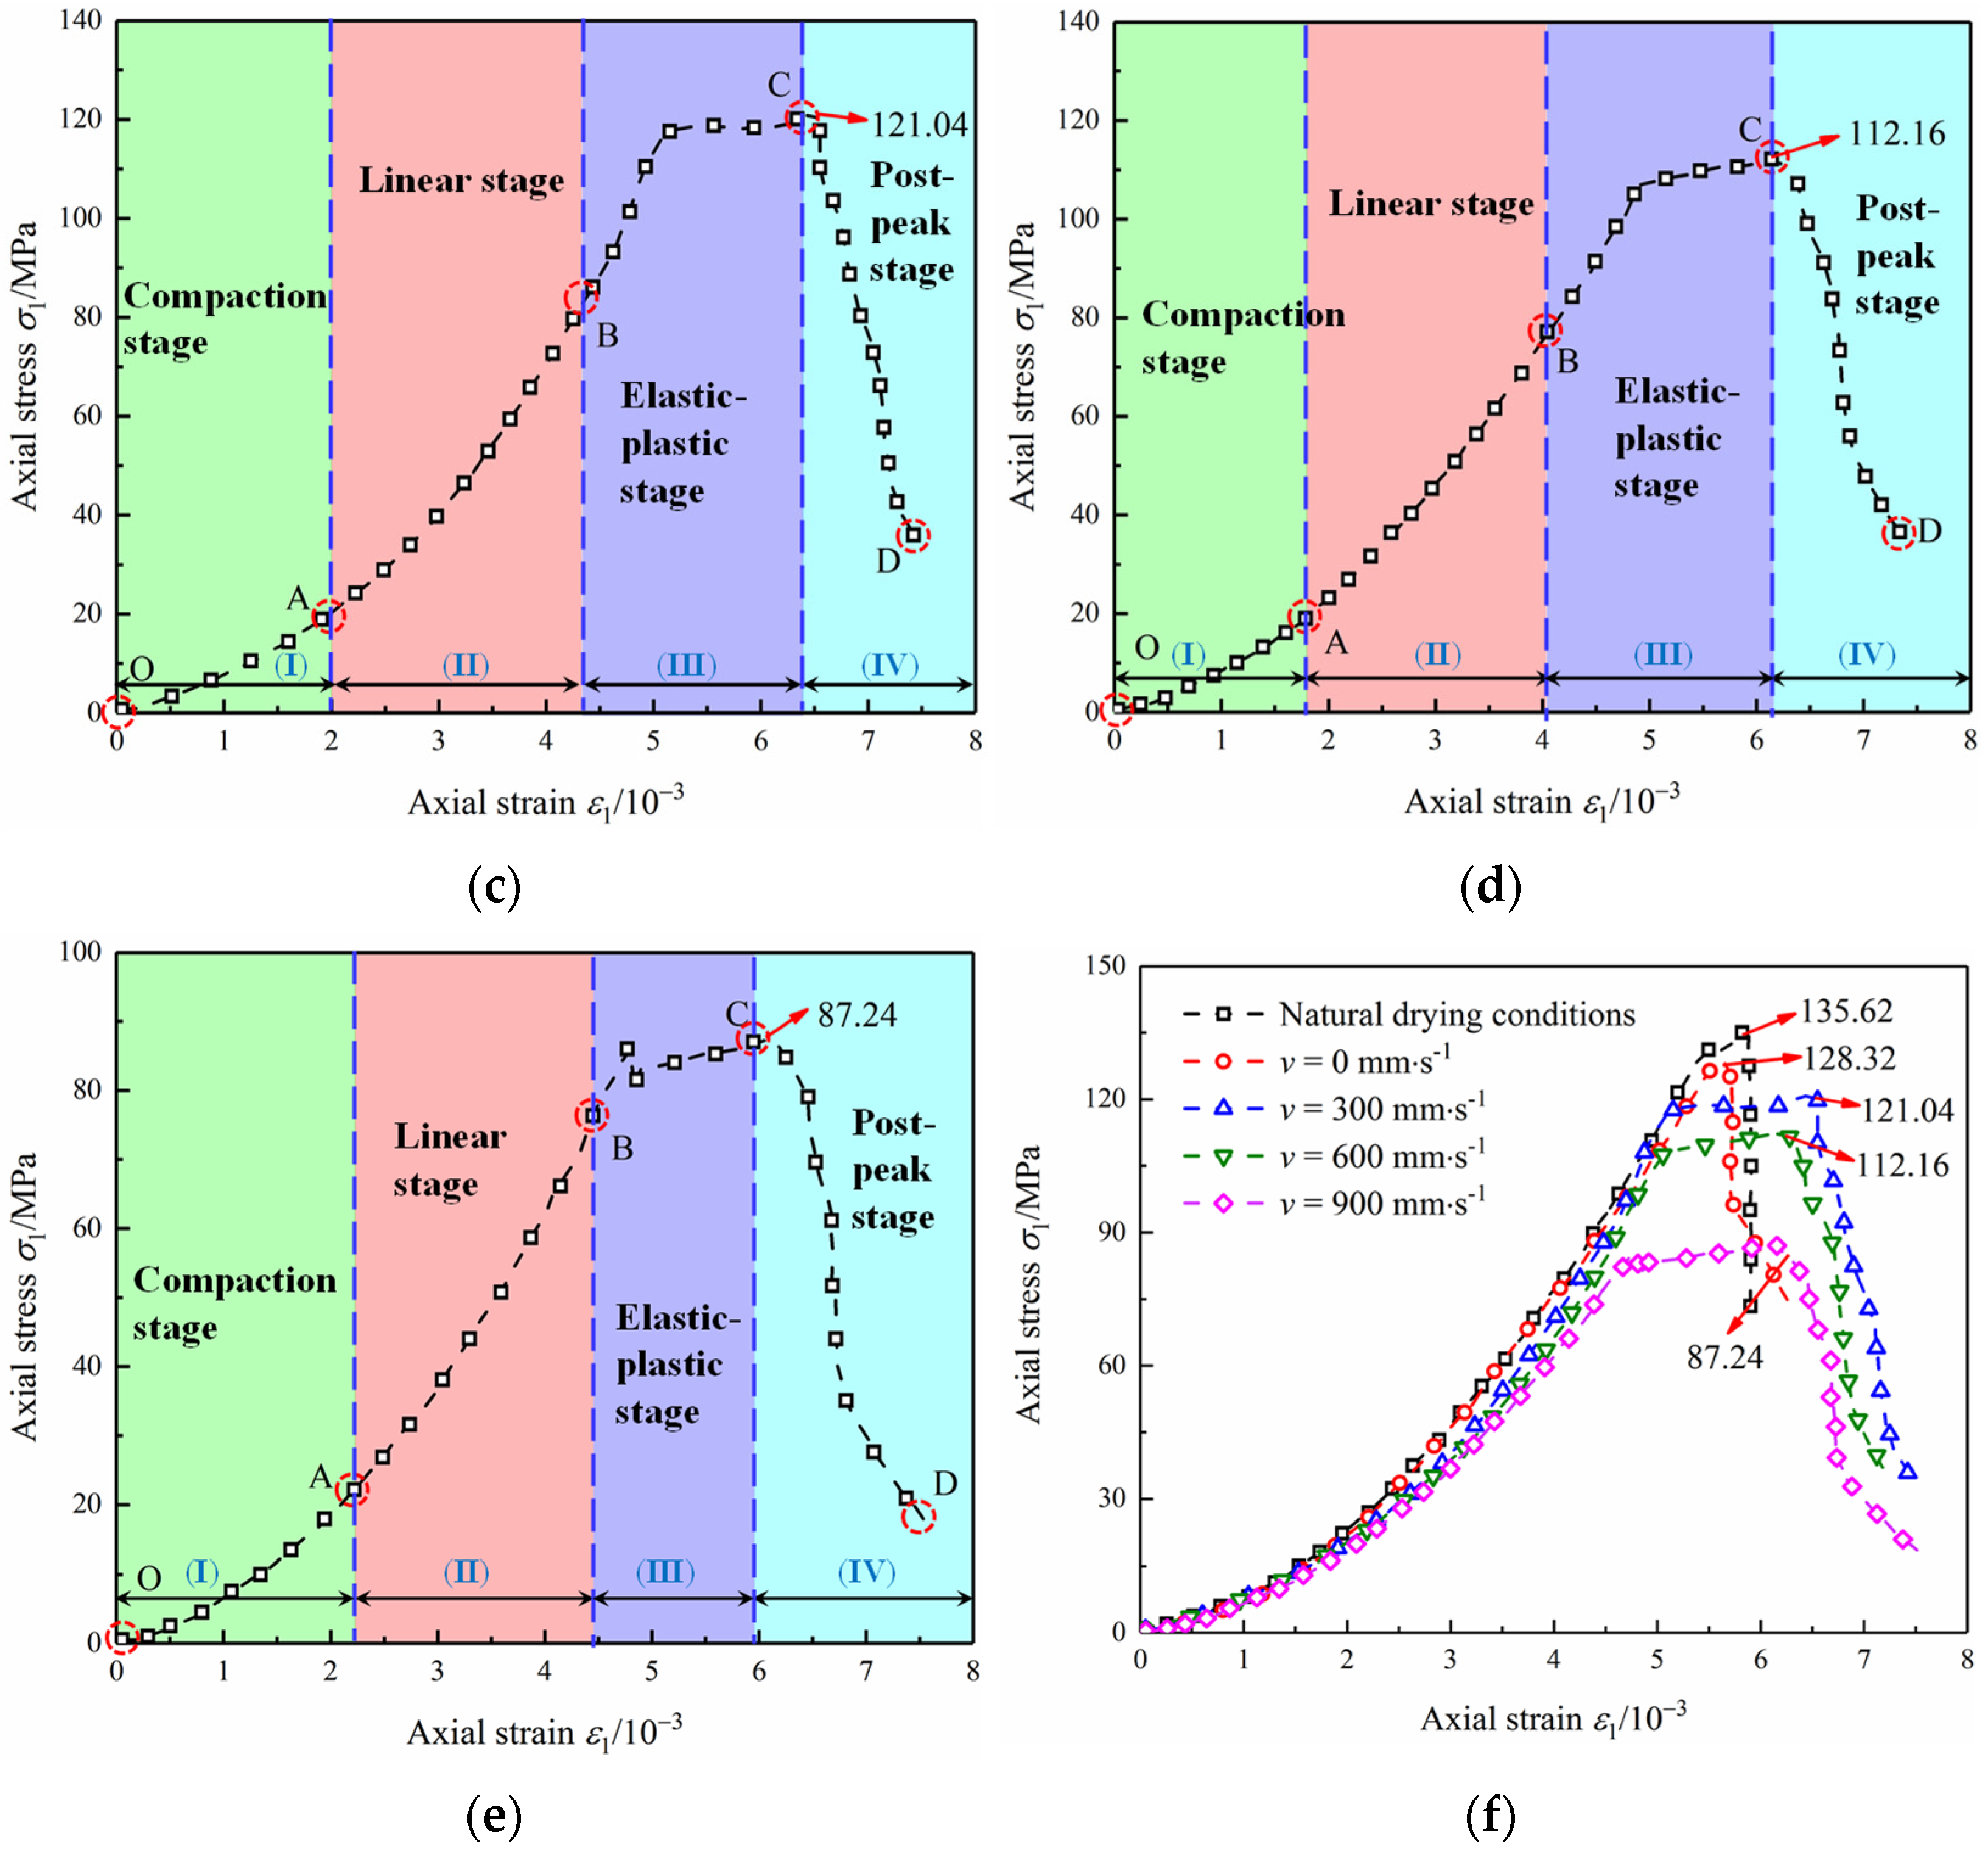
  • Effect of flow velocity on strength and deformation of diorite
Figure 8 shows the uniaxial compression stress–strain curves of the rock samples under different flow velocity conditions. Overall, the uniaxial compressive strength of the rock samples basically showed a trend of decreasing with the increase in the solution flow rate, while the deterioration process and degree were somewhat different by different flow rates. Compared with the dry condition, the uniaxial compressive strength of the specimens decreased to 128.32, 121.04, 112.16 and 87.24 MPa after 60 d of flushing at different flow rates (from low to high), which reduced by 5.38, 10.75, 17.30 and 35.67%, respectively. It can be seen that the degradation effect of low velocity (v = 0, 300, 600 mm·s−1) scouring is inconspicuous, while high velocity (v = 900 mm·s−1) scouring has a sharp strength attenuation. In other words, the strength damage of the diorite increases with the increase in the solution velocity, and the damage rate increases gradually with the increase in the solution velocity. It is especially emphasized that there is a certain dispersion in the test data, which is due to the rocks being natural geological materials and the specimens themselves have a certain heterogeneity [38,39].
According to the uniaxial compressive strength test results of the diorite, the uniaxial compressive deformation characteristics of the specimens in different states are obtained as follows:
(I)
Initial fracture compacting stage (OA stage): After solution scouring, some specimens show an obvious depression type in this section, especially in the initial stage of the specimen entering the solution environment. It indicates that the erosion and dissolution of the diorite by a solution increase or lengthen its pores and lengthen the initial fracture compaction stage.
(II)
Elastic deformation to crack stable expansion stage (AB stage): After different flow rates scouring, the curve slope of the diorite samples at this stage has been reduced in varying degrees. It indicates that the elastic modulus of the diorite decreases after being scoured by the solution, and the elastic modulus of the diorite decreases most obviously after being scoured by v = 900 mm·s−1.
(III)
Unstable rupture development stage (BC stage): Scouring with different flow rates, when the stress reaches a certain value, part of the stress–strain curve for diorite rock samples starts to bend downward. The rock samples after scouring with 300, 600 and 900 mm·s−1 flow rates have an obvious yield platform, and plastic deformation increases, which means that the plasticity of the diorite is enhanced by flow scouring and the peak strength decreases significantly compared with the natural drying state.
(IV)
Post rupture stage (CD stage): After scouring by flow rates, specimens still have a relatively large deformation after the peak point, illustrating that the solution scouring increases the ductility of diorite to some extent.
Figure 9 and Figure 10 show the variation curves for the uniaxial compressive strength of the rock samples with time under four flow velocities. It is observed that the intensity gradually degrades with the scouring time; however, the reduction rate slowly declines (see Figure 9). With the same action time, the faster the flow rate, the greater the degradation degree of the compressive strength, and the degradation degree of the compressive strength tends to increase with the prolongation of the scouring time. The growth of the rock sample’s deterioration is relatively gentle in a low-speed state, and the increase is more obvious in a high-speed state (see Figure 10). Compared with the test results on the compressive strength deterioration of the diorite specimens after acid solution action, the strength deterioration of the specimens under flow rate scouring increased slowly at a smooth and uniform rate overall, and eventually tended to 0 with time [40].

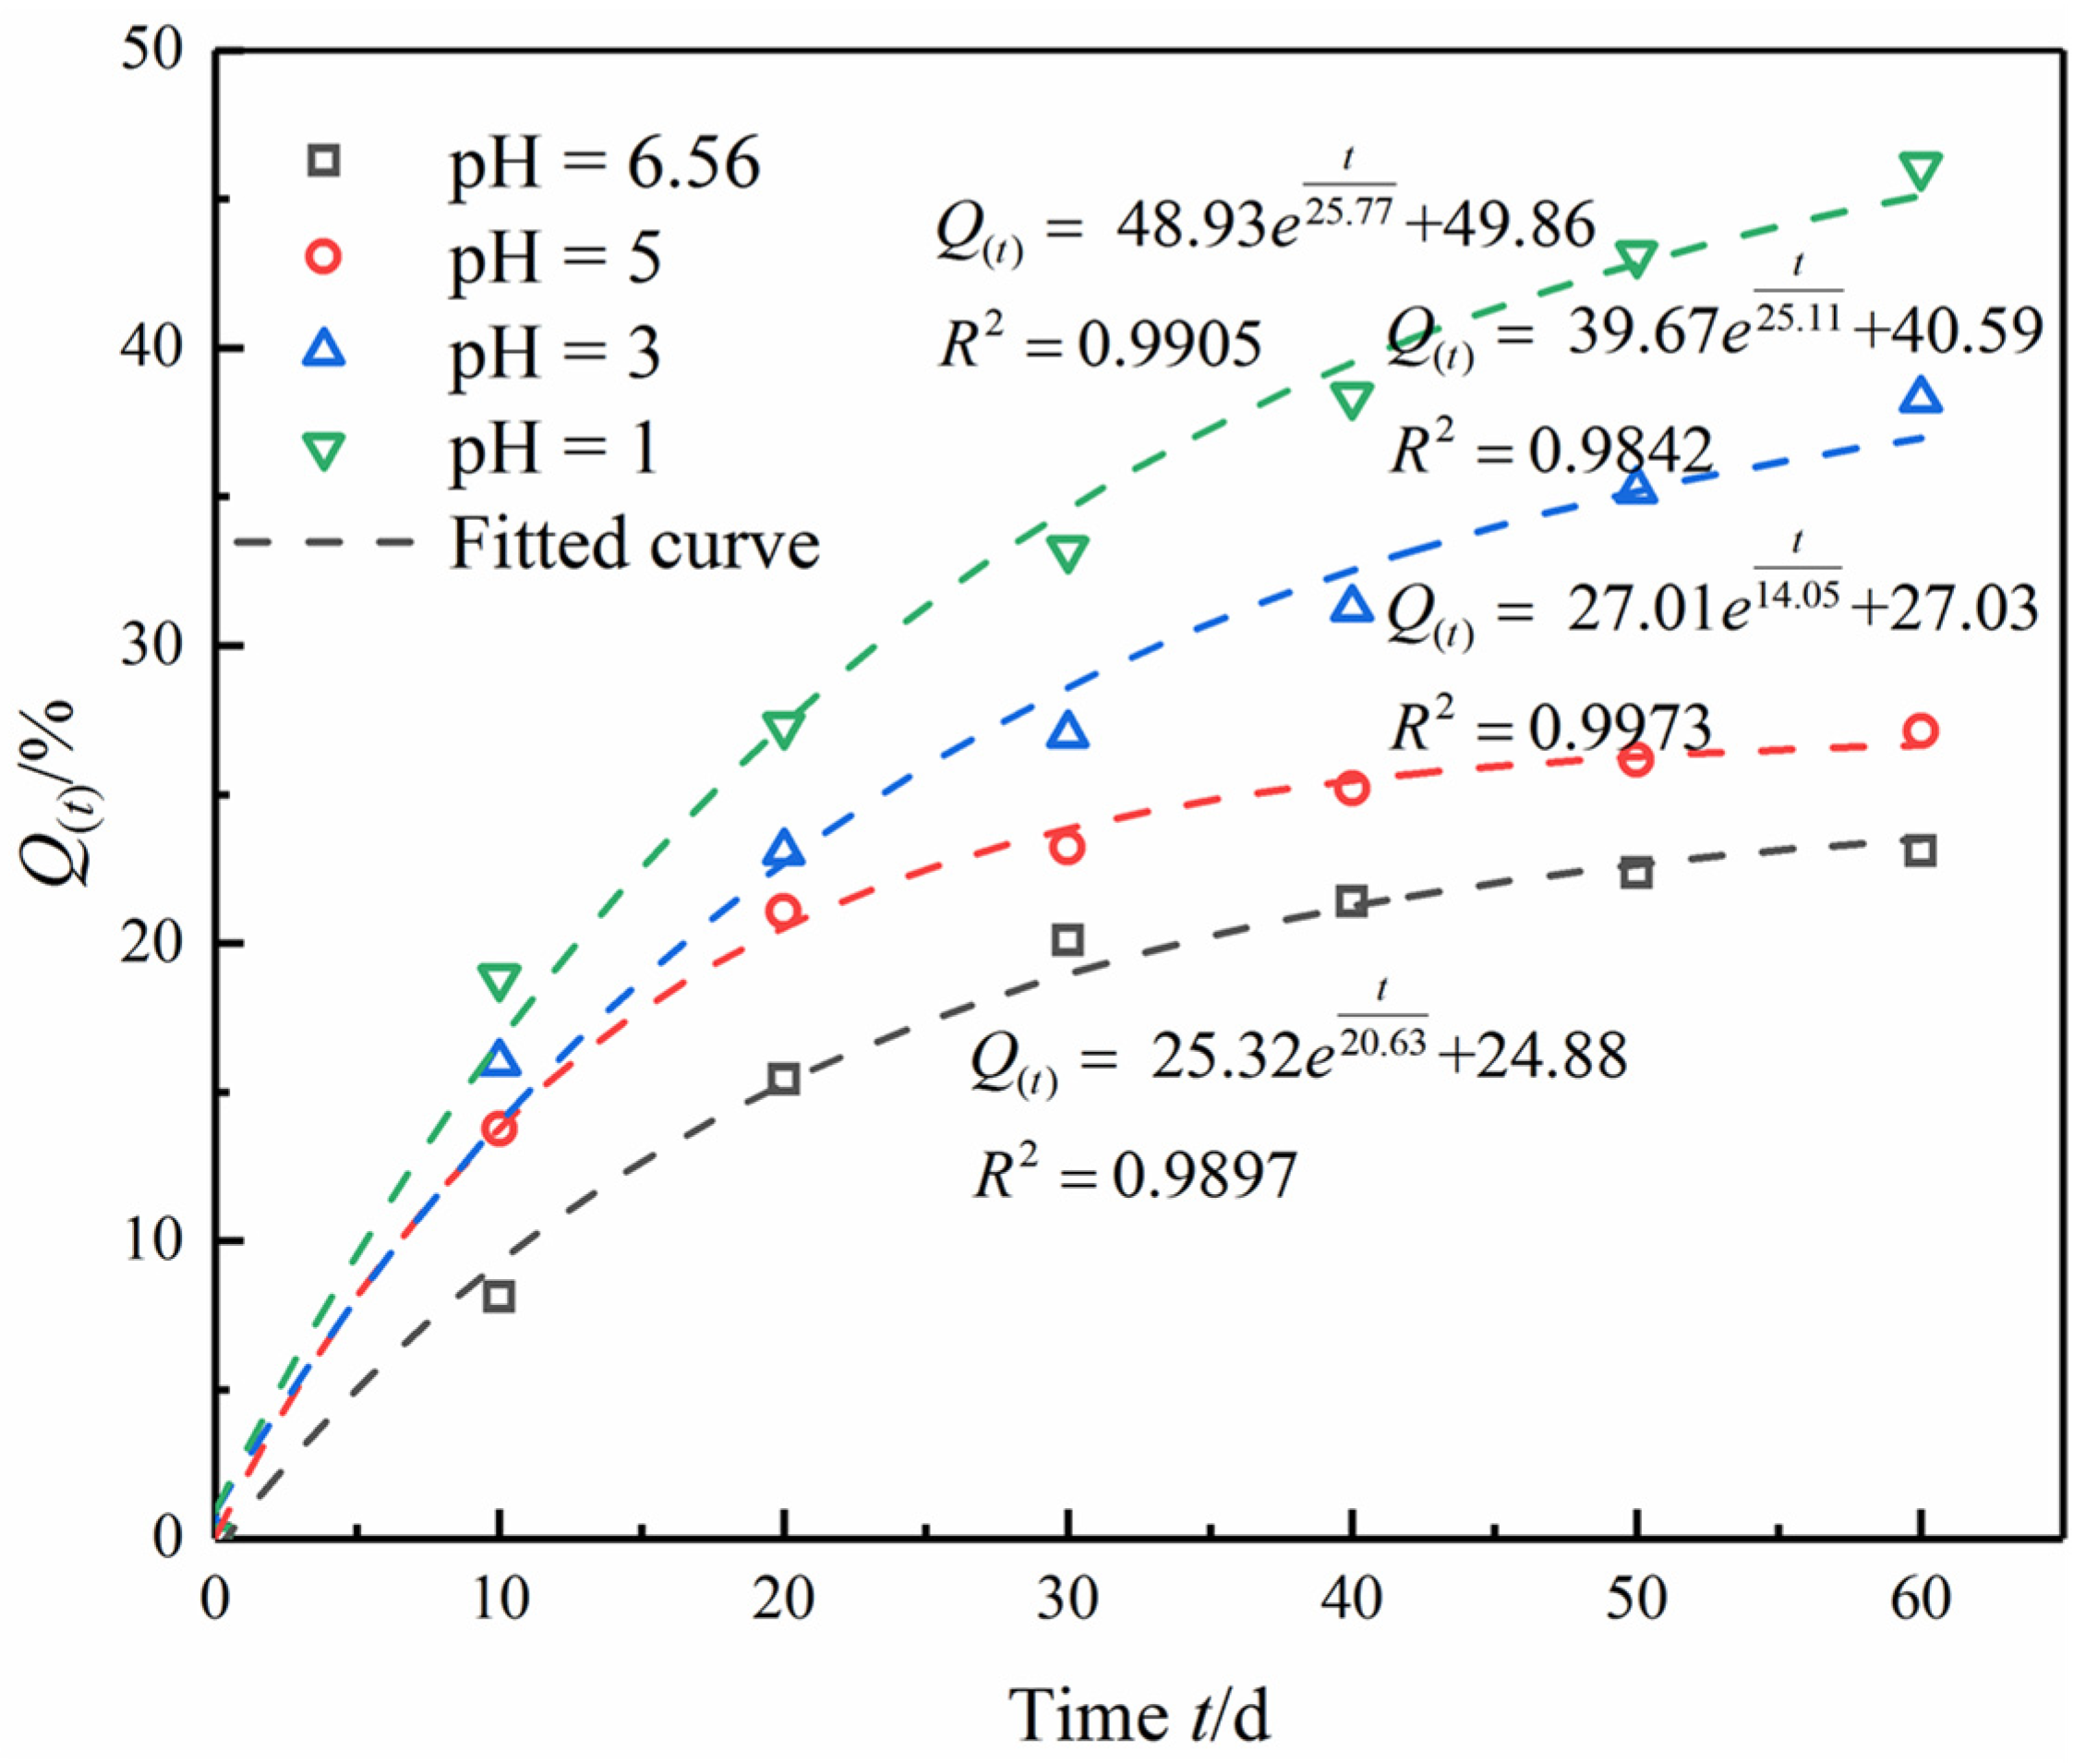
3.2.2. Deterioration Characteristics of Mechanical Parameters

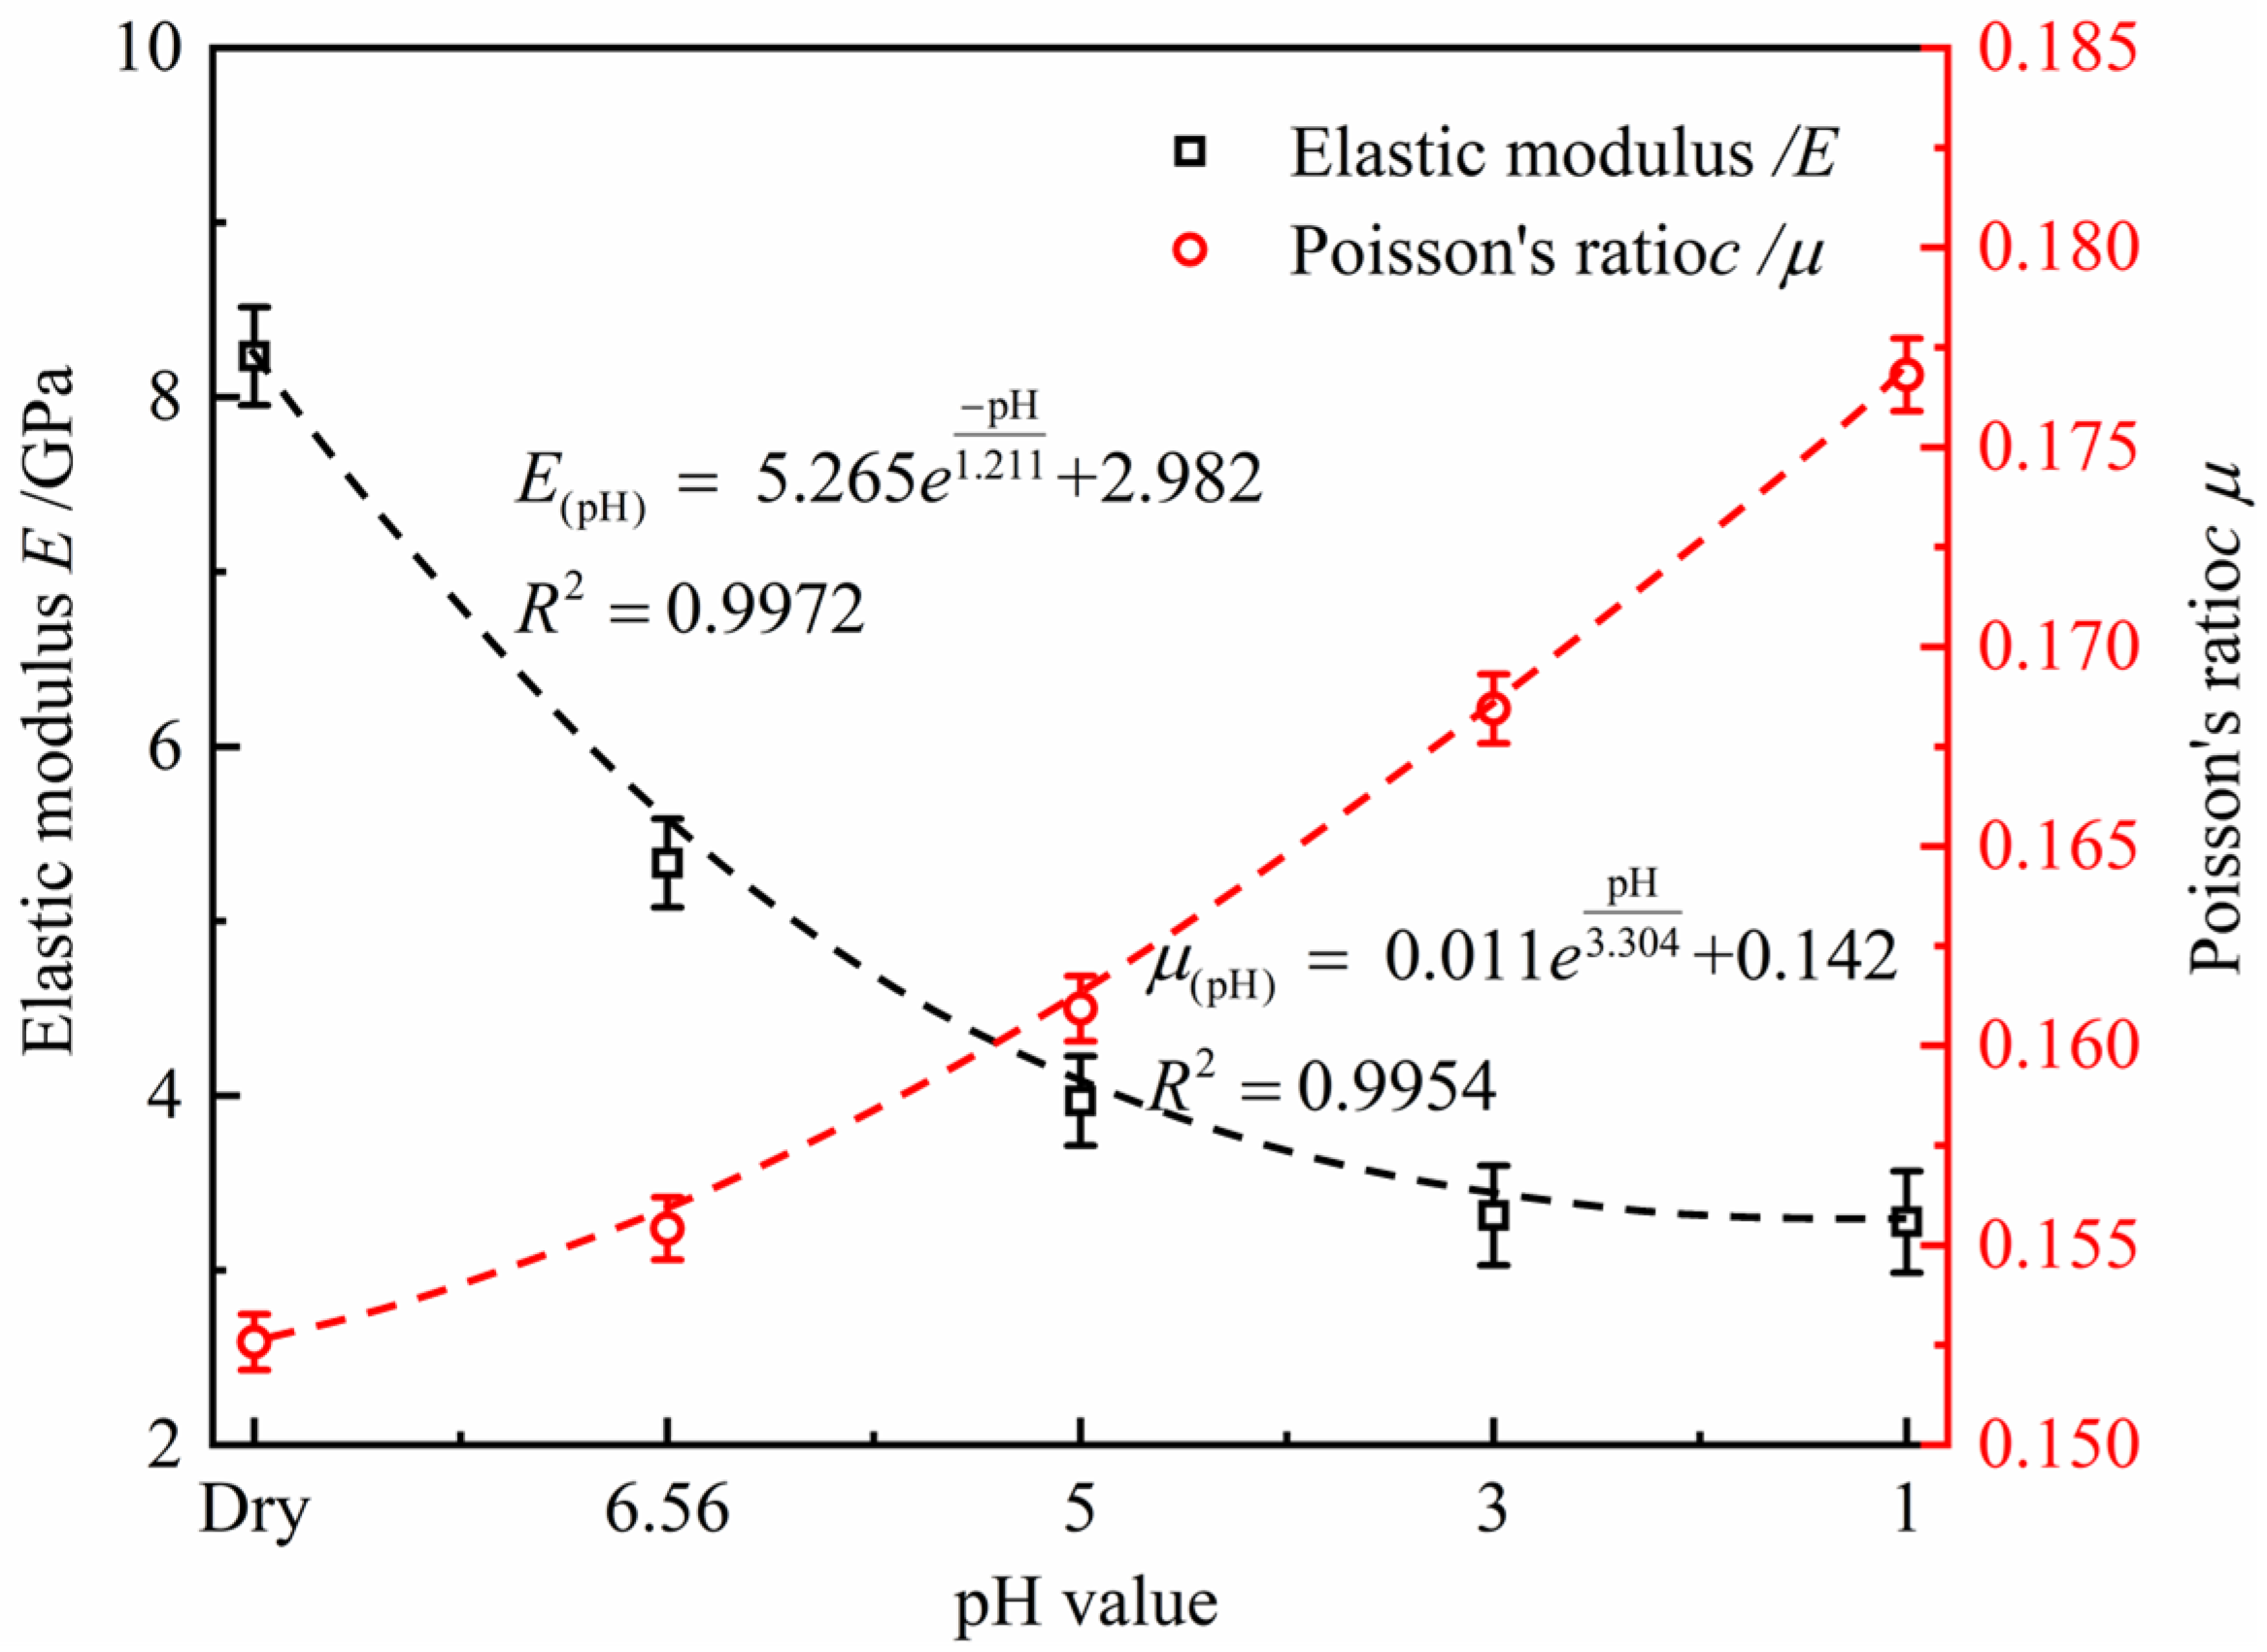
  • Effect of pH value on mechanical parameters of diorite
After the diorite sample enters the (II) elastic deformation to crack stable expansion stage, the stress–strain curve shows an approximately straight line segment. At this time, the elastic modulus E and Poisson’s ratio μ are used to reflect the deformation characteristics of the sample at this stage. The average elastic modulus and Poisson’s ratio were calculated by Equations (5) and (6), and the results are shown in Table 6 and Figure 11.
  E = ( σ B σ A ) / ( ε B ε A )
μ = ( ε dB ε dA ) / ( ε B ε A )
In Equations (5) and (6): reference specimen stage (II) (see Figure 5a–e), σA and σB are the stress values of starting point A and ending point B, respectively; εA and εB are the axial strains of points A and B, respectively; εdA and εdB are radial strains of points A and B, respectively.
According to Table 6 and Figure 11, the diorite’s elastic modulus is negatively correlated with the solution pH value and decreases as a negative exponential function, showing a gradually decreasing trend. Following 60 days at the pH 6.56, 5, 3 and 1 conditions, the specimens showed a decrease in elastic modulus of 35.24, 51.80, 59.76 and 60.20% compared to the drying condition, respectively. This shows that the corrosion softening effect caused by acidification will be enhanced as the increase in solution acidity. In addition, Figure 11 also shows that the solution pH value has a great influence on the Poisson’s ratio of diorite, which is positively correlated and increased exponentially as a function of the pH value. After 60 d of treatment in pH = 1, the Poisson’s ratio of the diorite cumulative increased by 13.71% compared with the drying state.
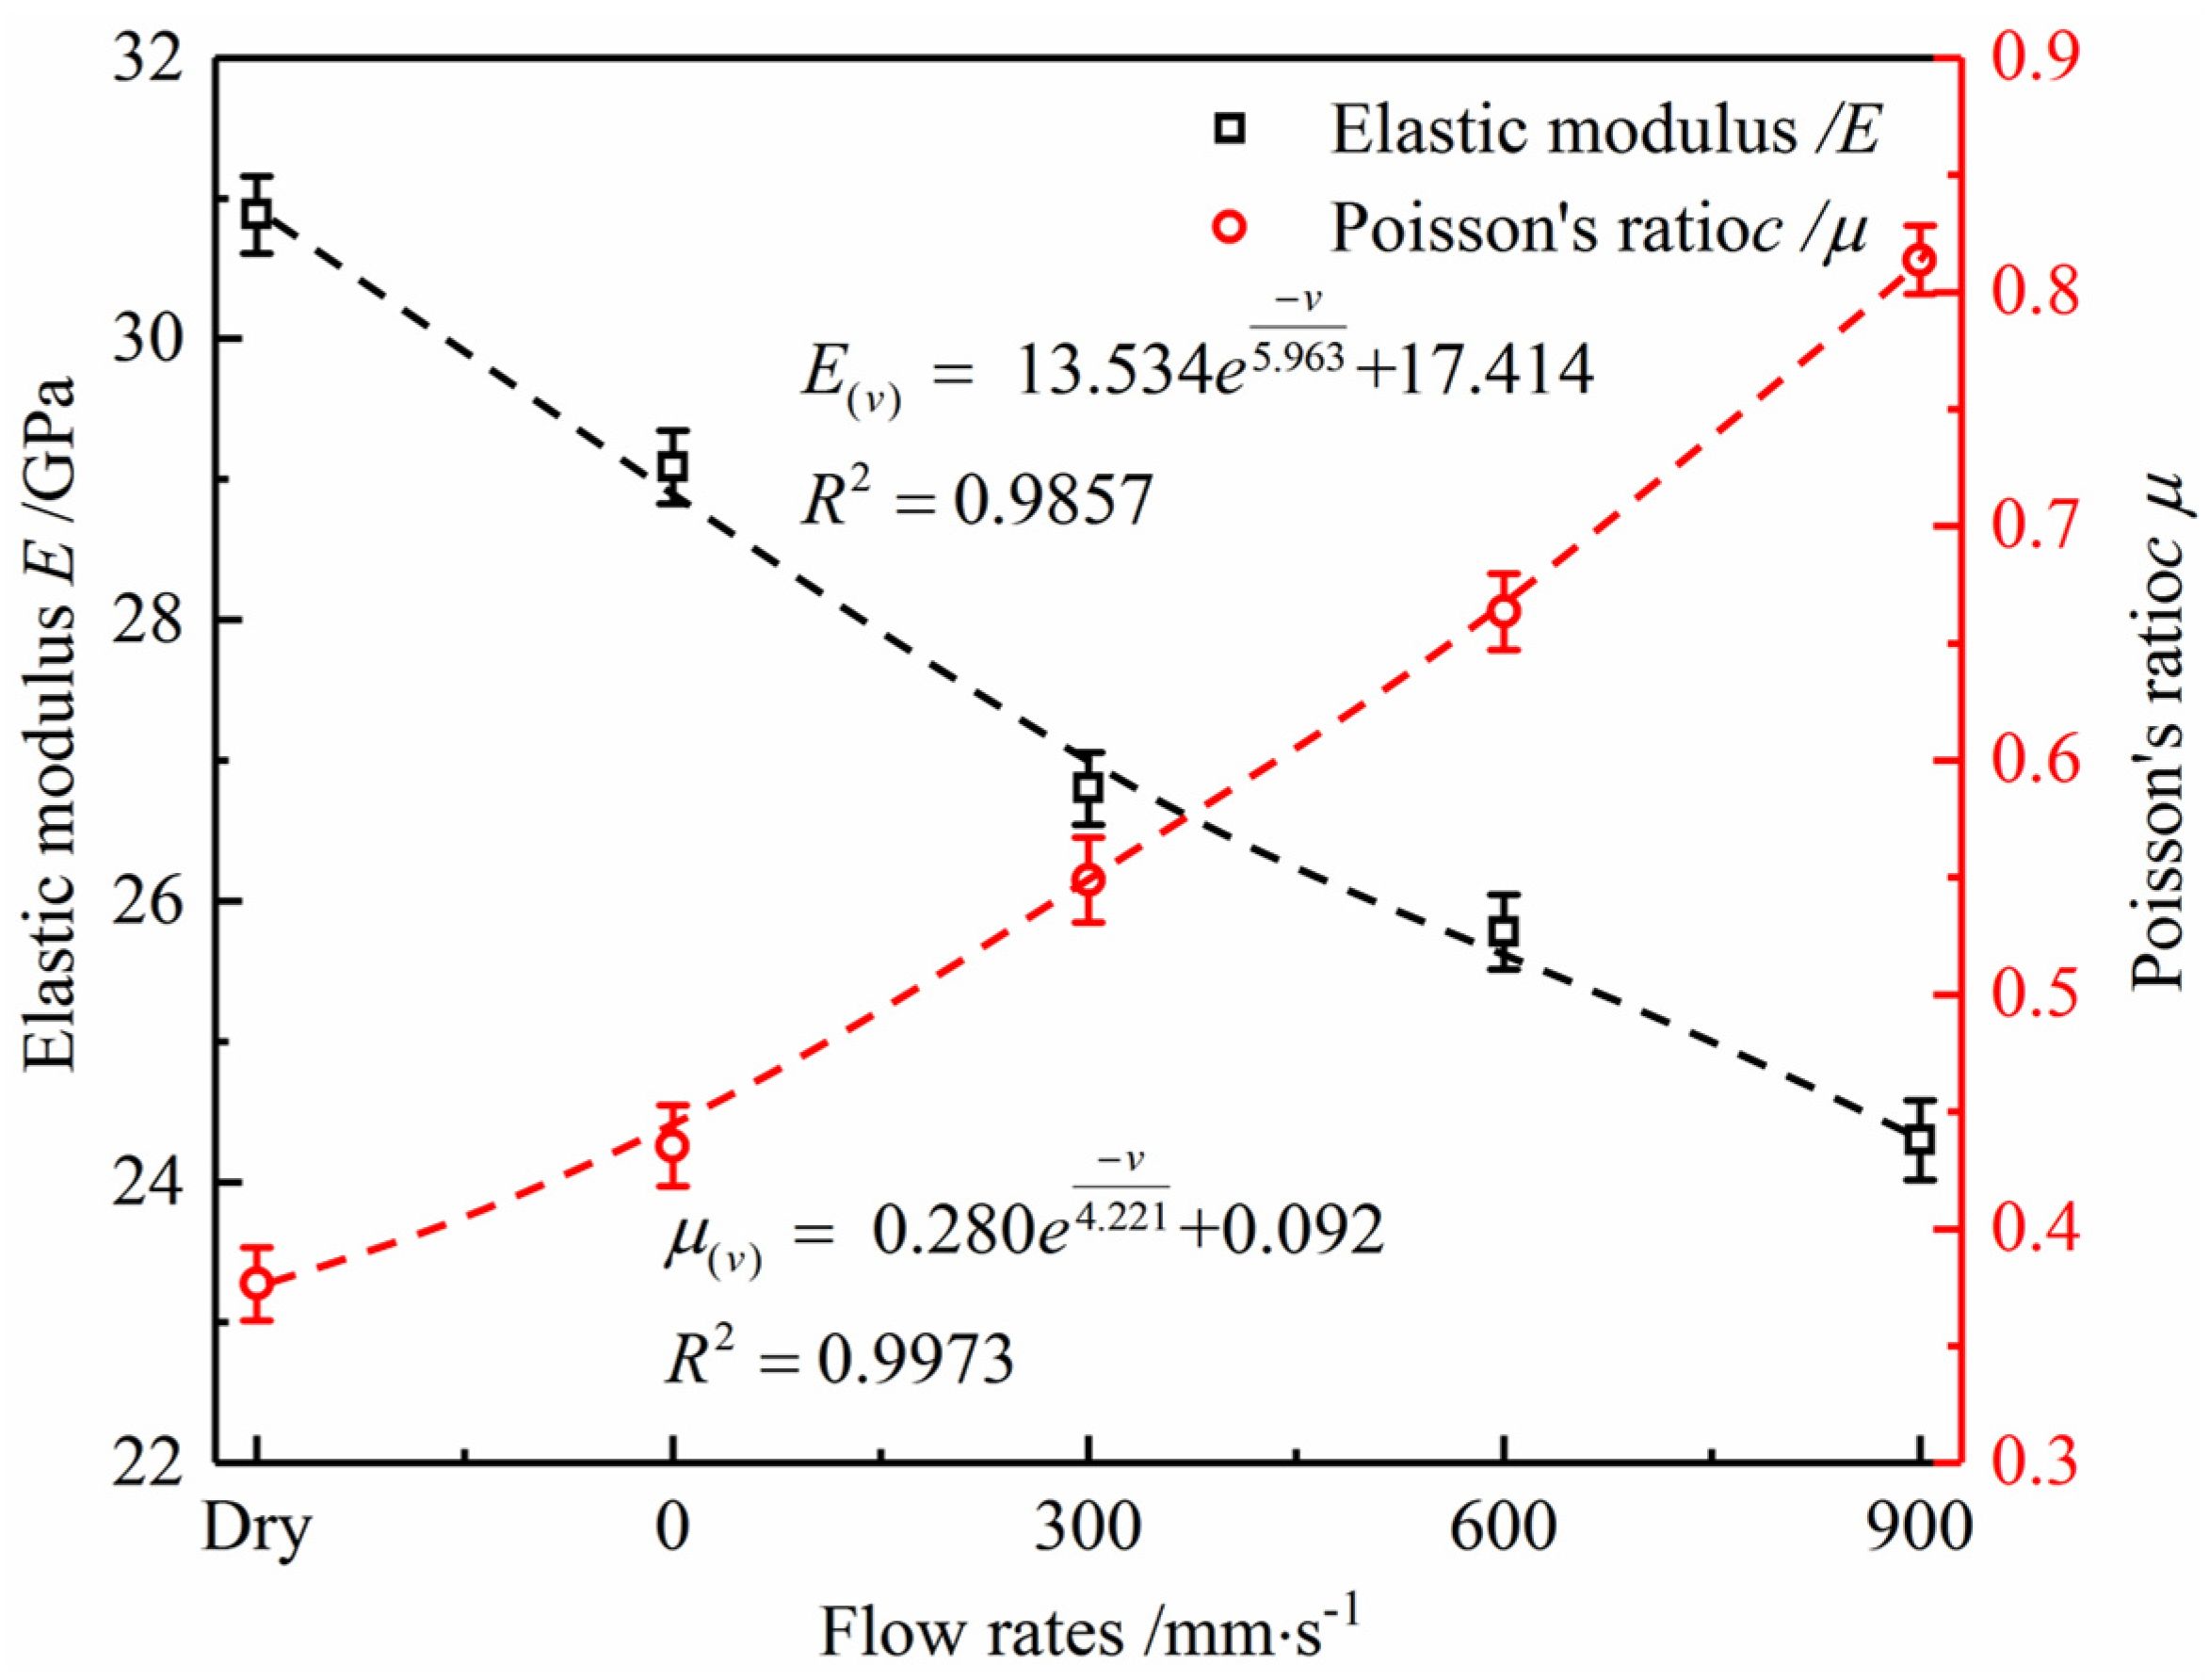
  • Effect of flow velocity on mechanical parameters of diorite
The calculated average elastic modulus and Poisson’s ratio of the diorite rock samples under different flow rates are shown in Table 7, which is plotted in Figure 12.
The deeper flow rate erosion of diorite is directly characterized by a smaller E value in the elastic deformation phase on the stress–strain curve [41,42]. Based on the elastic modulus of rock samples under the natural drying condition, the diorite’s elastic modulus showed a decreasing trend with the change in the solution flow rate after being scoured by different flow rates.
The diorite’s elastic modulus decreased significantly after 60 d of scouring by three solution flow rates with 300, 600 and 900 mm·s−1, and the decrease in the elastic modulus enhanced gradually with the growth of the flow rate, while the decrease in the elastic modulus was smaller after scouring by a flow rate of 0 mm·s−1. The average elastic modulus of specimens treated with different flow rates (from low to high) were 29.09, 26.80, 25.78 and 24.30 GPa, which, compared to the dry condition, decreased by 5.82, 7.86, 11.37 and 16.47%, respectively. This revealed that the higher the solution flow rate, the more obvious the deterioration damage effect caused by physical action. However, the Poisson’s ratio of diorite tends to increase with the acceleration of the solution flow rate. Compared with v = 0 mm·s−1, the Poisson’s ratio increases from 0.435 to 0.814 at v = 900 mm·s−1, with a cumulative increase of 53.73%. It is worth explaining that the mechanical parameters of the diorite specimens were less damaged by flow scouring compared to the acidic solution erosion effect, and the degradation range was relatively average throughout the process.

4. Analysis of the Damage Mechanism for Diorite under Flowing Acidic Solution Scouring

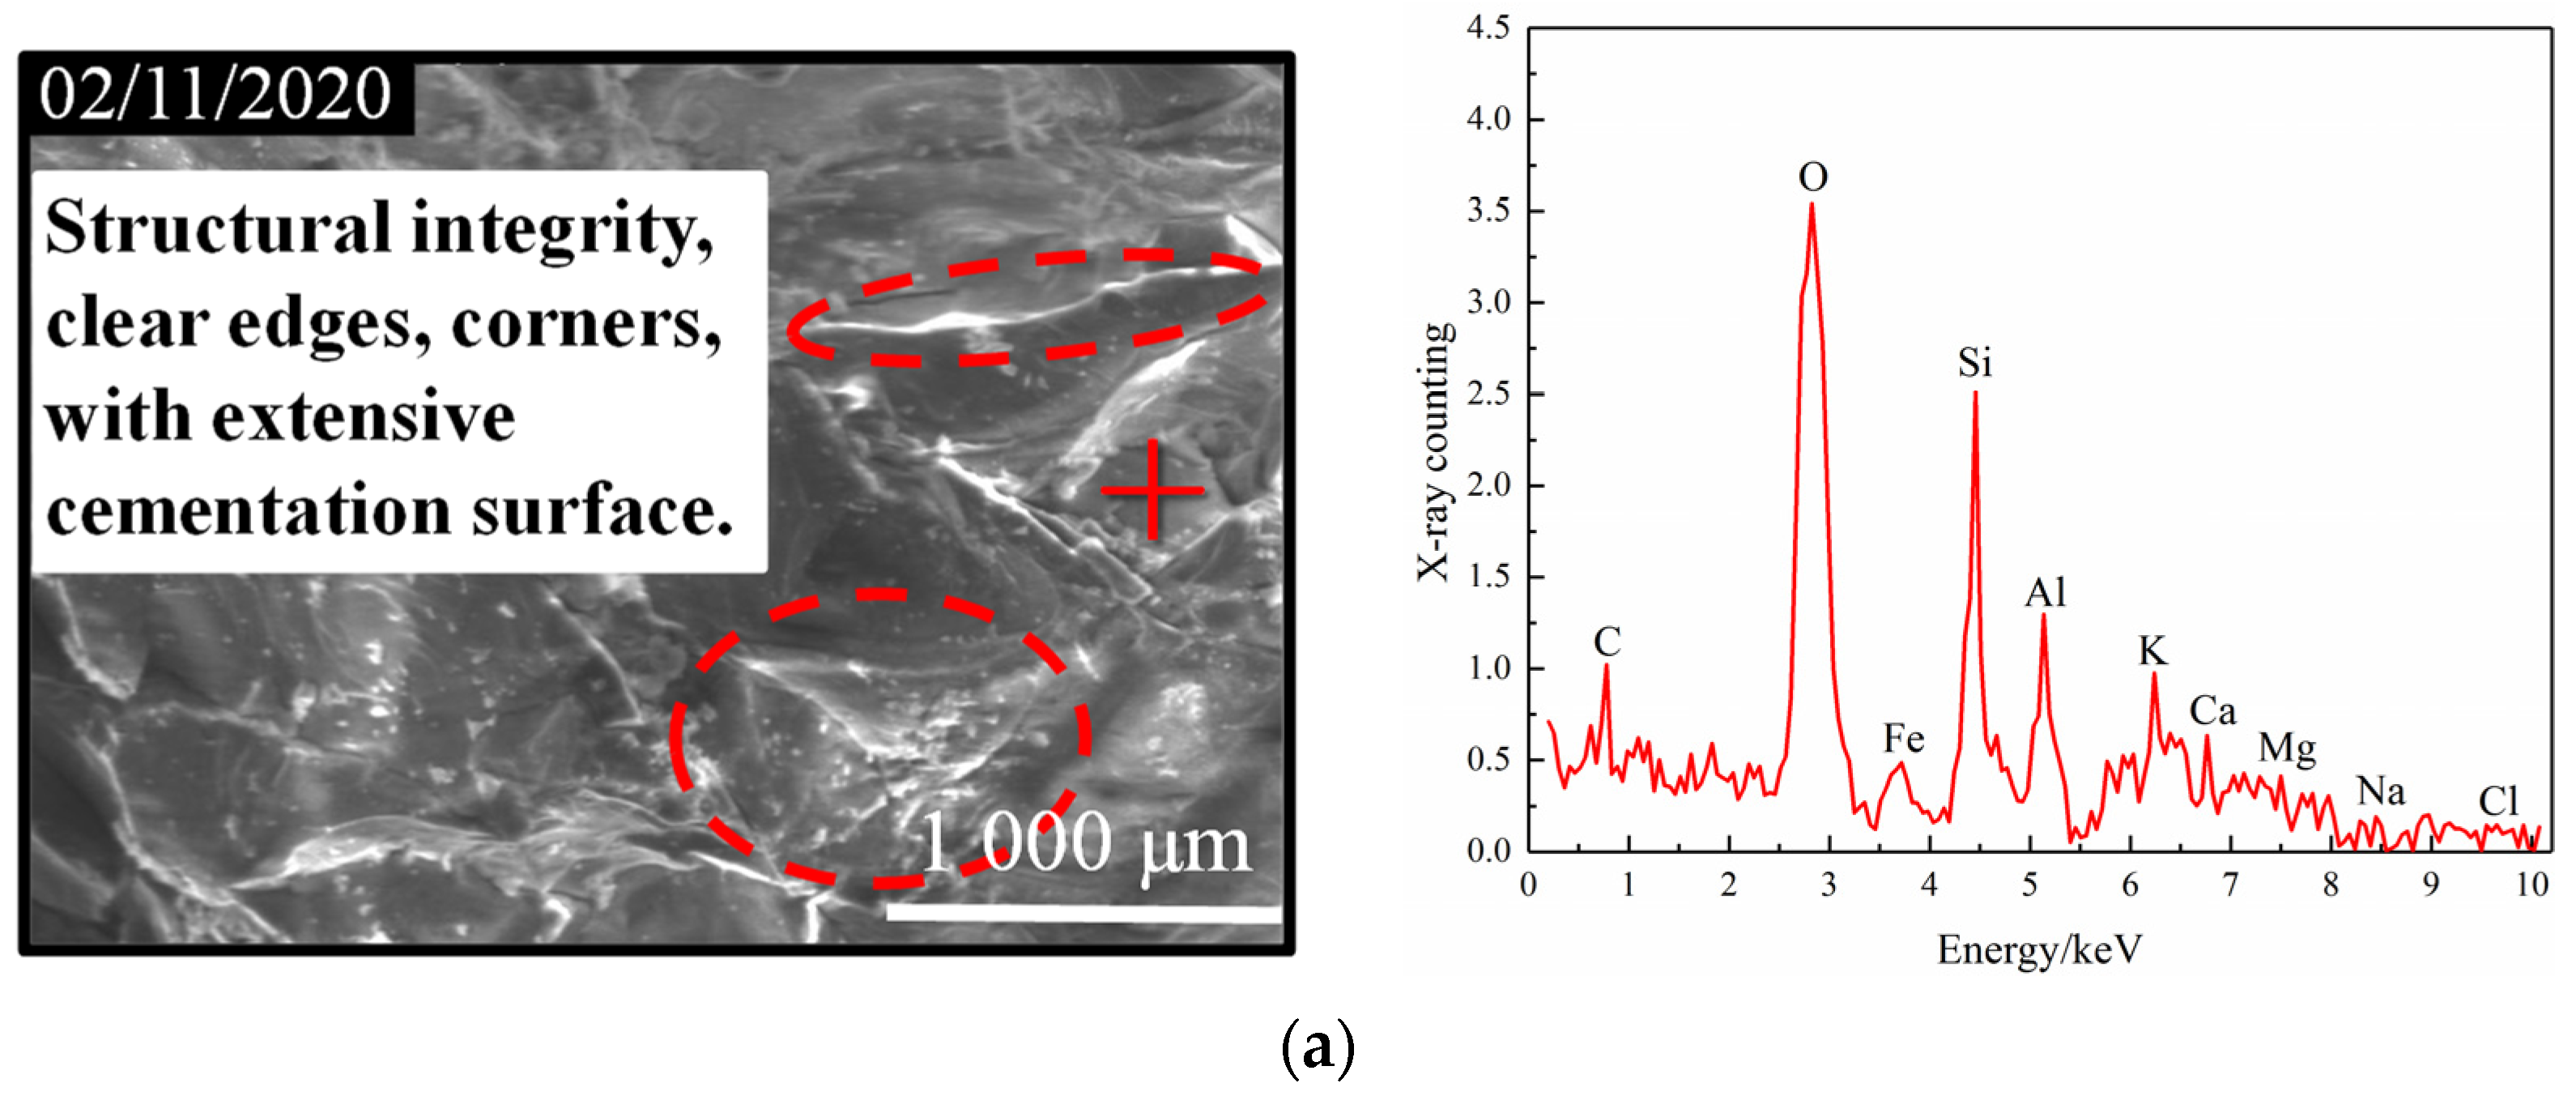
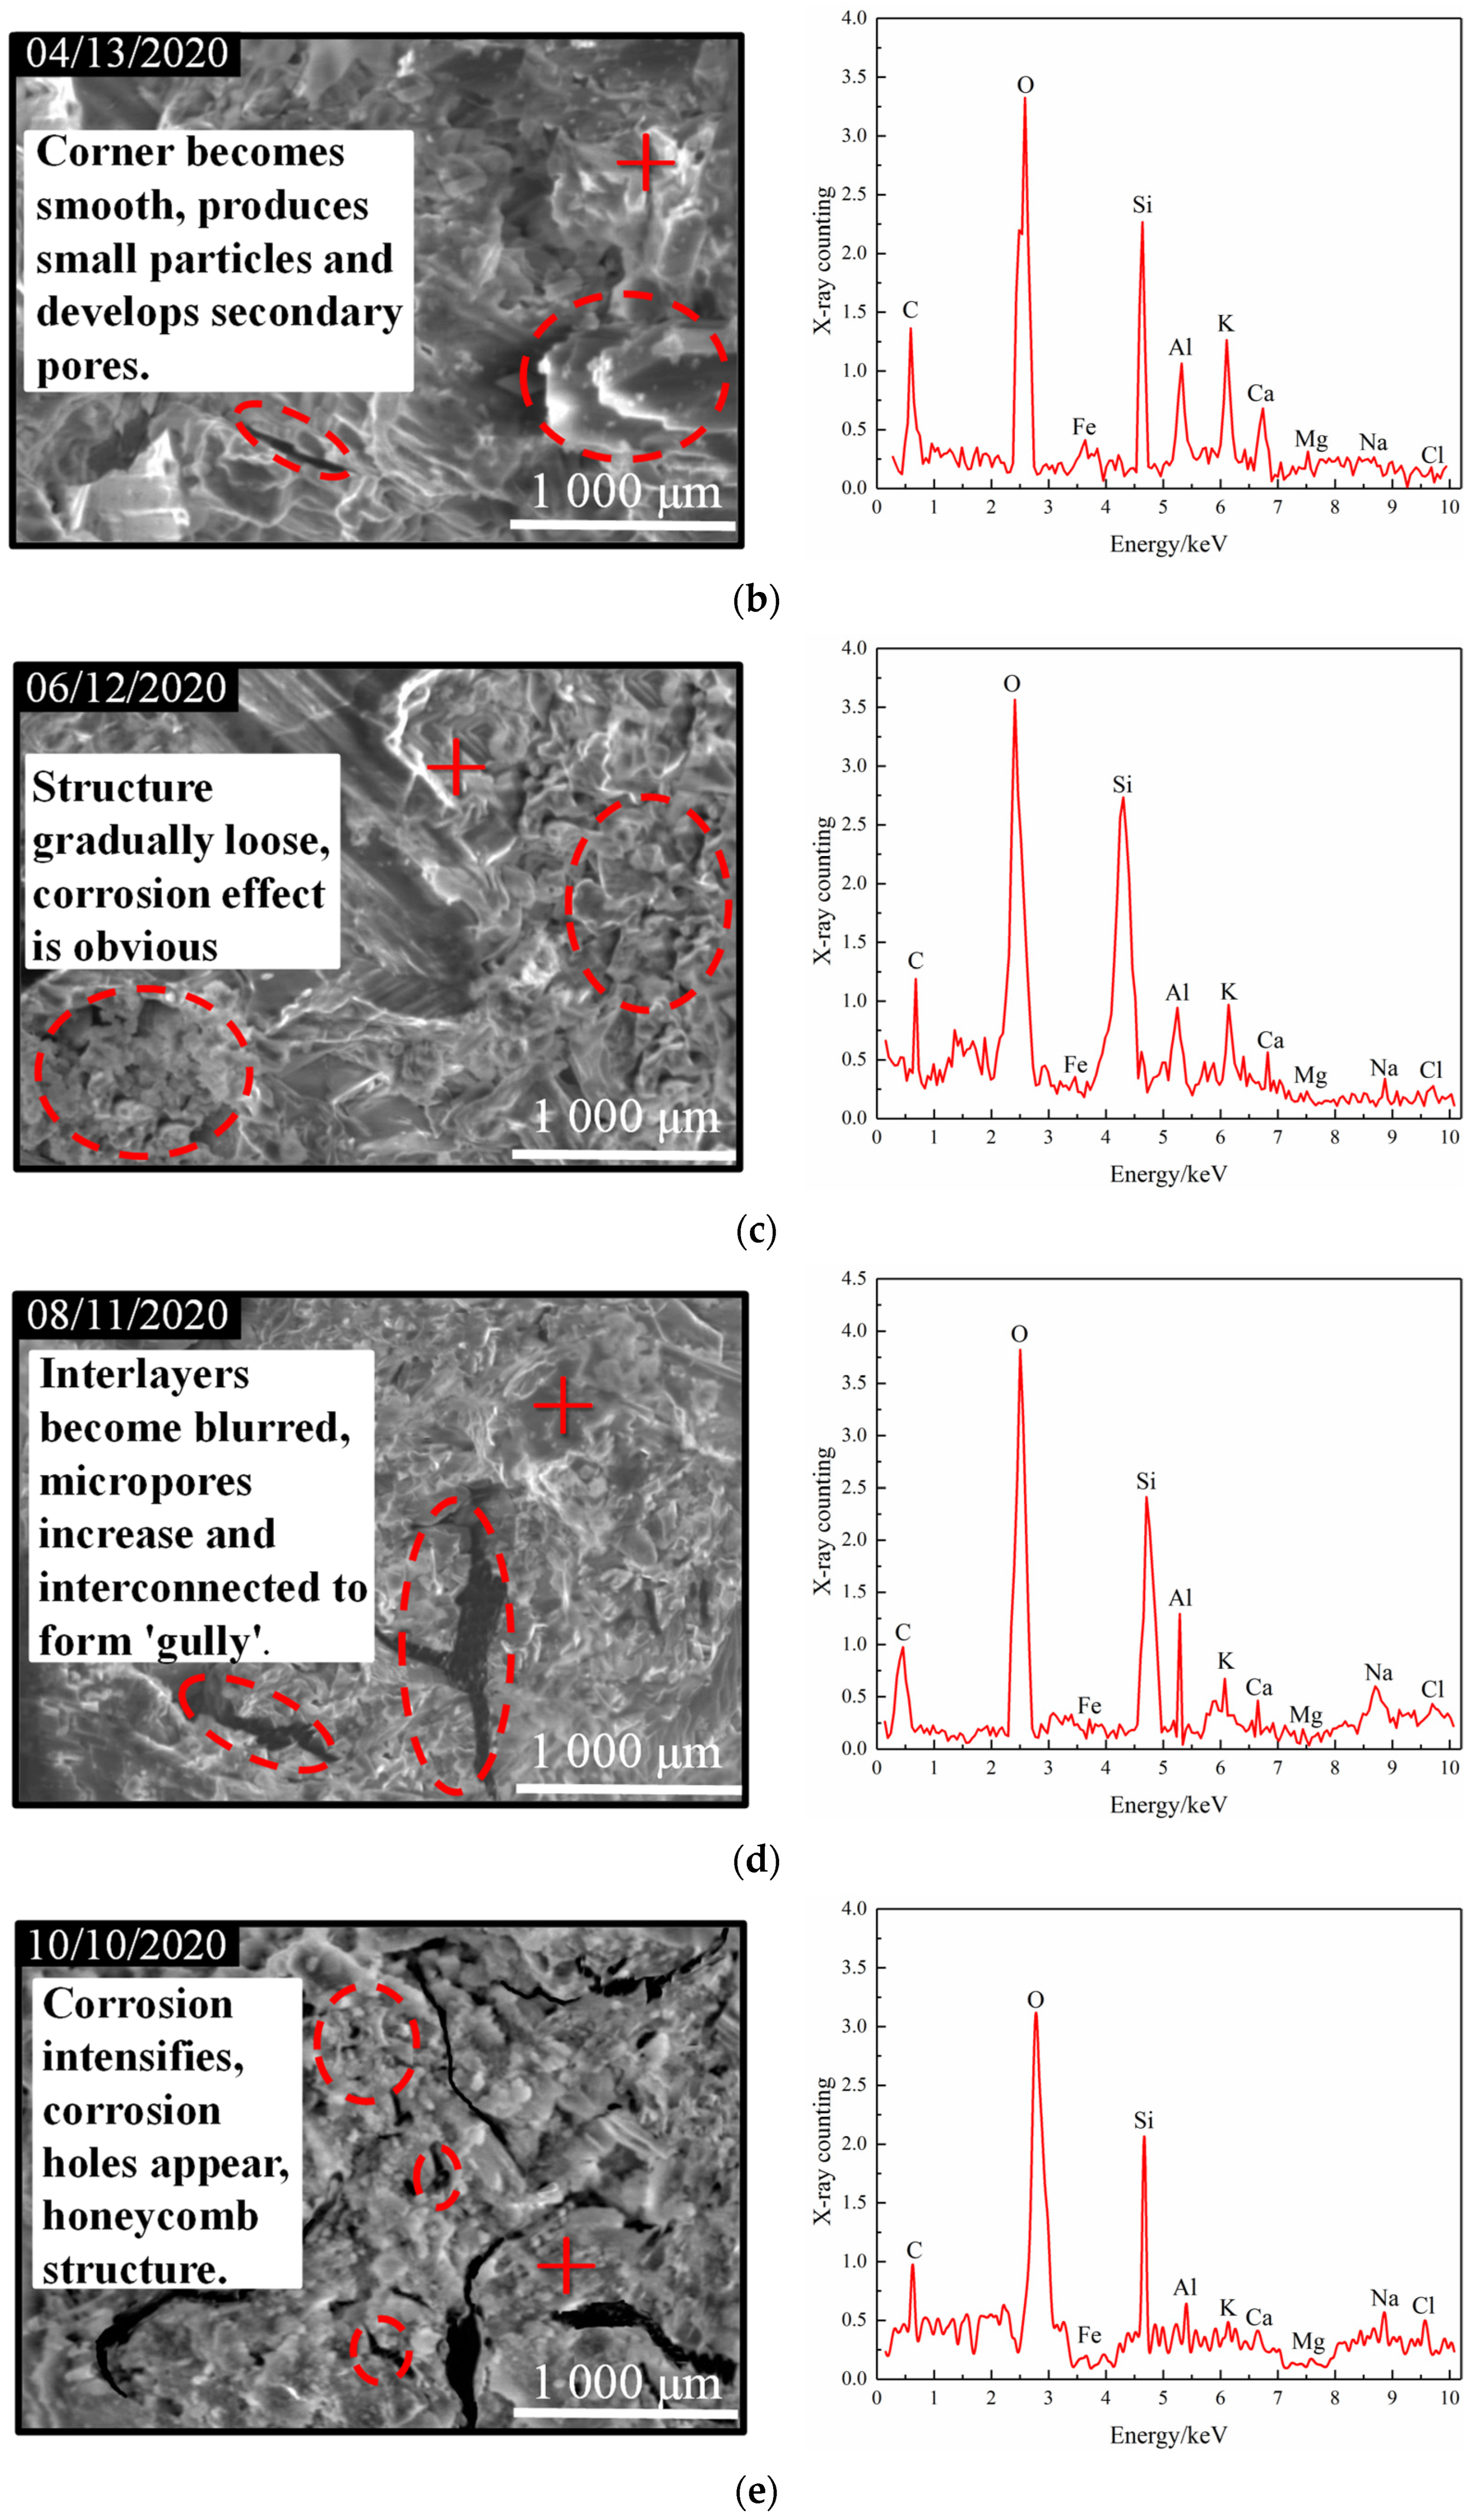
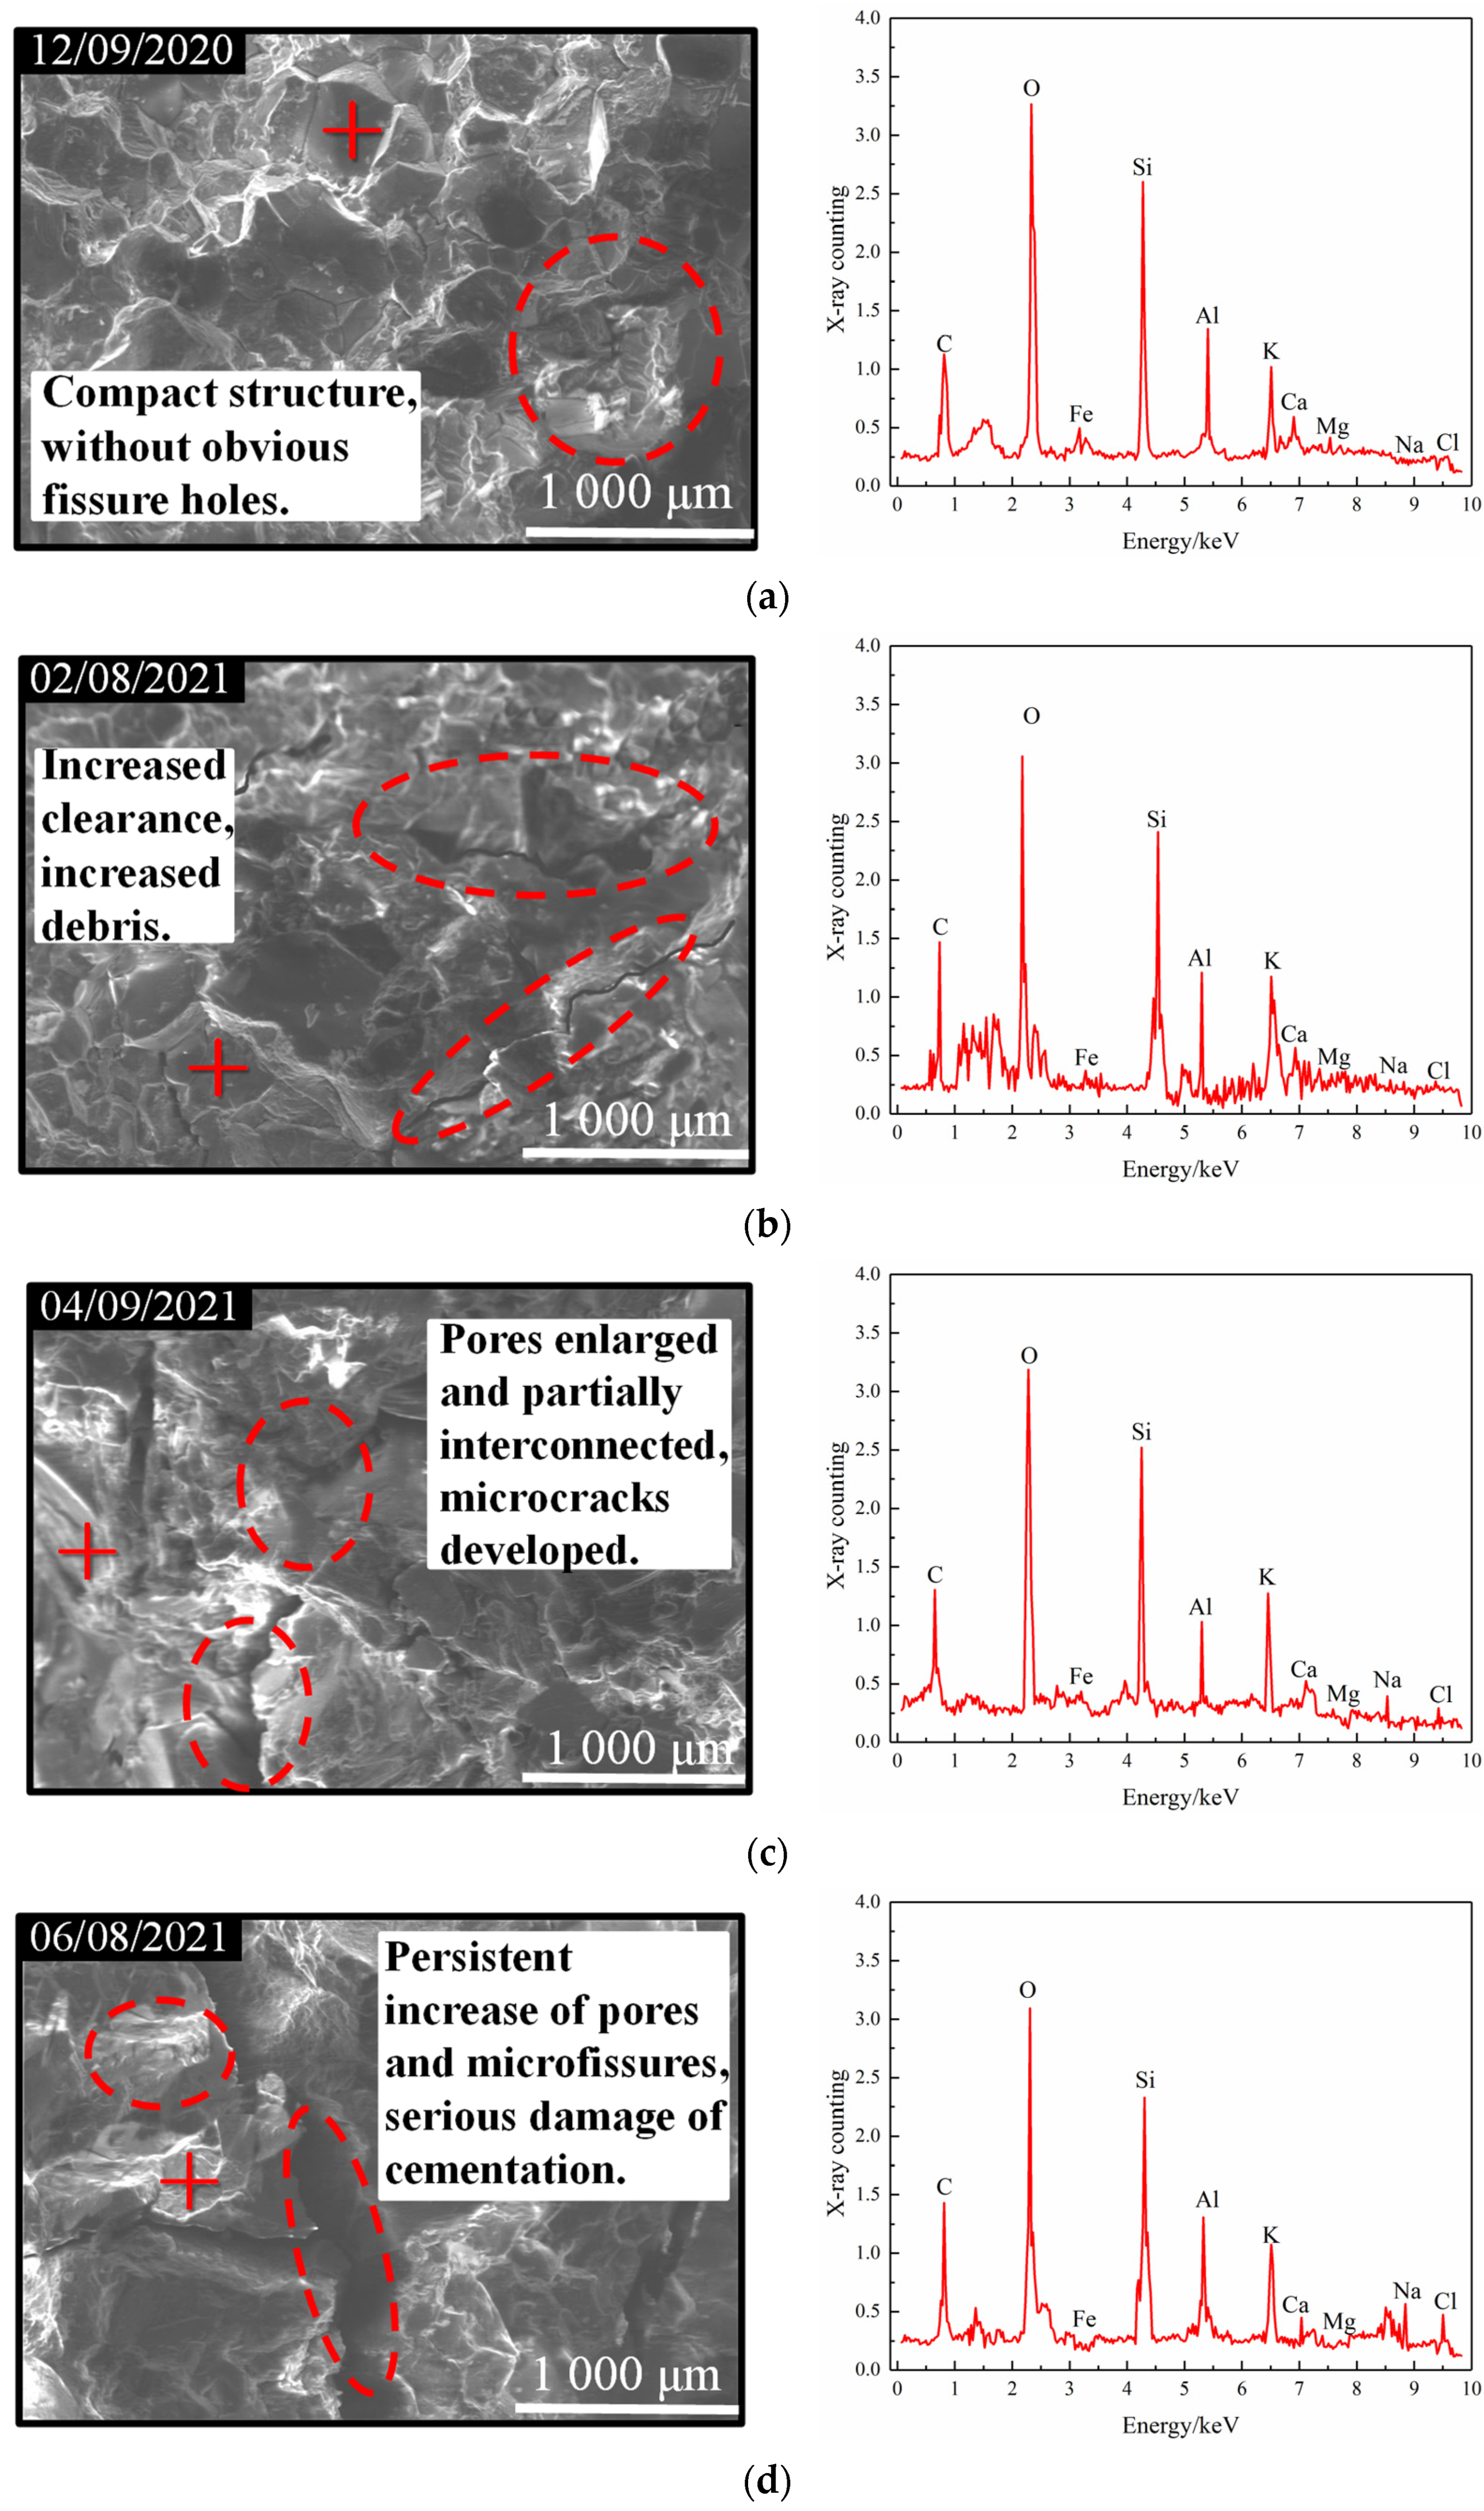
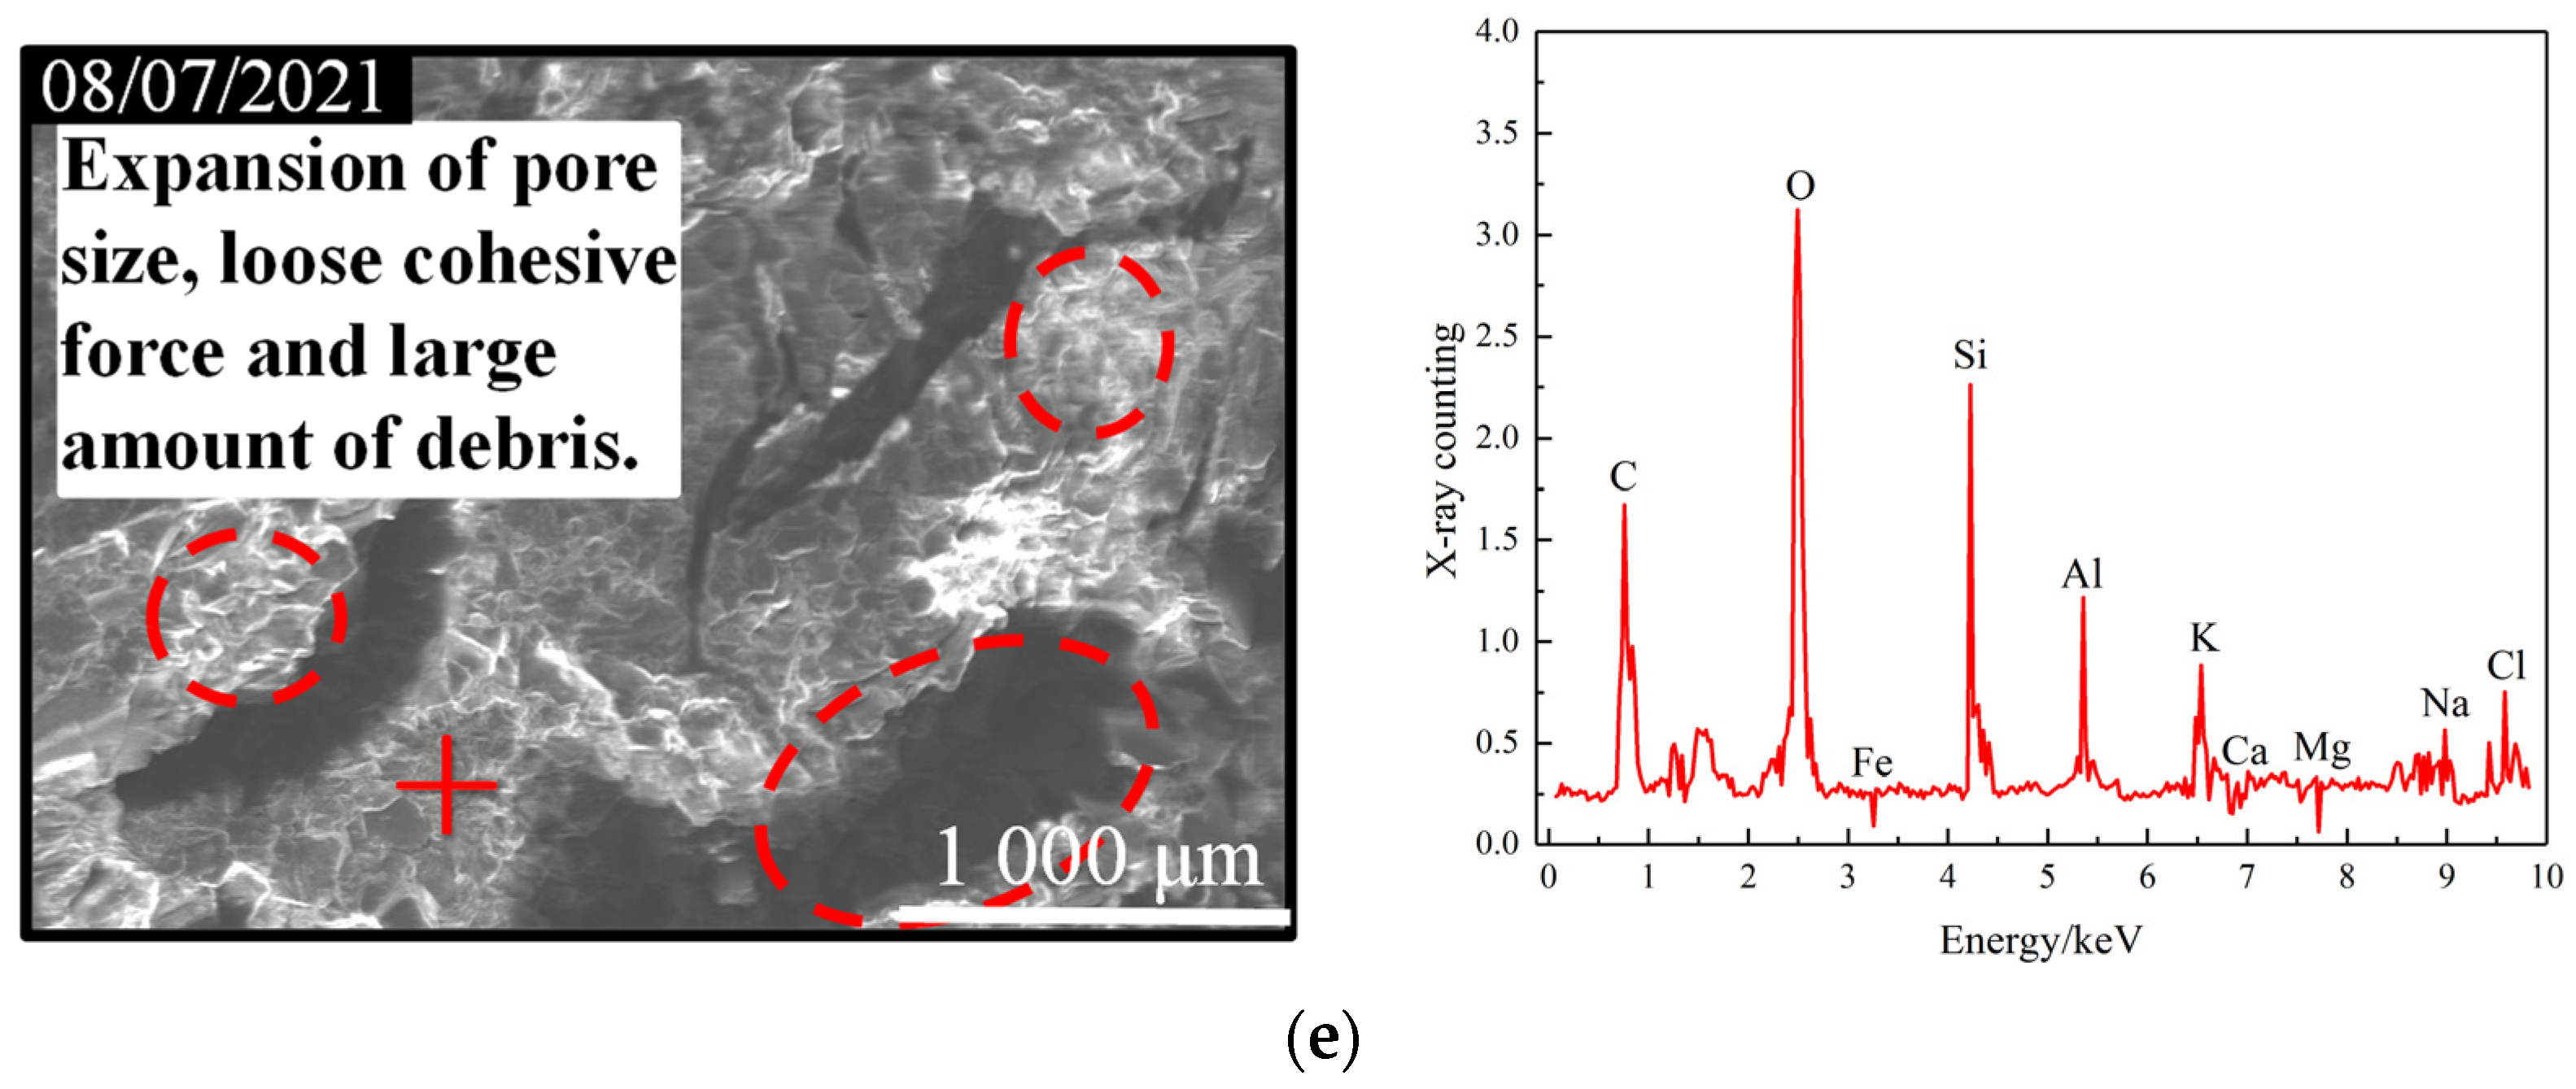
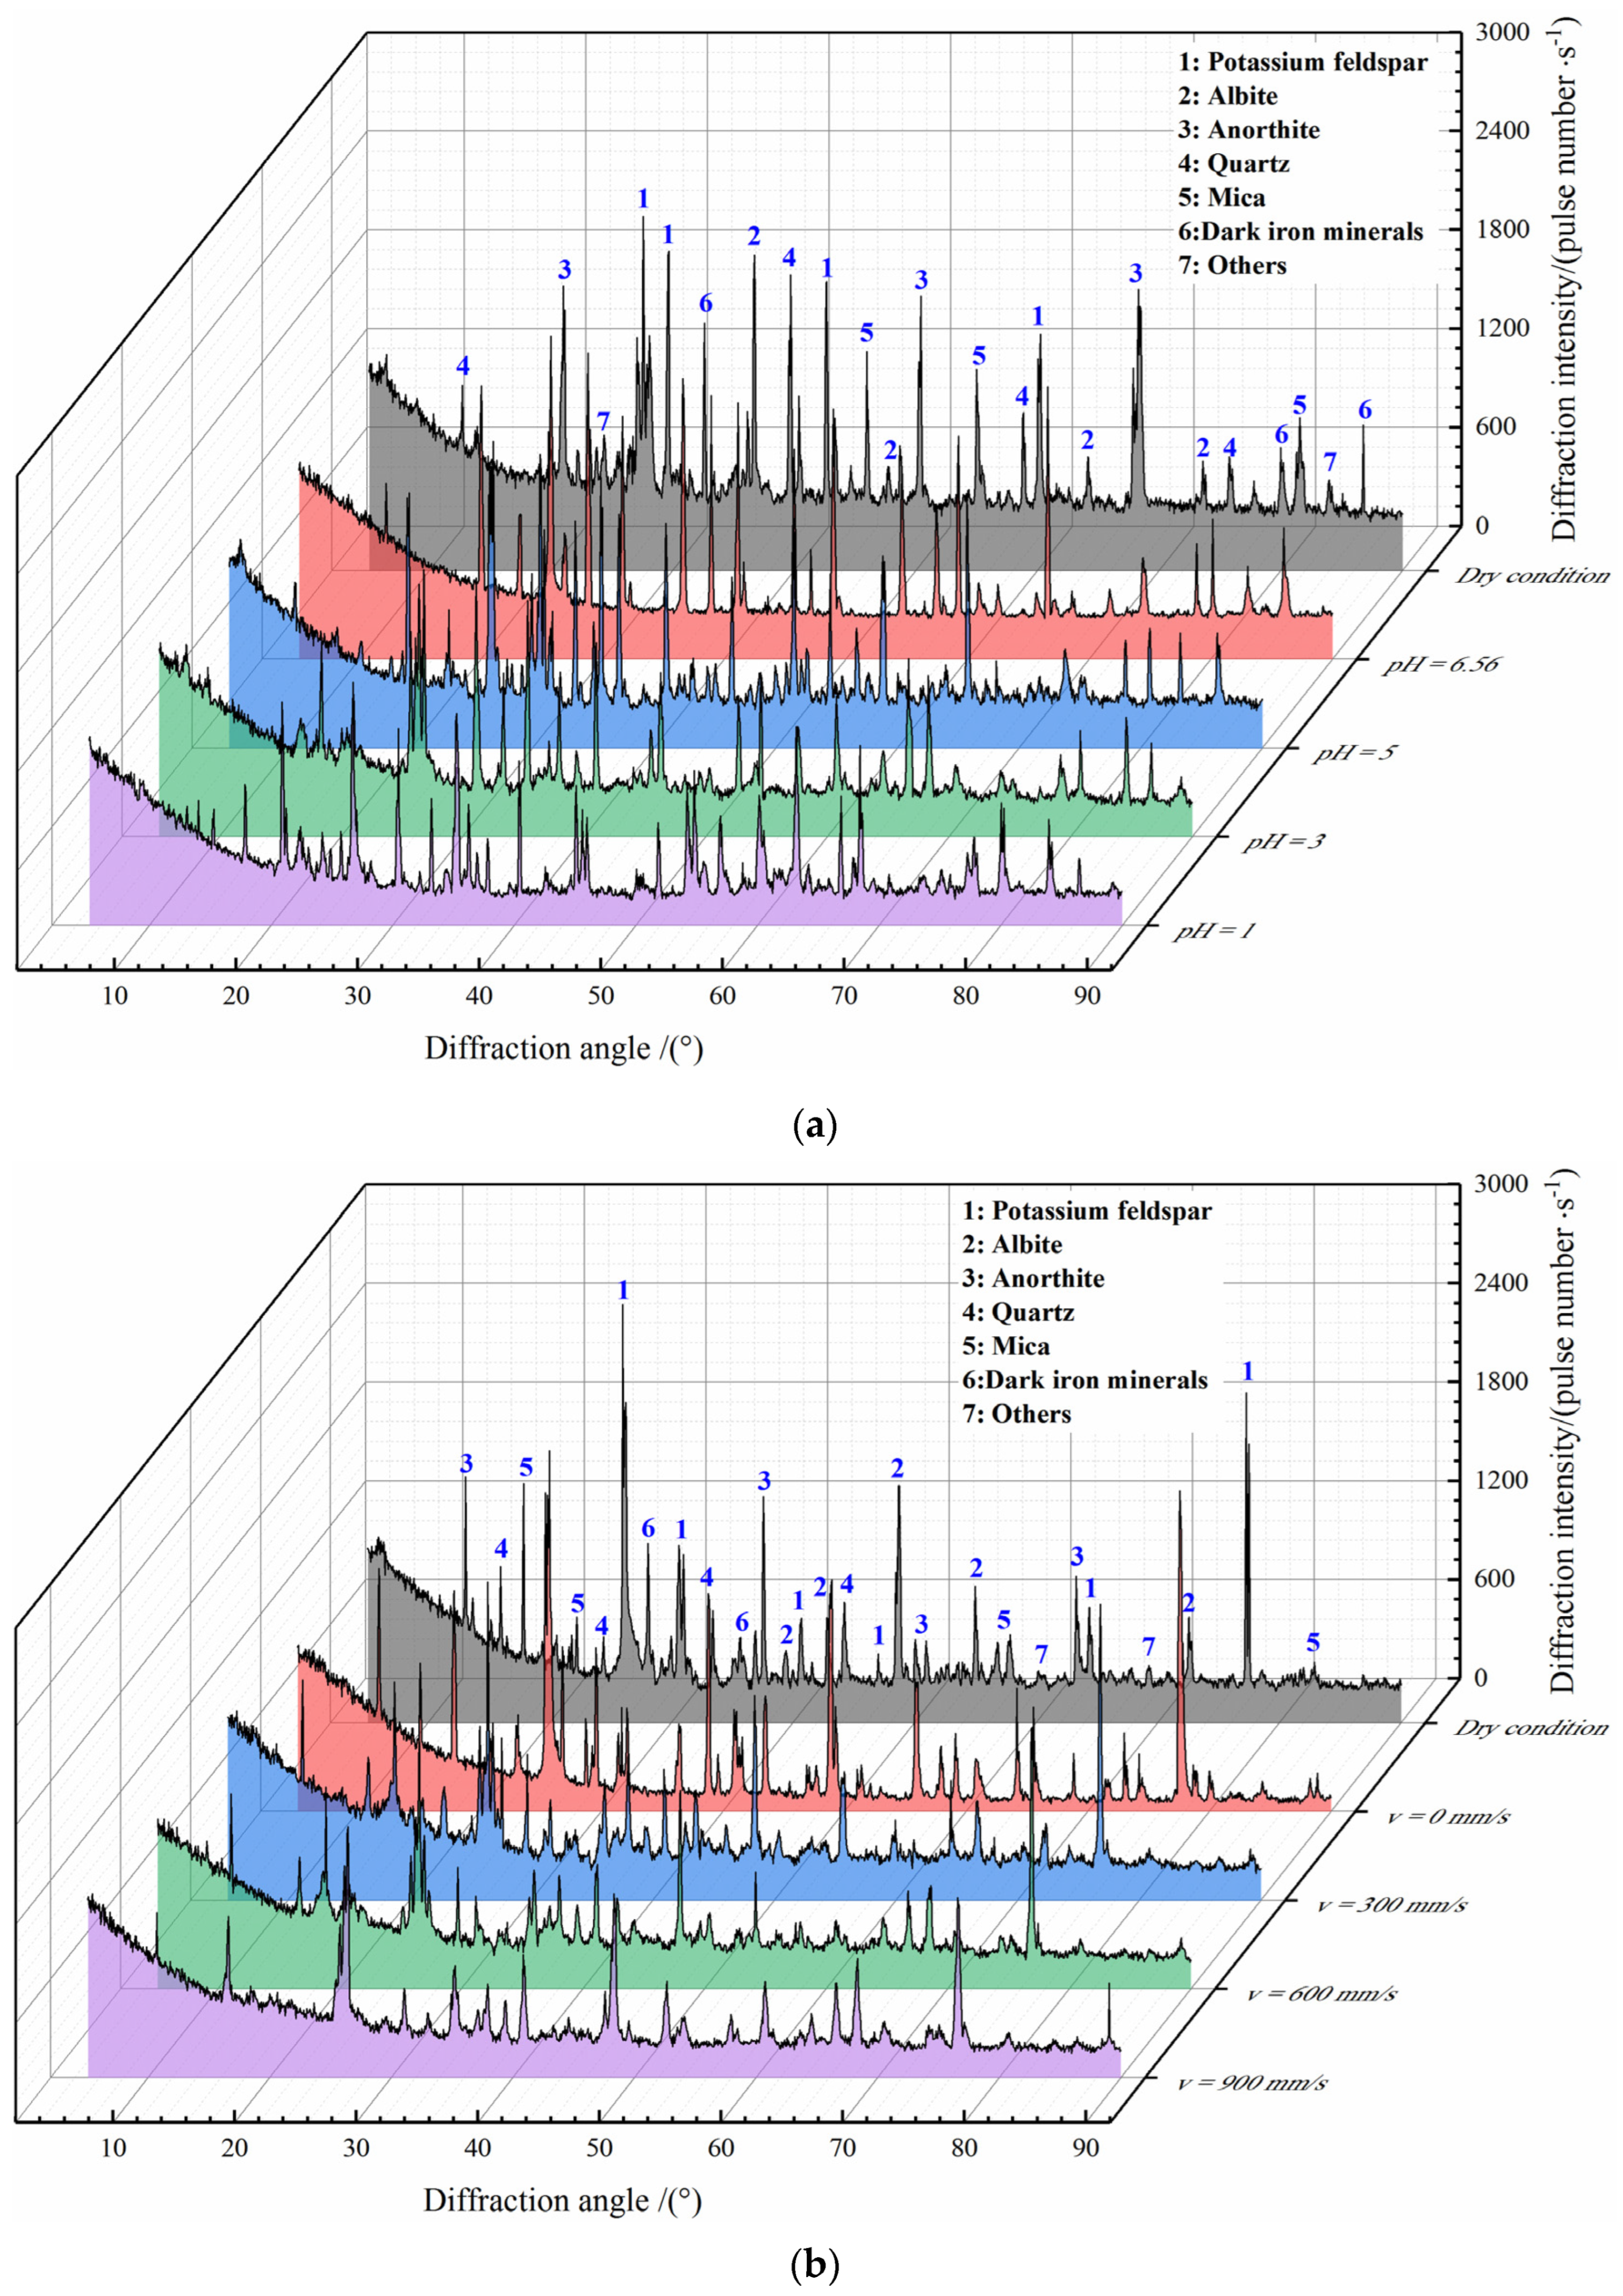
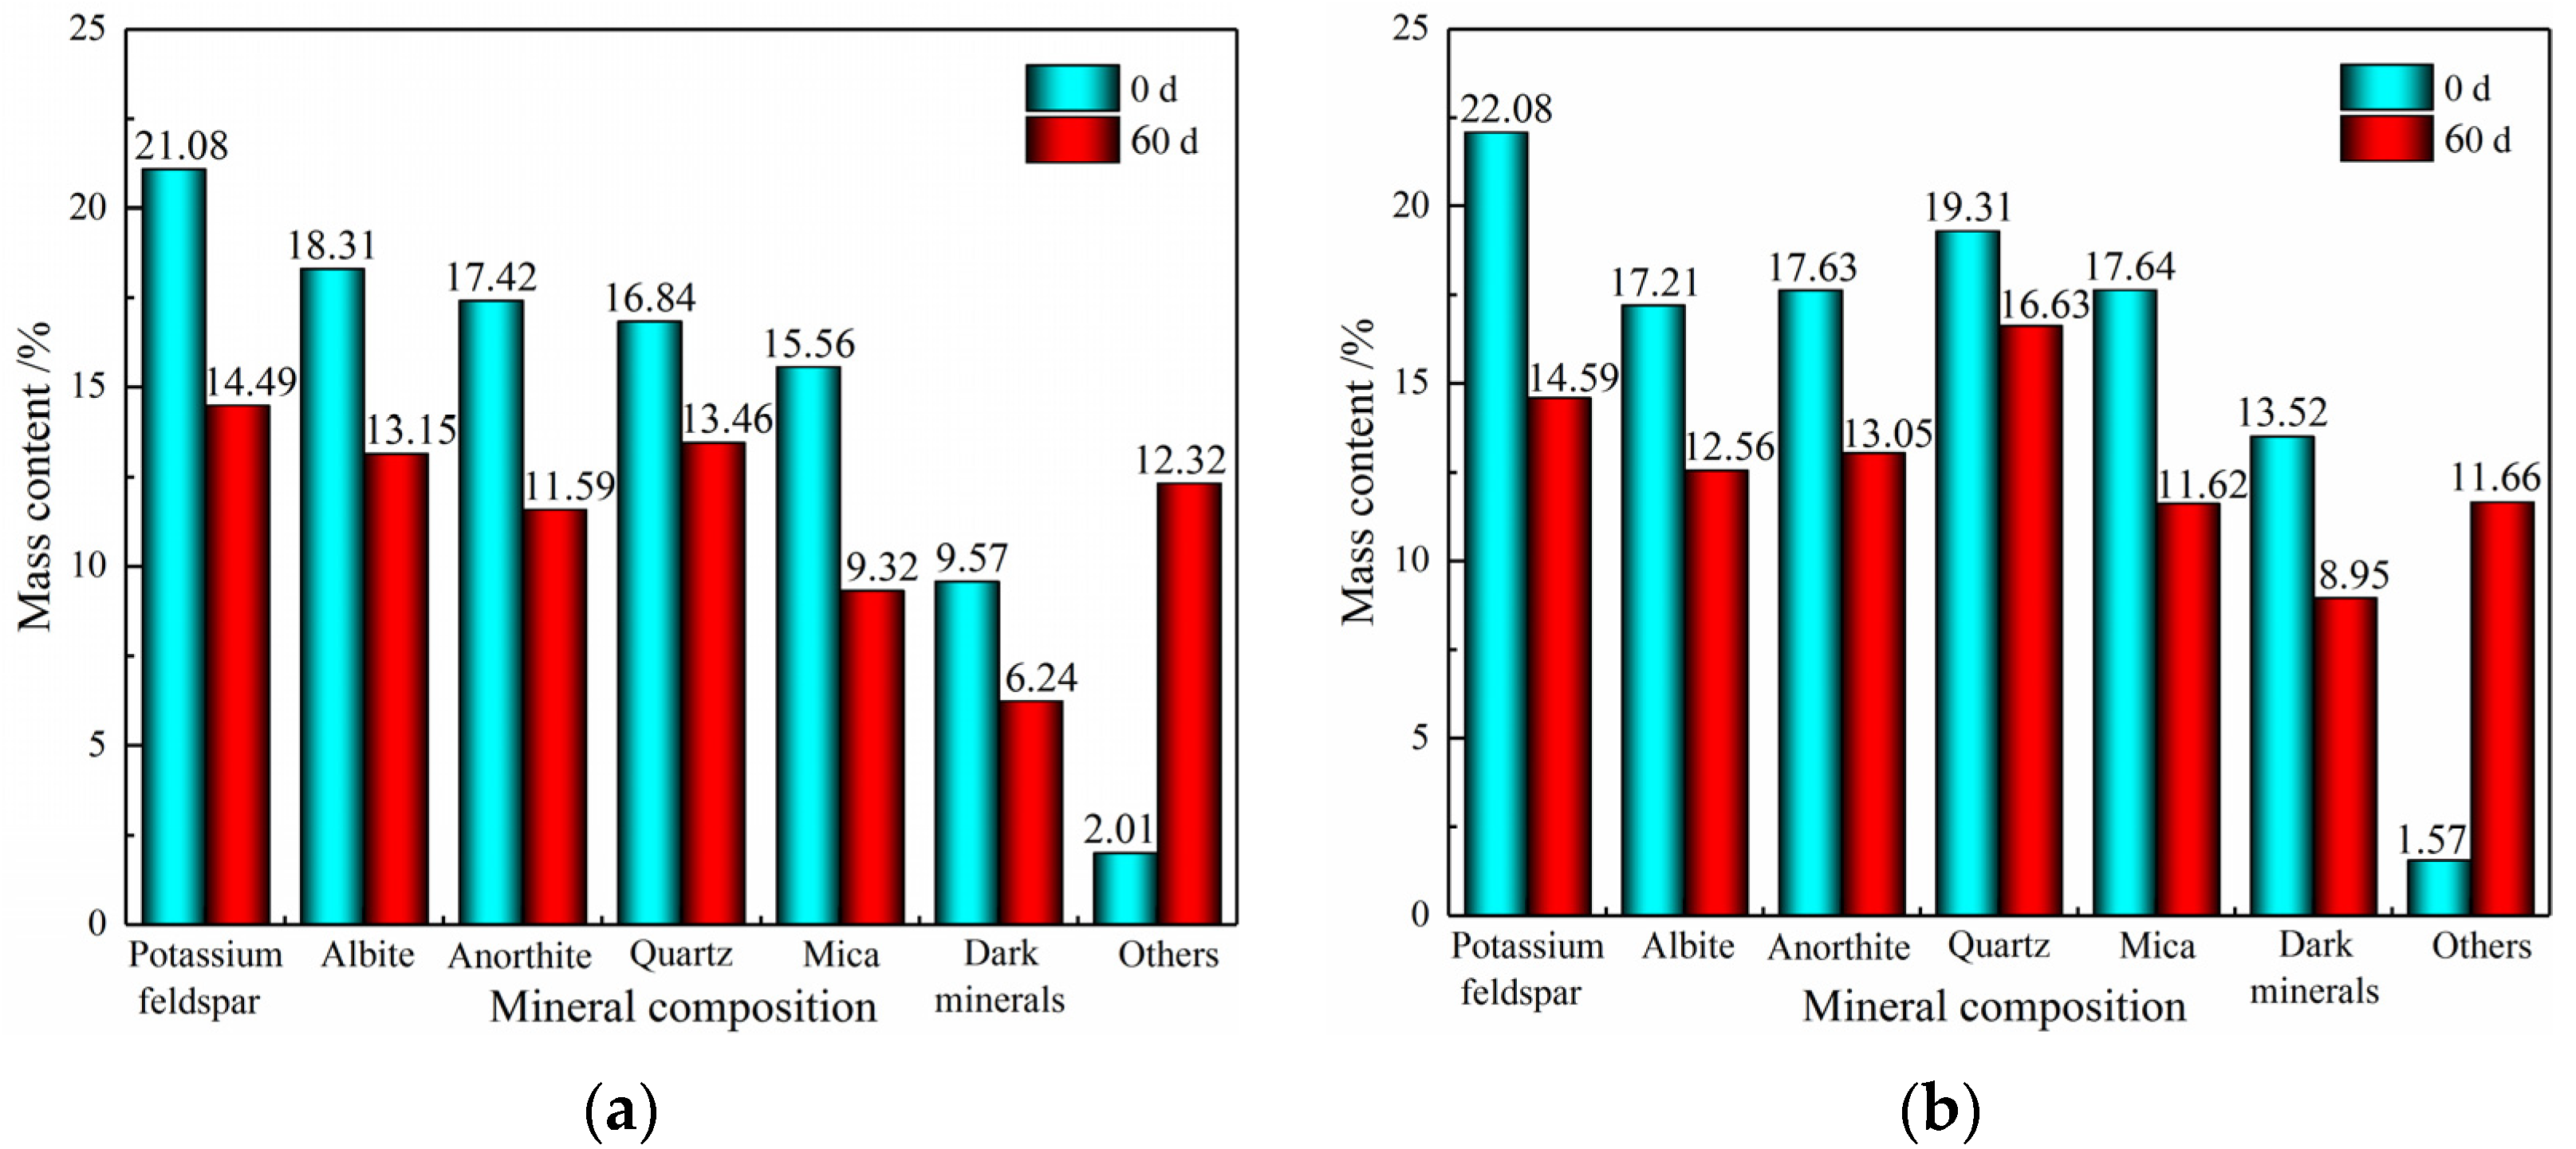
4.1. Analysis of Microscopic Change Characteristics

The macroscopic morphological changes in diorite are closely related to its microstructural changes [43]. In order to intuitively study the microstructural changes in diorite under the influence with different solution flow rates and pH values, scanning electron microscopy (SEM) was used to compare and analyze the surface minerals, defect morphology and pore structure of the specimens before and after different conditions. In addition, the changes in the mineral element content around the pores were tested using the energy dispersive spectroscopy (EDS) analysis technique.
  • Analysis of variation with pH
As shown in Figure 13a, before the experiment, the surface structure of the diorite was dense, but the pores were not obvious. In addition, the crystal and cleavage shape of the mineral is clear, the fracture characteristics are obvious and there are extensive cementation surfaces between the grains. After 60 d of the test, at pH = 6.56, the mineral particle angles became smooth or disappeared, with occasional regular crystal particles, and the surface structure of the diorite was relatively dense with insignificant secondary pores (see Figure 13b). Under the pH = 5 condition, the surface structure of the diorite tends to be loose and secondary pores are developed, and the dissolution effect is more obvious (see Figure 13c). In the condition of pH = 3, the interlayer becomes blurred, the local structure is relatively looser and the amount of microporosity increases making the originally dispersed independent small-sized microporosity interconnect and intersect to form larger-sized “gullies” (see Figure 13d). At the pH = 1 condition, the chemical corrosion degree of the diorite was intensified, and many small pores of dissolution appeared on the crystal surface, which was in a honeycomb structure. After 60 days of the experiment, the edges and corners of the mineral particles became smooth or disappeared under pH = 6.56. Regular crystal particles were occasionally observed, and the surface structure of the specimen was relatively dense, with no obvious secondary pores (see Figure 13e). It shows that the lower the pH of the acidic solution and the stronger the acidity, the more serious the chemical damage to diorite.
An electron spectroscopy test is confined to a microscopic area each time (the location of the red cross pointer in Figure 13a–e), and rocks are a collection of multiple minerals, which belong to heterogeneous materials; the results of a single-point analysis have great randomness. Therefore, several energy spectral tests were performed at different locations on the specimens, and the mass and atomic number content of the main elements were averaged (see Table 8). Combined with Figure 13 and Table 8, there was an overall decrease in the elemental contents of Al, K, Ca, Fe and Mg in the diorite under the action of acidic solutions with pH = 5, 3 and 1, which is mainly due to the chemical reaction between some minerals of the diorite and the H+ in the acidic solution, resulting in the dissolution of some elements and migration out of the rocks. Furthermore, due to the adsorption of the diorite, the elemental content of Cl and Na in the samples increased to a certain extent after the action of the NaCl solution. The contents of the major elements showed generally little variation at pH = 6.56 (data differences were caused by sample heterogeneity).
  • Analysis of variation with flow velocity
Figure 14 shows the microscopic electron micrographs of the diorite specimens before and after 60 d of scouring by each flow rate, which was magnified 1000 times with the electron microscope scanner. From Figure 14, it is shown that: (1) In the natural drying state, the internal structure of the specimens was without obvious fissures and pores, with tight cementation between minerals and a little debris attached to the surface (see Figure 14a). (2) Under the condition of v = 0 mm·s−1, some hydrophilic compounds of specimens dissolved in the water, while some minerals reacted with the aqueous chemical solution, the gap between the minerals increased and the amount of surface debris slightly enhanced (see Figure 14b). (3) After erosion by the v = 300 mm·s−1 scouring, the pore size enlarged and some pores were connected, resulting in the development of internal microfractures (see Figure 14c). (4) At the v = 600 mm·s−1 condition, the pores and microcracks further expanded and increased, and the cementation structure between the minerals was seriously damaged. In addition, more rock debris of different sizes was scattered on the surface (see Figure 14d). (5) By the v = 900 mm·s−1 scouring, the proportion of the medium and large pores in the specimen rose, and the pore spacing was further extended. A large number of mineral particles lose the wrapping of cementation, the bonding between particles was loose and lots of granular debris were attached to the surface (see Figure 14e). From the above, it can be seen that the faster the solution flow rate, the more serious the microstructure damage on the surface of the rock samples. It also reflects that the greater the erosion intensity of the solution, the more serious the damage to the macroscopic mechanical properties of the rock.
The electronic energy spectrum tests were carried out on the specimens after different flow rates of scouring, and the mass and atomic number content of the main elements in the specimens are shown in Table 9. Figure 14 and Table 9 show that the content of metallic elements all decreased to varying degrees with the enhancement of the flow rate, as Al, K, Ca, Fe and Mg. Among them, Ca, Fe and Mg were almost completely dissolved away in the condition with a flow rate of 900 mm·s−1, while the Na and Cl content increased significantly. The reason is that the diorite itself contains less CaO, GaAlSi3O8 and mafic minerals, which are rapidly dissolved and decomposed under acidification and the scouring effect, and the precipitated Ca2+, Mg2+, Fe2+ and Fe3+ ions travel away from the rock mass with the rapid movement of water.
Comparing the surface microscopic changes in the diorite specimens, as well as the changes in mass and atomic number content of major elements under acidification and scouring, the damage deterioration degree of specimens under acidification is not as serious as that under scouring. This is caused by the fact that the diorite specimens are in a relatively stable water chemical solution environment for a long time, while the water flow environment is unstable and violent scouring erosion occurs occasionally.

4.2. Analysis of Chemical Damage Mechanism

The XRD diffraction analysis of the diorite specimen powder before and after the 60 d scouring by different pH solutions, as well as different flow rates, is shown in Figure 15. Figure 15 shows that the mineral peaks of untreated diorite are obvious, which are Potassium Feldspar (KAlSi3O8), Albite (NaAlSi3O8), Anorthite (GaAlSi3O8), Quartz (SiO2), Mica (KAl3Si3O10(OH)2) and dark mafic minerals. The percentage of feldspar minerals and Quartz is relatively larger, followed by Mica and a few metallic minerals.
According to the results of the XRD diffraction mineral composition analysis in Figure 15, the Jade software was used to draw the mineral percentage content comparison diagram of the diorite specimens before and after treatment for 60 d (see Figure 16). From Figure 16, the percentage content of all minerals decreased to different degrees: Plagioclase and Mica were particularly serious, as the Plagioclase declined from 56.81 to 39.23% under acidification, a decrease of 30.95%, and Mica reduced from 15.56 to 9.32%, a decrease of 40.10%; the feldspar minerals fell by 29.37% from 56.92 to 40.20%, and Mica fell by 34.13% from 17.64 to 11.62% under the scouring effect. Moreover, the percentage content of the generated new minerals, namely other minerals, increased significantly. Comparing the mineral composition analysis results of the diorite specimens under the two action mechanisms, the damage degree of the rock samples under acidification is more serious, but the overall difference is less. In summary, based on the chemical kinetic reaction principle [44], the main mechanisms for analyzing the chemical damage on the diorite specimens by the acidic scouring condition are:
  • Water–rock chemical mechanism
The hydrolysis reaction rate of Quartz in diorite is usually slow, and its influence is ignored in a laboratory test-time scale. The water–rock chemistry of Plagioclase and Mica in diorite is mainly considered below.
Plagioclase (Potassium feldspar, Albite, Anorthite):
  KAlSi 3 O 8 + 4 H + + 4 H 2 O 3 H 4 SiO 4 + Al 3 + + K +
NaAlSi 3 O 8 + 4 H + + 4 H 2 O 3 H 4 SiO 4 + Al 3 + + Na +
CaAl 2 Si 2 O 8 + 8 H + 2 Al 3 + + 2 SiO 2 + 4 H 2 O + Ca 2 +
Mica:
KAl 3 Si 3 O 10 ( OH ) 2 + H + + 1.5 H 2 O 1.5 Al 2 Si 2 O 5 ( OH ) 4 + K +
In an acidic solution, mineral dissolution is predominant, thus the water–rock chemical mechanism produced by the specimen is closely related to the pH of the solution. Under an acidic environment, especially the moving water state enlarges the touching of the solution with the mineral column, and at the contact interface between them, the soluble minerals react with H+ and dissolve rapidly, producing K+, Na+, Ca+ plasma [45]. These released cations’ chemical properties are very active, and they will continuously dissolve the main minerals of the rock, loosening the intergranular structure and creating microcracks and pores in the rock, resulting in the reduced strength of specimens.
2.
Mechanism of hydration erosion
According to the chemical kinetic reaction principle [44], the following chemical reactions exist between the main compounds in diorite and the NaCl acidic solution:
K 2 O + 2 H + = 2 K + + H 2 O
Na 2 O + 2 H + = 2 Na + + H 2 O
CaO + 2 H + = Ca 2 + + H 2 O
Al 2 O 3 + 6 H + = 2 Al 3 + + 3 H 2 O
  Fe 2 O 3 + 6 H + = 2 Fe 3 + + 3 H 2 O
MgO + 2 H + = Mg 2 + + H 2 O
Figure 15 and Figure 16 both confirm that, under the action of flowing acidic solutions, the above chemical reactions lead to a decrease in the content of active compounds such as K2O, Na2O, CaO, Al2O3, Fe2O3 and MgO in diorite, while the corresponding K+, Ca2+, Al3+, Fe2+, Fe3+ and Mg2+ plasma concentrations in the chemical solution are increased. In addition, Figure 15 and Figure 16 also show the variable sensitivity of different compounds in diorite to acids, with more active reactions between CaO and Al2O3 with the NaCl acidic solutions, and the concentration of corresponding ions in the chemical solution is also higher at the end of the reaction. However, in the condition of the NaCl solution with pH = 6.56, it was difficult for obvious chemical reactions to occur, and the compound content in the diorite was basically unchanged.
Therefore, under the action of acidic solutions, some mineral particles in diorite result in multiple chemical reactions with ions in the solution, which cause damage to the physical and mechanical properties of the particle skeleton. In addition, the products exist in an ionic state, and some reaction products precipitate out of the rock with the flow of the solution. Thus, the pore size and shape of the rock mineral particles and their microscopic structure and defect morphology are changed. This also changes the macroscopic physico-mechanical properties of rock, and this effect becomes more obvious with the increase in solution rate.
3.
Physical mechanism of action
In the process of groundwater flow, on the one hand, it produces physical effects such as lubrication, softening, argillization, strengthening of bound water and scouring transport of rock mass. On the other hand, it continuously results in dissolving, hydrolysis, ion exchange, redox and other chemical reactions with rock mass, which results in the mineral composition, microstructure and physical properties of the rock mass changing, and then change to its macroscopic mechanical properties. Furthermore, the erosive effect of the acidic solution on diorite leads to the reduction in the inter-mineral particle connection force and inter-particle or inter-fracture surface friction. The decrease in the pore pressure of water reduces the compressive stress between particles, thus producing a cleavage effect on micropores, which in turn causes the deterioration of the rock strength damage.

5. Conclusions

(1) The changes in the elastic longitudinal wave velocity of specimens after different pH treatments had a similar law. The wave velocity increased slowly from 0 to 20 d, increased sharply from 20 to 40 d and decreased sharply from 40 to 60 d; under different flow rates, the sample’s wave velocity first drops sharply and then tends to be flat.
(2) The influence mechanism of the solution pH and flow rate on the mechanical parameters of diorite was investigated. Acidification and scouring effects both deteriorate the mechanical parameters of specimens. When the solution pH was low and the flow rate was high, the peak strength, peak strain and elastic modulus of the specimens were reduced, and Poisson’s ratio was increased. Under different treatment conditions, the diorite experienced all four stages: (I) the crack closure and compression stage, (II) elastic deformation to stable crack expansion stage, (III) unstable crack expansion stage and (IV) post-peak expansion stage. The deformation characteristics of the specimens were more obvious under the scouring action.
(3) The degree of apparent structural damage in diorite is controlled by acid strength, flow rate magnitude and action time. Macroscopically, after the rock samples were placed in pH = 5, 3, 1 solution or flushed at 300, 600, 900 mm·s−1 for 60 d, the surface microfractures developed rapidly, the pores increased and penetrated to form “gullies”. A large number of mineral particles were lost and disappeared or were altered to small debris particles, resulting in obvious unevenness. After treatment with pH = 6.56 or 0 mm·s−1, there was no significant change in the macroscopic appearance of the rock samples. Microscopically, with the passage of time, the defects such as mineral composition, microfine structure, microporosity and microfractures of samples under different treatment conditions will change. Its internal regular crystalline form into honeycomb and then gradually develop into microfractures.
(4) The decisive factor of bedrock stability depends on whether the mechanical properties of the rock mass are stable. Through this study, it was found that due to the existence of hydrophilic minerals in diorite, as well as considering the complexity of ionic fractions in the groundwater environment, there are various physical and chemical damage mechanisms such as hydrolysis, dissolution, ion exchange and cleavage action near the contact interface between the rock interior and the water–rock. Meanwhile, due to the long-term solution flow condition, the crack structure formed later will be more complex in form, and the quantity, size and degradation of mechanical properties will be more serious over time. Therefore, it is necessary to further consider whether the bedrock of other lithology is used, or the corresponding preventive measures are made for acidification corrosion and flow scouring erosion deterioration problems.

Author Contributions

Conceptualization, W.C. and Z.Z.; methodology, L.W.; software, J.L.; validation, X.W., W.P. and X.Z.; formal analysis, Z.R.; investigation, W.W.; resources, S.X.; data curation, Y.Z. All authors have read and agreed to the published version of the manuscript.

Funding

This research was funded by the Natural Science Foundation of Hunan Province (2021JJ30265) and the National Natural Science Foundation of China (51974118 and 51774132).

Data Availability Statement

The data presented in this study are available on request from the corresponding author.

Acknowledgments

We thank the reviewers for very helpful and inspiring comments.

Conflicts of Interest

The authors declare no conflict of interest.

References

  1. Ren, F.; Zhou, Y.; He, R.; Cao, J.; Zou, K. Similarity Model Test on the Spatiotemporal Evolution Law of Deformation and Failure of Surrounding Rock-Induced Caving in Multi-Mined-Out Areas. Adv. Civ. Eng. 2021, 2021, 1224658. [Google Scholar] [CrossRef]
  2. Zhao, Z.; Guo, T.; Ning, Z.; Dou, Z.; Dai, F.; Yang, Q. Numerical Modeling of Stability of Fractured Reservoir Bank Slopes Subjected to Water–Rock Interactions. Rock Mech. Rock Eng. 2018, 51, 2517–2531. [Google Scholar] [CrossRef]
  3. Zhao, Y.; Zhang, C.; Wang, Y.; Lin, H. Shear-related roughness classification and strength model of natural rock joint based on fuzzy comprehensive evaluation. Int. J. Rock Mech. Min. Sci. 2021, 137, 104550. [Google Scholar] [CrossRef]
  4. Fan, Z.Q.; Jin, Z.-H.; Johnson, S.E. Modelling petroleum migration through microcrack propagation in transversely isotropic source rocks. Geophys. J. Int. 2012, 190, 179–187. [Google Scholar] [CrossRef] [Green Version]
  5. Zhang, H.; Guo, P.; Wang, Y.; Zhao, Y.; Lin, H.; Liu, Y.; Shao, Y. Fracture Behavior of Rock with Initial Damage: Theoretical, Experimental, and Numerical Investigations. Geofluids 2020, 2020, 8886843. [Google Scholar] [CrossRef]
  6. Wu, Q.; Weng, L.; Zhao, Y.; Zhao, F.; Peng, W.; Zhang, S. Deformation and cracking characteristics of ring-shaped granite with inclusion under diametrical compression. Arab. J. Geosci. 2020, 13, 681. [Google Scholar] [CrossRef]
  7. Weng, L.; Wu, Q.-H.; Zhao, Y.-L.; Wang, S.-M. Dynamic response and failure of rock in initial gradient stress field under stress wave loading. J. Cent. South Univ. 2020, 27, 963–972. [Google Scholar] [CrossRef]
  8. Cai, Y.Y.; Yu, J.; Fu, G.F.; Li, H. Experimental investigation on the relevance of mechanical properties and porosity of sandstone after hydrochemical erosion. J. Mt. Sci. 2016, 13, 2053–2068. [Google Scholar] [CrossRef]
  9. Xiu, Z.; Wang, S.; Ji, Y.; Wang, F.; Ren, F.; Nguyen, V.-T. The effects of dry and wet rock surfaces on shear behavior of the interface between rock and cemented paste backfill. Powder Technol. 2021, 381, 324–337. [Google Scholar] [CrossRef]
  10. Lai, L. Influence of Water-rock Chemical Erosion on the Shear Strength of Coastal Buildings. J. Coast. Res. 2020, 95, 262–266. [Google Scholar] [CrossRef]
  11. Shang, D.; Zhao, Z.; Dou, Z.; Yang, Q. Shear behaviors of granite fractures immersed in chemical solutions. Eng. Geol. 2020, 279, 105869. [Google Scholar] [CrossRef]
  12. Tang, Y.; Lin, H.; Wang, Y.; Zhao, Y. Rock slope stability analysis considering the effect of locked section. Bull. Eng. Geol. Environ. 2021, 80, 7241–7251. [Google Scholar] [CrossRef]
  13. Zhao, Y.; Zhang, L.; Wang, Y.; Lin, H. Editorial: Hydro-Mechanical Coupling and Creep Behaviors of Geomaterials. Front. Earth Sci. 2021, 8, 739. [Google Scholar] [CrossRef]
  14. Zhao, Y.; Liu, Q.; Zhang, C.; Liao, J.; Lin, H.; Wang, Y. Coupled seepage-damage effect in fractured rock masses: Model development and a case study. Int. J. Rock Mech. Min. Sci. 2021, 144, 104822. [Google Scholar] [CrossRef]
  15. Chen, W.; Wan, W.; Zhao, Y.; Xie, S.; Jiao, B.; Dong, Z.; Wang, X.; Lian, S. Aging features and strength model of diorite’s damage considering acidization. Front. Phys. 2020, 8, 455. [Google Scholar] [CrossRef]
  16. Assefa, E.; Jiang, Q.; Luo, Z.; Feng, D.; Deng, H. Study on the Creep Constitutive Model of a Sandstone Rock under the Water-Rock Interaction. Adv. Civ. Eng. 2021, 2021, 6648421. [Google Scholar] [CrossRef]
  17. Xu, J.; Zhang, J.; Liu, T. Mesoscopic Weakening Feature of Marble during Water Rock Interaction. Geotech. Geol. Eng. 2019, 37, 121–128. [Google Scholar] [CrossRef]
  18. Chen, W.; Wan, W.; Feng, T.; Zhao, Y.; Wu, Q.; Zhou, Y.; Xie, S. Mechanical characteristics of skarns from Chuanyandong orefield of Wengfu phosphate mine under various humidity ratios and stress states. Chin. J. Rock Mech. Eng. 2021, 40, 2510–2525. [Google Scholar] [CrossRef]
  19. Miao, S.; Cai, M.; Guo, Q.; Wang, P.; Liang, M. Damage effects and mechanisms in granite treated with acidic chemical solutions. Int. J. Rock Mech. Min. Sci. 2016, 88, 77–86. [Google Scholar] [CrossRef]
  20. Zhao, Y.; Liao, J.; Wang, Y.; Liu, Q.; Lin, H.; Chang, L. Crack coalescence patterns and local strain behaviors near flaw tip for rock-like material containing two flaws subjected to biaxial compression. Arab. J. Geosci. 2020, 13, 1251. [Google Scholar] [CrossRef]
  21. Zhao, Y.; Liu, Q.; Liao, J.; Wang, Y.; Tang, L. Theoretical and numerical models of rock wing crack subjected to hydraulic pressure and far-field stresses. Arab. J. Geosci. 2020, 13, 926. [Google Scholar] [CrossRef]
  22. Wu, Q.-H.; Weng, L.; Zhao, Y.-L.; Feng, F. Influence of infilling stiffness on mechanical and fracturing responses of hollow cylindrical sandstone under uniaxial compression tests. J. Cent. South Univ. 2021, 28, 2485–2498. [Google Scholar] [CrossRef]
  23. Chen, W.; Wan, W.; Zhao, Y.; He, H.; Wu, Q.; Zhou, Y.; Xie, S. Mechanical damage evolution and mechanism of sandstone with prefabricated parallel double fissures under high-humidity condition. Bull. Eng. Geol. Environ. 2022, 81, 245. [Google Scholar] [CrossRef]
  24. Leal, M.; Reis, E.; Santos, P.P. Exploring spatial relationships between stream channel features, water depths and flow velocities during flash floods using HEC-GeoRAS and Geographic Information Systems. J. Geogr. Sci. 2022, 32, 757–782. [Google Scholar] [CrossRef]
  25. Zhou, X.; Fan, L.; Wu, Z. Effects of Microfracture on Wave Propagation through Rock Mass. Int. J. Geomech. 2017, 17, 04017072. [Google Scholar] [CrossRef]
  26. Rezaei, M.; Davoodi, P.K.; Najmoddini, I. Studying the correlation of rock properties with P-wave velocity index in dry and saturated conditions. J. Appl. Geophys. 2019, 169, 49–57. [Google Scholar] [CrossRef]
  27. Wu, Q.; Weng, L.; Zhao, Y.; Guo, B.; Luo, T. On the tensile mechanical characteristics of fine-grained granite after heating/cooling treatments with different cooling rates. Eng. Geol. 2019, 253, 94–110. [Google Scholar] [CrossRef]
  28. Zhang, J.; Shen, Y.; Yang, G.; Zhang, H.; Wang, Y.; Hou, X.; Sun, Q.; Li, G. Inconsistency of changes in uniaxial compressive strength and P-wave velocity of sandstone after temperature treatments. J. Rock Mech. Geotech. Eng. 2021, 13, 143–153. [Google Scholar] [CrossRef]
  29. Varma, M.; Maji, V.B.; Boominathan, A. Influence of rock joints on longitudinal wave velocity using experimental and numerical techniques. Int. J. Rock Mech. Min. Sci. 2021, 141, 104699. [Google Scholar] [CrossRef]
  30. Fan, Z.; Eichhubl, P.; Newell, P. Basement Fault Reactivation by Fluid Injection into Sedimentary Reservoirs: Poroelastic Effects. J. Geophys. Res. Solid Earth 2019, 124, 7354–7369. [Google Scholar] [CrossRef]
  31. Motra, H.B.; Mager, J.; Ismail, A.; Wuttke, F.; Rabbel, W.; Köhn, D.; Thorwart, M.; Simonetta, C.; Costantino, N. Determining the influence of pressure and temperature on the elastic constants of anisotropic rock samples using ultrasonic wave techniques. J. Appl. Geophys. 2018, 159, 715–730. [Google Scholar] [CrossRef]
  32. Lin, H.; Lei, D.; Zhang, C.; Wang, Y.; Zhao, Y. Deterioration of non-persistent rock joints: A focus on impact of freeze–thaw cycles. Int. J. Rock Mech. Min. Sci. 2020, 135, 104515. [Google Scholar] [CrossRef]
  33. Cao, R.; Lin, H.; Cao, P. Strength and failure characteristics of brittle jointed rock-like specimens under uniaxial compression: Digital speckle technology and a particle mechanics approach. Int. J. Min. Sci. Technol. 2018, 28, 669–677. [Google Scholar] [CrossRef]
  34. Pan, J.; Ren, F.; Cai, M. Effect of Joint Density on Rockburst Proneness of the Elastic-Brittle-Plastic Rock Mass. Shock. Vib. 2021, 2021, 5574325. [Google Scholar] [CrossRef]
  35. Huang, Y.-H.; Yang, S.-Q.; Tian, W.-L.; Zeng, W.; Yu, L.-Y. An experimental study on fracture mechanical behavior of rock-like materials containing two unparallel fissures under uniaxial compression. Acta Mech. Sin. 2016, 32, 442–455. [Google Scholar] [CrossRef]
  36. Wu, Q.; Li, X.; Weng, L.; Li, Q.; Zhu, Y.; Luo, R. Experimental investigation of the dynamic response of prestressed rockbolt by using an SHPB-based rockbolt test system. Tunn. Undergr. Space Technol. 2019, 93, 103088. [Google Scholar] [CrossRef]
  37. Wu, Q.; Chen, L.; Shen, B.; Dlamini, B.; Zhu, Y. Experimental Investigation on Rockbolt Performance under the Tension Load. Rock Mech. Rock Eng. 2019, 52, 4605–4618. [Google Scholar] [CrossRef]
  38. Pan, Y.; Wang, H.; Zhao, Y.; Liu, Q.; Luo, S. Numerical Analysis of the Mud Inflow Model of Fractured Rock Mass Based on Particle Flow. Geofluids 2021, 2021, 5599748. [Google Scholar] [CrossRef]
  39. Zhao, Y.; Wang, Y.; Tang, L. The compressive-shear fracture strength of rock containing water based on Druker-Prager failure criterion. Arab. J. Geosci. 2019, 12, 452. [Google Scholar] [CrossRef]
  40. Zhao, Y.; Zhang, L.; Wang, W.; Pu, C.; Wan, W.; Tang, J. Cracking and Stress–Strain Behavior of Rock-Like Material Containing Two Flaws under Uniaxial Compression. Rock Mech. Rock Eng. 2016, 49, 2665–2687. [Google Scholar] [CrossRef]
  41. Wang, J.; Fu, J.; Song, W.; Zhang, Y. Mechanical properties, damage evolution, and constitutive model of rock-encased backfill under uniaxial compression. Constr. Build. Mater. 2021, 285, 122898. [Google Scholar] [CrossRef]
  42. Yang, H.; Lin, H.; Chen, Y.; Wang, Y.; Zhao, Y.; Yong, W.; Gao, F. Influence of wing crack propagation on the failure process and strength of fractured specimens. Bull. Eng. Geol. Environ. 2022, 81, 71. [Google Scholar] [CrossRef]
  43. Zhao, Y.; Zhang, L.; Wang, W.; Wan, W.; Li, S.; Ma, W.; Wang, Y. Creep Behavior of Intact and Cracked Limestone under Multi-Level Loading and Unloading Cycles. Rock Mech. Rock Eng. 2017, 50, 1409–1424. [Google Scholar] [CrossRef]
  44. Lu, Y.; Li, X.; Chan, A. Damage constitutive model of single flaw sandstone under freeze-thaw and load. Cold Reg. Sci. Technol. 2019, 159, 20–28. [Google Scholar] [CrossRef]
  45. Ju, Y.; Luxbacher, K.; Li, X.; Wang, G.; Yan, Z.; Wei, M.; Yu, L. Micro-structural evolution and their effects on physical properties in different types of tectonically deformed coals. Int. J. Coal Sci. Technol. 2014, 1, 364–375. [Google Scholar] [CrossRef] [Green Version]
Figure 1. On-site environment and sample preparation: (a) geological structure location map of Hanjiang River Bridge Construction Project; (b) the bedrock of pile foundation of Hanjiang Bridge; (c) bedrock cores; (d) standard specimen of diorite; (e) the NM-4B non-metallic ultrasonic detection analyzer; (f) principle of specimen wave velocity testing.
Minerals 12 00770 g001
Figure 2. Realization of dynamic water scouring environment: (a) schematic diagram of hydrodynamic scouring; (b) dynamic water flushing device; (c) MTS-815 electro-hydraulic servo rock mechanics system.
Minerals 12 00770 g002
Figure 3. Time−dependent variation curves of elastic longitudinal wave velocity of diorite under different pH values (field flow rate v = 300 mm·s−1).
Minerals 12 00770 g003
Figure 4. Time−dependent variation curve of elastic longitudinal wave velocity (including error bars) of diorite under saturations with different flow velocities (field pH value = 6.56): (a) v = 0 mm·s−1; (b) v = 300 mm·s−1; (c) v = 600 mm·s−1; (d) v = 900 mm·s−1.
Minerals 12 00770 g004
Figure 5. Uniaxial compression stress–strain curves of rock samples under different pH values (field flow rate v = 300 mm·s−1, point (O, A–D) is the starting point and end point of different stages): (a) natural drying state; (b) pH = 6.56; (c) pH = 5; (d) pH = 3; (e) pH = 1; (f) rock samples at different pH values for 60 d.
Minerals 12 00770 g005
Figure 6. Rock samples at each time point in pH = 3 environment.
Minerals 12 00770 g006
Figure 7. Uniaxial compressive strength deterioration degree time-dependent change.
Minerals 12 00770 g007
Figure 8. Uniaxial compression stress–strain curves of rock samples under different flow rates (field pH value = 6.56, point (O, A–D) is the starting point and end point of different stages): (a) natural drying state; (b) v = 0 mm·s−1; (c) v = 300 mm·s−1; (d) v = 600 mm·s−1; (e) v = 900 mm·s−1; (f) rock samples at different flow rates for 60 d.
Minerals 12 00770 g008aMinerals 12 00770 g008b
Figure 9. Rock samples at each time point in v = 900 mm·s−1.
Minerals 12 00770 g009
Figure 10. Uniaxial compressive strength deterioration degree time−dependent change.
Minerals 12 00770 g010
Figure 11. Elastic modulus and Poisson’s ratio (including error bars) of diorite under saturations with different pH values for 60 d (field flow rate v = 300 mm·s−1).
Minerals 12 00770 g011
Figure 12. Elastic modulus and Poisson’s ratio (including error bars) diorite under saturations with different flow rates for 60 d (field pH value = 6.56).
Minerals 12 00770 g012
Figure 13. Scanning electron microscope analysis and energy spectrum analysis of diorite before and after treatment with different pH values (field flow rate v = 300 mm·s−1): (a) natural drying state; (b) pH = 6.56; (c) pH = 5; (d) pH = 3; (e) pH = 1.
Minerals 12 00770 g013aMinerals 12 00770 g013b
Figure 14. Scanning electron microscope analysis and energy spectrum analysis of diorite before and after scouring at different flow velocities (field pH value = 6.56): (a) natural drying state; (b) v = 0 mm·s−1; (c) v = 300 mm·s−1; (d) v = 600 mm·s−1; (e) v = 900 mm·s−1.
Minerals 12 00770 g014aMinerals 12 00770 g014b
Figure 15. X-ray diffraction pattern of diorite before and after acid solution scouring: (a) under different pH conditions (field flow rate v = 300 mm·s−1); (b) under different flow rates (field pH value = 6.56).
Minerals 12 00770 g015
Figure 16. Comparison of major mineral contents in specimens before and after 60 d of diorite: (a) under pH = 1 condition (field flow rate v = 300 mm·s−1); (b) under v = 900 mm·s−1 flow rate (field pH value = 6.56).
Minerals 12 00770 g016
Table 1. Mineral composition of diorite.
MineralsPlagioclaseDark MineralsQuartzOre MineralsOthers
IngredientsPotassium feldspar
Albite Anorthite etc.
FeO Fe2O3
MgO Mica etc.
CaOAl2O3
Na2O K2O etc.
Mass
percentage
51–57%21–32%17–20%3–5%1–2%
Table 2. Related physical parameters of diorite for test.
Sample NumberHeight
/mm
Diameter
/mm
Mass
/g
Volume
/cm3
Porosity
/%
Bulk Density
g/cm3
Longitudinal Wave Velocity
/m s−1
Natural Water Content/%Saturated Moisture Content/%
S-1100.0250.01534.18188.915.272.8646930.923.36
S-2100.0250.02538.07189.125.352.7943100.893.19
S-3100.0449.84536.32189.075.242.8141350.913.25
S-4100.0149.93535.78188.875.202.8540010.933.37
S-5100.0350.05538.03189.234.982.8247360.883.37
S-6100.0550.03536.51189.334.972.8443420.863.29
S-7100.0249.79538.03188.645.192.8048780.793.30
S-8100.0349.97532.35189.055.222.8148330.873.24
S-9100.0450.04537.14189.155.252.8544070.933.36
S-1099.9850.06535.68188.975.172.8140920.923.38
S-1199.9749.86537.91188.824.962.7641370.913.27
S-12100.0249.92529.68189.074.782.7842860.873.31
S-13100.0449.76532.26188.565.152.8340250.863.34
S-14100.0150.02530.85189.315.232.8440120.913.28
S-1599.9750.04534.43188.795.262.7942250.883.31
S-1699.9650.03530.28189.235.192.8245320.773.32
Table 3. Chemical solution for test.
Solution FractionConcentration/(mol·L−1)pH Value
NaCl0.011, 3, 5
On-site groundwater solution6.56
Table 4. Average elastic longitudinal wave velocity and damage factor of diorite under saturations with pH values of 6.56, 5, 3 and 1 (flow rate v = 300 mm·s−1).
pHElastic Longitudinal Wave Velocity at Each Time Point/(m·s−1)Dp/%
0102030405060
6.5646934708473247934880468045852.30
543424368438244814594438541045.48
341374154419642864384408437948.29
1402540394075414242133867347713.61
Table 5. Diorite’s damage factor of elastic wave velocity under saturations with different flow velocities for 60 d.
Sample NumberFlow Rate v/(mm·s−1)vsp/(m·s−1)vfp/(m·s−1)Dp/%
S-10445543013.46
S-2431041783.06
S-3413541050.73
S-4400139690.80
S-5300473743667.83
S-6466044165.24
S-7487944937.91
S-8483445984.88
S-9600440841196.56
S-104092364011.05
S-114178374410.39
S-12428639028.96
S-139003891330814.98
S-143998345013.71
S-154225355715.81
S-164533368618.69
Table 6. Elastic modulus and Poisson’s ratio of 60 d diorite at different pH values.
Rock
Sample State
Natural
Drying State
pH = 6.56pH = 5pH = 3pH = 1
Average elastic modulus/GPa8.235715.333293.970023.313983.27747
Average
Poisson’s ratio
0.152580.155420.160930.168450.17682
Table 7. Elastic modulus and Poisson’s ratio of 60 d diorite at different flow rates.
Rock
Sample State
Natural
Drying State
v = 0 mm·s−1v = 300 mm·s−1v = 600 mm·s−1v = 900 mm·s−1
Average elastic modulus/GPa30.8827229.0867026.7998725.7785924.29699
Average
Poisson’s ratio
0.376520.435420.548850.663450.81369
Table 8. Main element mass and atomic number content of diorite before and after acidification.
ParameterCOSiAlKCaFeMgNaCl
Mass
content/%
Dry state9.2231.6922.5111.638.765.664.363.681.650.86
pH = 6.5612.2629.9220.359.5411.326.123.682.822.361.63
pH = 510.6632.0824.538.438.635.063.152.042.992.43
pH = 38.7134.3821.6511.576.034.122.561.745.353.89
pH = 111.5630.8526.347.695.283.862.021.565.944.90
Atomic
number
content/%
Dry state15.6840.4616.378.804.572.881.563.071.460.50
pH = 6.5620.8538.2014.807.225.913.111.312.352.090.95
pH = 518.1340.9517.846.384.502.571.131.702.651.41
pH = 314.8143.8915.748.763.152.100.911.454.742.26
pH = 119.6639.3819.155.822.761.960.721.305.272.85
Table 9. Main element mass and atomic number content of diorite before and after scouring effect.
ParameterCOSiAlKCaFeMgNaCl
Mass
content/%
Dry state10.1529.3623.4112.079.165.334.463.721.430.91
v = 0 mm·s−113.2027.5121.6810.8710.565.083.323.062.791.93
v = 300 mm·s−111.7128.6422.689.2611.464.733.012.323.542.65
v = 600 mm·s−112.8427.8420.9411.739.654.031.981.665.084.25
v = 900 mm·s−115.0528.1220.3510.957.941.670.840.567.746.78
Atomic
number
content/%
Dry state17.2637.4817.029.134.782.711.593.101.270.53
v = 0 mm·s−122.4535.1215.768.235.512.581.192.552.471.12
v = 300 mm·s−119.9236.5616.497.015.982.411.081.933.141.54
v = 600 mm·s−121.8435.5415.238.885.042.050.711.384.502.47
v = 900 mm·s−125.6035.9014.808.294.140.850.300.476.863.94
Publisher’s Note: MDPI stays neutral with regard to jurisdictional claims in published maps and institutional affiliations.

