Article

Influence of Clogging at the Filtration on Analysis of Dissolved and Particulate Forms of Chemical Elements in Boreal Rivers of the Russian Far East

by
Vladimir Shulkin
1,*,
Natalia Bogdanova
1 and
Evgeniy Elovskiy
2
1
Pacific Geographical Institute, Far Eastern Branch Russian Academy of Sciences, 7, Radio Str., Vladivostok 690041, Russia
2
Far Eastern Geological Institute, Far Eastern Branch Russian Academy of Sciences, 159, 100-Let, Vladivostok 690022, Russia
*
Author to whom correspondence should be addressed.
Submission received: 1 April 2022 / Revised: 4 June 2022 / Accepted: 14 June 2022 / Published: 17 June 2022

Abstract

:
Clogging is inevitable when membranes with 0.45 µm pore size are used for the separation of particulates from dissolved/colloidal forms in river water. This can lead to a shift in water quality assessment and evaluation of geochemical fluxes. We studied the influence of clogging on the concentration of trace elements, major anions, nitrate, and dissolved organic carbon (DOC) in the filtrates after a sequential pass from 0.1 to 0.5 L of river water samples through the same 47 mm membrane with 0.45 µm pore size. These experiments were carried out for the typical boreal rivers of the Russian Far East, including the biggest one, Amur R., with different quantities of suspended solids (SS) and anthropogenic load. The concentration of the major anions, nitrate, Si, DOC, and such trace elements as Li, B, Ni, Cu, As, Sr, Rb, Mo, Ba, U did not depend on the water volume filtered. However, filterable Al, Fe, Ti, Pb, Mn, Co, and most REEs showed a notable decrease in concentration at an increase in volume filtered, at more than 100–200 mL of river water. Clogging membranes with retention of colloids <0.45 µm was suggested as a reason for such a decrease. The quantity of suspended solids and their grain size are the major factors that control clogging itself. Still, the influence of clogging on the concentration of filterable forms depends on the share of coarse colloidal forms. Moreover, retention of colloids <0.45 µm by the clogged membrane can bias the assessment of particulate forms. Surpluses of particulate Fe, Al, Mn, Co due to clogging decline from 13–26% to 2–6% of suspended forms of these metals at the growth of SS in river waters from 10 mg/L to more than 50 mg/L. For particulate REEs, the share due to membrane clogging varies non-linearly from 2–9% to 23–39%, depending on the initial concentration of filterable forms of REEs in the river waters.

1. Introduction

The variety of size-fractionated forms of chemical elements in a polydispersal system of river water can be divided into dissolved (<0.001 μm), colloidal (0.001–1 μm), and suspended particulate (>1 μm) forms [1]. However, in monitoring the quality of river waters by their chemical composition, dissolved and suspended/particulate forms of chemical elements are distinguished and separated most often by filtration through filters with a pore size of 0.45 μm [2]. These “dissolved” and “suspended” (particulate) forms differ considerably in both bioavailability and migratory capacity in rivers. Dissolved forms are easily assimilated by organisms and are capable of long-distance transport in the river stream. In contrast, suspended forms are less bioavailable and prone to sedimentation and accumulation in bottom sediments. The place of colloids is not defined clearly at this dichotomy division. Part of the colloidal forms (0.001–0.45 μm) are classified and determined as dissolved, and the coarse colloids (0.45–1.0 μm) are categorized as suspended forms. The vital role of colloidal and particulate forms is a well-known peculiarity in the migration of many chemical substances in rivers, including trace elements [3]. The correct and unambiguous separation of dissolved, colloidal, and suspended forms is important for assessing the water quality and the study of dissolved and sedimentary material migration and transformation in river runoff.
Several problems are raised with filtration as a method to separate particulate, colloidal, and dissolved forms of chemical elements, and especially trace elements in river waters. Contamination during sampling and analysis was identified and overcome in general more than 25 years ago by implementing clean techniques during sampling and processing, field blanks, and improvement in the analytical methods [4]. However, methodological efforts continue to enhance the consistency of sampling and treatment procedures [5]. The problem connected with the distinction of colloids of different sizes from truly dissolved forms is successfully decided by applying tangential flow ultrafiltration [6], especially by ultrafiltration in combination with dialysis techniques [7,8,9,10,11]. Field-flow fractionation techniques combined with ICP-MS also provide valuable detailed data on trace element distribution among organic and Fe-associated colloids in the range of 0.3 KDa to 0.45 µm [12,13].
Another problem is connected with the uncertainty in the separation between particulate and colloidal forms during filtration through the 0.45/0.22 µm membrane filters due to the clogging of pores. Colloids smaller than 0.45/0.22 µm are retained in such cases, and the filterable form concentration is reduced in a poorly predicted manner. This fact attracted considerable attention and discussion more than 20 years ago [14,15,16]. At the same time, according to the last review [17], the filtration artifacts due to clogging of 0.45 µm filters continue to be a problem in obtaining a reliable concentration of filterable forms of such metals as Al and Fe. A recent study of the possible influence of clogging during filtration of the waters from some boreal rivers of the Russian Far East has confirmed a notable decrease not only in Fe and Al, but also in Ti, Pb, Zr, Hf, Y, REEs in the filtrates after 0.45 µm membranes, if more than 100–200 mL of samples processed [18]. Minimizing the sample volume down to 50 mL is one option to solve the problem [5,19]. However, larger volume (0.5–1.0 L) samples are usually used to separate the dissolved/colloidal from the particulate forms of chemical elements in river waters by filtration through the 0.45/0.22 µm membranes [7,8,9]. Some regulators (e.g., USGS) recommend using capsule/cartridge filters with high filtering capacity that are much less affected by the clogging [2]. Other countries [20,21] still widely use 0.45/0.22 µm membranes susceptible to clogging at the separation of dissolved and suspended forms during routine monitoring.
Moreover, filtration through the membrane of 0.45 µm with the following analysis of the material collected continues to be one of the most common methods for assessing the quantity and quality of riverine suspended solids [20,21]. In such case, the colloids < 0.45 µm retained by the clogged membranes will be analyzed as suspended forms. There is plenty of data on the effect of clogging on the concentration of dissolved and colloidal forms of chemical elements in the filtrates [14,16]. However, the influence of the different controlling factors is not studied enough [17,18]. According to our knowledge, the impact of clogging on the determination of suspended forms on the membranes has not been evaluated yet.
The first objective of this paper is to estimate the influence of the clogging of 47 mm membrane filters, with pore size 0.45 µm, on the concentration of a range of trace elements, as well as major ions, nutrients, dissolved organic carbon (DOC) in the filtrates, depending on the volume of river water filtered. Based on these results, we will outline to what degree clogging affects the concentration of filterable forms of trace elements used in the water quality assessment. Second, we try to summarize the major factors controlling the clogging itself and its impact on the different chemical elements. The third goal of this paper is to assess the influence of colloids retained by the clogged membranes on the determination of particulate forms of trace elements. This assessment will compare the reduction of their concentration in the filtrates with the content of particulate forms at the different levels of suspended solids.

2. Material and Methods
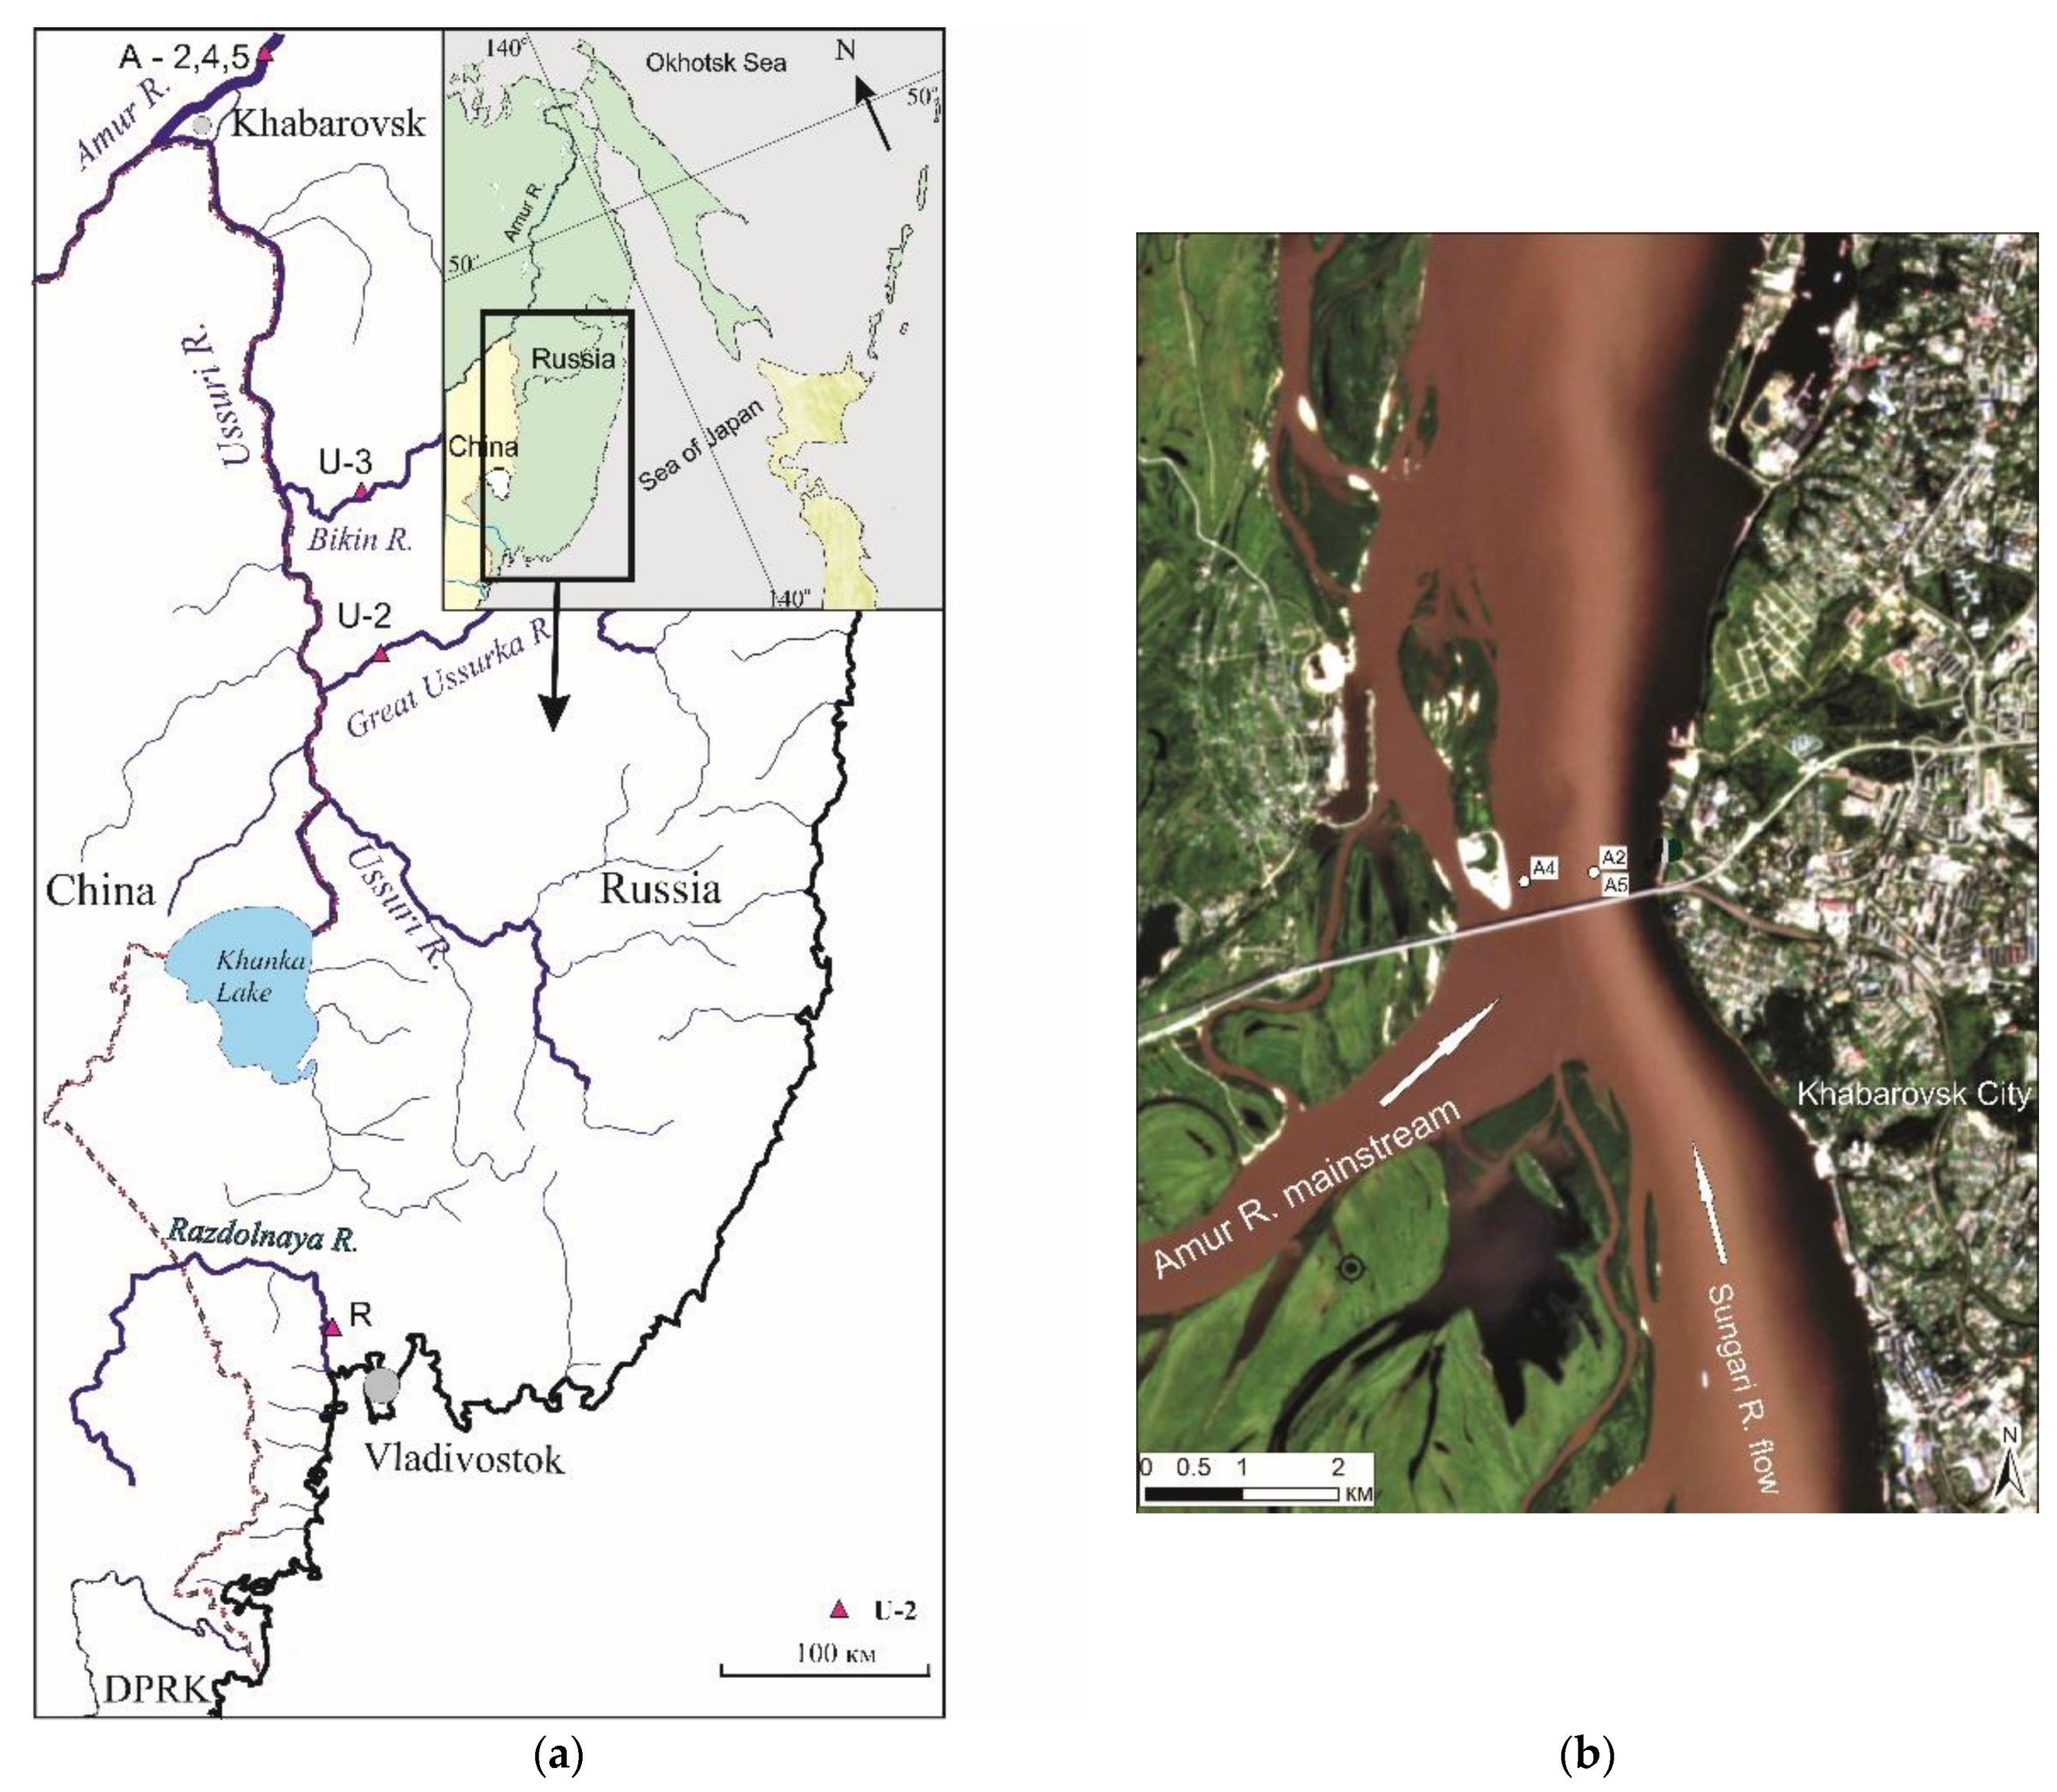
2.1. Study Area

The Russian Far East is a vast region stretching for more than 4000 km from the border with Korea in the south to the Chukchi Peninsula in the north. High-latitude boreal and subarctic climatic conditions with annual precipitation below 600 mm are typical for the region’s north part. Small- and medium-sized rivers are typical there. The temperate, boreal area that is a subject of study in this paper covers the south part of the Kamchatka peninsula, Sakhalin Is., Khabarovsk, and Primorye regions with more abundant annual precipitation up to 1000 mm and more copious river runoff. Besides small- and medium-sized rivers, this temperate, boreal area is drained by the huge Amur R. with a watershed of 1856 × 103 km2 (8th world rank) and an annual runoff of 344 km3 (14th world rank) [22].
Our study was carried out using the water samples from the downstream of Razdolnaya R., a typical medium-sized boreal river on the western watershed of the Sea of Japan, downstream of Bikin R. and Great Ussurka R., big tributaries of Ussury R. inputting to the Amur R. near Khabarovsk city, and from the middle stream of Amur R. itself, the biggest river of the region (Figure 1).
Razdolnaya R. is a transboundary river with a watershed of 16.8 × 10³ km2 and an average annual runoff of 2.37 km3. In total, 60% of the upstream watershed is situated within China, and 40% of the downstream is within Russia. Watershed bedrock is presented by a complex of sandstones, siltstones, basaltic intrusions, and unconsolidated products of their weathering within the hilly forested landscapes. All riparian zones and the adjoining valleys of tributaries are the areas with developed agricultural land use. Along with wastes from several middle-sized cities, it leads to the deterioration of water quality in terms of elevated content of the nutrients, suspended solids, and some metals [23,24]. The sampling point was situated downstream of Razdolnaya R. (Lat. 43°33′ N, Long. 131°53.25′ E), about thirty km northward of the river mouth. Five times from February to November, this point was sampled to study the seasonality in the clogging influence on the analysis of dissolved/colloidal and particulate forms.
The Ussuri R., together with its tributaries, the Great Ussurka and Bikin rivers, is one of the main right tributaries of the Amur R. Watersheds of Great Ussurka R. and Bikin R. before merging with Ussuri R., which are are 29.5 × 10² and 21.4 × 10² km2, respectively, with average annual water runoff of 11.07 and 7.51 km3. The bedrock composition of the Ussuri R. watershed is dominated by the volcanic sedimentary varieties of the cretaceous Sikhote–Alin volcanic belt. Unlike Razdolnaya R., watersheds of the Great Ussuri R. and Bikin R. are presented by the low and middle mountains covered by the coniferous–deciduous forests (taiga). Economic development of this part is weak: agricultural lands do not exceed 1.2% of the total watershed of the upper and middle stream of Ussuri R., compared with 11.5% for Razdolnaya R. Moreover, a sizeable part of the floodplain of the Bikin R is occupied by wetlands. Great Ussurka R. (U-2) and Bikin R. (U-3) were sampled in August 2019 for the study of the clogging influence at the high water regime, but with modest content of suspended solids (Table 1).
Amur R. is also a transboundary river, with 53% of the watershed in the Russian and 45% in the Chinese territory. The remaining 2% of the Amur R. upstream belongs to Mongolia. The bedrock composition of the Amur R. watershed includes practically all varieties of sedimentary and volcanic rocks due to the huge size of the basin. The majority of the watershed within Russia is presented by mountainous forest landscapes with a limited population. In contrast, a substantial portion of the biggest right tributary of the Amur R. and Sungari R. flows through the Northeast Plain of Heilongjiang Province of China with a population of 38 × 106 people and intensive agriculture and industrial development. This leads to the different chemical composition of Sungari R. compared with the mainstream of Amur R. Distinct flows presented by the major stream of Amur water and more turbid flow from the Sungari R. were clearly observed even 200 km downstream of the Sungari R. input to the Amur R. near the large city of Khabarovsk, where the sampling site was situated (Figure 1b). A sampling of the middle stream of Amur R. was carried out during the ice cover period in February 2020 (A-2) and during the summer high water in August 2020 (A-4, A-5) for the study of the clogging effect at the contrasted water regime and for variability in summertime due to the influence of the Sungari R.
The general characteristics of the samples studied are presented in Table 1. Water sampled in wintertime during a low water regime (R-201, A-2) has elevated conductivity (EC) due to a higher mineralization and concentration of major anions and nitrates but has diminished, suspended solids (SS). During the high water regime in summer, boreal rivers have elevated suspended solids and raised dissolved organic carbon (DOC). Such general seasonality in chemical composition is explained by the seasonal changes in atmospheric and groundwater, and soil water sources in the boreal river runoff [25].

2.2. Sampling, Processing, and Filtration

Water sampling was carried out from the riverbank 2–3 m offshore at a 0.3 m depth using a pre-washed PE container attached to a fiberglass pole. A rubber boat was used for the sampling at the cross-section of the Amur R. Before filling, pre-cleaned containers were rinsed several times with sampled water. Containers were packed into the hermetic cooled plastic bags for transportation to the lab. Processing and filtration were carried out within several hours after sampling upon returning to the laboratory in the clean laminar flow bench CLEATECH® with HEPA filtered air. All filters and filter holders were thoroughly washed and rinsed with 0.1M HCl, and 3–4 times with plenty of Milli Q water.
A one-liter subsample was filtered through the pre-cleaned Pall® GWV capsule filter 0.45 µm using MasterFlex® peristaltic pump. First, 50–100 mL of capsule filtrate was used to rinse the 30 mL glass bottles for the DOC, major ions, and nutrients analysis, and 50 mL acid-cleaned PP capped tubes for the trace elements analysis. Subsamples in the PP tubes were acidified by ultrapure HNO3 to pH~2 for further ICP-MS analysis. The results of these filtrates are considered as a concentration of dissolved and colloidal forms < 0.45 µm (Ci). The large filtration capacity of the capsule (~700 cm2) pays no attention to the clogging, and it is confirmed by the constant rate of filtration of at least several liters of river water. Last decade, we used such capsule filters to study the chemical composition of the boreal rivers of the Russian Far East [26,27]. Filtration of 250 mL Milli Q water was used as a procedural blank to assess possible contamination during the filtration procedure.
Another subsample was used to study the influence of membrane clogging on the composition of filtrates. For this purpose, the 500 mL water sample was filtered in five 100 mL portions through the pre-weighted 47 mm Millipore Durapore membrane with a pore size of 0.45 µm using a polycarbonate Sartorius filter holder. Already pre-cleaned holders with filter were rinsed twice with Milli-Q (18 Mom) water directly before filtration with attaching gentle vacuum (0.2–0.3 bar) for drying and further filtration. Five 100 mL portions were consecutively filtered through the same membrane, and each filtrate portion was analyzed as a separate sample. The initial subsample was agitated before each filtration step. Filtration time (t, min) was registered by a stopwatch to control the clogging process and to calculate filtration rate v (mL/min) = 100/t. Then, 30–50 mL of each filtrate portion was used to rinse the sample storage bottles. Filtrates for the major anions, nutrients, and DOC were collected in the 30 mL glass bottles, trace elements in the 50 mL acid-cleaned PP capped tubes with the following acidification by ultrapure HNO3 to pH~2. Filtration of 100 mL Milli-Q water was used as a procedural blank to assess possible contamination during the filtration procedure.
Membranes after filtration with retained suspended solids were used for the determination of the amount and chemical composition of suspended matter (Cp). A volume of 500 mL was often enough to obtain 20–100 mg of suspended matter, but 1 L samples were used at the minor content of suspended solids (2.6–8.1 mg).
All bottles and tubes used for the sampling and sample storage and filtration equipment (holders, tubes) were cleaned by detergent wash, soaking in 1 M HCl, thoroughly rinsed with distilled water, then by Milli-Q water, dried, and stored in clean laminar bench. Before each new sample, the filtration system was rinsed with Milli-Q water, 0.1 M HCl, and again with Milli-Q water. Persons involved in the sampling and filtration procedures used disposable plastic gloves.

2.3. Analysis of Water and Suspended Solids

The instrument YSI Pro Plus® measured temperature, pH, and conductivity (EC) as a measure of total mineralization at the sampling points. The change in pH during filtration was checked by a Mettler Toledo Seven Compact pH-meter with a combined electrode calibrated against buffer solutions (pH of 4.01 and 6.86 at 25 °C). The accuracy of pH measurements was ±0.02 pH units. Filtered samples for DOC (dissolved organic carbon), major anions (SO42−, Cl), and nutrients (NO3) were stored in the refrigerator before the analyses. DOC was analyzed by high-temperature catalytic oxidation using carbon analyzer Shimadzu TOC cpn with an uncertainty better than 3%. The DOC blanks of filtrate did not exceed 0.1 mg/L, which is less than 5% of the DOC values in the studied river waters. SO42−, Cl, and NO3 were analyzed by ion-chromatography on Shimadzu LC-10 with an uncertainty 4–5%. Suspended solids (SS) content was evaluated by the weighting of Millipore membranes after filtration of 0.5–1 L water samples and drying at 80 °C. The grain size of the suspended solids (SS) of Razdolnaya R. and Amur R. was measured by laser scattering with the instrument Fritsch Analizette 22 Nano in the samples with SS content of more than 100 mg/L.
The concentrations of filterable forms of trace elements were analyzed in the acidified filtrates for the range of elements from Li to U by Agilent 7700× inductively coupled plasma mass spectrometer (DVGI, FEBRAS) with In as internal standard. Highly diluted acid digested standards of bottom sediment BCSS-1, and CRM-TMDW-A (certified reference material trace metals in drinking water, HighPurity Standards, USA) were measured every 20 samples to check the accuracy and reproducibility of the ICP-MS analysis. The difference with certified values did not exceed 15% and was considered acceptable. The results of analysis of the filtration blanks were less than 10% of the concentration in the samples of most trace elements except Zn with filtration blank compared with the concentration of Zn in filtrate samples (0.2–0.4 µg/L). For this reason, Zn is not discussed further in this paper. Some apparently contaminated results for the filterable forms Pb, Cr, and Cd were also excluded from the data analysis.
The concentrations of elements in the river-suspended solids were analyzed by AAS for Fe, Mn, Cu, Ni, Pb, Cd, and by the ICP MS method for the elements from Li to U. Suspended solids on the filter were fully digested by HF-HNO3 mixture and diluted by 2% HNO3 before ICP MS analysis. A small amount (30 mg) of standard bottom sediments (BCSS-1 and CRM 8704) was digested in the same way and analyzed along with every 20 samples. The difference with certified values did not exceed 15%. A clean filter without suspended matter was acid digested and analyzed as a blank.
The significance of the decline trends in the concentration of elements in filtrates at the increase in volume filtered, and the difference in clogging effect between chemical elements was assessed by the Mann–Kendall non-parametric test using a statistical package PAST3 [28].

2.4. Evaluation of the Loss of Filterable Forms Due to Clogging, and Share of Colloids Retained during Clogging in the Content of Particulate Forms in the 0.45 µm Membranes

Several ways could assess the loss of filterable forms due to clogging. It is possible to use the difference between concentrations after filtration of the first 100 mL portion and the last one: ΔCi = C100 − C500, and to normalize this difference by the concentration Ci of filterable forms after capsule filter practically without clogging: Ki = ΔCi/Ci [18].
Another way to estimate the influence of clogging on the concentration of filterable forms is to compare the amount in all five portions of filtrates (Vj × Σ Cj) with content in the filtrates after the capsule without clogging (Ci × Vi) and to present it as a share of losses (L clog) due to clogging during filtration of 0.5 L of sample: Lclog = (Ci × Vi − Vj × Σ Cj )/ Ci × Vi with a range from 0 to 1. Such an approach is used in this paper.
The amount of colloidal forms retained by clogged membranes after filtration depended on the volume of the sample filtered and was assessed by the decrease in concentration of chemical elements in the filtrates due to clogging: Aclog = Ci × Vi − Vj × Σ Cj, where Ci—concentration in the filtrate < 0.45 µm without clogging; Vi—overall volume of sample filtered (0.5 or 1.0 L); Vj—the volume of portion at the successive filtration (0.1 L); Cj—concentration in the successive portions of filtrates. Aclog should be normalized by the Vi for the direct comparison with the concentration of elements in the dissolved/colloidal and suspended forms in the river waters.
Comparison of the concentration of colloidal forms retained at clogging (Aclog) with the overall quantity of particulate forms determined after analysis of the membranes (Cp) estimates the share of particulates due to the clogging of the membranes: Aclog/Cp.

3. Results

3.1. Concentration of Filterable and Particulate Forms of Trace Elements in River Waters

Data on the concentration of the filterable forms of trace elements obtained after capsule filters 0.45 µm practically not affected by clogging are presented in Table 2 in comparison with data on <0.45 µm fraction for the permafrost free rivers of the West Siberian Lowlands [11] and world-averaged data for rivers [3]. For many elements (e.g., Li, B, Sc, Ti, Ni, Cu, As, Rb, U, Mn, Co, V, Cr), ranges of concentrations in the boreal rivers of the Russian Far East were close to those of the West Siberian Lowland rivers and world averages regardless of season, although for some elements (Li, B, Mn), seasonal changes are obvious. Our data for these elements are also similar to the previous studies for Amur R. [29]. At the same time, the concentrations of filterable Al, Fe, and REEs observed in the rivers studied compared with the world average were rather diverse depending on the season. At the low water regime and low suspended solids in winter, the concentration of these elements was close to the world average [3]. However, at the high water regime and with an elevated content of suspended solids (SS), the concentrations of filterable forms of Al, Fe, and REEs were 2–3 times higher than the world average. An increased content of dissolved organic carbon (DOC) up to 14.7 mg/L in Bikin R. was also accompanied by elevated concentration of filterable Fe, Al, and REEs compared with the world average and rivers of the West Siberian Lowland (Table 2).
The concentrations of trace elements in the river particulates (on the dry weight basis) are listed in Table 3 in comparison with data for suspended solids of the permafrost-free west Siberian lowland rivers (WSLR) [30] and world average [31]. There is a notable seasonal difference in the chemical composition of suspended solids in the rivers studied. Still, the general commonality with world-averaged data for alumosilicate riverine suspended solids [31] is obvious. However, our data are characterized by an increased level of Al, Pb, and REEs compared with suspended solids of the West Siberian lowland rivers, having a larger share of organic matter [30].

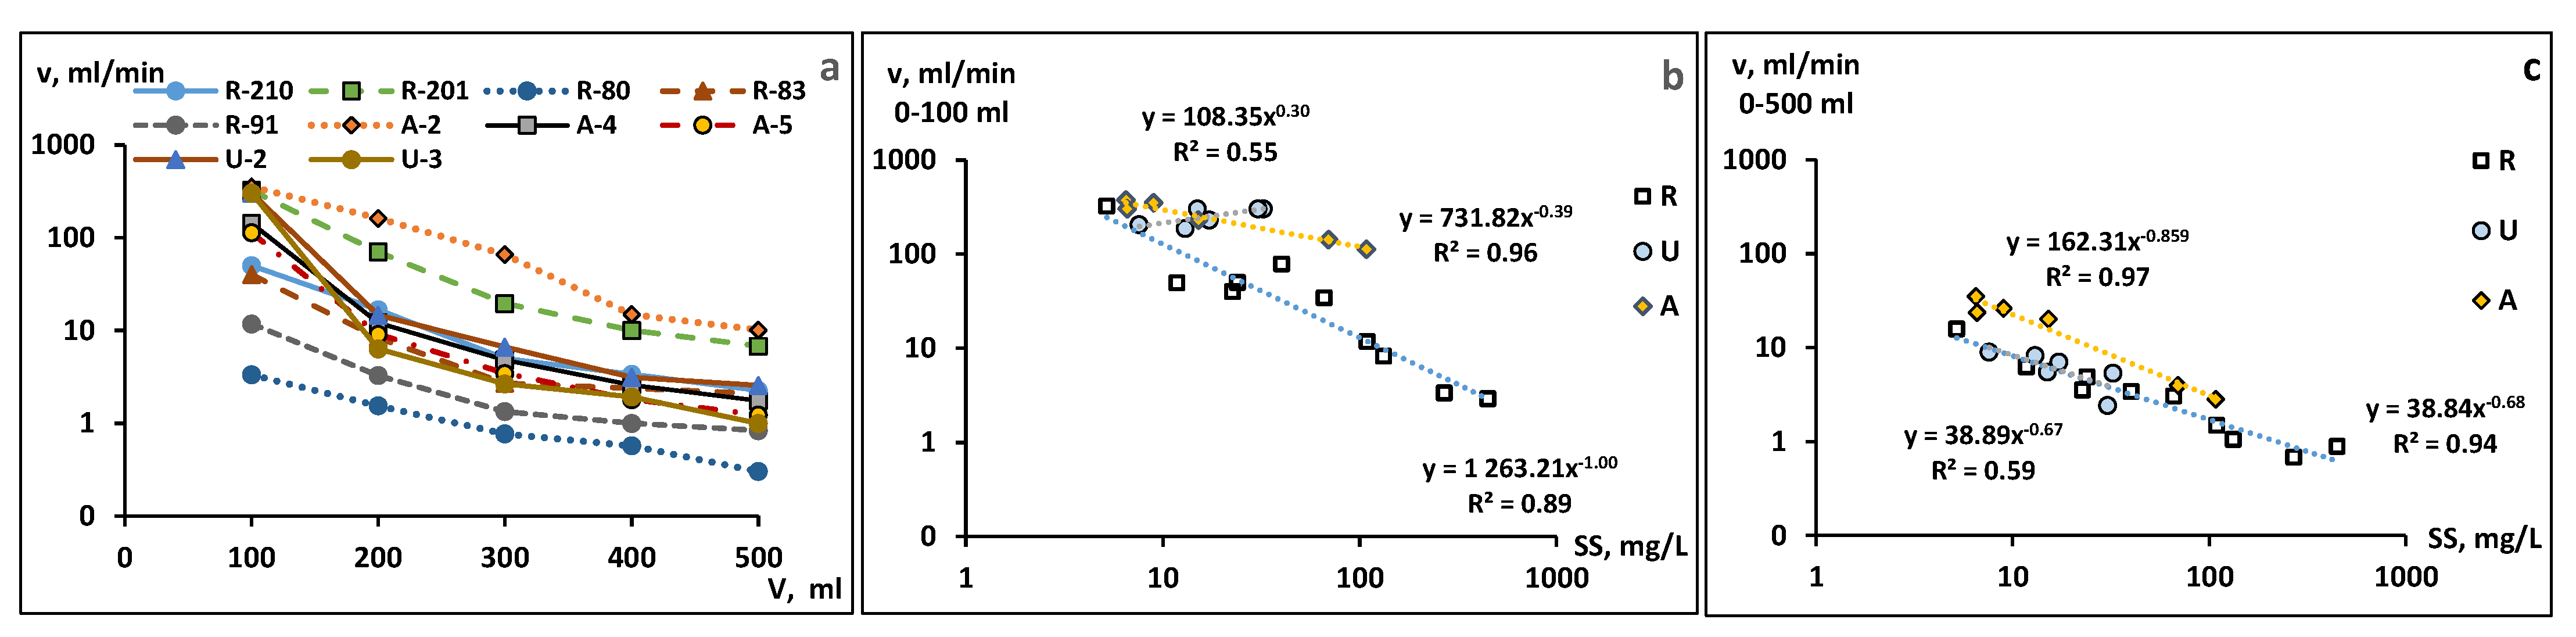
3.2. Clogging during Filtration through Membrane Filters

The filtration rate of 2–3 L of river water samples did not change using the capsule filters Pall GWV with a pore size of 0.45 µm, reflecting the lack of notable clogging. However, the filtration rate through the 0.45 µm 47 mm membrane begins to decline even after the first 100 mL, as is registered by increased filtration time (Figure 2a).
Clogging becomes sizeable after filtration of the 100–200 mL. After filtration of 400–500 mL, the filtration rate drops 5–15 times compared with the initial portions. Within the same river (e.g., Razdolnaya R.), the growth of suspended matter content leads to a faster decrease in the filtration rate, but the dynamic of this drop is different for the rivers studied. It is especially notable at the concentration of suspended solids of more than 50 mg/L (Figure 2b). Water from Amur R. with suspended solids, having pelitic (<0.01 mm) fraction less than 80%, shows one order higher filtration rate than the water of Razdolnaya R. where suspended solids contain 92–98% of fractions < 0.01 mm (Figure 2b). The difference between rivers is smoothed out by filtering the entire sample volume of 500 mL (Figure 2c).

3.3. Influence of Clogging on the Concentration of Major Ions, Nutrients, DOC

The behavior of the major anions and DOC at clogging of the membranes was tested for certain samples only because a negligible response of major ions to the clogging has been shown clearly elsewhere [32]. Our previous results for the Razdolanya R. and for Tumen R. with different mineralization and content of suspended matter support it [18]. Concentrations of major anions (sulfate, chloride, and nitrate ions) and DOC continue to be the same in the filtrates, with coefficients of variation (CV) less than 10% regardless of the water volume filtered. The difference between capsule and membrane filters was also negligible.

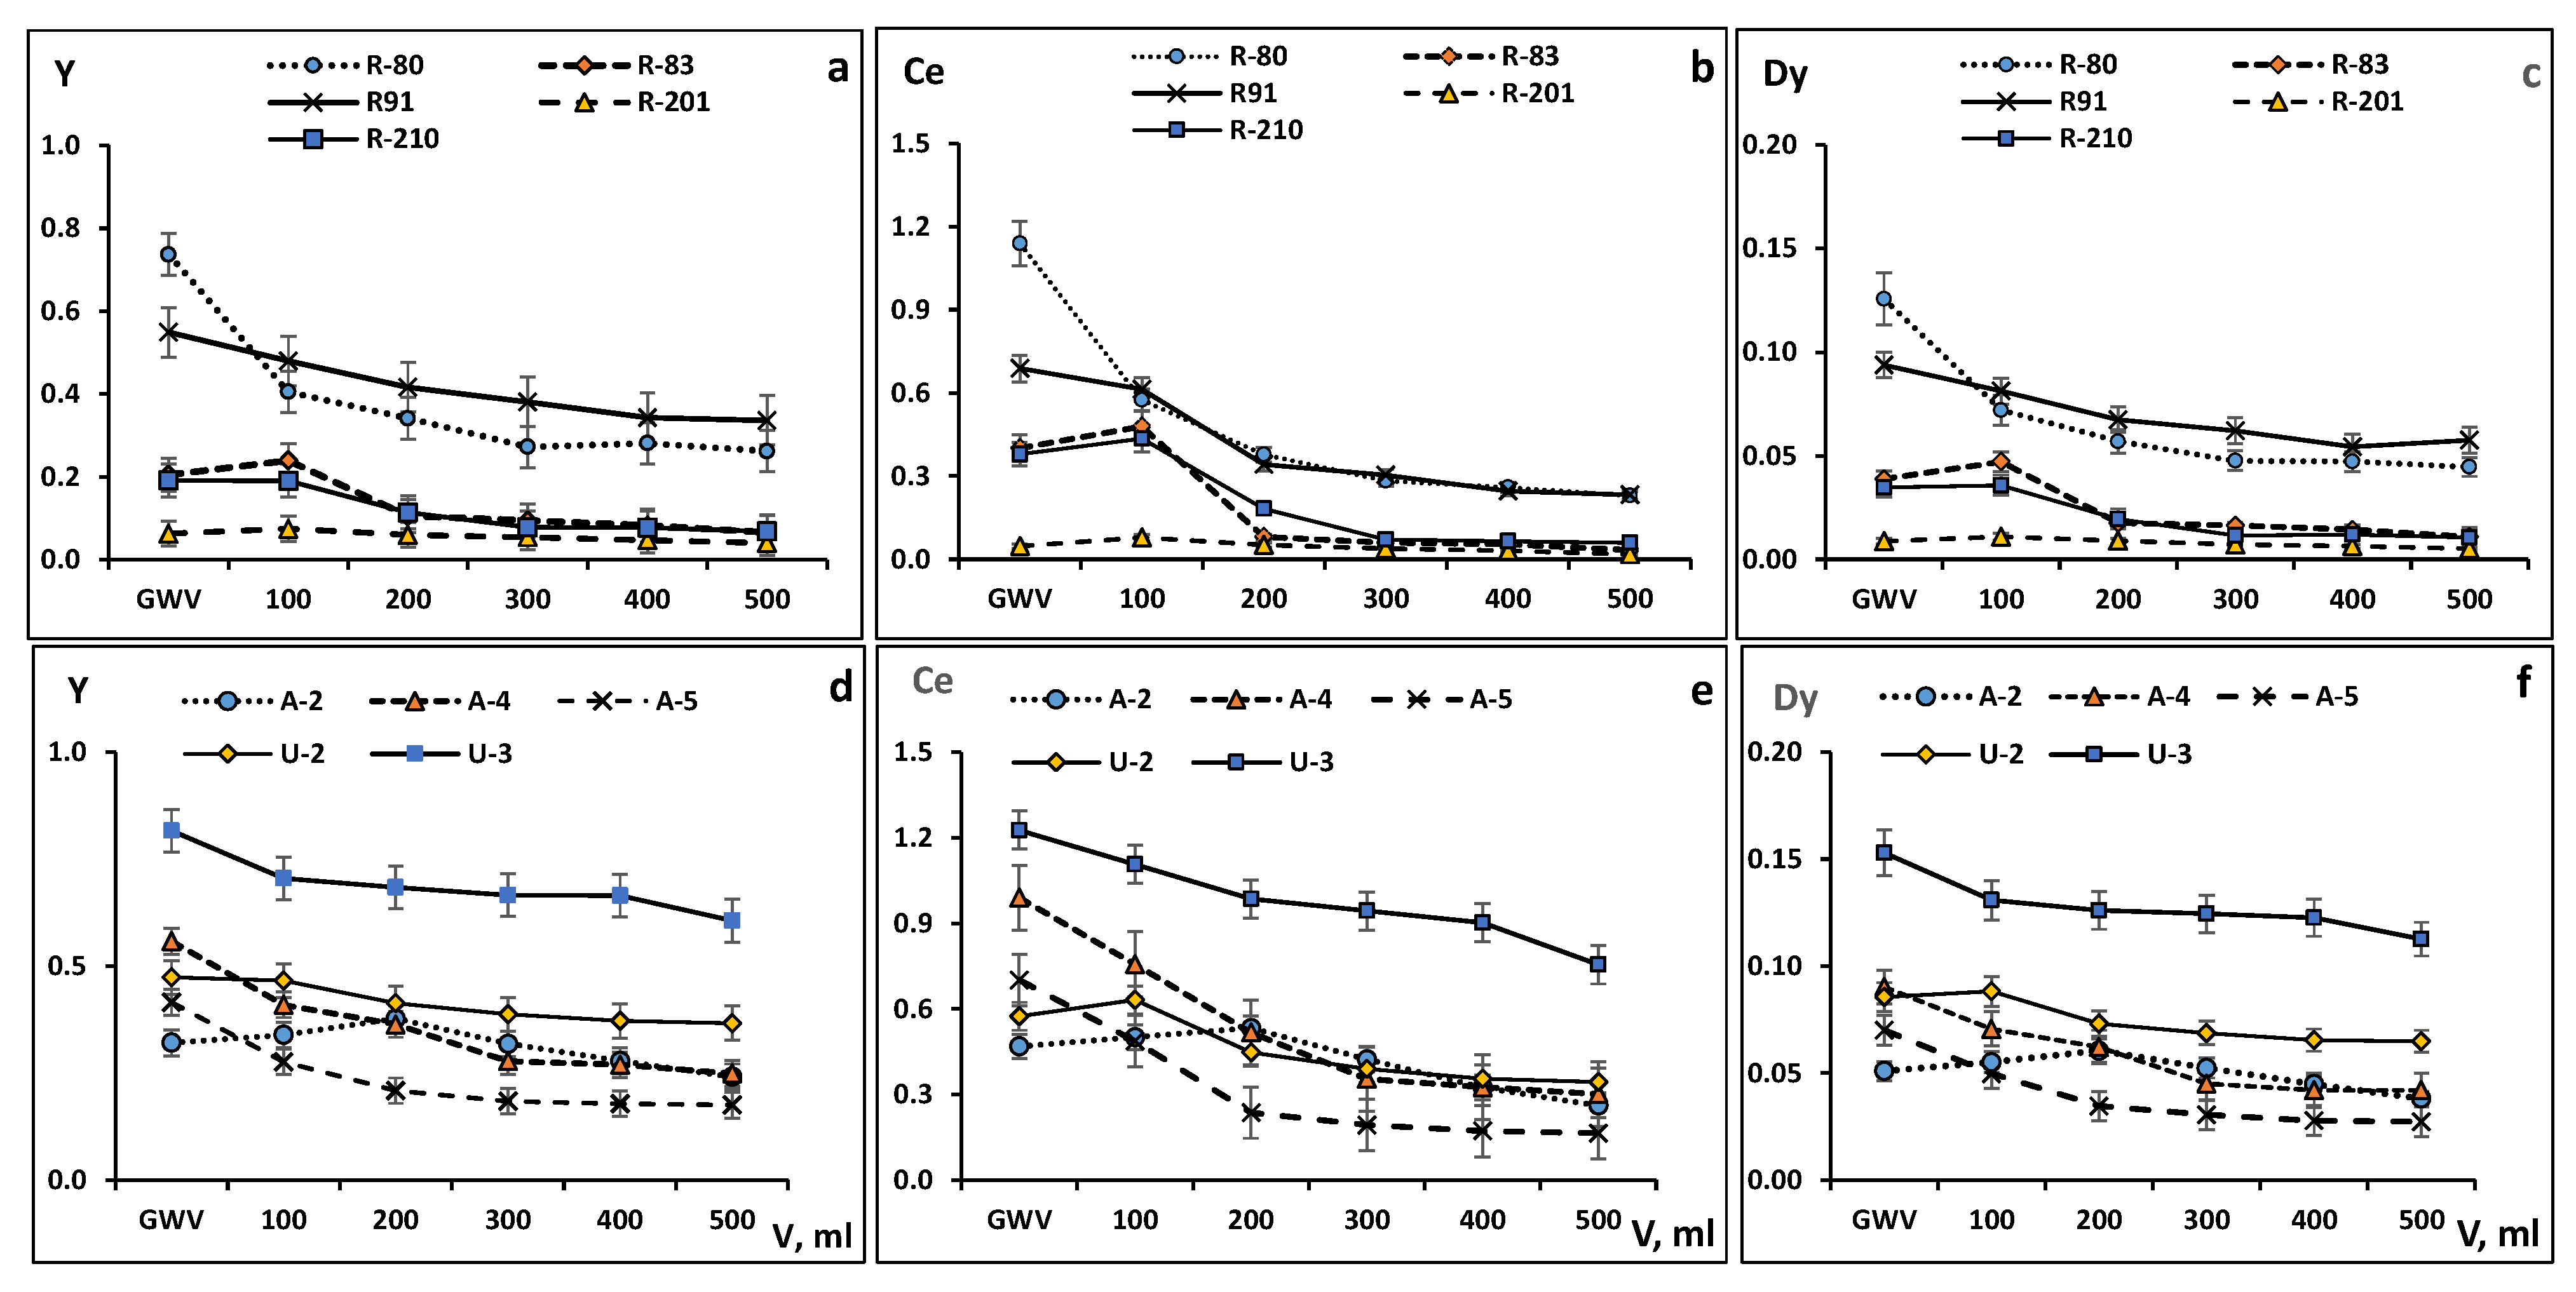
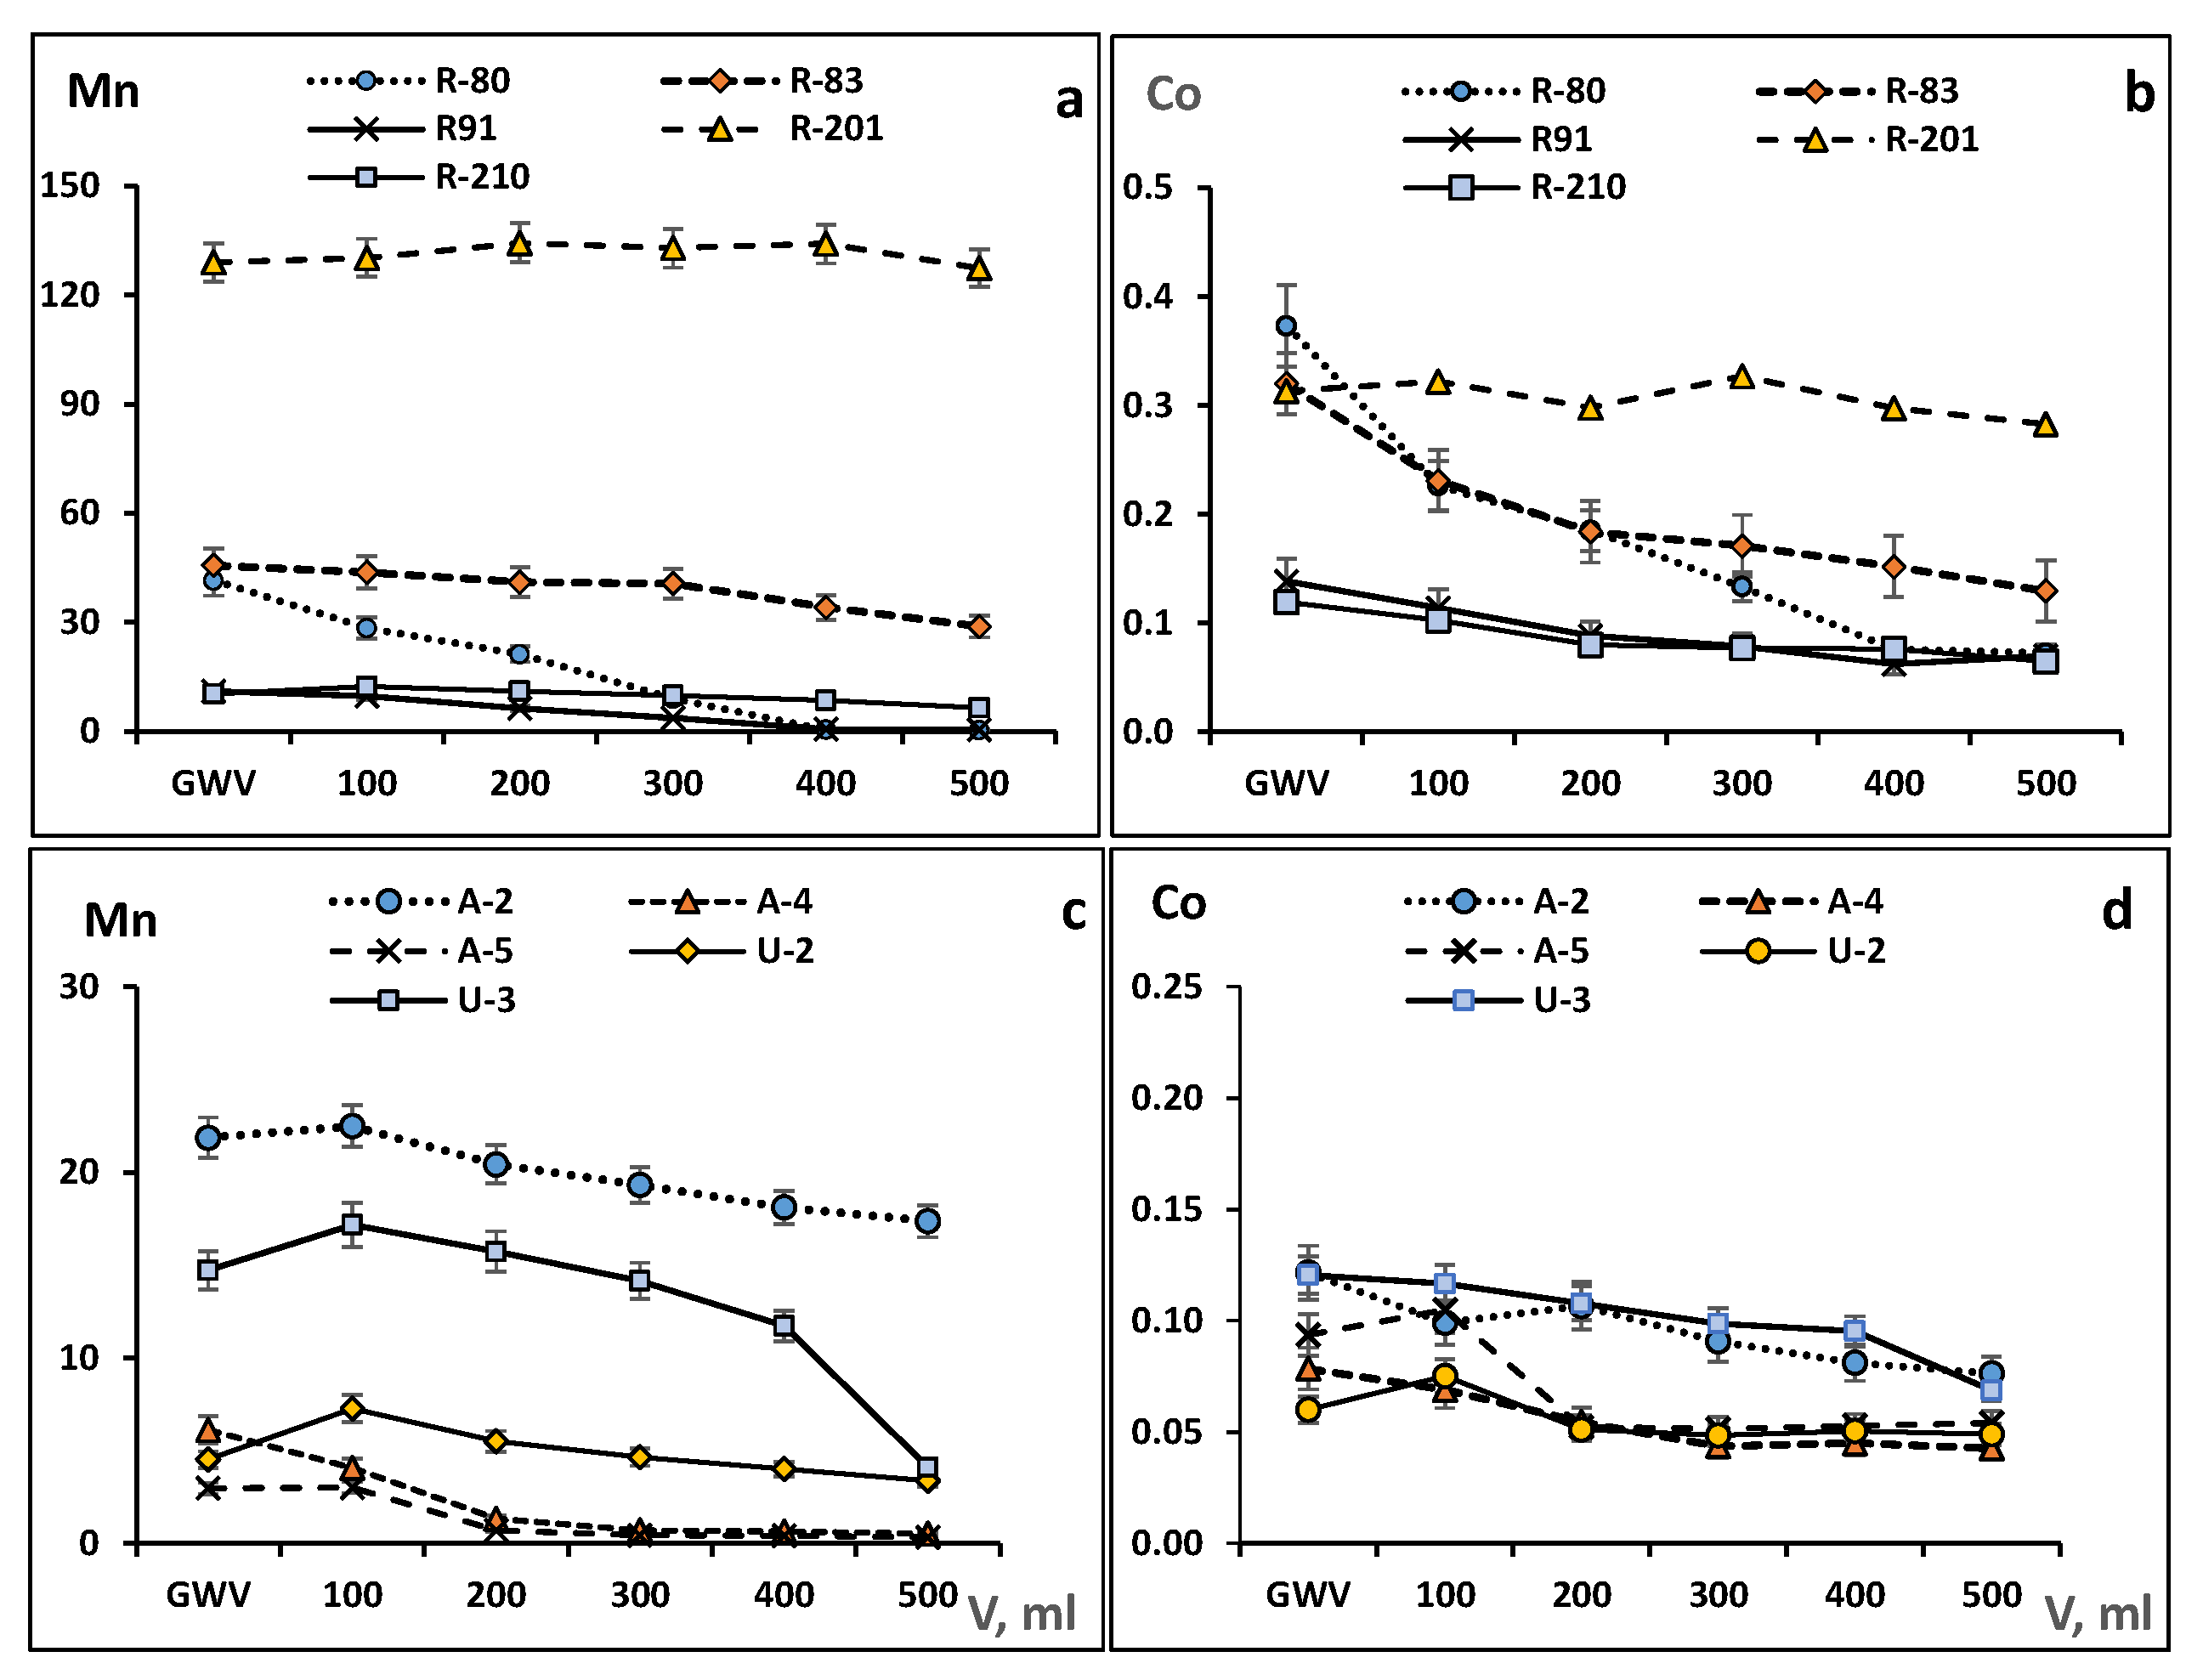
3.4. Influence of Clogging on the Concentration of Trace Elements in the Filtrates

Several groups are distinguished among trace elements by the change in concentration in filtrates along with the filtration volume increase from 100 to 500 mL and correspondent clogging of the membranes.
The first group includes Fe, Al, Ti, Pb. The concentration of these elements in filtrates showed the most significant decline with filtration volume growth, especially at the first increment from 100 to 200 mL. The rate of concentration decreases the slowdown in the following portions of the filtrate (Figure 3 for Fe, Al, Ti, and Table S1 for Pb). The initial concentration of the forms of these elements responding to the clogging seems to be a major reason controlling their behavior during filtration. The similar initial concentrations were accompanied by the analogous dynamic of concentration decrease in filterable forms (e.g., A-2 and U-3 for Fe, R-201 and R-91 for Al, Figure 3) even at the quite different suspended solid content and clogging rate (Figure 2). The reduction of filterable Fe, Al, and Ti due to clogging in the Razdolnaya R. water was more pronounced compared with Amur R. and Ussuri R. waters (Figure 3a–c vs. Figure 3d–f), especially at the level of suspended solids less than 50 mg/L. The difference between filtrates after capsule filters and first 100 mL subsamples was within the 10–15% of concentrations observed or showing some decrease in distinct clogging (e.g., R-91 at Figure 3a–c).
The second group of elements consists of REEs, and such low solubility in oxygenated river water elements as Y, Zr, Hf, Sc, Cr. A notable decrease in concentration in the filtrates was often observed for these elements at the rise of water volume filtered through the membrane (Figure 4 for Y, Ce, Dy as an example; see Supplementary Materials Table S1 for others).
At the low content of suspended solids and weak clogging, the decrease in REEs and other low soluble metals in the filtrates becomes negligible at the small initial concentration (e.g., Ce in R-201) or gradual at the elevated initial concentration (Ce in U-3) (Figure 4b,e). Such a pattern was observed in the Amur R. and Razdolnaya R. in wintertime (A-2 and R-201) and in the Bikin R. in summer as well.
The behavior of Mn and Co during clogging of the membrane filters is varied depending on the season, initial concentration in the river, and content of suspended solids (Figure 5). At the high initial concentration and low suspended solids in the Razdolnaya R. in winter, dissolved Mn and Co did not respond to the clogging at all (Figure 5a,b). The Amur R. concentration of Mn and Co in winter showed a slight decline, probably due to diminished initial concentrations (Figure 5c). During warm seasons, the decrease in Mn concentration in the filtrates is more gradual compared with Fe and Al or REEs. At the same time, in all our experiments with high suspended solids content, the concentration of Mn in filtrates after 400 mL decreased to 0.4–0.6 µg/L regardless of variations from 4 to 42 µg/L after the first 100 mL (Figure 5a). Another dynamic of Mn decrease along with clogging was observed at low suspended solids in the autumn (R-83) when the original high concentration of Mn gradually declined only from 48 to 29 µg/L after filtering 500 mL sample. In spring (R-210), dissolved Mn decreased from 11 to 6.5 µg/L at low suspended solids (Figure 5a). A similar in general but less contrasting change of concentration in filtrates along with clogging was observed for Co (Figure 5b,d).
The last group is presented by a wide range of elements Li, B, Si, Ni, Cu, As, Sr, Rb, Mo, V, Ba, and U. The concentrations of these elements in filtrates did not depend on the volume filtered and type of filters (Supplementary Materials, Figure S1 for Si, Sr, Ni, As, Cu, U and Table S1 for others). This group includes elements with quite different chemical properties. Still, a common feature is probably the minor role of large colloids in the balance of migration forms in the rivers studied. For some elements of this group, the dominance of ionic forms in river waters is consistent with their general chemical properties, but for Cu and Ni, it is possibly the complexes with organic compounds, including colloids, but small ones passing through the clogged membranes. The migration of Cu and Ni mainly in the form of dissolved complexes or small organic colloids with a size <10 kDa has been shown for the rivers of the boreal zone [7,11].

4. Discussion

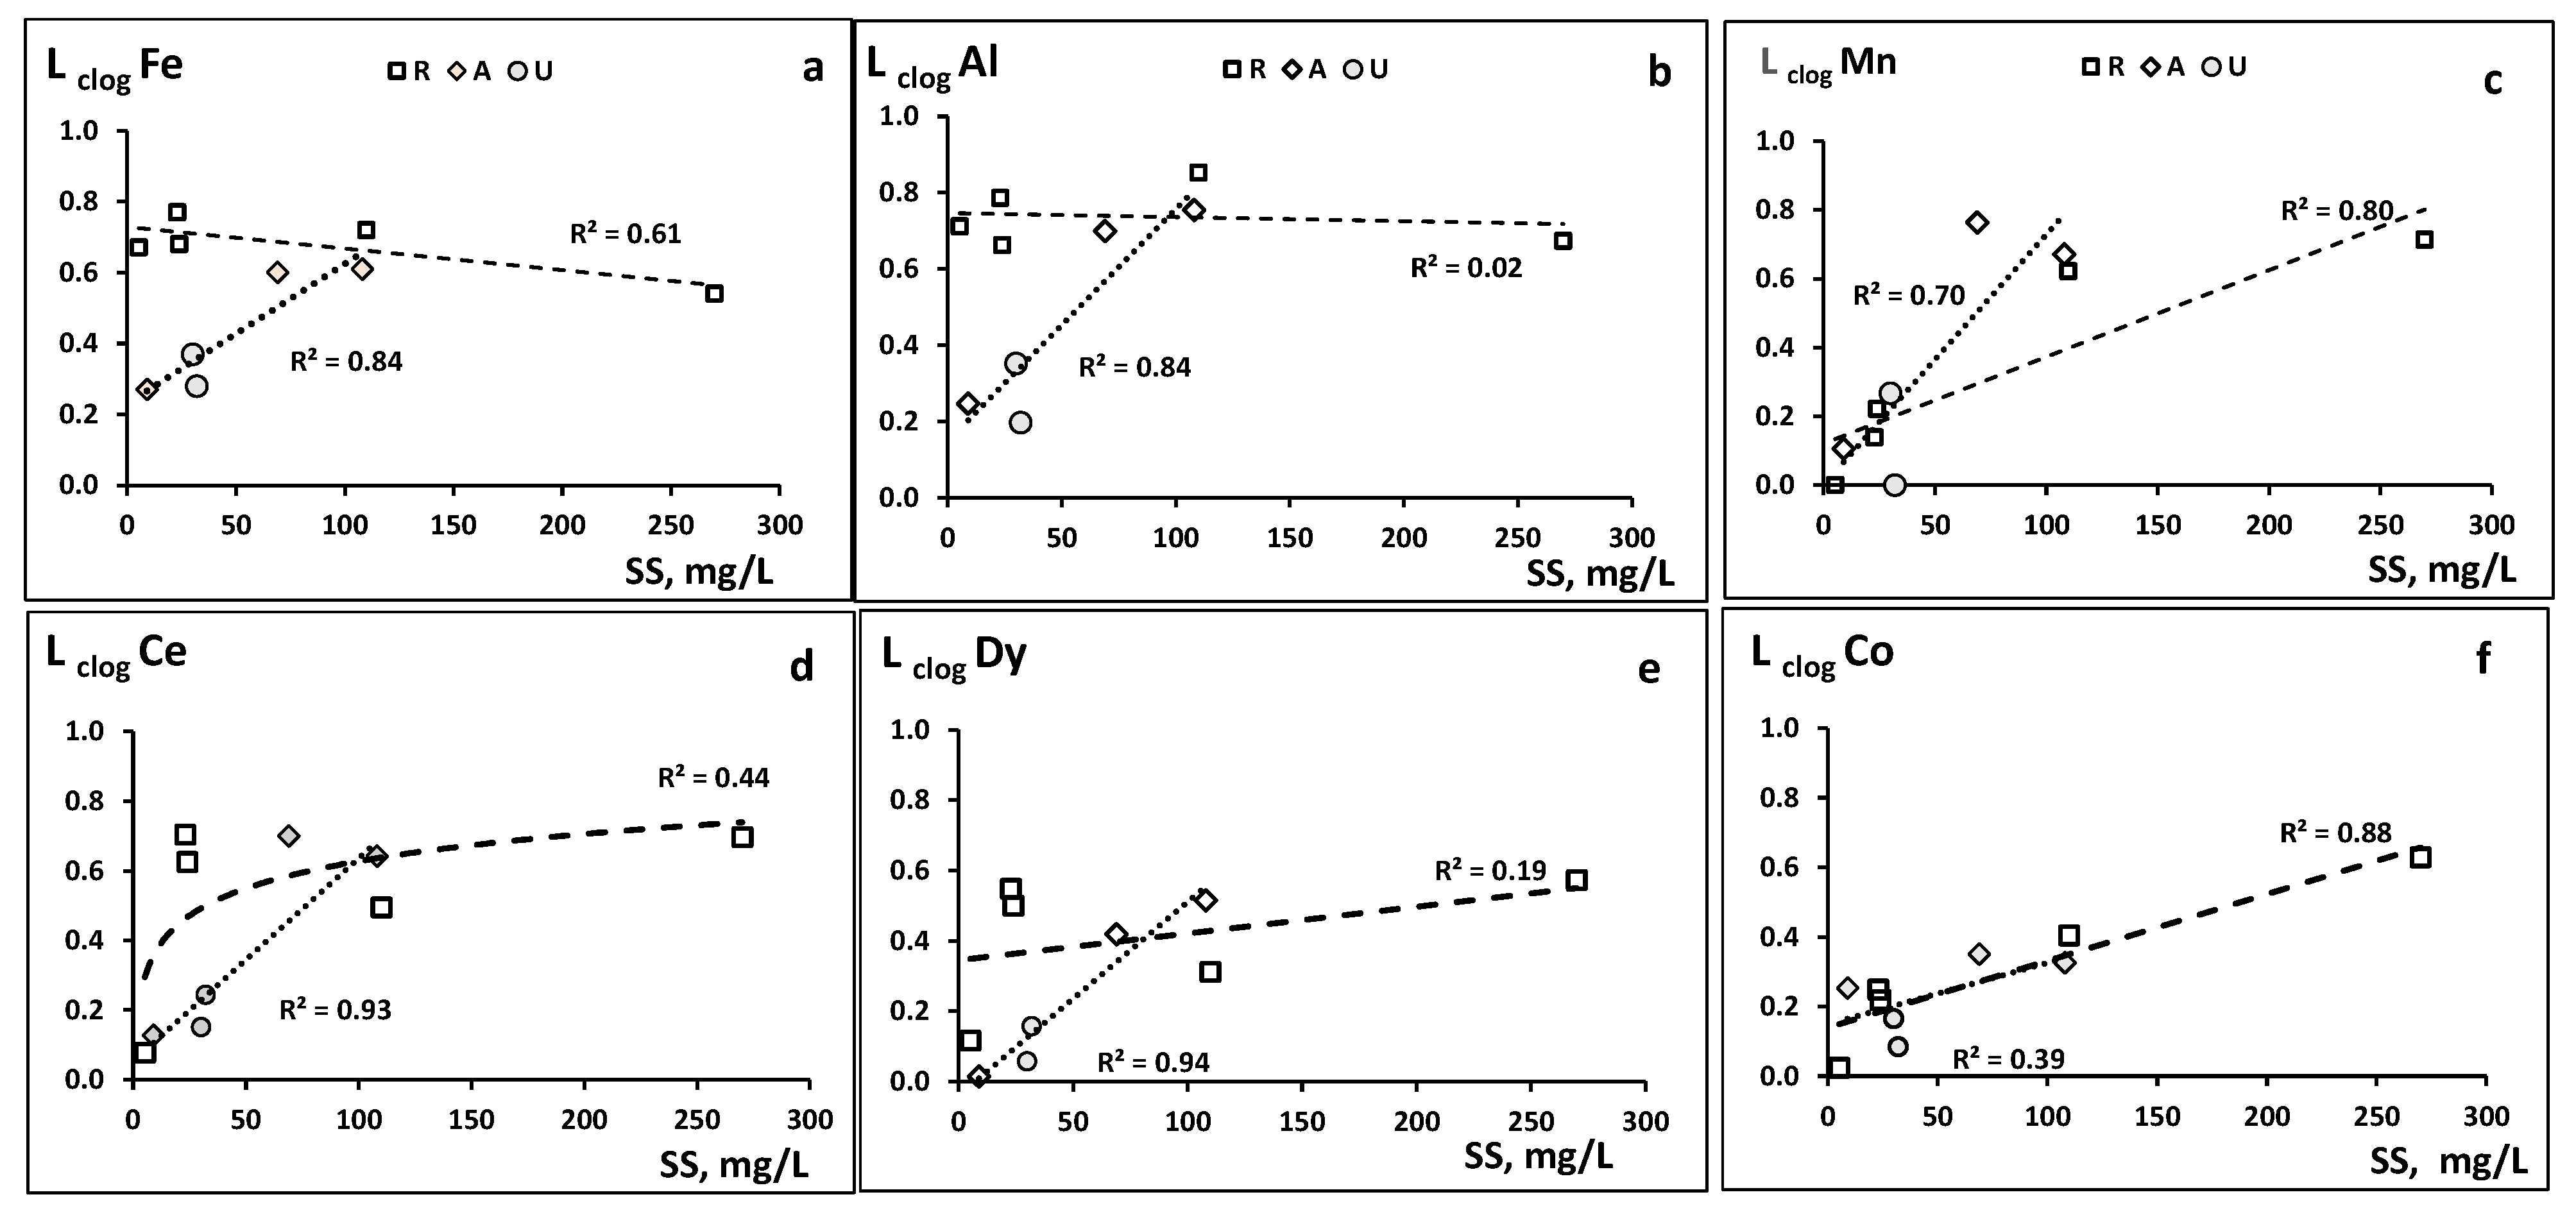
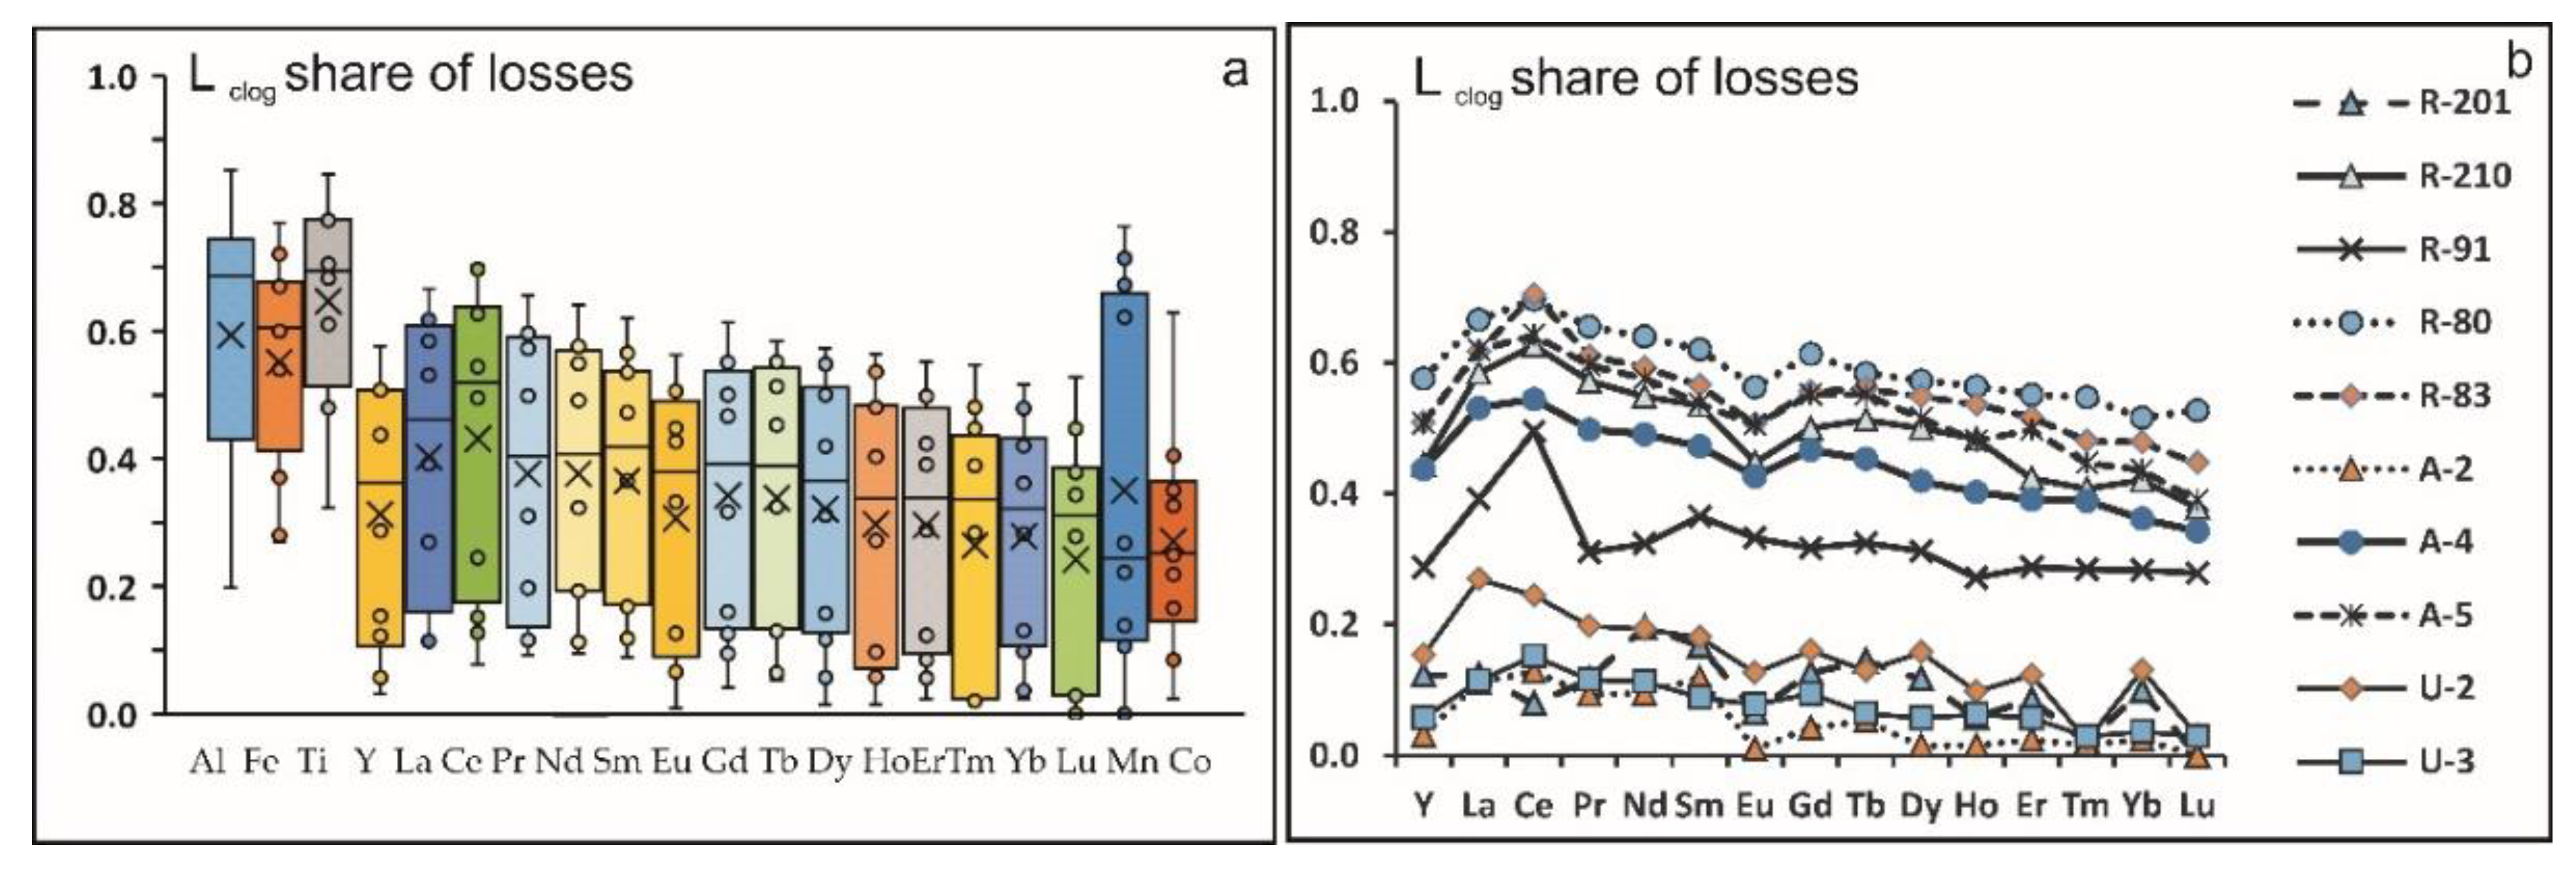
4.1. Factors Controlling the Clogging and the Loss of Filterable Forms of Trace Elements

The mechanism of clogging of the filter media was studied in most detail in the research of fouling in the operation of wastewater treatment systems [33,34,35]. The pore blocking and cake layer formation together provide the clogging of filter media with a notable diminishing of effective pore size [36]. The retention of colloids less than the nominal cut-off is an obvious result of the clogging. The quantity of the suspended particles and coarse colloids in the water to be filtered is a significant factor affecting the clogging of the filter media [14,33]. Suspended sediment grain size distribution is another crucial factor influencing clogging [14]. Colloidal organic matter can take part in clogging as well [16]. Our results on the change of the filtration rate at the different suspended solids (SS) content (Figure 2b,c) confirm its leading role in controlling the clogging process. A more intensive clogging at the growth of SS was observed for all rivers. Still, the dynamic of filtration rate decline varied from the river to river, especially during filtration of the first portions (Figure 2b). The difference in the SS grain size is a probable reason. The drop of filtration rate at the growth of volume filtered indicates (Figure 2a) sizable clogging after 100–200 mL, especially at SS > 50 mg/L. At the same time, at low SS < 10 mg/L in winter, the filtration rate drops down 20–30 times after 400–500 mL filtered (Figure 2a). Clearer Bikin R. and Great Ussurka R. in summer diminished SS (8–30 mg/L), showing analogous filtration rate decline after 300–400 mL of sample. That is, clogging is inevitable if using a 47 mm membrane with a 0.45 µm pore size. We used a tortuous-type Millipore PVDF membrane, and clogging will be notably faster for the sieve-type membranes such as Nucleopore [15,16].
The clogging leads to decreased effective pore size [14] and retention of coarse colloids <0.45 µm with chemical elements connected with them. Such retention has been suggested as a reason for the decline of filterable Fe and Al concentration along with the filtration process [15]. The response of filterable Fe to the clogging is most pronounced compared with other metals (Figure 3), due to the dominance of Fe forms in the oxygenated river waters as coarse (0.22–0.45 µm) ferrihydrite (FeOOH) colloids [7]. These coarse Fe-oxyhydroxides colloidal particles do not show a direct association with DOC [11]. At the same time, small (1–10 kDa) Fe-containing colloids show close linking with organic matter and probably exist as Fe-organic complexes [13]. The response of filterable Al, and possibly Ti and Pb, to the clogging indicates control of these metals by coarse colloids in the rivers studied. The similar bearing of Fe and Al by predominantly inorganic Fe-oxyhydroxides and clay colloids with possible stabilization by small organic colloids was reported for other boreal rivers [7] in contrast to the tropical rivers where fine organic colloids control colloidal forms of Al directly [37]. Ferrihydrite was discovered as a major Fe phase of coarse colloids and clay aggregates—as the Al colloidal phase in Lena R. [38]. Flow field-flow fractionation technique confirmed the domination of large colloids for Fe in the clean boreal rivers in Canada, but Al was associated with small colloids or even ionic forms [18].
For the Y and REEs, the retention of coarse colloids with absorbed REEs at clogging of the membrane seems the most logical explanation for the decrease in filterable REEs. The decline is more pronounced for the Y and light REE (La-Ce group) compared with heavy REEs (Dy, Er, Lu) (Figure 4b,c for Ce and Dy), which could be explained by the stronger affinity of light REE to the particulates and colloids and the higher solubility of heavy REEs [39].
More even distribution of Mn and Co by colloidal fractions of different sizes explains a more gradual decrease at clogging (Figure 5). A gradual decrease in Mn and Co concentration after filters 0.22 µm and ultrafilters 0.025 µm, 100 kD (0.006 µm), 10 kD (0.003 µm), 1 kD (0.001 µm) in the rivers of the White Sea basin [8] confirms this supposition.
The loss of filterable forms of Fe, Al, Ti, Y, REEs, and in some cases Mn and Co after filtration of 0.5 L river water varied not only between metals and between rivers (Figure 3, Figure 4 and Figure 5) but also within the same river depending on the water regime (Figure 6). Suspended solids (SS) content is the most obvious controlling factor of the clogging and decrease in filterable forms of metals. In the Amur and Ussuri rivers, the share of losses of 0.6–0.9 was observed at the SS at more than 50 mg/L and declined to 0.2–0.4 at the SS below 30 mg/L. In the Razdolnaya R., share of losses for Fe and Al had a range of 0.6–0.9 regardless of SS content (Figure 6a,b). For Y and REEs, the share of losses in Razdolnaya R. varied from 0.3 to 0.7 also irrespective of SS during the warm period, but losses were below 0.1 in winter under ice. In the Amur and Ussuri rivers, losses for YREEs increased from 0.1 to 0.3–0.7 with the growth of SS (Figure 6d,e for Ce and Dy). The most evident control of the share of losses by SS was observed for Mn and Co: from the absence of loss at SS less than 10 mg/L to 0.4–0.8 at more than 50 mg/L (Figure 6c,f). Fine grain size of the suspended solids in the Razdolnaya R. is a probable reason for its enhanced ability to block the membranes even at the low SS content compared with the Amur and Ussury rivers. Elevated concentration of DOC in the Bikin R. can be an additional factor boosting the appearance of small colloidal forms with Fe, Al, REEs passing through the clogged membranes [7,13].
Despite the notable variability within the rivers, the range of metals by their share of losses due to clogging during filtration of 0.5 L of river water is obvious (Figure 7a). For the Y and REEs, the significant (by Mann–Kendall Z test) declining trend of the share of losses from La to Lu was observed in all rivers studied (Figure 7b) in accordance with a higher affinity of light REEs to the coarse colloids [39] more susceptible to the clogging.

4.2. Possible Influence of Clogging on the Assessment of River Water Quality

The concentration of the filterable forms of trace elements is a background for the evaluation of water quality in many countries. Among the metals susceptible to clogging, environmental quality standards (EQS) for the fresh waters are established for Al, Fe, Mn, and in some countries for Co. The underestimation of filterable forms of these metals, taking place at clogging of the membrane filters, can lead to a positive shift in the assessment of water quality. It is difficult to assess the effect of clogging in general form since it is necessary to know the volume of filtered water, which is usually approximately fixed in the publications. We have compared the concentration of dissolved/colloidal forms <0.45 µm without clogging influence (Ci from Table 2) and average concentration in all five 100 mL portions filtered (Cj from Table S2) with EQS in drinking water in terms of the number of cases when the observed concentration exceeds EQS (Table 4).
For Al and Fe, paying no attention to clogging influence leads to the ignoring of exceedance above EQS for 30–40% of the ten samples studied. Misjudgment of environmental situations and problems is an obvious consequence. The influence of clogging on Mn does not change the frequency of exceedance above EQS because a really high concentration of Mn was observed in Razdolnaya R. in winter under the ice, probably due to flux from the bottom sediments [23] and at the low suspended solids content with weak clogging (Figure 2 and Figure 5a). Clogging does not affect the assessment of water quality for Co because, in any case, the observed concentration of filterable Co is notably less than most tough environmental water standards (Table 4).

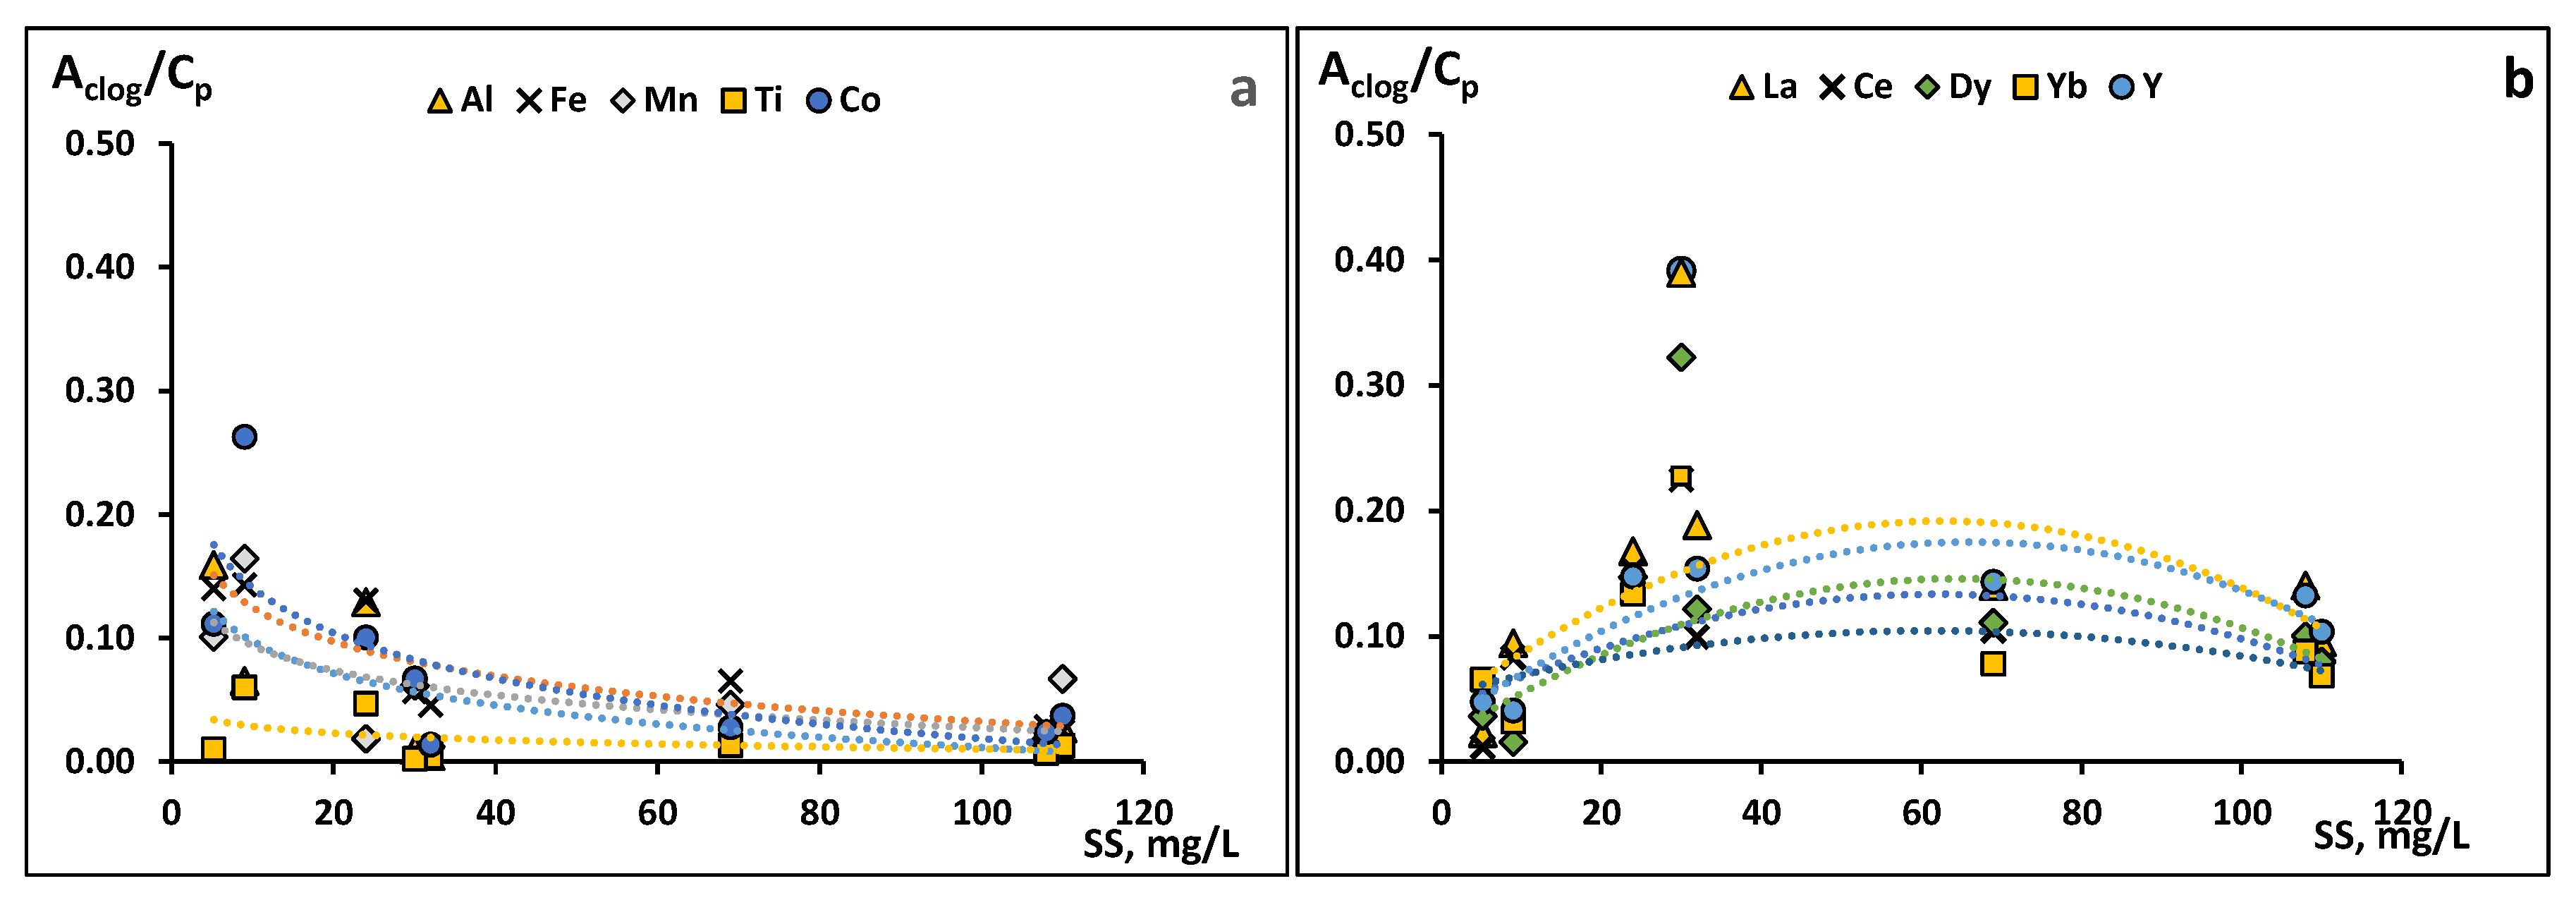
4.3. Influence of Clogging on the Concentration of Particulate Forms of Trace Elements

The clogging of membrane filters by coarse colloids, besides reducing the concentration of some elements in the filtrates, leads to a corresponding increase in their concentration in particulate material collected on the filters. The impact of this process on the determination of particulate forms depends not only on the absolute value of the loss in the filtrates due to clogging but also on the total amount of particulate forms in the water. The latter is controlled, first, by suspended solids content and their chemical composition. Suspended solids content (SS) is a major controlling factor with seasonal variability of two orders of magnitude because seasonal variability of the chemical composition of the suspended solids within one river does not exceed 20–30% as a rule [42].
Based on the decrease in the concentration in the filtrates during sequential filtration (Figure 3, Figure 4 and Figure 5), the amount of the elements retained on the membrane during clogging was calculated. Comparison of this amount (Aclog) with the total concentration of suspended/particulate forms (per volume basis) of the element after the acid digestion of the membrane filters (Cp) assesses the effect of clogging on the concentration of suspended forms of elements in river waters (Aclog/Cp). The result of such comparison is presented in Table S2 for the chemical elements, showing a notable decrease and response to the clogging during filtration through the membrane.
Two groups of elements can be distinguished by the influence of clogging on the suspended forms on the membranes: (1) Al, Fe, Ti, Mn, Co, and (2) Y and REEs. For the first group, absolute input due to clogging is directly dependent on the decline of filterable forms, but a relative influence on the concentration of particulates is inversely dependent on the suspended solids content. At the high suspended solids in river water (more than 50 mg/L), even pronounced clogging of Fe and Al cannot compose more than 3–8% in the amount of particulate forms per volume basis. At the suspended solids below 30 mg/L, the relative input of clogging to the particulates increases to 10–16%, and even to 25% for Co in the Amur R. in winter at the SS content of 9 mg/L (Figure 8a). Among this group, Ti shows a minimal share of clogging in the concentration of particulate forms: less than 6%. No specific difference between rivers studied was observed for these metals.
The second group (Y and REEs) shows a different dependence on suspended matter content (Figure 8b): the smallest share of clogging to the particulates of these metals (<10%) is obtained at minimal SS (<10 mg/L) in winter under ice. The reason is diminished initial concentration of Y and REEs and less pronounced decline due to slight clogging in winter (Figure 4). Share of clogging 7–18% to the particulates of YREEs is typical for rivers at the suspended solids broad range of 24–108 mg/L (Figure 8b). Bikin R. is an exception, having elevated initial concentrations of Y and REEs compared with other rivers and evident decreases due to clogging (Figure 4d–f) along with modest contents of suspended solids (30 mg/L). Combining these factors leads to an increase in the share of clogged Y and REEs in the concentration of suspended forms in Bikin R. to 23–39% (Figure 8b). Elevated concentrations of DOC and filterable Fe is another feature of Bikin R. (Table 1 and Table 2), and unlike Razdolnaya R., the decrease in filterable Fe along with clogging is more gradual (Figure 3d). This allows us to suppose that part of the Fe colloids in the Bikin R. are presented by medium-sized organo-mineral fractions [11] retained by the clogged membranes. These features control the distribution of Y and REEs in Bikin R. as well.

5. Conclusions

Sequential filtration of river water with a suspended solids content of 5.2–270 mg/L through the membrane filters reaffirmed significant clogging after more than 100–200 mL of the water filtered, unlike the capsule filters that provided practical absence of clogging at a volume of sample up to 2–3 L.
The concentrations of major ions, nitrates, DOC, and a range of trace elements (Ni, Cu, Cd, As, Sr, Rb, Mo, Ba, V, Cr) do not show notable changes in the filtrates as filters become clogged, indicating the prevalence of dissolved and/or small colloidal forms of migration in the rivers studied for all of these components.
The concentrations of filterable forms of rare earth elements (REEs) and a number of low soluble elements (Y, Zr, Hf) decrease by 30–70% as the filtrate volume increases up to 500 mL and the suspended solids amount exceeds 20–30 mg/L. This indicates the existence of a notable part of these elements in the form of coarse colloids. At the same time, in winter, at the low suspended solids, the influence of clogging on YREEs declines to negligible.
Clogging has the most significant effect on the concentration-filterable Fe, Al, Ti, and Pb, which after 200 mL are reduced by 60–90%. This confirms the dominance of coarse colloidal particles of Fe hydroxides and clay minerals in the pool of dissolved and colloidal forms of these metals in the rivers studied.
The concentrations of Mn and in part Co in the filtrates decrease gradually along with clogging, which corresponds to more even distribution of these metals across colloidal fractions of different sizes.
Content and grain size of suspended solids are the major factors controlling the clogging itself, but influence on the determination of filterable Fe, Al, Ti, Pb, Mn, and YREEs also depends on the concentration of the dissolved and colloidal forms of these metals, and probably DOC, in the river waters.
Th effects of the membranes clogging during filtration of 400–500 mL of river water lead to the underestimation of filterable forms of Fe, Al, Mn, Co, YREEs, and some other low soluble metals in boreal rivers at the suspended solids of more than 20–30 mg/L. Therefore, a shift in the assessment of water quality by Fe, Al, Mn is possible.
The influence of clogging on the determination of particulate forms depends both on the quantity of filterable forms lost during filtration and on the amount of suspended solids accumulated on the membranes. A relative surplus of particulate forms of Fe, Al, Mn, Co on the clogged membranes reaches 10–25% at the content of suspended solids below 30 mg/L and falls to 3–8% for the suspended solids more than 50 mg/L. For the Y and REEs, the clogging effect on the particulates is controlled more by the decrease in filterable forms during filtration, which in turn depends on the initial concentration in river water.

Supplementary Materials

The following supporting information can be downloaded at: www.mdpi.com/article/10.3390/min12060773/s1, Table S1: Concentration of chemical elements in filtrates after capsules GWV, and successive filtration through Millipore membranes 100, 200, 300, 400, and 500 mL of river water; Table S2: Concentration of dissolved/colloidal forms < 0.45 µm (Cj), forms retained by membranes owing to clogging (A), the concentration of all particulates on the membranes (C_part), and the share of the particulates due to clogging; Figure S1: The concentration of Si (mg/L), and Ni, Cu, Sr, As, U (µg/L) in filtrates obtained at the capsules (GWV) after 500 mL and Millipore membranes after filtration of 100, 200, 300, 400, 500 mL.

Author Contributions

Conceptualization, methodology, field works, V.S.; filtration experiments, chemical analysis, validation, N.B. and V.S.; ICP-MS analysis, E.E.; writing—original draft preparation, review, and editing V.S. and E.E. All authors have read and agreed to the published version of the manuscript.

Funding

This research was performed within the framework of the State Assignment for Pacific Geographical Institute FEBRAS (theme no. AAAA-A19-119030790003-1).

Acknowledgments

The authors are grateful to their colleagues from the Pacific Geographical Institute FEBRAS and Far Eastern Geological Institute FEBRAS for their support. Special thanks to T. Lutsenko and S. Yurchenko for DOC, major ions, and nitrate measurements, and to N.V. Zarubina for support in ICP-MS arrangement. Special thanks to anonymous reviewers for the valuable comments improving the manuscript considerably.

Conflicts of Interest

The authors declare no conflict of interest.

References

  1. Everett, D.H. Manual of symbols and terminology for physicochemical quantities and units, Appendix II: Definitions, Terminology, and Symbols in Colloid and Surface Chemistry. Pure Appl. Chem. 1972, 31, 577–638. [Google Scholar] [CrossRef]
  2. Wilde, F.D.; Radtke, D.B.; Gibs, J.; Iwatsubo, R.T. (Eds.) Chapter A5. Processing of Water Samples (Version 2.2); 2004 with Updates through 2009; Book 9; U.S. Geological Survey Techniques of Water-Resources Investigations: Reston, VA, USA, 2004. Available online: http://pubs.water.usgs.gov/twri9A5 (accessed on 17 April 2021).
  3. Gaillardet, J.; Viers, J.; Dupre, B. Trace elements in river waters. Surface and groundwater, weathering and soils. In Treatise on Geochemistry; Holland, H.D., Turekian, K.K., Eds.; Elsevier-Pergamon: Oxford, UK, 2003; Volume 5, pp. 225–272. [Google Scholar]
  4. Benoit, G.; Hunter, K.S.; Rozan, T.F. Sources of trace metal contamination artifacts during collection, handling, and analysis of freshwaters. Analyt. Chem. 1997, 69, 1006–1011. [Google Scholar] [CrossRef]
  5. Shotyk, W.; Bicalho, B.; Cuss, C.W.; Donner, M.; Grant-Weaver, I.; Haas-Neill, S.; Javed, M.B.; Krachler, M.; Noernberg, T.; Pelletier, R.; et al. Trace metals in the dissolved fraction (<0.45 μm) of the lower Athabasca River: Analytical challenges and environmental implications. Sci. Total Environ. 2017, 580, 660–669. [Google Scholar] [CrossRef] [PubMed]
  6. Morrison, M.A.; Benoit, G. Investigation of conventional membrane and tangential flow ultrafiltration artifacts and their application to the characterization of freshwater colloids. Environ. Sci. Technol. 2004, 38, 6817–6823. [Google Scholar] [CrossRef]
  7. Pokrovsky, O.S.; Schott, J. Iron colloids/organic matter associated transport of major and trace elements in small boreal rivers and their estuaries (NW Russia). Chem. Geol. 2002, 190, 141–179. [Google Scholar] [CrossRef]
  8. Pokrovsky, O.S.; Viers, J.; Shirokova, L.S.; Shevchenko, V.P.; Filipov, A.S.; Dupre, B. Dissolved, suspended, and colloidal fluxes of organic carbon, major and trace elements in the Severnaya Dvina River and its tributary. Chem. Geol. 2010, 273, 136–149. [Google Scholar] [CrossRef]
  9. Vasyukova, E.V.; Pokrovsky, O.S.; Viers, J.; Dupre, B. The new operational method of testing colloid complexation with metals in natural waters. Appl. Geochem. 2012, 27, 1226–1237. [Google Scholar] [CrossRef]
  10. Shirokova, L.S.; Pokrovsky, O.S.; Moreva, O.Y.; Chupakov, A.V.; Zabelina, S.A.; Klimov, S.I.; Shorina, N.V.; Vorobieva, T.Y. Decrease of concentration and a colloidal fraction of organic carbon and trace elements in response to the anomalously hot summer of 2010 in a humic boreal lake. Sci. Total Environ. 2013, 463–464, 78–90. [Google Scholar] [CrossRef]
  11. Krickov, I.; Pokrovsky, O.S.; Manasypov, R.; Lim, A.; Shirokova, L.S.; Viers, J. Colloidal transport of carbon and metals by western Siberian rivers during different seasons across a permafrost gradient. Geochim. Cosmochim. Acta 2019, 265, 221–241. [Google Scholar] [CrossRef]
  12. Stolpe, B.; Guo, L.; Shiller, A.M. Binding and transport of rare earth elements by organic and iron-rich nanocolloids in Alaskan rivers, as revealed by field-flow fractionation and ICP-MS. Geochim. Cosmochim. Acta 2013, 106, 446–462. [Google Scholar] [CrossRef]
  13. Cuss, C.W.; Donner, M.W.; Grant-Weaver, I.; Noernberg, T.; Pelletier, R.; Sinnatamby, R.N.; Shotyk, W. Measuring the distribution of trace elements amongst dissolved, colloidal species as a fingerprint for the contribution of tributaries to large boreal rivers. Sci. Total Environ. 2018, 642, 1242–1251. [Google Scholar] [CrossRef]
  14. Horowitz, A.; Elrick, K.; Colberg, M. The effect of membrane filtration artifacts on dissolved trace element concentrations. Water Res. 1992, 26, 753–763. [Google Scholar] [CrossRef]
  15. Hall, G.E.M.; Bonham-Carter, G.F.; Horowitz, A.J.; Lum, K.; Lemieux, C.; Quemerais, B.; Garbarino, J.R. The effect of using different 0.45 pm filter membranes on ‘dissolved’ element concentrations in natural waters. Appl. Geochem. 1996, 11, 243–249. [Google Scholar] [CrossRef]
  16. Morrison, M.A.; Benoit, G. Filtration artifacts caused by overloading membrane filters. Environ. Sci. Technol. 2001, 35, 3774–3779. [Google Scholar] [PubMed]
  17. Horowitz, A.J. A review of selected inorganic surface water quality-monitoring practices: Are we really measuring what we think, and if so, are we doing it right? Environ. Sci. Technol. 2013, 47, 2471–2486. [Google Scholar] [CrossRef] [PubMed]
  18. Shulkin, V.M.; Bogdanova, N.N.; Elovskiy, E.V. Effect of Filter Clogging on the Determination of Concentrations of Chemical Elements Migrating in River Water as Components of True Solutions or in Colloidal Forms. Water Resour. 2022, 49, 122–133. [Google Scholar] [CrossRef]
  19. Shiller, A.M. Syringe filtration methods for examining dissolved and colloidal trace element distributions in remote field locations. Environ. Sci. Technol. 2003, 37, 3953–3957. [Google Scholar] [CrossRef]
  20. Deutch, K.; Leroy, D.; Belpaire, C.; den Hann, K.; Vrana, B.; Clayton, H.; Hanke, G.; Ricci, A.; Held, A.; Gawli, B.; et al. Common Implementation Strategy for the Water Framework Directive (2000/60/ec), Guidance Document No. 19: Guidance on Surface Water Chemical Monitoring under the Water Framework Directive; Office for Official Publications of the European Communities: Luxembourg, 2009; 65p. [Google Scholar]
  21. Working document 52.24.468–2019. In Mass Concentration of Suspended Solids and Dry Residue in Waters. Gravimetric Measurement Method; Federal Service for Hydrometeorology and Environmental Monitoring (Roshydromet): Rostov-on-Don, Russia, 2019; 34p. (In Russian)
  22. Gaillardet, J.; Dupre, B.; Louvat, P.; Allegre, C.J. Global silicate weathering and CO2 consumption rates deduced from the chemistry of large rivers. Chem. Geol. 1999, 159, 3–36. [Google Scholar]
  23. Shulkin, V.; Tishchenko, P.; Semkin, P.; Shvetsova, M. Influence of river discharge and phytoplankton on the distribution of nutrients and trace metals in Razdolnaya River estuary, Russia. Estuar. Coast. Shelf Sci. 2018, 211, 166–176. [Google Scholar] [CrossRef]
  24. Mikhailik, T.A.; Tishchenko, P.Y.; Koltunov, A.M.; Tishchenko, P.P.; Shvetsova, M.G. The Effect of Razdol’naya River on the Environmental State of Amur Bay (The Sea of Japan). Water Resour. 2011, 38, 512–521. [Google Scholar] [CrossRef]
  25. Bagard, M.-L.; Chabaux, F.; Stille, P.; Rihs, S.; Pokrovsky, O.S.; Viers, J.; Dupré, B.; Prokushkin, A.S.; Schmitt, A.-D. Seasonal variability of elements fluxes in two central Siberian rivers draining high latitude permafrost dominated areas. Geochim. Cosmochim. Acta 2011, 75, 3335–3357. [Google Scholar] [CrossRef]
  26. Shulkin, V.M.; Bogdanova, N.N.; Kiselev, V.I. Metals in the river waters of Primorye. Geochem. Int. 2007, 45, 70–79. [Google Scholar] [CrossRef]
  27. Shulkin, V.; Zhang, J. Trace metals in estuaries in the Russian Far East and China: Case studies from the Amur River and the Changjiang. Sci. Total Environ. 2014, 499, 196–211. [Google Scholar] [CrossRef] [PubMed]
  28. Hammer, F.; Harper, D.A.T.; Ryan, P.D. PAST: Paleontological Statistics Software Package for Education and Data Analysis. Palaeontol. Electron. 2001, 4, 9. [Google Scholar]
  29. Chudaeva, V.A.; Shesterkin, V.P.; Chudaev, O.V. Trace Elements in Surface Water in Amur River Basin. Water Resour. 2011, 38, 650–661. [Google Scholar] [CrossRef]
  30. Krickov, I.V.; Lim, A.G.; Manasypov, R.M.; Loiko, S.V.; Vorobyev, S.N.; Shevchenko, V.P.; Dara, O.M.; Gordeev, V.V.; Pokrovsky, O.S. Major and trace elements in suspended matter of western Siberian rivers: First assessment across permafrost zones and landscape parameters of watersheds. Geochim. Cosmochim. Acta 2020, 269, 429–450. [Google Scholar] [CrossRef]
  31. Viers, J.; Dupréa, D.; Gaillardet, J. Chemical composition of suspended sediments in World Rivers: New insights from a new database. Sci. Total Environ. 2009, 407, 853–868. [Google Scholar] [CrossRef]
  32. Horowitz, A.J.; Lum, K.R.; Garbarino, J.R.; Hall, G.E.M.; Lemieux, C.; Demas, C.R. Problems associated with using filtration to define dissolved trace element concentrations in natural water samples. Environ. Sci. Technol. 1996, 30, 954. [Google Scholar] [CrossRef]
  33. Du, X.; Shi, Y.; Jegatheesan, V.; Ul Haq, I. A Review on the Mechanism, Impacts and Control Methods of Membrane Fouling in MBR System. Membranes 2020, 10, 24. [Google Scholar] [CrossRef] [Green Version]
  34. Chen, Y.Q.; Li, F.; Qiao, T.J. Research on ultrafiltration membrane fouling based on chemical cleaning. China Water Wastewater 2013, 29, 51–54. [Google Scholar]
  35. Blandin, G.; Verliefde, A.R.D.; Comas, J. Efficiently combining water reuse and desalination through forward osmosis-reverse osmosis (FO-RO) hybrids: A critical review. Membranes 2016, 6, 37. [Google Scholar] [CrossRef] [PubMed] [Green Version]
  36. Karlsson, S.; Häkansson, K.; Ledin, A. Fractionation of trace metals in surface water with screen filters. Sci. Total Environ. 1994, 149, 215–223. [Google Scholar] [CrossRef]
  37. Viers, J.; Dupre, B.; Polve, M.; Schott, J.; Dandurand, J.-L.; Braun, J.-J. Chemical weathering in the drainage basin of a tropical watershed (Nsimi-Zoetele site, Cameroon): Comparison between organic-poor and organic-rich waters. Chem. Geol. 1997, 140, 181–206. [Google Scholar] [CrossRef]
  38. Hirst, C.; Andersson, P.S.; Shaw, S.; Burke, I.T.; Kutscher, L.; Murphy, M.J.; Maximov, T.; Pokrovsky, O.S.; Morth, M.; Porcelli, D. Characterization of Fe-bearing particles and colloids in the Lena River basin, NE Russia. Geochim. Cosmochim. Acta 2017, 213, 553–573. [Google Scholar] [CrossRef] [Green Version]
  39. Sholkovitz, E.R. The aquatic chemistry of rare earth elements in rivers and estuaries. Aquat. Geochem. 1995, 1, 1–34. [Google Scholar] [CrossRef]
  40. WHO. Guidelines for Drinking-Water Quality: Fourth Edition Incorporating the First Addendum; World Health Organization: Geneva, Switzerland, 2017; pp. 222–226. [Google Scholar]
  41. Nagpal, N.K. Technical Report—Water Quality Guidelines for Cobalt. 2004. Available online: http://www.env.gov.bc.ca/wat/wq/BCguidelines/cobalt/cobalt_tech.pdf (accessed on 10 November 2021).
  42. Zhang, J.; Liu, C.L. Riverine composition and estuarine geochemistry of particulate metals in China—Weathering features, anthropogenic impact and chemical fluxes. Estuar. Coast. Shelf Sci. 2002, 54, 1051–1070. [Google Scholar] [CrossRef]
Figure 1. (a) Scheme of the study area; triangles are the location of the sampling points, and the numbers of samples are listed in Table 1. (b) Sampling 21 August 2020 across the Amur R. A-4 within the mainstream, A-5 (and A-2 in 27 February 2020) within the more turbid flow of Sungari R. Satellite image for 19 August 2020 was available online from www.planet.com (accessed on 18 November 2020).
Minerals 12 00773 g001
Figure 2. (a) Dynamic of the filtration rate (ml/min) decrease at the successive filtration of river water samples. (b) Dependence of the filtration rate on the first 100 mL of water with different concentrations of suspended solids SS (mg/L). (c) Dependence of the filtration rate on 500 mL water samples. R, U, A, Razdolnaya R., Ussuri R., and Amur R., respectively.
Minerals 12 00773 g002
Figure 3. The concentration of Fe (a,d), Al (b,e), and Ti (c,f) (µg/L) in filtrates obtained at the capsules (GWV) after 500 mL and Millipore membranes after filtration of 100, 200, 300, 400, 500 mL for waters from Razdolnaya R. (upper panel) and Amur R./Ussuri R. (lower panel). Bars on Figure 3, Figure 4 and Figure 5 reflect standard errors of analysis.
Minerals 12 00773 g003
Figure 4. The concentrations of Y (a,d), Ce (b,e), and Dy (c,f) (µg/L) in filtrates obtained at the capsules (GWV) after 500 mL and Millipore membranes after filtration of 100, 200, 300, 400, 500 mL for waters from Razdolnaya R. (upper panel) and Amur R./Ussuri R. (lower panel).
Minerals 12 00773 g004
Figure 5. The concentration of Mn (a,c) and Co (b,d) (µg/L) in filtrates obtained in the capsules (GWV) after 500 mL and Millipore membranes after filtration of 100, 200, 300, 400, and 500 mL for Razdolnaya R. (upper panel) and Amur R./Ussuri R. (lower panel).
Minerals 12 00773 g005
Figure 6. Share of losses (Lclog) of filterable forms of metals due to clogging during filtration of 0.5 L of Razdolnaya R. (□), Amur R. (◊), Ussuri R. (o) at the different contents of suspended solids (SS) for the elements: (a) Fe; (b) Al; (c) Mn; (d) Ce; (e) Dy; (f) Co.
Minerals 12 00773 g006
Figure 7. (a) Whisker-box plot (max, min, quartiles, med, mean) of the share of losses for the metals susceptible to clogging. (b) Decline in the share of losses of REEs for the rivers studied.
Minerals 12 00773 g007
Figure 8. (a) Share of clogging in the concentration of particulate forms of elements at the different suspended solids content in river waters for the Fe, Al, Ti, Mn, Co; (b) the same for the Y and REEs.
Minerals 12 00773 g008
Table 1. Chemical composition of the boreal rivers studied within the Russian Far East 1.
River#DateSSECpHNO3ClSO42−DOC
R-20123.02.20205.22477.461.5320.925.14.1
R-21025.05.202024927.530.424.112.04.8
Razdolnaya R.R-9125.07.2019110737.250.471.95.18.5
R-8016.08.2018270987.200.564.48.48.0
R-8320.11.2018231167.870.845.210.84.6
A-227.02.202091036.960.515.214.36.6
Amur R.A-421.08.202069.4567.100.171.34.39.3
A-521.08.2020108.2947.330.353.87.78.5
Great Ussurka R. R.U-213.08.201932507.210.260.82.97.4
Bikin R.U-313.08.201930387.090.070.63.914.7
1 SS, suspended solids, Cl, SO42−; DOC, dissolved organic carbon in mg/L; nitrates in mgN/L; EC, conductivity in µS/cm.
Table 2. Concentration (Ci, µg/L) of 0.45 µm filterable 1 forms of trace elements in the boreal rivers of the Russian Far East compared with permafrost-free West Siberian lowland Rivers (WSLR) [11] and World average [3].
Razdolnaya R.Amur R.Ussury R.WSLRWorld
ElementsR-201R-210R-91R-80R-83A-2A-4A-5U-2U-3[11][3]
Li2.91.51.01.41.91.91.52.20.70.82.7–3.21.8
B44.017.813.4ndnd15.27.215.54.39.215–37-
Al72.0299.9142.730.7334.0167.5198.4191.837.791.07.3–7932
Si84065701934910,08711,378446845544729549156276500-
Sc0.040.080.080.070.130.100.090.080.040.10nd0.07
Ti0.247.306.341.4812.033.945.604.891.161.260.6–6.50.49
V0.281.242.051.310.910.480.861.150.360.630.51–0.790.71
Cr0.120.390.520.300.950.350.390.360.891.380.18–0.280.7
Mn129.010.411.141.545.721.96.13.04.514.710–62.834
Fe127.9234.2158.579.2291.7314.1329.6219.8191.9312.061–23666
Co0.310.120.140.370.320.120.080.090.060.120.10–0.170.15
Ni1.280.981.941.671.360.880.951.290.961.290.87–1.620.80
Cu0.870.941.911.360.970.981.211.681.441.510.52–1.451.48
As0.480.780.790.880.590.470.931.030.950.700.77–1.290.62
Rb1.010.520.520.840.860.830.660.890.620.861.0–1.31.63
Sr17572577889845895394295–32660
Y0.060.190.550.740.210.320.560.420.470.820.02–0.180.04
Zr0.090.390.630.390.870.360.460.480.190.350.03–0.170.04
Mo0.450.480.34nd0.550.410.460.930.300.550.28–0.290.42
Cd0.0050.0020.0040.0090.0040.0050.0040.0040.0090.0160.002–0.0120.080
Ba22.912.09.616.616.718.312.519.67.811.023–4223
La0.0310.1990.4000.6860.1750.3410.6640.4790.4140.7610.01–0.190.120
Ce0.0470.3800.6881.1390.4010.4680.9900.7010.5751.2270.01–0.260.262
Pr0.0080.0490.1090.1810.0460.0860.1560.1130.1130.2060.002–0.0440.040
Nd0.0390.1990.4830.7730.2010.3530.6330.4570.4810.8780.008–0.1880.152
Sm0.0090.0440.1120.1650.0460.0750.1290.0920.1120.1950.002–0.0430.036
Eu0.0040.0090.0250.0350.0110.0140.0240.0190.0230.043nd0.010
Gd0.0150.0440.1190.1710.0480.0700.1280.0950.1150.2000.003–0.0470.040
Tb0.00150.00640.01680.02240.00660.00980.01740.01340.01660.0277nd0.0055
Dy0.0090.0350.0940.1260.0390.0510.0900.0700.0850.1530.002–0.0420.03
Ho0.0020.0070.0190.0250.0080.0110.0180.0140.0170.030nd0.007
Er0.0090.0230.0570.0720.0230.0330.0550.0440.0470.083nd0.02
Tm0.00120.00310.00750.00980.00340.00470.00740.00570.00660.0114nd0.0033
Yb0.00880.01930.04740.06030.02320.03100.04660.03550.04040.07140.002–0.0220.017
Lu0.00150.00320.00720.00980.00360.00480.00710.00530.00650.0108nd0.0024
Hf0.00320.01160.01310.00970.02160.01080.01380.01490.00460.01170.002–0.0230.0059
Pb0.0350.147cont0.117cont0.0990.1410.1410.260cont0.003–0.4570.089
U0.1840.1090.1330.1400.1290.1660.1960.2210.0500.0480.18–0.45
1 Data on filtrates after capsule filter Pall GWV with pore size 0.45 µm. nd, not determined; cont, contamination.
Table 3. Concentration 1 of trace elements in the suspended solids of the boreal rivers of the Russian Far East.
ElementsRazdolnaya R.Amur R.Ussury R.WSLRWorld
R-201R-210R-91A-2A-4A-5U-2U-3[30][31]
Li47.840.224.733.841.335.846.732.715.68.5
Al6.186.304.107.048.895.945.495.753.098.72
Sc14.515.110.312.714.910.810.310.8-18.2
Ti0.290.480.450.350.470.510.320.330.780.44
V869699778488788161129
Cr936178595453565643130
Mn1051165493216041474104611121155142191679
Fe11.864.844.226.504.374.383.664.097.565.81
Co13.016.113.813.114.411.911.411.232.722.5
Ni34.433.340.626.625.425.727.424.126.974.5
Cu32133015172126201675.9
As11.07.210.19.811.813.08.65.434.836.3
Rb79.130.014.271.161.428.233.127.036.378.5
Sr412155131301312212152192180187
Y31241427251515139.821.9
Zr16212010913814112610010735160
Mo0.660.760.991.601.371.181.281.260.492.98
Cd0.160.120.180.170.140.110.410.340.351.55
Ba376307341454590480431477617522
La32271545362018181437.4
Ce62594180744644422973.6
Pr8.67.34.510.69.55.35.35.03.27.95
Nd33.128.518.139.535.620.720.919.512.432.2
Sm7.06.14.17.67.04.34.54.02.56.1
Eu1.41.20.91.41.40.90.90.90.61.3
Gd7.05.84.06.96.34.04.33.82.55.3
Tb1.00.90.61.00.90.60.60.60.340.82
Dy5.44.83.35.24.93.33.43.01.94.3
Ho1.10.90.71.00.90.70.70.60.360.88
Er3.02.72.02.92.81.91.91.81.12.2
Tm0.40.40.30.40.40.30.30.30.150.38
Yb2.52.41.82.62.61.81.91.71.02.1
Lu0.40.40.260.40.40.30.270.250.140.35
Hf0.02.42.92.33.53.22.72.84.84.0
Pb21.822.921.726.625.223.828.624.812.861.1
U1.72.62.54.15.53.83.22.30.83.3
1 Al, Fe in %, other elements in µg/g dry weight.
Table 4. Exceedance of EQS for filterable forms of Al, Fe, Mn, and Co by concentration (µg/L) without clogging influence (Ci) and after clogged membranes (C100–500).
ElementEQS *Range of CiCase of exceedance, %Range of C 100–500Case of exceedance,%
Al10031–3346010–12620
Fe30079–3293042–2410
Mn1003–129101–12910
Co4 **0.06–0.3700.05–0.310
* Ecological quality standards (EQS) for drinking water [40]; ** from [41].
Publisher’s Note: MDPI stays neutral with regard to jurisdictional claims in published maps and institutional affiliations.

