
Differences in Properties between Pebbles and Raw Ore from a SAG Mill at a Zinc, Tin-Bearing Mine
1
School of Resources and Civil Engineering, Northeastern University, Shenyang 110819, China
2
School of Resources, Environment and Materials, Guangxi University, Nanning 530004, China
3
Science and Technology Innovation Center of Smart Water and Resource Environment, Northeastern University, Shenyang 110819, China
*
Authors to whom correspondence should be addressed.
Minerals 2022, 12(6), 774; https://0-doi-org.brum.beds.ac.uk/10.3390/min12060774
Submission received: 12 May 2022
/
Revised: 28 May 2022
/
Accepted: 15 June 2022
/
Published: 17 June 2022
(This article belongs to the Special Issue Experimental and Numerical Studies of Mineral Comminution)
Abstract
:Semi-autogenous (SAG) mills are widely used grinding equipment, but some ore with critical particle sizes cannot be effectively processed by SAG mills and turned into pebbles. This research aims to analyze and compare the properties of raw ore and pebbles from a zinc- and tin-bearing ore. The results show that the contents of sphalerite, cassiterite, biotite, antigorite, pyroxferroite, ferroactinolite, and ilvaite in the raw ore are higher than those in the pebbles, and that the pebbles have higher contents of hedenbergite, chlorite, epidote, actinolite, etc. Meanwhile, the abrasion and impact resistance of pebbles is greater than that of the raw ore. In addition, the sphalerite is evenly embedded, and the grinding process is regular. Fine cassiterite associated with harder minerals is difficult to dissociate; it is often found in softer or brittle minerals which may be easily ground into ore mud. The cassiterite in the pebbles is associated with hard and brittle hedenbergite and soft chlorite, making it difficult to recover. This research provides a good foundation for evaluating the recovery value of pebbles and improving the productivity of the SAG process.
1. Introduction
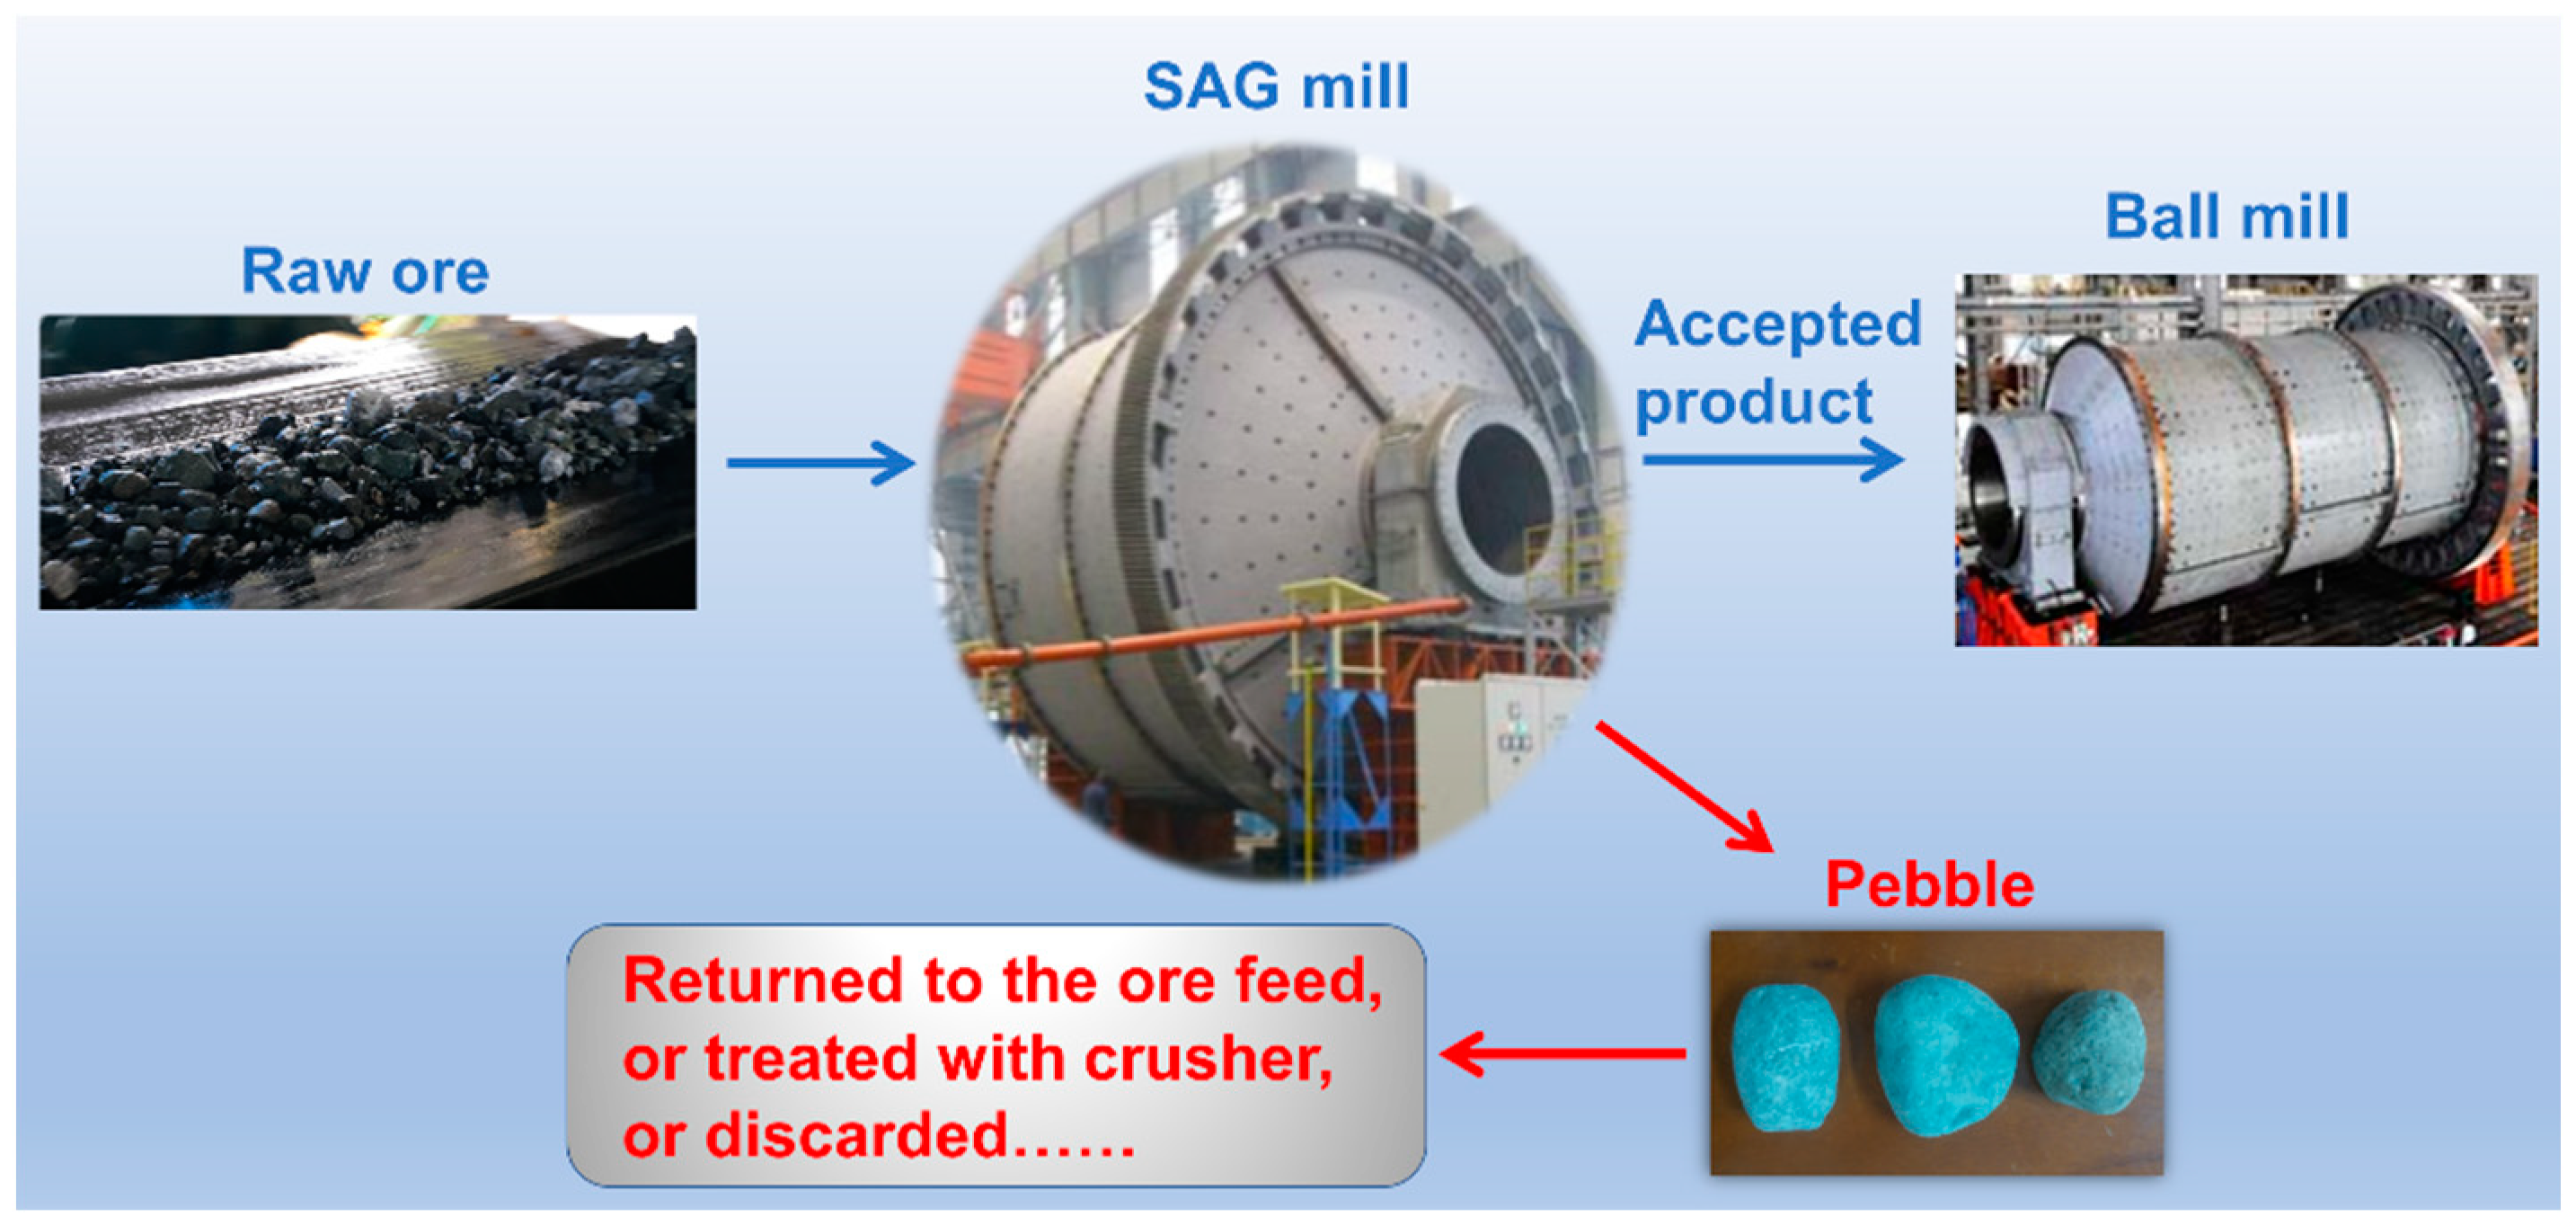
After ore is mined, it first needs to be crushed and ground to suitable particle size. Semi-autogenous grinding (SAG) mills are widely used, large-scale grinding machines that generate a grinding effect through the impact and abrasion of a small amount of grinding medium and ore clasts of different sizes [1]. This process can complete the traditional secondary crushing, fine crushing, and coarse grinding processes, thereby simplifying the crushing and grinding process and equipment required [2]. However, some of the hard ore in the critical particle size range cannot be effectively processed by SAG mills. The critical particle size of the ore can be between 20–70 mm, according to the SAG parameters. These ores, when discharged as unqualified products, are called pebbles [3,4]. Depending on the hardness of the raw ore, the proportion of pebbles is typically between approximately 5% and 25%, and these pebbles are often returned to the mill or treated with additional crushing equipment, such as a jaw crusher or cone crusher (see Figure 1). Consequently, pebbles significantly affect the efficiency of mineral processing production.
The discrete element method (DEM) is often used to analyze the grinding process of SAG mills; it also helps us understand the origins of pebbles [5,6,7,8]. According to the previous DEM analysis, it can be concluded that the primary mode of grinding in the SAG mill is low-energy abrasion. When the abrasion effect acts on the hard part of material, the ore particle cannot be broken as a whole, but a small amount of wear is generated on the surface so that the surface of the ore is ground smooth and turned into a pebble. Therefore, pebbles can also be regarded as a product of selective grinding, and they typically have some property differences compared to raw ore.
In concentrators that include the SAG process, the overall processing capacity of the crushing and grinding circuit is often improved by adding a pebble crushing process [9]. For example, a pebble crusher is added during the return of pebbles to the SAG mill + ball mill (SAB) grinding process, which is an improved version of the SAG mill + ball mill + crusher (SABC) grinding process. Some concentrators add a new, high-pressure roller mill after the pebble crusher. The treatment of pebbles can be understood as supplementing the lack of high-energy impact in the SAG mill [10]. Crawford et al. [11] observed a strong linear relationship between the pebble crusher specific energy and the crusher product size. Li et al. [12] implemented a dynamic AG/SAG model to control a pebble crusher and optimize the circuit throughput. In addition, due to the high hardness of pebbles, some engineers try to use pebbles as the grinding medium in subsequent ball mills or ball-stirring mills [3,4]. However, analyses of pebble properties are still largely incomplete. A systematic study of property differences will help us to evaluate the recovery value of pebbles and improve the grinding process and subsequent separation.
In this study, a sulfide ore with a zinc content of approximately 3.5% was obtained from Yunnan, China. It also contained approximately 0.09% SnO2, which can easily lead to the over-grinding of cassiterite and under-grinding of sulfide ore during the grinding process. In this SAB process, pebbles account for approximately 8.3% of the raw ore, which is representative. The phase composition and intercalation relationship characteristics and differences of raw ore and pebble were analyzed by the Advanced Mineral Identification and Characterization System (AMICS). The breakage characteristics and differences of raw ore and pebble were analyzed by the JKMRC drop weight test (JKDWT). The grinding test was carried out in a laboratory ball mill, and the enrichment characteristics of the target elements in the raw ore and pebble at each particle size range over time were analyzed.
2. Materials and Methods
2.1. Materials
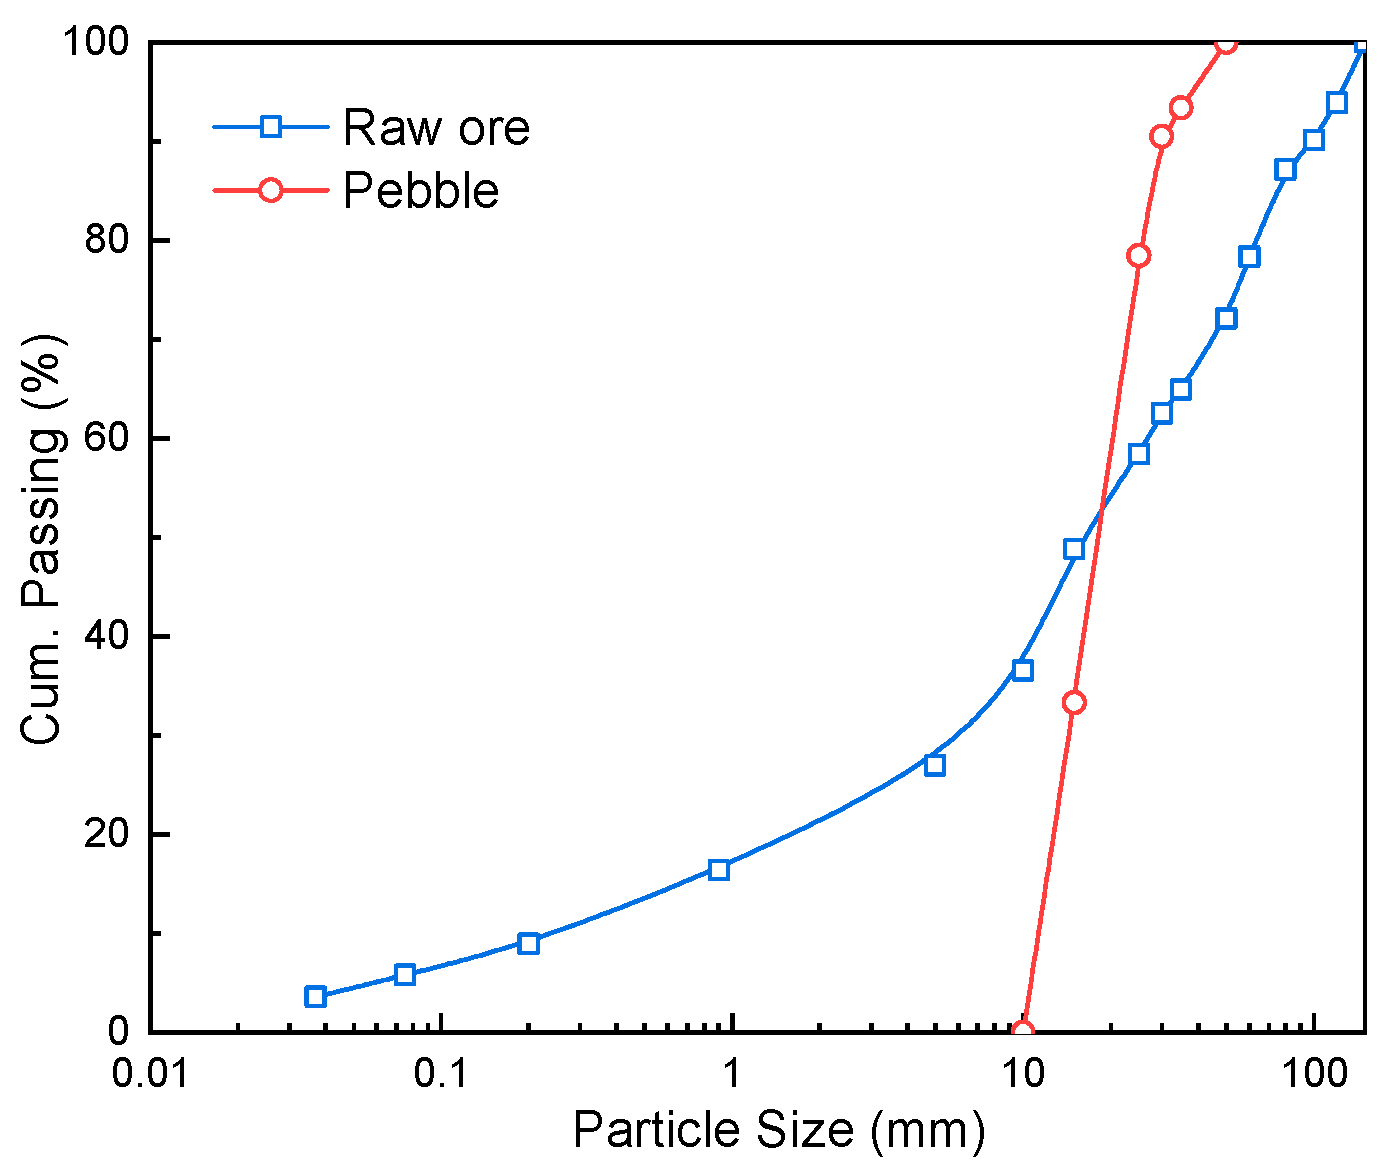
In the grinding process investigation, representative raw ore and pebbles were taken from their respective belts. A particle size analysis of the samples is shown in Figure 2. After the regular ore blocks used in the JKDWT were selected, the remaining raw ore and pebbles were mixed, respectively, and 500 kg raw ore and pebbles were divided and transported to the laboratory. These samples were crushed to <3 mm via the common, three-stage process with a single closed circuit crushing process, and were divided into 400 g portions for grinding tests and AMICS tests.
2.2. AMICS Measurements
AMICS is a state-of-the-art mineralogy research method which can be used for the automatic identification and quantitative characterization of minerals [13,14,15]. A representative sample is mixed with epoxy resin and a curing agent and cured. After cutting the surface, it is polished and sprayed with carbon to ensure conductivity. The Sigma 500 field emission scanning electron microscope (FESEM, ZEISS, Germany) and the XFlash® 5000 series silicon drift detector (SDD, Bruker, Germany) and energy-dispersive spectroscopy (EDS, Bruker, Germany) can be used to acquire data across the entire surface. In this study, the AMICS process software was used for the automatic quantitative analyses of the mineral parameters.
2.3. JKDWT Method
JKDWT is one of the most popular methods to characterize ore response for modeling SAG mills [16]. It is divided into a standard drop weight test and an abrasion test. The results can be used to characterize the grindability of ore under impact and abrasion [17,18]. Five groups of samples of −63 + 53 mm, −45 + 37.5 mm, −31.5 + 26.5 mm, −22.4 + 19 mm, and −16 + 13.2 mm were subjected to three specific crushing energy (Ecs) tests in the standard drop weight test. The change in Ecs was realized by calculating the hammer weight, falling height, and ore weight. Particle size analyses were carried out for each group of products, and breakage intensity (t10, the percentage of progenies that were smaller than 1/10 of the original particle size) was used to describe particle size characteristics. A power-law relationship (Equation (1)) can be used to fit the parameters A and b of the impact resistance of the ore.
t10 = A(1 − e−b×Ecs)
First, 1500 ± 10 g ore was selected from the two sizes, i.e., −53 + 45 mm and −45 + 37.5 mm, and ground for 10 min in a Φ305 mm × 305 mm mill without grinding media in the abrasion test. Particle size analyses were carried out for the products, and t10 values were obtained. The characteristic parameter ta of the abrasion resistance of the ore was t10/10.
2.4. Ball Mill Grinding Tests
Next, 400 g of ore and 200 mL of water were put into a Φ200 mm × 240 mm ball mill in the laboratory. The speed of the ball mill was 110 r/min and the volume was 7.5 L. In this test, 31 mm, 25 mm, and 19 mm steel media accounted for 30%, 35%, and 35% respectively, with a 30% filling rate. After the grinding products were sieved, the chemical element compositions of the products of each particle size were analyzed.
3. Results and Discussion
3.1. Process Mineralogy Analysis
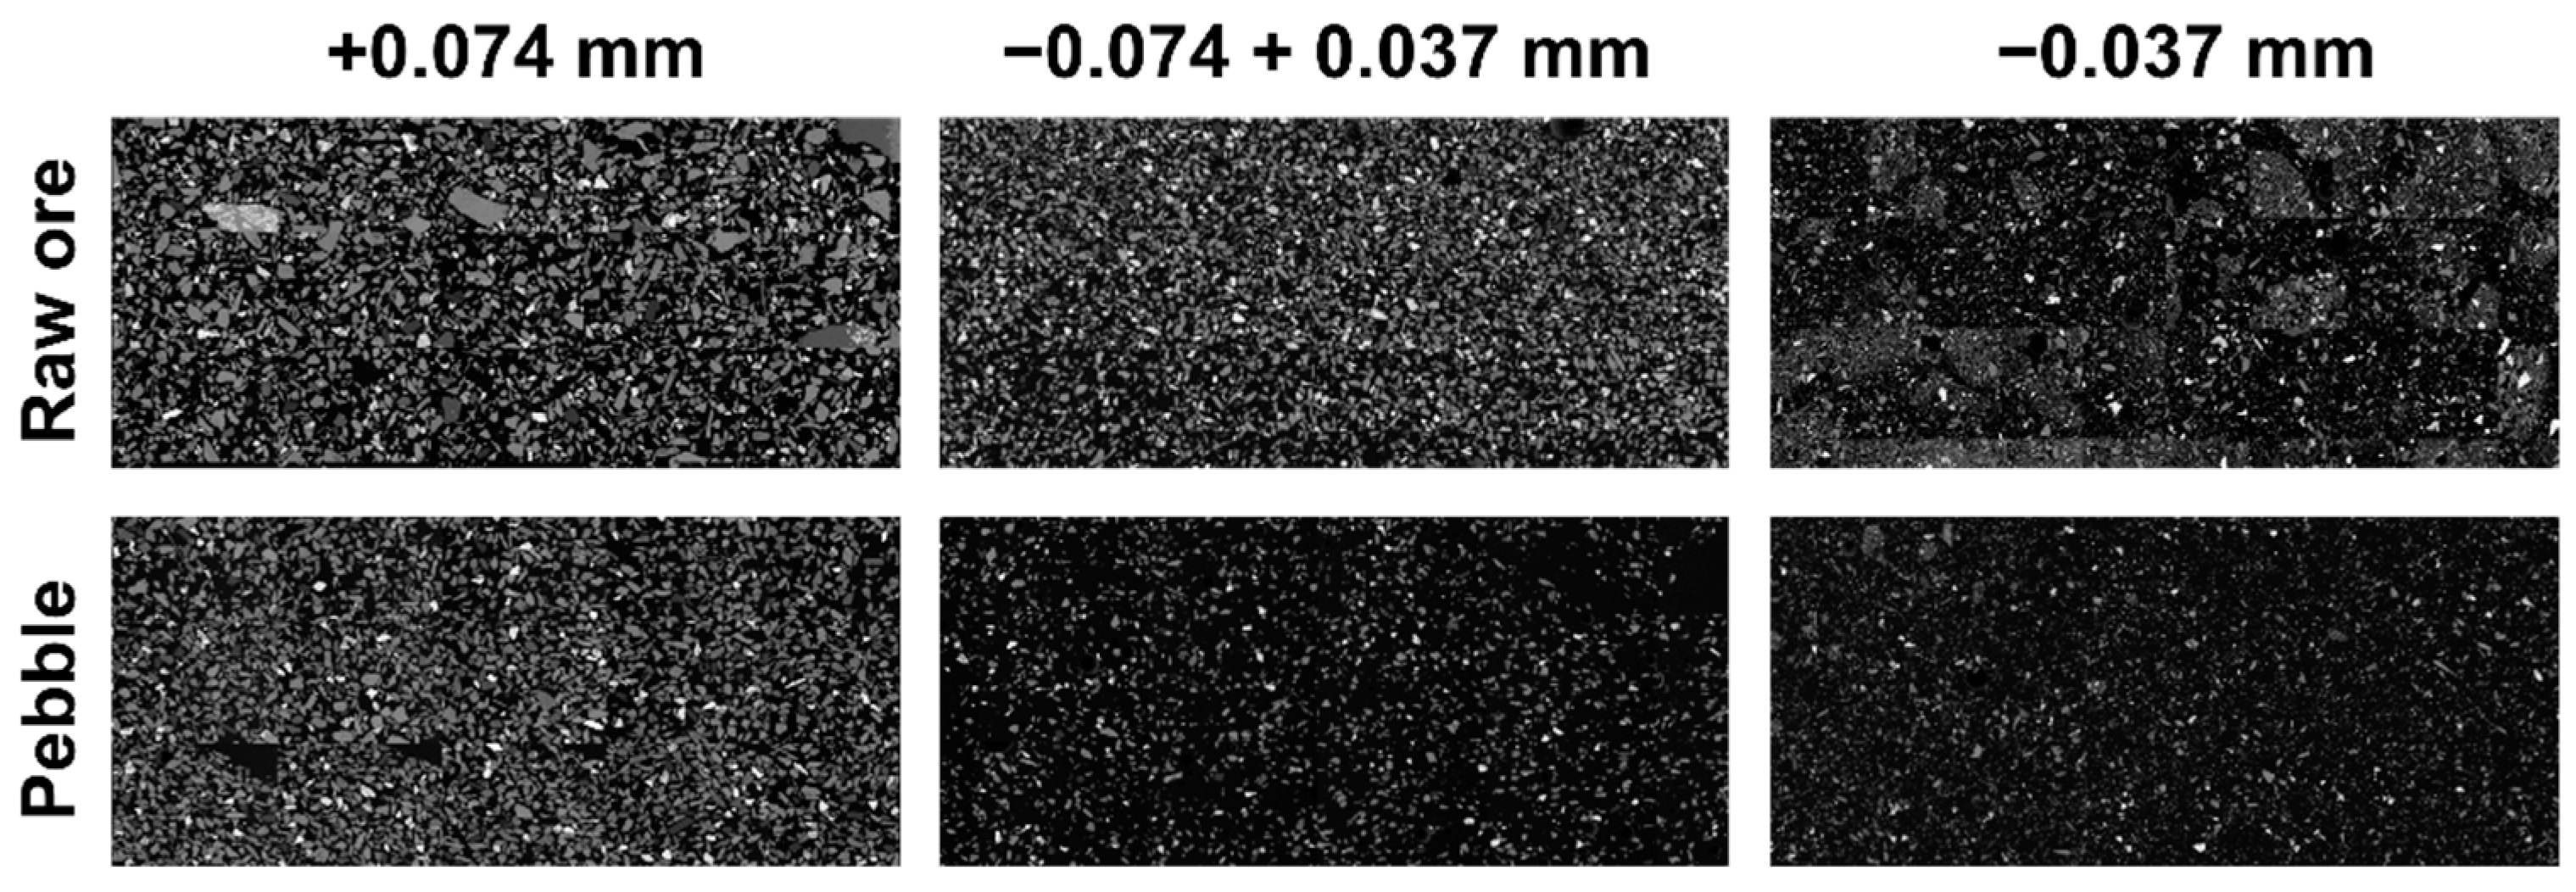
SEM images of representative surfaces are shown in Figure 3. The mineral components of the raw ore and pebbles from representative surfaces are shown in Table 1. Among the main valuable components, Zn is mainly found in sphalerite, and Sn is mainly found in cassiterite. A mineral analysis showed that valuable minerals were more abundant in the raw ore than in the pebbles, which indicates that the recovery value of the raw ore is higher, even though the pebbles also have a specific value [19]. In addition, the content of iron in the raw ore corresponded to the higher mineral content of sphalerite, biotite, and pyroxferroite. The main gangue minerals included silicates and carbonates, including calcite, dolomite, and siderite. The main calcium mineral composition corresponded to hedenbergite and epidote, followed by calcite and dolomite. In addition, the pebbles contained approximately 8.92% chlorite, i.e., higher than the 3.07% chlorite content of the raw ore. Some other ores, including antigorite, biotite, ferroactinolite, and pyroxferroite, have higher contents in the raw ore.
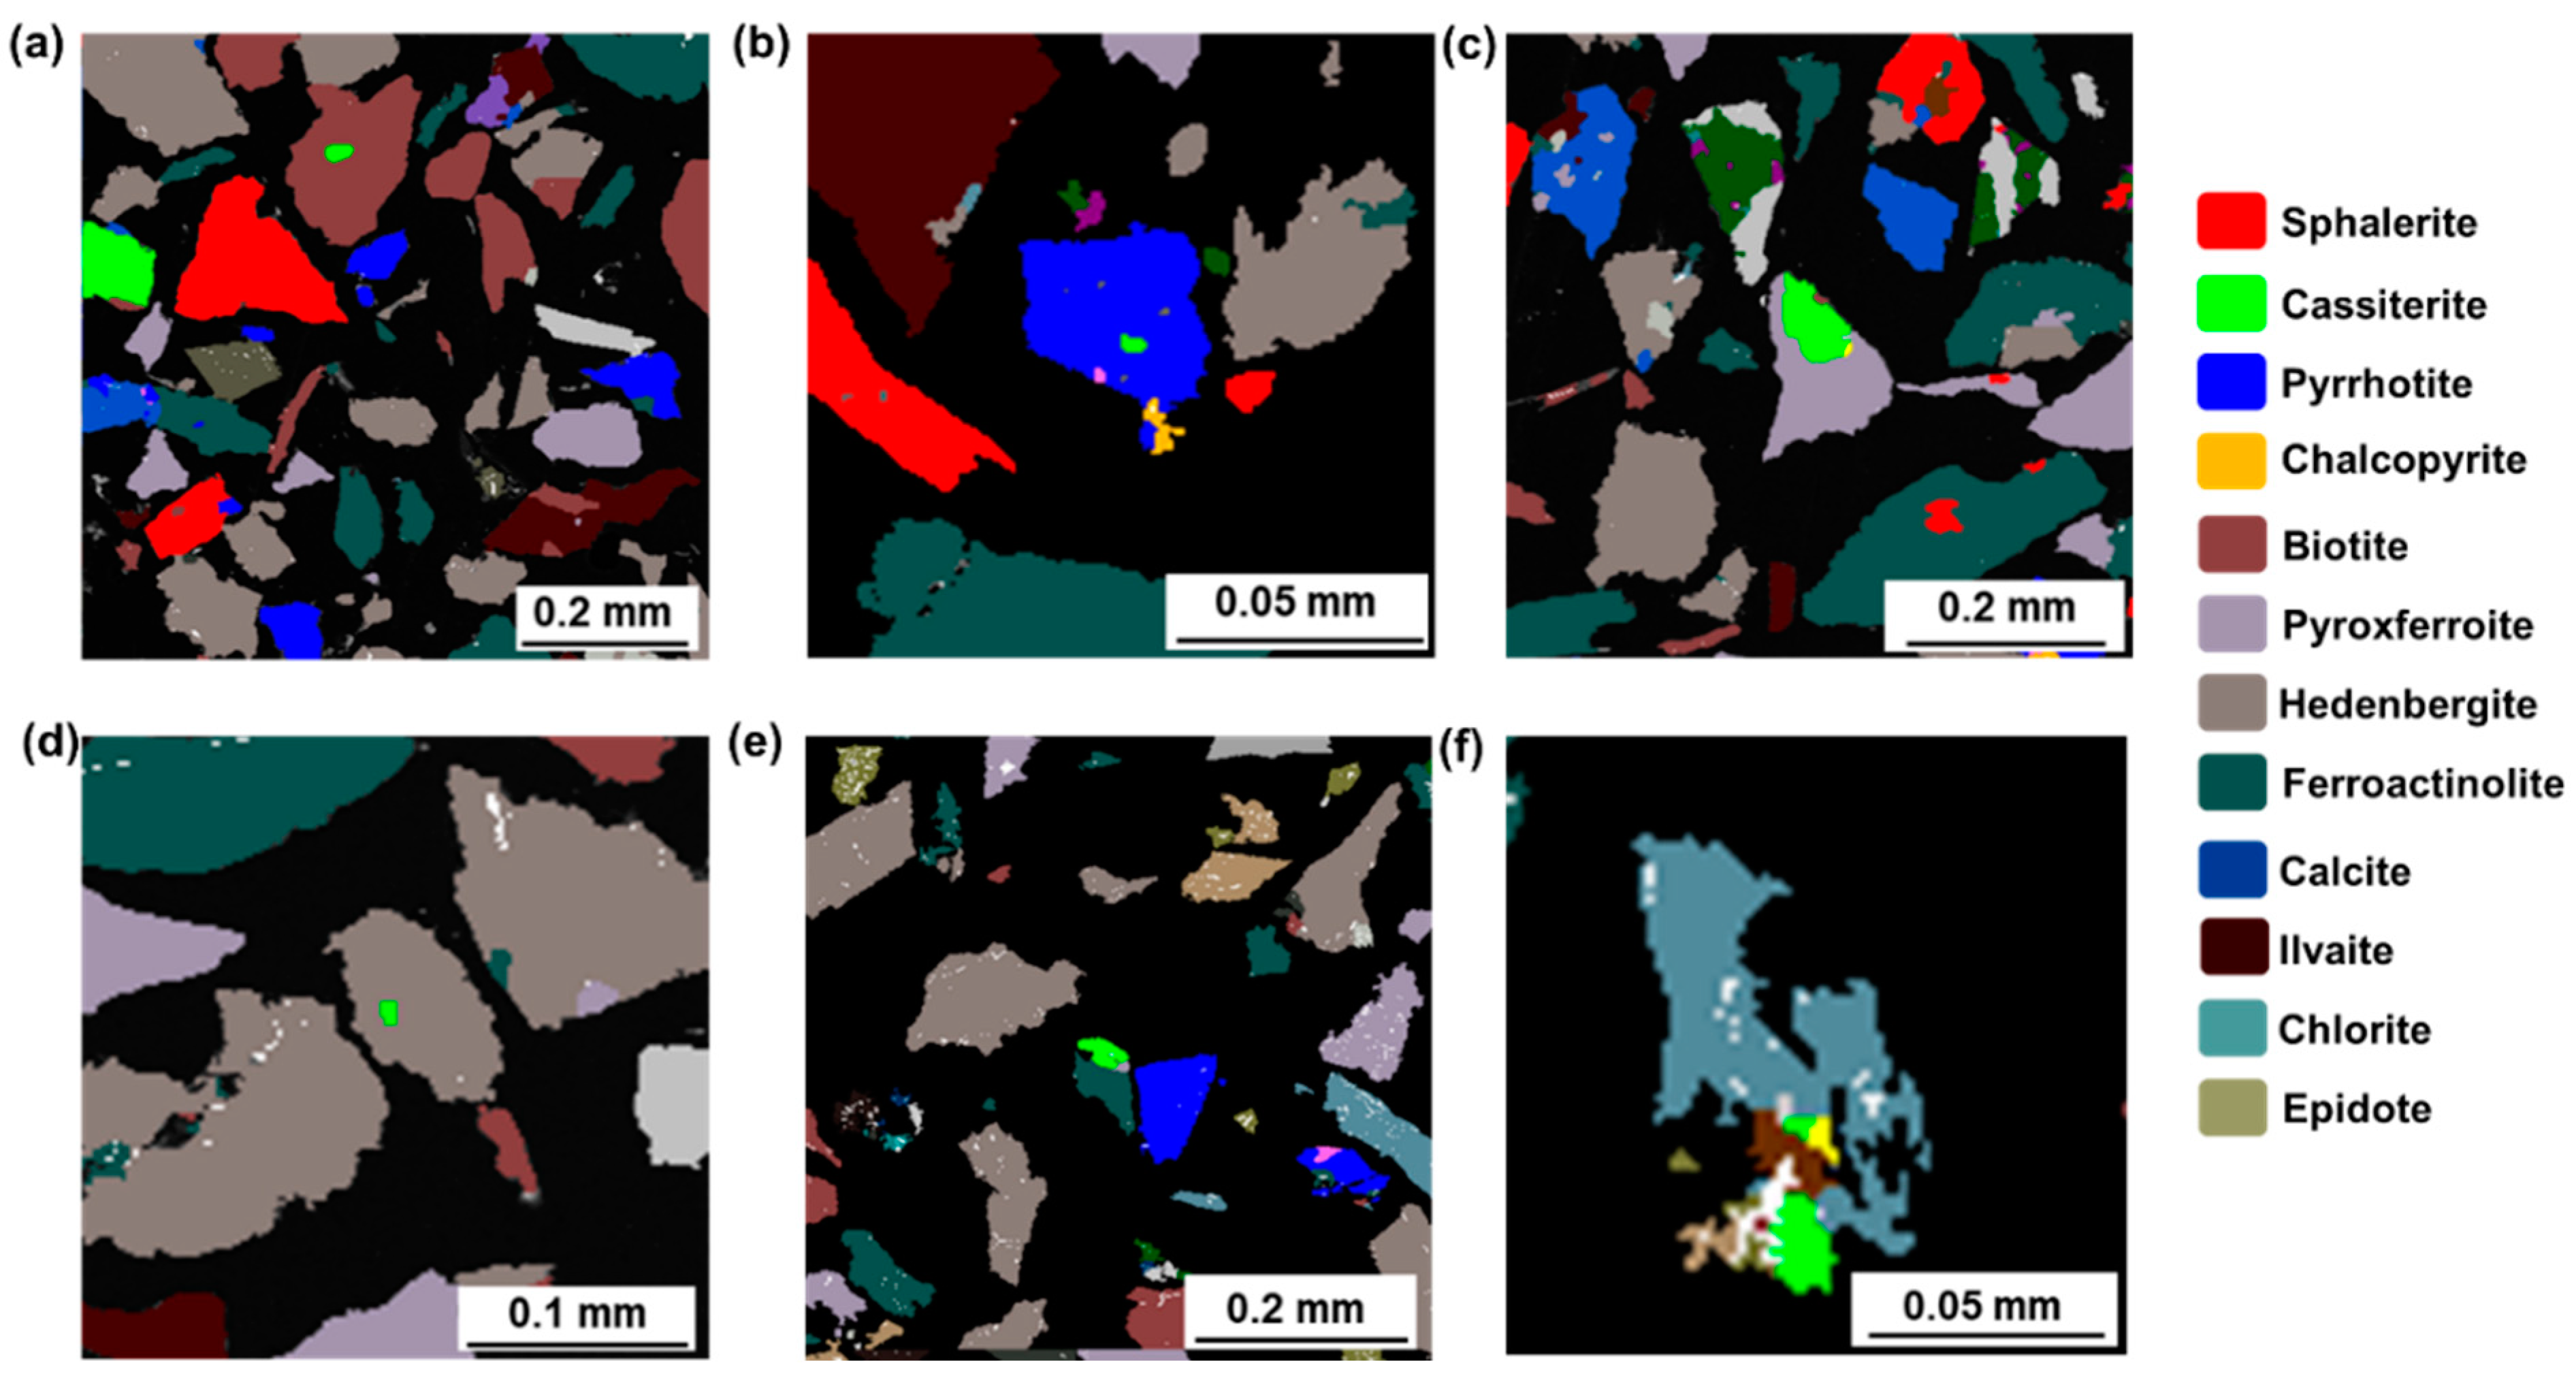
Figure 4 shows several typical embedment relationships between cassiterite and other minerals. The overall distribution of sphalerite was relatively uniform, and there was no apparent relationship with any other mineral. In Figure 4a–c, fine particles of cassiterite (green) are coated in biotite, pyrrhotite, and hedenbergite. Figure 4d,e show that cassiterite was associated with pyroxferroite and ferroactinolite. In addition, the obvious association of chlorite and cassiterite was only found in the pebble sample, which is shown in Figure 4f.
The distance between the cassiterite edge and other minerals was quantified in the AMICS, and the results are shown in Table 2. A part of cassiterite was embedded in biotite and ferroactinolite, and its proportion decreased steadily as the particle size decreased, indicating that this part of cassiterite was not challenging to dissociate from these minerals, and that this process was balanced. The relationship between cassiterite and pyrrhotite was observed at each particle size, and its decrease was not apparent with the reduction in particle size. Based on Figure 4b, the fine cassiterite particles embedded in pyrrhotite were difficult to dissociate [20]. In addition, pyroxferroite and hedenbergite occupied a higher proportion in the particle size range of −0.037 mm, indicating that the cassiterite in the harder pyroxene mineral was also difficult to dissociate. The data demonstrate that the association relationship of the hedenbergite was more robust in the pebbles than in the raw ore [21]. In addition, the association of cassiterite and chlorite was only found in pebbles and was relatively easy to dissociate.
According to the process mineralogy results and production practice, it can be concluded that most of the pebbles originated from the surrounding rock stripped during the mining process. For mines with a higher stripping ratio, this may increase the load of the subsequent SAG process. AMICS can be used in preliminary assessments of the recovery value of pebbles and the associated relationship of minerals, and can provide guidance for improving the grinding process.
3.2. Grinding Properties Analysis
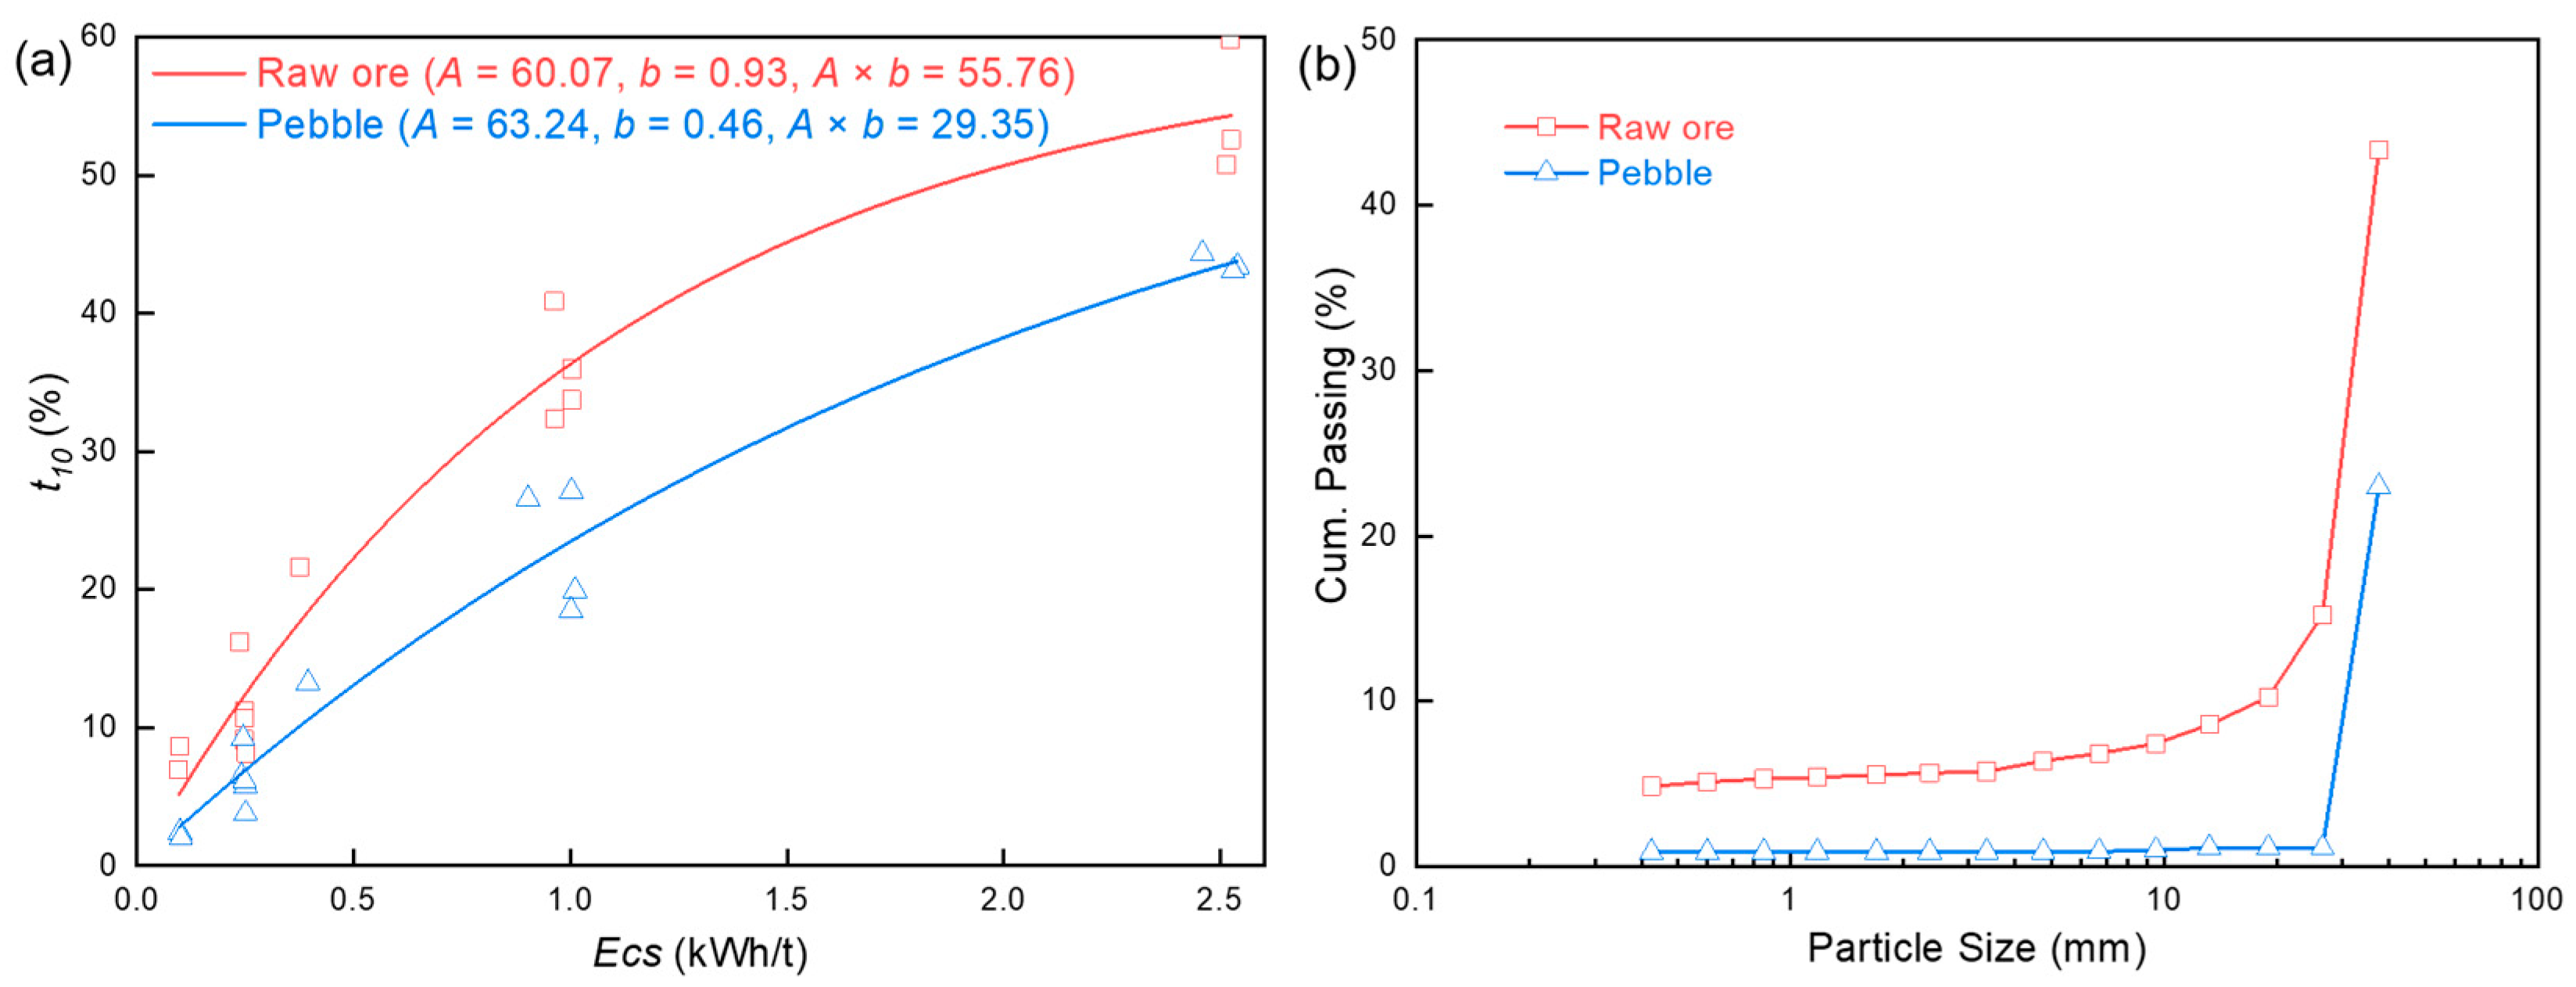
Figure 5a shows the results of the standard drop weight test. On the whole, the impact resistance of pebbles is obviously stronger than that of raw ore. The pebbles could be effectively broken in most experimental conditions, but under the condition of a low Ecs of 0.1 kWh/t, the effect of pebbles being broken was very poor. For example, the product less than 19 mm accounted for only 10.69% in the −63 + 53 mm fraction tests and only 16.37% in the −45 + 37.5 mm fraction tests, while in the raw ore, they corresponded to 28.52% and 35.58%, respectively. Parameters A and b were obtained through the fitting process of Equation (1), and the A × b of the raw ore and pebbles were 55.76 and 29.35, respectively. The raw ore was classified as having a medium hardness, and the pebbles were classified as having a hardness between hard and extremely hard in the database from JKtech.
Figure 5b shows the abrasion tests results. The pebbles did not produce ore body fractures in this grinding method with extremely low energy; instead, only minor damage occurred on the mineral surface. This indicates that the abrasion resistance of the pebble is very strong, and that grinding with low Ecs cannot effectively treat pebbles. The values of parameter ta for the raw ore and pebble were calculated to be 0.6 and 0.09, respectively, defined as a softer hardness and an extremely hard hardness in the JKtech database. The pebbles exhibited a greater difference from the raw ore in terms of abrasion resistance rather than impact resistance. This means that the pebbles were too coarse to undergo body breakage by either grinding media or coarse ore particles, which is the main reason for the production of the pebble.
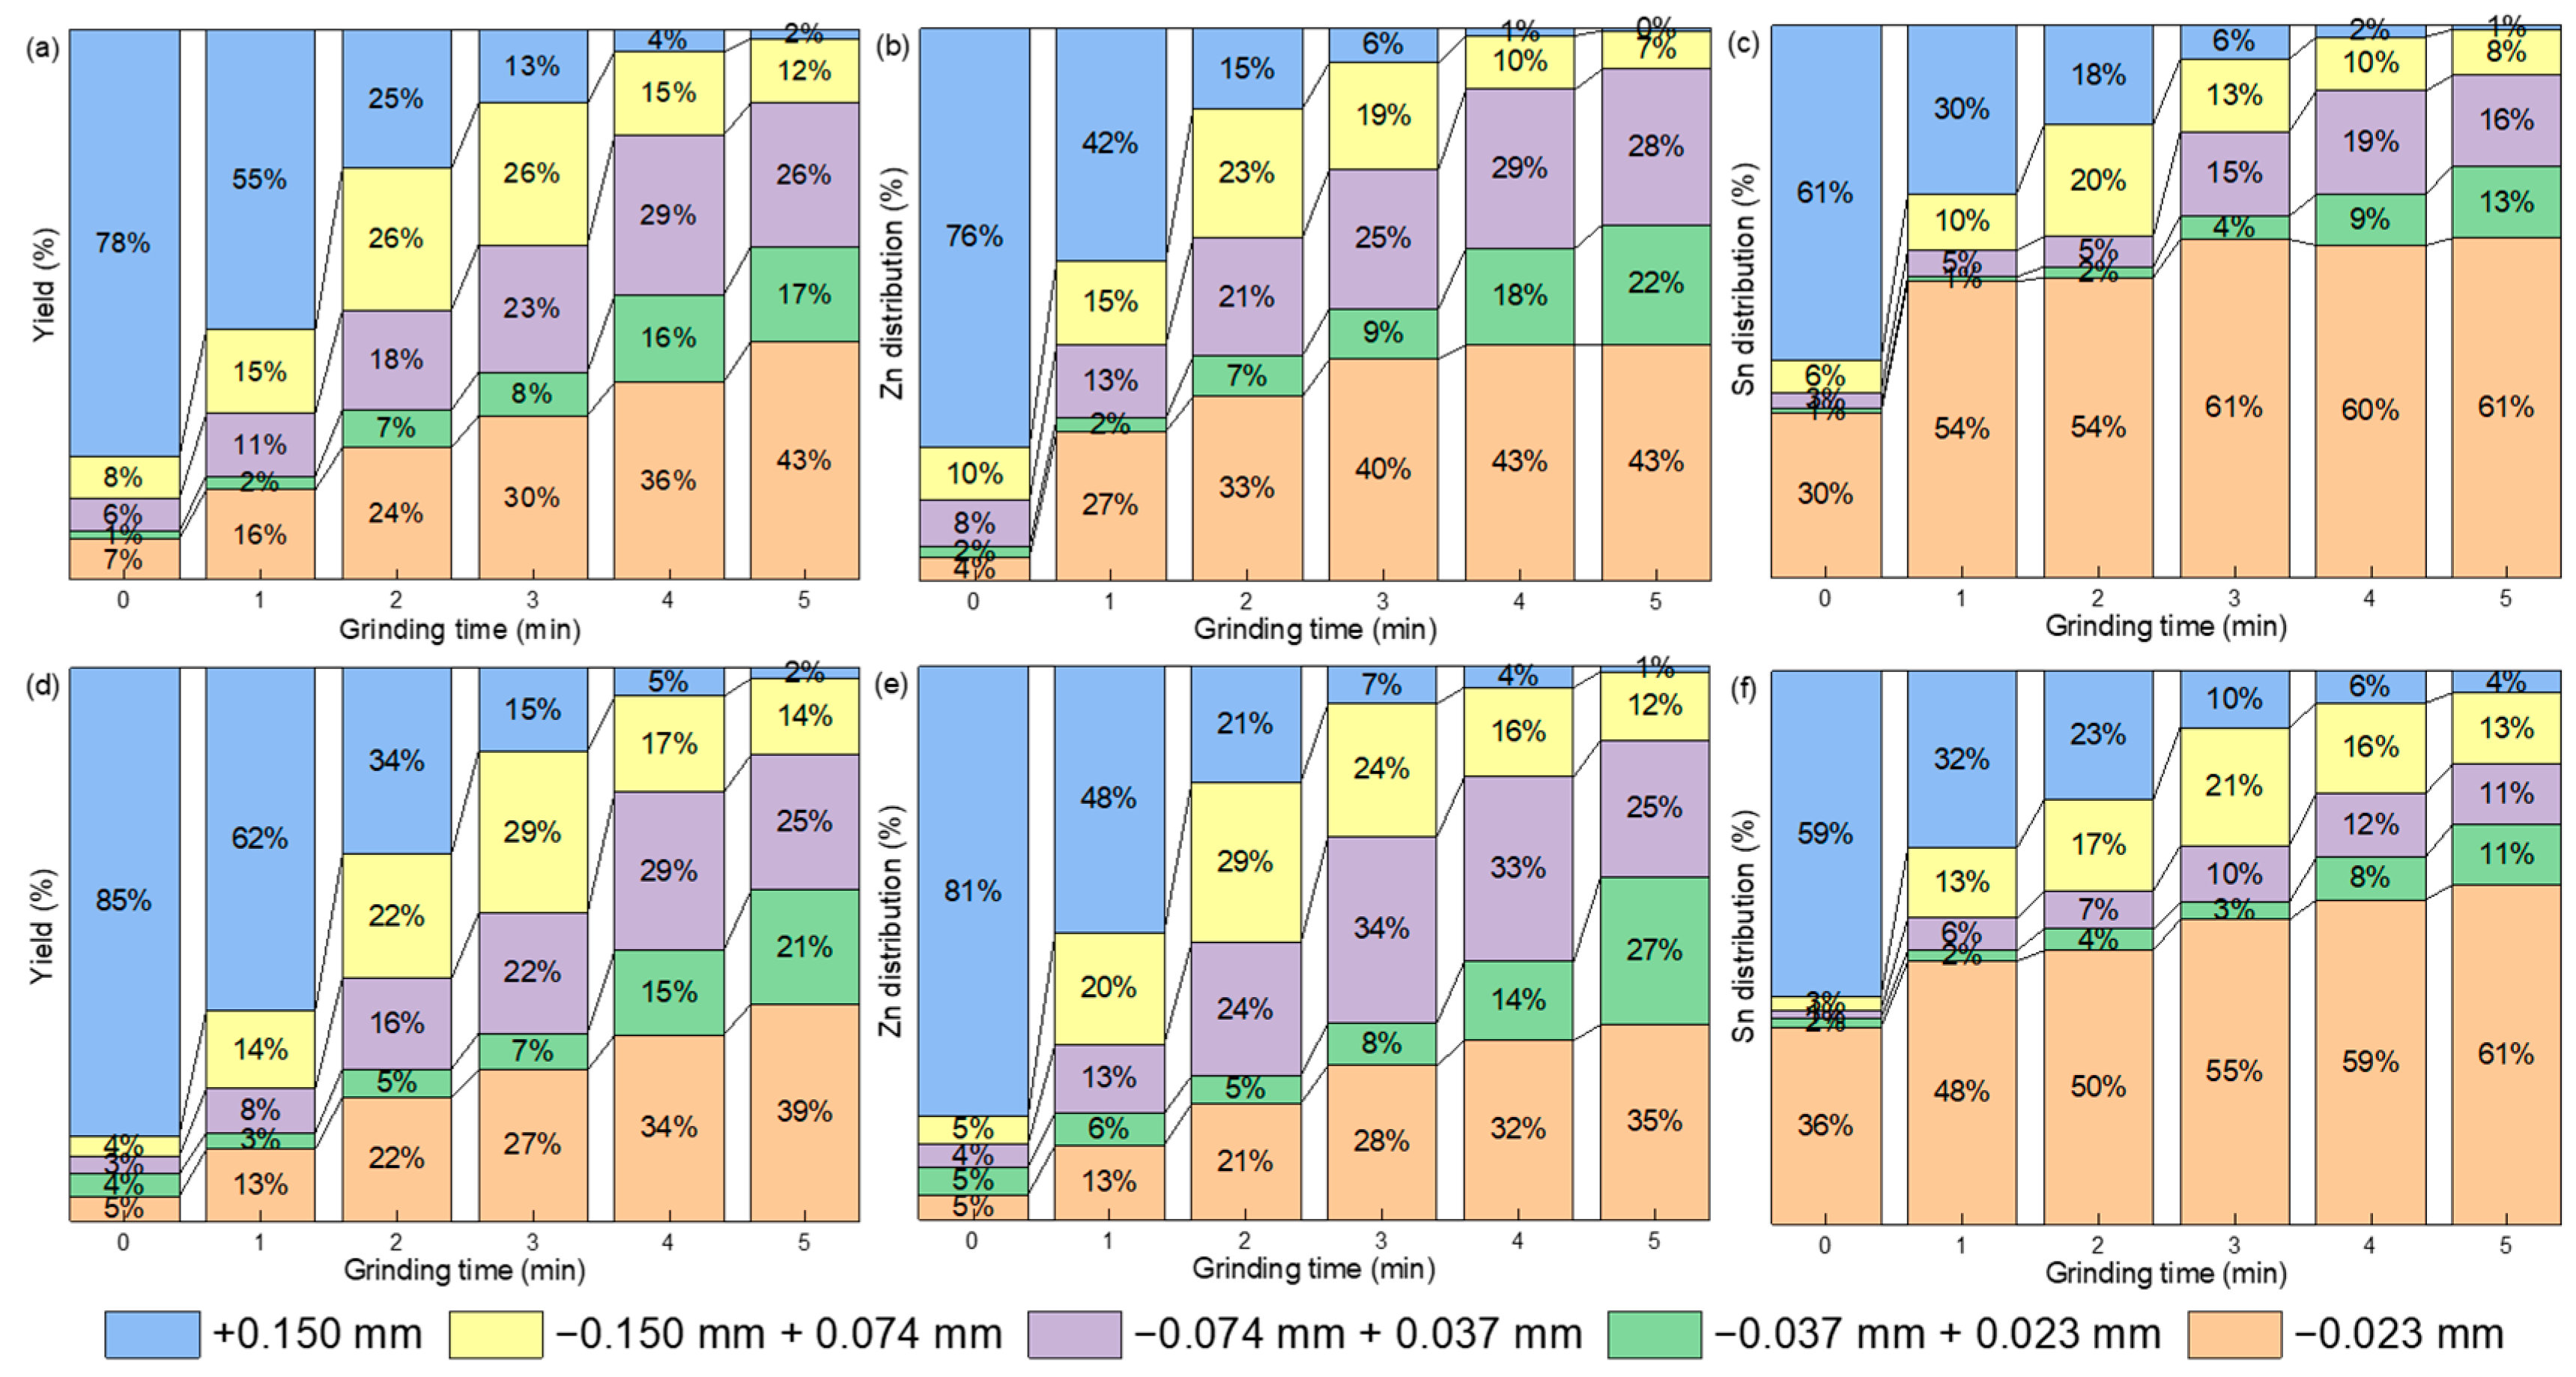
The results of ball mill grinding tests are shown in Figure 6. Figure 6a,d show the effect of grinding time on the particle size composition of the raw ore and pebbles, respectively. As expected, the grindability of the raw ore was stronger than that of the pebbles in the ball mill, although this distinction was less obvious as in the abrasion test. In the ball mill, the main grinding method was the impact of the steel ball medium with the finer ore particles, and the Ecs was high because the weight of the single steel ball was significantly greater than that of the particle [22]. Additionally, when the ore gradually dissociated into finer particles, the protective effect of the harder minerals on the softer minerals gradually weakened in the pebbles [23]. As a result, the grindability in the ball mill grinding tests was not consistent with that of the abrasion tests.
The effect of grinding time on the Zn distribution of each particle size in the raw ore and pebbles is shown in Figure 6b,d, respectively. Sphalerite was the main Zn-bearing mineral, and the hardness of sphalerite (3.5–4) in the ore was relatively moderate, so the Zn distribution was similar to the yield for each particle size. When the grinding time reached 4 and 5 min, it can be seen that the Zn distribution at +0.037 mm was lower than the yield, indicating that the harder components were enriched in the product at +0.037 mm at these grinding times. According to process mineralogy research, it can be determined that this grain size contains more pyroxene minerals.
The effect of grinding time on Sn distribution in the raw ore and pebbles is shown in Figure 6c,e, respectively. On the one hand, the distribution of Sn in the fine particle size of −0.023 mm was high. When the samples were not ground, 30% and 36% Sn was recovered at −0.023 mm in the raw ore and pebbles, respectively, reaching 54% and 48%, respectively, after 1 min of grinding, indicating that cassiterite was easier to over-grind, producing a large amount of sludge. Part of this was caused by the association of cassiterite with softer ores. When it is associated with harder and highly brittle minerals (such as pyroxene), it can still be directly over-ground under higher energy. In addition, after the grinding time was gradually increased to 5 min, the Sn in the +0.150 mm particles of the sample was still distributed at +0.023 mm after grinding, which indicated that the grinding efficiency of cassiterite was relatively low when it was associated with harder minerals. Therefore, the association relationship between cassiterite and other minerals presented a phenomenon of soft and hard differentiation [20]. The Sn distribution of the pebbles at −0.023 mm without grinding was 36%, i.e., higher than the value of 30% for the raw ore. This was likely related to the fact that the association of chlorite and cassiterite is only found in the pebbles, and the proportions of cassiterite and brittle hedenbergite in the pebbles was higher than those in the raw ore. When the grinding time reached 3 min or more, the distribution of Sn in the +0.074 mm particle size of the pebble was higher than that in the raw ore. This was likely because Sn was more contiguous with the hard hedenbergite in the pebbles, leading to Sn enrichment in coarser particles. In other words, since the cassiterite in the pebbles had a higher probability of being associated with softer and more brittle ores, the grinding process of pebbles was challenging to control, and the Sn was more difficult to recover from the pebbles than the raw ore.
4. Conclusions
Valuable minerals in the zinc- and tin-bearing ore from Yunnan include sphalerite, pyrrhotite, and cassiterite, as well as gangue minerals including a variety of silicate minerals and carbonate minerals. The contents of sphalerite, cassiterite, biotite, antigorite, pyroxferroite, ferroactinolite, and ilvaite are higher in the raw ore, whereas the contents of hedenbergite, chlorite, epidote, actinolite, etc. are higher in the pebbles. Meanwhile, the abrasion and impact resistance of the pebbles are significantly higher than those of the raw ore. The grindability of the raw ore is stronger than that of the pebbles in the ball mill. Additionally, the sphalerite is evenly embedded, and the grinding process is regular. Fine cassiterite associated with harder minerals is difficult to dissociate, and fine cassiterite associated with softer minerals or more brittle minerals is easily ground into ore mud. The cassiterite in the pebbles is associated with hard and brittle hedenbergite and soft chlorite, making it relatively difficult to recover. The research results provide a foundation for evaluating the recovery value of pebbles and improving the production of the SAG process.
Author Contributions
W.S.: Conceptualization, Methodology, Software, Visualization, Investigation, Formal Analysis, Writing—Original Draft; J.Y.: Conceptualization, Validation, Resources, Supervision, Writing—Review and Editing; H.L.: Resources, Supervision, Writing—Review and Editing; W.L.: Visualization, Resources, Supervision, Writing—Review and Editing; S.M.: Resources, Supervision, Funding Acquisition, Writing—Review and Editing. All authors have read and agreed to the published version of the manuscript.
Funding
This research was funded by National Natural Science Foundation of China (51874105).
Data Availability Statement
Data associated with this research are available and can be obtained by contacting the corresponding author.
Conflicts of Interest
The authors declare no conflict of interest.
References
- Apelt, T.A.; Thornhill, N.F. Inferential measurement of sag mill parameters IV: Inferential model validation. Miner. Eng. 2009, 22, 1032–1044. [Google Scholar] [CrossRef] [Green Version]
- Behnamfard, A.; Namaei Roudi, D.; Veglio, F. The performance improvement of a full-scale autogenous mill by setting the feed ore properties. J. Clean. Prod. 2020, 271, 122554. [Google Scholar] [CrossRef]
- Nkwanyana, S.; Loveday, B. Addition of pebbles to a ball-mill to improve grinding efficiency—Part 2. Miner. Eng. 2018, 128, 115–122. [Google Scholar] [CrossRef]
- Nkwanyana, S.; Loveday, B. Addition of pebbles to a ball-mill to improve grinding efficiency. Miner. Eng. 2017, 103–104, 72–77. [Google Scholar] [CrossRef]
- Cleary, P.W.; Owen, P. Effect of particle shape on structure of the charge and nature of energy utilisation in a SAG mill. Miner. Eng. 2019, 132, 48–68. [Google Scholar] [CrossRef]
- Cleary, P.W.; Morrison, R.D.; Sinnott, M.D. Prediction of slurry grinding due to media and coarse rock interactions in a 3D pilot SAG mill using a coupled DEM + SPH model. Miner. Eng. 2020, 159, 106614. [Google Scholar] [CrossRef]
- Cleary, P.W.; Owen, P. Effect of operating condition changes on the collisional environment in a SAG mill. Miner. Eng. 2019, 132, 297–315. [Google Scholar] [CrossRef]
- Cleary, P.W.; Delaney, G.W.; Sinnott, M.D.; Morrison, R.D. Inclusion of incremental damage breakage of particles and slurry rheology into a particle scale multiphase model of a SAG mill. Miner. Eng. 2018, 128, 92–105. [Google Scholar] [CrossRef]
- Rodrigues, A.F.d.V.; Delboni, H., Jr.; Powell, M.S.; Tavares, L.M. Comparing strategies for grinding itabirite iron ores in autogenous and semi-autogenous pilot-scale mills. Miner. Eng. 2021, 163, 106780. [Google Scholar] [CrossRef]
- Hadizadeh, M.; Farzanegan, A.; Noaparast, M. A plant-scale validated MATLAB-based fuzzy expert system to control SAG mill circuits. J. Process Control 2018, 70, 125381109. [Google Scholar] [CrossRef]
- Crawford, A.; Zheng, X.; Manton, P. Incorporation of Pebble Crusher Specific Energy Measurements for the Optimisation of SABC Grinding Circuit Throughput at Telfer. In Proceedings of the Tenth Mill Operators Conference, Adelaide, SA, Australia, 12–14 October 2009; pp. 305–315. [Google Scholar]
- Li, H.J.; Evertsson, M.; Lindqvist, M.; Hulthen, E.; Asbjornsson, G. Dynamic modeling and simulation of a SAG mill-pebble crusher circuit by controlling crusher operational parameters. Miner. Eng. 2018, 127, 98–104. [Google Scholar] [CrossRef]
- Montross, S.N.; Verba, C.A.; Chan, H.L.; Lopano, C. Advanced characterization of rare earth element minerals in coal utilization byproducts using multimodal image analysis. Int. J. Coal Geol. 2018, 195, 362–372. [Google Scholar] [CrossRef]
- Jiao, Y.; Qiu, K.H.; Zhang, P.C.; Li, J.F.; Zhang, W.T.; Chen, X.F. Process mineralogy of Dalucao rare earth ore and design of beneficiation process based on AMICS. Rare Met. 2020, 39, 959–966. [Google Scholar] [CrossRef]
- Barker, R.D.; Barker, S.L.L.; Wilson, S.A.; Stock, E.D. Quantitative Mineral Mapping of Drill Core Surfaces I: A Method for mu XRF Mineral Calculation and Mapping of Hydrothermally Altered, Fine-Grained Sedimentary Rocks from a Carlin-Type Gold Deposit. Econ. Geol. 2021, 116, 803–819. [Google Scholar] [CrossRef]
- Faramarzi, F.; Napier-Munn, T.; Morrison, R.; Kanchibotla, S.S. The extended drop weight testing approach—What it reveals. Miner. Eng. 2020, 157, 106550. [Google Scholar] [CrossRef]
- Shi, F.; Kojovic, T. Validation of a model for impact breakage incorporating particle size effect. Int. J. Miner. Processing 2007, 82, 156–163. [Google Scholar] [CrossRef]
- Pauw, O.G.; Maré, M.S. The determination of optimum impact-breakage routes for an ore. Powder Technol. 1988, 54, 3–13. [Google Scholar] [CrossRef]
- Nuorivaara, T.; Serna-Guerrero, R. Unlocking the potential of sustainable chemicals in mineral processing: Improving sphalerite flotation using amphiphilic cellulose and frother mixtures. J. Clean. Prod. 2020, 261, 121143. [Google Scholar] [CrossRef]
- Zhou, W.; Han, Y.; Li, Y.; Sun, Y.; Yang, J.; Ma, S. Process mineralogy and grinding optimization of cassiterite polymetallic sulphide ore. J. Cent. South Univ. (Sci. Technol.) 2019, 50, 1271–1277. [Google Scholar]
- Jara, A.D.; Woldetinsae, G.; Betemariam, A.; Kim, J.Y. Mineralogical and petrographic analysis on the flake graphite ore from Saba Boru area in Ethiopia. Int. J. Min. Sci. Technol. 2020, 30, 715–721. [Google Scholar] [CrossRef]
- Amelunxen, P.; Berrios, P.; Rodriguez, E. The SAG grindability index test. Miner. Eng. 2014, 55, 42–51. [Google Scholar] [CrossRef]
- Wentao, Z.; Yuexin, H.; Yanjun, L.; Jinlin, Y.; Shaojian, M.; Yongsheng, S. Research on prediction model of ore grinding particle size distribution. J. Dispers. Sci. Technol. 2020, 41, 537–546. [Google Scholar] [CrossRef]
Figure 1.
Schematic illustration of pebbles and the SAG process.

Figure 2.
Particle size distribution of raw ore and pebble in the grinding process investigation.

Figure 3.
SEM images of representative surfaces.

Figure 4.
(a) Association of cassiterite and biotite in raw ore; (b) Association of cassiterite and pyrrhotite in raw ore; (c) Association of cassiterite and pyroxferroite in raw ore; (d) Association of cassiterite and hedenbergite in raw ore; (e) Association of cassiterite and ferroactinolite in pebble; (f) Association of cassiterite and chlorite in pebble.

Figure 5.
(a) Relation between Ecs and t10; (b) Particle size distribution of abrasion products.

Figure 6.
(a) Yield in each particle size of raw ore grinding products; (b) Zn distribution in each particle size of raw ore grinding products; (c) Sn distribution in each particle size of raw ore grinding products; (d) Yield in each particle size of pebble grinding products; (e) Zn distribution in each particle size of pebble grinding products; (f) Sn distribution in each particle size of pebble grinding products.


Table 1.
The mineral components in the raw ore and pebbles (wt%).
| Mineral | Raw Ore | Pebbles |
|---|---|---|
| Sphalerite | 7.89 | 5.55 |
| Cassiterite | 0.06 | 0.04 |
| Hedenbergite | 20.62 | 28.85 |
| Biotite | 6.79 | 4.25 |
| Antigorite | 3.44 | 0.04 |
| Pyroxferroite | 8.08 | 5.93 |
| Ferroactinolite | 19.24 | 15.48 |
| Calcite | 4.25 | 5.96 |
| Pyrrhotite | 4.05 | 5.54 |
| Dolomite | 2.15 | 3.38 |
| Chlorite | 3.07 | 8.92 |
| Epidote | 0.95 | 7.31 |
| Siderite | 3.016 | 3.889 |
| Actinolite | 0.33 | 2.05 |
| Ilvaite | 5.31 | 0.45 |
| Ferrohypersthene | 1.34 | 1.35 |
| Chalcopyrite | 0.24 | 0.37 |
| * Others | 5.39 | 4.641 |
* Others: including pores, shadows, unidentified minerals, and some trace minerals (including tetrahedronite, ludwigite, ankerite, herzenbergite, etc.).
Table 2.
The length proportion of cassiterite margins connected with other minerals (%).
| Mineral | Raw Ore | Pebble | ||||
|---|---|---|---|---|---|---|
| +0.074 mm | −0.074 + 0.037 mm | −0.037 mm | +0.074 mm | −0.074 + 0.037 mm | −0.037 mm | |
| Pyroxferroite | 17.16 | 10.78 | 6.22 | 13.52 | 7.16 | 3.25 |
| Biotite | 17.34 | 11.08 | 2.00 | 7.25 | 1.46 | 0.22 |
| Ferroactinolite | 7.94 | 7.85 | 0.63 | 7.15 | 10.05 | 0.97 |
| Pyrrhotite | 2.72 | 7.56 | 6.53 | 6.71 | 3.82 | 2.31 |
| Hedenbergite | 2.91 | 4.11 | 0.58 | 5.59 | 11.16 | 3.28 |
| Calcite | 6.28 | 0 | 0 | 7.57 | 0 | 0 |
| Chlorite | 0 | 0 | 0 | 7.65 | 3.99 | 0.8 |
| Others | 4.6 | 6 | 5.22 | 6.1 | 5.4 | 7.99 |
| Unconnected | 41.05 | 52.62 | 78.82 | 38.46 | 56.96 | 81.18 |
Publisher’s Note: MDPI stays neutral with regard to jurisdictional claims in published maps and institutional affiliations. |
© 2022 by the authors. Licensee MDPI, Basel, Switzerland. This article is an open access article distributed under the terms and conditions of the Creative Commons Attribution (CC BY) license (https://creativecommons.org/licenses/by/4.0/).
Share and Cite
MDPI and ACS Style
Sun, W.; Yang, J.; Li, H.; Liu, W.; Ma, S. Differences in Properties between Pebbles and Raw Ore from a SAG Mill at a Zinc, Tin-Bearing Mine. Minerals 2022, 12, 774. https://0-doi-org.brum.beds.ac.uk/10.3390/min12060774
AMA Style
Sun W, Yang J, Li H, Liu W, Ma S. Differences in Properties between Pebbles and Raw Ore from a SAG Mill at a Zinc, Tin-Bearing Mine. Minerals. 2022; 12(6):774. https://0-doi-org.brum.beds.ac.uk/10.3390/min12060774
Chicago/Turabian StyleSun, Wenhan, Jinlin Yang, Hengjun Li, Wengang Liu, and Shaojian Ma. 2022. "Differences in Properties between Pebbles and Raw Ore from a SAG Mill at a Zinc, Tin-Bearing Mine" Minerals 12, no. 6: 774. https://0-doi-org.brum.beds.ac.uk/10.3390/min12060774
Note that from the first issue of 2016, this journal uses article numbers instead of page numbers. See further details here.