Article

Understanding Cement Hydration of Cemented Paste Backfill: DFT Study of Water Adsorption on Tricalcium Silicate (111) Surface

1
School of Civil, Environmental and Mining Engineering, University of Western Australia, Perth 6009, Australia
2
Energy School, Xi’an University of Science and Technology, Xi’an 710054, China
3
School of Minerals Processing and Bioengineering, Central South University, Changsha 410083, China
4
School of Resources and Safety Engineering, Central South University, Changsha 410083, China
5
ARC Centre of Excellence for Electromaterials Science, Research School of Chemistry, Australian National University, Canberra ACT 2601, Australia
6
School of Molecular Sciences, University of Western Australia, Perth 6009, Australia
7
Institute of High Energy Physics, Chinese Academy of Sciences (CAS), Beijing 100049, China
8
Dongguan Institute of Neutron Science (DINS), Dongguan 523808, China
*
Author to whom correspondence should be addressed.
Submission received: 26 February 2019 / Revised: 18 March 2019 / Accepted: 23 March 2019 / Published: 27 March 2019
(This article belongs to the Special Issue Computational Methods in Mineralogy and Geochemistry)

Abstract

:
Understanding cement hydration is of crucial importance for the application of cementitious materials, including cemented paste backfill. In this work, the adsorption of a single water molecule on an M3-C3S (111) surface is investigated using density functional theory (DFT) calculations. The adsorption energies for 14 starting geometries are calculated and the electronic properties of the reaction are analysed. Two adsorption mechanisms, molecular adsorption and dissociative adsorption, are observed and six adsorption configurations are found. The results indicate that spontaneous dissociative adsorption is energetically favored over molecular adsorption. Electrons are transferred from the surface to the water molecule during adsorption. The density of states (DOS) reveals the bonding mechanisms between water and the surface. This study provides an insight into the adsorption mechanism at an atomic level, and can significantly promote the understanding of cement hydration within such systems.

Graphical Abstract

1. Introduction

Minerals excavation and extraction, though contribute billions of dollars to the world economy every year, pose a serious threat to the environment due to the mine tailings. It is estimated that about 5 to 7 billion tonnes of mine tailings are produced worldwide each year and the disposal of mine tailings has received increasing scrutiny from government and society [1]. The cemented paste backfill (CPB) technology is a promising method for the safe disposal of mine tailings. Moreover, benefits like reclaiming water, stabilising the rock mass and thus increasing mining safety, and increasing ore recovery rate promote the broad application of CPB worldwide [2,3,4,5,6,7,8,10,11,12].
CPB is a composite material produced with dewatered mine tailings (70–85% solids by weight), hydraulic binders (3–7% by dry paste weight) and water [13,14,15]. For the successful application of CPB, the hydration of cement needs to be investigated. It is estimated that the annual production of ordinary cement exceeds 3 billion tonnes, releasing 5–7% of worldwide CO2 emissions [16]. The global demand for cement is ever growing due to the expansion of built infrastructure in developing economies [17]. As the most predominant and most reactive component in cement clinker, tricalcium silicate (Ca3SiO5 or C3S) has been investigated in both academia and industry with the objective of modifying or controlling its reaction kinetics. The initial hydration of C3S involves the adsorption of water on its surface; however, to date, we have little understanding of this process at the atomic level due to the limitations of the experimental methods, such as material purity and instrument accuracy [18]. For this reason, atomic simulations can be a valuable tool to investigate the hydration of C3S. Alternative ways might be found to increase the hydration rate and reduce cement consumption with a better understanding of cement hydration process.
Density functional theory (DFT) has been introduced to cement chemistry to investigate the reactivity and hydration mechanism of cement clinkers, including C3S [19,20,21,22,23,24,25]. Durgun et al. [19,20] examined the reactivity of the calcium silicate phases, as well as their synthetic surfaces, using DFT calculations. Saritas et al. [21] assessed the electronic structure modification of the M3 polymorph of C3S (M3-C3S) caused by Mg, Al, and Fe substitutions. Qi et al. [26] investigated the structural and electronic properties of ferrite phases in cement clinkers, including Ca2Fe2O5, Ca2AlFeO5, and Ca2Al2O5. Huang et al. [23] analysed the reactivity enhancement of doping using a case study of a triclinic polymorph of C3S (T1-C3S) and found that long-term hydration is mainly controlled by proton transport. Although the surface properties of C3S have been provided in previous studies at the nanometer level, the adsorption mechanism between water and M3-C3S surfaces needs to be investigated theoretically.
Recently, a simultaneous investigation of water molecules on C3S surfaces has been performed [27], which confirms the significance of the topic. Though the adsorption energy was calculated for all low-index surfaces in [27], a thin slab (15 Å) was used. As systematically investigated in [20], converged surface energies could be obtained with a slab thickness between 25–30 Å. Thus, an enlarged slab model with a thickness of 26.36 Å was built to expect more reliable results. Moreover, the authors in [27] mainly focused on the discussion of M3-C3S (100) surface. For example, the density of states (DOS) results were only presented for M3-C3S (100) surface. Instead, a detailed discussion, including electronic properties, adsorption configurations and energies, is provided in this paper for M3-C3S (111) surface.
In this work, DFT calculations are used to investigate the water adsorption on the M3-C3S (111) surface. A total of 14 starting geometries are studied. In each case the corresponding adsorption configuration and energy are calculated. Such DFT calculations can provide an insight into the interaction mechanism between water and C3S surfaces, and suggest possible methods for increasing the hydration of C3S.

2. Computational Details

All DFT calculations are performed using the VASP package with the Perdew-Burke-Ernzerhof generalized gradient (GGA-PBE) exchange-correlation functional [28,29,30]. The 3p64s2, 3s23p2, 2s22p4, and 1s1 are treated as valence electrons for Ca, Si, O and H, respectively. The energy cutoff and the energy tolerance are chosen to be 500 eV and 1.0 × 10⁻⁵ eV/atom respectively for all calculations [20,21]. For bulk calculations, A 4 × 4 × 4 k-mesh is used, and the ionic relaxation is carried out until the maximum residual force is less than 0.01 eV/Å on each atom [21]. In the case of surface calculations, the first Brillouin zone is integrated at the gamma point and the maximum residual force on each atom is set to 0.05 eV/Å. The authors note here the surface relaxation in the current study is performed following the procedure in [20]. For the stopping criterion of ionic relaxation, a 0.01 eV/Å was used in [20]. However, a 0.05 eV/Å is used in this paper to speed up the calculations, as suggested in [31,32,33,34,35].
Among different polymorph structures for C3S, M3-C3S (CM symmetry group) is chosen since it is the most frequently observed in industrial applications [36]. The unit cell of M3-C3S has 18 Ca atoms, 6 Si atoms and 30 O atoms, as shown in Figure A1 in Appendix A. The bulk M3-C3S shows sixfold coordinated Ca atoms (Ca6c), fourfold coordinated Si atoms (Si4c), sixfold coordinated O atoms (referred as ionic O atoms, O6c) and fourfold coordinated O atoms (referred as covalent O atoms, O4c). The experimental unit cell in [36] is used as the initial model for the ionic relaxation. Table 1 shows the comparison between the calculated and experimental lattice parameters of M3-C3S, and a good agreement can be seen among current calculations, experimental measurements and previous calculations.
The M3-C3S (111) surface, which is the most stable M3-C3S surface and forms most of its surface area [20], is cleaved from the relaxed bulk structure. All possible cleavages of the (111) surfaces are compared following the suggestions in [20]. Based on the convergence tests, the M3-C3S (111) surface is modelled using a (1 × 1) slab with a 26.36 Å slab thickness and a 15 Å vacuum layer along the nonperiodic direction c. Furthermore, no symmetry constraints are imposed on the slab model due to the complex crystal morphology of M3-C3S (i.e., the top and bottom slab surfaces are likely to have different atomic arrangements). All atoms in the slab are allowed to relax as recommended in [10] while lattice parameters are fixed during surface relaxation. Figure 1 illustrates the near-surface structures before and after surface relaxation. As shown, the coordination number of surface Ca and O atoms is decreased because of the surface cleavage (i.e., from Ca6c to Ca3-5c). Furthermore, the bond length is reduced during surface relaxation. For example, the average Ca(1)-O bond length is 2.41 Å and 2.18 Å before and after surface relaxation, respectively. The influence of surface relaxation is mainly near the top two surface layers, within which the SiO4 tetrahedron is tilted while the Ca and O atoms are slightly shifted.
Starting from the relaxed M3-C3S (111) surface, a single water molecule is placed nearby the (111) surface. During cement hydration, water molecules typically react with cement surfaces by forming two different bonds, the bonds between O atoms in water (Ow) and surface Ca atoms and the bonds between H atoms and surface O atoms. As the bond length of Ow–Ca is approximately twice that of H-O, the surface Ca atoms are often selected as the adsorption sites [37].
In terms of the initial separation distance between the water molecule and the C3S, Huang et al. [23] investigated the energy of the water-C3S system when the initial distance was decreased from 7 Å to 2 Å. An initial distance of 4 Å is suggested based on their results. Moreover, several potential adsorption sites (surface Ca atoms) are investigated in this paper. For some adsorption sites, there might be other adjacent Ca atoms that are more ‘protruding’ (a larger z coordinate) than the investigated one. In such cases, the water molecule might be too close to these ‘protruding’ Ca atoms if it is placed ~2.5 Å above the adsorption site. Therefore, the Ow atom is placed ~4 Å above the corresponding adsorption sites in this paper for representative results. Both the ‘downward’ and ‘upright’ initial water configurations (described in Figure 2) are investigated since the initial configuration of water plays an important role in its adsorption behavior [38].
The adsorption (or reaction) energy Eads can be calculated as follows:
Eads = EtotalEsurfaceEwater
where Etotal is the total energy of the surface/water system after adsorption, Esurface is the energy of the relaxed M3-C3S (111) surface and Ewater is the energy of an isolated water molecule in free phases. In this paper, a higher Eads represents an Eads with a more negative value. According to Equation (1), a higher Eads indicates stronger binding between the water molecule and the M3-C3S (111) surface, implying that such an adsorption is more favorable from a thermochemical point of view [37,39,40,41,42].

3. Results and Discussion

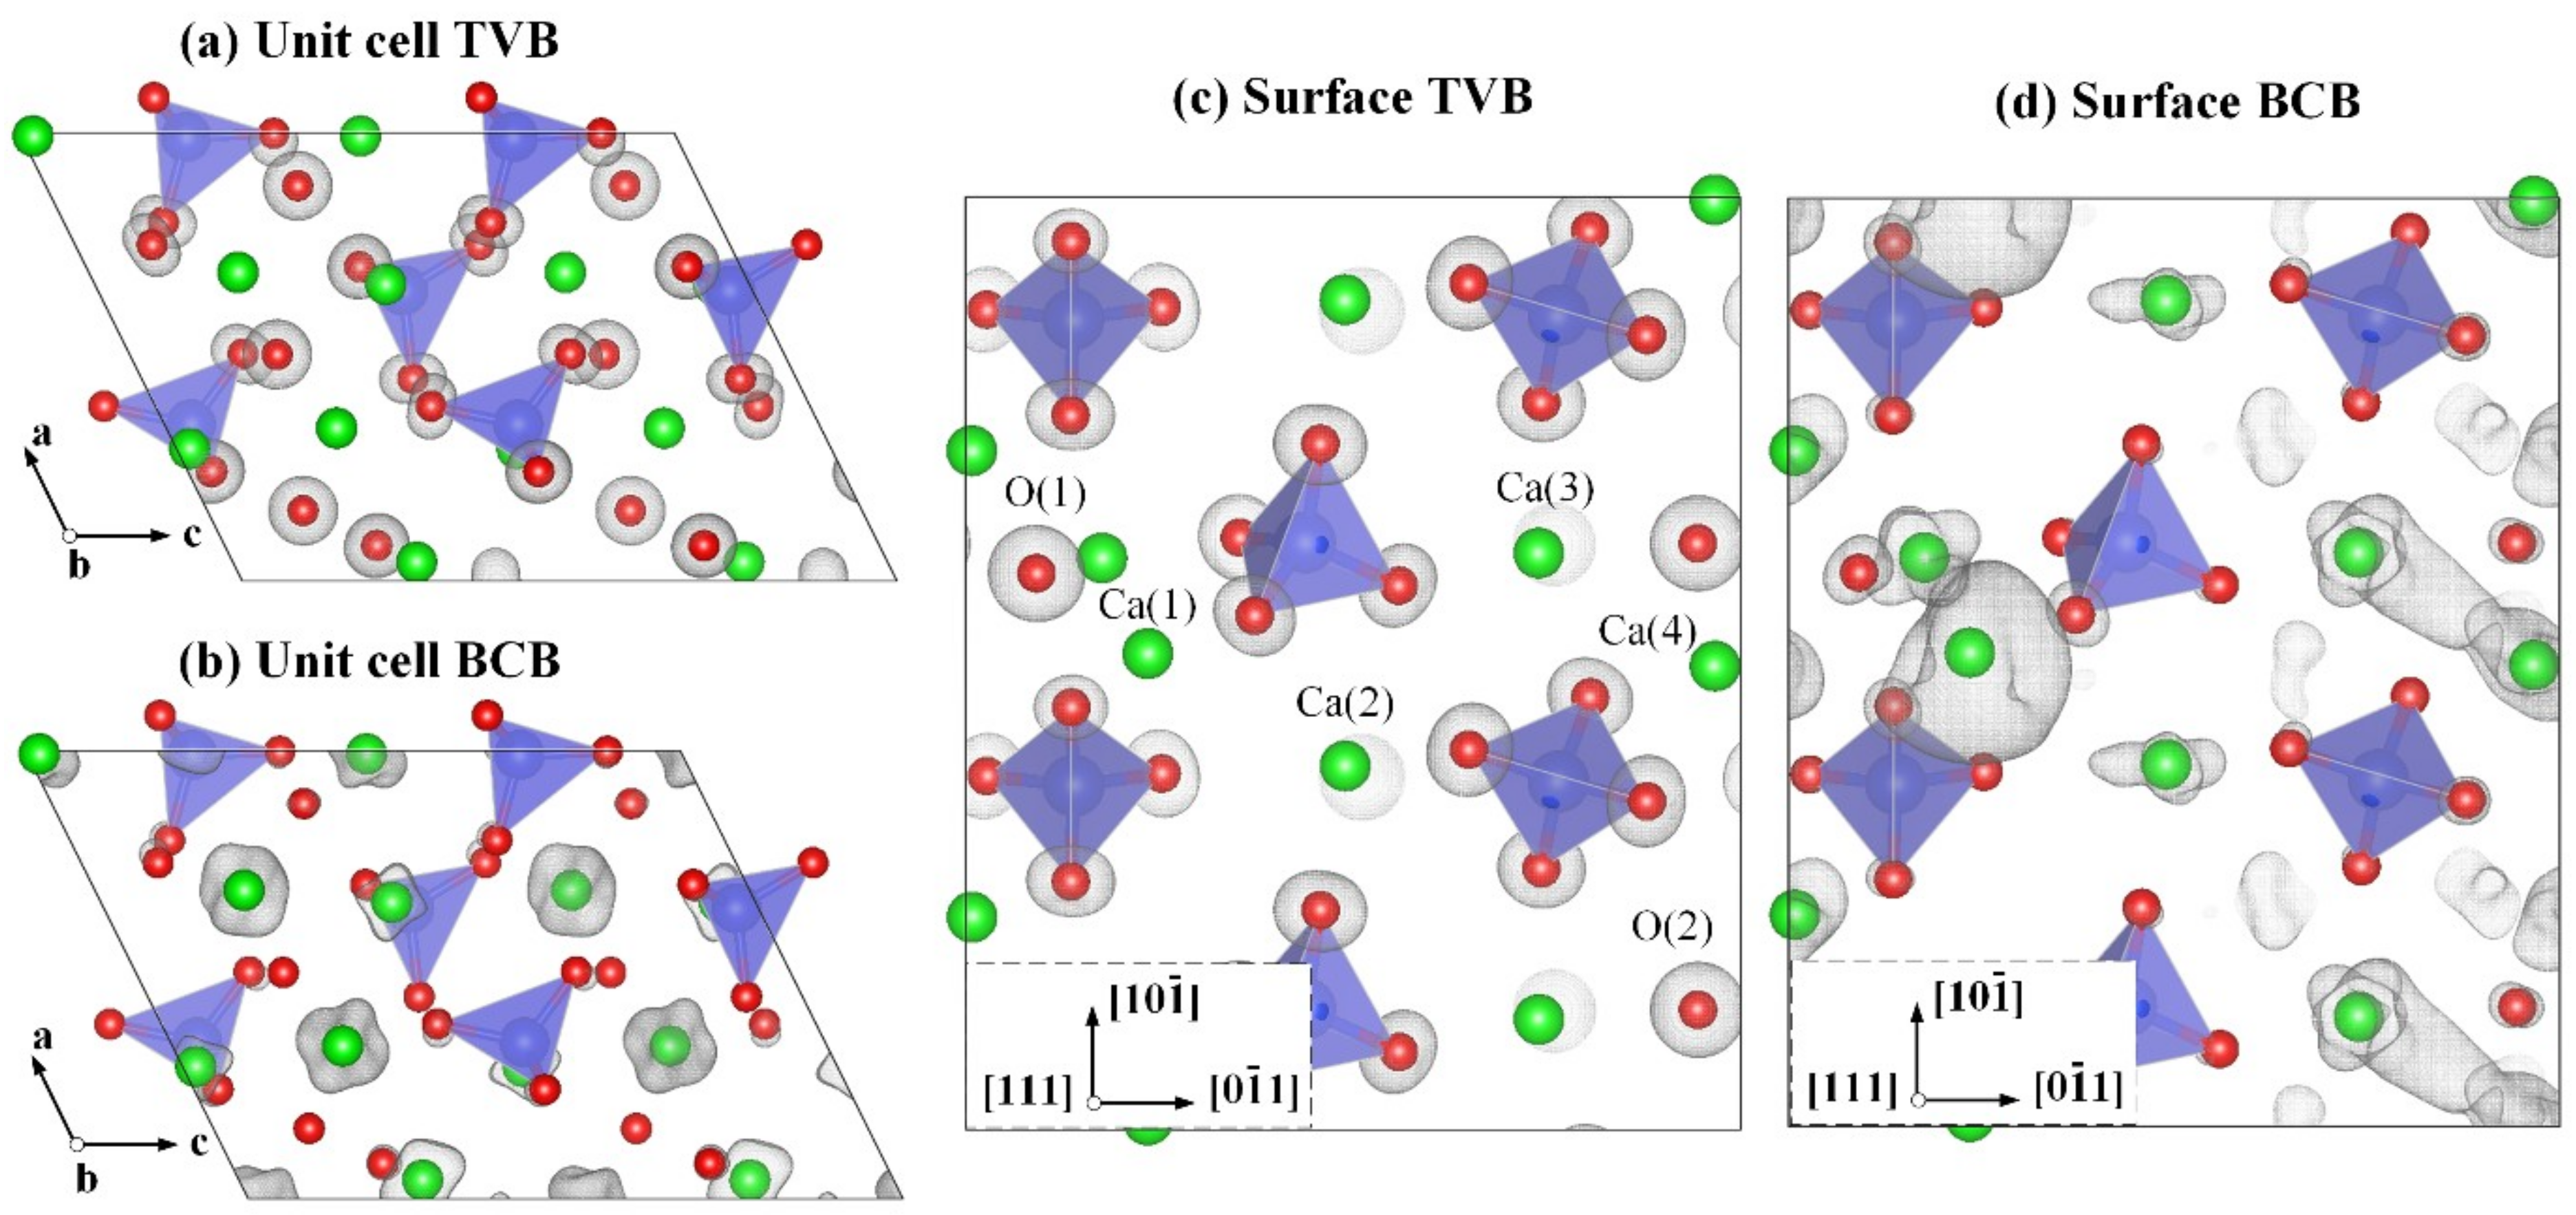
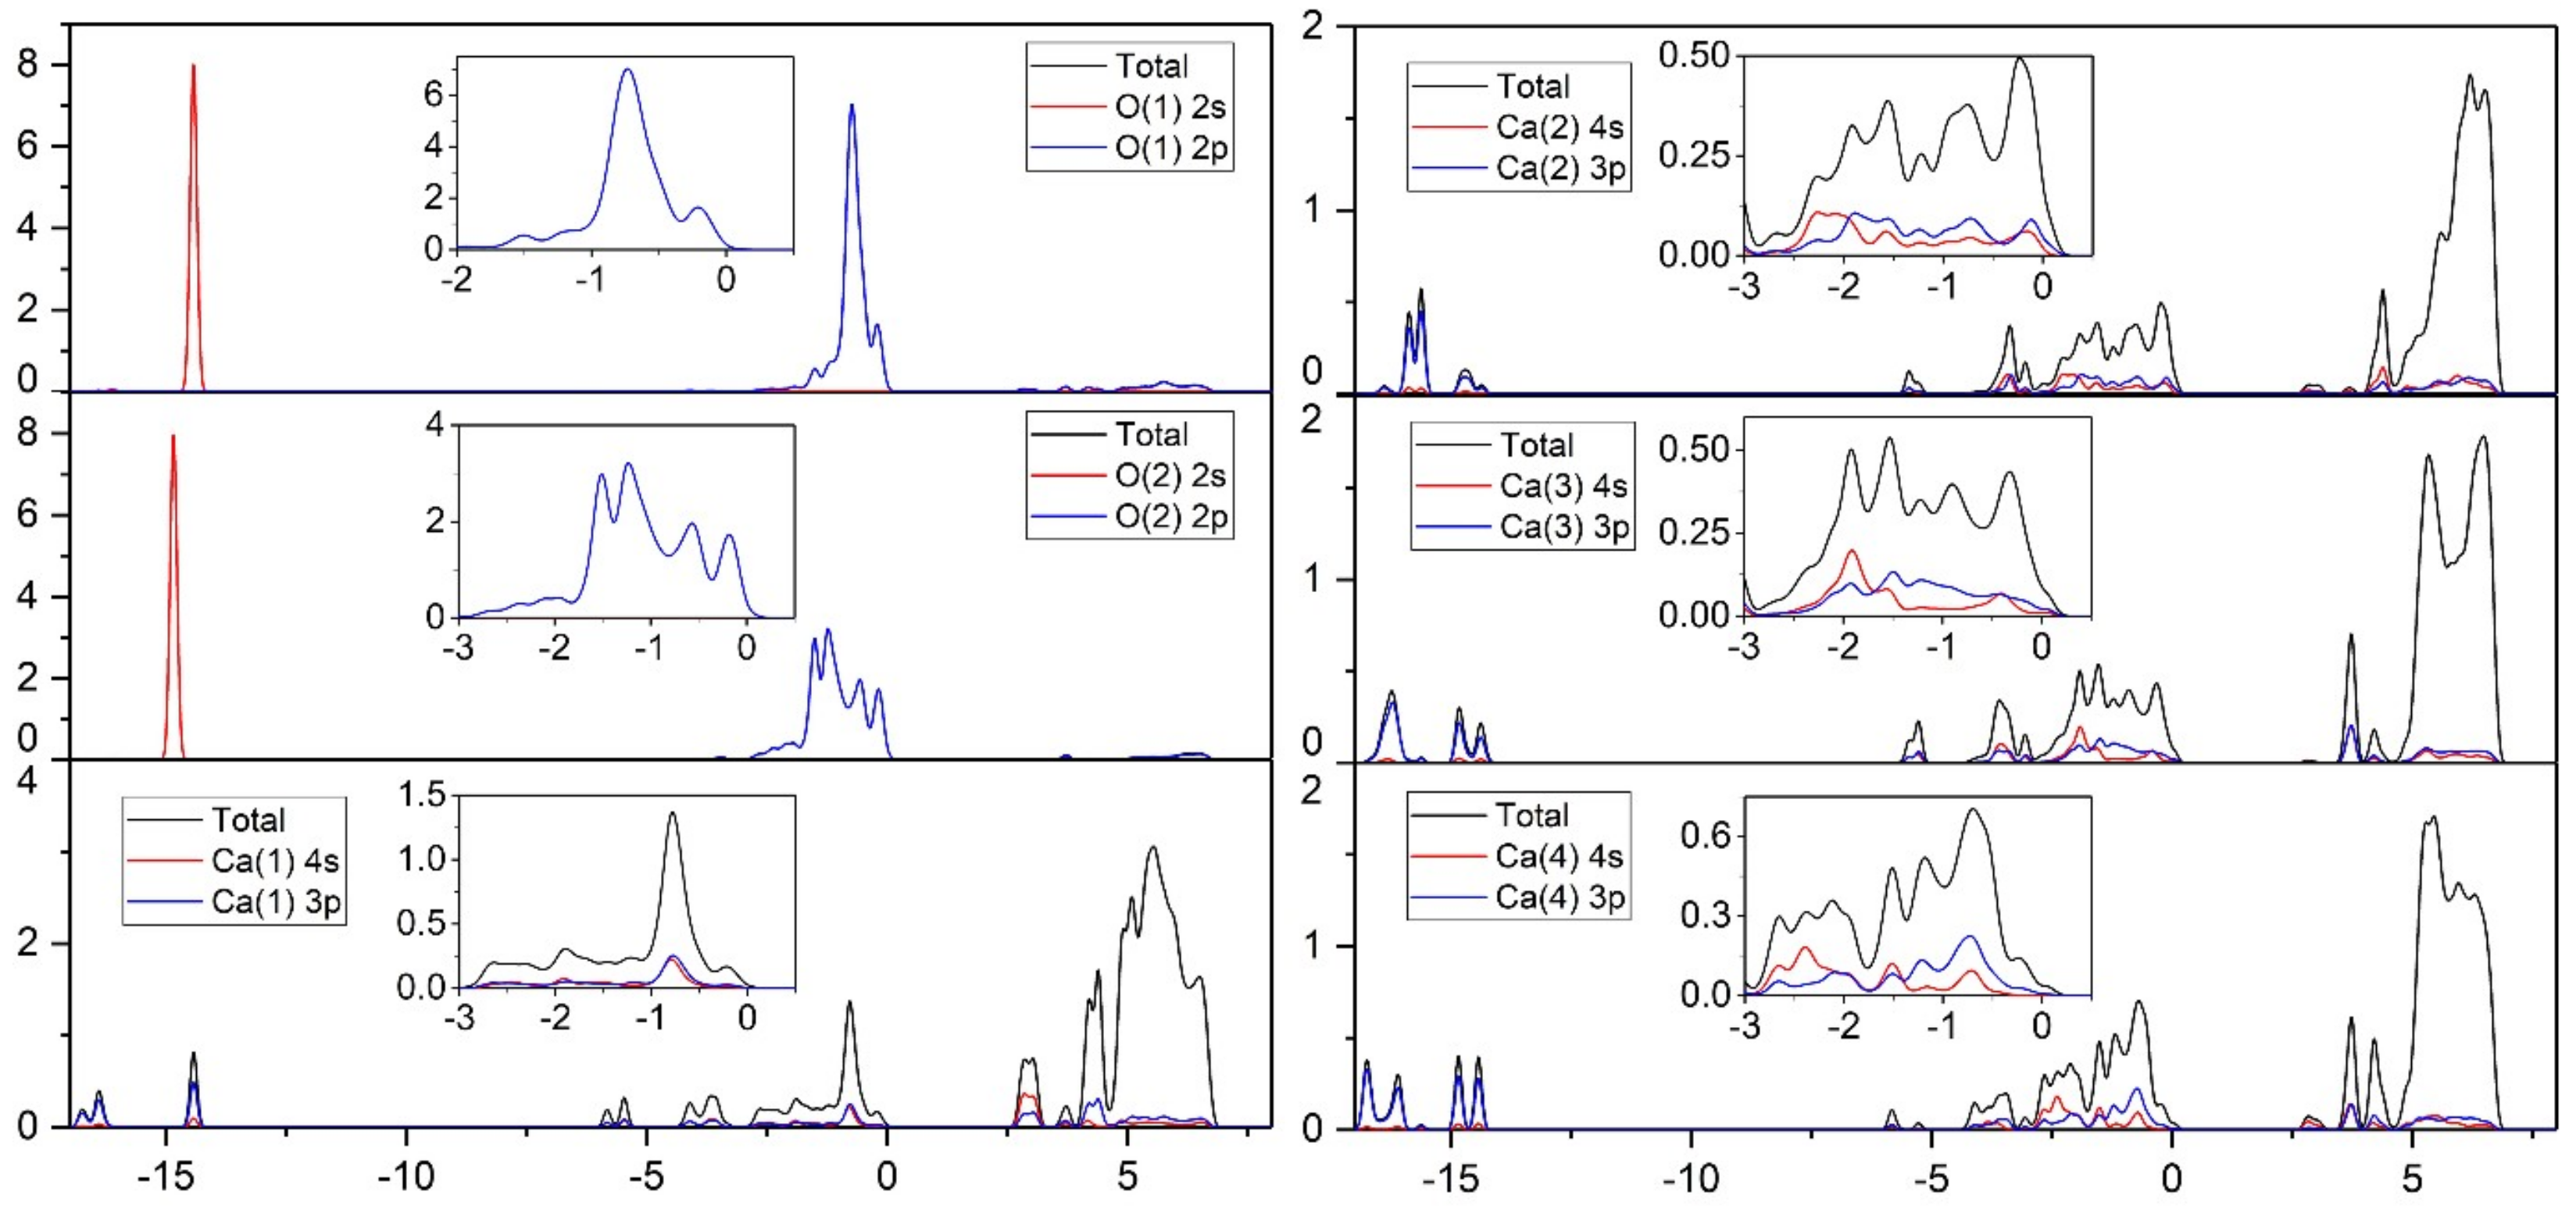
3.1. Electronic Properties of the M3-C3S (111) Surface

In order to investigate the interaction between water molecules and M3-C3S atoms at the surfaces, the electronic properties of the M3-C3S (111) surface are examined. For chemical reactivity analysis, the band decomposed charge density around the top of the valence band (TVB, −3 eV to 0 eV) and the bottom of the conduction band (BCB, 0 eV to 3 eV), denoted by ρ(r)TVB and ρ(r)BCB respectively, is employed. More detailed information regarding the band decomposed charge density can be obtained in the literature [43,44].
Figure 3 shows the ρ(r)TVB and ρ(r)BCB of the M3-C3S structures. In the unit cell, ρ(r)TVB is localized over O atoms, especially ionic O atoms, whereas ρ(r)BCB is localized over Ca atoms. These results indicate that the ionic O atoms are prone to electrophilic attack while the Ca atoms are prone to nucleophilic attack. However, when bulk M3-C3S is cleaved to produce the (111) surface, the spread of ρ(r)TVB and ρ(r)BCB changes accordingly. A stronger ρ(r)TVB localization is observed over surface ionic O atoms. This effect is more pronounced for some surface Ca atoms and such a strong ρ(r)BCB localization will render these surface Ca atoms dominating sites for water adsorption [45]. The influence of surface cleavage on the spread of ρ(r)TVB and ρ(r)BCB over bulk atoms in the slab is negligible compared with surface atoms (see Figure A2 in Appendix A).
Bader charge analysis is also used to investigate the atomic charge of both unit cell and surface [46,47]. For the M3-C3S unit cell, the results show that each Ca and Si atom donates 1.535 e- and 3.098 e on average to the system. Each O atom is found to withdraw 1.541 e on average from the unit cell. For the M3-C3S (111) surface, a Bader charge analysis shows that, on average, each Ca and Si donates 1.533 and 3.104 e respectively while each O atom withdraws 1.541 e. To better understand the influence of surface cleavage on the atomic Bader charge, the Bader charges for several surface atoms, as shown in Figure 3c, are compared with the average Bader charges from their corresponding bulk positions. The Bader charges for O(1), O(2), Ca(1), Ca(2), Ca(3) and Ca(4) are −1.438, −1.443, +1.490, +1.554, +1.512, and +1.491, respectively, while the average bulk Bader charges are −1.460, −1.449, +1.534, +1.531, +1.544, and +1.514, respectively. Therefore, most of the surface O/Ca atoms, except Ca(2), withdraw/donate fewer electrons compared with the bulk materials, indicating that they may be more prone to undergo electrophilic/nucleophilic attacks, respectively. Interestingly, the magnitude of the Bader charge variation between surface/bulk Ca atoms is much greater than that between surface/bulk ionic O atoms, which may give rise to a higher reaction activity of surface Ca atoms to ionic O atoms. The surface Bader analysis is also in agreement with the localization of the ρ(r)TVB and ρ(r)BCB around the surface O/Ca atoms.
In addition to investigating the charge distribution in M3-C3S unit cell and its (111) surface, we also examine the partial density of states (DOS) of aforementioned surface atoms. As shown in Figure 4, the whole valence band of surface O atoms can be mainly divided into two sections, including the deeper level between −15 eV and −14 eV originating from the O 2s orbital and the upper level between −3 eV and 0 eV originating from the O 2p orbital. For the valence bands of surface Ca atoms, five sections are observed at −21 eV to −15.5 eV, −15 eV to −14 eV, −6 eV to −5 eV, −4.5 eV to −3 eV and −3 eV to 0 eV. Notably, the density of states (DOS) within the scope of −21 eV to −15.5 eV is not shown as it is far from the Fermi level (EF). Both Ca 3p and 4s orbitals are observed to contribute to the DOS near the EF (−2 eV to 0 eV), indicating that these orbitals can contribute to the reactions with adsorbates. As noted by Zhao et al. [48], the reaction activity of electrons is positively correlated to the DOS of surface atoms near the EF. Thus, the reaction activity of surface Ca atoms can be ranked in the following order: Ca(1) Ca(4) Ca(3) Ca(2), which agrees well with the charge density analysis and Bader charge analysis.

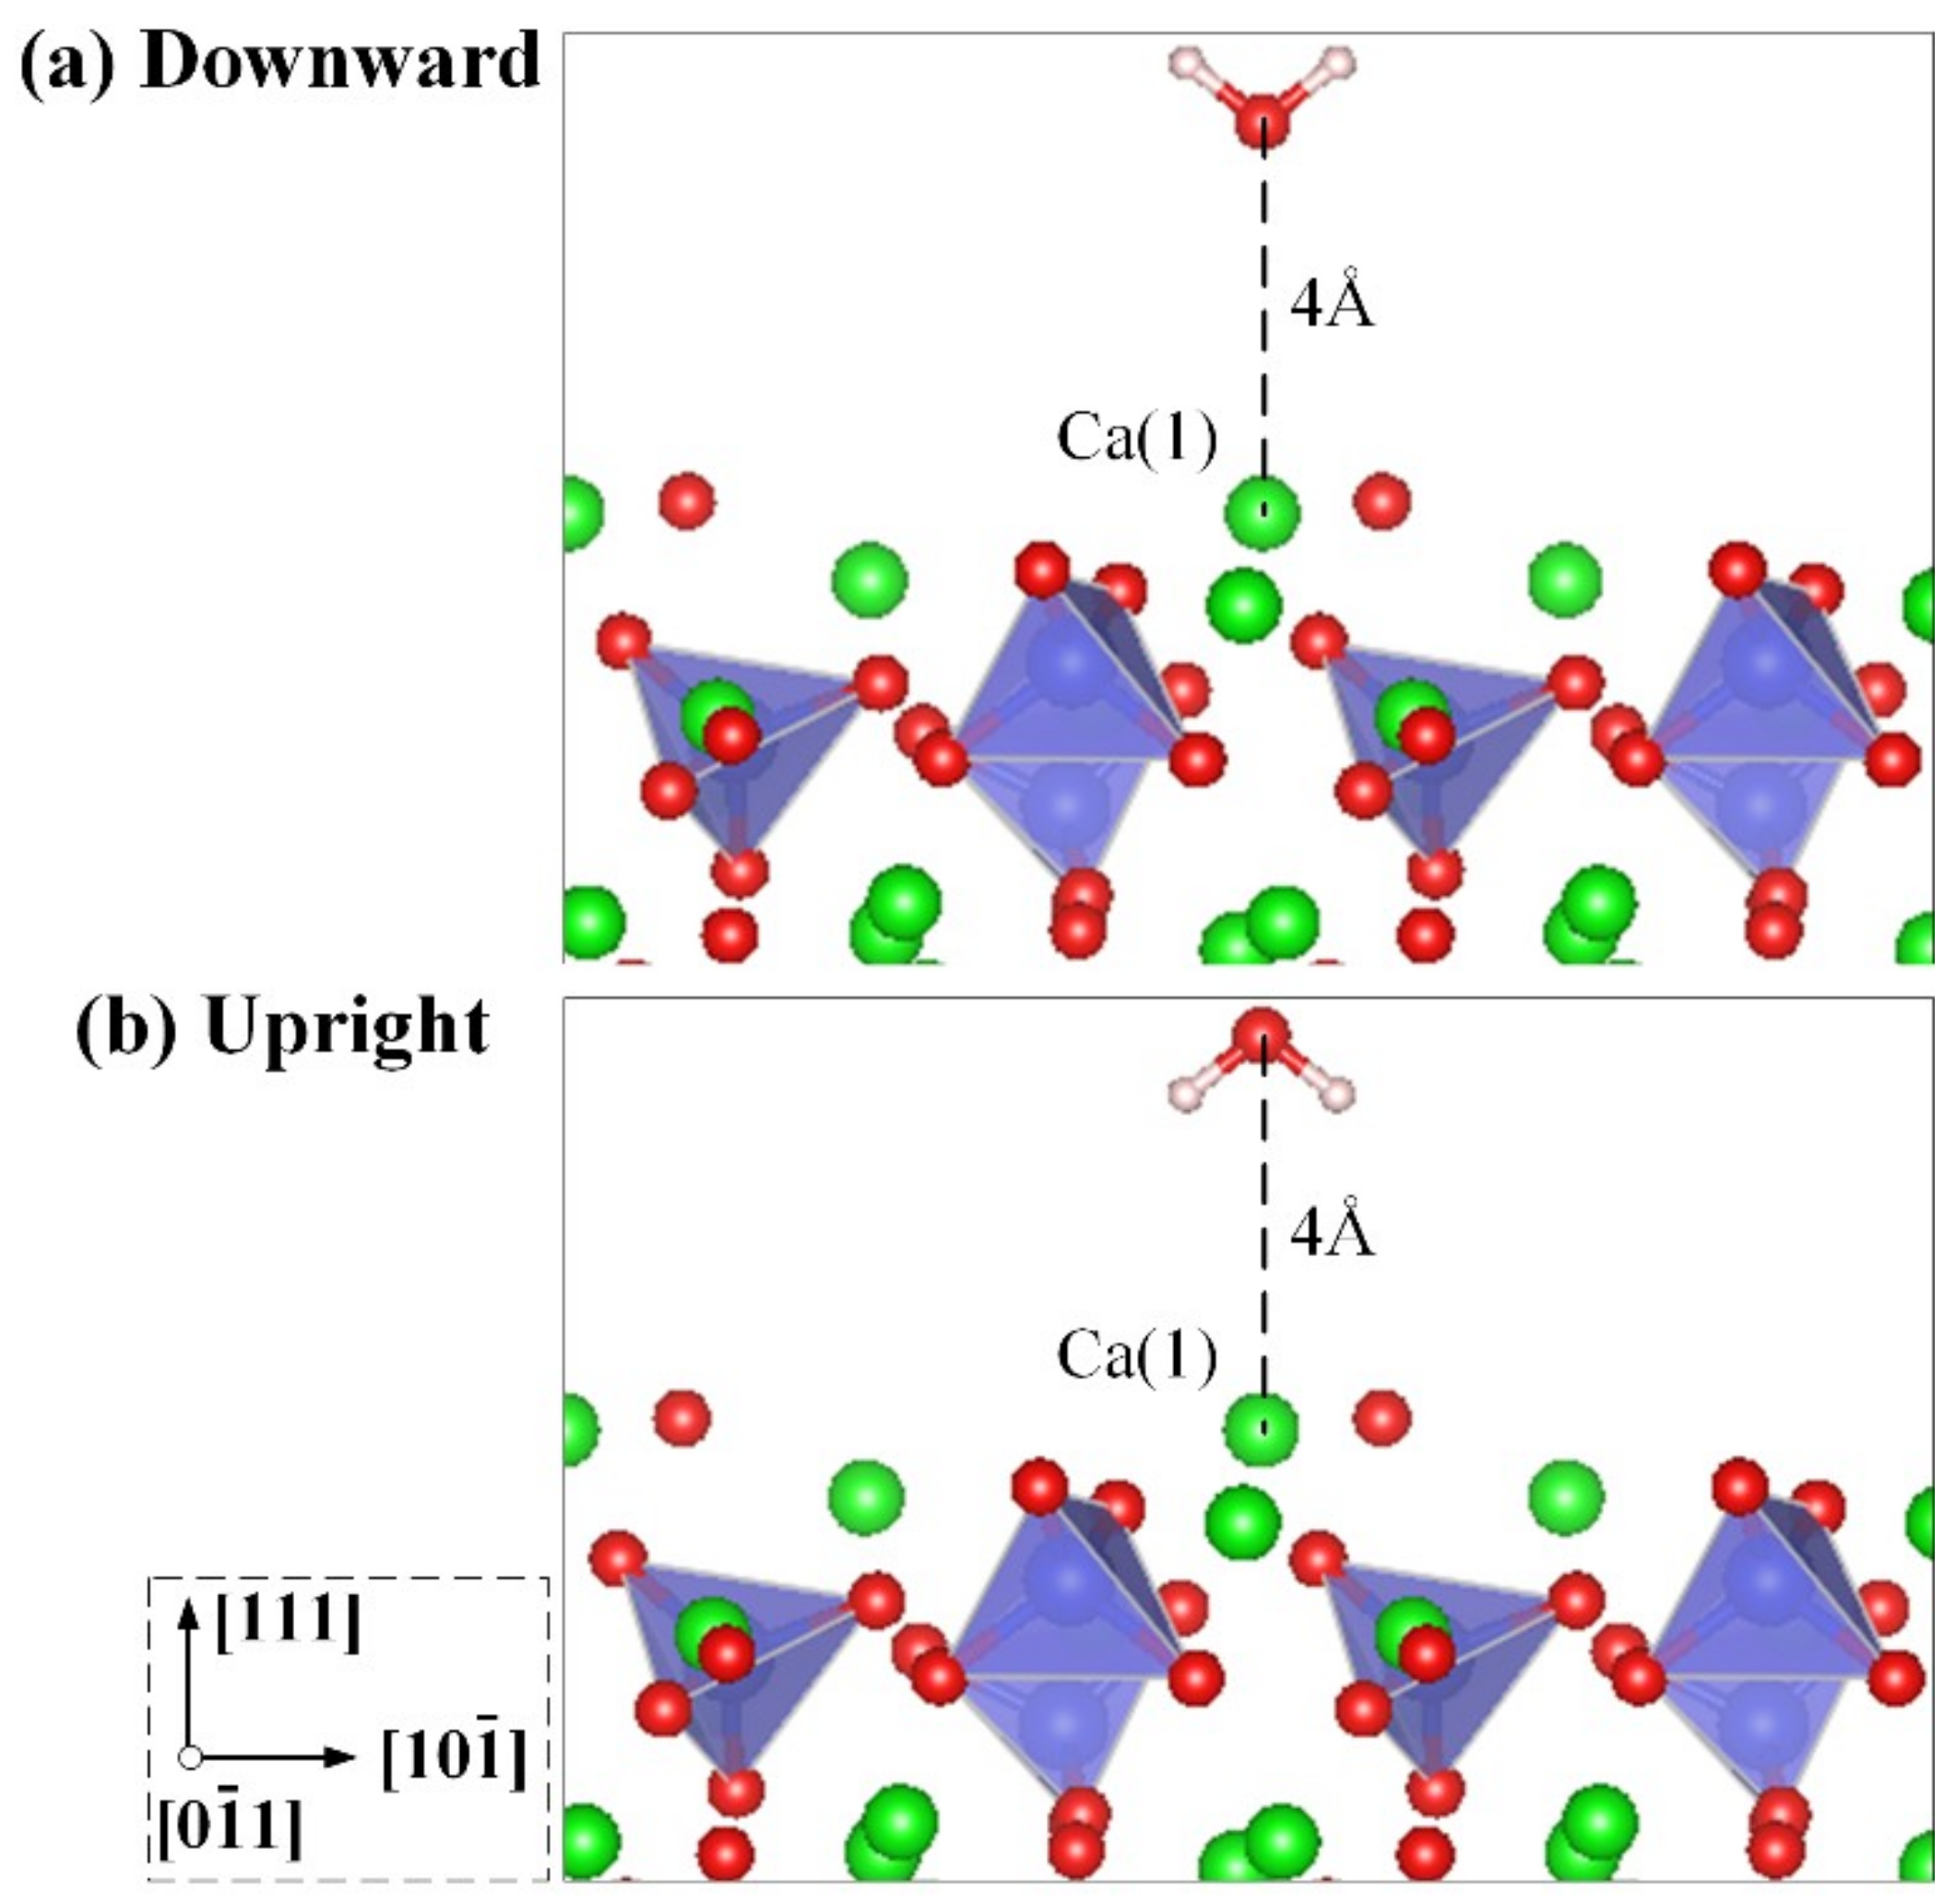
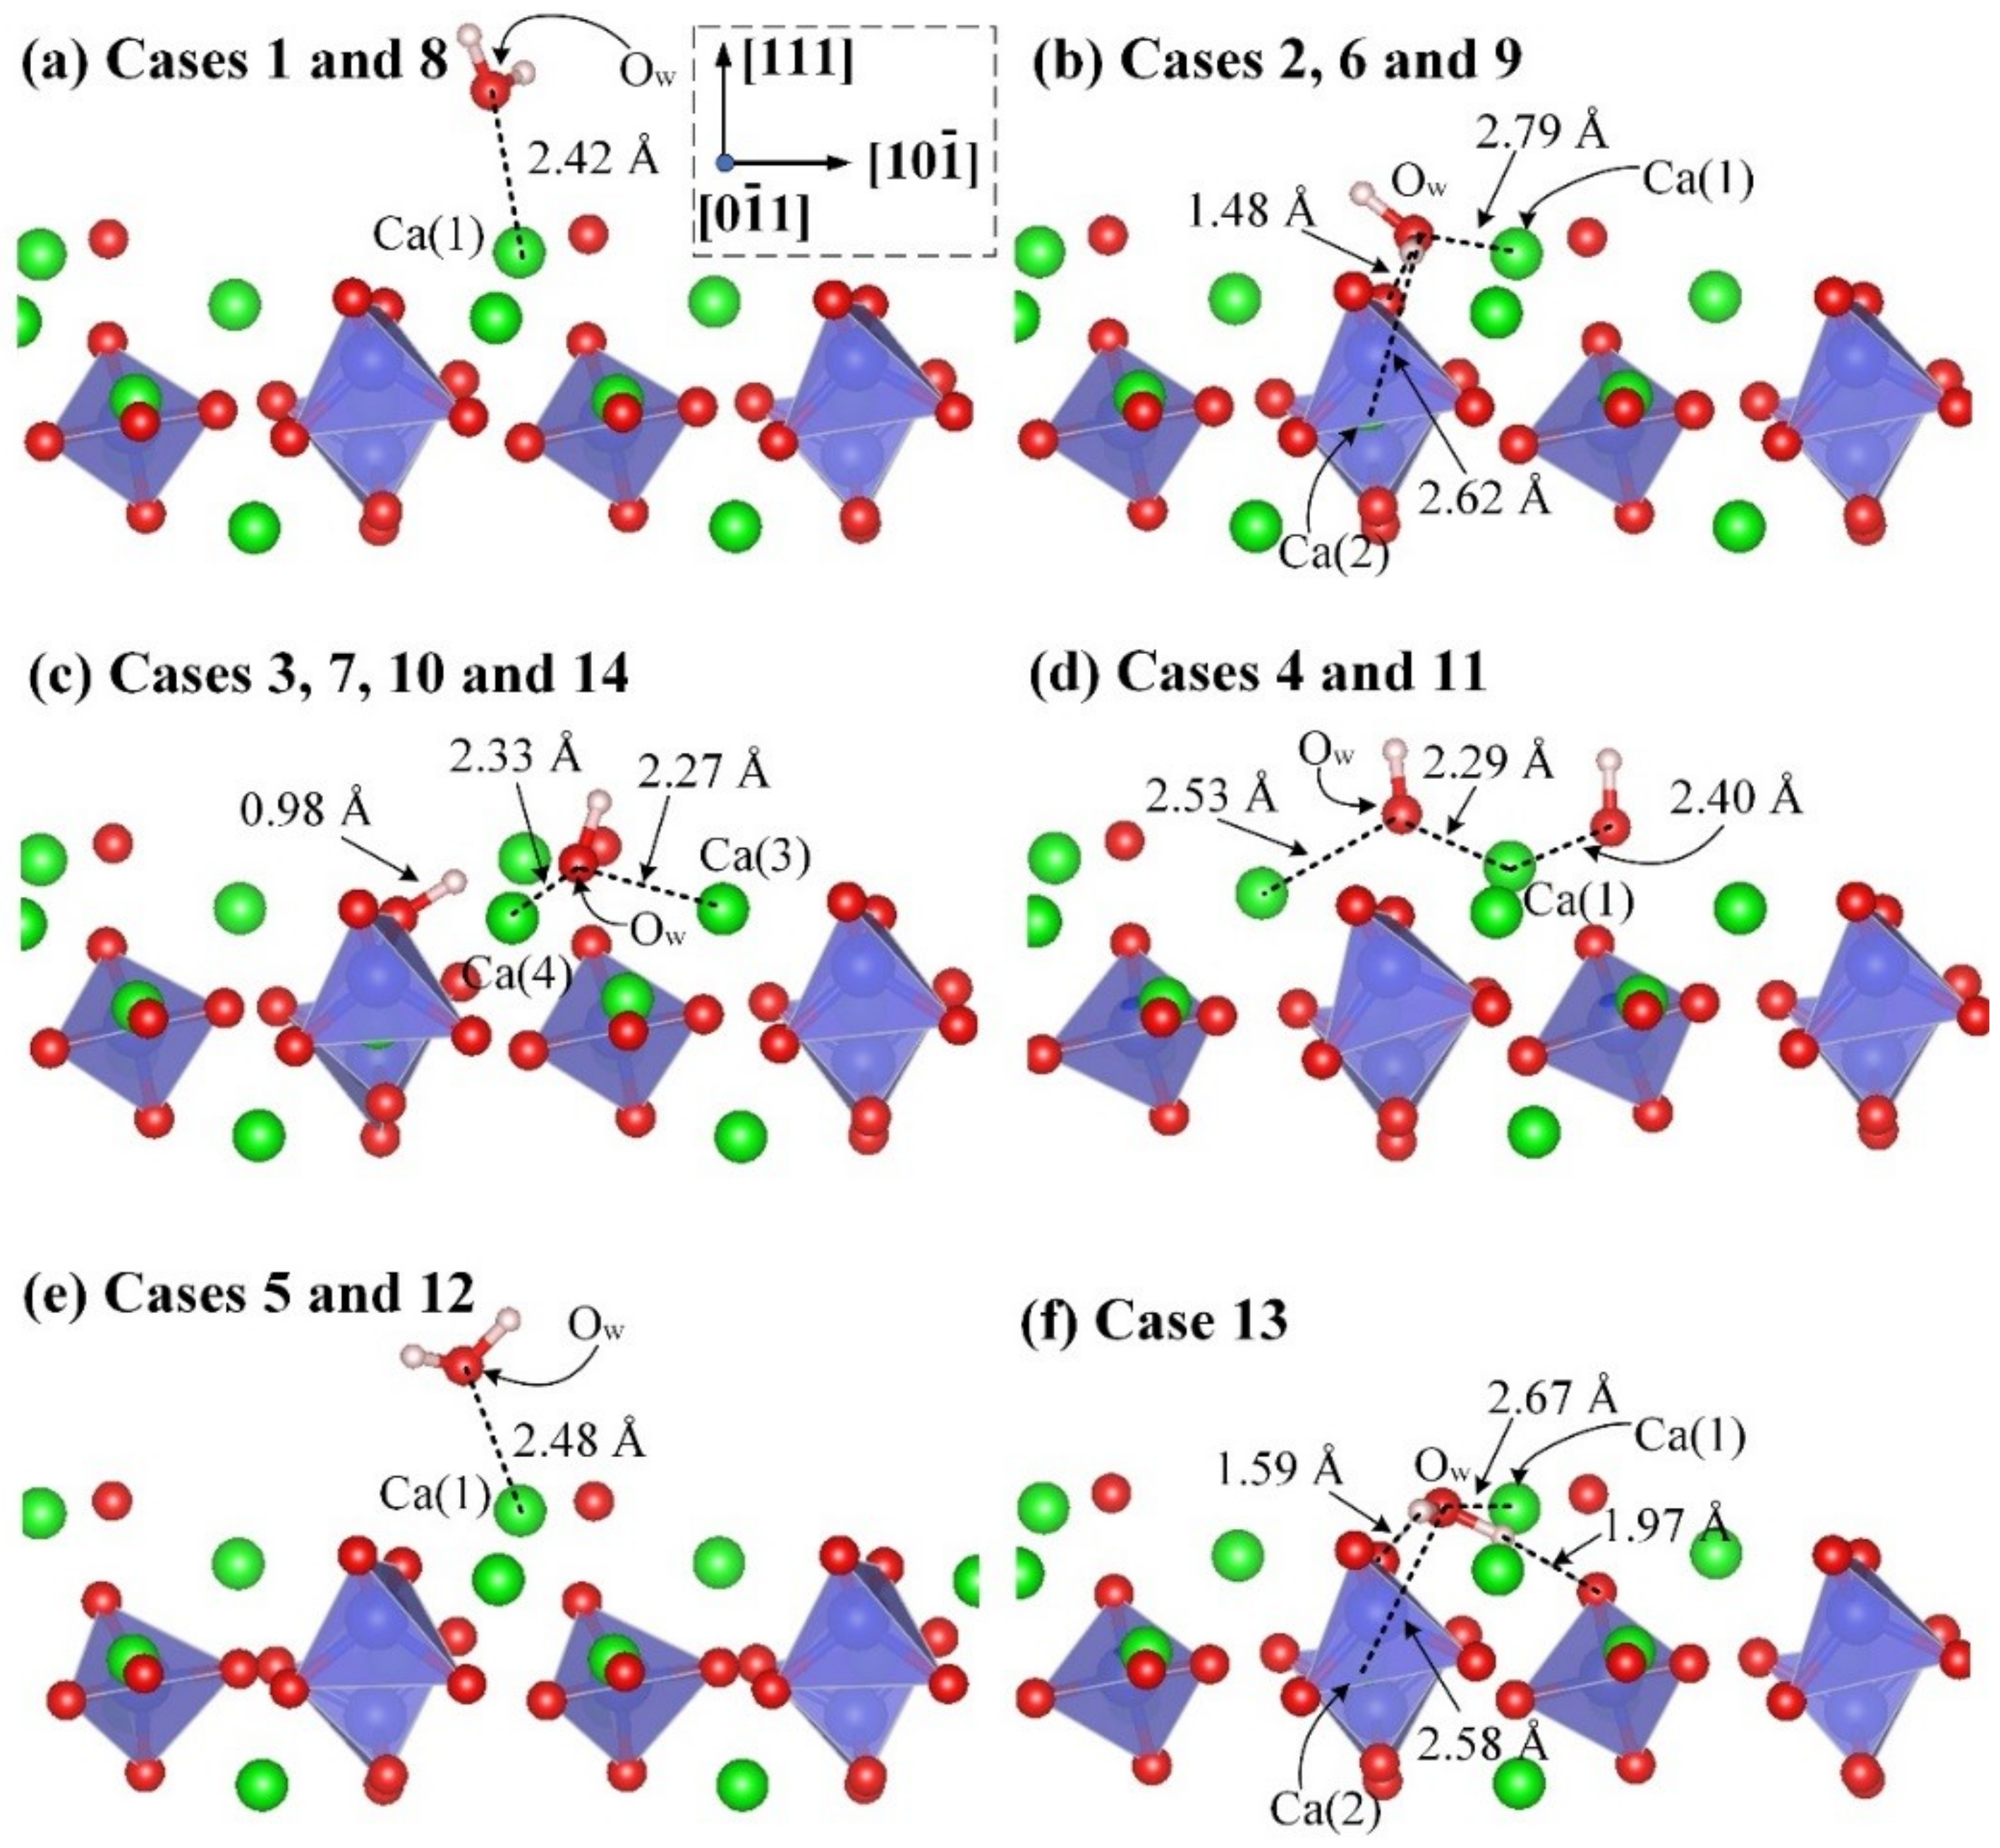
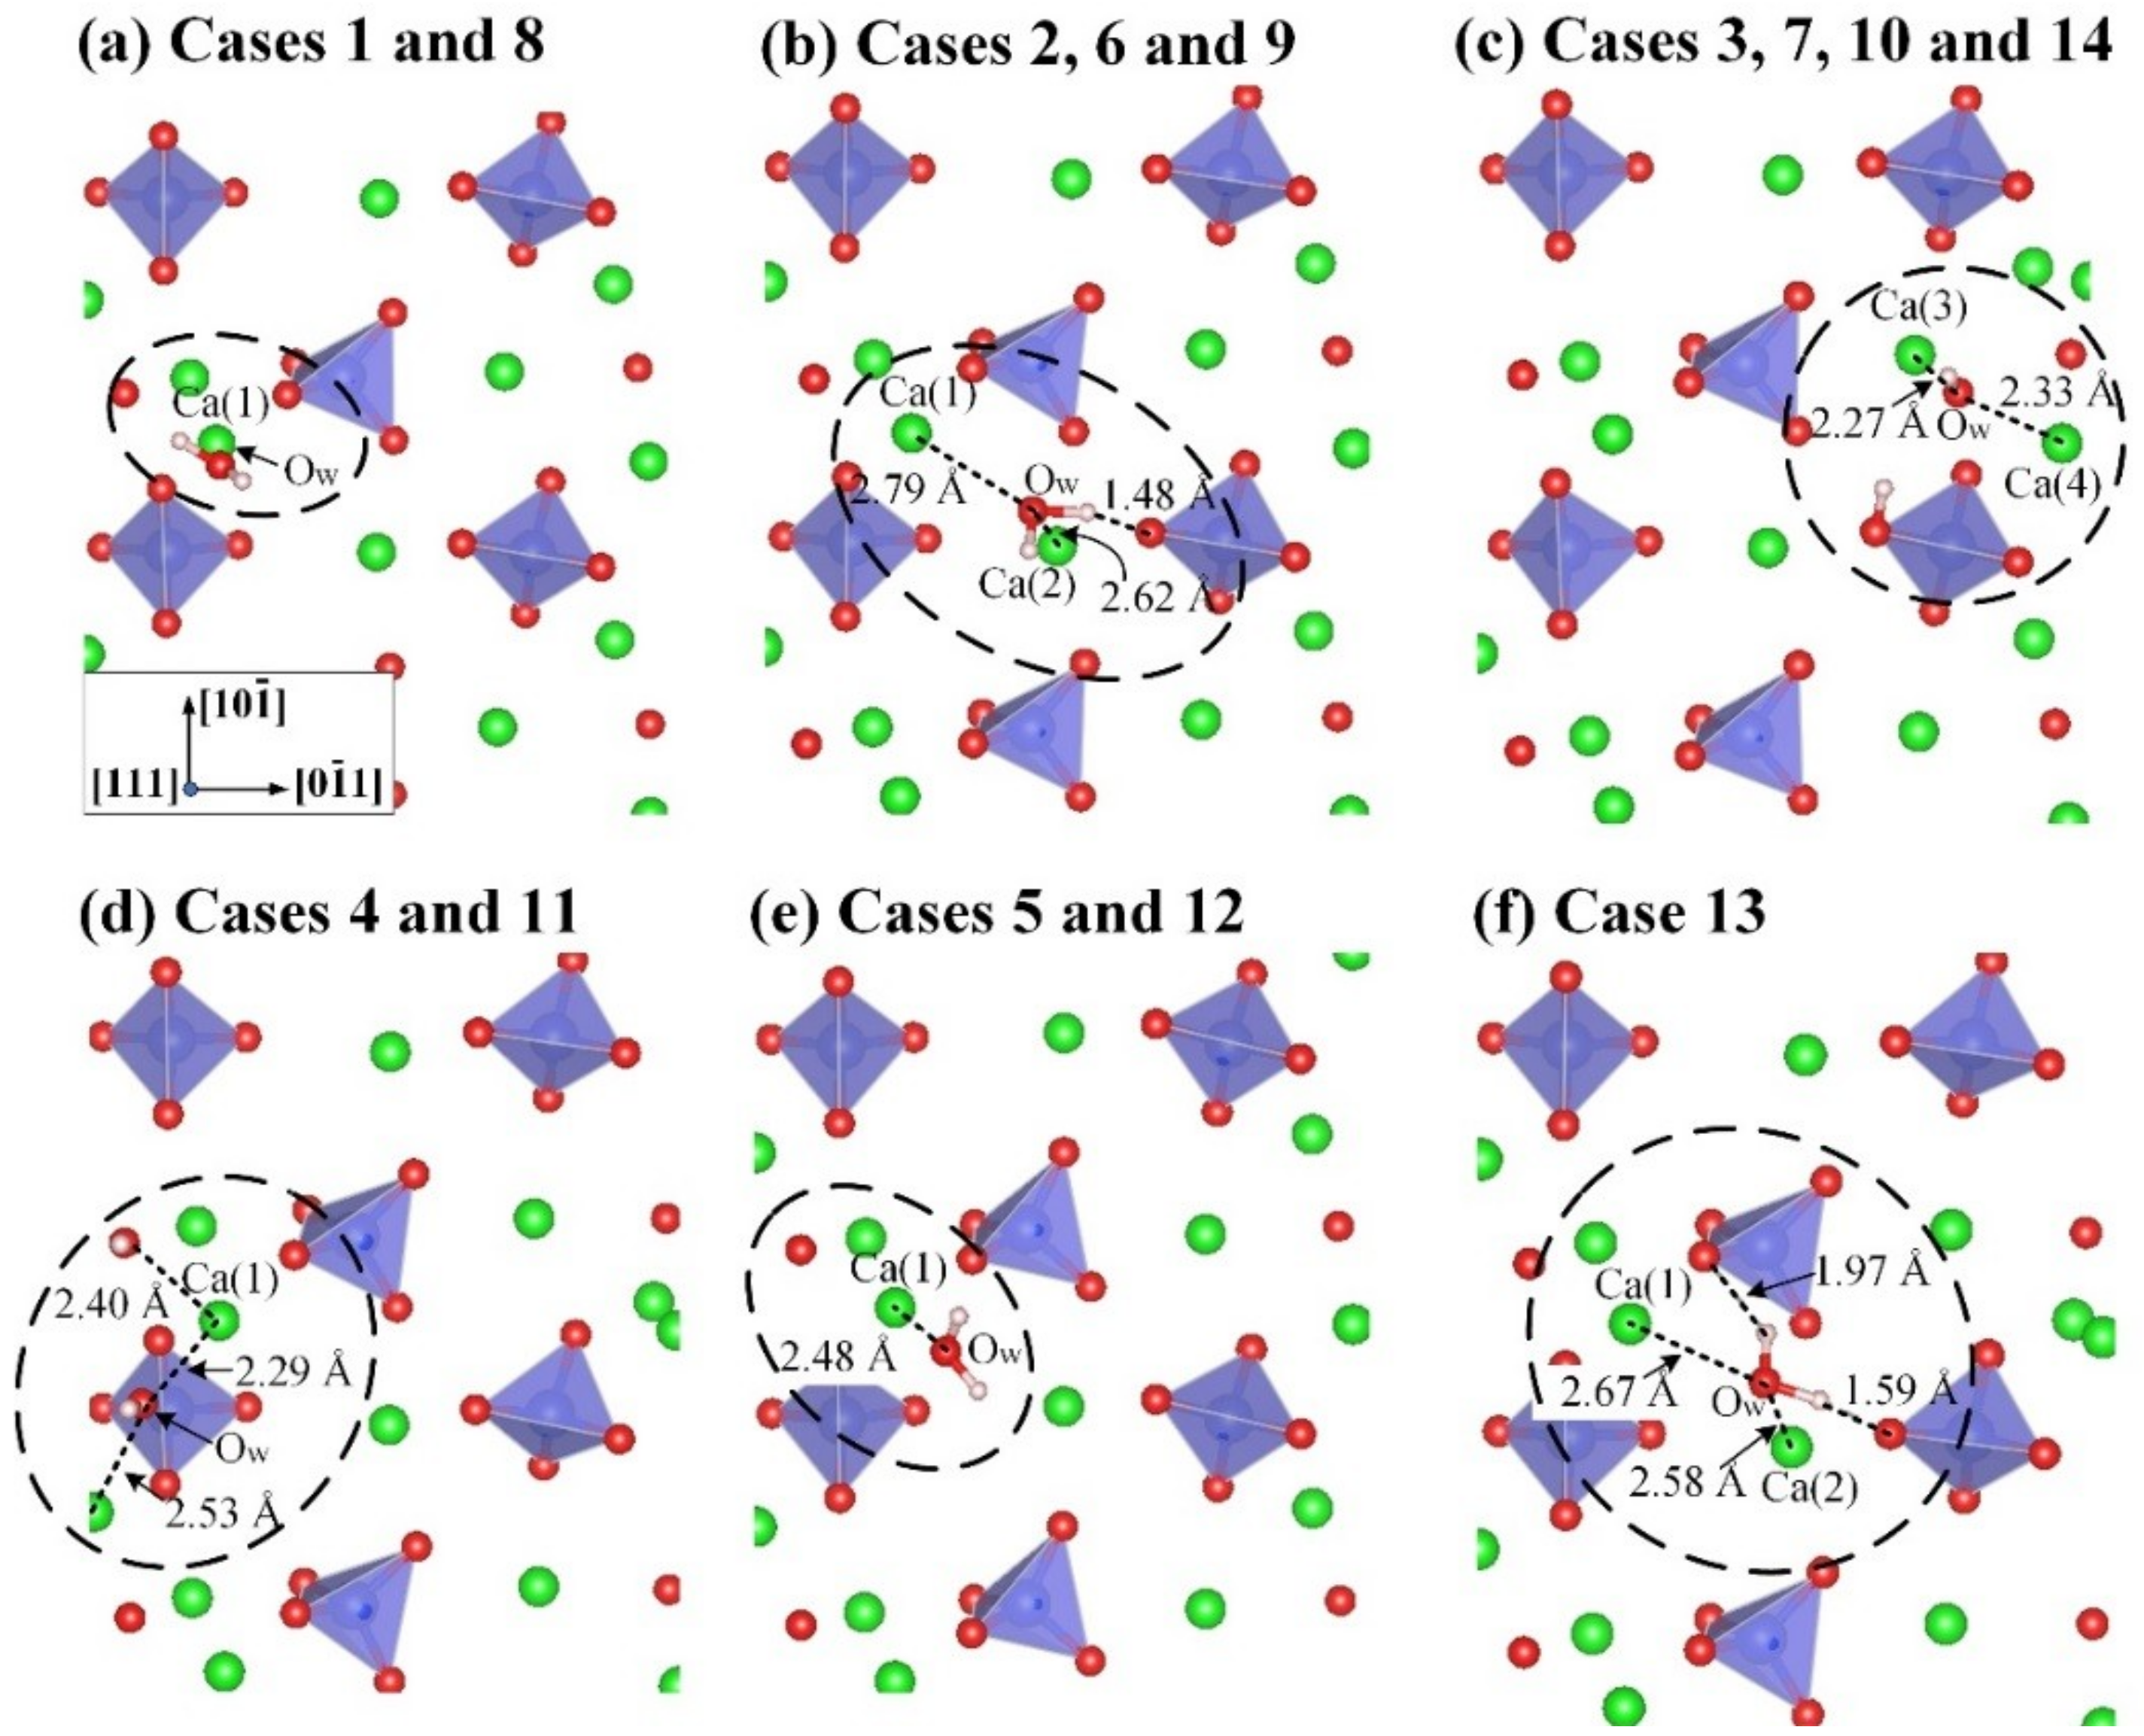
3.2. Adsorption Configuration of a Water Molecule on the M3-C3S (111) Surface

From the discussion about the electronic properties of the M3-C3S (111) surface, the dominating adsorption sites for water molecules could be the surface Ca atoms. In this study, the four surface Ca atoms in Figure 3c, namely, Ca(1) to Ca(4), and their corresponding top/bridge sites are selected as potential adsorption sites. A total of 14 starting geometries are considered based on different initial adsorption sites and water configurations, detailed in Table 2.
The adsorption of a water molecule on the M3-C3S (111) surface is performed using the same setting as the surface relaxation. During geometry optimization, the water molecule in most ‘downward’ cases, except case 13, turns around, leading to the same adsorption configurations with their corresponding ‘upright’ cases. This result suggests that the reaction between the water molecule and surface Ca atoms is superior to the reaction with surface O atoms. Furthermore, several bridge sites are also absorbed into the same configuration as the adjacent top sites. Figure 5 shows the six adsorption configurations (AC) after geometry optimization (the atomic labelling and bond length can be found in Figure A3 and Figure A4 in Appendix A). Table 3 summarizes the adsorption mechanism, the adsorption energy, and the net number of bonds (N) formed during the water adsorption. Notably, a bond is considered to be formed when the distance between two atoms is smaller than the average bond distance between these two kinds of atoms in the literature.
As shown in Figure 5 and Table 3, there are two types of interactions between the water molecule and the M3-C3S (111) surface, namely the molecular adsorption and the dissociative adsorption. For molecular adsorption, bonds are formed between the Ow atom and surface Ca atoms with bond lengths ranging from 2.27 to 2.79 Å (the Ca-O bond length ranges between 2.29 to 2.60 Å in bulk M3-C3S). In some cases, such as case 13, hydrogen bonds are also formed between the H atoms and the surface O (Os) atoms. For dissociative adsorption, apart from the bond formation between Ow/Ca and H/Os, intermolecular OH bonds are broken during the geometry optimization. Experimental data from infrared spectroscopy also revealed that the exposure of calcium-silicate substrate to water molecules led to the dissociation and the formation of OH-species [25], which corresponds to the dissociative adsorption of water molecules found in this study.
The adsorption energies for all six configurations vary from −0.93 eV to −2.48 eV. As shown, the adsorption energies for dissociative adsorptions, namely, AC3 and AC4, are −2.28 eV and −2.48 eV respectively. These two adsorption energies are much higher than the remaining adsorption energies in Table 3, indicating that dissociative adsorption is energetically favored compared to molecular adsorption [37]. Among the molecular adsorptions, the highest molecular adsorption energy is −1.81 eV for AC6, which means that the molecular adsorption of water under such configuration is strongest. The adsorption energies for AC2 and AC1 are −1.74 eV and −1.10 eV, respectively. The weakest adsorption of water is observed at AC5 with an adsorption energy of −0.93 eV. As investigated by Zhang et al. [37], the adsorption energy of a water molecule on a β-dicalcium silicate (100) surface ranges from 0.59 eV to 0.99 eV. Therefore, the adsorption of water molecules on the M3-C3S (111) surface is much more favorable in energy compared to the β-dicalcium silicate (100) surface. Moreover, an energy barrier is observed for the water dissociative adsorption on the β-dicalcium silicate (100) surface while the dissociative adsorption of water on the M3-C3S (111) surface is spontaneous, implying that the adsorption rate on the might be higher than on the β-dicalcium silicate (100) surface.
Notably, the calculated adsorption energy in this study agreed well with the results in [27]. In [27], the highest adsorption energy was −2.70 eV and the water molecule was adsorbed onto the M3-C3S (111) surface in a dissociative way. In contrast, the smallest adsorption energy was −0.71 eV, which came from a molecular adsorption. The authors also note here that there were a total of 10 adsorption configurations in [27] while only 6 were found in this study. This might be caused by the difference in the initial water distance to the M3-C3S (100) surface. A larger initial distance was used in this study (4 Å compared to 2.5 Å in [27]), which allows the water molecules to rotate during the adsorption.
A further comparison about the adsorption configuration is provided as follows. The adsorption configurations 2, 4, 5, and 7 in [27] correspond to AC3 in this paper. The lowest energy for this type of adsorption was −2.49 eV in [27], while it is calculated at −2.28 eV in the current study. Adsorption configurations 3 and 8 in [27] correspond to AC4, the lowest energy for this type was −2.70 eV in [27], in the present study it is −2.48 eV. Configurations 6, 9, 10 correspond to AC1, AC5, and the adsorption energies are about −1 eV. The author note that the adsorption configuration 1 in [27] is not found in this paper. However, it is acceptable as this configuration was not the most favorable one among dissociative adsorptions. Instead, another two new configurations, the AC1 and AC6, are observed in this study and the AC6 is found to be the strongest among molecular adsorptions. The reasons for such discrepancies are mentioned previously, including the difference in initial water structures and slab thickness.
In previous studies regarding water-solids interactions, a central issue is investigating the nature of water adsorption, i.e., molecular adsorption of dissociative adsorption. An isolated water molecule is found to not dissociate on many metal oxide surfaces, such as clean MgO (111) surfaces [49] and rutile TiO2 (110) surfaces [50]. In this paper, the hydrogen bonds formed between H atoms and Os atoms promote the dissociative adsorption of the water molecule by weakening its intramolecular OH bonds. Such hydrogen bonding also stabilizes the dissociated water molecules on the M3-C3S (111) surface, hindering their recombination to the molecular state. Therefore, the active Os atoms are quite important for dissociative water adsorption on the M3-C3S (111) surface. The dissociative mechanism found in this paper agrees well with the conclusions in the literature [49,51].
Further investigations of the surface structure show that the water adsorption, especially dissociative adsorption, weakens the Ca–O bond. We use AC1 and AC4 as an example and the bond strength is represented by the corresponding bond lengths [52]. For AC1, the average bond lengths for Ca(1)–O before and after molecular adsorption are 2.18 Å and 2.21 Å, respectively, indicating that the Ca(1)–O bond is weakened. In the case of AC4, the average bond lengths for Ca(1)–O and Ca(4)–O are 2.18 Å and 2.34 Å, respectively, which are increased to 2.29 Å and 2.41 Å after dissociative adsorption. These results suggest that the water adsorption, especially dissociative adsorption, can promote the solid dissolution of the M3-C3S (111) surface.
It is also interesting to investigate the relationship between the adsorption energy and N. As shown in Table 3, the molecular adsorption energy has a strong positive correlation with N. Since both dissociative adsorptions, AC3 and AC4, have an N of two, further studies are needed to analyze the correlation between the dissociative adsorption energy and N. Additionally, the analysis of the adsorption energy using N is only applicable with similar adsorption mechanisms. Therefore, the N from dissociative adsorptions cannot be compared with the N from molecular adsorptions because, for example, dissociative adsorption involves the breakage of H–O bonds.

3.3. Electronic Properties of Reactions between a Water Molecule and the M3-C3S (111) Surface

As discussed before, the adsorption of a water molecule on the M3-C3S (111) surface exhibits different configurations depending on the adsorption mechanisms involved. In this section, we present a more detailed analysis of the hydration reactions. AC4 and AC6 are selected to represent dissociative and molecular adsorption, respectively. Atomic labelling and freshly formed bonds during adsorption are illustrated in Figure 6. Electronic property analysis for the other adsorption configurations can be as easily performed and will reveal similar conclusions as those from AC4 and AC6.

3.3.1. Bader Charge Analysis

A Bader charge analysis is used to investigate the charge distribution and transfer of bonding atoms before and after water adsorption. In this study, the charge transfer is calculated as the charge difference before and after adsorption for a particular atom. Thus, a +/− charge transfer represents a loss/gain of electrons during the adsorption, respectively [53]. The Bader charges of the reacting atoms from AC4 and AC6 are shown in Table 4 and Table 5, respectively.
As shown, the electrons are transferred between bonding atoms during the adsorption of water molecules on the M3-C3S (111) surface. Generally, electrons are transferred from the M3-C3S (111) surface to the water molecule. For the bonding between surface Ca atoms with Ow atoms, surface Ca atoms tend to lose electrons, while Ow atoms tend to gain electrons during adsorption. Taking the Ow–Ca(1) bond from AC4 as an example, the Bader charge of the Ow changes from −1.184 to −1.349 eV, indicating the Ow gains 0.165 electrons. In contrast, the Ca(1) atom loses 0.074 eV, increasing its Bader charge from +1.490 to +1.542 eV. In the case of the bonding between the H and surface O atoms, the surface O atoms lose electrons while the H atoms gain electrons, except H(1) from AC6. The results regarding the electron transfer agreed well with the results in [27], which provided detailed discussion about the electron transfer during the water adsorption on the M3-C3S (100) surface.

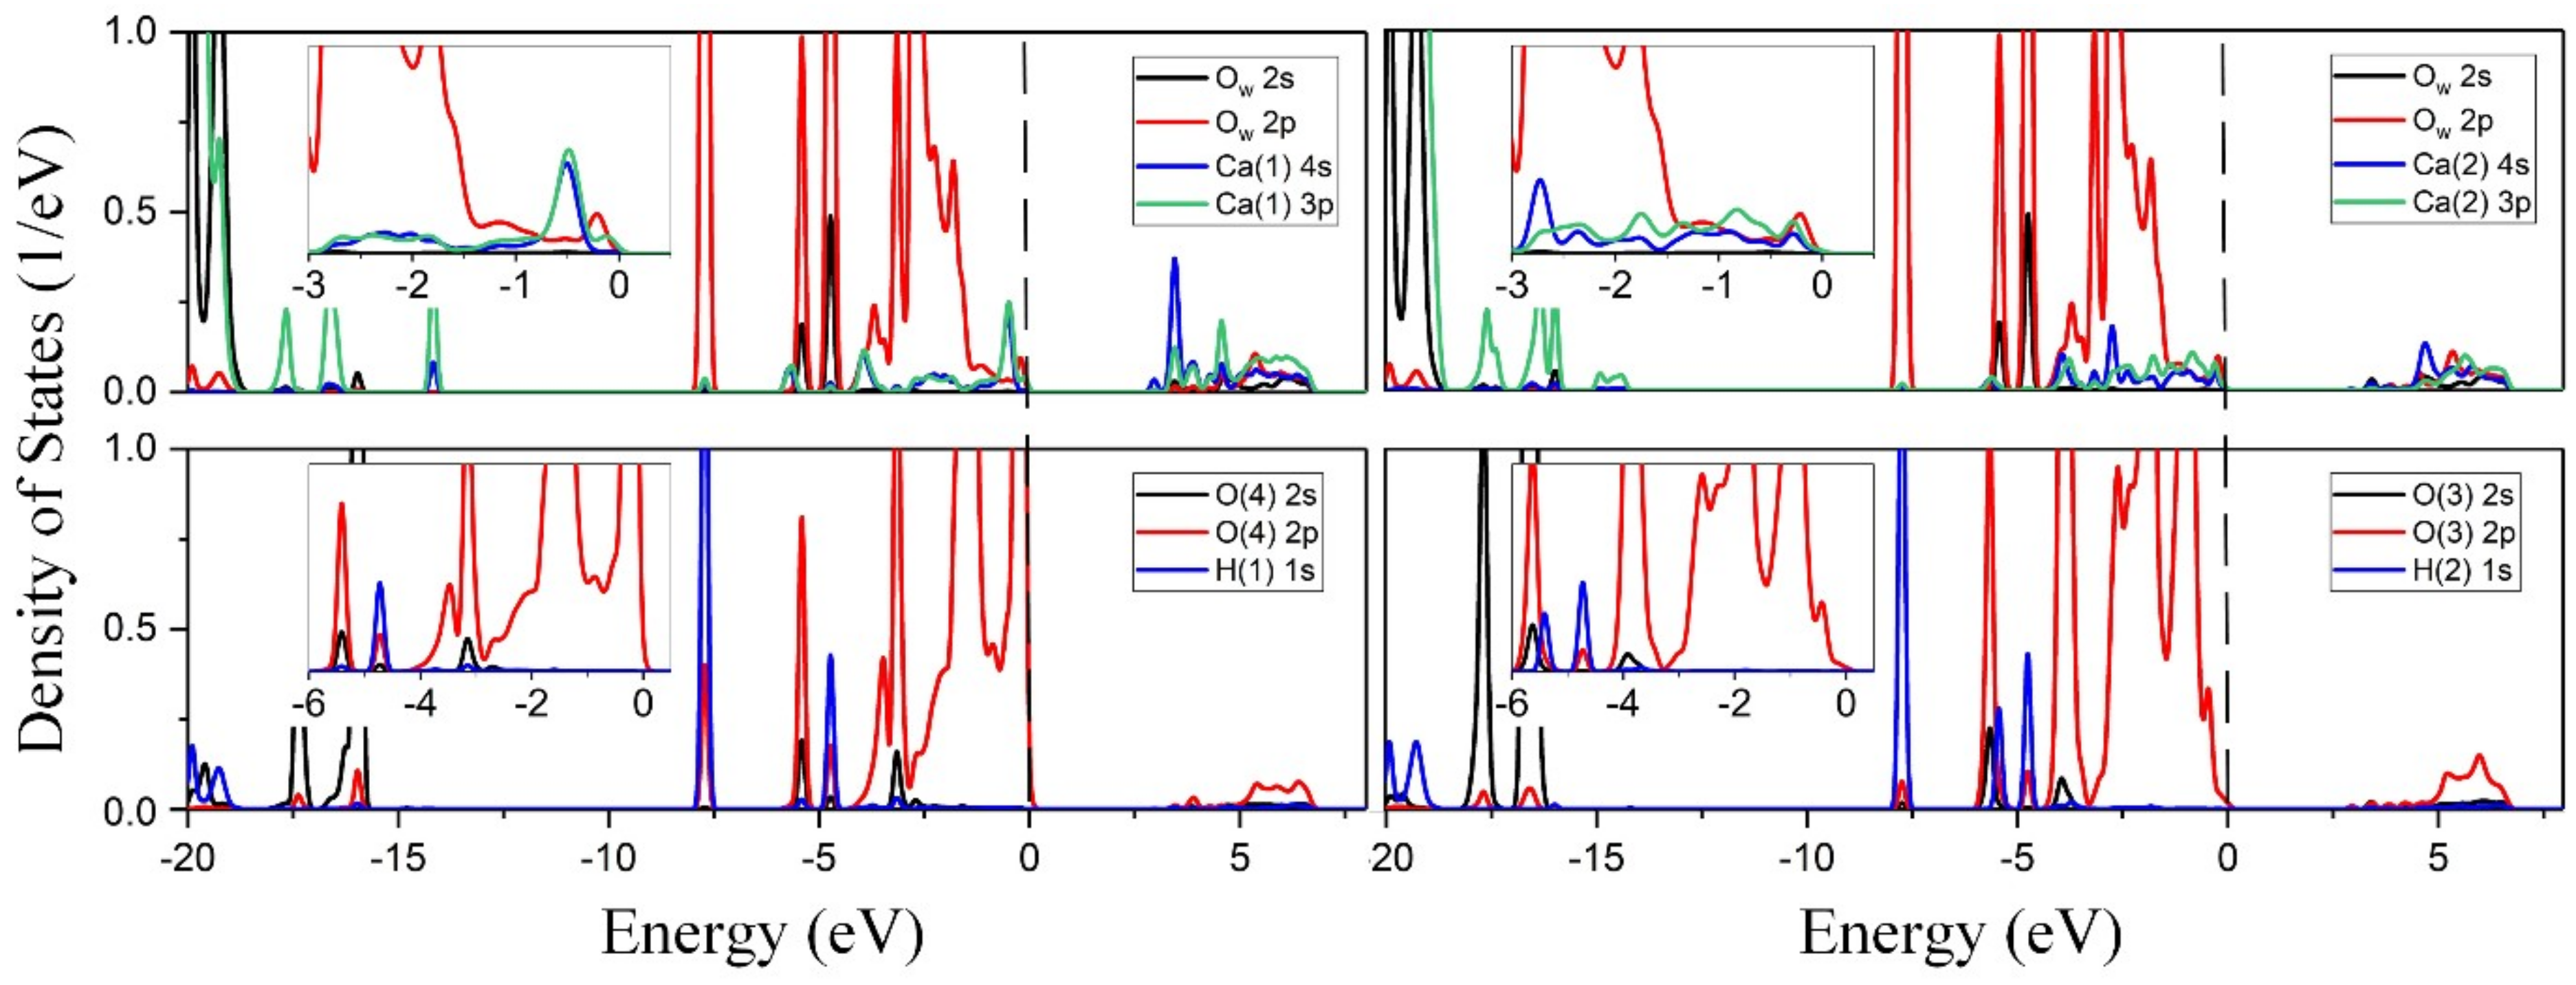
3.3.2. Density of States Analysis

Thus far, we have presented the Bader charge results before and after water adsorption. Next, we turn our attention to the DOS of atoms participating in the creation of freshly formed bonds. In this study, the freshly formed bonds represent those bonds that have not been observed in both the slab surface and the water molecule. Although some bonds have undergone evident changes during adsorption, such as the Ow–H(1) bond from AC4, they are not investigated in the DOS analysis for clarity purposes.
Figure 7 illustrates the DOS of the freshly formed bonds from AC4, including the Ow–Ca(1) bond, the Ow–Ca(5) bond, and the O(1)–H(2) bond. In the DOS curve of Ow–Ca(1), the Ow 2p orbital from the water molecule overlaps with the Ca(1) 4s and 3p orbitals from the M3-C3S (111) surface near the Ef (−2.0 eV to 0 eV). Additionally, a more considerable overlapping is observed at approximately −6 eV, which involves all s and p orbitals from the Ow atom and Ca(1). These results show that the Ow atom can be bonded to the Ca(1) atom. Although the other atomic orbitals also contribute to the DOS, they are either not-overlapped or overlapped but far from the Ef (i.e., the overlapping between Ow 2s and Ca(1) 3p near −17.5 eV). Therefore, these orbitals have a negligible influence on the interaction between the water molecule and the M3-C3S (111) surface. The overall DOS distribution of Ow–Ca(5) is similar to that of Ow–Ca(1). However, there is no extensive overlapping at approximately −6 eV, implying that the Ow–Ca(5) bond is weaker than the Ow–Ca(1) bond. This result agrees with their corresponding bond lengths, 2.53 Å for Ow–Ca(5) and 2.29 Å for Ow–Ca(1). The DOS overlapping in the O(1) –H(2) bond is derived mainly from O(1) 2p and H(2) 1s orbitals within the range of −7 to −5 eV.
Four bonds are freshly formed in AC6, namely the Ow−Ca(1) bond, the Ow−Ca(2) bond, the O(4) −H(1) bond and the O(3) −H(2) bond, whose DOS is shown in Figure 8. The overlapping between Ow and Ca atoms is mainly within the range of −4 to 0 eV. However, the overlapped DOS is not extensive, indicating weak bonding between Ow and Ca atoms. Compared with Ow−Ca(1), a larger DOS overlapping is observed between the Ow 2p orbital and Ca(2) 4s and 3p orbitals. This result suggests that the Ow−Ca(2) bond is stronger than the Ow−Ca(1) bond in this adsorption configuration (the bond lengths for Ow−Ca(1) and Ow−Ca(2) are 2.67 Å and 2.58 Å, respectively). The bonding between H atoms and surface O atoms is mainly derived from O 2p and H 1s orbitals, as seen from the overlapped DOS at approximately −7.6 and −4.8 eV. Furthermore, the DOS overlapping between O(4) and H(1) is more extensive than between O(3) and H(2), indicating a stronger hydrogen bond between O(4) and H(1). The bond length of O(4)−H(1) is 1.59 Å while the bond length of O(3)−H(2) is 1.97 Å, which agrees well with the DOS results.

3.4. Limitations and Future Works

Though this study contributes to the knowledge of the adsorption of a single water molecule on M3-C3S (111) surfaces, challenges still remain. Firstly, only the most reactive surface of M3-C3S, the (111) surface, was investigated and there were other representative surfaces available in the literature, such as the (100) surface. Secondly, the current study focused on the adsorption of a single water molecule and the adsorption configuration with different water coverage was not investigated. The authors note that the adsorption of a single water molecule is always a good starting point, which has been widely used in the literature [27,37,54]. Finally, the influence of surface defects, such as vacancy and impurity, on water adsorption was not investigated.
Future works will be performed to fill the gap about the above-mentioned limitations. More representative surfaces of the M3-C3S will be investigated and the results will be compared with the results from the literature [27]. Moreover, we will take a step further to investigate the influence of water coverage and surface defects on the water adsorption on M3-C3S surfaces.

4. Conclusions

The current study employs DFT calculations to investigate the interaction between a water molecule and the M3-C3S (111) surface. Such an atomic level study improves the understanding of cement hydration, which can work as a benchmark for further studies. The electronic properties of the M3-C3S (111) surface are determined and the adsorption energies for 14 cases with different starting geometries are calculated. The results show that the surface ionic O atoms and surface Ca atoms are the active sites for water adsorption. Interestingly, the charge density, Bader charge and DOS results reveal that surface Ca atoms are even more active for water adsorption. Water molecules can be readily adsorbed on the M3-C3S (111) surface with six adsorption configurations. The adsorption energies range from −0.93 to −2.48 eV and it is found that dissociative adsorption is energetically favored compared to molecular adsorption. Also, water adsorption, especially the dissociative adsorption, promoted the cement dissolution in water as such adsorptions weakened the Ca–O bond. The adsorption of a water molecule on the M3-C3S (111) surface involves electron transfer from the surface to the water molecule through the bonding atoms. The bonding between Ow and surface Ca atoms is derived from the Ow 2p orbital and the Ca 4s and 3p orbitals while the bonding between H atoms and surface O atoms mainly involves the O 2p and H 1s orbitals.

Author Contributions

Conceptualization, C.Q. and L.L.; methodology, C.Q., formal analysis, C.Q., J.H., Q.C., L.-J.Y., P.L., VASP resources, P.L.; writing—original draft preparation, C.Q.; writing—review and editing, C.Q., L.L., J.H., Q.C., L.-J.Y., P.L.; visualization, C.Q.; funding acquisition, L.L.

Funding

This work is financially supported by the National Natural Science Foundation of China (Nos. 51674188, 51404191, 51504182, 51405381), Shaanxi Innovative Talents Cultivate Program-New-star Plan of Science and Technology (2018KJXX-083), Natural Science Basic Research Plan of Shaanxi Province of China (No. 2015JQ5187), Scientific Research Program funded by the Shaanxi Provincial Education Department (No. 15JK1466), China Postdoctoral Science Foundation (No. 2015M582685), and Outstanding Youth Science Fund of Xi’an University of Science and Technology (No. 2018YQ2-01). The first author is supported by China Scholarship Council (No. 201606420046).

Conflicts of Interest

The authors declare no conflict of interest.

Appendix A

Figure A1. Structure of unit cell of M3-C3S. Green spheres indicate Ca; red spheres indicate O; blue spheres indicate Si in the center of the tetrahedron.
Minerals 09 00202 g0a1
Figure A2. Band decomposed charge densities at the TVB and BCB, ρ(r)TVB and ρ(r)BCB, of M3-C3S slab structures.
Minerals 09 00202 g0a2
Figure A3. Side views of six adsorption configurations of a water molecule on the M3-C3S (111) surface.
Minerals 09 00202 g0a3
Figure A4. Top views of six adsorption configurations of a water molecule on the M3-C3S (111) surface.
Minerals 09 00202 g0a4

References

  1. Edraki, M.; Baumgartl, T.; Manlapig, E.; Bradshaw, D.; Franks, D.M.; Moran, C.J. Designing mine tailings for better environmental, social and economic outcomes: A review of alternative approaches. J. Clean. Prod. 2014, 84, 411–420. [Google Scholar] [CrossRef]
  2. Kesimal, A.; Yilmaz, E.; Ercikdi, B.; Alp, I.; Deveci, H. Effect of properties of tailings and binder on the short-and long-term strength and stability of cemented paste backfill. Mater. Lett. 2005, 59, 3703–3709. [Google Scholar] [CrossRef]
  3. Sun, W.; Wang, C.; Zhang, C. Factor analysis and forecasting of CO2 emissions in Hebei, using extreme learning machine based on particle swarm optimization. J. Clean. Prod. 2017, 162, 1095–1101. [Google Scholar] [CrossRef]
  4. Yilmaz, E.; Belem, T.; Benzaazoua, M. Effects of curing and stress conditions on hydromechanical, geotechnical and geochemical properties of cemented paste backfill. Eng. Geol. 2014, 168, 23–37. [Google Scholar] [CrossRef]
  5. Yılmaz, T.; Ercikdi, B. Predicting the uniaxial compressive strength of cemented paste backfill from ultrasonic pulse velocity test. Nondestruct. Test. Eval. 2016, 31, 247–266. [Google Scholar] [CrossRef]
  6. Qi, C.; Tang, X.; Dong, X.; Chen, Q.; Fourie, A.; Liu, E. Towards Intelligent Mining for Backfill: A genetic programming-based method for strength forecasting of cemented paste backfill. Miner. Eng. 2019, 133, 69–79. [Google Scholar] [CrossRef]
  7. Liu, L.; Fang, Z.; Qi, C.; Zhang, B.; Guo, L.; Song, K.I.I.L. Numerical study on the pipe flow characteristics of the cemented paste backfill slurry considering hydration effects. Powder Technol. 2019, 343, 454–464. [Google Scholar] [CrossRef]
  8. Zhao, Y.; Li, R.; Ji, C.; Huan, C.; Zhang, B.; Liu, L. Parametric study and design of an earth-air heat exchanger using model experiment for memorial heating and cooling. Appl. Therm. Eng. 2019, 148, 838–845. [Google Scholar] [CrossRef]
  9. Liu, L.; Zhu, C.; Qi, C.; Zhang, B.; Song, K.-I. A microstructural hydration model for cemented paste backfill considering internal sulfate attacks. Constr. Build. Mater. 2019, 211, 99–108. [Google Scholar]
  10. Qi, C.; Chen, Q.; Fourie, A.; Zhao, J.; Zhang, Q. Pressure drop in pipe flow of cemented paste backfill: Experimental and modeling study. Powder Technol. 2018, 333, 9–18. [Google Scholar] [CrossRef]
  11. Wang, M.; Liu, L.; Zhang, X.-Y.; Chen, L.; Wang, S.-Q.; Jia, Y.-H. Experimental and numerical investigations of heat transfer and phase change characteristics of cemented paste backfill with pcm. Appl. Therm. Eng. 2019, 150, 121–131. [Google Scholar] [CrossRef]
  12. Zhao, Y.; Zhang, Z.; Ji, C.; Liu, L.; Zhang, B.; Huan, C. Characterization of particulate matter from heating and cooling several edible oils. Build. Environ. 2019, 152, 204–213. [Google Scholar] [CrossRef]
  13. Fall, M.; Adrien, D.; Célestin, J.C.; Pokharel, M.; Touré, M. Saturated hydraulic conductivity of cemented paste backfill. Miner. Eng. 2009, 22, 1307–1317. [Google Scholar] [CrossRef]
  14. Qi, C.; Chen, Q.; Fourie, A.; Tang, X.; Zhang, Q.; Dong, X.; Feng, Y. Constitutive modelling of cemented paste backfill: A data-mining approach. Build. Environ. 2019, 197, 262–270. [Google Scholar] [CrossRef]
  15. Qi, C.; Fourie, A.; Chen, Q.; Tang, X.; Zhang, Q.; Gao, R. Data-driven modelling of the flocculation process on mineral processing tailings treatment. J.Clean. Production 2018, 196, 505–516. [Google Scholar] [CrossRef]
  16. Scrivener, K. The Concrete Conundrum. Chem. World 2008, 5, 62–66. [Google Scholar]
  17. Monteiro, P.J.; Miller, S.A.; Horvath, A. Towards sustainable concrete. Nat. Mater. 2017, 16, 698. [Google Scholar] [CrossRef] [PubMed]
  18. Hou, D.; Zhao, T.; Ma, H.; Li, Z. Reactive molecular simulation on water confined in the nanopores of the calcium silicate hydrate gel: Structure, reactivity, and mechanical properties. J. Phys. Chem. C 2015, 119, 1346–1358. [Google Scholar] [CrossRef]
  19. Durgun, E.; Manzano, H.; Pellenq, R.; Grossman, J.C. Understanding and controlling the reactivity of the calcium silicate phases from first principles. Chem. Mater. 2012, 24, 1262–1267. [Google Scholar] [CrossRef]
  20. Durgun, E.; Manzano, H.; Kumar, P.; Grossman, J.C. The characterization, stability, and reactivity of synthetic calcium silicate surfaces from first principles. J. Phys. Chem. C 2014, 118, 15214–15219. [Google Scholar] [CrossRef]
  21. Saritas, K.; Ataca, C.; Grossman, J.C. Predicting electronic structure in tricalcium silicate phases with impurities using first-principles. J. Phys. Chem. C 2015, 119, 5074–5079. [Google Scholar] [CrossRef]
  22. Manzano, H.; Dolado, J.S.; Ayuela, A. Structural, mechanical, and reactivity properties of tricalcium aluminate using first-principles calculations. J. Am. Ceram. Soc. 2009, 92, 897–902. [Google Scholar] [CrossRef]
  23. Huang, J.; Wang, B.; Yu, Y.; Valenzano, L.; Bauchy, M.; Sant, G. Electronic origin of doping-induced enhancements of reactivity: Case study of tricalcium silicate. J. Phys. Chem. C 2015, 119, 25991–25999. [Google Scholar] [CrossRef]
  24. Sanna, S.; Schmidt, W.G.; Thissen, P. Formation of Hydroxyl Groups at Calcium-Silicate-Hydrate (C-S-H): Coexistence of Ca–OH and Si–OH on Wollastonite(001). J. Phys. Chem. C 2014, 118, 8007–8013. [Google Scholar] [CrossRef]
  25. Thissen, P.; Natzeck, C.; Giraudo, N.; Weidler, P.; Wöll, C. Hydration of Concrete: The First Steps. Chem. A Eur. J. 2018, 24, 8603–8608. [Google Scholar] [CrossRef] [PubMed]
  26. Qi, C.; Fourie, A.; Chen, Q.; Liu, P. Application of first-principles theory in ferrite phases of cemented paste backfill. Miner. Eng. 2019, 133, 47–51. [Google Scholar] [CrossRef]
  27. Zhang, Y.; Lu, X.; Song, D.; Liu, S. The adsorption of a single water molecule on low-index C3S surfaces: A DFT approach. Appl. Surf. Sci. 2019, 471, 658–663. [Google Scholar] [CrossRef]
  28. Perdew, J.P.; Burke, K.; Ernzerhof, M. Generalized gradient approximation made simple. Phys. Rev. Lett. 1996, 77, 3865. [Google Scholar] [CrossRef] [PubMed]
  29. Kresse, G.; Hafner, J. Ab initio molecular dynamics for liquid metals. Phys. Rev. B 1993, 47, 558. [Google Scholar] [CrossRef]
  30. Kresse, G.; Furthmüller, J. Efficiency of ab-initio total energy calculations for metals and semiconductors using a plane-wave basis set. Comput. Mater. Sci. 1996, 6, 15–50. [Google Scholar] [CrossRef]
  31. Viñes, F.; Sousa, C.; Liu, P.; Rodriguez, J.A.; Illas, F. A systematic density functional theory study of the electronic structure of bulk and (001) surface of transition-metals carbides. J. Chem. Phys. 2005, 122, 174709. [Google Scholar] [CrossRef]
  32. Yu, B.D.; Scheffler, M. Physical origin of exchange diffusion on fcc(100) metal surfaces. Phys. Rev. B 1997, 56, R15569–R15572. [Google Scholar] [CrossRef]
  33. Shi, X.-R.; Wang, S.-G.; Wang, H.; Deng, C.-M.; Qin, Z.; Wang, J. Structure and stability of β-Mo2C bulk and surfaces: A density functional theory study. Surf. Sci. 2009, 603, 852–859. [Google Scholar] [CrossRef]
  34. Rossmeisl, J.; Qu, Z.W.; Zhu, H.; Kroes, G.J.; Nørskov, J.K. Electrolysis of water on oxide surfaces. J. Electroanal. Chem. 2007, 607, 83–89. [Google Scholar] [CrossRef]
  35. Guo, P.; Guo, X.; Zheng, C. Roles of γ-Fe2O3 in fly ash for mercury removal: Results of density functional theory study. Appl. Surf. Sci. 2010, 256, 6991–6996. [Google Scholar] [CrossRef]
  36. De Noirfontaine, M.N.; Dunstetter, F.; Courtial, M.; Gasecki, G.; Signes-Frehel, M. Polymorphism of tricalcium silicate, the major compound of Portland cement clinker: 2. Modelling alite for Rietveld analysis, an industrial challenge. Cement Concr. Res. 2006, 36, 54–64. [Google Scholar] [CrossRef]
  37. Zhang, Y.; Lu, X.; He, Z.; Song, D. Molecular and dissociative adsorption of a single water molecule on a β-dicalcium silicate (100) surface explored by a DFT approach. J. Am. Ceram. Soc. 2018, 101, 2428–2437. [Google Scholar] [CrossRef]
  38. Schiros, T.; Haq, S.; Ogasawara, H.; Takahashi, O.; Öström, H.; Andersson, K.; Pettersson, L.G.M.; Hodgson, A.; Nilsson, A. Structure of water adsorbed on the open Cu(110) surface: H-up, H-down, or both? Chem. Phys. Lett. 2006, 429, 415–419. [Google Scholar] [CrossRef]
  39. Peng, C.; Min, F.; Liu, L.; Chen, J. A periodic DFT study of adsorption of water on sodium-montmorillonite (001) basal and (010) edge surface. Appl. Surf. Sci. 2016, 387, 308–316. [Google Scholar] [CrossRef]
  40. Xin, Y.; Hou, S.C.; Xiang, L.; Yu, Y.-X. Adsorption and substitution effects of Mg on the growth of calcium sulfate hemihydrate: An ab initio DFT study. Appl. Surf. Sci. 2015, 357, 1552–1557. [Google Scholar] [CrossRef]
  41. Liu, J.; Wen, S.; Deng, J.; Chen, X.; Feng, Q. DFT study of ethyl xanthate interaction with sphalerite (110) surface in the absence and presence of copper. Appl. Surf. Sci. 2014, 311, 258–263. [Google Scholar] [CrossRef]
  42. Sholl, D.; Steckel, J.A. Density Functional Theory: A Practical Introduction; John Wiley Sons: Hoboken, NJ, USA, 2011. [Google Scholar]
  43. Fan, X.; Chang, C.H.; Zheng, W.T.; Kuo, J.-L.; Singh, D.J. The Electronic Properties of Single-Layer and Multilayer MoS2 under High Pressure. J. Phys. Chem. C 2015, 119, 10189–10196. [Google Scholar] [CrossRef]
  44. Parr, R.G.; Yang, W. Density functional approach to the frontier-electron theory of chemical reactivity. J. Am. Chem. Soc. 1984, 106, 4049–4050. [Google Scholar] [CrossRef]
  45. Astala, R.; Stott, M. First-principles study of hydroxyapatite surfaces and water adsorption. Phys. Rev. B 2008, 78, 075427. [Google Scholar] [CrossRef]
  46. Bader, R.F. A quantum theory of molecular structure and its applications. Chem. Rev. 1991, 91, 893–928. [Google Scholar] [CrossRef] [Green Version]
  47. Tang, W.; Sanville, E.; Henkelman, G. A grid-based Bader analysis algorithm without lattice bias. J. Phys. Condens. Matter 2009, 21, 084204. [Google Scholar] [CrossRef] [PubMed]
  48. Zhao, C.; Chen, J.; Li, Y.; Huang, W.D.; Li, W. DFT study of interactions between calcium hydroxyl ions and pyrite, marcasite, pyrrhotite surfaces. Appl. Surf. Sci. 2015, 355, 577–581. [Google Scholar] [CrossRef]
  49. Odelius, M. Mixed Molecular and Dissociative Water Adsorption on MgO[100]. Phys. Rev. Lett. 1999, 82, 3919–3922. [Google Scholar] [CrossRef]
  50. Schaub, R.; Thostrup, P.; Lopez, N.; Lægsgaard, E.; Stensgaard, I.; Nørskov, J.K.; Besenbacher, F. Oxygen Vacancies as Active Sites for Water Dissociation on Rutile TiO2(110). Phys. Rev. Lett. 2001, 87, 266104. [Google Scholar] [CrossRef]
  51. Hass, K.C.; Schneider, W.F.; Curioni, A.; Andreoni, W. The chemistry of water on alumina surfaces: Reaction dynamics from first principles. Science 1998, 282, 265–268. [Google Scholar] [CrossRef]
  52. Tilocca, A.; Selloni, A. Reaction pathway and free energy barrier for defect-induced water dissociation on the (101) surface of TiO2-anatase. J. Chem. Phys. 2003, 119, 7445–7450. [Google Scholar] [CrossRef]
  53. Liu, X.; Sui, Y.; Meng, C.; Han, Y. Tuning the reactivity of Ru nanoparticles by defect engineering of the reduced graphene oxide support. RSC Adv. 2014, 4, 22230–22240. [Google Scholar] [CrossRef]
  54. Zhang, L.; Wu, Y.; Liu, Y.; Li, H. DFT study of single water molecule adsorption on the (100) and (101) surfaces of KH2PO4. RSC Adv. 2017, 7, 26170–26178. [Google Scholar] [CrossRef]
Figure 1. Near-surface structures of M3-C3S (111) before and after relaxation. Green spheres indicate Ca; red spheres indicate O; blue spheres indicate Si in the center of the SiO4 tetrahedron; dashed ellipses indicate several changes before and after surface relaxation.
Minerals 09 00202 g001
Figure 2. Initial configurations of a water molecule on the top of the M3-C3S (111) surface: (a) downward and (b) upright. White spheres indicate H.
Minerals 09 00202 g002
Figure 3. Band decomposed charge densities around the TVB and BCB, ρ(r)TVB and ρ(r)BCB, of M3-C3S structures for (a), (b) unit cell and (c), (d) surface atoms.
Minerals 09 00202 g003
Figure 4. Partial density of states for surface O and Ca atoms.
Minerals 09 00202 g004
Figure 5. Adsorption configurations of a water molecule on the M3-C3S (111) surface.
Minerals 09 00202 g005
Figure 6. Atomic labelling for (a) AC4 and (b) AC6.
Minerals 09 00202 g006
Figure 7. Partial density of states for participating atoms in freshly formed bonds from AC4.
Minerals 09 00202 g007
Figure 8. Partial density of states for participating atoms in freshly formed bonds from AC6.
Minerals 09 00202 g008
Table 1. Comparison of lattice parameters of M3-C3S by experimental measurements and density functional theory (DFT) calculations.
Referencesa (Å)b (Å)c (Å)α (°)β (°)γ (°)
Experimental[29]9.307.0812.2290116.0890
DFT calculationsThis work9.367.1512.2590116.4490
[13]9.387.2012.4690116.2390
[20]9.337.1412.3590116.0490
[14]9.237.1112.2190116.0890
Table 2. Starting geometries for a water molecule on the M3-C3S (111) surface.
Case No.Position aConfigurationCase No.PositionConfiguration
1Ca(1)Downward8Ca(1)Upright
2Ca(2)Downward9Ca(2)Upright
3Ca(3)Downward10Ca(3)Upright
4Ca(4)Downward11Ca(4)Upright
5Ca(1)–Ca(2)Downward12Ca(1)–Ca(2)Upright
6Ca(2)–Ca(3)Downward13Ca(2)–Ca(3)Upright
7Ca(3)–Ca(4)Downward14Ca(3)–Ca(4)Upright
Note: a Initial positions with one Ca atom represents the top site on that atom while initial positions with two Ca atoms represents the bridge site between these two Ca atoms.
Table 3. Adsorption mechanism, adsorption energy and the net number of formed bonds for each adsorption configuration. The AC No. 1–6 corresponds to (a)–(c) in Figure 5 and Figure 6.
AC No.Adsorption MechanismAdsorption Energy (eV) aN b
AC1Molecular−1.101
AC2Molecular−1.743
AC3Dissociative−2.282
AC4Dissociative−2.482
AC5Molecular−0.931
AC6Molecular−1.814
Note: a Adsorption energy with multiple cases is calculated to be the average adsorption energy; b Net number of bonds formed during water adsorption is defined as the number of freshly formed bonds minus the number of broken bonds.
Table 4. Bader charge of bonding atoms before and after water adsorption from AC4.
Bader Charge (eV)O(1)OwH(1)H(2)Ca(1)Ca(5)
Before adsorption−1.438−1.184+0.592+0.592+1.490+1.505
After adsorption−1.367−1.349+0.548+0.569+1.564+1.542
Charge transfer +0.071−0.165−0.044−0.023+0.074+0.037
Table 5. Bader charge (eV) of bonding atoms before and after water adsorption from AC6.
Bader Charge (eV)O(3)O(4)OwH(1)H(2)Ca(1)Ca(2)
Before adsorption−1.560−1.558−1.184+0.592+0.592+1.490+1.554
After adsorption−1.543−1.539−1.311+0.648+0.585+1.529+1.568
Charge transfer +0.017+0.019−0.127+0.056−0.007+0.039+0.014

