Article

Integrating the EBM Model and LTS(A,A,A) Model to Evaluate the Efficiency in the Supply Chain of Packaging Industry in Vietnam

by
Chia-Nan Wang
1,*,
Quynh-Ngoc Hoang
1,* and
Thi-Kim-Lien Nguyen
2,*
1
Department of Industrial Engineering and Management, National Kaohsiung University of Science and Technology, Kaohsiung 80778, Taiwan
2
Scientific Research—International Cooperation, Thanh Dong University, Hai Duong 171967, Vietnam
*
Authors to whom correspondence should be addressed.
Submission received: 9 February 2021 / Revised: 27 February 2021 / Accepted: 8 March 2021 / Published: 12 March 2021
(This article belongs to the Special Issue Multiple-Criteria Decision Making)

Abstract

:
In recent decades, Vietnamese labeling and packaging has been widely recognized as being one of the fastest developing industries in Vietnam, supported by the tremendous demand of domestic production and the exportation of its packaged goods. The emerging packaging technology trends and the participation of foreign direct investment (FDI) companies have led to fierce competition between all packaging enterprises in Vietnam. This paper aims to calculate the productivity performance of 10 packaging companies in Vietnam from the past to the future by combining the additive Holt-Winters (LTS(A,A,A)) model to predict key variables in the financial statement for the next 4 years (2020–2023) and an epsilon-based measure of efficiency (EBM) model of data envelopment analysis (DEA) to define the developing trend, efficiency, and ranking of packaging operations. The empirical results will assist packaging enterprises to identify their positions, suggest feasible solutions to overcome shortcomings and catch up with the global trends, and propose superior partnerships for manufacturers, which have packaging service demands and support investment decisions for investors. Overall, all the enterprises in the packaging industry have high productivity. In particular, SIVICO JSC is identified as the most efficient packaging company in Vietnam, as it continuously maintains the first ranking over the observation time, followed by Agriculture Printing & Packing JSC and Bien Hoa Packaging Company. In the past, Tan Dai Hung Plastic JSC was identified as the most unproductive unit, while in the future term, the inefficient decision-making units (DMUs) are Tan Tien Plastic Packaging JSC, Sai Gon Packaging JSC, Dong A JSC, and PetroVietnam Packaging JSC. The suggestion for incompetent enterprises is changing the value of inputs proportionally to optimize for better performance.

1. Introduction

Although packaging is an auxiliary industry for many manufacturing industries, it plays a key role, contributing significantly to the development of the economy. It is also widely considered to be one of the most important parts of logistic systems. The purpose of the earliest and most basic packaging was containing products, serving the stages of transportation, preservation, and display. The second benefit of packaging is protecting products from damage, deformation, theft, or reduction of quality due to external and environmental impacts such as air, humidity, water, and light. Furthermore, providing information on products on stamps, labels, or the cover is a legal requirement for packaging to help consumers better understand the product before making a purchasing decision. Furthermore, packaging has long been recognized as the silent salesperson and has been the focus of much recent regulation [1]. It contributes to product positioning and brand identity. It is also a marketing and sales support tool. Product packaging with innovative designs and unique colors outstanding and suitable for brand identity publications will easily impress consumers and help them associate and remember products and brands more. Research and packaging design is a vital part of the product development strategy of most businesses that cannot be replaced.
Understanding the important role of packaging, as stated by the Vietnam Packaging Association (VINPAS), over the last 10 years, the packaging industry has been recognized as one of the fastest growing economic sectors in both size and the number of enterprises established in Vietnam [2]. Currently, Vietnam has more than 900 packaging factories, and the numbers of companies is still increasing, about 70% of which are concentrated in the southern provinces [3]. The Association of Vietnam Retailers (AVR) explained the first reason behind this development. The population of Vietnam is over 97 million, leading to the rise of domestic demand in the food and beverage industry, as well as for industrial and pharmaceutical product packaging [4]. The Vietnamese food market is on an upward trend and is expected to grow annually by 13.05% (compound annual growth rate (CAGR) 2021–2025) [5]. Besides that, Vietnam is one of the 17 countries with the highest pharmaceutical growth rate in the world, with a market size of about USD 5.1 billion (as stated by IMS Health) [6]. Specifically, in the packaging industry, the proportion of food packaging is approximately one third to a half, while the percentage for electronics packaging is 5–10% and pharmaceutical and chemistry packaging is estimated to be 5–10% [4].
Moreover, recently, the urbanization process has been developing quickly, along with the appearance of a series of foreign supermarkets that invested in Vietnam such as Big C, Aeon, and Lotte Mart. In addition, the habit of using packaged products has given the packaging industry many development opportunities. In addition, the high export market requirement in packing services is stimulating the development of this industry. The Vietnam packaging industry has a high average growth rate of 15–20% per year [
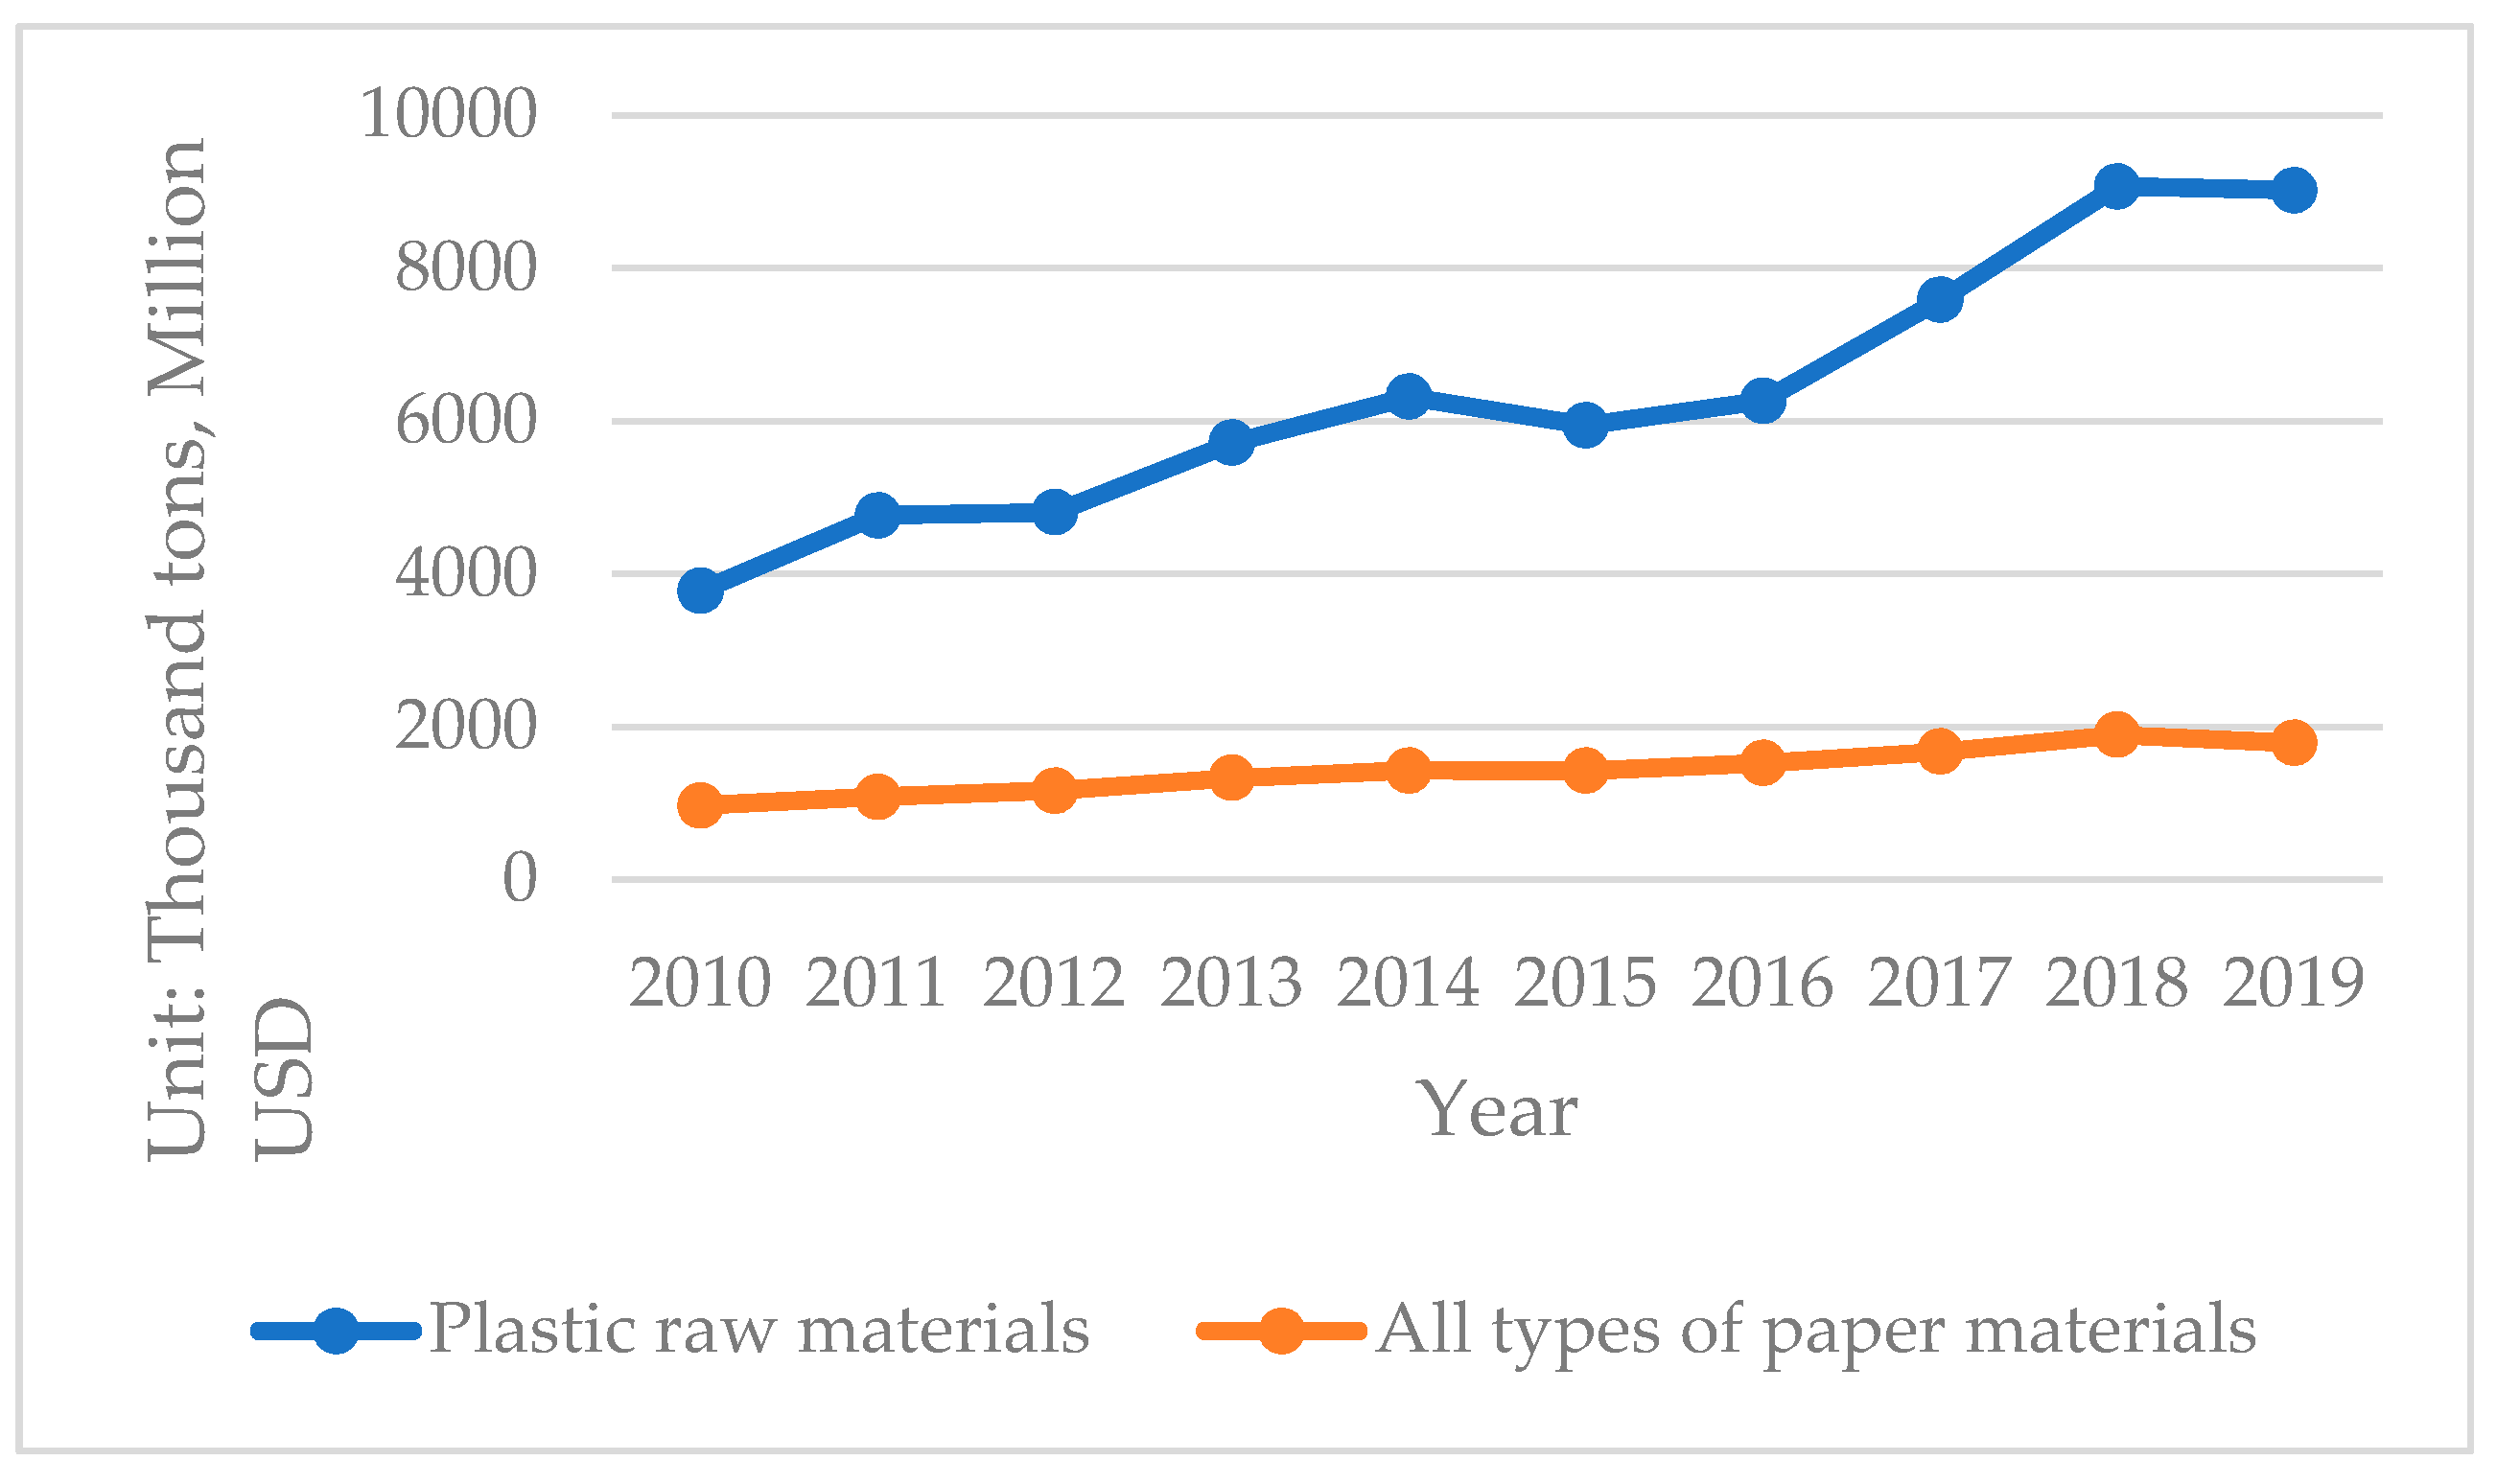
5]. In recent years, the attractiveness of the packaging industry in Vietnam has been proven, as many overseas manufacturers have selected Vietnam as an ideal destination to supply machines, devices, and goods and to invest in building factories. The market for packaging materials can be divided into a series of main segments, including paper and cardboard, plastic, metal, glass, wood, textiles, and other suitable materials such as foam and leather. Based on the statistical data from Thongke [7], Figure 1 summarizes the levels of some imported input materials for packaging production in Vietnam from 2010 to 2019.
In addition, in 2015, greenhouse gas (GHG) emissions from plastics accounted for 3.5 percent of the global annual GHG emissions [8], and in 2018, Laura Parker emphasized that around 40 percent of the plastic created was for the packaging industry, which means this industry would also be responsible for the world’s pollution [9]. Particularly, plastic packaging in Vietnam achieved a growth rate of 25 percent per year and accounted for the highest proportion in structural plastic (38–39%) [10]. In 2019, the total consumption of paper material reached 3818 million tons, while the percentage of paper packaging production attained was over 80% [10].
The packaging industry is undoubtedly considered a potential industry with high growth rate in Vietnam, but according to the National Steering Committee for Clean Water—Ministry of Natural Resources and Environment [11], the paper manufacturing industry that includes the paper packaging industry is one of the most serious environmental polluting industries today, especially for water resources.
To face concerns about environmental pollution with a high amount of plastic waste, the global packaging operation is looking forward to producing active, intelligent [12], and green packaging in the future. Some preliminary work was carried out in 2001, showing that various executives perceive how influential a strategy on how associated social responsibility affects the social and financial performance of an enterprise [13]. Following the global trend, Vietnamese consumers are gradually switching to using green packaging to ensure their health and safety.
These packaging technologies are also known as the trend of environmentally friendly and sustainable development packaging. The solutions are integrating packaging with Internet of things (IoT) technology, recycling materials, reusable packaging products, and using fast decomposition packaging. All these actions aim to reduce hazardous waste in the environment, sustain materials, expand product storage life, and improve safety, management, and cost-effectiveness. At the same time, governments have been aware of and set out regulations to improve the environment. These commitments were agreed upon by worldwide governments. This tendency enhances tough technological competition among all enterprises in the packaging industry. Therefore, the biggest challenge now for this industry is not only finding customers but also investing in technological innovation that has the minimum impact on the environment by using eco-friendly materials and manufacturing processes to compete and catch up with the ever-growing production and sustain business. When the production process is not optimized, the waste of raw materials, fuel, and emissions will also create significant environmental impacts.
Moreover, in the new development context, Vietnam joined the World Trade Organization (WTO) in 2007 and attracted many foreign companies and corporations to come to Vietnam to seek investment opportunities. At this time, the Vietnam government has also allowed 100% foreign-owned companies to operate in the packaging industry [14]. Considering some aspects of competitiveness and production materials, foreign direct investment (FDI) enterprises have shown superiority. Their machines and technology are very modern, have closed production lines, are mostly automated so their costs are low, and their productivity is very high. Vietnamese packaging enterprises also revealed many shortcomings, such as a lack of vision, unclear long-term strategy, poor governance, low productivity, lack of high-quality human resources, weak financial positions, and so on. In addition, the market still requires businesses in the industry to constantly research and create unique and more effective personalization and interaction. There is a major concern that the profit margins of packaging companies will be reduced more than before due to the increase in production costs, and the obstacle to technology transfer is one factor that inhibits the development of the green packaging market. Besides that, the number of consumers aware of the need to use green packaging is still not in the majority, so it is not enough for packaging companies to completely switch to supplying green packaging. If packaging enterprises do not utilize their competitive advantages and update the technology to adapt to growth trends, they will go backward and lose customers. To initiate a sustainable strategy in an operation, different administration systems, such as commodity expense, capital budgeting, information, and performance assessment, must be composed and defined [13].
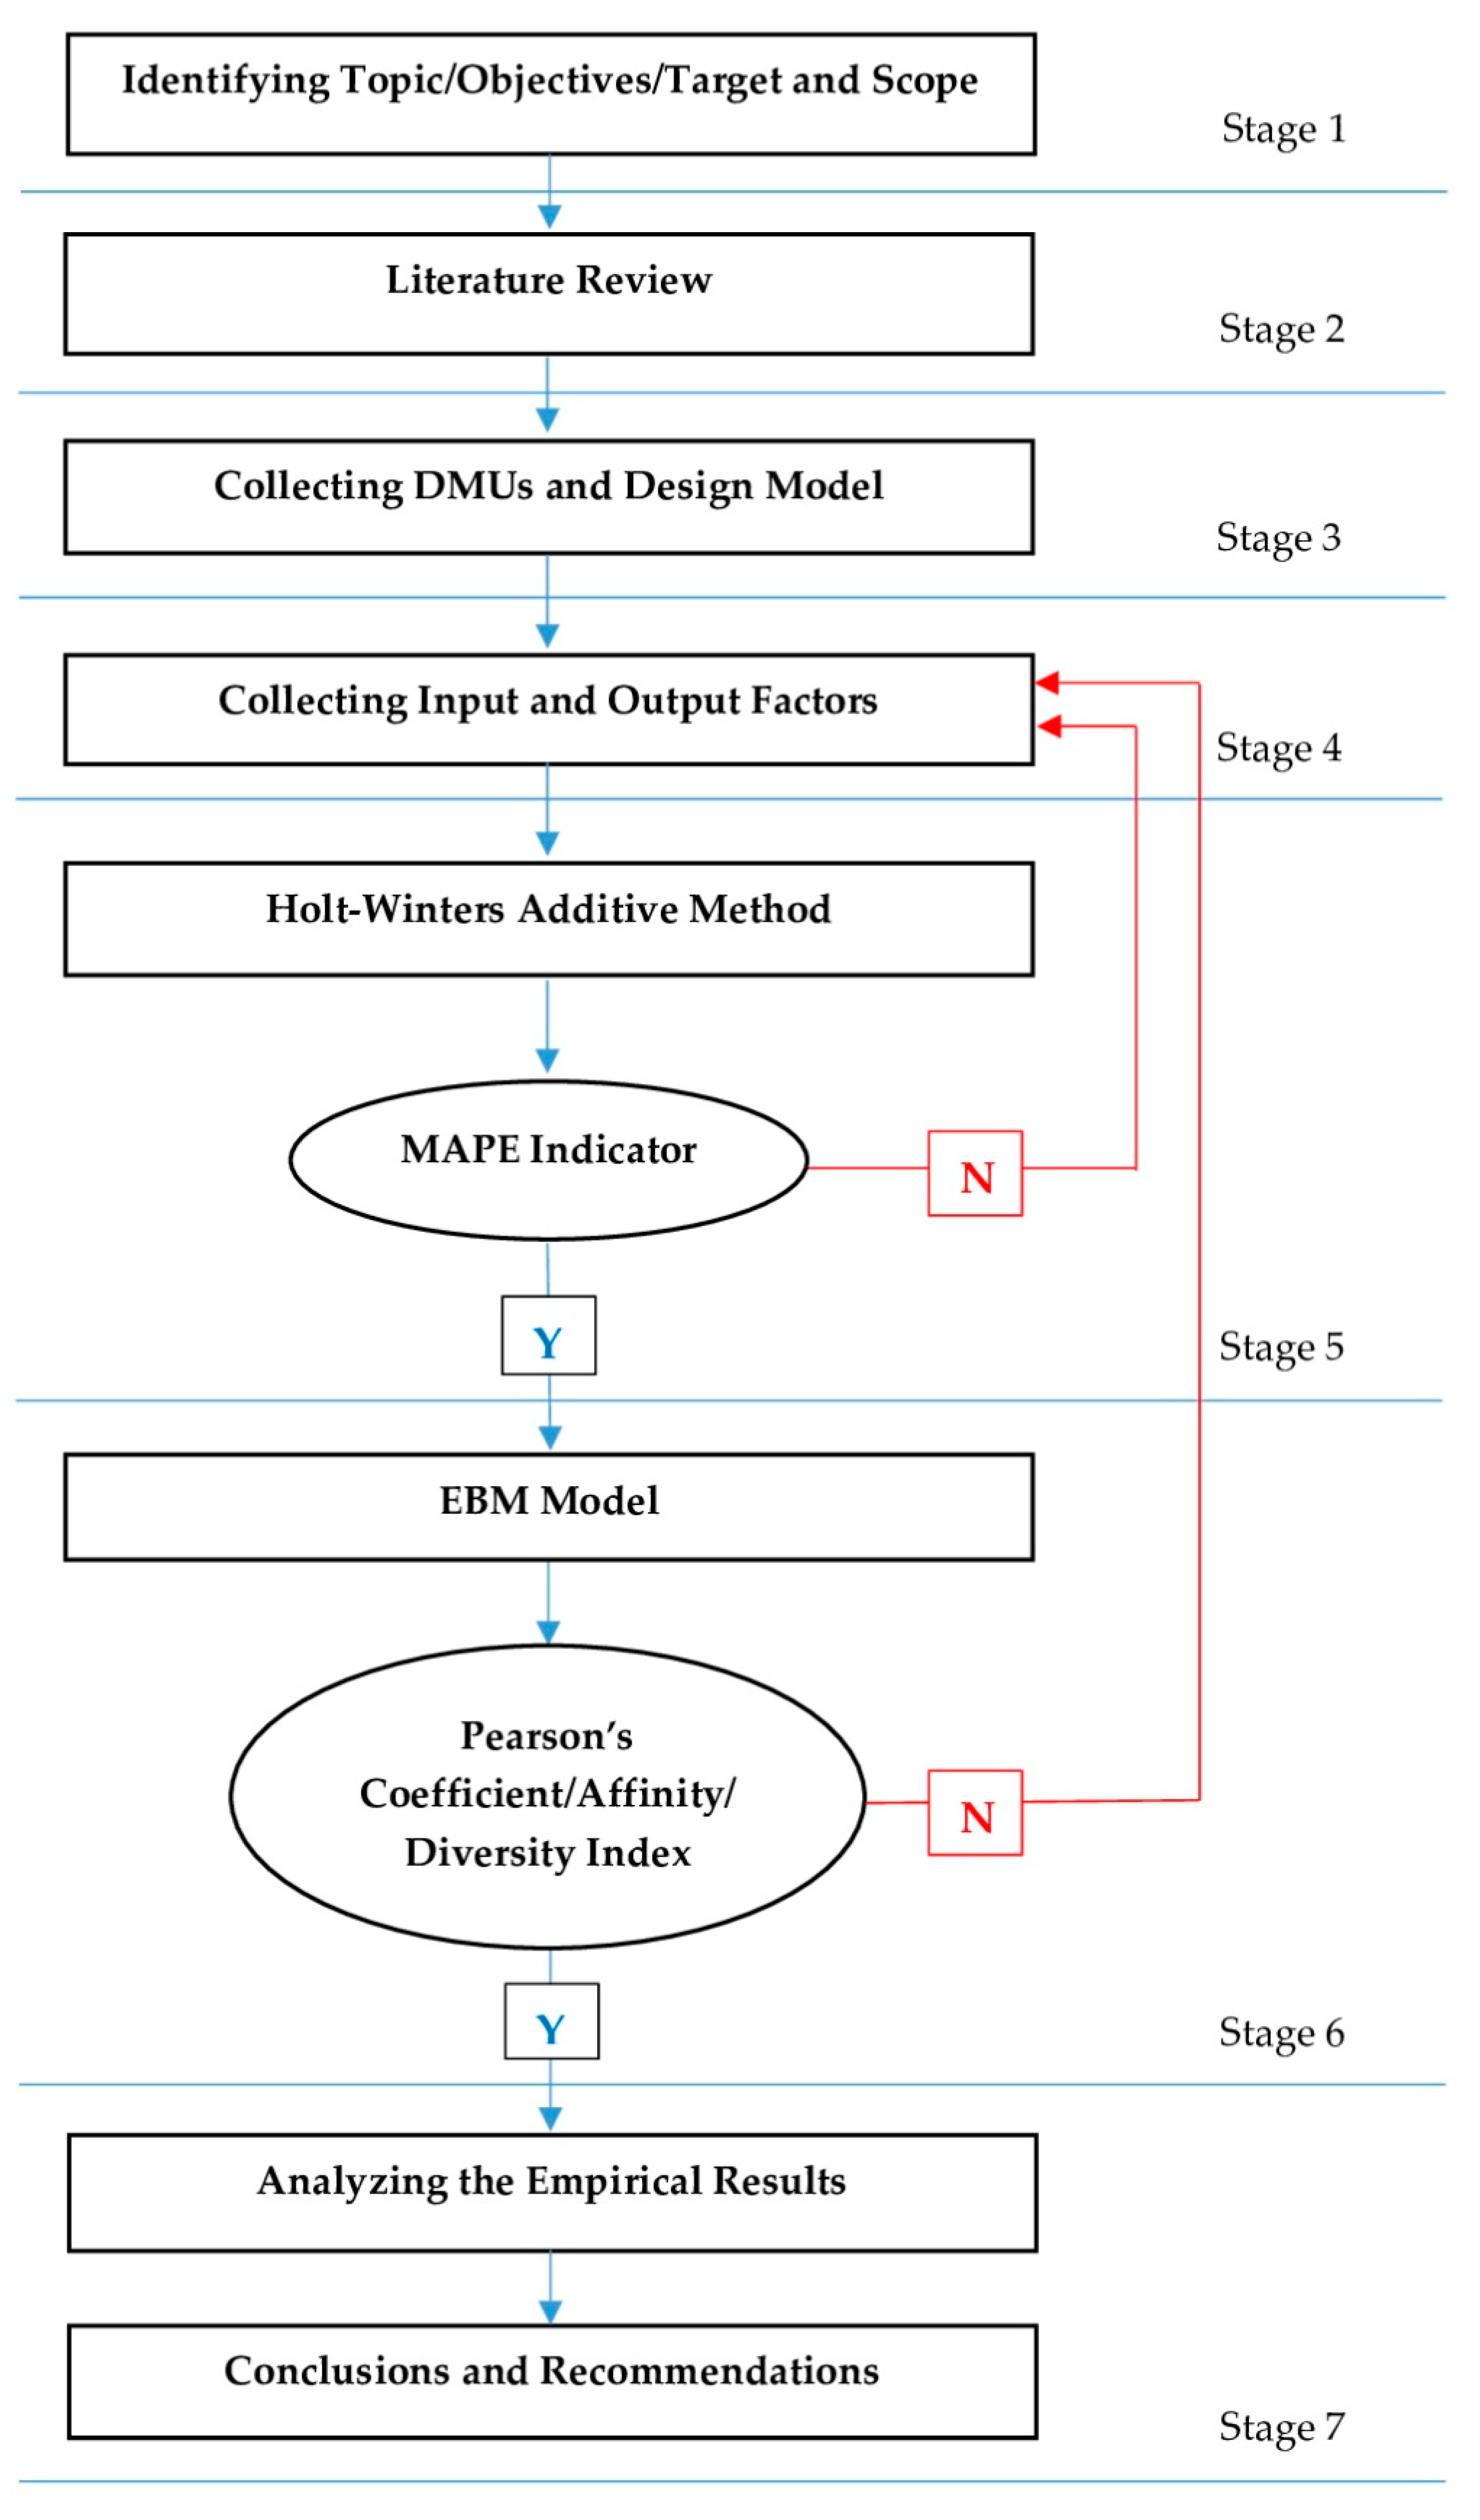
According to all these facts mentioned above, the purpose of this study is to identify and evaluate the performance and ranking of 10 packaging companies in Vietnam in each period from 2012 to 2023, by integrating the additive Holt-Winters (LTS(A,A,A)) forecasting model in Tableau and an epsilon-based measure of efficiency (EBM) in data envelopment analysis (DEA). Due to the fact that financial reporting plays an important role in the process of strategic decision-making, specifically decisions of an investment nature [15], while all the packaging companies are trying to meet the market demands and sustain development and increase their competitive advantages or minimize weaknesses, the financial performance forecasting analysis in this study can show how financial variables change over time and hence support packaging companies to make strategic decisions, whether they should align their budgets or determine expenses to invest in new technology, materials, processes, and consultancy to adapt to global trends, because green supply chain management (GSCM) practices in the packaging industry contain the risks of high investment costs and low returns [16]. Besides that, the results will also assist manufacturers, which need packaging services to find the most suitable partners and investors, who need to make investment decisions in this industry. This investigation is expected to add substantially to the understanding of applying EBM to DEA, the model which can give the score and ranking for each decision-making unit (DMU) performance in the experiment years and its implementation, contributing to the specific solution to improve the efficiency for the identified company.
There are five parts in this paper, and they are as follows. Section 1 is an overview of the study that includes the packaging industry background, motivation, objectives, and the process of the research. Section 2 reviews the literature of the packaging industry, the additive Holt-Winters model (LTS(A,A,A)), and an epsilon-based measure of efficiency (EBM) in DEA, proposes the data sources and figures out the input and output that would be applied for the methods. Section 3 presents the empirical results, indicates assessed values, and calculates and discusses the outcomes. Section 4 provides the conclusions, describes some elements that may affect the findings, and recommends future studies.

2. Theoretical Foundations and Methodology

2.1. Literature Review

As mentioned above, packaging plays an important role in every industry. It is not only the thing that is protecting the products, but also the tool that is supporting overall sales. Package design has a huge impact on the decision-making stage of customers. Nielsen demonstrated that more than 60% of buyers try a new product just because the package attracts their eye, and over 40% will consume a product continuously because of its impressive design [17]. Nowadays, traditional packaging is not sufficient to meet the need of the development of consumer experience expectations over time and increasing product complexity. Moreover, recently, national and international have aimed to promote a circular economy and reduce the carbon footprint of manufactured products [18]. Hence, with the growth trend of smart packaging in the Industry 4.0 era, in 2018, Dirk Schaefer and Wai M. Cheung conducted a general overview of smart packaging and defined its underlying base technologies with opportunities and challenges, hence finding out the solutions for smart packaging to minimize its shortcomings and to get its full potential [19]. Gareth R.T. White et al. investigated the decision’s complication around the interorganizational green packaging design in an automotive manufacturer. The author noticed that despite the enterprise generating considerable attempts to enhance its environmental effectiveness, the most important aspects in the form of packaging are the operational matters [20]. In this study, the performance of packaging companies in Vietnam is measured by integrating the LTS(A,A,A) model and the EBM model.
The Holt-Winters (HW) theory was one of the favorable variants of the exponential smoothing (ES) forecasting method variations, first introduced by Holt [21]. It is a well-known concept that is used to predict the future data value and performance of an undefined system in diversified interdisciplinary fields, capable of accommodating the changing trends and seasonal adjustments based on a selection of time interval data [22]. The HW model includes mathematical equations that are calculated to create accurate forecasts. It divides into two forms based on the nature of the seasonal element. The first variant is the additive method, suitable for obtaining the seasonality changes in data that are stable during the series, and the second is the multiplicative method which, on the contrary, is suitable for catching up the seasonality changes in data that are raised all over the observation time [23]. For example, in 2015, Eimutis Valakevicius and Mindaugas Brazenas used the seasonal Holt-Winters model to forecast the exchange rate volatility [24]. Vicky Chrystian Sugiarto et al. applied the HW method to predict goods demands from consumers for enterprise resource planning at a sales and distribution module [25]. Furthermore, Maciej Szmit and Anna Szmit proposed a modified HW version to forecast the anomaly detection of network traffic [26]. The HW method is integrated and can be used in Tableau, an analytic forecasting platform that was created from a computer science project at Stanford in 2003 [27]. Tableau is a beneficial business intelligence (BI) platform that supports analysis and gives data visualization for organizations from diverse fields and countries to utilize their decision-making procedures. Tableau accommodates with most data forms and gives out-of-the-box combinations with a diversified range of big data platforms, including Hadoop. Tableau integrates with R, the BI statistical language that many data experts manipulate for progressive analytics [28]. There are different Tableau manners that have been introduced for linear and branching time point-based temporal logics [29]. One of the most practical functions in Tableau is predicting future data by applying exponential smoothing throughout the past statistics. It contains multiplicative and additive methods and enables highly precise results [30]. Its application was reported in the study of Anita S. Harsoor and Anushree Patil, who proposed sales forecasting for Walmart by using the Holt-Winters method in Tableau [30]. In order to forecast the future value of all subjects, this research will conduct the additive Holt-Winters method (LTS (A,A,A)) in the Tableau software.
Data envelopment analysis (DEA) is a decision-making support method that was first introduced in 1978 by Charnes, Cooper, and Rhodes [31], based on the fundamental theory of the nonparametric method for assessing the technical efficiency of Farrel [32], whose domain of inquiry is a group of decision-making units (DMUs) which can obtain multiple inputs and declare multiple outputs [33]. Over four decades, DEA was developed for various models and was utilized by a large number of worldwide researchers and scholars in multiple fields. Since the first Charnes, Cooper, and Rhodes (CCR) model was introduced, there have been many upgraded DEA models which shortened the limitations of previous models, such as the variable returns-to-scale Banker, Charnes, and Cooper (BBC) model (1984) [34], which improved the shortcomings of the constant returns to scale of the CCR model, the slacks-based measure (SBM) considering the change in proportion between the inputs and outputs, and directly dealing with the slacks gap (Tone, 2001) [35]. A highlighted case study confirmed the usefulness of the fuzzy analytic network process (FANP) and data envelopment analysis (DEA), which includes the CCR model, BCC model, and SBM model in order to rank and evaluate the suppliers in the rice supply chain, through the efforts of Wang, C.N et al. in 2018 [36]. DEA normally has two assessments of technical efficiency with different attributes: radial and nonradial [37]. To solve the issue related to radial and nonradial models concerning the proportionality between the input and output changes, the epsilon-based measure (EBM) model was invented in 2010 by K. Tone and M. Tsutsui [37], which has both radial and non-radial attributes in an undetermined structure. In 2018, Chia-Nan Wang, Jen-Der Day, and Thi-Kim-Lien Nguyen used the EBM model and gray forecasting to assess the efficiency of 10 third-party logistics providers [38]. Li Yang, Ke-Liang Wang, and Ji-Chao Geng assessed China’s regional ecological energy efficiency and energy saving and pollution abatement potentials with the exploited EBM model [39]. QiangChen et al. applied the EBM model for marketization and calculated the water resource utilization efficiency based on provincial panel data in China during the span of 2008–2013 [40].

2.2. Method of Research

2.2.1. Research Process

This research applied the additive Holt-Winters model to predict the future values of performance indicators in financial statements and the EBM model to estimate the performance of each DMU. The final analysis results show the efficiency and inefficiency of 10 packaging companies for every year during the period from 2012 to 2023. The process was divided into even stages, shown in Figure 2:
  • Stage 1: With the background knowledge about the packaging industry, the authors defined the importance of assessing the performance of packaging companies and identified the research objectives, target, and scope;
  • Stage 2: Based on the overview of the background of previous studies of the packaging industry and the LTS(A,A,A) and EBM methods, the authors found that the research topic was new and necessary. Hence, the researcher established the methodology of the study;
  • Stage 3: All suitable packaging companies were chosen from Vietstock [41] to meet the research target, and the models were designed after reviewing the theory of the additive Holt-Winters method and the EBM model. The study collected ten packaging companies;
  • Stage 4: Input and output factors were selected to assess the performance of packaging companies. If the input and output indicators were not appropriate, they would be replaced by other factors;
  • Stage 5: The study used the series of historical collected data to forecast the future values by using the additive Holt-Winters model. The results of the forecasting data would be examined by the mean absolute percent error (MAPE) indicator. If the MAPE index was accurate and appropriate, the next step would be applied, but if not, the data and factors would need to be retested;
  • Stage 6: Following the previous step, an epsilon-based measurement model in DEA would be conducted to measure the performance of 10 enterprises from 2012 to 2023. The Pearson’s coefficient would be tested to define the correlation among the input and output variables. According to the EBM model, the Pearson’s coefficient was adjusted and formulated by the values of affinity and diversity. The suitable index would need to be between 0 and +1;
  • Stage 7: The authors analyzed the performance and ranking of all DMUs from the past to the future. The recommendations for unproductive units to improve their effectiveness based on the EBM model results would be represented. Then, the empirical results and conclusions would be discussed.

2.2.2. Data Sources

There are many companies in the packaging industry, and each company has different sizes, technology, and target products. It is quite difficult to access all companies’ data when not all of them provide public financial reports. Firms that have negative values in their financial statements were also not selected for this study. This research aims to calculate the productivity performance of packaging industry companies in Vietnam. Therefore, the authors collected 10 packaging companies in Vietnam that were listed in Vietstock [41] from 2012 to 2019. The name of each DMU is shown in Table 1.
Finding the input and output factors plays an important role for applying DEA. One of the most beneficial features of DEA is allowing users to choose the variable inputs and outputs. However, these elements must correspond. Experiments on the pricing strategy in the European packaging industry were performed in 2017 by Niklas L.Hallberg, which revealed how asset specificity and routines impacted the pricing strategy and finally enterprise effectiveness [42]. In an economic value-added tree, according to Pohlen and Goldsby, performance indicators including the cost of goods sold, expenses, net profit, sales, fixed assets, and working capital were affected by supply chain activities [43]. Besides that, Roland T. Rust et al. highlighted that the cost determination focused on the efficiency of the operation’s processes [44].
Regarding the purpose of the research, this study selected input and output factors for 10 packaging companies during the period from 2012 to 2019 to estimate their performance as mentioned below.
Input variables:
The total assets (TA) was defined as the total amount of assets owned by a person, group, or operation.
The cost of goods sold (CGS) presented the direct costs attributable to the production of the goods sold in a company.
The operating expenses (OE), also called operating expenditures or opex, were the ongoing costs for running a product, business, or system.
Output variables:
The revenue (RE) was the income that a business had from its normal business activities, usually from the sale of goods and services to customers.
The gross profit (GP) was the profit that an operation made after subtracting the cost of goods sold from its revenue.

2.3. Mathematical Modeling

2.3.1. Additive Holt-Winters Method

The additive Holt-Winters method is one of the most favorable forecasting tools among the HW methods, in which the seasonal component is indicated in constant terms in the scale in the time series. The LTS(A,A,A) method has been widely adopted by researchers due to its ease of comprehension, moderate data storage conditions, and ability to be effortlessly automated [22]. This research will exploit the Tableau software to obtain the additive Holt-Winters prediction values for 10 packaging companies in Vietnam from 2020 to 2023, based on the historical data from 2012 to 2019.
Let us indicate that X 0 is the units of packaging enterprises, calculated by applying the primary time series T 1 , T t + 1 , , T t + n (with t = 0 , 1 , 2 , n ) and the evaluated prediction values P 1 , P t + 1 , , P t + n (with t = 0 , 1 , 2 , n ).
The sequence of examination for the primary time series and forecasting values begins at t = 0 as the first period. The standard formula for exponential smoothing is formulated by
P 0 = T 0 P 1 = α × T 1 + ( 1 α ) × P t 1 0 α 1
In the additive Holt-Winters method, the overall approach form is described as
P 1 = α × ( T t S t k ) + ( 1 α ) × ( P t 1 + R t 1 ) R t = β × ( P 1 P t 1 ) + ( 1 β ) × R t 1 S t = γ × ( T t P t ) + ( 1 γ ) × S t k
The forecasted value of the data elements T t is given by
T t = P t 1 + R t 1 + S t k
The prediction for the next period n is identified by
T t ( n ) = P t + n × R t + S t + n k
where α ,   β ,   and   γ correspond to the smoothing constants for the level of the series ( 0 α 1 , 0 β 1 , 0 γ 1 ) , k is the rate of occurrence span of the seasonality, T t is the particular value at the past time series t, P t is the approximate smoothing of the deseasonalized level at the termination of span t, R t is the approximate smoothing of the trend factor at the termination of span t, S t is the approximate smoothing of the seasonal factor at the termination of span t, n is the number of spans in the forecasting lead time, and t is the time indicator.
Actually, the gap between the predicted data value and the actual data value always remains. As proposed by Stekler [45,46], an ideal forecast can be sorted out through calculation of the root mean square errors (RMSEs) and mean absolute percentage errors (MAPEs). Both are the most favorable prediction estimation measures used [47,48]. The RMSE is the square root of the second sample moment of the differences between the forecasted and observed values [49] and is non-negative. The lower the RMSE, the better the regression model is. The RMSE and is defined by [50]
R M S E = 1 n t = 1 n ( P t T t ) 2
The mean absolute percent error (MAPE) is an index that is used to define the accuracy of the forecasting values. It gives an intuitive interpretation in terms of the relative error and can be commonly used in many cases [48,51]. It expresses the accuracy as a percentage. The MAPE indicator is interpreted as
M A P E = 100 n t = 1 n | T t P t T t |
where: T t is the actual value in time t and P t is the forecasted value in the time t.
The forecasting values estimated by the additive Holt-Winters method must be examined by the MAPE indicator. If the MAPE index is lower than 50%, it means the predicted value is appreciable. Conversely, if it is higher than 50%, it means the forecasting values have a lot of noise, and then another forecasting model can be retested. The MAPE index was divided into four categories as presented in Table 2.

2.3.2. An Epsilon-Based Measure (EBM) Model

An Epsilon-Based Measure of Efficiency

According to DEA, there are two different measurement types for technical efficiency: radial and nonradial. The radial measurement only focuses on the proportionate change of the input or output and ignores the appearance of slacks. In contrast, the nonradial measurement faces slacks directly and is not concerned with the proportion of inputs and outputs changing. As a result, both can lead to inappropriate evaluation in some cases. The epsilon-based measure (EBM) was invented as a solution for this shortcoming. The model combines both radial and nonradial features. Two parameters, one scalar and one vector, are contained in this framework, determined by affinity index with regards to the inputs and outputs. These two parameters are defined to integrate the radial and nonradial models into a unified model to assess the efficiency of DMUs.
By indicating the input-oriented EBM (EBM I-C) for D M U 0 = ( x 0 , y 0 ) , we then calculate it as
γ *   =   min θ , λ , s θ     ε x i = 1 s w i s i x i 0
This is subject to
θ x 0 X λ s = 0 Y λ y 0 , λ 0 , s 0
where the weight (relative importance) of input (i) is w i and i = 1 s w i = 1 ( w i 0 i ) and ε x is the parameter that integrates the radial θ and nonradial slacks terms.

Diversity Index and Affinity Index

Generally, in DEA, the Pearson’s correlation plays an essential role in clarifying the relationship between two variables. It translates the initial data to estimate the correlation. If the Pearson’s index is high, it means the two variables associate with each other. On the other side, if the correlation coefficient is low, it means the input and output relation is unappropriated. The value of the Pearson’s correlation coefficient ranges from −1 to +1.
In addition, the weight is also one of the most important factors in DEA. The weight determines how much the input will impact the output [52]. If the weight is close to 0, it shows that there is no change in the output even if the input changes. Nonpositive weights indicate the opposite relationship between the input and output, such that if the input grows, the output will decline.
Regarding the EBM model, the values of x and w i have a major impact on estimating the efficiency of DMUs. However, instead of using the Pearson’s correlation coefficient as another model, the EBM model will use the affinity index between two vectors.
Let a R + n and b R + n be two non-negative vectors with a dimension n. They display the examined values for a definite input component in n DMUs. S (a,b) is the affinity index between two vectors a and b with the following features:
S ( a , a ) = 1 ( a ) Identical
S ( a , b ) = S ( a , b ) Symmetric
S ( t a , b ) = S ( a , b ) / ( t > 0 ) Units-invariant
1 S ( a , b ) 0 / ( a , b )
Let us define
c j = ln b j a j   ( j = 1 , , n ) c ¯   =   1 n j = 1 n c j c m a x   =   m a x j { c j } ,   c m i n   =   m i n j { c j }
The diversity index of vectors (a,b) as the deviation of { c j } from the average c ¯ will be identified as follows:
D ( a , b )   =   j = 1 n | c j c ¯   | n ( c m a x c m i n ) = 0   i f   c m a x   =   c m i n And :   0 D ( a , b ) = D ( b , a ) 1 2
D ( a , b ) = 0 only if vector a and vector b are proportional.
If we denote the affinity index between vector a and vector b as S(a,b), then
S ( a , b ) = 1 2 D ( a , b )
If 1 S ( a , b ) 0 , S(a,b) is accomplished with properties (7) and (8).
In DEA, the Pearson’s correlation coefficient (P(a,b)) will be calculated by the following equation:
P ( a , b ) = j = 1 n ( a j a ¯ ) ( b j b ¯ ) j = 1 n ( a j a ¯ ) 2 ( b j b ¯ ) 2
where: a ¯ and b ¯ are the average of a j and b j , respectively.
However, in the EBM model, the affinity index will replace the Pearson’s correlation coefficient (P(a,b)). As mentioned above, the Pearson’s index range is 1 P ( a , b ) 1 . Thus, when analyzing the fundamental factor, there is no assurance for the principal vector only including positive components. Therefore, it will be adjusted to 0 P ( a , b ) 1 .

3. Results

3.1. Additive Holt-Winters Forecasting

3.1.1. Forecasting’s Results

In this section, through the data of 10 packaging companies from the period of 2012–2019 that were collected, the additive Holt-Winters additive model in Tableau will be applied to calculate the future data from 2020 to 2023. From the past data sequence, in applying the method, forecasting values for the inputs and outputs of all 10 DMUs from 2012 to 2023 are described in Table A1 and Table A2.

3.1.2. Forecasting Accuracy

According to the additive Holt-Winters forecasting model, there is a difference that exists between the predicted data value and the actual data value. In this research, the authors utilized the root mean square error (RMSE) and mean absolute percent error (MAPE) to calculate the accuracy of the forecasting values.
Table 3 illustrates the RMSE index per DMU. It can be seen from the table that all RMSE results were positive values and could be accepted.
As mentioned in Table 2, for the MAPE parameter, if the MAPE index was under 20%, it meant the accuracy of the forecasted value was highly appreciable. Table 4 identifies the average MAPE of each DMU.
It is apparent from Table 4, all DMUs had MAPE indexes under 36%, and their mutual average was 10.56%. As such, all DMU predicted values had good accuracy and were close to the actual values. Furthermore, all predicted values for all DMUs from 2020 to 2023 in Table A2 were non-negative values and acceptable to use in EBM analysis.

3.1.3. Smoothing Coefficients

According to the condition of smoothing coefficients in the additive Holt-Winters method, an acceptable α, β, γ index ranged from 0 to 1. The three smoothing constants were applied to forecast the future performance of packaging enterprises. The results of the alpha, beta and gamma that are shown in Table A3 confirmed our data were appreciable when their values were accounted for from 0 to 0.5.

3.2. Assessing the Performance of DMUs

In this part, the EBM-I-C (input-oriented under constant returns-to-scale assumption) in DEA will be applied to assess the efficiency of each packaging company, based on the historical data (2012–2019) in Table A1 and forecasted data (2020–2023) in Table A2 obtained from the additive Holt-Winters forecasting results. The efficiency of each year will be presented in Tables 8 and 9 below.
One of the biggest concerns before assessing the efficiency of the DMUs through EBM was defining whether the data value was positive. Besides that, the relation between the input and output data was isotonic. The correlation coefficient would be used to define the relationship among two variables, and it would be ranged from −1 to +1. If the index was near +1, it meant the two variables had a strong correlation. In contrast, if the correlation coefficient was close to −1, it meant the input and output correspondence was low. Table A4 presents the Pearson’s correlation coefficient of the DMUs for each year. As can be observed from the results, the correlation coefficient minimum was 0.6889. This means all the data variables were closely connected and acceptable to run EBM.
As stated in the EBM model, two parameters that combine the radial and nonradial models were established by an affinity index. The affinity index between two vectors was calculated to replace the Pearson’s correlation coefficient. Their appropriated values had to meet the requirement 0 P ( a , b ) 1 .
The diversity index of the vectors was determined as the deviation of variables and 0 ≤ D(a,b) = D(b,a) ≤ 1/2. It was only equal to 0 when the two vectors were proportional. Both the affinity and diversity indicators were utilized to assure that the correspondence of the input and output variables was suitable for evaluating the efficiency of the DMUs with EBM. It can be seen from Table 5 and Table 6 the data variables satisfied the condition of the EBM model.
The weight of the inputs and outputs and the epsilon indicator played an essential role in eliminating the EBM score for each DMU. A weight index defines the proportional effect the input will have on the output. Table 7 indicates that the entirety of the weight indexes were positive. In this case, this means that changing the input factors would have an impact on the outputs, and if the values of the input increased, the values of the output would grow.
The results of the epsilon for the EBM through the years in Table A5 satisfied the condition 0 ≤ epsilon index ≤ 1. The efficiencies of 10 packaging enterprises were obtained based on the factors of weight and epsilon for EBM. Table 8 and Table 9 indicate the efficiency scores for the DMUs from the past to the future.
In general, all the enterprises in the packaging industry had high productivity, while there was no company with an efficiency score below 0.681 in the observation time from 2012 to 2023. As reported by Table 8 and Table 9, there were five DMUs with efficiency scores increasing over time from the past to the future. Specifically, they were DMU1, DMU4, DMU5, and DMU9. In contrast, only DMU8 showed a downward trend compared with the first period; however, its efficiency index remained high. Other DMUs presented the fluctuation trend over the same time span. 
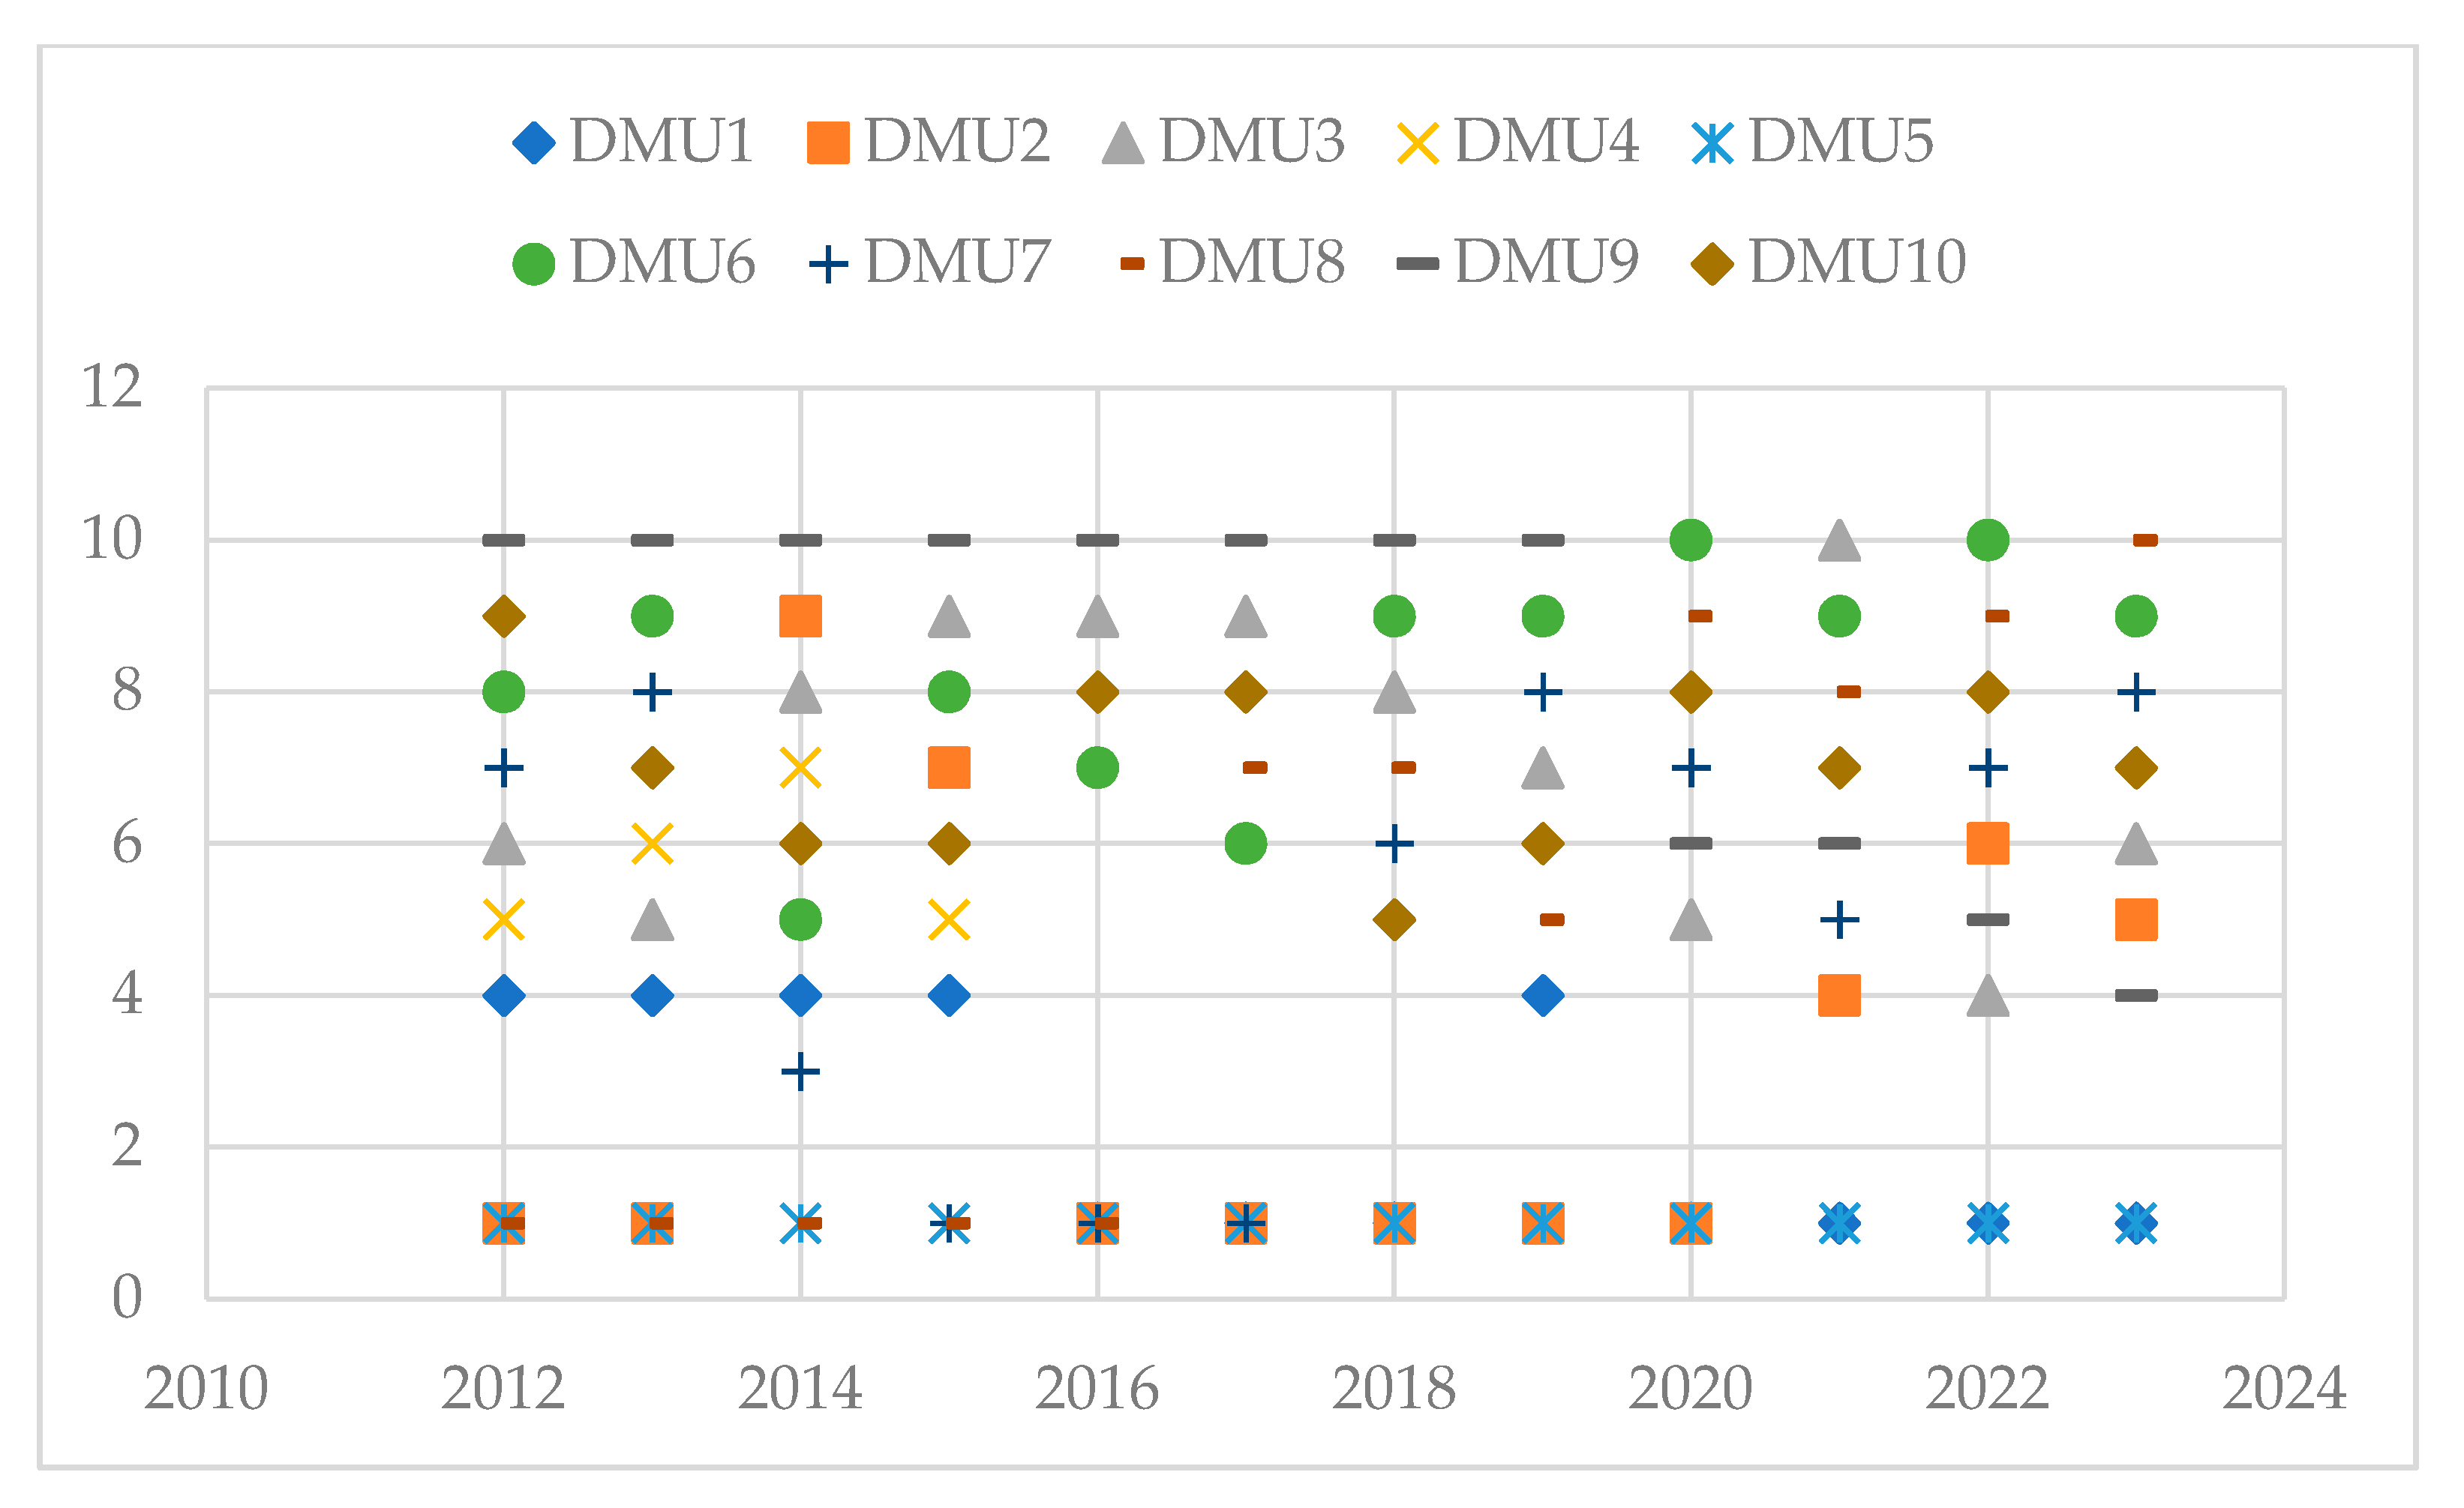
Figure 3 indicates the ranking positions of all companies from past to future (2012–2023).
Once a DMU gained the first ranking, that meant its theta index (θ) needed to be equal or closest to one, and all slacks for each variable needed to be the lowest and nearest to zero. Conversely, if the slack was high and the theta index was far from one, the DMU could not reach a high position. In the case where θ was higher than one, this meant the DMU was inefficient, and the values of the inputs needed to change accordingly to increase the efficiency and values of the outputs. Table A6 describes theta (θ) and slack (s) in the solution for each unit.
It is interesting to note that in the past data sequence, DMU6 was the most inefficient unit, even with high efficiency scores of 0.95611 (in 2014), 0.98359 (in 2016), and 0.97447 (in 2017) while compared with the efficient unit (score = 1). Particularly, DMU6 had the theta θ = {1.044; 1.064; 1.005} (>1) in 2014, 2016, and 2017, respectively. The input value, theta and slack (s1, s2, and s3) indicators of DMU6 in 2014 in Table A1 and Table A6 were picked as a sample for the ideal suggestion emphasized for the inefficient unit. All input indexes were multiplied by θ = 1.044 without the slack. Furthermore, the total assets was reduced by the slack s1 = 384,480. The estimated input for the total assets was 650,097 × 1.044 − 384,480 = 294,221.268. Calculated accordingly, the optimal cost of goods sold was 692,997 × 1.044 − 71,033.5 = 652,455.368, and 47,851 × 1.044 − 0 = 49,956.444 for the operating expenses. DMU6 was advised to reduce the amount of total assets from 650,097 to 294,221.268 and the cost of goods sold from 692,997 to 652,455.368 and increase the operating expenses from 47,851 to 49,956.444 to have better performance.
It is apparent from Table A6 that the incompetent DMUs in each period were different. Except for DMU6 mentioned above, DMU7 was unproductive in 2014, and so was DMU4 in 2015. In the future term, DMU2, 3, 8 and 10 were predicted to be inefficient. With a few exceptions, the years 2015, 2016, and 2017 illustrated that DMU7 got pretty good scores and rankings. In another year, DMU7 showed fluctuating results in its efficiency score, ranking around the fifth to eighth positions. DMU2 showed a high performance, but it was unstable. In 2012 and 2013, it had the highest rank at first with the score also being one. One year later, its position dropped significantly to ninth and seventh in 2014 and 2015. Between 2016 and 2010, it gained the first ranking with a score of one again. From 2021 to 2023, with its forecast value, it was predicted to fall to the fourth, sixth, and fifth positions, respectively. As can be seen from Table 8 and Table 9 and Figure 3, compared with the other DMUs, based on the efficiency score and ranked in the order of DMU3, DMU6, and DMU10, these three DMUs were determined to be the most ineffective enterprises. In the same period, three companies’ scores fluctuated below one, and their ranks stayed around the last positions. As opposed to the developing companies, DMU8 was the most efficient enterprise from the initial years. It obtained the first position with the highest point of one in the first five years (2012–2016). Nevertheless, they could not remain stable from 2017 to 2023. It was predicted to be in the last group of low efficiency, with DMU8 falling to the last two positions—the ninth and tenth ranking—in 2022 and 2023 with scores of 0.8986 and 0.9110, respectively. The projected input values that were recommended for each inefficient DMU would not be the same based on the efficiency score, theta, and slack index calculations. However, in general, following the estimated instructions as with DMU6, we can see the common solutions for these DMUs were lowering the input values’ total assets and operating expenses to improve the values of the outputs, including the revenue and gross profit.
Overall, DMU5 started with the highest score of one, and it ranked first in 2012 and continuously maintained the same the same level until 2023. Its theta was always equal to one and the slacks were zero. DMU5 was defined as the most efficient unit over time. Following that, DMU1 presented steady growth for the whole time. Its position was fourth from 2012 to 2015. One year after, it increased rapidly to be the first leader among the DMUs. In 2019, its position fell to the fourth ranking again with a score of 0.9365. Then, it reversed positions to first with the highest score for the next four years. DMU4 denoted a slight change in its score and position for the first four years, from 2012 to 2015. Noticeably, its beginning position was fifth with a score of 0.888 and ranked sixth, seventh, and fifth in 2013, 2014, and 2015, respectively. It was even mentioned that it was inefficient in 2015 based on the theta and slack indexes. However, starting from 2016, it climbed to the dominant position together with DMU5 with an efficiency score of one and a ranking of first.
DMU9’s score substantially grew within 12 years, but due to it having the lowest score (0.6807) from the beginning, it still held the last ranking (tenth) among ten packaging companies between the year 2012 and 2019. Their position only changed from sixth to fourth, with a score from 0.9312 to 0.9663 from 2020 to 2023, respectively.

3.3. Discussion

The development potential of the packaging industry is expanding. However, Vietnamese packaging companies are facing a lot of pressure and great competition from many FDI enterprises. Specifically, following the global packaging trends combined with high technology and eco-friendly practices together with the COVID-19 pandemic, packaging enterprises need to deal with changes in consumer behavior. When customers turn to attain their fundamental priorities, which are food, shelter, water, and healthcare and pharmaceutical products, they are not focused on luxury order desires [53]. In terms of the packaging materials, packaging companies all faced common difficulties under the impact of the crisis, such as breaking the supply chain in business, difficulty in approaching new customers, and not being able to implement a sales plan. However, packaging businesses also have many opportunities such as Vietnam’s e-commerce scale, which will continue to grow [54]. Under the EU–Vietnam Free Trade Agreement (EVFTA), the import tax on Vietnam’s plastic bags into the EU market will be removed, creating a significant competitive advantage for the packaging industry [55].
To have a deeper understanding not only of the investment and cooperation opportunities, but also the performance effectiveness of each firm in the packaging industry in Vietnam, based on the historical financial statements of 10 determined packaging companies from 2012 to 2019, this research evaluated the developing trends from the past, present, and future of all units by integrating the additive Holt-Winters model and epsilon-based measurement (EBM) of DEA. Throughout the analysis, manufacturer managers can find the most suitable company to collaborate with to sustain their business strategy and catch up with global trends. According to the empirical results, generally, all packaging companies had productivity from medium to high. DMU1, DMU4, and DMU5 were evaluated as the three most efficient units and ideal suppliers which reached the first rank and remained at it over time. In contrast, DMU3, DMU6, and DMU8 presented fluctuations and a downward trend and kept the last positions. Formulated on the calculation of feasible solutions of EBM, the inefficient and unstable units could change the input value for better performance of the output value. Besides that, they should have policies to improve their competitiveness in quality, reduce waste in the production process, attach value to maintaining long-term relationships with large customers, strengthen after-sales and customer care services, adjust the selling prices reasonably while ensuring profit, and finally invest in technical machinery and equipment to meet the strict requirements from the market.
This section may be divided by subheadings. It should provide a concise and precise description of the experimental results, their interpretation, as well as the experimental conclusions that can be drawn.

4. Conclusions

The packaging industry has an important role in a developing economy, especially in Vietnam, where the demand for producing products is increasing day by day, leading to an increase in the need for packaging. Packaging’s values are not only protecting products, but also its role as a sales and marketing tool. Along with the Fourth Industrial Revolution and high customer requirements, packaging companies are under pressure to deal with challenges to improve their core competencies through technology and associated services as suppliers. However, to adapt with the growth trends, which are being fast, flexible, convenient, good, cheap, and environmentally friendly, changing technology will be a big task for companies when it requires strong capital ability. With uncertain circumstances, financial forecasting and performance evaluation are necessary for packaging companies.
This research aimed to construct the efficiency and developing trends of 10 packaging operations from the past to the future by integrating the additive Holt-Winters model, an extended variation of Holt’s exponential smoothing that captures seasonality in Tableau and the EBM of DEA. Based on the collected original data from 2012 to 2019 for the packaging companies, the LTS(A,A,A) approach was employed to forecast the value of the data for the next four years (2019–2023), with the chosen inputs and outputs being total assets, cost of goods sold, operating expenses, revenues, and gross profit. The mean absolute percent error (MAPE) estimated the accuracy of the forecasting values. With the MAPE under 10.56%, the predicted data value in this research had good accuracy. Subsequently, the EBM model was applied to assess the decision-making unit (DMU) productivity by giving efficiency scores with rankings and then providing suggestions through the calculation of the theta and slack indexes for incompetent companies in order to improve their performance. The empirical results will first assist packaging company’s managers in defining their positions in the market and making long-term sustainable advancement decisions. Secondly, it will be valuable support for investors and manufacturers for choosing the best supplier for their business and making investment decisions. This finding also validates the usefulness of the Holt-Winters forecasting model and epsilon-based measure of efficiency (EBM) in data envelopment analysis (DEA), as the model can measure the performance of a decision-making unit (DMU) and contribute solutions for companies over the observation period, specifically for cases in the packaging industry. These frameworks’ combination can be adopted in multiple fields and different projects.
Although the research was successful, some limitations still remain. Since a company’s strategic decision-making process and performance can be defined and affected by diversified variations, including internal and external factors not be presented in a financial statement such as human resources and environmental factors, the study estimated the efficiency of packaging companies based on input and output indicators in financial reports. Accordingly, future investigations can address greater clarity on the links between other factors and their effects on the performance of the industry. The research models that were applied in this study are not the only methods for predicting and assessing the productivity of decision-making units. Future research can employ other frameworks and models to achieve their objectives and have a comparative measurement. Besides that, because many firms have not published their financial reports, the sample size was limited and less comparative. Hence, future studies can expand the research target and scope in other regions and other industries.

Author Contributions

C.-N.W. directed the research, offered analysis software, and edited the content; T.-K.-L.N. designed the research structure, reviewed the content, and guided the method; Q.-N.H. collected data, analyzed the empirical results, and wrote the paper. All authors contributed to issuing the final result. All authors have read and agreed to the published version of the manuscript.

Funding

This research was partly supported by the National Kaohsiung University of Science and Technology and MOST 109-2622-E-992-026 from the Ministry of Sciences and Technology in Taiwan.

Institutional Review Board Statement

Not applicable.

Informed Consent Statement

Not applicable.

Data Availability Statement

Not applicable.

Acknowledgments

The authors would like to express their gratitude to the National Kaohsiung University of Science and Technology’s Ministry of Sciences and Technology in Taiwan.

Conflicts of Interest

The authors declare no conflict of interest.

Appendix A

Table A1. Historical data of all DMUs from 2012 to 2019.
DMUsTACGSOEREGPTACGSOEREGP
20122013
1225,416340,33138,933416,94376,612274,489464,00240,906560,70096,698
2668,8901,395,76154,1141,492,42096,6591,056,5491,380,54874,3961,502,907122,358
3160,851259,66026,390298,98939,329158,167263,52037,208311,87148,350
4549,662728,95865,569851,749122,791610,872854,39381,8181,003,373148,980
552,86194,1349817124,17830,04474,832108,1538925143,96635,813
6613,666575,39952,258607,37731,978659,919639,47648,231697,93158,455
785,926112,17319,925139,76227,589117,109153,83223,847187,19833,367
885,821195,90016,682224,14628,24698,168199,94416,068228,83728,892
9130,54161,722814963,9342212135,05189,090792393,1984107
1075,97063,32910,80174,10610,77790,478121,72711,578142,96121,233
20142015
1341,105519,13150,759627,524108,392397,805629,96258,670762,977133,015
21,178,5601,349,670124,8231,514,504164,834813,7811,199,197127,9301,392,908193,711
3154,407195,16323,177227,82332,660128,275185,38925,771213,09627,707
4669,385975,75485,3331,130,701154,947758,7951,170,06493,1321,341,383171,319
5114,886115,15711,523154,67039,513153,226152,15018,119219,30767,156
6650,097692,99747,851741,82448,827534,730658,10953,171707,01648,907
7109,409190,70226,730228,45537,752124,503253,21629,901294,83241,616
899,367220,42816,878250,70030,272130,624247,71420,324283,42935,715
9147,89596,7698907107,44510,676149,944102,96213,251123,15420,193
1094,615133,41812,483156,91323,49685,418120,65714,001144,47723,820
20162017
1491,379714,85182,110882,745167,894554,368804,22279,506978,153173,931
2925,7231,176,36490,5541,405,264228,9011,089,3531,300,81283,6631,459,899159,087
3125,184146,85726,553179,51132,654136,676155,66429,137194,25438,590
4749,9801,199,77495,7521,381,740181,966936,9621,370,666107,4161,554,386183,719
5164,648119,49016,115167,65248,161199,119140,99718,421196,15155,153
6599,823649,99842,523702,10752,109643,818674,06441,945735,33761,273
7142,893245,13828,506286,39441,255196,875347,34035,998396,11148,770
8156,247263,11524,429303,36940,255196,681277,14227,955324,82947,688
9157,994104,98812,415125,97520,987158,356104,12813,035122,35218,224
10116,449125,83717,292153,29927,461121,774159,48518,877186,92727,442
20182019
1653,755976,24994,5111,164,601188,352792,4151,073,852135,0161,309,529235,677
21,247,8921,566,78390,3601,704,119137,3371,348,7801,536,620101,1031,763,523226,903
3154,904168,33924,290204,13535,796184,592176,27827,793216,42040,142
4922,9251,594,683113,0931,780,171185,488904,4961,404,516112,3491,703,555299,039
5218,140149,61717,891194,42144,804227,599143,19722,743195,52352,326
6662,377645,76353,968713,68567,922666,365710,31757,558781,06170,744
7237,719396,92040,416447,93251,012219,920312,03738,074356,25544,218
8212,062292,09733,075340,09447,998214,670314,91333,194364,96450,052
9177,527124,19113,163143,49219,301168,725140,75916,597166,93826,179
10135,686204,77020,944236,60331,833138,740196,86720,361223,73826,870
Table A2. Forecasting data of all DMUs from 2020 to 2023.
20202021
DMUTACGSOEREGPTACGSOEREGP
DMU1850,0401,196,789138,2201,440,914245,096950,1261,281,480147,7321,558,944267,450
DMU21,374,3611,597,270105,6221,823,640204,7821,368,1051,554,814117,3171,821,797232,070
DMU3175,830129,14619,810168,18932,505188,005126,18926,516167,26734,539
DMU4996,2511,637,435118,6931,876,436260,1571,066,0831,780,077129,8272,038,766288,901
DMU5261,082156,04222,871204,31648,378288,472181,49625,529246,52865,084
DMU6680,308706,04454,344780,79665,853645,751720,63954,991808,66978,104
DMU7251,207405,41241,817458,54353,231274,346453,01444,925510,81257,963
DMU8241,088331,93437,875384,13054,348262,890347,64338,781406,66857,687
DMU9181,861135,86316,041164,52629,677184,060150,65017,949184,69435,383
DMU10153,283207,35623,097239,49535,705155,938226,24224,245263,36334,249
20222023
DMU11,007,7511,404,417163,1681,690,329286,8821,007,7511,489,108172,6801,808,358309,237
DMU21,484,1751,651,786116,1151,902,359228,9861,477,9201,609,330127,8091,900,516256,274
DMU3179,24399,38617,891136,47230,548191,41896,42924,597135,54932,582
DMU41,096,4421,838,949129,9232,110,224295,6161,166,2741,981,591141,0572,272,553324,360
DMU5308,559171,02526,133224,61653,591335,949196,47828,791266,82870,297
DMU6689,501729,57856,184812,36971,837654,944744,17356,830840,24284,088
DMU7293,641470,26946,726528,80658,764316,780517,87149,834581,07663,496
DMU8281,545365,74643,462426,14361,167303,347382,35544,367448,68064,505
DMU9193,144150,89918,021185,43936,204195,343165,68619,929205,60741,910
DMU10171,279235,55826,251271,35840,154173,935254,47527,399295,22638,698
Table A3. Forecasting parameters of all DMUs from 2020 to 2023.
DMUTACGSOEREGP
αβγαβγαβγAβγαβγ
DMU100.5000.10.500.5000.10.50000.5
DMU90.20.500.20.500.10.500.10.5000.20
DMU80.5000.500.10.500.50.500.20.500
DMU70.5000.10.500.20.400.10.5000.50
DMU60.1000000.3000000.10.50
DMU50.20.4000.500.10.50000000
DMU40.10.500.10.500.10.500.20.400.200.1
DMU30.500.50000000.5000.100
DMU20.10.500.500.20000.500.400.10
DMU10.500.50.500.50.500.10.500.50.500
Table A4. Pearson’s correlation coefficient from 2012 to 2020.
TACGSOEREGPTACGSOEREGP
Year20122013
TA10.89950.92140.89830.688910.97650.86820.96820.7643
COGS0.899510.82030.99840.76350.976510.91080.99860.8525
OPEX0.92140.820310.83890.85640.86820.910810.92670.9441
REV0.89830.99840.838910.79830.96820.99860.926710.8792
GP0.68890.76350.85640.798310.76430.85250.94410.87921
Year20142015
TA10.97950.95720.97160.840310.98520.95840.98090.8849
COGS0.979510.98610.99890.91750.985210.97420.99860.9208
OPEX0.95720.986110.98960.94450.95840.974210.97750.9317
REV0.97160.99890.989610.93490.98090.99860.977510.9400
GP0.84030.91750.94450.934910.88490.92080.93170.94001
Year20162017
TA10.97190.90230.96870.889610.97580.89010.97010.8555
COGS0.971910.96140.99830.92610.975810.96150.99890.9163
OPEX0.90230.961410.97100.96410.89010.961510.97090.9696
REV0.96870.99830.971010.94630.97010.99890.970910.9342
GP0.88960.92610.96410.946310.85550.91630.96960.93421
Year20182019
TA10.95870.88240.95220.805810.97170.85620.96190.8640
COGS0.958710.95990.99900.89720.971710.91870.99860.9431
OPEX0.88240.959910.97010.97160.85620.918710.93070.9491
REV0.95220.99900.970110.91610.96190.99860.930710.9595
GP0.80580.89720.97160.916110.86400.94310.94910.95951
Year20202021
TA10.96240.87290.95990.871010.95960.91410.96340.9185
COGS0.962410.93670.99930.94840.959610.94970.99910.9629
OPEX0.87290.936710.94720.97890.91410.949710.95970.9811
REV0.95990.99930.947210.95880.96340.99910.959710.9716
GP0.87100.94840.97890.958810.91850.96290.98110.97161
Year20222023
TA10.95430.87960.95400.889210.94750.89510.95180.9145
COGS0.954310.93650.99940.95980.947510.94590.99920.9689
OPEX0.87960.936510.94650.97610.89510.945910.95620.9782
REV0.95400.99940.946510.96850.95180.99920.956210.9769
GP0.88920.95980.97610.968510.91450.96890.97820.97691
Table A5. Epsilon for the EBM in each year.
Year201220132014201520162017201820192020202120222023
Epsilon Indicator0.434750.354580.38850.458290.538210.499270.523710.454060.561510.570040.573880.52865
Table A6. Theta and slack(s) index of inputs for all DMUs.
θs1s2s3θs1s2s3θs1s2s3
DMUs TACGSOP TACGSOP TACGSOP
201220132014
DMU10.92931,857.303195.40.976003041.670.995006376.4
DMU2100010000.87961674.200
DMU30.88013,990.3000.9500014,933.20.922004962.6
DMU40.924141,796000.88217,388.909979.640.94500717.87
DMU5100010001000
DMU60.833250,021000.859176,739001.044384,48071,033.50
DMU70.94521,662.307770.20.9149755.52010,195.41.067012,693.512,587
DMU8100010001000
DMU90.78575,288.101344.40.78657,690.60448.8290.87260,551.900
DMU100.88735,843.903722.60.8825517.8401352.410.95300749.08
201520162017
DMU1100503.3710001000
DMU20.9380014,57510001000
DMU30.922007567.80.99023,990.909586.4119019.53012,853
DMU41.034163,59240128010001000
DMU5100010001000
DMU60.953184,021958001.064175,678103,83501.00598,118.221,995.20
DMU7100010001000
DMU8100010000.9645435.880536.3
DMU90.83038,3830821.22173,793.204178.290.86320,932.300
DMU100.953002306124,775.604807.430.96411,407.202997.1
201820192020
DMU11000157,216.4045,477.81000
DMU2100010001000
DMU3117,62207283.9154,888.6012,3431.05145,456.503759.5
DMU4100010001000
DMU5100010001000
DMU60.990285,76208089.80.907189,4080669.8230.965241,96503054.2
DMU712253.92010,6300.94117,857.2012,343.90.9874486.41012,268
DMU80.97616,061.504681.90.95511,340.607647.541.00536,412.6012,651
DMU90.96991393.401104.20.9787634405219.010.99463710.100
DMU1017665.2703713.50.93711,205.904322.70.99220,175.105160.4
202120222023
DMU1100010001000
DMU21.023446,99904009.51.009508,6488349.401.030546,525013,645
DMU31.06154,696.9013,9541.06626,314.503772.21.06657,073.2012,006
DMU4100010001000
DMU5100010001000
DMU60.980209,83002383.20.970246,95304501.220.985213,60203797.4
DMU70.9852990.18011,7010.98012,985.1013,230.10.97811,725.8012,690
DMU81.02155,483.7013,6861.01059,100.6015,9191.02178,770.5016,905
DMU91.00239,098.6032200.99314,513000.99711,595.102335.1
DMU101.01620,77707871.20.99123,287.306794.241.01224,44309392.2

References

  1. Imiru, G.A. The Effect of Packaging Attributes on Consumer Buying Decision Behavior in Major Commercial Cities in Ethiopia. Int. J. Mark. Stud. 2017, 9, 43–54. [Google Scholar] [CrossRef] [Green Version]
  2. Tiem Nang Cua Nganh Cong Nghiep Bao Bi Viet Nam. Available online: https://hhbb.vn/xu-huong-bao-bi/tiem-nang-cua-nganh-cong-nghiep-bao-bi-viet-nam-54.html (accessed on 20 July 2020).
  3. Vietnam Economic News. Packaging Industry Ahead of Good Opportunities. Available online: http://ven.vn/packaging-industry-ahead-of-good-opportunities-20720.html (accessed on 20 July 2020).
  4. VN’s Processing and Packaging Industry: Many Encouraging Signals. Available online: http://news.gov.vn/Home/VNs-processing-and-packaging-industry-Many-encouraging-signals/201910/37847.vgp (accessed on 31 August 2020).
  5. Mordor Intelligence. Vietnam Food Service Market—Growth, Trends, Covid-19 Impact, and Forecasts (2021–2026). Available online: https://www.mordorintelligence.com/industry-reports/Vietnam-Food-Service-Market (accessed on 20 February 2020).
  6. Viet Nam La Thi Truong Duoc Pham Lon Thu 2 Dong Nam A. Available online: https://vietnamnet.vn/vn/suc-khoe/viet-nam-la-thi-truong-duoc-pham-lon-thu-2-dong-nam-a-603838.html (accessed on 20 February 2020).
  7. Thongke. Available online: http://thongke.idea.gov.vn/ (accessed on 28 September 2020).
  8. Zheng, J.; Suh, S. Strategies to reduce the global carbon footprint of plastics. Nat. Clim. Chang. 2019, 9, 374–378. [Google Scholar] [CrossRef]
  9. National Geographic. Fast Facts About Plastic Pollution. Available online: https://www.nationalgeographic.com/ (accessed on 10 January 2021).
  10. Top 10 Cong Ty Bao Bi Uy Tin 2020. Available online: https://vietnamnet.vn/vn/kinh-doanh/vef/top-10-cong-ty-bao-bi-uy-tin-nam-2020-677358.html (accessed on 16 October 2020).
  11. Giam Thieu Su Dung Giay De Bao Ve Moi Truong. Available online: http://nioeh.org.vn/tin-tuc/giam-thieu-su-dung-giay-de-bao-ve-moi-truong (accessed on 20 October 2020).
  12. Realini, C.E.; Marcos, B. Active and intelligent packaging systems for a modern society. Meat Sci. 2014, 98, 404–419. [Google Scholar] [CrossRef] [PubMed] [Green Version]
  13. Epstein, M.J.; Roy, M.J. Sustainability in Action: Identifying and Measuring the Key Performance Drivers. Long Range Plan. 2001, 34, 585–604. [Google Scholar] [CrossRef]
  14. Trungtamwto. Available online: https://trungtamwto.vn/upload/files/wto/7-/25-van-kien/Tai-lieu-cam-ket-ve-dich-vu-khi-gia-nhap-wto-binh-luan-cua-nguoi-trong-cuoc-pdf.pdf (accessed on 20 October 2020).
  15. Papadakis, V.; Lioukas, S.; Chambers, D. Strategic decision-making processes: The role of management and context. Strateg. Manag. J. 1998, 19, 115–147. [Google Scholar] [CrossRef]
  16. Wang, Z.; Mathiyazhagan, K.; Xu, L.; Diabat, A. A decision making trial and evaluation laboratory approach to analyze the barriers to Green Supply Chain Management adoption in a food packaging company. J. Clean. Prod. 2016, 117, 19–28. [Google Scholar] [CrossRef]
  17. Design Audit Series Wine. Available online: https://labelprintingportland.com (accessed on 22 October 2020).
  18. Cheung, W.M.; Leong, J.T.; Vichare, P. Incorporating lean thinking and life cycle assessment to reduce environmental impact of plastic injection moulded products. J. Clean. Prod. 2017, 167, 759–775. [Google Scholar] [CrossRef]
  19. Schaefer, D.; Cheung, W.M. Smart Packaging: Opportunities and Challenges. Procedia CIRP 2018, 72, 1022–1027. [Google Scholar] [CrossRef]
  20. White, G.R.T.; Wang, X.J.; Li, D. Inter-organisational green packaging design: A case study of influencing factors and constraints in the automotive supply chain. Int. J. Prod. Res. 2015, 53, 6551–6566. [Google Scholar] [CrossRef]
  21. Holt, C.C. Forecasting seasonals and trends by exponentially weighted moving averages. Int. J. Forecast. 2004, 20, 5–10. [Google Scholar] [CrossRef]
  22. Goodwin, P. The Holt-Winters Approach to Exponential Smoothing: 50 Years Old and Going Strong. Foresight 2010, 19, 30–33. [Google Scholar]
  23. Hyndman, R.J.; Athanasopoulos, G. Forecasting: Principles and Practice, 1st ed.; Otexts: Melbourne, Australia, 2013. [Google Scholar]
  24. Valakevicius, E.; Brazenas, M. Application of the Seasonal Holt-Winters Model to Study Exchange Rate Volatility. Inžinerinė Ekonomika 2015, 26, 384–390. [Google Scholar]
  25. Sugiarto, V.C.; Sarn, R.; Sunaryono, D. Sales forecasting using Holt-Winters in Enterprise Resource Planning at sales and distribution module. In Proceedings of the 2016 International Conference on Information & Communication Technology and Systems (ICTS), Surabaya, Indonesia, 12 October 2016; pp. 8–13. [Google Scholar]
  26. Szmit, M.; Szmit, A. Usage of Modified Holt-Winters Method in the Anomaly Detection of Network Traffic: Case Studies. J. Comput. Netw. Commun. 2012, 2012, 192913. [Google Scholar] [CrossRef] [Green Version]
  27. Tableau. Available online: https://www.tableau.com/why-tableau/what-is-tableau (accessed on 21 February 2020).
  28. Jena, B. An Approach for Forecast Prediction in Data Analytics Field by Tableau Software. IJIEEB Int. J. Inf. Eng. Electron. Bus. 2019, 11, 19–26. [Google Scholar] [CrossRef] [Green Version]
  29. Goranko, V.; Montanari, A.; Sala, P.; Sciavicco, G. A general tableau method for propositional interval temporal logics: Theory and implementation. J. Appl. Log. 2006, 4, 305–330. [Google Scholar] [CrossRef] [Green Version]
  30. Harsoor, A.S.; Patil, A.; Tech, M. Forecast of sales of Walmart store using big data applications. Int. J. Res. Eng Technol. 2015, 4, 51–59. [Google Scholar]
  31. Charnes, A.A.; Cooper, W.W.; Rhodes, E. Measuring the efficiency of decision-making units. Eur. J. Oper. Res. 1978, 2, 429–444. [Google Scholar] [CrossRef]
  32. Farrell, M.J. The measurement of productivity efficiency. J. R. Stat. Soc. 1957, 120, 449–513. [Google Scholar]
  33. Wang, C.N.; Lin, H.S.; Hsu, H.P.; Le, V.T.; Lin, T.F. Applying Data Envelopment Analysis and Grey Model for the Productivity Evaluation of Vietnamese Agroforestry Industry. Sustainability 2016, 8, 1139. [Google Scholar] [CrossRef] [Green Version]
  34. Banker, R.D.; Charnes, A.; Cooper, W.W. Some models for estimating technical and scale inefficiencies in data envelopment analysis. Manag. Sci. 1984, 30, 1078–1092. [Google Scholar] [CrossRef] [Green Version]
  35. Tone, K. A slacks-based measure of efficiency in data envelopment analysis. Eur. J. Oper. Res. 2001, 130, 498–509. [Google Scholar] [CrossRef] [Green Version]
  36. Wang, C.N.; Nguyen, V.T.; Duong, D.H.; Do, H.T. A Hybrid Fuzzy Analytic Network Process (FANP) and Data Envelopment Analysis (DEA). Approach for Supplier Evaluation and Selection in the Rice Supply Chain. Symmetry 2018, 10, 221. [Google Scholar] [CrossRef] [Green Version]
  37. Tone, K.; Tsutsui, M. An epsilon-based measure of efficiency in DEA—A third pole of technical efficiency. Eur. J. Oper. Res. 2010, 207, 1554–1563. [Google Scholar] [CrossRef]
  38. Wang, C.N.; Day, J.D.; Nguyen, T.K.L. Applying EBM Model and Grey Forecasting to Assess Efficiency of Third-Party Logistics Providers. J. Adv. Transp. 2018, 2018, 1212873. [Google Scholar] [CrossRef]
  39. Yang, L.; Wang, K.L.; Geng, J.C. China’s regional ecological energy efficiency and energy saving and pollution abatement potentials: An empirical analysis using epsilon-based measure model. J. Clean. Prod. 2018, 194, 300–308. [Google Scholar] [CrossRef]
  40. Chen, Q.; Ai, H.; Zhang, Y.; Hou, J. Marketization and water resource utilization efficiency in China. Sustain. Comput. Inform. Syst. 2019, 22, 32–43. [Google Scholar] [CrossRef]
  41. Vietstock. Available online: http://en.vietstock.vn/ (accessed on 8 July 2020).
  42. Hallberg, N.L. The micro-foundations of pricing strategy in industrial markets: A case study in the European packaging industry. J. Bus. Res. 2017, 76, 179–188. [Google Scholar] [CrossRef]
  43. Pohlen, T.L.; Goldsby, T.J. VMI and SMI programs. How economic value added can help sell the change. Int. J. Phys. Distrib. Logist. Manag. 2003, 33, 565–581. [Google Scholar] [CrossRef]
  44. Rust, R.T.; Moorman, C.; Dickson, P.R. Getting Return on Quality: Revenue Expansion, Cost Reduction, or Both? J. Mark. 2002, 66, 7–24. [Google Scholar] [CrossRef]
  45. Stekler, H.O. Macroeconomic forecast evaluation techniques. Int. J. Forecast. 1991, 7, 375–384. [Google Scholar] [CrossRef]
  46. Stekler, H.O. Are economic forecasts valuable? J. Forecast. 1994, 13, 495–505. [Google Scholar] [CrossRef]
  47. Mohammed, E.A.; Naugler, C. Open-source Software for Demand Forecasting of Clinical Laboratory Test Volumes Using Time-series Analysis. J. Pathol. Inform. 2017, 8, 7. [Google Scholar]
  48. Wang, C.N.; Day, J.D.; Nguyen, T.K.L.; Luu, Q.C. Integrating the Additive Seasonal Model and Super-SBM Model to Compute the Efficiency of Port Logistics Companies in Vietnam. Sustainability 2018, 10, 2782. [Google Scholar] [CrossRef] [Green Version]
  49. Arum, K.C.; Ugwu, C.L.J.; Ugwuowo, F.I.; Oranye, H.E.; Agu, P.I. Time Series Model Comparative Approaches in Analyzing Accident and Emergency Departmental Demand in Eastern Nigeria. Afr. J. Math. Stat. Stud. 2020, 3, 55–62. [Google Scholar]
  50. Hussain, A.; Rahman, M.; Memon, J.A. Forecasting electricity consumption in Pakistan: The way forward. Energy Policy 2016, 90, 73–80. [Google Scholar] [CrossRef]
  51. Hansun, S.; Charles, V.; Indrati, C.R.; Subanar, S.S. Revisiting the Holt-Winters’ Additive Method for Better Forecasting. Int. J. Enterp. Inf. Syst. 2019, 15, 43–57. [Google Scholar] [CrossRef]
  52. Wei, C.-K.; Chen, L.-C.; Li, R.-K.; Tsai, C.-H.; Huang, H.-L. A study of optimal weights of Data Envelopment Analysis—Development of a context-dependent DEA-R model. Expert Syst. Appl. 2012, 39, 4599–4608. [Google Scholar] [CrossRef]
  53. Loxton, M.; Truskett, R.; Scarf, B.; Sindone, L.; Baldry, G.; Zhao, Y. Consumer Behaviour during Crises: Preliminary Research on How Coronavirus Has Manifested Consumer Panic Buying, Herd Mentality, Changing Discretionary Spending and the Role of the Media in Influencing Behaviour. J. Risk Financ. Manag. 2020, 13, 166. [Google Scholar] [CrossRef]
  54. Statistic. Available online: https://0-www-statista-com.brum.beds.ac.uk/outlook/243/127/ecommerce/Vietnam (accessed on 14 December 2020).
  55. EU-Vietnam Free Trade Agreement. Available online: http://evfta.moit.gov.vn/?page=overview&category_id=45745512-6ea1-4740-bcba-15c09e3d994c (accessed on 14 December 2020).
Figure 1. Import levels of some input materials for packaging production in Vietnam in 2010–2019 (Source: thongke.idea.gov.vn [7]).
Axioms 10 00033 g001
Figure 2. Research framework.
Axioms 10 00033 g002
Figure 3. Ranking positions of the DMUs.
Axioms 10 00033 g003
Table 1. List of packaging companies.
DMUsCompany NameHeadquarters
DMU1Agriculture Printing & Packing Joint Stock CompanyHanoi, Vietnam
DMU2Tan Tien Plastic Packaging JSCHo Chi Minh City, Vietnam
DMU3Sai Gon Packaging Joint Stock CompanyHo Chi Minh City, Vietnam
DMU4Bien Hoa Packaging CompanyDong Nai Province, Vietnam
DMU5SIVICO JSCHai Phong City, Vietnam
DMU6Tan Dai Hung Plastic Joint Stock CompanyHo Chi Minh City, Vietnam
DMU7Dam Phu My Packaging Joint Stock CompanyVung Tau City, Vietnam
DMU8Dong A Joint Stock CompanyKhanh Hoa Province, Vietnam
DMU9Do Thanh Technology CorporationHo Chi Minh City, Vietnam
DMU10PetroVietnam Packaging JSCBac Lieu City, Vietnam
Source: Vietstock.vn [41].
Table 2. The parameters of the mean absolute percent error (MAPE).
MAPE ValueRanking
MAPE < 10%Excellent
10% < MAPE < 20%Good
20% < MAPE < 50%Reasonable
MAPE > 50%Poor
Table 3. Root mean square error of the decision-making units (DMUs).
DMUTACOGSOERVGP
DMU10929922,475114224,2313622
DMU945839399118310,8823641
DMU815,8128755224210,4642786
DMU723,76042,656253345,9923609
DMU648,67728,471597430,0897180
DMU513,99612,353183318,9768786
DMU449,316107,923470593,50431,286
DMU319,96425,163306629,9946167
DMU2176,835139,67324,194114,02436,453
DMU142,93053,10913,69361,80613,769
Table 4. The average MAPEs of the DMUs.
DMUTACGSOEREGP
DMU108.30%16.90%7.40%16.20%14.80%
DMU92.40%8.10%9.30%7.80%36.00%
DMU811.20%3.20%9.80%3.20%6.60%
DMU715.60%15.50%7.70%13.90%6.90%
DMU66.80%3.40%10.90%3.40%11.90%
DMU512.00%7.90%10.90%8.30%14.70%
DMU45.90%7.50%4.10%6.10%13.60%
DMU312.10%13.10%9.50%12.10%14.50%
DMU217.10%9.40%15.60%6.60%18.30%
DMU19.20%8.00%15.80%8.10%10.20%
Average10.56%
Table 5. Affinity index.
TACGSOETACGSOE
Year20122013
TA10.561830.5058510.694660.54117
COGS0.5618310.625920.6946610.69653
OPEX0.505850.6259210.541170.696531
Year20142015
TA10.583070.5810610.589160.64542
COGS0.5830710.668940.5891610.3793
OPEX0.581060.6689410.645420.37931
Year20162017
TA10.460810.4181510.514810.43663
COGS0.4608110.505030.5148110.54862
OPEX0.418150.5050310.436630.548621
Year20182019
TA10.438080.3685110.490530.58637
COGS0.4380810.610530.4905310.55946
OPEX0.368510.6105310.586370.559461
Year20202021
TA10.403510.434310.424140.30355
COGS0.4035110.476630.4241410.55016
OPEX0.43430.4766310.303550.550161
Year20222023
TA10.381450.4282510.460370.36986
COGS0.3814510.467220.4603710.57605
OPEX0.428250.4672210.369860.576051
Table 6. Diversity index.
TACGSOETACGSOE
Year20122013
TA00.219080.2470800.152670.22941
COGS0.2190800.187040.1526700.15173
OPEX0.247080.1870400.229410.151730
Year20142015
TA00.208470.2094700.205420.17729
COGS0.2084700.165530.2054200.31035
OPEX0.209470.1655300.177290.310350
Year20162017
TA00.269590.2909200.24260.28168
COGS0.2695900.247490.242600.22569
OPEX0.290920.2474900.281680.225690
Year20182019
TA00.280960.3157400.254730.20681
COGS0.2809600.194730.2547300.22027
OPEX0.315740.1947300.206810.220270
Year20202021
TA00.298240.2828500.287930.34823
COGS0.2982400.261680.2879300.22492
OPEX0.282850.2616800.348230.224920
Year20222023
TA00.309280.2858800.269810.31507
COGS0.3092800.266390.2698100.21198
OPEX0.285880.2663900.315070.211980
Table 7. Weight to input or output.
YearTACGSOE
20120.320930.344650.33442
20130.324740.350170.32509
20140.322460.338940.3386
20150.363190.311420.32539
20160.322580.343530.3339
20170.322470.346890.33063
20180.297780.357730.34448
20190.330840.324980.34418
20200.323340.334650.34201
20210.298580.363480.33795
20220.322270.333150.34458
20230.306330.355960.3377
Table 8. The efficiency scores for DMUs in the past years (2012–2019).
DMUs20122013201420152016201720182019
DMU10.897050.967570.97840.998721110.93651
DMU2110.872350.921321111
DMU30.867490.903590.894330.878610.891720.916560.928160.88593
DMU40.888070.86490.944190.993521111
DMU511111111
DMU60.775760.827860.956110.894140.983590.974470.89570.86206
DMU70.852630.855310.995861110.951070.87843
DMU8111110.956040.938660.91156
DMU90.680770.730160.8210.777990.858430.8420.873130.86069
DMU100.771120.86180.944750.928740.913110.922360.95920.89168
Table 9. The efficiency scores for DMUs in the prediction years (2020–2023).
DMUs2020202120222023
DMU11111
DMU210.960850.944350.95079
DMU30.968050.910310.997110.93022
DMU41111
DMU51111
DMU60.889650.916120.888260.91979
DMU70.927410.932480.915750.92693
DMU80.913890.917260.89860.91106
DMU90.930470.931260.979190.96635
DMU100.924960.931150.915120.92765
Publisher’s Note: MDPI stays neutral with regard to jurisdictional claims in published maps and institutional affiliations.

