Article

An Advanced Decision Making Framework via Joint Utilization of Context-Dependent Data Envelopment Analysis and Sentimental Messages

1
English Program of Global Business, Chinese Culture University, Taipei 11114, Taiwan
2
Department of Accounting, Chinese Culture University, Taipei 11114, Taiwan
3
Department of Business Management, National United University, Miaoli 36003, Taiwan
*
Author to whom correspondence should be addressed.
Submission received: 8 June 2021 / Revised: 19 July 2021 / Accepted: 19 July 2021 / Published: 4 August 2021
(This article belongs to the Special Issue Intelligent and Fuzzy Systems)

Abstract

:
Compared to widely examined topics in the related literature, such as financial crises/difficulties in accurate prediction, studies on corporate performance forecasting are quite scarce. To fill the research gap, this study introduces an advanced decision making framework that incorporates context-dependent data envelopment analysis (CD-DEA), fuzzy robust principal component analysis (FRPCA), latent Dirichlet allocation (LDA), and stochastic gradient twin support vector machine (SGTSVM) for corporate performance forecasting. Ratio analysis with the merits of easy-to-use and intuitiveness plays an essential role in performance analysis, but it typically has one input variable and one output variable, which is unable to appropriately depict the inherent status of a corporate’s operations. To combat this, we consider CD-DEA as it can handle multiple input and multiple output variables simultaneously and yields an attainable target to analyze decision making units (DMUs) when the data present great variations. To strengthen the discriminant ability of CD-DEA, we also conduct FRPCA, and because numerical messages based on historical principles normally cannot transmit future corporate messages, we execute LDA to decompose the accounting narratives into many topics and preserve those topics that are relevant to corporate operations. Sequentially, the process matches the preserved topics with a sentimental dictionary to exploit the hidden sentiments in each topic. The analyzed data are then fed into SGTSVM to construct the forecasting model. The result herein reveals that the introduced decision making framework is a promising alternative for performance forecasting.

1. Introduction

The global financial tsunami that first erupted in the middle of 2007 has been widely acknowledged as the most serious financial crisis since the Great Depression [1,2,3]. Due to ever-increasing financial defaults, market participants have raised considerable attention on risk management in corporate finance and accounting studies. Peters et al. [4] pointed out that the main trigger for financial defaults/crises is bad operating performance—that is, a corporate with bad operating performance usually has insufficient resources and weak risk-absorbing ability to properly respond to financial troubles. This situation also explains why a firm with bad operating performance usually has a higher chance of being bought out or being liquidated. Thus, how to evaluate a corporate’s operating performance turns out to be an essential and urgent requirement in today’s highly turmoil economic atmosphere.
Ratio analysis with the benefits of easy-to-use and being highly intuitive is one of the most widely employed measures for evaluating corporate operations [5,6]. However, the structure of ratio analysis has one input variable and one output variable (such as return on assets (ROA) = net income/total assets), making it rather complicated to depict the real picture of a corporate’s operations under today’s highly uncertain and intense business atmosphere. Data envelopment analysis (DEA) has already proved itself as a very well-known linear programming and management science method for handling performance measure tasks [7,8]. It not only can take multiple input and multiple output variables simultaneously without a presetting production function, but it also can be extended into dissimilar structures, thus increasing its application fields. This technique still has some weaknesses, such as too many variables inserted into a model will impede its discriminant ability. To combat this, Adler and Golany [9] applied principal component analysis (PCA) to identify an uncorrelated linear combination of inputs and outputs and then inserted the essential principal components (PCs) into DEA (PCA-DEA) to prevent arriving at an inappropriate judgment.
The challenge of PCA is that it suffers from sensitivity to extreme data and is limited to a linear structure [10,11,12]. In other words, if the data are contaminated by extreme values, then DEA cannot identify their real semantic structure. To solve this problem, one may consider fuzzy robust principal component analysis (FRPCA) with the function of modifying the covariance matrix calculation procedure, which can reduce the impacts caused by extreme values [13]. It is able to convert high-dimensional data into low-dimensional data, thus increasing comprehensibility as well as reducing the storage requirement. Dimensionality reduction is an essential data pre-processing technique in machine learning and pattern recognition. It helps analyze high-dimensional datasets by mapping data from high dimensional feature space to data in low dimensional feature space and tries to preserve as much as possible the relationships among data samples without distorting inherent data semantics in the traditional feature space [14]. Especially, with the rapid advancement and development of information technology and Internet, high dimension, distributed and dynamic complex data are promptly proliferated [15,16]. However, too many information surrounded by decision makers will confuse their decision making process and even worse lead to a biased judgment. To combat this, dimensionality reduction with the merits of increasing model’s separation ability, removing irrelevant information, and eliminating computational burden is considered in this study [17].
Seiford and Zhu [18] indicated that adding or deleting an inefficient decision making unit (DMU) into the DEA model will not modify the position of the decision frontier/surface. The decision frontier/surface changes only if the structure of the decision frontier/surface is altered. Based on the theory of consumer choice, consumers’ judgements are normally influenced by a certain context—e.g., a circle looks large when so many small circles surround it; or a circle looks small when so many large circles surround it [18,19]. In order to take this construct within the DEA model into consideration, one may employ context-dependent DEA (CD-DEA), which modifies the measuring context developed by alternative options so as to capture the relative attractiveness and progressiveness of each DMU. This method can overcome the obstacle of conventional DEA by generating a direction for an inefficient DMU to become an efficient DMU, but one often ends up with a target that is difficult or even impossible to achieve [20]. This method begins by a grouping strategy in order to establish many different evaluation contexts. For this purpose, this method performs a DEA to identify the best-practice frontier and removes all the efficient DMUs on this frontier (i.e., the first level frontier), then the remaining (i.e., inefficiency DMUs) will form a new second-level frontier. If the DMUs on the second-level frontier are removing, the third-level frontier can be developed, and so on, until no DMU is left [19,21]. By doing that it is able to group DMUs into different clusters via this non-parametric approach (i.e., CD-DEA) and then calculate the progressiveness and attractiveness score for each DMUs by adjusting the evaluation contexts [21]. Based on each DMU’s cluster reference (i.e., progressiveness and attractiveness scores), CD-DEA enables assigning attainable goals for inefficient DMUs to become efficient gradually [20]. However, in most real-life situations, it is impossible for a DMU to improve all of the inputs and outputs proportionally at the same time. Based on this concept, the inefficient DMU can look for the most achievable target by performing a CD-DEA and compares its own resources with the benchmark so as to set up level-by-level improvement plans for the current and future. By joint utilization of FRPCA and CD-DEA, we are able to improve the model’s discriminant ability as well as steer the users to a more suitable and accessible position.
Different from previous research works on setting up forecasting models that focused heavily on the adoption of numerical messages, this study provides users with an overarching consideration from different perspectives and further utilizes textual messages [22,23,24,25,26]. Rönnqvist and Sarlin [27] also indicated that the signs of a change in corporate operations very likely will appear in textual format that precedes users who try to find any subtle differences in various numerical ratios. People nowadays live in an era of an abundant amount of information that can be accessed easily without any hysteresis. However, too many messages surrounding decision makers can confuse them and even worse result in inappropriate judgments [28,29]. Some messages represented in narratives lack a structured format and sometimes simply turn out to be useless or an encumbrance [30]. How to digest a large amount of textual messages and convert them into manageable ones turns out to be an essential task in today’s highly intertwined and connected economies.
To combat the circumstance above, one may use latent Dirichlet allocation (LDA), which is a sort of topic modelling technique. As Cambria and White [31] indicated, LDA is an endogenous Natural Language Processing (NLP) procedure that “involves the utilization of artificial intelligence (AI) methods to conduct a semantic extraction task by generating a knowledge hierarchy that conjecture the concepts from considerable amounts of narratives without a pre-determined knowledge foundation”. The topic derived from LDA is illustrated by a distribution over words. The words’ distribution for each topic and the topics’ distribution for each document are unknown; they are learned from the data [32]. We are capable of discovering the essential topics hidden in large amounts of narratives and delete those topics that have no relation to corporate operations.
Tetlock [33] stated that the sentiment of messages (i.e., financial reports) issued by corporates has a strong impact on stock trading volume. Tetlock et al. [34] further identified that negative sentiment embedded into a corporate’s issued documents implies a declining trend in the near future. In order to catch the sentiment hidden in such documents, a dictionary-based approach can be considered. By joint utilization of LDA and a dictionary-based approach, we can decompose financial reports into different topics, preserve those topics that highly relate to a corporate’s operations, and match the preserved topics with dictionary-based word lists to exploit the hidden sentiments so as to make conjectures about the corporate’s future prospects.
Adopting CD-DEA + FRPCA allows us to determine the performance rank for each corporate and convert the performance forecasting task into a binary classification problem. The sentimental messages hidden in annual reports can be exploited via LDA and a dictionary-based approach. All the analyzed outcomes are then injected into an AI algorithm, called stochastic gradient twin support vector machine (SGTSVM) [35] with superior learning capability, outstanding generalization ability, and a very small memory requirement, to establish a decision making framework for corporate performance forecasting [36]. Current and potential investors can view this model as a roadmap to adjust their investment portfolios so as to reach the maximized profits under an anticipated risk level [37,38]. From the perspective of managers, they can consider many different if-then scenarios to formulate future policies so as to obtain the goal of sustainable development.
Eventually, four main contributions of this study can be summarized as follows. First, this study displays the applicability of FRPCA and CD-DEA in a performance evaluation task so as to help inefficient DMUs to look for an attainable target to follow and plan for current performance improvement and future prosperity. Secondly, we add the stream of financial research that concentrates on risk management. In contrast to other studies (i.e., financial failure prediction, or credit rating forecasting), the works on performance prediction is not well-examined in depth. Third, we introduce a novel strategy to quantify large amount of textual information. By performing LDA (i.e., one of the topic modelling approaches), we can decompose considerable amount of textual messages into different categories. By removing the categories which are not relevant to business operation, and then matches the preserved categories with a sentimental dictionary in order to extract the essential messages hidden in texts. Finally, we insert the analyzed outcome into a kernel-based model (i.e., SGTSVM) to construct the performance prediction model. The model, tested by real cases, is a promising alterative for performance prediction and improvement.
The rest of this paper is organized as follows. Section 2 establishes the literature review. Section 3 presents the introduced decision making framework. Section 4 displays the empirical analysis and outcomes based on the adopted methodologies described herein. Section 5 discusses the conclusion and directions for future works.

2. Literature Review

2.1. Applications of Numerical Information

A corporate financial difficulty takes place when an enterprise suffers continuous and chronic losses or when it cannot pay obligations or liabilities that are disproportionately greater than its assets [39]. Bankers, creditors, stock shareholders, suppliers, and top managers are all interested in corporate financial difficulty assessment due to the considerable negative impacts imposed upon them [40]. The potential assumption underlying financial difficulty forecasting is that the financial ratios derived from financial reports, such as financial statements, income statements, etc., can be used to properly describe the aforementioned characteristics. In other words, financial ratio analysis can assess different facets of an enterprise, such as profitability, liquidity, long-term solvency, and market value. The effectiveness and usefulness of financial ratio analysis appear considerably in the finance, economic, and accounting domains [41].
Altman [5] and Beaver [6] sparked efforts towards the discernment of enterprises’ financial difficulty through statistical techniques, namely discriminant analysis (DA), that are grounded on the usage of financial ratios. One of DA’s critical drawbacks is its unrealistic assumptions that do not hold in numerous real-life applications [42]. To overcome this problem, some amended statistical approaches, such as linear conditional probability approach, logistic regression (LR), and logit model, were introduced. Martin [43] constructed a financial pre-warning model for banks by LR, gathering research samples from the Federal Reserve System. Ohlson [44] used a logit model to detect an enterprise’s financial difficulty, collecting research samples and financial information from the Compustat database and 10-K financial reports. The forecasting performances reported by him were all above 90% for one year, two years, and three years. Kolari et al. [45] introduced a novel mechanism integrating the logit model and trait recognition technique (a non-parametric approach that relies on no statistical or distributional assumptions about the predictor variables) for financial difficulty prediction, achieving prediction accuracy of nearly 95%.

2.2. Applications of Textual Information

The narrative analysis of financial documents in recent years has become rather essential in the financial world. While the numerical part of a document only represents a corporate’s past performance, the textual part holds information about its future development and performance [46,47]. The literature on accounting narratives can be briefly categorized into two main streams: (1) readability and (2) content analysis [17]. Works on readability have sought to evaluate how difficult textual contents are to comprehend, while those on content analysis seek to draw inferences from the data by “systematically identifying specified characteristics of [a] message” [48,49].
Most early studies placed a lot more emphasis on comprehending the readability of annual reports and their components. For example, Smith and Smith [50] evaluated the readability of financial reports’ footnotes from Fortune 50 firms, while Healy [51] examined the readability of financial reports’ footnotes from 50 New Zealand firms. Both studies concluded that the readability level of these footnotes is restrictive. Some works have examined the association between readability and other variables. For example, Li [52] found a positive relationship between readability and earnings persistence, while Goel et al. [53] identified that annual reports provided by fraudulent corporates are much harder to comprehend and read.
Another branch of research on accounting narratives covers content analysis. Bowman [54] implemented content analysis to examine the relationship between annual reports and corporate strategies. Bodnaruk et al. [55] stated that the frequency of negative words embedded in 10-K reports exhibits very low correlation with traditional measures of financial constraints and better forecasts impending cases of liquidity trouble.
Apart from the aforementioned studies that collected textual information from narrative documents, some studies focused on obtaining widely available and timely resources of information from news media. Because of the great improvement in information technology and Internet, we are now able to get instant global economic news on all the financial media in a very short time. Interpreting and extracting implicit information from financial news to assist the decision making process have become an attractive research issue. Tetlock [33] studied media (Wall Street Journal) influence on market practitioners and identified the strong influence of negative news on stock trading volume. Tetlok et al. [34] pointed out that negative wording implies a decrease in future corporate earnings. Grounded on previous works, we conclude that textual information derived from narrative documents provides great potential for pattern searching as well as offers a great contribution to the accounting and finance domains.
When compared to widely studied topics like financial difficulty prediction or credit risk prediction, the literature on performance forecasting that involves numerical and textual information is quite scant. In order to fill this gap, this study proposes a performance forecasting model with numerical and textual information. Furthermore, to extract the decisive messages from accounting narratives and to avoid considerable human judgments, a dictionary-based approach (that is, the Loughran-McDonald dictionary: it is a finance-specific dictionary) is adopted. To eliminate the problem of information overload and realize how a corporate’s operating performance may change through its financial disclosures across different topics, this study also applies LDA. By joint utilization of a finance-specific dictionary and LDA, we are able to condense a large amount of textual information into holistic and synthesized readable data in a timely manner.

3. Methodologies

3.1. Fuzzy Robust Principal Component Analysis: FRPCA

By integrating Xu and Yuille’s algorithm into principal component analysis (PCA), which is related to the energy function, Yang and Wang [56] introduced robust principal component analysis (RPCA) with higher tolerance to outliers and extreme values. The objective function of RPCA can be also extended to be fuzzy, hereafter fuzzy robust principal component analysis (FRPCA), so as to enhance its application fields. A brief illustration of FRPCA runs as follows.
The optimization function of Xu and Yuille’s algorithm [57] subject to b i 0 , 1 is expressed in Equation (1):
G B , w = i = 1 n b i g x i + η i = 1 n 1 b i
where X = x , , x n denotes the research targets, B = b i i = 1 , , n expresses the membership function, and η represents the threshold. The purpose is to minimize G B , w with respect to b i and w . However, the problem of this method is that b i is a binary variable, and w is a continuous variable, making this optimization task hard to reach an optimal solution via a gradient descent algorithm. To combat this, the minimization task is transformed into a maximization task by performing the Gibbs distribution approach. The mathematical formulation is represented by:
P B , w = exp λ G B , w Z
where Z denotes the partition function that ensures the summation of B w P B , w equals 1. The assessment criterion can be one of the following functions:
g 1 x 1 = x i w T x i w 2
g 2 x 1 = x i 2 w T x i 2 w 2 = x i T x i w T x i x i T w w T w
The minimization rules of the gradient descent approach for G 1 = i = 1 n g 1 x i and G 2 = i = 1 n g 2 x i are displayed as follows:
w n e w = w o l d + α t y x i b + y v x i
w n e w = w o l d + α t x i y w w T w y 2
Here, α t depicts the learning rate, y = w T x i , b = y w , and v = w T b . The objective function done by Yang and Wang’s [56] study can be expressed in Equation (7).
G = i = 1 n b i m 1 g x 1 + η i = 1 n 1 b i m 1 s . t . b i 0 , 1 m 1 1 ,
Here, b i is the membership of x i , which are assigned to a data cluster, and 1 b i is the membership of x i , which are assigned to a noise cluster. Finally, g x i is taken to measure the error/difference between x i and the cluster center.
The aforementioned idea is similar to the fuzzy c-means algorithm [58]. By performing this transformation, b i becomes a continuous variable and the aforementioned problem (that is, the optimization task that involves the continuous and discrete variables) can be eliminated and the gradient descent algorithm can be executed. By setting δ G δ b i = 0 , we restructure Equation (7), displayed as follows.
b i = 1 1 + g x i / η 1 / m 1 1
By replacing the old membership function with the new membership function, Equation (9) can be obtained.
G = i = 1 n 1 1 + g x i / η 1 / m 1 1 m 1 1 g x i
The gradient with respect to w is displayed in Equation (10):
δ G δ w = 1 1 + g x i / η 1 / m 1 1 m 1 δ g x i δ w
We now set:
β x i = 1 1 + g x i / η 1 / m 1 1 m 1
Here, m 1 denotes a fuzziness variable. If m 1 = 1 , then fuzzy membership can be reduced to crisp membership and can be decided by the following rule:
b i = 1 , i f g x i < η 0 , o t h e r w i s e
This study follows the work done by Yang and Wang [56] to determine the optimal solution. For a more detailed illustration of FRPCA, one can refer to Yang and Wang [56], Luukka [10], and Luukka [13].

3.2. Stochastic Gradient Twin Support Vector Machine: SGTSVM

We consider a classical two-class prediction task in n -dimentional real space n . The training instances are expressed as B n × m , where b n is the instance with the class label y = ± 1 . We formulate the matrix B 1 n × m 1 and the matrix B 2 n × m 2 to represent the m 1 instances of class-lebel + 1 and the m 2 instances of class-lebel 1 , respectively. SGTSVM is based on TSVM that aims at solving the following primal problems.
min w 1 , x 1 , γ 1 1 2 w 1 2 + x 1 2 + c 1 2 m 1 B 1 T w 1 + x 1 2 + c 2 m 2 e T γ 1 s u b j e c t   t o B 2 T w 1 + x 1 γ 1 e ,   γ 1 0 a n d min w 2 , x 2 , γ 2 1 2 w 2 2 + x 2 2 + c 3 2 m 2 B 2 T w 2 + x 2 2 + c 4 m 1 e T γ 2 s u b j e c t   t o B 1 T w 2 + x 2 + γ 2 e , γ 2 0
Here, c 1 , c 2 , c 3 , c 4 are all positive numbers, the slack variables are γ 1 m 2 and γ 2 m 1 .
For SGTSVM, the above quadratic programming problems (QPPs) can be viewed as unconstrained problems.
min w 1 , x 1 1 2 w 1 2 + x 1 2 + c 1 2 m 1 B 1 T w 1 + x 1 2 + c 2 m 2 q T q + B 2 T w 1 + x 1 , a n d min w 2 , x 2 1 2 w 2 2 + x 2 2 + c 3 2 m 2 B 2 T w 2 + x 2 2 + c 4 m 1 q T q B 1 T w 2 x 2 ,
By developing a series of strictly convex function F 1 , t w 1 , x 1 and F 2 , t w 2 , x 2 with t 1 , the above questions can be solved.
F 1 , t = 1 2 w 1 2 + x 1 2 + c 1 2 w 1 T b t + x 1 2 + c 2 1 + w 1 T b ^ t + x 1 a n d F 2 , t = 1 2 w 2 2 + x 2 2 + c 3 2 w 2 T b t + x 2 2 + c 4 1 w 2 T b ^ t x 2
The sub-gradients for Equation (15) at w 1 , t , x 1 , t and w 2 , t , x 2 , t are expressed in Equation (16).
w 1 , t F 1 , t = w 1 , t + c 1 w 1 , t T b t + x 1 , t b t + c 2 b t ^ s i g n 1 + w 1 , t T b t ̑ + x 1 , t x 1 , t F 1 , t = x 1 , t + c 1 w 1 , t T b t + x 1 , t b t + c 2 s i g n 1 + w 1 , t T b t ̑ + x 1 , t a n d w 2 , t F 2 , t = w 2 , t + c 3 w 2 , t T b ^ t + x 2 , t b ^ t c 4 b t s i g n 1 w 2 , t T b t x 2 , t x 2 , t F 2 , t = b 2 , t + c 3 w 2 , t T b ^ t + x 2 , t c 4 s i g n 1 w 2 , t T b t x 1 , t
The starting points of SGTSVM are w 1 , 1 , x 1 , 1 and w 2 , 1 , x 2 , 1 . The following equations are the updating processes for t 1 .
w 1 , t + 1 = w 1 , t α t w 1 , t , F 1 , t x 1 , t + 1 = x 1 , t α t x 1 , t , F 1 , t w 2 , t + 1 = w 2 , t α t w 2 , t , F 2 , t x 2 , t + 1 = x 2 , t α t x 2 , t , F 2 , t
A more detained illustration of SGTSVM can be seen in Wang et al. [35] and Ren et al. [59].

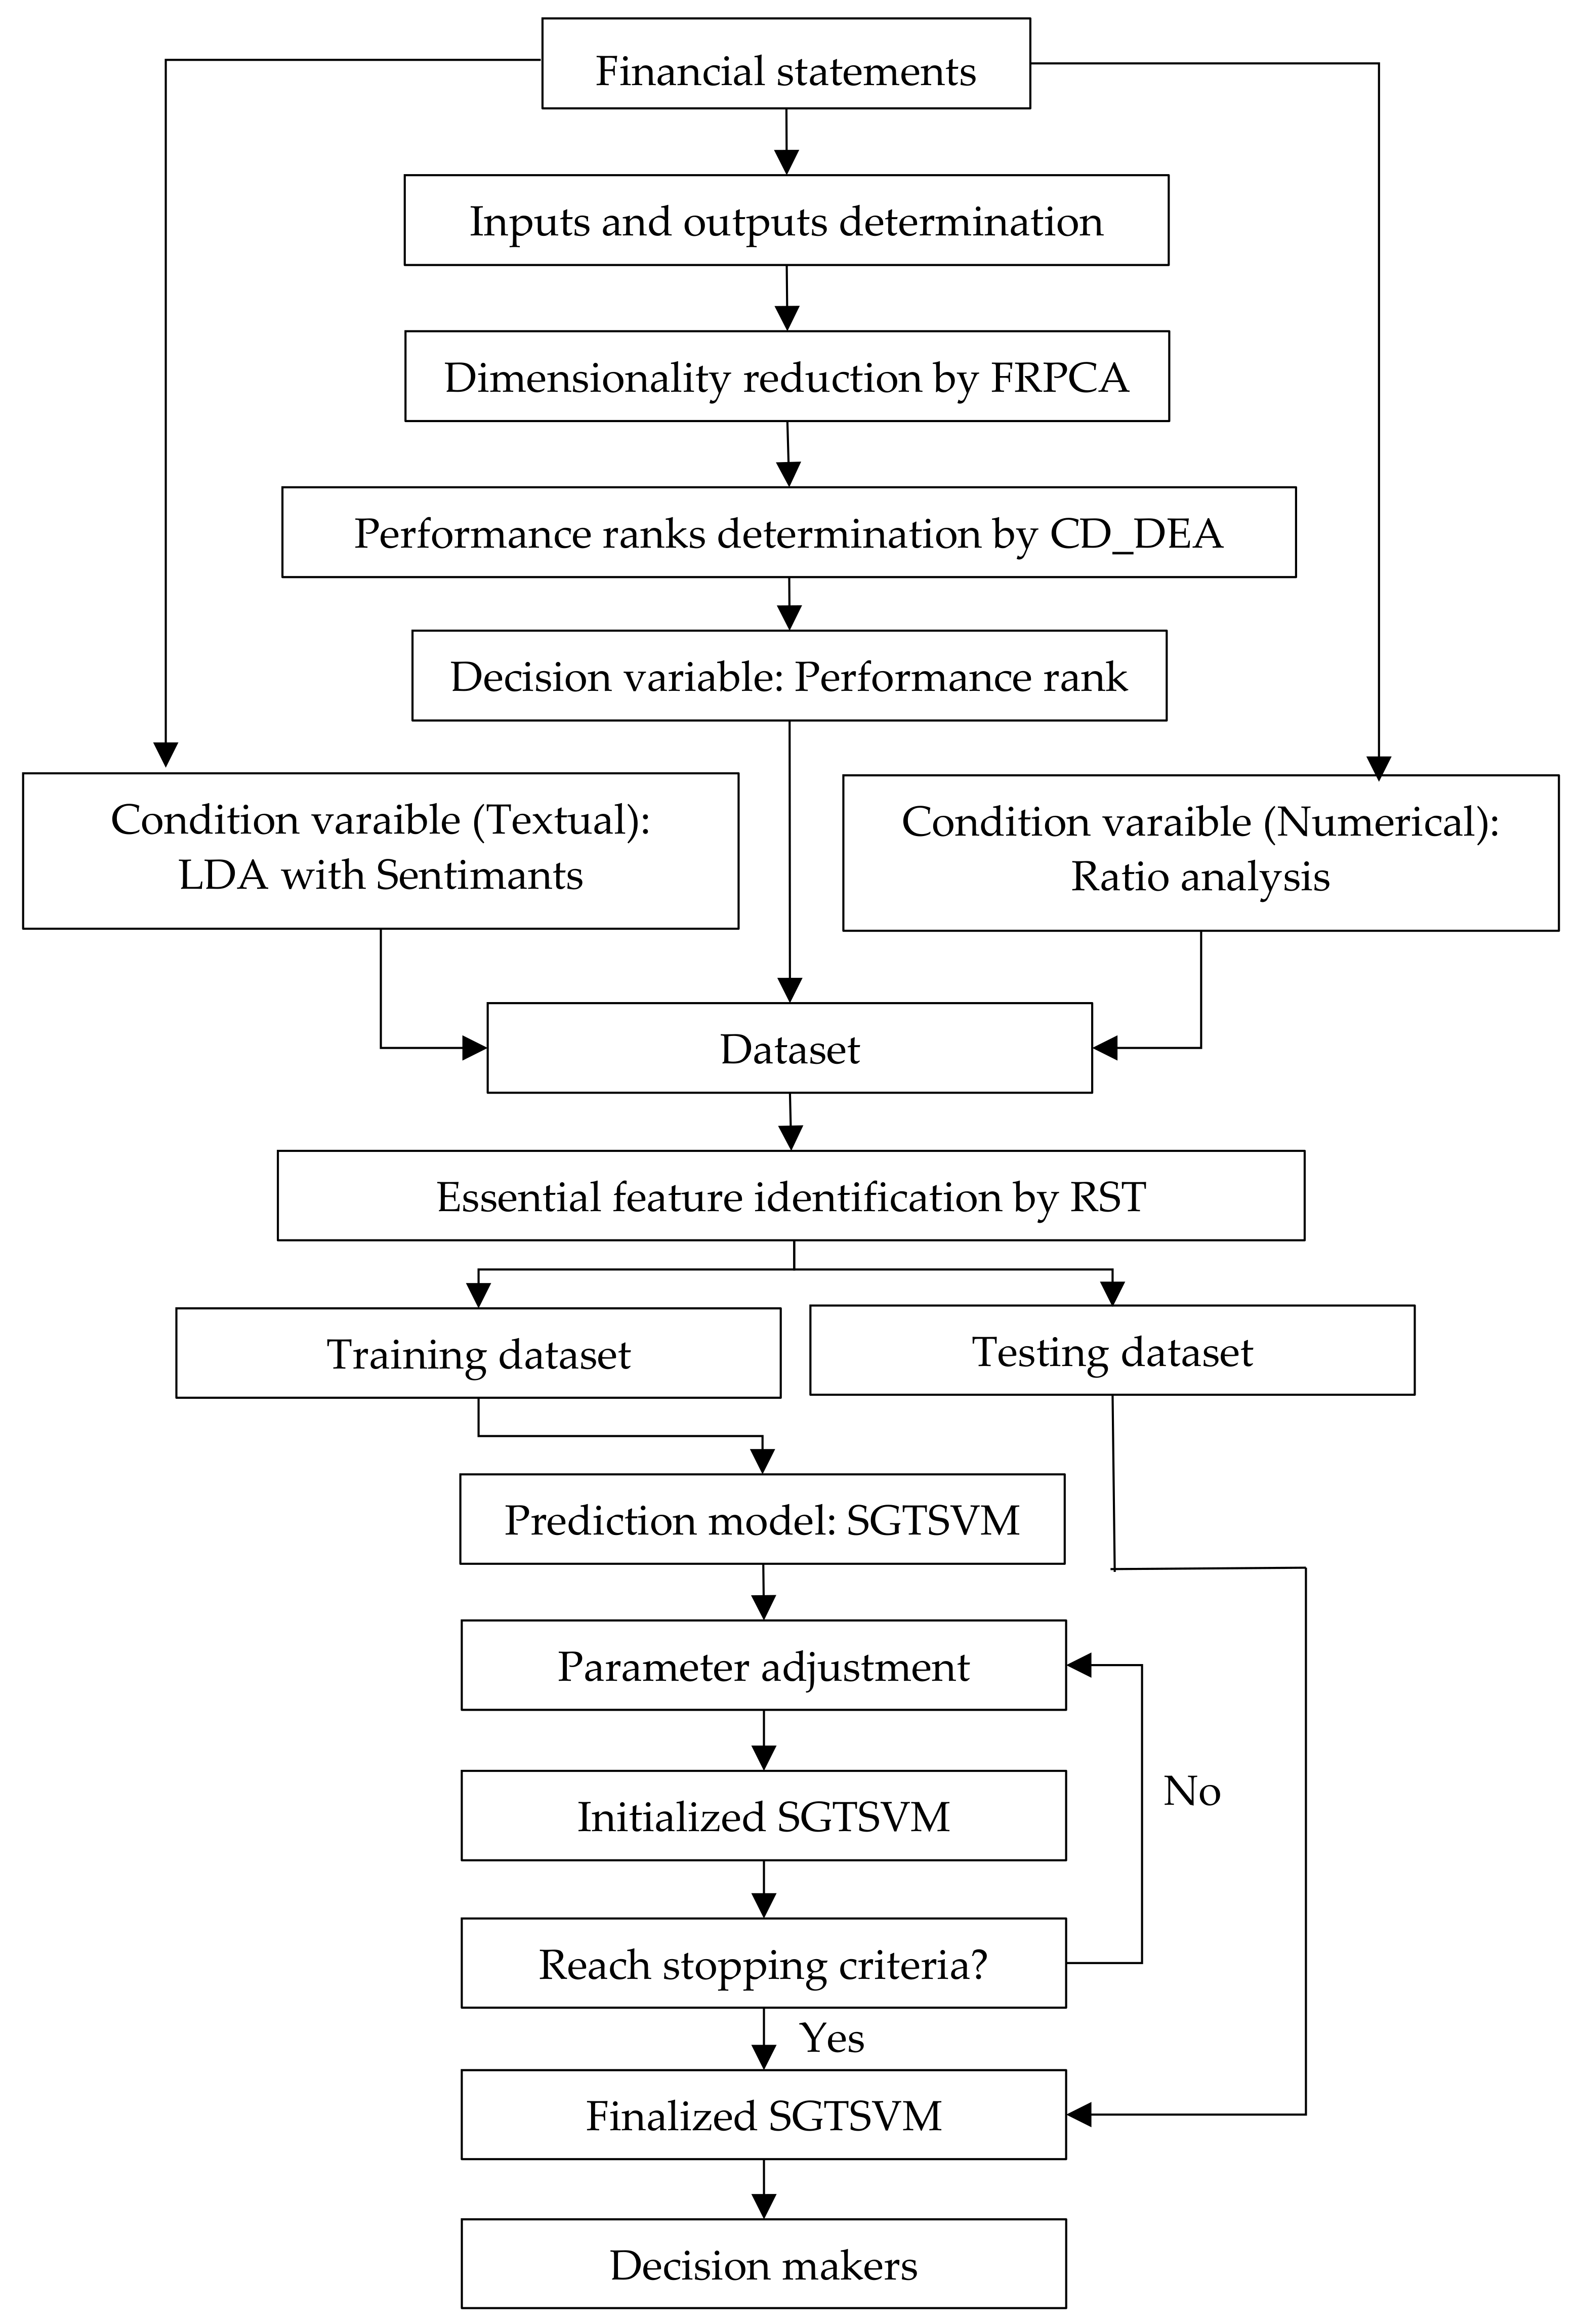
3.3. An Advanced Decision Making Framework: FRPCA_CD-DEA + SGTSVM

This study proposes an advanced decision making architecture (see Figure 1) that consists of three procedures for performance ranking determination, essential messages extraction and prediction model construction. (1) Performance ranking determination: To fully capture the status of corporate’s operation, CD-DEA with the merits of handing multiple inputs and outputs without predetermining a production function and yielding a reachable learning target to follow so as to setting up an appropriate business strategy for current and future development, is considered. In order to reach a robust result of CD-DEA, the appropriateness of input messages, and data clarification is a required and inevitable pre-process, (2) Essential message extraction: To ensure the inputs and outputs are representative for CD-DEA, the Pearson correlation is considered. CD-DEA involves with too many input and output variables will deteriorate its discriminant ability. To combat this, one of the dimensionality reduction techniques, namely FRPCA is taken to eliminate the effect of curse of dimensionality as well as increase its discriminant ability. Most proportion of the research works on pre-warning model constructions rely heavily on numerical information due to its characteristics of easy-to-use and intuitiveness. However, the numerical information represents merely historical messages, it contains less messages about corporate’s future plans and prospects. To complement the time lag problem caused by considering numerical information only, the textual information which can be vised as a leading indicator is taken. How to handle large amount of textual information is an essential issue in today’s information overload economy. LDA, one of the topic modelling algorithms, is performed to divide whole textual information into some topics and preserves the topics which are relevant to business operations. How to conjecture the managers’ attitudes toward corporate’s future development is an essential issue. To deal with this issue, the sentimental dictionary is considered. By joint utilization of LDA and sentimental dictionary, we can infer the managers’ attitude toward company’s future development. The market participants can view this as a guideline to modify their investment portfolios and allocate resources to suitable places to maximize their personnel wealth under anticipated risk levels, and (3) Prediction model construction: For an unfamiliar domain, the decision makers tend to collect all of the related information as much as possible to conjecture the inherent situation. However, too many information surround decision makers will easily confuse their judgments and then result in inappropriate decisions. Thus, essential message extraction turns out to be an important process before prediction model construction. Rough set theory (RST) has been demonstrated its usefulness and robustness in essential message extraction, knowledge generation and classification. Thus, the RST is executed to determine the essential messages [60,61]. The selected messages are then injected into SGTSVM to construct the prediction model. The data used to construct the prediction model is divided into two subsets: (1) training data subset and (2) testing data subset. The former is used to construct the prediction model, and the latter is applied to examine the effectiveness of the constructed model. Five-fold cross-validation is applied to deal with the over-fitting problem. The decision makers can take the introduced model as a roadmap/reference to adjust the corporate’s capital structure, reduce the financing burden, and increasing profitability so as to reach the goal of sustainable development.

4. Empirical Analysis and Outcome

4.1. The Data and Decision Variables

The electronics industry in Taiwan has been widely admired as an economic miracle of the world, has considerable influences on global supply chains of personal computers (PCs), integrated circuits (ICs), and electronic devices, and is viewed as an essential capital market to worldwide investors [17]. In addition, this industry has received large amounts of financial incentives and policy support initiatives from governments and gathered funding from market participants at very low capital costs, turning it gradually into an economic backbone of Taiwan’s stock market. The trading volumes of this specific industry typically exceed 60% of total trading volumes. As the electronics industry has a great impact on the society and economic development of Taiwan, this study takes it as a research target and aims to dig out more hidden useful insights for future policy formulations.
Before we convert the performance forecasting task into a classic binary classification problem, we need to determine the performance rank for each corporate in advance. DEA has demonstrated its usefulness and gained widespread success for performance evaluation among dissimilar research fields. The weakness of conventional DEA is that when the analyzed data have exogenous factors, the performance rank for inefficient corporates often ends up with a target that the model recommended, which is very complicated to reach or attain [14,16]. Thus, it is an urgent requirement to determine an achievable target for inefficient corporates. To reach this goal, CD-DEA is performed to determine a corporate’s performance rank. In estimating the efficient frontier, there are two assumptions: constant return to scale (CRS): it assumes that any level of increase in inputs will proportionately increase the level of output, and variable return to scale (VRS): it assumes that any increase in the level of inputs will either increase or decrease the level of output [62]. There are two orientations in DEA model: input-oriented and output-oriented. The former seeks to minimize the inputs with the assumption of fixed level of outputs, and the latter aims to maximize the output with an assumption of fixed level of inputs, and thus maximize the efficiency. In this study, we apply CRS, output-oriented CD-DEA to reach the outcome. Based on the performance level the corporates are at, we divide all corporates into two categories: one for efficiency and the other one for inefficiency. In accordance to previous work done by Tone and Tsutsui [63] and Xu and Wang [64], we choose five input variables: total assets (TA), number of employees (NOE), fixed assets (FA), cost of goods sold (COGS), and total debt (TD); and four output variables: total sales (TS), gross margin (GM), net income (NI), and earnings per share (EPS). Table 1 displays the selected input and output variables. We can see that our selected input and output variables mixed use of raw data and ratio. Based on the research work done by Cook et al. [65] they indicated that a mixture of ratios/percentiles and raw data is permissible in DEA applications.

4.2. The Results

Because examining the selected variables for CD-DEA is reliable, we employ the Pearson correlation (see Table 2). We see that all the selected variables are positive and reach a significance level. In other words, all the selected variables are representative and appropriate.
For an unknown domain, users tend to collect as much information as possible to conjecture the inherent reality of this domain. However, too many messages to the end- users will deteriorate their judgmental ability and even worse may result in decision failure. To confront this, we utilize FRPCA, which is a dimensionality reduction technique. Table 3 displays the test results concerning the effectiveness of FRPCA. The results indicate that CD-DEA with FRPCA has a lower mean value and a higher variance value—that is, the model with dimensionality reduction has better discriminant ability than the model without dimensionality reduction. This finding is echoed with the work done by Lin [3].
In addition, the number of DMUs in comparison to the number of combined inputs and outputs has been a concern when it comes to applying DEA. That is, large numbers of combined inputs and outputs compared to the number of DMUs may deteriorate the DEA’s discriminant ability [65]. A suggested “rule of thumb” is that the number of DMUs be at least twice the numbers of combined inputs and outputs [66]. To further examine the discriminant power of the introduced performance evaluation mechanism (i.e., FRPCA + CD-DEA), data eliminating strategy is executed. In this experimental test, we randomly eliminate the constant percentage (i.e., 20%) of the whole data and use the remaining data to get the results from two different evaluation models. The results are shown in Table 4. We can see that the introduced model still performs better than CD-DEA under all scenarios.
Peters et al. [4] pointed out that the main trigger for financial difficulties/crises is bad operating performance. That is, the bad operating performance can be viewed as a prior stage before the financial difficulties/crises burst forth. Due to the nature of corporate financial difficulties/crises highly related to corporate’s bad operating performance, the variables we chosen in financial difficulty forecasting can be taken as the surrogate for joining up with the predictors. According to the related works [67,68,69,70], the selected variables are represented in Table 5.
Apart from prior works on building performance forecasting models that merely focus on numerical messages, this study aims at providing decision makers with an overarching decision making framework from different perspectives of corporate operations and equipping them with textual messages that can transmit future corporate performance without any time delay. How to digest large amounts of textual messages is an urgent requirement in today’s information society. Thus, one may use a topic modelling technique, called Latent Dirichlet Allocation (LDA), to extract the essential topics embedded in a corporate’s annual report. By implementing LDA, we can identify the essential topics and preserve those topics that are highly relevant to corporate operations. Perplexity is a commonly adopted criterion in information theory to measure how well a statistical approach describes a dataset, with lower perplexity denoting a superior probabilistic method [71]. The results show that five topics are preserved (see Figure 2) and the word lists for each topic is displayed in Table 6. To extract the inherent sentimental messages hidden in these topics, we utilize a finance-specific dictionary (i.e., Loughran-McDonald dictionary: LM dictionary). We count the number of positive words and the number of negative words in each topic. If the number of positive words exceeds the number of negative words in this topic, then it means this topic contain positive information and vice versa.
Feature selection is an inevitable pre-process in data mining and machine learning. Rough set theory (RST) has proven its superior performance in the identification of essential features. The weakness of RST is to determine the minimal reduct that is viewed as a NP hard task—that is, the run time of generating all reducts is exponential [72,73]. To confront this, one type of heuristic algorithm, the fish swarm method, is employed.
Table 7 displays the selected features. We can see that the selected variables contain two topic-based messages. To further test the usefulness of the topic-based messages, we divide the experimental design into two conditions: one is the model with topic-based messages, and the other one is the model without topic-based messages. Apart from previous forecasting model establishment studies with findings that merely consider one assessment measure, such as total accuracy and total error rate, this study takes two assessment measures, called type I error and type II error, into consideration so as to reach a more reliable and trustworthy judgment. Five-fold cross-validation (CV) is adopted to eliminate the problem of over-fitting. We can see that the model with topic-based messages performs better than the model without topic-based messages. This finding (see Table 8) supports Huang et al. [74] who noted that sentimental messages from annual reports (i.e., financial narratives) provide much denser and detailed information beyond just financial messages [75,76,77,78].
To avoid the outcome just happening by coincidence, we take the introduced model as a benchmark and further compare it with the other three AI-based algorithms: relevant vector machine (RVM), extreme learning machine (ELM), and back propagation neural network (BPNN). Five-fold cross-validation is adopted to eliminate the problem of over-fitting, and the Friedman test is conducted to examine the robustness of the introduced model. Table 9 displays the comparison outcomes. We see that the introduced model still outperforms the other three algorithms. The introduced model can therefore be used as an alternative for performance forecasting.
Most related studies conclude their finding rely on a pre-determined dataset. To test the generalization ability of the proposed model, we consider the other four situations. The results are displayed in Table 10. We can see that the proposed model still reaches an outstanding performance under all situations. In summary, the introduced model is a promising alternative for performance prediction.

5. Conclusions and Future Works

Compared to the well-developed domain of financial crisis prediction and credit rating forecasting, there are scant works on corporate operating performance forecasting. To fill this research gap, our study aims at developing an effective decision making framework for this type of forecasting. Most studies on performance evaluation have focused considerably on ratio analysis, but this measuring framework generally has one input and one output, which cannot depict the real status of a corporate’s operations, especially in today’s highly intense and interconnected economy. To combat this, this study sets up CD-DEA, which can handle multiple input and output variables simultaneously without a pre-determined cost function and is able to yield an attainable target for analyzed corporates to initiate plans for short- and long-term development. In order to enhance the CD-DEA’s discriminant ability, FRPCA is employed herein.
This research does not restrict itself to numerical messages, but further extends into including sentimental messages hidden in financial narratives so as to construct an overarching and comprehensive decision making framework. The findings echo those by Huang et al. [61] who stated that textual information can be used to complement the information lag concluded from numerical messages.
Future research works can consider several directions as follows. (1) Adoption of advanced feature selection approaches: The original features of a model can be inserted into kernel-based methods, such as kernel principal component analysis (KPCA) and kernel independent component analysis (KICA), to extract much deeper insight through data semantics. (2) Advanced decision making framework: The CD-DEA can be integrated it with cross efficiency to prevent the obstacle caused by radial-based measure. That is, the problem of radial-based measure expresses how distinct the DMU under evaluation is from a single specific DMU in the evaluation context, not from the entire evaluation context overall. By considering cross efficiency, we can achieve a more precise conclusion and eliminate unrealistic weighting scheme so as to fit into practical applications.

Author Contributions

Conceptualization, H.-L.H. and S.-J.L.; methodology, S.-J.L. and M.-F.H.; validation, S.-J.L. and M.-F.H.; writing—original draft preparation, H.-L.H. and S.-J.L.; writing—review and editing, S.-J.L. and M.-F.H.; project administration, H.-L.H. and S.-J.L.; funding acquisition, S.-J.L. All authors have read and agreed to the published version of the manuscript.

Funding

This research was funded by Ministry of Science and Technology (MOST), Taiwan, grant number MOST 109-2410-H-034 -034 -MY2 and MOST 110-2410-H-034 -009.

Institutional Review Board Statement

Not applicable.

Informed Consent Statement

Not applicable.

Data Availability Statement

All the data can be collected from public sources, such as Taiwan Securities and Exchange, Taiwan Economic Journal Databank.

Conflicts of Interest

No conflicts of interest exist in this study.

References

  1. Mian, A.; Sufi, A. The Consequences of Mortgage Credit Expansion: Evidence from the U.S. Mortgage Default Crisis. Q. J. Econ. 2009, 124, 1449–1496. [Google Scholar] [CrossRef]
  2. Ko, Y.C.; Fujita, H.; Li, T. An evidential analysis of Altman Z-score for financial predictions: Case study on solar energy companies. Appl. Soft Comput. 2017, 52, 748–759. [Google Scholar] [CrossRef]
  3. Lin, S.J. Integrated artificial intelligence and visualization technique for enhanced management decision in today’s turbulent business environments. Cybern. Syst. 2021, 52, 274–292. [Google Scholar] [CrossRef]
  4. Peters, M.D.; Wieder, B.; Sutton, S.G.; Wakefield, J. Business intelligence systems use in performance measurement capabilities: Implications for enhanced competitive advantage. Int. J. Account. Inf. Syst. 2016, 21, 1–17. [Google Scholar] [CrossRef]
  5. Altman, E.J. Financial ratios, discriminant analysis and the prediction of corporate bankruptcy. J. Financ. 1968, 23, 589–609. [Google Scholar] [CrossRef]
  6. Beaver, W.H. Financial ratios as predictors of failures. J. Account. Res. 1966, 4, 71–111. [Google Scholar] [CrossRef]
  7. Charnes, A.; Cooper, W.; Rhodes, E. Measuring the efficiency of decision making units. Eur. J. Oper. Res. 1978, 2, 429–444. [Google Scholar] [CrossRef]
  8. Wang, C.N.; Nguyen, N.A.T.; Fu, H.P.; Hsu, H.P.; Dang, T.T. Efficiency Assessment of Seaport Terminal Operators Using DEA Malmquist and Epsilon-Based Measure Models. Axioms 2021, 10, 48. [Google Scholar] [CrossRef]
  9. Adler, N.; Golany, B. Evaluation of deregulated airline networks using data envelopment analysis combined with principal component analysis with an application to Western Europe. Eur. J. Oper. Res. 2001, 132, 260–273. [Google Scholar] [CrossRef]
  10. Luukka, P. Classification based on fuzzy robust PCA algorithms and similarity classifier. Expert Syst. Appl. 2009, 36, 7463–7468. [Google Scholar] [CrossRef]
  11. He, Z.; Wu, J.; Han, N. Flexible robust principal component analysis. Int. J. Mach. Learn. Cyber. 2020, 11, 603–613. [Google Scholar] [CrossRef]
  12. Wang, A.D.; Jin, Z.; Yang, J.Y. A faster tensor robust PCA via tensor factorization. Int. J. Mach. Learn. Cyber. 2020, 11, 2771–2791. [Google Scholar] [CrossRef]
  13. Luukka, P. A New Nonlinear Fuzzy Robust PCA Algorithm and Similarity Classifier in Classification of Medical Data Sets. Int. J. Fuzzy Syst. 2011, 13, 153–162. [Google Scholar]
  14. Li, Y.; Chai, Y.; Yin, H.; Chen, B. A novel feature learning framework for high-dimensional data classification. Int. J. Mach. Learn. Cyber. 2021, 12, 555–569. [Google Scholar] [CrossRef]
  15. Farnè, M.; Vouldis, A.T. Banks’ business models in the euro area: A cluster analysis in high dimensions. Ann. Oper. Res. 2021. [Google Scholar] [CrossRef]
  16. Jie, T. Parallel processing of the Build Hull algorithm to address the large-scale DEA problem. Ann. Oper. Res. 2020, 295, 453–481. [Google Scholar] [CrossRef]
  17. Hsu, M.F.; Lin, S.J. A BSC-based network DEA model equipped with computational linguistics for performance assessment and improvement. Int. J. Mach. Learn. Cyber. 2021. [Google Scholar] [CrossRef]
  18. Seiford, L.M.; Zhu, J. Context-dependent data envelopment analysis-Measuring attractiveness and progress. Omega 2003, 31, 397–408. [Google Scholar] [CrossRef]
  19. Lim, S. Context-dependent data envelopment analysis with cross-efficiency evaluation. J. Oper. Res. Soc. 2012, 63, 38–46. [Google Scholar] [CrossRef]
  20. Ulucan, A.; Atıcı, K.B. Efficiency evaluations with context-dependent and measure-specific data envelopment approaches: An application in a World Bank supported project. Omega 2010, 38, 68–83. [Google Scholar] [CrossRef]
  21. Morita, H.; Hirokawa, K.; Zhu, J. A slack-based measure of efficiency in context-dependent data envelopment analysis. Omega 2005, 33, 357–362. [Google Scholar] [CrossRef]
  22. Akeb, H.; Lévy, A.; Rdali, M. A quantitative method for opinion ratings and analysis: An event study. Ann. Oper. Res. 2021. [Google Scholar] [CrossRef]
  23. Chen, X.; Qi, J.; Zhu, X.; Wang, X.; Wang, Z. Unlabelled text mining methods based on two extension models of concept lattices. Int. J. Mach. Learn. Cyber. 2020, 11, 475–490. [Google Scholar] [CrossRef]
  24. Yu, C.; Zuo, Y.; Feng, B.; Au, L.; Chen, B. An individual-group-merchant relation model for identifying fake online reviews: An empirical study on a Chinese e-commerce platform. Inf. Technol. Manag. 2019, 20, 123–138. [Google Scholar] [CrossRef]
  25. Hajek, P.; Olej, V.; Myskova, R. Forecasting corporate financial performance using sentiment in annual reports for stakeholders’ decision-making. Technol. Econ. Dev. Econ. 2014, 20, 721–738. [Google Scholar] [CrossRef]
  26. Gajzler, M. Text and data mining techniques in aspect of knowledge acquisition for decision sup-port system in construction industry. Technol. Econ. Dev. Econ. 2010, 16, 219–232. [Google Scholar] [CrossRef] [Green Version]
  27. Rönnqvist, S.; Sarlin, P. Bank distress in the news: Describing events through deep learning. Neurocomputing 2017, 264, 57–70. [Google Scholar] [CrossRef] [Green Version]
  28. Huotari, T.; Savolainen, J.; Collan, M. Deep Reinforcement Learning Agent for S&P 500 Stock Selection. Axioms 2020, 9, 130. [Google Scholar]
  29. Too, J.; Abdullah, A.R.; Mohd Saad, N. Hybrid Binary Particle Swarm Optimization Differential Evolution-Based Feature Selection for EMG Signals Classification. Axioms 2019, 8, 79. [Google Scholar] [CrossRef] [Green Version]
  30. Vijayarani, J.; Geetha, T.V. Joint learning of author and citation contexts for computing drift in scholarly documents. Int. J. Mach. Learn. Cyber. 2021, 12, 1667–1686. [Google Scholar] [CrossRef]
  31. Cambria, E.; White, B. Jumping NLP curves: A review of natural language processing research. IEEE Comput. Intell. Mag. 2014, 9, 48–57. [Google Scholar] [CrossRef]
  32. Gross, A.; Murthy, D. Modeling virtual organizations with Latent Dirichlet Allocation: A case for natural language processing. Neural Netw. 2014, 58, 38–49. [Google Scholar] [CrossRef]
  33. Tetlock, P.C. Giving Content to Investor Sentiment: The Role of Media in the Stock Market. J. Financ. 2007, 62, 1139–1168. [Google Scholar] [CrossRef]
  34. Tetlock, P.C.; Saar-Tsechansky, M.; Macskassy, S. More than Words: Quantifying Language to Measure Firms’ Fundamentals. J. Financ. 2008, 63, 1437–1467. [Google Scholar] [CrossRef]
  35. Wang, Z.; Shao, Y.H.; Bai, L.; Li, C.N.; Liu, L.M.; Deng, N.Y. Insensitive stochastic gradient twin support vector machines for large scale problems. Inf. Sci. 2018, 462, 114–131. [Google Scholar] [CrossRef] [Green Version]
  36. Liu, L.; Li, P.; Chu, M.; Cai, H. Stochastic gradient support vector machine with local structural information for pattern recognition. Int. J. Mach. Learn. Cyber. 2021. [Google Scholar] [CrossRef]
  37. Hu, K.H.; Lin, S.J.; Hsu, M.F.; Chen, F.H. A dynamic network-based decision architecture for performance evaluation and improvement. J. Intell. Fuzzy Syst. 2020, 39, 4299–4311. [Google Scholar] [CrossRef]
  38. Hu, K.-H.; Chen, F.-H.; Hsu, M.-F.; Yao, S.; Hung, M.-C. Identification of the Critical Factors for Global Supply Chain Management under the COVID-19 Outbreak via a Fusion Intelligent Decision Support System. Axioms 2021, 10, 61. [Google Scholar] [CrossRef]
  39. Hua, Z.; Wang, Y.; Xu, X.; Zhang, B.; Liang, L. Predicting corporate financial distress based on integration of support vector machine and logistic regression. Expert Syst. Appl. 2007, 33, 434–440. [Google Scholar] [CrossRef]
  40. Wilson, R.; Sharda, R. Bankruptcy prediction using neural networks. Decis. Support Syst. 1994, 11, 545–557. [Google Scholar] [CrossRef]
  41. Ross, S.A.; Westerfield, R.W.; Jordan, B.D. Corporate Finance; McGraw-Hill-Irwin: New York, NY, USA, 2002. [Google Scholar]
  42. Geng, R.; Bose, I.; Chen, X. Prediction of financial distress: An empirical study of listed Chinese companies using data mining. Eur. J. Oper. Res. 2015, 241, 236–247. [Google Scholar] [CrossRef]
  43. Martin, D. Early warning of bank failure: A logit regression approach. J. Bank. Financ. 1977, 1, 249–276. [Google Scholar] [CrossRef]
  44. Ohlson, J.A. Financial ratios and the probabilistic prediction of bankruptcy. J. Account. Res. 1980, 18, 109–131. [Google Scholar] [CrossRef] [Green Version]
  45. Kolari, J.; Glennon, D.; Shin, H.; Caputo, M. Predicting large US commercial bank failures. J. Econ. Bus. 2002, 54, 361–387. [Google Scholar] [CrossRef]
  46. Shirata, C.Y.; Takeuchi, H.; Ogino, S.; Watanabe, H. Extracting key phrases as predictors of corporate bankruptcy: Empirical analysis of annual reports by text mining. J. Emerg. Technol. Account. 2011, 8, 31–44. [Google Scholar] [CrossRef] [Green Version]
  47. Henry, E. Are investors influenced by how earnings press releases are written? Int. J. Bus. Commun. 2008, 45, 363–407. [Google Scholar] [CrossRef]
  48. Holsti, O.R. Content Analysis for the Social Sciences and Humanities; Addison Wesley: Reading, MA, USA, 1969. [Google Scholar]
  49. Fisher, I.E.; Garnsey, M.R.; Goel, S.; Tam, K. The role of text analytics and information retrieval in the accounting domain. J. Emerg. Technol. Account. 2010, 7, 1–24. [Google Scholar] [CrossRef] [Green Version]
  50. Smith, J.E.; Smith, N.P. Readability: A measure of performance of the communication function of financial reporting. Account. Rev. 1971, 46, 552–556. [Google Scholar]
  51. Healy, P. Can you understand the footnotes to financial statements? Account. J. 1977, 56, 219–222. [Google Scholar]
  52. Li, F. Annual report readability, current earnings, and earnings persistence. J. Account. Econ. 2008, 45, 221–247. [Google Scholar] [CrossRef]
  53. Goel, S.; Gangolly, J.; Faerman, S.R.; Uzuner, O. Can linguistic predictors detect fraudulent financial filings? J. Emerg. Technol. Account. 2010, 7, 25–46. [Google Scholar] [CrossRef]
  54. Bowman, E.H. Content analysis of annual reports for corporate strategy and risk. Interfaces 1984, 14, 61–71. [Google Scholar] [CrossRef]
  55. Bodnaruk, A.; Loughran, T.; McDonald, B. Using 10-K text to gauge financial constraints. J. Financ. Quant. Anal. 2015, 50, 623–646. [Google Scholar] [CrossRef] [Green Version]
  56. Yang, T.N.; Wang, S.D. Robust algorithms for principal component analysis. Pattern Recognit. Lett. 1999, 20, 927–933. [Google Scholar] [CrossRef]
  57. Xu, L.; Yuille, A.L. Robust principal component analysis by self-organizing rules based on statistical physics approach. IEEE Trans. Neural Netw. 1995, 6, 131–143. [Google Scholar]
  58. Bezdek, J.C. Pattern Recognition with Fuzzy Objective Function Algoritms; Plenum Press: New York, NY, USA, 1981. [Google Scholar]
  59. Ren, L.H.; Ye, Z.F.; Zhao, Y.P. A modeling method for aero-engine by combining stochastic gradient descent with support vector regression. Aerosp. Sci. Technol. 2020, 99, 105775. [Google Scholar] [CrossRef]
  60. Roy, J.; Pamučar, D.; Kar, S. Evaluation and selection of third party logistics provider under sustainability perspectives: An interval valued fuzzy-rough approach. Ann. Oper. Res. 2020, 293, 669–714. [Google Scholar] [CrossRef]
  61. Rajesh, R. Sustainability performance predictions in supply chains: Grey and rough set theoretical approaches. Ann. Oper. Res. 2020. [Google Scholar] [CrossRef]
  62. Banker, R.D.; Charnes, A.; Cooper, W.W. Some Models for Estimating Technical and Scale Inefficiencies in Data Envelopment Analysis. Manag. Sci. 1984, 30, 1078–1092. [Google Scholar] [CrossRef] [Green Version]
  63. Tone, K.; Tsutsui, M. Network DEA: A slacks-based measure approach. Eur. J. Oper. Res. 2009, 197, 243–252. [Google Scholar] [CrossRef] [Green Version]
  64. Xu, X.; Wang, Y. Financial failure prediction using efficiency as a predictor. Expert Syst. Appl. 2009, 36, 366–373. [Google Scholar] [CrossRef]
  65. Cook, W.D.; Tone, K.; Zhu, J. Data envelopment analysis: Prior to choosing a model. Omega 2014, 44, 1–4. [Google Scholar] [CrossRef]
  66. Golany, B.; Roll, Y. An Application Procedure for DEA. Omega 1989, 1, 237–250. [Google Scholar] [CrossRef]
  67. Chen, X.; Dai, Q.; Na, C. The value of enterprise information systems under different corporate governance aspects. Inf. Technol. Manag. 2019, 20, 223–247. [Google Scholar] [CrossRef]
  68. Lucanera, J.P.; Fabregat-Aibar, L.; Scherger, V.; Vigier, H. Can the SOM Analysis Predict Business Failure Using Capital Structure Theory? Evidence from the Subprime Crisis in Spain. Axioms 2020, 9, 46. [Google Scholar] [CrossRef]
  69. Hsu, M.F. A fusion mechanism for management decision and risk analysis. Cybern. Syst. 2019, 50, 497–515. [Google Scholar] [CrossRef]
  70. Mario, I.T.; Brenda, V.; Julia, G. Organizational Diseases. Cybern. Syst. 2020, 51, 615–630. [Google Scholar]
  71. Blei, D.; Ng, A.; Jordan, M. Latent Dirichlet allocation. J. Mach. Learn. Res. 2003, 3, 993–1022. [Google Scholar]
  72. Skowron, A.; Rauszer, C. The Discernibility Matrices and Functions in Information Systems. In Intelligent Decision Support. Theory and Decision Library; Series D: System Theory, Knowledge Engineering and Problem Solving; Słowiński, R., Ed.; Springer: Dordrecht, The Netherlands, 1992; Volume 11, pp. 331–362. [Google Scholar]
  73. Lu, W.M.; Kweh, Q.L.; Wang, C.W. Integration and application of rough sets and data envelopment analysis for assessments of the investment trusts industry. Ann. Oper. Res. 2021, 296, 163–194. [Google Scholar] [CrossRef]
  74. Huang, A.; Zang, A.; Zheng, R. Evidence on the information content of text in analyst reports. Account. Rev. 2014, 89, 2151–2180. [Google Scholar] [CrossRef] [Green Version]
  75. Cai, Y.; Yang, K.; Huang, D.; Zhou, Z.; Lei, X.; Xie, H.; Wong, T.L. A hybrid model for opinion mining based on domain sentiment dictionary. Int. J. Mach. Learn. Cybern. 2019, 10, 2131–2142. [Google Scholar] [CrossRef]
  76. Dridi, A.; Atzeni, M.; Reforgiato Recupero, D. FineNews: Fine-grained semantic sentiment analysis on financial microblogs and news. Int. J. Mach. Learn. Cyber. 2019, 10, 2199–2207. [Google Scholar] [CrossRef]
  77. Ibtihel, B.L.; Lobna, H.; Lotfi, B.R. Hybrid Deep Neural Network-Based Text Representation Model to Improve Microblog Retrieval. Cybern. Syst. 2020, 51, 115–139. [Google Scholar]
  78. Du Jardin, P. Forecasting bankruptcy using biclustering and neural network-based ensembles. Ann. Oper. Res. 2021, 299, 531–566. [Google Scholar] [CrossRef]
Figure 1. The introduced advanced decision making framework.
Axioms 10 00179 g001
Figure 2. The number of topics determination via LDA.
Axioms 10 00179 g002
Table 1. The input and output variables.
Input VariablesOutput Variables
SymbolDescriptionSymbolDescription
Input (1): TATotal assetsOutput (1): TSTotal sales
Input (2): NOENumber of employeesOutput (2): GMGross margin
Input (3): FAFixed assetsOutput (3): NINet income
Input (4): COGSCost of goods soldOutput (4): EPSEarnings per share
Input (5): TDTotal debts
Table 2. The results of Pearson correlation.
SymbolTANOEFACOGSTDTSGMNIEPS
TA10.829 **0.870 **0.856 **0.962 **0.908 **0.862 **0.765 **0.105
NOE0.829 **10.490 **0.946 **0.922 **0.939 **0.461 **0.313 **0.033
FA0.870 **0.490 **10.501 **0.713 **0.593 **0.969 **0.940 **0.109 *
COGS0.856 **0.946 **0.501 **10.959 **0.993 **0.498 **0.354 **0.034
TD0.962 **0.922 **0.713 **0.959 **10.983 **0.705 **0.579 **0.065
TS0.908 **0.939 **0.593 **0.993 **0.983 **10.594 **0.458 **0.051
GM0.862 **0.461 **0.969 **0.498 **0.705 **0.594 **10.979 **0.151 **
NI0.765 **0.313 **0.940 **0.354 **0.579 **0.458 **0.979 **10.147 **
EPS0.1050.0330.109 *0.0340.0650.0510.151 **0.147 **1
* denotes at 10% significance level; ** denotes at 5% significance level; *** denotes at 1% significance level.
Table 3. The comparison outcomes of two models.
ConditionCD-DEAFRPCA + CD-DEA
Total number of DMUs400400
Maximum efficiency11
Number of efficiency DMUs3817
Percent of efficient DMUs9.54.25
Average performance score0.630.47
Standard deviation (S.D.)0.110.15
Table 4. The comparison outcomes of two models in different scenarios.
ModelCD-DEAFRPCA + CD-DEA
MeanS.D.MeanS.D.
Eliminating 20% of the data0.670.110.490.14
Eliminating 40% of the data0.710.080.530.13
Eliminating 60% of the data0.760.070.590.11
Eliminating 80% of the data0.780.060.610.10
Table 5. The predictors.
SymbolDescription
X1: TL/TATotal liabilities to total assets
X2: CA/CLCurrent assets to current liabilities
X3: EBIT/IEEarnings before interest and tax to interest expense
X4: NP/TSNet profit to total sales
X5: GM/TSGross margin to total sales
X6: TS/TATotal sales to total assets
X7: NP/SENet profit to shareholders’ equity
X8: FA/TAFixed assets to total assets
X9: NP/OSNet profit to outstanding shares
X10: NPGRNet profit growth rate
Table 6. The word list for each topic (Top 10 words).
Topic
Operation RelatedBusiness Strategy-RelatedStock Market-RelatedEnvironmental Protection-RelatedCorporate Governance-Related
profitdevelopmentgrowthprotectionresponsibility
gainefficiencydeclinecontinuedividend policy
reduceprospectdecreasesustainabilitycapital expenditure
efficiencyLay offprofitabilityemissionRemuneration committee
promoteperformanceprofitlawsuitaudit
reducecreativereduceriskgovernance
growthriskpromotepenaltyinternal control
declineuncertaintymodificationsafeduality
shockliquidityvolumeenergy savedisclosure
lossseveranceuncertaintyreducetransparency
Table 7. The predictors.
Symbol■: Selected; □: Unselected
Numerical messages
PC1■: Selected
PC2■: Selected
PC3■: Selected
PC4■: Selected
PC5■: Selected
Topic-based sentimental messages
S1: Operation related■: Selected
S2: Business strategy-related■: Selected
S3: Stock market-related■: Selected
S4: Environmental protection-related□: Unselected
S5: Corporate governance-related□: Unselected
Table 8. The outcomes of comparison (Accuracy) (Type I error) (Type II error).
Condition1: With Topic-Based Sentimental Messages2: Without Topic-Based Sentimental Messages
CV-1(83.75) (10.67) (19.60)(76.25) (14.67) (29.20)
CV-2(86.50) (11.33) (14.80)(68.00) (24.00) (36.80)
CV-3(85.00) (12.00) (16.80)(70.00) (20.00) (36.00)
CV-4(85.50) (13.33) (15.20)(66.75) (21.33) (40.40)
CV-5(86.25) (10.00) (16.00)(77.25) (12.67) (28.80)
Average(85.40) (11.47) (16.48)(71.65) (18.53) (34.24)
Table 9. The outcomes of comparison.
Performance Measure: Accuracy (Rank)Friedman Test
Benchmark (85.40) (1) >> RVM (78.25) (2) >> ELM (72.20) (3) >> BPNN (67.45) (4)0.000
Performance measure: 100-Type I error (Rank)
Benchmark (88.53) (1) >> RVM (82.13) (2) >> ELM (72.27) (3) >> BPNN (69.87) (4)0.003
Performance measure: 100-Type II error (Rank)
Benchmark (83.52) (1) >> RVM (75.92) (2) >> ELM (72.16) (3) >> BPNN (66) (4)0.000
Table 10. The outcomes of comparison under four situations.
Situation 1: Eliminating 20% of the data
Accuracy: Benchmark (81.50) >> RVM (78.75) >> ELM (77.05) >> BPNN (75.75)
100-Type I error: Benchmark (81.00) >> RVM (80.05) >> ELM (78.00) >> BPNN (77.00)
100-Type II error: Benchmark (82.00) >> RVM (77.00) = ELM (77.00) >> BPNN (74.50)
Situation 2: Eliminating 40% of the data
Accuracy: Benchmark (77.75) >> ELM (75.75) >> RVM (71.75) >> BPNN (69.75)
100-Type I error: Benchmark (78.00) >> ELM (77.50) >> RVM (74.50) >> BPNN (72.00)
100-Type II error: Benchmark (77.50) >> ELM (74.00) >> RVM (69.00) >> BPNN (67.50)
Situation 3: Eliminating 60% of the data
Accuracy: Benchmark (73.75) >> ELM (70.75) >> RVM (67.75) >> BPNN (65.75)
100-Type I error: Benchmark (74.00) >> ELM (72.50) >> RVM (70.50) >> BPNN (69.00)
100-Type II error: Benchmark (73.50) >> ELM (69.00) >> RVM (65.00) >> BPNN (62.50)
Situation 4: Eliminating 80% of the data
Accuracy: Benchmark (68.00) >> ELM (67.50) >> RVM (62.00) >> BPNN (60.50)
100-Type I error: Benchmark (65.00) >> ELM (64.00) >> RVM (59.00) >> BPNN (57.00)
100-Type II error: Benchmark (71.00) = ELM (71.00) >> RVM (65.00) >> BPNN (64.00)
Publisher’s Note: MDPI stays neutral with regard to jurisdictional claims in published maps and institutional affiliations.

