Article

An Application of the Super-SBM MAX and LTS(A,A,A) Models to Analyze the Business Performance of Hydropower Suppliers in Vietnam

Department of Economics-Business Administration, Thanh Dong University, Hai Duong 171960, Vietnam
*
Authors to whom correspondence should be addressed.
Submission received: 3 May 2022 / Revised: 13 May 2022 / Accepted: 18 May 2022 / Published: 20 May 2022
(This article belongs to the Special Issue Mathematical Analysis for Financial Modelling)

Abstract

:
As Vietnam continues to industrialize and modernize, such economic development and high-tech will require a major electrical energy source to operate the electrical equipment; hence, the hydropower plants are established and growing up to demand. Therefore, the purpose of this study is to evaluate the business performance of Vietnamese hydropower suppliers by integrating the LTS(A,A,A) model of the Additive Holt-winters method in Tableau and a super-slacks-based measure (super-SBM) max model in data envelopment analysis (DEA). The LTS(A,A,A) model is applied to forecast future valuation from 2022 to 2025 based on historical time series from 2012 to 2021. Next, with the actual and predicted data, the researcher uses the super-SBM max model to calculate the business performance of these hydropower suppliers from past to future. The empirical result reveals efficient and inefficient cases to explore which hydropower suppliers can achieve the business performance in their operational process. The position of hydropower suppliers in Vietnam from past to future time is determined particularly based on their scores every year. Further, the empirical result recommends a solution to deal with inefficient cases by deducting the input excesses and raising the output shortages based on the principle of the super-SBM Max model in DEA. The finding results create an overview of the operational process with the continuing variations in each period to equip hydropower suppliers in Vietnam which will determine their future and operational orientation.

1. Introduction

Hydropower energy is derived from water that falls from a high to a low position. As the water is carried downhill through a turbine (flow), the vertical drop (head) creates pressure at the bottom end of the pipeline. Therefore, it is generated by water and is a renewable energy source and a clean energy source. Hydropower energy is a renewable energy source [1], which is low in cost; thus, the development of various hydropower plants all over the world is increasing to meet economic growth [2]. Some countries create policies, objects, and directions to enhance different hydropower plants [3,4]. In Vietnam, for example, the construction of hydropower plants has increased with a total capacity of installed units of 15.999 MW in 2018. Thus, the electricity sector in Vietnam is expanding, and hydropower plays a key role as an inevitable economic element [5]. The main task of the electricity industry is to provide an energy source to operate electrical installations. Carol and Leon (2013) [6] revealed that the first hydropower plant was built in 1878. Additionally, hydropower energy is low-cost and available in nature [7]. Therefore, many hydropower plants of the small, medium, and large scale have been built and operated around the world, such as in Valara, India [8]; sub-Saharan Africa [9]; China [10]; and so on. In Vietnam, hydropower plants have been built to provide electricity to households and factories. The first hydropower plant in Vietnam is the Suoi Vang hydropower plant, being built in 1942 that’s located in Lam Dong province.
Accompanied by economic growth, the electricity industry in Vietnam has achieved sustainable development to provide a large electrical energy source. The purpose of this study is to compute the business efficiency scores of hydropower suppliers in Vietnam from past to future based on the financial indicators via integration of the LTS(A,A,A) model in the Tableau and super-SBM max model in DEA; it then recommends a solution to deal with inefficient terms. Additionally, the theoretical concepts will provide an overview of the hydropower plant and its sustainable development goals, reflecting the importance of the environmental and social dimensions. The empirical result discovers an overall picture of the electricity industry in Vietnam, whereas the LTS(A,A,A) model is used for predicting future data because it can present a high prediction value based on the historical time series and indicators such as alpha, beta, gamma, and mean absolute percentage error (MAPE). Then the super-SBM max model is employed to conduct efficiency scores with maximum and separate values [11] in efficient terms. Thus, based on these characteristics of the super-SBM model, the study utilizes this model to measure the efficiency and determine the position of Vietnamese hydropower suppliers every year during the period of 2012–2025. The empirical results propose a meaningful value for Vietnamese hydropower suppliers to have a direction in the future.
The remainder of this research comprises five sections. Section 1 discusses typical hydropower energy and the current status of hydropower plants in Vietnam and offers an overview of hydropower plants, along with significant characteristics of the LTS(A,A,A) model and super-SBM max model. Section 2 gives the data source and sets up the mathematical equations of the LTS(A,A,A) model and super-SBM model. Section 3 points out the empirical result and discusses the key results. Section 4 discusses the findings and implications for practice. Section 5 reviews the main contents and offers suggestions for future research.

2. Materials and Methods

2.1. Theoretical Framework

Hydropower has an important role in achieving sustainable development to ensure access to affordable, reliable, sustainable, and modern energy services; hence, it will enhance the investment in energy infrastructure and clean energy technology to increase sustainable energy service. The fuel cost of hydropower plants is lower than fossil-fuel plants. Hydropower plants provide renewable energy supply by immediately generating power for the grid when replying to the water cycle and low-cost electricity and durability than other energy sources. IEA [12] revealed that the technical potential for hydropower development is growing up around the world, and some countries have the largest developed proportion of the hydropower potential, such as Switzerland at 88%, Mexico at 80%, and Norway at 70%.
Much previous research has investigated the efficiency of hydropower. For example, Wang et al. (2014) [13] evaluated the efficiency of hydropower generation in Canada by using the technique for order preference via the similarity to the ideal solution method. Chang et al. (2017) [3] demonstrated the efficiency of hydropower station operation in the Yellow River based on the evaluation method of three indexes, including relative water consumption rate, relative hydropower utilization rate, and relative hydropower utilization increasing rate. In this research, to forecast the future and evaluate the business performance of the operational process of hydropower plants in Vietnam, the study combines the LTS(A,A,A) and super-SBM max models. A business efficiency will have a good measurement result by calculating the financial indicators because the transformation of labour, capital, etc. into services and products produces revenue. Therefore, the business performance of Vietnamese hydropower suppliers is calculated based on the historical time series of factors, including assets, owner’s equity, employee, net revenue, and gross profit.
Tableau is data visualization software that analyzes large data through a visual interface [14]. This software does not need to write code that connects directly to available data in the cloud to create forecasts, trend analysis, regression, and correlation [15]. Whereas the forecast function integrates exponential smoothing, the estimated data are predicted based on historical time series and checked by an accurate prediction tool, including full parameters and performance [16]. Further, exponential smoothing is a popular forecast technique with weighted values of past series data for calculating the immediate future for time series data [17]. Several previous papers have used exponential smoothing for predicting future data, such as forecasted weather in the Aced Besar District [18], and Lahore, Pakistan [19], Vietnamese port logistics [20]. Exponential smoothing is a predicted method that presents various models; this research utilizes the LTS(A,A,A) model in the Holt-Winters method with level, trend, and seasonality to forecast future hydropower suppliers in Vietnam. When receiving all historical and future data, the study approaches the super-SBM max model in DEA to evaluate the performance operation.
DEA is an analysis statistic program that approaches linear programming and nonparametric to measure a comparable set in decision-making units (DMUs [21]. Charnes, Cooper, and Rhodes introduced the first model of DEA in 1978, which presented a ratio of input factors and output factors under the condition of constant return to scale [22]. Up to now, the DEA method has developed and exhibited various models, such as a slacks-based measure, resampling, etc., to measure performance and rank DMUs based on calculating the ratio of input variables and output variables. Khodabakhshi and Aryavash (2012) [23] used the DEA method to discover the minimum and maximum efficiency scores of each DMU, and then determine the position of each DMU. Zanboori et al. (2014) [24] calculated efficiency scores and ranged the units when applying the super efficiency. Le and Wang (2018) [25] computed the future macroeconomic efficiency among developed countries and Asian developing countries via the resampling model. Wu, Yao, and Zhang (2020) [26] used the DEA method to indicate the efficiency of future research institutes in China. The DEA approach calculated the managerial efficiency of 30 insurance companies in Saudi Arabia. Mai, Nguyen, and Vu (2020) [27] applied the DEA method to evaluate the technical efficiency of Vietnamese garment firms and discover productivity changes. Therefore, the super-SBM max model is an excellent method to assess efficiency because it can present different scores to distinguish the efficiency and position of each DMU. This model also describes a maximum distance point for the best DMU and the minimum distance point on the frontiers for an efficient DMU [28]. In contrast, other models, including CCR, Slacks-Based Measure (SBM), etc. compute the highest score as 1; thus, they only figure out efficient terms with the same score and cannot determine the best DMU. In professional version 15 of DEA-Solver-PRO, the super-efficiency introduced a new approach with the supermax efficiency that provides different values and maximum values to evaluate the supper-efficiency of efficient DMUs.

2.2. Research Framework

The research process of forecasting and conducting the performance of hydropower plants in Vietnam has four steps, as shown in Figure 1.
Step 1. The study defines objective research, input, and output variables. The historical time series of input and output factors of hydropower plants in Vietnam from 2012 to 2021 were selected and gathered from Vietstock (2022) [29]. Next, the study introduces the current status of hydropower in Vietnam and then gives an overview of theoretical research of hydropower energy sources, i.e., LTS(A,A,A) in Tableau and the super-SBM max model in DEA.
Step 2. When all historical time series are gathered, the LTS(A,A,A) model in Tableau is applied to forecast the future time. All estimated values must ensure the condition of parameters, including alpha, beta, and gamma. Moreover, these forecasting values must check the mean absolute percentage error (MAPE) to obtain high accuracy. The appreciated values are used for the next steps, and the unsuitable values must be removed and reselected as input and output factors.
Step 3. Before applying the super-SBM max model to calculate the performance of hydropower from past to future, all data must test the Pearson correlation because the input and output variables in DEA must ensure “isotonic”. The Pearson correlation must be from −1 to +1, and the unsuitable input and output factors must be reselected if they do not range from −1 to +1. Then, all appreciated values seek out the business efficiency and position of each hydropower plant in Vietnam.
Step 4. Reviewing the findings of business performance and valuable methods. Some implications for the practice of this paper are conducted.
Step 5. All significant forecasting results and conducting the performance of hydropower plants in Vietnam from past to future time are recaptured. Some recommendations for inefficient cases are suggested to improve the efficiency score in the future time.

2.3. Materials

From the rule of DEA and Tableau, the data comprise input variables and output variables covering a long historical time series. The researcher selected and collected the input and output data of nine hydropower suppliers from 2012 to 2021 to evaluate the business performance of Vietnam’s hydropower suppliers through the financial statement posted on Vietstock (2022) [29]. Names, abbreviate, and locations of the hydropower plants are shown in Table 1. These nine hydropower plants have the essential information posted on Vietstock to be suitable for LTS(A,A,A) and super-SBM Max models’ requirements.
The financial efficiency of an operation process is conducted via parameters of financial reports, including assets, capitalization, owner’s equity, net revenue, and so on. Therefore, the study chose three inputs, including assets, owner’s equity, and employee and two outputs, including net revenue and gross profit.
Input Factors:
Assets (AS): All tangible and intangible assets that the company manages and owns.
Owner’s equity (OE): Total tangible and intangible assets of a supplier minus liabilities.
Employee (EM): Total workers are working in a company hiring to perform the operational process of the enterprise.
Output Factors:
Net revenue (NR): The income of a supplier is derived from selling electricity to customers.
Gross profit (GP): Valued revenue conducts the cost of goods sold.
The above variables are important financial factors that describe the real business of an enterprise. These factors are used to predict the business status in the future term and compute the performance economics in the whole term.
With the above-collected names, their historical data were gathered from Vietstock (2022) over the period of 2012–2021 and summarized, as shown in Table 2.
Table 2 recaptured the summarized actual data of nine Vietnamese hydropower suppliers from 2012 to 2021. The maximum value of AS, OE, NR, and GP during the period of 2012–2021 was achieved as 10,016,612; 4,010,451; 1,611,214; and 814,905 (Million Vietnam Dong), respectively, and the maximum value of EM during the period of 2012–2021 was 322 employees. The minimum value of AS, OE, NR, and GP during the period of 2012–2021 was 79,332; 72,551; 28,860; and 17,846 (Million Vietnam Dong), respectively, and the minimum value of EM during the period of 2012–2021 was 24 employees. These actual data were positive values so that all input and output variables were appreciated to be used for forecasting the future data through LTS (A,A,A) model in Tableau and calculating efficiency through the super-SBM Max model in DEA.

2.4. Methods

2.4.1. LTS(A,A,A) Model

The LTS model in Tableau focuses on the level, trend, and seasonal components; it also approaches the historical time series to estimate future situations. Setting up the units of hydropower suppliers in Vietnam is DMU0, which uses the initial time series ( I t , I t + 1 , I t + n ( t = 0 , 1 , 2 , ) ) and the predicted time series ( P t , P t + 1 , P t + n ( t = 0 , 1 , 2 , ) ) , whereas t represents the time, and n is the number of periods in the forecast lead-time. The model identifies with Holt’s linear method of simple exponential smoothing, which is integrated into Tableau, the consequence of actual and predicted time begins at point t equaling 0. Thus, the primary equation of exponential smoothing is given as follows.
I 0 = P 0
Beverton and Holt (1957) [30] presented an extended method of simple exponential smoothing. The point estimation of the additive component is equal to the median of the forecast distribution because the median is equal to the mean. In the additive case, the smoothing coefficient has a level as α, a trend as β, seasonality as γ, the number of seasons as m, step ahead forecasts as d, number of complete years in the predicted period prior to time (the integer part of h 1 / m )as g. The state, slope component, and seasonal component are l t , b t , s t , respectively.
The state is calculated:
l t = α ( P t S t m ) + ( 1 α ) l t 1 + b t 1 ) / ( 0 α 1 )
The slope component is determined:
b t = β ( l t l t 1 ) + ( 1 β ) b t 1 / ( 0 β 1 )
The seasonal component is given:
S t = γ ( P t l t 1 b t 1 ) + ( 1 γ ) S t m / ( 0 γ 1 )
Finally, the forecasted valuation is calculated:
P ¯ t = l t + d b t + S t m + ( g + 1 )
Besides, the forecasted values must be retested to ensure accuracy through the mean absolute percentage error (MAPE) indicator as below:
M A P E = 100 n t 1 n | P t I t P t |
According to Lewis (1982) [31], the predicted values will be accepted when the MAPE is under 50%, and they are unappreciated when the MAPE is higher than 50%. The data or model needs reelection if the future data receives an unacceptable MAPE. Hence, the estimated method in Tableau checks quality metrics and smoothing coefficients [32] to measure the accuracy level.

2.4.2. Super Slacked-Based Measure Max Model

Tone (2002) [33] exhibited the super-efficiency to assess the performance of an efficient DMU referring to the nearest point. Then, the author modified and combined the SBM max model and super-SBM model, which formed the super-SBM max model to express the nearest frontier point. DMU is set up in Section 2.3; each DMU has e inputs and s outputs. The input vector is x j = ( x 1 j , x 2 j , x e j ) T , and the output vector is b j = ( b 1 j , b 2 j , , b s j ) T . All data must be positioned; the metrics A and B are defined below.
A = ( a 1 , a 2 , , a n ) R e × n B = ( b 1 , b 2 , , b n ) R s × n
The production possibility set is determined by:
P = { a , b }
Whereas
a j = 1 n λ j a j , 0 b j = 1 n λ j b j , λ 0
The equation of the super SBM max model is built up as below steps.
Step 1. Calculate the SBM min efficiency.
ρ 0 min = min λ , s , s + 1 1 e i = 1 e s i x i o 1 + 1 s r = 1 s s r + b r o
Subject to
a i o = j = 1 n a ij λ j + s i ( i = 1 , . . . e ) ; b r o = j = 1 n b r j λ j s r + ( r = 1 , , s ) ; λ j 0 ( j ) , s i 0 ( i ) , s r + 0 ( r ) .
Step 2. The efficient DMUs are called ( a 1 c f f , b 1 c f f ) , ( a n c f f , b n c f f ) . The set R c f f of all efficient DMUs. is determined:
R c f f = { j | ρ j min = 1 , j = 1 , , n } .
Step 3. The inefficient DMU defines the local reference set R 0 l o c a l by:
R 0 l o c a l = { j | λ j * > 0 , j = 1 , , n } .
Step 4. The pseudo min score of the inefficient DMU is estimated:
[ P s e u d o 1 ] ρ 0 min = max 1 1 e i = 1 e s i o a i o 1 + 1 s r = 1 s s r + b r o
Step 5. Set the optimal slacks, the Pseudo min score is counted:
[ P s e u d o 2 ] ρ 0 * = min 1 1 e i = 1 e s i o a i o s i * 1 + 1 s r = 1 s s r + b r o + s r + *
Subject to
a o s * = j = R e f f a j c f f λ j + s ; b o + s + * = j R e f f b j c f f λ j s + ; s , s + , λ 0 .
Step 6. Set the optimal slacks, and the pseudo-max score is calculated:
[ P s e u d o Max ] ρ o p s e u d o max = 1 1 e i = 1 e s i o * + s i o * * a i o 1 + 1 s r = 1 s s r + * + s r + * * b r o
Step 7. In the inefficient case, the distance between ( a 0 , b 0 ) is defined:
d h = i = 1 e | a i h c f f a i o | a i o + i = 1 s | b i h c f f b i o | b i o .
Step 8. The slacks are found out when the score of the inefficient DMU is solved by:
d h = i = 1 e | a i h c f f a i o | a i o + i = 1 s | b i h c f f b i o | b i o .
The program is infeasible when ρ o h * = 10 .
The optimal objective value is 1 and ρ o h * = 1 , the DMU expresses a non-negative combination of DMU.
If the optimal objective value is smaller than 1, the variables ( λ , s , s + ) need to deal with again.
Step 9. The max-score of inefficient DMU is determined:
ρ o max = max { ρ o A d j u s t e d R a d i a l , ρ o pseudo max , ρ o 1 * , , ρ o c f f * } .
where ρ o A d j u s t e d R a d i a l denotes that the max-score is comprised by the radial model.
Step 10. Combining the super efficiency and SBM max model, the mathematics of the super SBM max model is given by:
δ * = min λ , s , s + 1 + 1 e i = 1 e s i a i o 1 1 s r = 1 s s r + b r o
Subject to
a o = j = 1 , j 0 n a j λ j s ; b o = j = 1 , j 0 n b j λ j + s + ; λ 0 , s 0 , s + 0 .
Tone (2017) [28] introduced the super-SBM max model. The final results present the inefficient DMU with scores under one and the efficient DMU with above one. Moreover, each efficient case will have a separate efficiency; it is also convenient to range DMUs. For inefficient cases, a feasible solution is to increase outputs and decrease inputs, which will help inefficient DMUs to improve their performance.

3. Results

3.1. Estimated Valuation

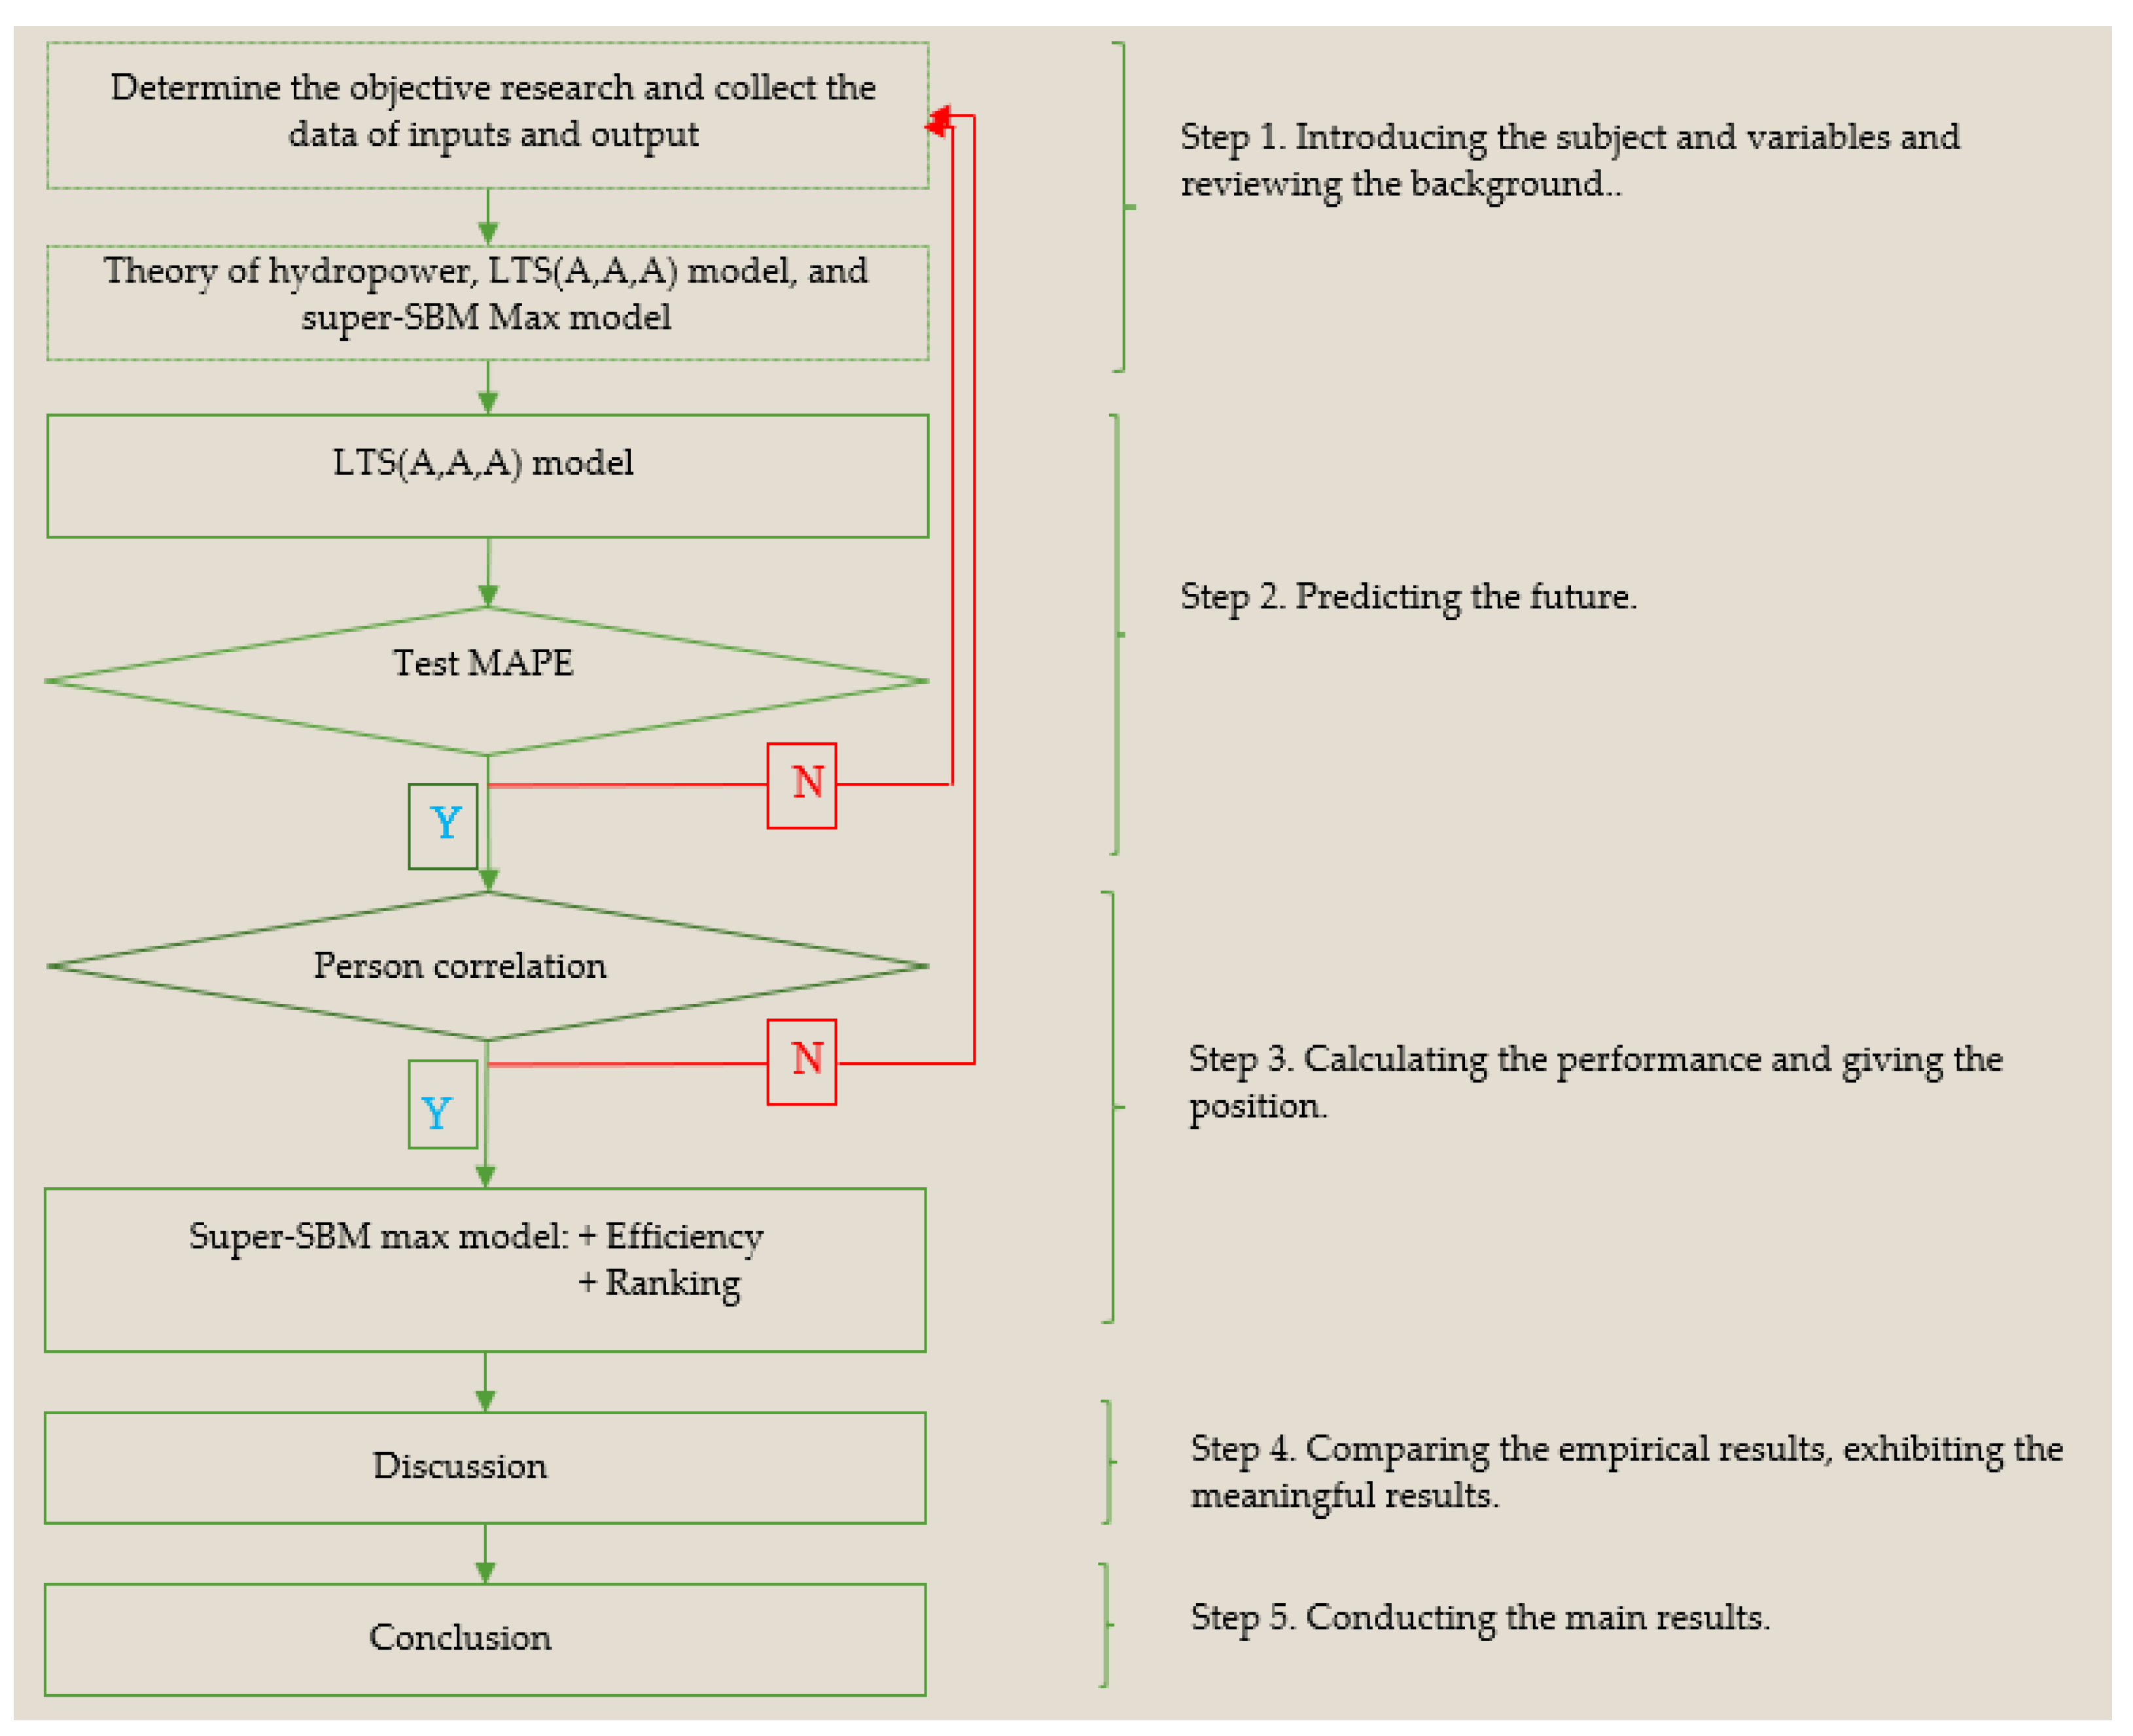
The integration of the LTS(A,A,A) model in Tableau and the super-SBM Max model in DEA measures the business efficiency of Vietnamese hydropower suppliers from past to future. The data of nine Vietnamese hydropower suppliers from 2012 to 2021 in Table 2 estimate future values from 2022 to 2025 using the LTS(A,A,A) model in Tableau. Each exponential smoothing model in Tableau presents forecasts under controlling parameter space [34] and testing accuracy levels [31]. This study approaches the LTS(A,A,A) model of the Holt-Winters additive method in Tableau to predict the financial indicators of hydropower suppliers based on the historical time series within ten past years. As a result, their forecasting values from 2022 to 2025 are calculated, computed, and described in Table A1.
The estimated values must check parameter space, including alpha, beta, and gamma, to ensure accuracy levels, these parameter values of inputs and outputs are calculated in Table 3. The parameter space condition of the estimated value is from 0 to 1. Table 3 denotes that all parameters of alpha, beta, and gamma to nine hydropower suppliers are from 0 to 0.5 so that they are appreciated within the space scope. However, the forecasted values must check the MAPE index to measure accuracy levels, as shown in Table 3.
According to Lewis (1982) [31], the MAPE of each hydropower supplier is accepted when each valuation is less than 50%. All forecasted values need to remove and test other methods when their MAPEs are higher than 50%. Table 4 shows that the parameters of each factor to each hydropower supplier are from 0.90% to 46.60%, and the average MAPE is 13.51%. As a result, the predicted data of hydropower suppliers in the future period of 2022–2025 are satisfied with space conditions and MAPE indication. Thus, all historical values in Table 2 and forecasted values in Table A1 are positive and meaningful data; they are absolutely appropriate for using the next step of measuring the efficiency score. Therefore, the business performance and position of nine hydropower suppliers in Vietnam during the period of 2012–2025 are computed and determined by the super-SBM max model in DEA.

3.2. Efficiency and Position

The actual and predicted data of nine hydropower suppliers in Vietnam during the time period of 2012–2025 are positive values; thus, they are suitable for applying to the super-SBM max model in DEA. Before putting these data into calculating the scores, these data must check the correlation between input and input, output and output, and input and output to ensure an isotonic relationship. The two variables do not have a linear relationship when the correlation coefficient equals zero; they also have a perfect linear relationship when the correlation coefficient is closer to ±1. The factors relate directly to a positive number, and the factors relate inversely to a negative number [35]. The Pearson correlations of Vietnamese hydropower providers from 2012 to 2025 show a correlation coefficient of variables, and these values range from 0.13878 to 1, as shown in Table A2. Consequently, the correlation between variables has a strong linear relationship and gets a standard qualification.
After checking the correlation coefficients among inputs and inputs, outputs and outputs, and inputs and outputs, all appreciate the data utilized to escalate the scores in every term by applying the super-SBM Max model in DEA. The ratio between outputs and inputs calculates the scores that point out the business efficiency of each hydropower supplier in Vietnam from past to future, as shown in Table 5.
The empirical efficiency scores in Table 5 reveal the efficiency of hydropower suppliers from past to future that most suppliers have sharp fluctuating scores. TMP and TDB are the best excellent suppliers that implement smooth changes to achieve performance, with a score above one from 2012 to 2025. HJS and SHP presented the action of up and down efficiency in the whole term, whereas their actual values owned both efficient and inefficient terms over the time period of 2012–2021, and their forecasted values denote that they will grow and achieve performance during the future time. The scores of VSH express a dramatic picture of augmenting and decrease; further, VSH had not achieved efficiency within four continual years, its score was down 0.3758 in 2017, and the highest score for both previous and future term only attains 1. Although DRL dropped its efficiency in 2016 when its’ score was down 0.9673; however, its’ forecasted valuation will increase and obtain the efficiency in future time. SJD and TBC had a similar situation because their past terms had both efficient and inefficient terms in one term, and they will not approach performance in the future. Similarly, GHC also received both efficient and inefficient terms in the past and without efficiency scores in future terms; however, it attained the efficiency score in five terms, including 2012, 2013, 2016, 2019, and 2020. Although the COVID-19 pandemic has impacted the business process of enterprises from 2020, these score reveals a slight impact on the business and manufacturing process of Vietnamese hydropower suppliers, and most hydropower suppliers extended the efficiency score in 2020, excluding SHP and TMP.
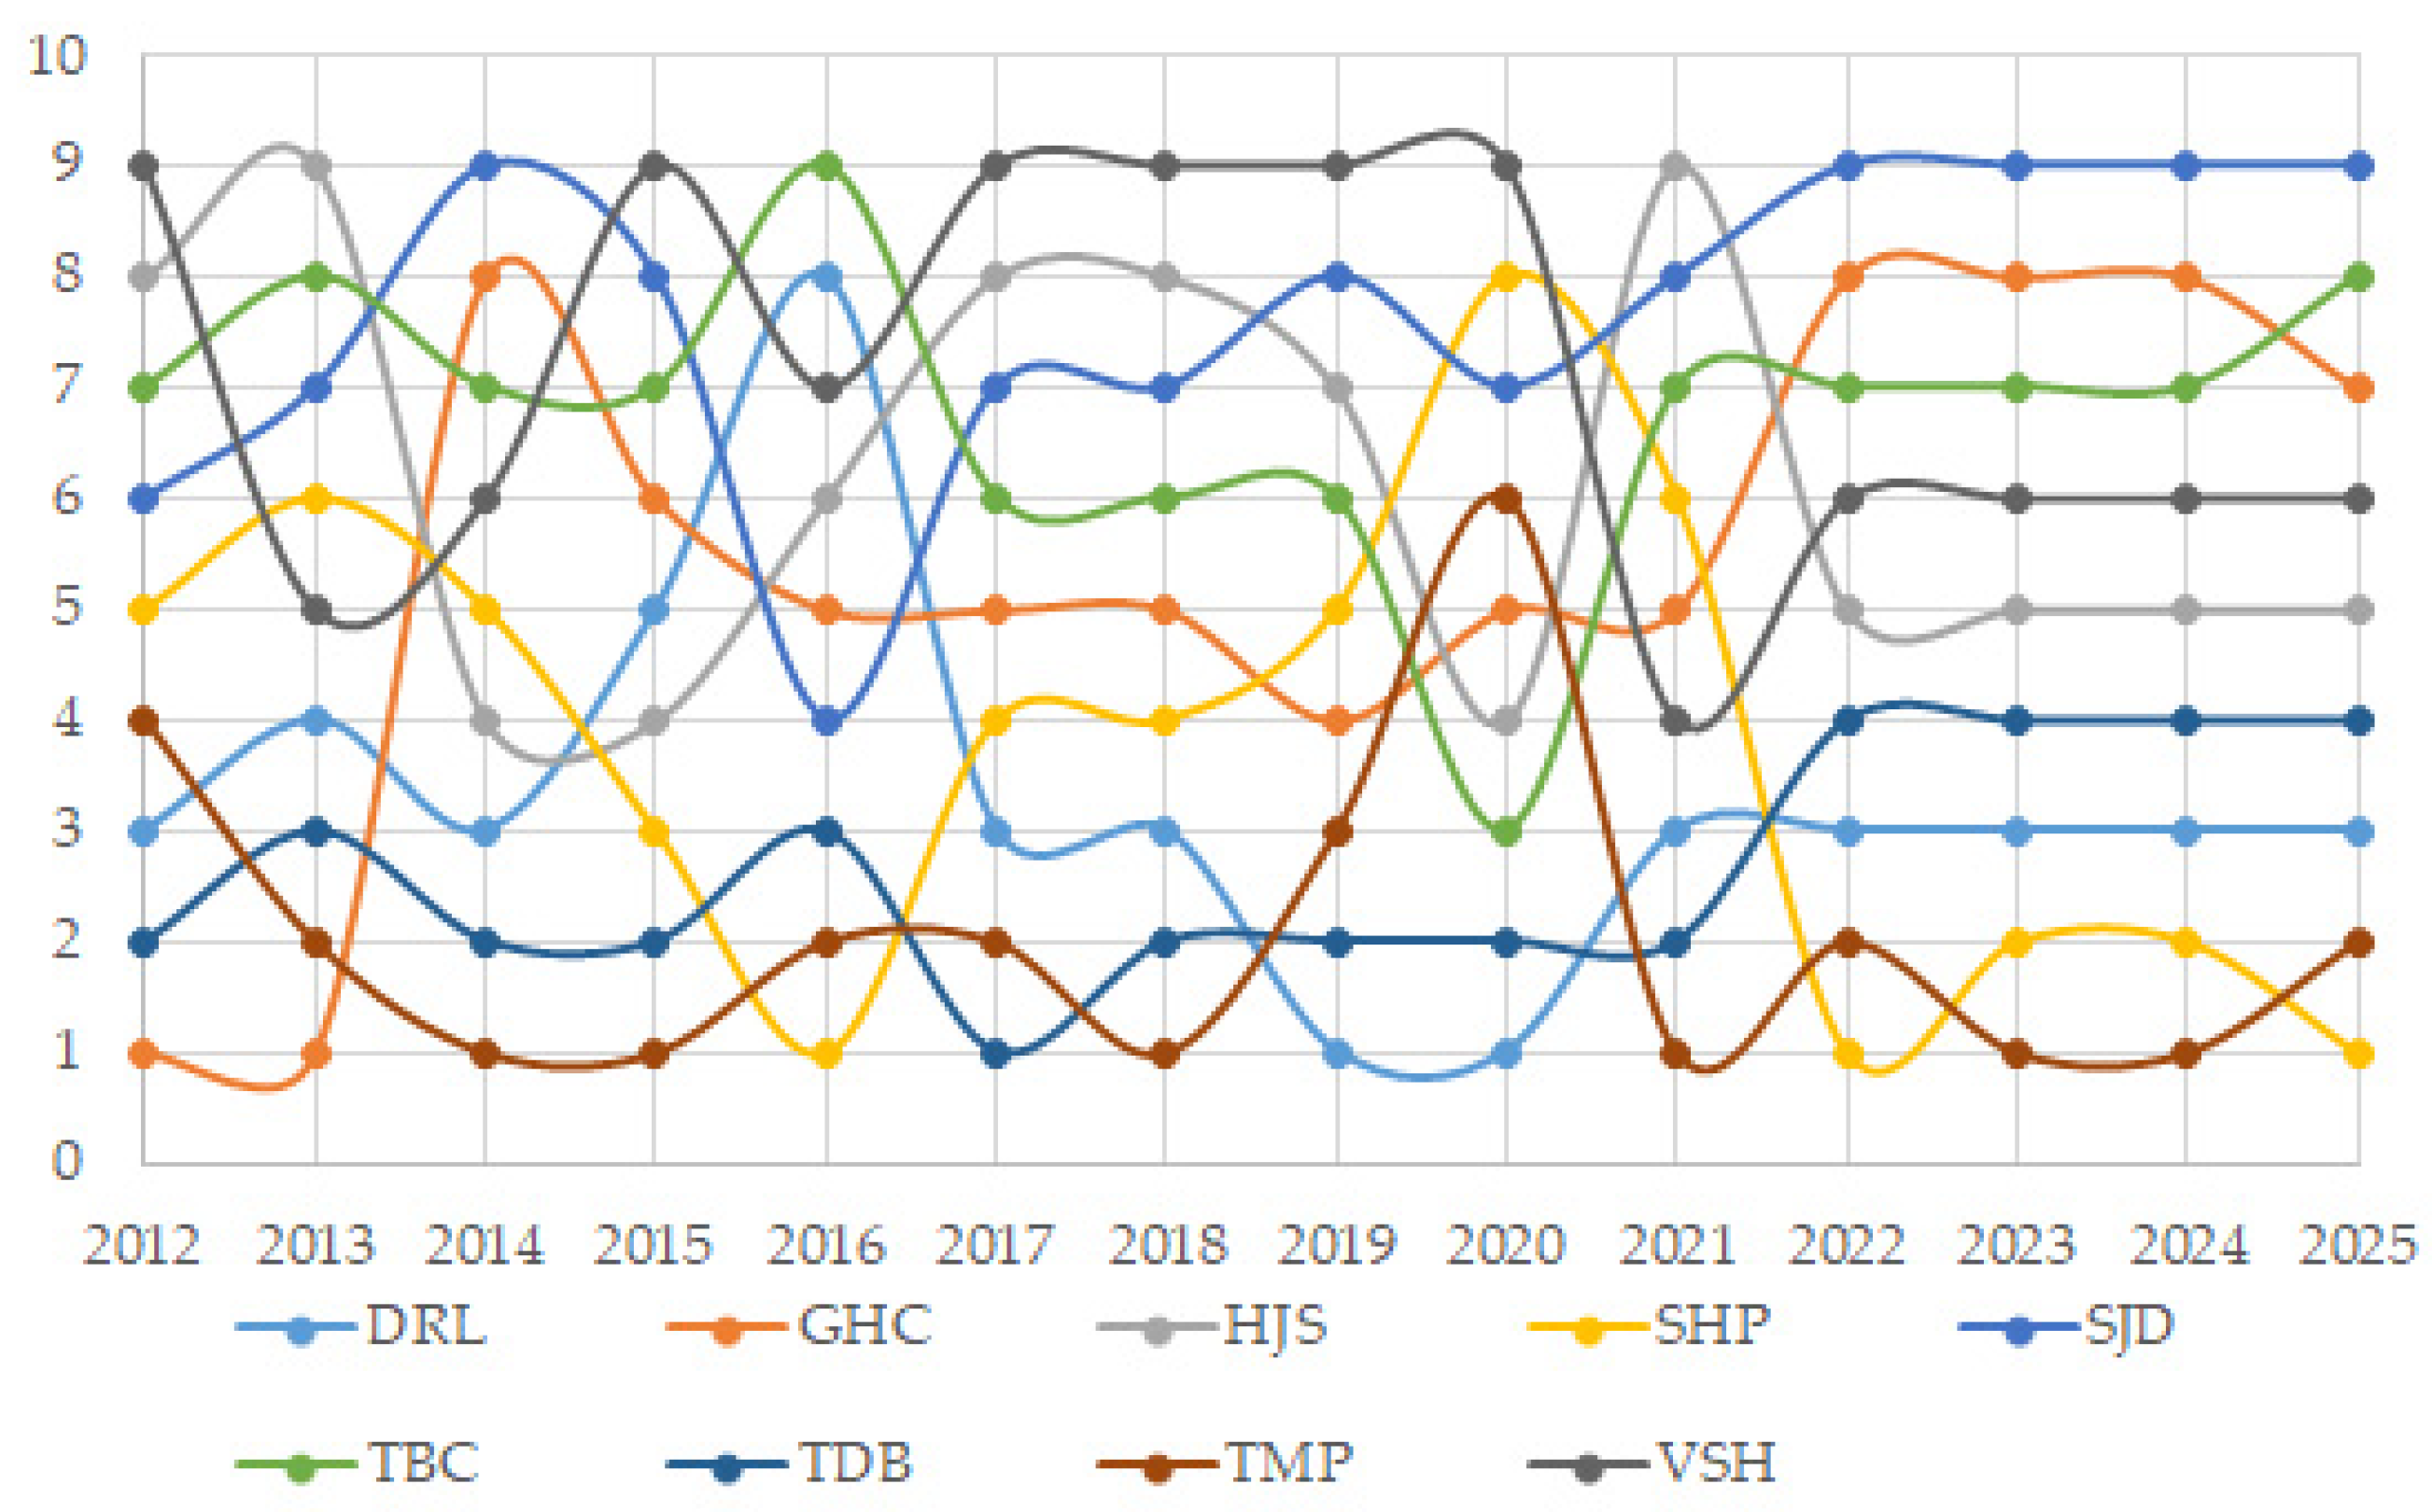
Based on the efficiency score of DMUs, the final analysis determines the position of each hydropower supplier every year, as shown in Figure 2.
Figure 2 reveals that the positions of each hydropower supplier change continually. With a long period of 14 years, including ten previous years and four future years, none of the suppliers holds the first rank in the whole term; moreover, HJS, SJD, TBC, and VSH do not approach the first position at any time. HJS, SJD, and VSH range from the fourth to ninth positions. HJS ranked from the fourth to ninth position in the historical time and is expected to hold the fifth position in the next four future years. SJD and VSH had one year at the fourth position; however, VSH is expected to hold the sixth position in future terms; on the contrary, SJD will be down the final position in future terms. TBC only stayed at the third position in 2020 and ranks from sixth to ninth position in the remaining years. TMP is the best supplier and achieves the first rank within six terms in the whole term; other terms rank from the second to sixth position. SHP ranges in the first rank within three terms; its position was down to the eighth position in 2022. GHC achieved the first position within two terms in 2012 and 2013; its position from 2022 to 2025 will rank the low position. DRL attained the first rank in two continual terms from 2019 to 2020; however, it was down the eighth position in 2016. TDB only approached the first rank in 2018; the remaining terms are from the second to fourth position. As a result, the position of hydropower suppliers every year changes when their classes are determined based on the individual scores. The development of hydropower plants depends on the demand for electric energy.
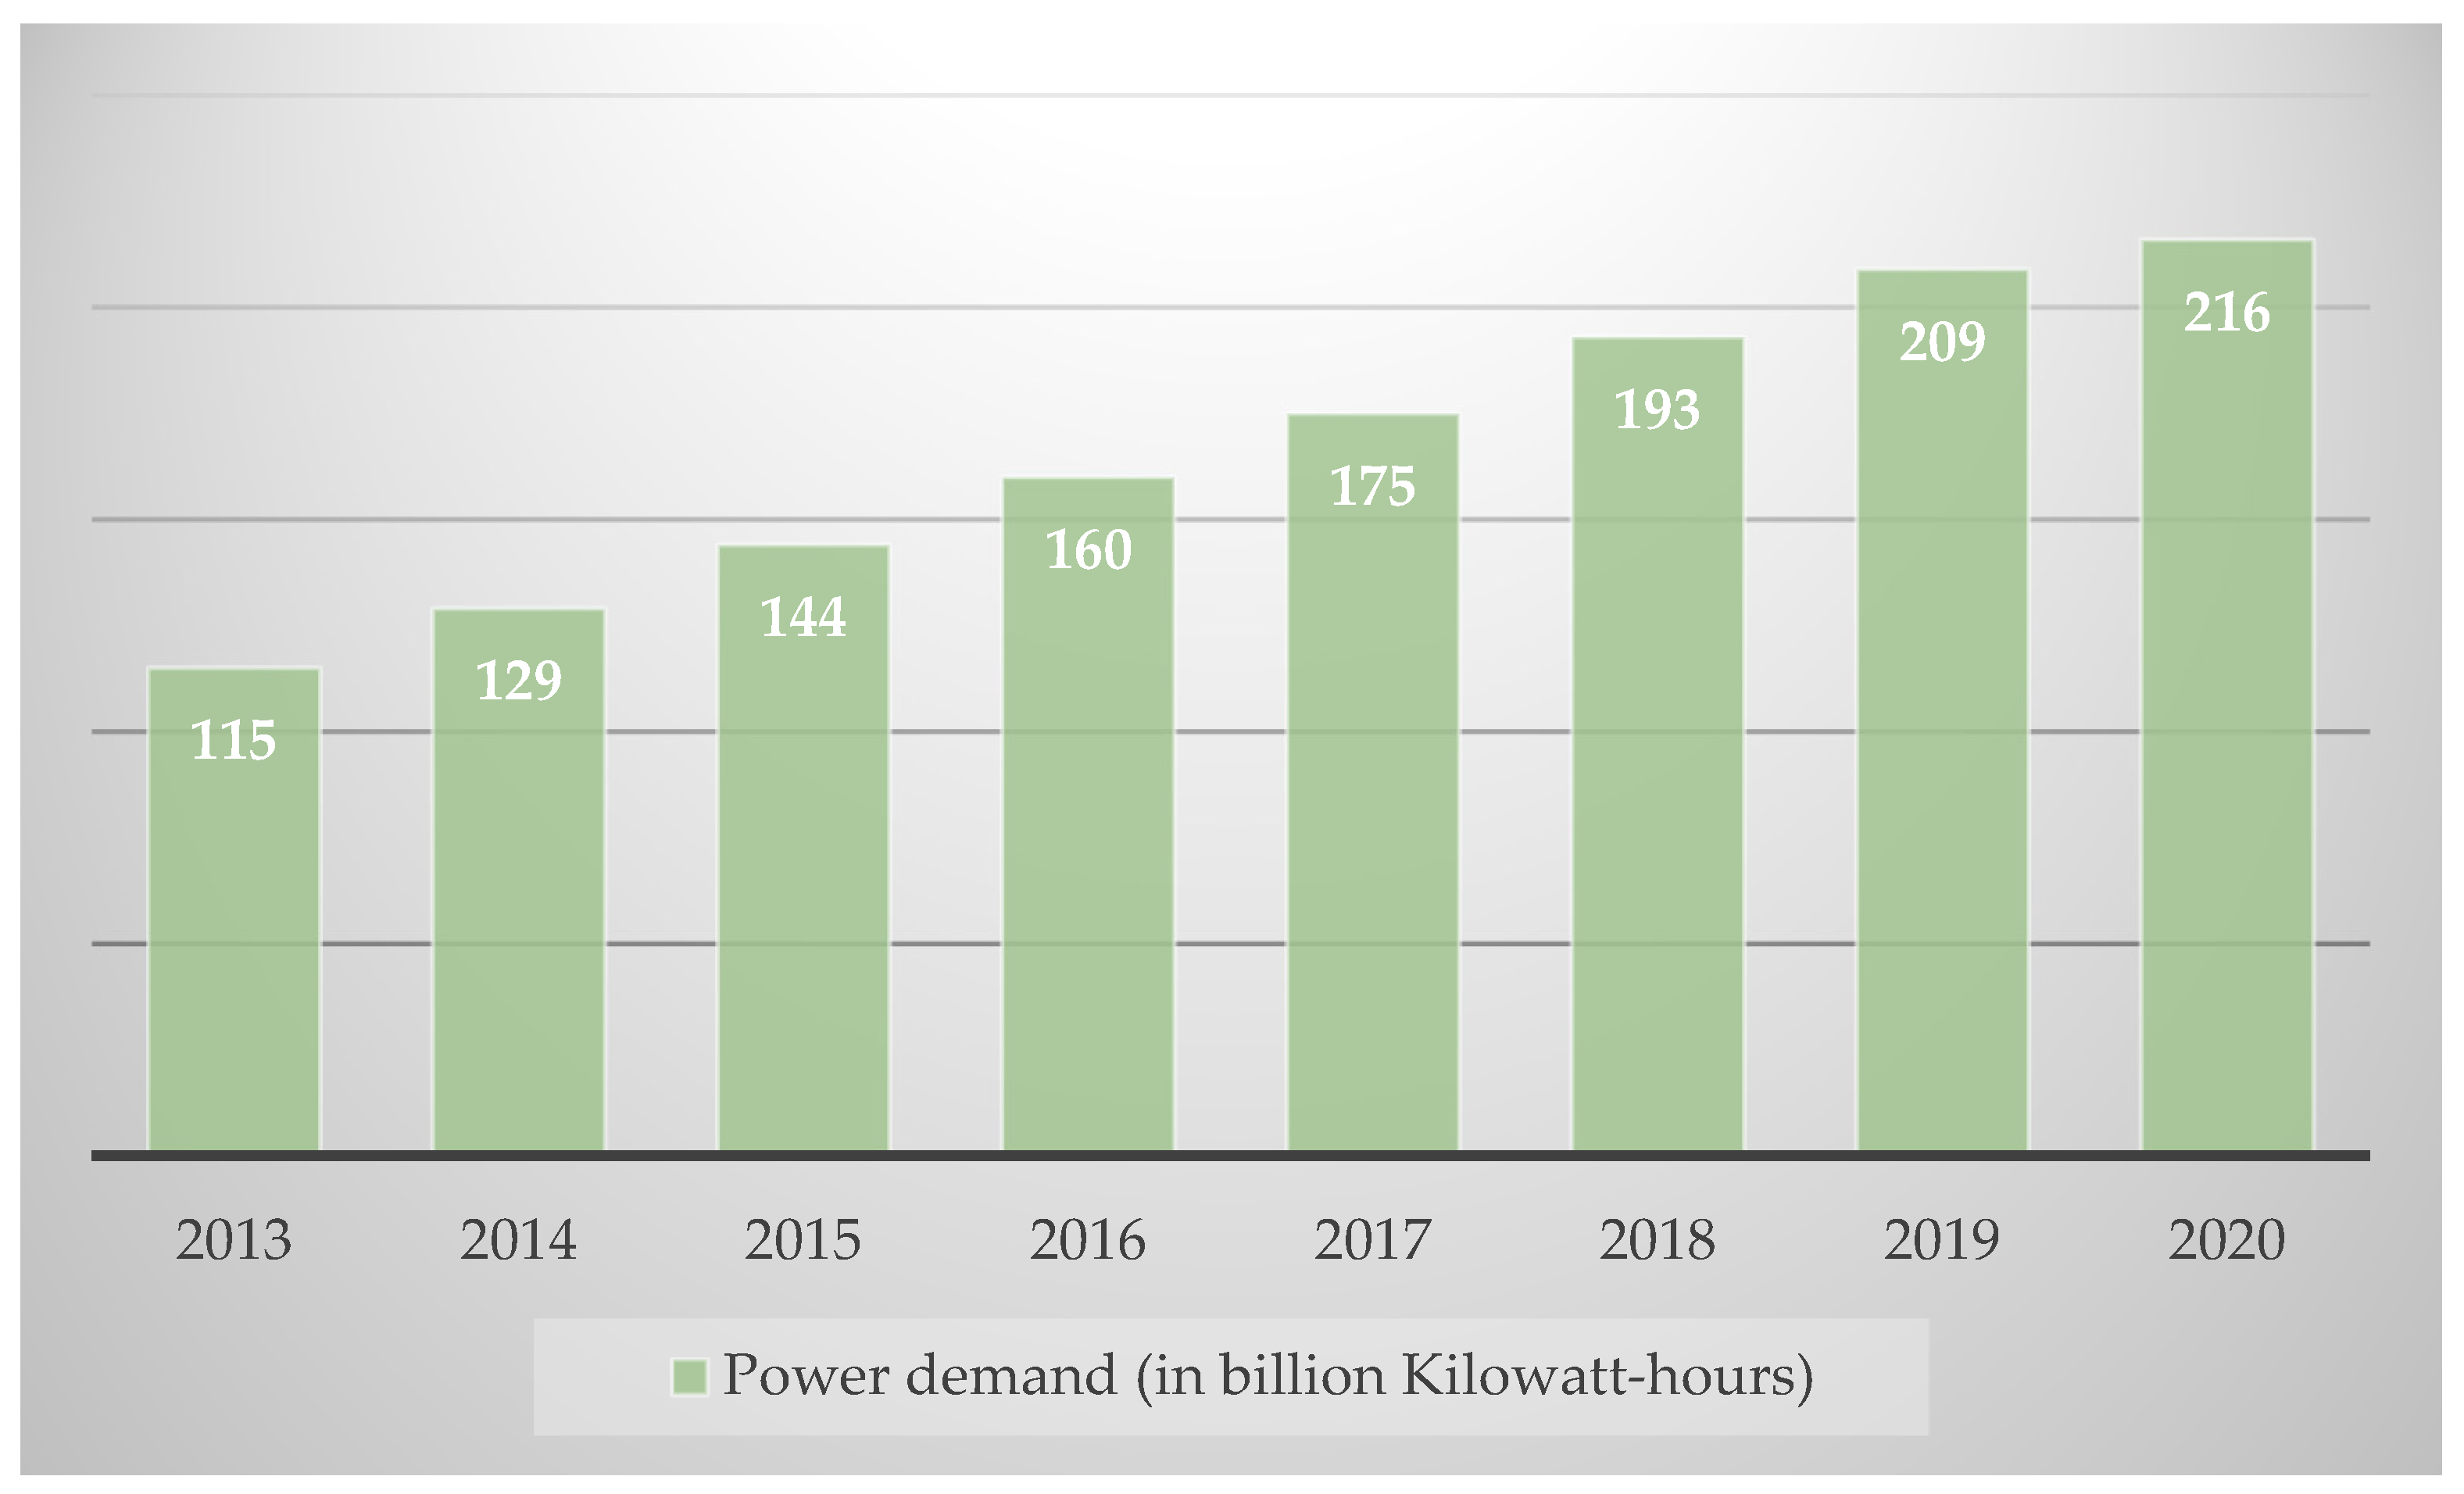
Electricity demand was growing faster before the COVID-19 pandemic occurred worldwide. Due to the impacts of the COVID-19 pandemic, global electricity demand was felt by about 1% [36]. Power demand continuously increased from 2013 to 2020 [37] in Vietnam, as shown in Figure 3.
Figure 3 revealed that power demand in Vietnam increased not only before the COVID-19 pandemic but also in 2020. Therefore, economic development was a foundation to foster the development of the electricity industry. In 2020, the COVID-19 pandemic had strong impacts on the economy, such as postponement in the supply chain, interruption in production, and shortage of human resources, so many enterprises were lost from suspension. The electricity industry also suffered impacts from the COVID-19 pandemic. Power demand increased by more than 14 billion kilowatt-hours per year from 2013 to 2019; however, it only increased by 7 billion kilowatt-hours in 2020. Here was the main reason which led to deduct the business performance of many electricity suppliers in Vietnam in 2020.
In this study, the above analysis indicates the efficiency and position of hydropower suppliers in Vietnam during the time period of 2012–2025. The research reveals forecasted values and then combines actual and predicted data to apply to the super-SBM max model and define the efficient terms, inefficient terms, and position. The empirical results reveal that their scores and ranks of previous and future time periods always have a consecutive variation. TMP is the best supplier when its’ scores always hold the efficiency excluding 2020, and it ranks the high position in the whole term as well. On the contrary, HJS, TBC, SJD, and VSH are the worst suppliers, as shown by low scores, and do not attain high positions in the whole term. In addition, the empirical result recommends a development direction toward efficient terms and a solution to reduce inefficient terms. Inefficient terms should reduce valuable input variables to eliminate excess and increase useful output variables to reduce shortages. Hence, hydropower suppliers should apply high-tech equipment to improve the quality of management and operation process. Energy storage devices should establish to demand extension of electricity energy resources to ensure the standard operation. Technical should maintain and check frequently to avoid unintended incidents and increase the customer’s reliability. Technicians should have training sessions to upgrade their knowledge to catch up with technological innovation.
The DEA method is an excellent tool that is used to evaluate decision-making units [38,39]. Each model in the DEA method has a particular characteristic, whereas the super-SBM model is a good model for calculating the efficiency with separate scores and being easy to identify ranking [20]; however, it cannot conduct the maximum score. This study uses the super-SBM Max model with the integration of the super efficiency and SBM max model for calculating the performance of hydropower suppliers in Vietnam from the past to the future. Additionally, DMUs’ separate scores in the same term support determining their position.

4. Discussion

In this paper, two models, namely LTS (A,A,A) model in Tableau and Super-SBM Max model in the DEA method, were used to develop and conduct the empirical results in the paper. First, the LTS (A,A,A) model is implemented to calculate Vietnamese hydropower providers’ future values based on the historical data. Second, the Super-SBM Max model in the DEA method is applied to measure the efficiency from past to future. The ratio between outputs and inputs calculates the efficiency score. The empirical results exhibit the performance and position of Vietnamese hydropower providers from past to future terms. These findings will help Vietnamese hydropower providers to have an orientation in advance and improve their business performance in the future.
The super-SBM Max model recommends a feasible solution for inefficient cases by increasing the output shortage and reducing the input excesses. By the way, for inefficient cases, the input variables, including AS, OE, and EM should deduct and the output variables, including NR and GP, should extend.
SenGupta et al. (2020) [40] used Barndorff-Nielsen and Shephard model to analyze the financial indicator of crude oil price from 2009 to 2019, while our paper utilizes the LTS(A,A,A) model in Tableau and the super-SBM Max model in DEA to explore the economic indicators and observe future time. The findings not only conduct the business performance but also suggest input excess and output shortfall for efficiency score in inefficient cases.
Moreover, the hydropower suppliers can improve their efficiency scores through the new technology. Ye et al. (2022) [41] pointed out the profit of digital technologies to achieve better supply chain performance in the Covid-19 crisis. Barykin et al. (2021) [42] indicated a physical distribution digital development in managing trade network activities. Hence, the hydropower suppliers in Vietnam should apply the digital transformation, especially when the COVID-19 pandemic and technological innovation impact sharply. The digital transformation in the hydropower industry will be an internal element for development, including planning, design, construction, operation, and maintenance.

5. Conclusions

The scientific novelty of the research, including theory, methods, and data, is presented and described to explore hydropower energy and the business performance of hydropower plants in Vietnam. Electric energy contributes to successful Vietnamese innovation from an agricultural to an industrial economy. Hydropower plants were built to generate the electric source for serving life and manufacturing activities. An overall picture of hydropower suppliers from the past to the future time period is presented by combining the LTS(A,A,A) model in Tableau and the super-SBM model in DEA. The calculated efficiencies indicate that the development rate of hydropower suppliers is quick and robust to demand the requirement of electrical energy sources.
The LTS(A,A,A) model of additive Holt-Winters method in Tableau with the full parameters of coefficient smoothing and MAPE index escalates the high predicted accuracy values under the standard qualification indicators. The predicted data of TS, OE, EM, NR, and GP of Vietnamese hydropower suppliers from 2021 to 2025 are escalated via previous data; their parameters with the values from 0 to 0.5 and Mapes under 46.60% obtain an expected result. The forecasted valuations are estimated based on the actual data without experts’ opinions, and they recommend a foresight of key financial factors.
After acquiring future and historical data, they are applied to measure the efficiency and give the position of hydropower suppliers in every term via the super-SBM max model in DEA. The empirical analysis determines efficient, inefficient terms and positions. The empirical result indicates that TMP is the best hydropower supplier and VSH is the worst hydropower supplier in Vietnam. The final result draws a picture of the development process of hydropower suppliers from the past to the future. In addition, the results help these hydropower suppliers to identify their operational efficiencies and make a better plan for the future.
The empirical result is a reference for the reader to acknowledge the Vietnamese electricity industry and the integration skill between the LTS(A,A,A) model and the super-SBM Max model. The study describes valuable characteristics of the super-SBM Max model of maximum score and identification in ranking. The integration among LTS(A,A,A) model and the super-SBM Max model exhibits a future observation and recommends an overall future picture. Additionally, feasible solutions for inefficient cases suggest increasing the efficiency score based on the variables’ slacks for each DMU.
Although the study estimates the future values and computes the performance of publishing firms, it still has some limitations. Firstly, an analysis result does not offer profound observation when the total input and output variables are not various; the following study should expand elements to approach a deep observation. Secondly, the number of suppliers is limited; further research should also consider more DMUs. Thirdly, this study only implements the forecasting values via the LTS(A,A,A) model; future work can apply more models, such as GM(1,1) model, ARIMA models, etc., to have a comparative analysis and choose the best-predicted estimation.

Author Contributions

T.K.L.N. designed the research framework, analyzed the data, and wrote the paper. H.N.N. collected the data. V.D.D. created the visualization of the paper. Q.N.N. analyzed the data. V.H.L. reviewed and edited the paper. All authors have read and agreed to the published version of the manuscript.

Funding

This research was funded by Thanh Dong University, Vietnam (Project No. TDU.1792009).

Institutional Review Board Statement

Not applicable.

Informed Consent Statement

Not applicable.

Data Availability Statement

Data is available in a publicly accessible repository.

Acknowledgments

The authors appreciate the support from Thanh Dong University.

Conflicts of Interest

The authors declare no conflict of interest.

Appendix A

Table A1. Forecasted values of hydropower suppliers from 2022 to 2025.
DMUsYears(I)AS(I)OE(I)EM(O)NR(O)GPYears(I)AS(I)OE(I)EM(O)NR(O)GP
DRL2022142,888123,25434104,77271,7282023138,988119,25834104,74573,088
GHC1,611,368672,87680311,122179,0541,838,025676,37481337,530189,587
HJS309,913355,432114202,03271,449284,203380,584105197,34378,996
SHP1,739,6581,228,694116726,513292,4931,761,4831,371,916114785,239383,536
SJD1,405,499951,722287427,637227,2721,464,6321,027,288304444,296235,145
TBC1,666,9971,300,004159502,782318,0951,802,6551,365,716156506,888323,799
TDB103,39099,6852561,20838,65493,47799,8502569,11541,016
TMP2,094,2911,596,351105676,554426,0682,081,3321,673,320102692,389418,192
VSH10,926,6523,669,958265713,166368,48111,516,2173,651,580258875,512421,409
DRL2024142,990122,62535112,99878,0882025139,091118,62935112,97179,448
GHC1,828,614761,95086349,249197,4682,055,270765,44786375,657208,001
HJS247,688387,56999216,41873,189221,978412,72290211,72980,736
SHP1,668,6261,280,202114818,989325,6531,690,4511,423,424112877,715416,697
SJD1,487,6551,028,746305443,199229,5421,546,7881,104,312322459,858237,415
TBC1,852,4221,387,255163552,711352,0251,988,0801,452,967160556,816357,729
TDB102,047103,2322566,82641,82392,134103,3972574,73444,186
TMP2,221,0161,759,29098707,003453,8662,208,0581,836,25995722,838445,991
VSH12,426,2583,880,485287864,443423,71313,015,8233,862,1082801,026,789476,641
Note: EM: Employee; AS, OE, NR, and GP: Million Dong in Vietnam. Source: Tableau.
Table A2. Pearson Correlation from 2012 to 2025.
FactorsYear(I)AS(I)OE(I)EM(O)NR(O)GPYear(I)AS(I)OE(I)EM(O)NR(O)GP
(I)AS20121.00000.93660.53260.51840.500520131.00000.91880.35000.44790.4410
(I)OE0.93661.00000.48470.57690.54400.91881.00000.35520.54250.5234
(I)EM0.53260.48471.00000.55640.54790.35000.35521.00000.58310.6330
(O)NR0.51840.57690.55641.00000.99510.44790.54250.58311.00000.9887
(O)GP0.50050.54400.54790.99511.00000.44100.52340.63300.98871.0000
(I)AS20141.00000.90050.33800.83090.901820151.00000.97150.33620.74900.8203
(I)OE0.90051.00000.36870.73230.82110.97151.00000.43640.73410.8118
(I)EM0.33800.36871.00000.48130.44130.33620.43641.00000.54180.5405
(O)NR0.83090.73230.48131.00000.98710.74900.73410.54181.00000.9889
(O)GP0.90180.82110.44130.98711.00000.82030.81180.54050.98891.0000
(I)AS20161.00000.97660.51450.70680.804020171.00000.97430.61490.56370.5593
(I)OE0.97661.00000.62440.76330.86950.97431.00000.71700.69400.7013
(I)EM0.51450.62441.00000.67250.74890.61490.71701.00000.63750.6212
(O)NR0.70680.76330.67251.00000.96360.56370.69400.63751.00000.9891
(O)GP0.80400.86950.74890.96361.00000.55930.70130.62120.98911.0000
(I)AS20181.00000.96560.54160.49660.473820191.00000.94400.61930.34890.2473
(I)OE0.96561.00000.61620.69420.67610.94401.00000.67590.59590.5187
(I)EM0.54160.61621.00000.53110.44920.61930.67591.00000.44310.3504
(O)NR0.49660.69420.53111.00000.97930.34890.59590.44311.00000.9734
(O)GP0.47380.67610.44920.97931.00000.24730.51870.35040.97341.0000
(I)AS20201.00000.95480.57040.31650.138820211.00000.97740.57500.95150.9182
(I)OE0.95481.00000.63430.55600.37470.97741.00000.63730.98730.9722
(I)EM0.57040.63431.00000.51950.40280.57500.63731.00000.62730.6112
(O)NR0.31650.55600.51951.00000.90380.95150.98730.62731.00000.9926
(O)GP0.13880.37470.40280.90381.00000.91820.97220.61120.99261.0000
(I)AS20221.00000.95550.61880.60570.576520231.00000.93890.57830.69670.6143
(I)OE0.95551.00000.67900.79510.78340.93891.00000.64780.88180.8369
(I)EM0.61880.67901.00000.57330.53770.57830.64781.00000.57230.5225
(O)NR0.60570.79510.57331.00000.94330.69670.88180.57231.00000.9755
(O)GP0.57650.78340.53770.94331.00000.61430.83690.52250.97551.0000
(I)AS20241.00000.94730.63750.65590.604920251.00000.93090.59940.72490.6318
(I)OE0.94731.00000.68760.84010.82000.93091.00000.65660.90190.8583
(I)EM0.63750.68761.00000.57250.52490.59940.65661.00000.56630.5069
(O)NR0.65590.84010.57251.00000.93670.72490.90190.56631.00000.9675
(O)GP0.60490.82000.52490.93671.00000.63180.85830.50690.96751.0000
Source: DEA-Solver-Pro15.

References

  1. Rahman, M.S.; Nabil, I.M.; Alam, M. Global analysis of a renewable micro hydro power generation plant. AIP Conf. Proc. 2017, 1919, 1–5. [Google Scholar] [CrossRef] [Green Version]
  2. Chala, G.T.; Maarof, M.I.N.; Sharma, S. Trends in an increased dependence towards hydropower energy utilization—a short review. Cogent Eng. 2019, 6, 1631541. [Google Scholar] [CrossRef]
  3. Chang, J.X.; Li, Y.Y.; Yuan, M.; Wang, Y.M. Efficiency evaluation of hydropower station operation: A case study of Longyangxia station in the Yellow River, China. Energy 2017, 135, 23–31. [Google Scholar] [CrossRef]
  4. Osokoya, O.O.; Ojikutu, A.O.; Olayiwola, O.O.; Chinedum, C.W. Enhancing small hydropower generation in Nigeria. J. Sustain. Energy Eng. 2013, 1, 113–126. [Google Scholar] [CrossRef]
  5. Luu, C.; Meding, J.V.; Kanjanabootra, S. Balancing costs and benefits in Vietnam’s hydropower industry: A strategic proposal. Int. J. Disaster Resil. Built Environ. 2017, 8, 27–39. [Google Scholar] [CrossRef]
  6. Carol, R.; Leon, C. The Engineering Feats of Tasmania’s Hydro Electric System. 2013. Available online: https://www.abc.net.au/local/audio/2013/07/29/3813028.htm (accessed on 2 September 2021).
  7. Tkac, S. Hydro power plants, an overview of the current types and technology. Sel. Sci. Pap. —J. Civ. Eng. Manag. 2018, 13, 115–126. [Google Scholar] [CrossRef]
  8. Micheal, P.A.; Jawahar, C.P. Design of 15 kW Micro Hydro Power Plant for Rural Electrification at Valara. Energy Procedia 2017, 117, 163–171. [Google Scholar] [CrossRef]
  9. Kaunda, C.S.; Kimambo, C.Z.; Nielsen, T.K. Potential of Small-Scale Hydropower for Electricity Generation in Sub-Saharan Africa. Int. Sch. Res. Not. 2012, 2012, 132606. [Google Scholar] [CrossRef] [Green Version]
  10. Magee, D. Hydropower and End-Use Electrical Efficiency in China: State Support and Potential Contribution to Low-Carbon Development. Cph. J. Asian Stud. 2015, 33, 64–89. [Google Scholar] [CrossRef]
  11. Fang, H.H.; Lee, H.S.; Hwang, S.N.; Chung, C.C. A slacks-based measure of super-efficiency in data envelopment analysis: An alternative approach. Omega 2013, 41, 731–734. [Google Scholar] [CrossRef]
  12. IEA. Renewable Energy Essentials: Hydropower. Available online: http://www.iea.org. (accessed on 11 May 2022).
  13. Wang, B.; Nistor, I.; Murty, T.; Wei, Y.M. Efficiency assessment of hydroelectric power plants in Canada: A multi criteria decision making approach. Energy Econ. 2014, 46, 112–121. [Google Scholar] [CrossRef]
  14. Hoelscher, J.; Mortimer, A. Using Tableau to visualize data and drive decision-making. J. Account. Educ. 2018, 44, 49–59. [Google Scholar] [CrossRef]
  15. Salgador, J.P.Z. Data analytics with Tableau: The trend lines models. SSRN Electron. J. 2018, 11, 1–17. [Google Scholar]
  16. Harsoor, A.S.; Patil, A. Forecast of sale of Walmart store using big data applications. Int. J. Eng. Res. Technol. 2015, 4, 51–59. [Google Scholar] [CrossRef]
  17. Shastri, S.; Sharma, A.; Mansotra, V.; Bhadwal, A.S.; Kumari, M. A study on exponential smoothing method for forecasting. JCSE Int. J. Comput. Sci. Eng. 2018, 6, 482–485. [Google Scholar] [CrossRef]
  18. Jofipasi, C.A.; Hizir, M. Selection for the best ETS (error, trend, seasonal) model to forecast weather in the Aceh Besar district. IOP Conf. Ser. Mater. Sci. Eng. 2017, 352, 12055. [Google Scholar] [CrossRef]
  19. Omar, Z. Modelling and forecasting weather parameter using ANN-MLP, ARIMA and ETS model: A case study for Lahore, Pakistan. Int. J. Sci. Eng. Res. 2019, 10, 351–366. [Google Scholar]
  20. Wang, C.N.; Day, J.D.; Nguyen, T.K.L.; Luu, Q.C. Integrating the additive seasonal model and super-SBM model to compute the efficiency of port logistics companies in Vietnam. Sustainability 2018, 10, 2782. [Google Scholar] [CrossRef] [Green Version]
  21. Pongpanich, R.; Peng, K.C. Assessing the Operational Efficiency of Agricultural Cooperative in Thailand by Using Super-SBM DEA Approach. Int. J. Sci. Res. Publ. 2016, 6, 247–253. [Google Scholar]
  22. Charnes, A.; Cooper, W.W.; Rhodes, E. Measuring the efficiency of decision-making units. Eur. J. Oper. Res. 1978, 2, 429–444. [Google Scholar] [CrossRef]
  23. Khodabakhshi, M.; Aryavash, K. Ranking all units in data envelopment analysis. Appl. Math. Lett. 2012, 25, 2066–2070. [Google Scholar] [CrossRef] [Green Version]
  24. Zanboori, E.; Malkhalifeh, M.R.; Jahanshahloo, G.R.; Shoja, N. Calculating Super Efficiency of DMUs for Ranking Units in Data Envelopment Analysis Based on SBM Model. Sci. World J. 2014, 2014, 382390. [Google Scholar] [CrossRef] [PubMed] [Green Version]
  25. Wu, G.H.; Yao, T.Y.; Zhang, B.P. A Study of the Efficiency of Futures Research Institutes of China. J. Asian Finance Econ. Bus. 2020, 7, 555–564. [Google Scholar] [CrossRef]
  26. Naushad, M.; Faridi, M.R.; Faisal, S. Measuring the Managerial Efficiency of Insurance Companies in Saudi Arabia: A Data Envelopment Analysis Approach. J. Asian Finance Econ. Bus 2020, 7, 297–304. [Google Scholar] [CrossRef]
  27. Mai, T.K.; Nguyen, V.; Vu, T.H.T. Analysing Productivity Change in Vietnamese Garment Industry Using Global Malmquist Index. J. Asian Finance Econ. Bus 2020, 7, 1033–1039. [Google Scholar] [CrossRef]
  28. Tone, K. On the consistency of Slacks-based Measure-Max model and Super-slacks-based Measure Model. Univers. J. Manag. 2017, 5, 160–165. [Google Scholar] [CrossRef] [Green Version]
  29. Vietstock. Available online: http://en.vietstock.vn/ (accessed on 2 April 2022).
  30. Beverton, R.J.H.; Holt, S.J. On the Dynamics of Exploited Fish Populations; Great Britain Fishery Investment; Springer Science & Business Media: London, UK, 1975. [Google Scholar] [CrossRef]
  31. Lewis, C.D. Industrial and Business Forecasting Methods: A Practical Guide to Exponential Smoothing and Curve Fitting; Butterworth Scientific: London, UK, 1982. [Google Scholar]
  32. Tirkes, G.; Guray, C.; Celebi, N. Demand forecasting: A comparison between the Holt-Winters, trend analysis and decomposition models. Tehnički Vjesnik 2017, 24, 503–509. [Google Scholar]
  33. Tone, K. A slacks-based measure of super-efficiency in data envelopment analysis. Eur. J. Oper. Res. 2002, 143, 32–41. [Google Scholar] [CrossRef] [Green Version]
  34. Archibald, B.C. Parameter space of the Holt-Winters’ model. Int. J. Forecast. 1990, 6, 199–209. [Google Scholar] [CrossRef]
  35. Mukaka, M.M. Statistics Corner: A guide to appropriate use of Correlation coefficient in medical research. Malawi Med. J. 2012, 24, 69–71. [Google Scholar]
  36. IEA. Global Electricity Demand Is Growing Faster than Renewables, Driving Strong Increase in Generation from Fossil Fuels. Available online: https://www.iea.org/news/global-electricity-demand-is-growing-faster-than-renewables-driving-strong-increase-in-generation-from-fossil-fuels (accessed on 20 November 2021).
  37. Statistics. Power Demand in Vietnam from 2013 to the First 7 Months into 2021. Available online: https://0-www-statista-com.brum.beds.ac.uk/statistics/1206469/vietnam-power-demand/ (accessed on 20 November 2021).
  38. Wang, C.; Nguyen, V.T.; Duong, D.H.; Do, H.T. A Hybrid Fuzzy Analytic Network Process (FANP) and Data Envelopment Analysis (DEA) Approach for Supplier Evaluation and Selection in the Rice Supply Chain. Symmetry 2018, 10, 221. [Google Scholar] [CrossRef] [Green Version]
  39. Krmac, E.; Djordjević, B. A New DEA Model for Evaluation of Supply Chains: A Case of Selection and Evaluation of Environmental Efficiency of Suppliers. Symmetry 2019, 11, 565. [Google Scholar] [CrossRef] [Green Version]
  40. SenGupta, I.; Nganje, W.; Hanson, E. Refinements of Barndorff-Nielsen and Shephard Model: An Analysis of Crude Oil Price with Machine Learning. Ann. Data Sci. 2020, 8, 39–55. [Google Scholar] [CrossRef] [Green Version]
  41. Ye, F.; Liu, K.; Li, L.X.; Lai, K.H.; Zhan, Y.Z.; Kumar, A. Digital supply chain management in the COVID-19 crisis: An asset orchestration perspective. Int. J. Prod. Econ. 2022, 245, 108396. [Google Scholar] [CrossRef]
  42. Barykin, S.Y.; Kapustina, I.V.; Sergeev, S.M.; Kalinina, O.V.; Vilken, V.V.; de la Poza, E.; Putikhin, Y.Y.; Volkova, L.V. Developing the physical distribution digital twin model within the trade network. Acad. Strateg. Manag. J. 2021, 20, 1–18. [Google Scholar]
Figure 1. Proposal research.
Axioms 11 00238 g001
Figure 2. Position of hydropower suppliers from past to future.
Axioms 11 00238 g002
Figure 3. Vietnamese power demand from 2013 to 2020 (Source: Statistics (2020)) [37].
Axioms 11 00238 g003
Table 1. Name of hydropower supplier in Vietnam.
NumberAbbreviateNameLocation
1VSHSong Hinh Hydropower JSCBinh Dinh
2TMPThac Mo Hydro Power JSCBinh Phuoc
3TDBDinh Binh Hydro Power JSCBinh Phuoc
4TBCThac Ba Hydropower JSCYen Bai
5SJDCandon HydroPower JSCBinh Phuoc
6SHPSouthern Hydropower JSCLam Dong
7HJSNam Mu Hydropower JSCHa Giang
8GHCGia Lai Hydropower JSCGia Lai
9DRLHydro Power JSCDak Nong
Source: Vietstock (2022) [29].
Table 2. Description of collected data.
IndexYears(I)AS(I)OE(I)EM(O)NR(O)GPYears(I)AS(I)OE(I)EM(O)NR(O)GP
Max20123,382,4122,450,451201516,355280,98020133,664,9522,610,492233496,638257,944
Min120,78384,0872533,68420,825122,77891,2252544,50426,140
Ave1,176,735717,684114220,117127,6001,262,151762,614118215,821125,384
SD1,054,154709,79358146,99277,7951,179,286758,84866137,18272,430
Max20133,639,5482,962,608275687,319396,57020155,049,3852,791,351248594,685337,172
Min117,29686,7902544,88424,775117,07898,4552556,21434,810
Ave1,331,305867,334119323,973197,8821,454,265867,379115295,879170,146
SD1,179,286758,84866137,18272,4301,522,153800,71266200,192115,276
Max20166,110,1222,832,686250512,967266,73820176,752,7832,904,728254700,107420,305
Min111,781105,8212559,82237,12595,54289,9632563,10236,145
Ave1,493,455856,411121269,328142,0441,558,390890,018122353,117205,634
SD1,798,416803,80071168,90085,0091,970,307823,19875225,594127,511
Max20187,960,4212,994,609281886,530598,45320199,048,8233,149,171268672,861453,026
Min89,63483,3642655,73032,46996,52291,4452654,98732,623
Ave1,728,333922,120126382,020227,9161,965,606984,061127331,140189,079
SD2,315,997857,60778267,476173,8412,595,676910,77179211,501127,075
Max20209,676,1653,330,257269533,011333,412202110,016,6124,010,4512551,611,214814,905
Min98,74193,9042452,50531,40298,61290,6652564,11839,758
Ave2,047,0321,034,990130301,249151,0332,110,6481,161,619125507,071280,589
SD2,782,100941,82579152,41387,3332,881,3551,118,00074451,129232,215
Note: Ave: Average; SD: Standard deviation; AS, OE, NR, and GP in Million Vietnam Dong, EM: number of employees. Source: Vietstock (2022) [29].
Table 3. Parameter space of inputs and outputs.
DMUsASOEEMNRGP
αβγαβγαβγαβγαβγ
VSH0.5000.0000.5000.0380.4630.0000.0200.0000.0770.0240.4810.0000.0000.0480.000
TMP0.0770.0000.0000.5000.0000.0250.5000.0000.0000.1660.5000.0000.1430.5000.000
TDB0.5000.0000.1540.5000.0000.0000.1920.0700.0000.5000.0000.4650.0000.0430.000
TBC0.5000.0000.0320.0000.0400.0000.5000.0000.0000.0000.0480.1240.0000.2490.150
SJD0.5000.0000.4750.5000.5000.5000.0000.0350.1250.0540.5000.0000.0280.4780.000
SHP0.5000.5000.5000.5000.5000.0000.0000.0420.0000.0240.4890.0000.0000.2470.000
HJS0.5000.0000.2840.3470.0000.2170.0000.0420.0000.0000.0430.0000.0730.0000.000
GHC0.5000.5000.5000.0000.0390.0000.5000.0000.0000.0010.0360.0000.0000.0440.000
DRL0.0000.0410.0000.0180.4510.0000.5000.0000.0000.0310.4790.0120.0180.2600.067
Table 4. Classification of MAPE indication.
DMUsASOEEMNRGP
VSH12.20%3.20%12.50%19.90%32.30%
TMP7.40%7.60%1.60%23.90%40.00%
TDB9.90%7.30%1.70%10.10%11.00%
TBC11.30%8.40%6.40%18.60%23.70%
SJD6.40%10.70%10.70%14.00%12.90%
SHP12.10%6.80%2.10%40.20%46.60%
HJS5.70%8.50%5.10%8.00%9.70%
GHC19.10%21.10%11.40%24.30%23.20%
DRL5.00%8.00%0.90%10.70%15.80%
Average13.51%
Table 5. Efficiency of hydropower suppliers from past to future.
DMU20122013201420152016201720182019202020212022202320242025
DRL1.17551.10741.13841.01500.96731.22081.08681.43121.56681.32491.58621.54411.68281.5584
GHC1.43661.63890.97610.99321.07440.88090.87781.07221.07970.99080.85490.83680.86770.8631
HJS0.63700.67401.05881.03461.06920.69760.71730.73681.12090.72781.08901.08861.15991.1764
SHP0.98870.98391.03801.03701.59750.99930.98671.04480.96450.95173.85082.47883.42422.7563
SJD0.87250.78580.76500.79981.16730.79570.72130.73620.98110.76300.76360.73350.73880.7123
TBC0.75220.77200.99870.87460.93720.83970.84960.93481.17850.82070.87090.90030.88160.8433
TDB1.32281.16471.22481.18981.25301.49651.44301.29031.45281.35801.32611.34711.32971.3523
TMP1.01441.23781.39911.24701.25681.32882.91391.07881.04921.55523.34673.20343.57642.2463
VSH0.55960.99721.00000.63331.00000.37580.40370.37610.40161.00000.99961.00001.00001.0000
Publisher’s Note: MDPI stays neutral with regard to jurisdictional claims in published maps and institutional affiliations.

