Article

Surface Roughness Improvement by Sliding Friction Burnishing of Parts Produced by Selective Laser Melting of Ti6Al4V Titanium Alloy

1
Institute of Manufacturing Science, University of Miskolc, 3515 Miskolc, Hungary
2
Institute of Engineering and Agriculture, University of Nyíregyháza, 4400 Nyíregyháza, Hungary
*
Author to whom correspondence should be addressed.
Submission received: 5 April 2022 / Revised: 16 May 2022 / Accepted: 17 May 2022 / Published: 20 May 2022
(This article belongs to the Special Issue Cutting Tools: Materials, Development and Performance)

Abstract

:
Selective laser melting is a frequently used, powder bed fusion additive manufacturing technology for producing metallic parts. However, appropriate surface quality cannot be achieved, so post-processing is often necessary. Subsequent machining of surfaces serves multiple objectives such as improvement of dimensional accuracy, changing surface roughness and modification of the residual stress state for higher surface hardness. Beyond its several advantageous properties, Ti6Al4V material has, as its weaknesses, low tribological behavior and wear resistance. Sliding friction burnishing is a conventional chipless and coolant-free environmentally conscious technology for surface modification that is appropriate for simultaneously decreasing surface roughness and increasing surface hardness. Until now, there has been a research gap regarding the diamond burnishing of selective laser melted Ti6Al4V parts. In this study, we investigated how the surface roughness of selective laser melted parts can be modified via sliding friction burnishing. 2D and 3D characteristics of surface roughness were measured by a chromatic roughness measuring device. Indices of surface roughness improvement were defined and studied as a function of selective laser melting parameters. Optimal manufacturing parameters of laser power—P = 280 W and scanning speed u = 1200 mm/s—for effective surface improvement via burnishing are proposed.

1. Introduction

1.1. Metal Selective Laser Melting

Additive manufacturing (AM) began gaining traction in industry as a paradigm near the end of the twentieth century. There are several names used for AM, such as rapid prototyping, rapid tooling, 3D printing, freeform fabrication, and layer-by-layer manufacturing. These names reflect how the function of AM has changed in industry since its inception, from prototyping to the mass production of fully functional near net shape parts [1]. Additive manufacturing can be related to different materials, such as distinct types of plastics and metals. In the case of plastics, there exist many different examinations. Monkova et al. studied the use of 3D printing technology from an acoustic point of view. They also dealt with the examination of sound reflection and sound absorption properties. It was found that the sound reflection behavior of the PLA samples they examined was influenced not only by the type of 3D-printed, open porous material structure, but also by the excitation frequency, porosity of the total volume, and thickness of the specimen [2]. The sound-absorbing property has been found to be influenced by a number of factors as well, including the type of 3D printed material structure [3].
Metal AM is often applied for materials which are hard to machine, optimized geometries, lattices, and composite materials such as metals which are combined with each other, or ceramics [4].
In this paper, we consider parts manufactured by one of the laser powder bed fusion (LPBF) technologies—selective laser melting (SLM). SLM is an additive manufacturing process used in regards to near net shape metal parts. In this method, a layer of metal powder is repeatedly melted by a laser beam in an inert gas atmosphere. Physical phenomena arising as a result of the SLM process can be assessed in three topics. Interaction between the laser and material lead to local heating and melting of the powder. The absorption rate of the laser’s energy depends on the substance of the metal, particle size, and morphology. Energy flow density and distribution within the part under production can be influenced by manufacturing parameters, the most influential of which are laser beam power, scanning speed, hatch distance, and layer thickness [5]. The second topic in SLM is balling, which is due to tension and the insufficient wetting of molten material. Ball formation depends on the oxygen content of inert gas due to oxide film formation and can be oppressed via rescanning. The third group of physical phenomena covers high temperature change rate, temperature gradient during the SLM process, and high residual stresses in the manufactured part which may lead to cracks or fractures in the workpiece. Residual stress can be reduced by so-called sectorial scanning and heat treatment [6]. The microstructure and porosity of parts can be controlled via the optimization of manufacturing parameters, but it is a highly complex task because there are a large number of factors, affected properties, and correlations [7].
Postprocessing usually follows SLM manufacturing. In most cases, surface modification is the main purpose. Surface quality significantly affects the high cycle fatigue life [8]. The most frequently applied methods are sandblasting, polishing, shape adaptive grinding [9], ultrasonication, pulsed laser [10], laser remelting [11], and hot isostatic pressing [12]. Surface treatment may be a preparation for a complex coating for special applications [13]. Porous and lattice structures have significant internal surfaces which cannot be reached via the postprocessing methods mentioned above. In this case, chemical and electrochemical methods come into prominence [14].

1.2. Material Ti6Al4V

Nowadays, alloys of titanium (Ti) are applied in many different fields of industry for aircraft and space engines, medical surgery tools, medical implants, food processing, pharmaceutical and chemical instruments, pharmaceutical machines, automobiles, nuclear and other types of energy generation, and marine vehicle parts. Ti alloys may enter industrial processes in either wrought or additively manufactured form. Alloys often have more advantageous properties than pure Ti.
Intensive biomedical research activity has been invested into lattice structures made from Ti alloys by AM technologies, in most cases SLM. Mechanical properties, microstructures with special focus on material pores [15], and the effects of manufacturing parameters on those are studied [16].
Ti6Al4V is the most popular alloy of Ti. It produces approximately half of the market share of Ti alloy production of the world, most of which is used in the aircraft industry, but also applied in all of the fields listed above [17]. The main advantages of Ti6Al4V are low mass density, high strength relative to most of the other Ti alloys, chemical endurance, and biocompatibility [18].
However, the Ti6Al4V alloy has a disadvantage—namely, poor tribological properties. It has weak wear resistance, unstable friction coefficient, and a tendency toward adhesion, micro-welding at higher temperatures (500 °C) [19]. Research results on wrought (conventionally produced, not by AM) parts show that several opportunities are applicable for improving the wear properties of Ti6Al4V parts [20]. Hydrostatic ball burnishing proved to be applicable to improve the fretting wear resistance of the Ti6Al4V alloy [21].
From the perspective of metallography, Ti6Al4V is an alpha–beta alloy. Al is an alpha stabilizer; V is a beta stabilizer. Usually, three metallographic phases are present in Ti6Al4V: hexagonal alpha, body-centered cubic beta, and the alpha-plus-beta (alpha + beta) dual phase. At room temperature, approximately 91% of the alloy is present in the alpha phase [22]. The Ti6Al4V alloy is heat treatable, and appropriate heat treatment improves the mechanical and wear properties, as well as the fatigue lifetime [23].
In our experiments, samples were built from the Ti6Al4V (TC4, Ti64) alloy material melted from EOS Titanium Ti64ELI powder. Chemical composition of this powder can be characterized as 5.5–6.75 wt% Al, 3.5–4.5 wt% V; the balance is composed of Ti, and elements such as O, N, C, H, and Fe are guaranteed to be under a certain low limit. This is a Grade 25 titanium alloy, with reduced content of oxygen, nitrogen, carbon, and iron, containing extra low interstitials (ELI), ensuring higher ductility and improved fatigue resistance related to Grade 5 Ti6Al4V materials. Therefore, it is suitable for medical implants and devices. The size of the metal alloy powder particles varies in the range of 20–80 micrometers according to the data sheet [24].

1.3. Application of the Diamond Burnishing Process on Outer Cylindrical Surfaces

The substance of mechanical surface treatment is the plastic deformation of surface irregularities caused by sliding or rolling friction between the deforming element and the surface to be treated. The peaks of the protrusions are plastically deformed, as they flow into the valleys of the metal. As a result, the material hardens. At the same time, the contact between the deforming element and the surface to be treated increases and the metal increases its resistance to further deformation. Thus, the plastic deformation ends below a certain depth below the surface, and only elastic deformations occur below this level [25,26]. In the case of burnishing, there is no need for coolants, only lubricants such as other low environmental loading dry machining systems [27,28].
Sliding friction burnishing is a static mechanical surface treatment method. The main advantage of the method is that it can be implemented with simple tools and equipment. If the forming element is made of artificial or natural diamond, the method is called diamond burnishing or sliding friction diamond burnishing.
Sliding friction burnishing is kinematically similar to turning, but instead of the edge of the cutting tool, the spherical pressed end of the deforming element moves on the sur-face to be machined. The method creates a plastic deformation on the surface of the treated workpiece and in the subsurface layers near the surface (Figure 1).
Sliding friction burnishing tools can be used on any conventional and CNC (computer numerically controlled) lathe or CNC lathe centers. Thus, immediately after metal cutting, the workpieces can be burnished in the same setup as the cutting. Sliding friction burnishing can be used to treat outer cylindrical surfaces, large diameter inner cylindrical surfaces, and even flat surfaces. The main technical and technological parameters of the preparation of the sliding friction burnishing process are as follows: the deforming element’s spherical radius r, mm; burnishing force F [N]; feed f [mm/rev]; burnishing speed v [m/min]. Additional factors may include the number of passes of burnishing i and the type of lubricant.
The technology of burnishing has been studied by several researchers on different material qualities with different tools in order to meet different expected requirements. Some examples of this, without wishing to be exhaustive, are as follows: Many researchers have experimentally shown that mechanical surface treatment increases surface wear resistance and surface integrity [29,30]. The research topic of Kato et al. was the improvement of wear resistance with a nanostructured surface layer produced by burnishing [29]. Rao et al. investigated the effect of ball burnishing parameters on the surface roughness and corrosion resistance of two-phase steels [31]. Korzynski et al. developed experimental models, establishing correlations between burnishing technology parameters and characteristics of surface integrity [32]. The burnishing process of non-ferrous metals with a PCD (polycrystal diamond, an artificial diamond) burnishing tool was investigated by Luo et al. [33]. Maximov et al. studied the effect of changes in technological parameters of the burnishing process on surface roughness, microhardness, and residual stresses when burnishing high-strength aluminum alloys [25]. An analysis of the texture of a cylindrical surface was done by Swirad based on a sliding friction diamond burnishing experiment [34]. Hamadache et al. dealt with ball burnishing to improve the surface conditions of a workpiece, and the material quality of the burnished workpiece was 36CrNiMo6 [26]. Tobola et al. proposed new indicators for the evaluation of the burnished surface [35]. Maximov et al. investigated the effect of the sliding friction diamond burnishing method on the surface integrity of AISI 316Ti chromium-nickel steels [36]. Dzierwa and Markopoulos studied the effect of the ball-burnishing operation of 42CrMo4 material steel surfaces executed with different burnishing technology parameters on the surface roughness and residual stress [37].

1.4. State of the Art and Aims

This section gives an overview on the application of sliding friction diamond burnishing to Ti6Al4V alloys, especially to parts produced by SLM.
There are several solutions for the surface modification of additively manufactured parts depending on their functionality and for the purpose of surface treatment. From our point of view, it is advisable to classify the surface modification tasks by the shape of the part into two main categories. The first one is the surface modification of parts with a compact (simple) shape; the second is of parts which have complicated (trabecular, porous) geometry. In the following, we focus on parts with compact geometry.
In the case of compact parts, there are few well-defined surfaces which can be accessed relatively easily by conventional tools. If it is possible, the process of surface modification has the advantage of effectiveness and direct controllability. Studies on the machinability of titanium alloys show that it is sensitive for technological parameters and also the composition of the material [38]. The effect of ultrasonic vibration turning (UVT) on the wear properties of the cylindrical faces of Ti6Al4V samples were studied and it was concluded that UVT is a potential technology for machining the surfaces of parts produced for biomedical applications [39]. Surface adaptive grinding is a process for decreasing surface roughness even with 3 magnitudes down, achieving 10 nm Ra [9] where Ra is the arithmetic mean deviation.
Diamond burnishing is a special technology with the strength of the simultaneous improvement of two essential features of surface; namely, surface roughness and surface hardness. It is also applied as a preparatory treatment before the sulphonitriding of tool steel surfaces [40]. Surface roughness modification as function of sliding force, speed, and feed rate was studied experimentally for shafts made from 42CrMo4 material [41]. For carbon steel with a silicon nitride ball, it has been shown that slide burnishing has a strong effect on surface roughness, and the influence of the ball size and force has been studied in detail [42]. Reports on the burnishing experiments of Ti6Al4V material are known in the case of wrought test specimens [43,44].
Various burnishing methods have been reported to be successfully applied for the surface modification of different additively manufactured metallic parts. Good results in the decrease of surface roughness were reached via experimental investigation of the effect of machining parameters for steels [45,46,47]. The fatigue life of additively manufactured steel parts was investigated via experimental work and simulation, demonstrating that burnishing has a significant positive effect on fatigue lifetime [48]. Ultrasonic vibration assisted burnishing was applied to the AlSi10Mg alloy for the improvement of surface roughness, hardness, and filling ratio [49]. Low plasticity burnishing combined with grinding was applied to nickel-based superalloy 718 [50]. In this paper, titanium alloys are mentioned, but only nickel-based superalloys are studied.
In the case of metallic, Ti6Al4V parts additively manufactured by SLM diamond burnishing may especially attract attention since the application of SLM is emerging and the necessity of the postprocessing of a surface produced by this technology is beyond question. We can see a research gap in this field, especially regarding the burnishing of Ti6Al4V alloys, and this is what we study here.
In our study, the surface modification of cylindrical shaped Ti6Al4V parts produced by SLM technology with diamond burnishing was investigated via factorial experiment design. In this paper, we demonstrate results regarding the effect on surface roughness and morphology, and empirical formulas linking manufacturing parameters, machining parameters, and surface roughness indices obtained via numerical regression.

2. Materials and Methods

2.1. Material and Samples

Cylindrical test specimens for experiments were manufactured with the dimensions 50 mm in length and 10 mm in diameter. The manufacturing machine was an EOS-M290/400W. Specimens were fabricated with 5 different manufacturing parameter setups, and 8 specimens were made for each setup. Two manufacturing parameters (infill laser power and infill laser speed) were varied, as shown in Table 1. Additionally, energy input is also involved in Table 1; although it is not an experimental factor, it is an interesting and important quantity determined by laser power, laser scan speed, hatch distance, and layer thickness. Two of the experimental factors are related to the SLM process, namely infill laser power (P) and infill laser scan speed (u). The default values of those are P = 280 W and u = 1200 mm/s. Levels were selected so that A, B, D, and E setups form a two-factor, two-level factorial subset. Additionally, C, D, and E belong to the same input energy density, so this provides an opportunity to compare results for samples produced with the same energy input, but with different power (P) and scan speed (u). In the discussion, we will refer to energy input values. The most important parameters were kept constant for each specimen. These are a layer thickness of 0.03 mm and a hatch distance of 0.14 mm.
Otherwise, parameters for down skin, up skin layers, contour and edge areas of the model were manufactured with default values of the machine and were the same for each specimen.
The material of the test specimens was Ti6Al4V. EOS Titanium Ti64ELI powder was applied with the material composition 5.5–6.75 wt% Al, 3.5–4.5 wt% V, where the remainder is Ti, O, N, C, H, and Fe content is guaranteed to be under a certain limit [51].
Electron microscopic images were used to display the surface porosity of the samples (Figure 2 and Figure 3).
Figure 2 and Figure 3 show the original surface of a sample before diamond burnishing. Partially molten dust particles are visible on the surface. The inequalities are 100 µm. In this sample, no pore defects can be detected at more than 100 µm from the surface.

2.2. Experimental Parameters for Sliding Diamond Burnishing

The burnishing was executed by a PCD tool with a radius of R = 2.7 mm. Figure 1 shows a general setup for diamond burnishing; however, our experiments were used when α = 0°. The surface roughness of the burnishing diamond was Ra = 0.3 µm.
In the various experiments, the factors include burnishing speed (v), feed (f), and burnishing force (F) (in burnishing it can be denoted Fb as well).
To apply the full experimental design method, the values of the selected factors were set to 2 levels (minimum, maximum), which are summarized in Table 2.
In determining the numerical values, we considered the results of our previous theoretical and experimental research.

2.3. Measured Characteristics and Dimensionless Characteristics

The roughness indices used for the micro geometric description of the surface can be grouped according to the following classification:
  • amplitude (height or depth) parameters
  • spacing (profile or longitudinal) parameters
  • material ratio parameters
  • functional metrics
  • hybrid parameters
Among the 2D roughness parameters, the following are often used (ISO21920-2:2021) [52]:
  • Maximum height (Rz)
  • Arithmetic mean deviation (Ra)
  • Root mean square deviation (Rq)
The use of 3D parameters is also becoming more common. The most common of these [52] are (ISO21920-2:2021).
  • Maximum height (Sz)
  • Arithmetical mean height (Sa)
  • Root mean square height (Sq)
Ra is calculated as the Roughness Average of surface measured microscopic peaks and valleys. Ra is the most frequently used 2D roughness parameter, and that is why Ra was chosen for the examination. This parameter gives a good possibility for comparing the surface quality before and after burnishing. We have determined the other two 2D roughness parameters (Rz and Rq) as well; however, we analyse only Ra here.
Interpretation of the 3D arithmetical mean height (Sa): This parameter expands the profile (line roughness) parameter Ra three dimensionally. It represents the arithmetic mean of the absolute ordinate Z(x, y) within the evaluation area. We have determined the other two 3D roughness parameters (Sz and Sq) as well; however, we analyse only Sa here.
The 2D and 3D surface roughness parameters were measured on the 3D Optical Profilometer type AltiSurf©520. CL2 MG140 chromatic optical sensor was used, where the nominal measuring range is 300 μm, Z-direction (perpendicular to the measuring surface) resolution is 0.012 μm, X and Y resolution is 1.55 μm, and accuracy is 0.06 μm. In the case of 2D surface roughness measurement, the measuring length was chosen to be 12.5 μm. With 3D surface roughness measurements, the measuring range was 4 mm × 4 mm. In one direction, the laser scanning was performed at 1 μm, while perpendicular to the recorded planes the distance between them was 5 μm. Concretely, the surface roughness was measured at 3 locations, 120° from each other (I, II, and III in Figure 4). The mean values of both 2D and 3D measured roughness values were calculated separately.
In Figure 4, “Sign” means one letter for the parameter setup. Specifically, it can be A, B, C, D, or E. These letters appear at the end of the bars.
In order to make the change of the measured characteristics more illustrative, we created a dimensionless roughness improvement ratio, which was calculated using Formula (1) [53]:
ρ R a ,   % = R a b b R a a b R a b b · 100 %
where:
Rabb—Value of arithmetic mean deviation (Ra) before burnishing, μm;
Raab—Value of arithmetic mean deviation (Ra) after burnishing, μm.
If the value of the ρ R a ,   % ratio is the higher positive number, the greater the roughness improvement due to burnishing.
The dimensionless roughness improvement ratio for the average surface roughness Sa was created according to Formula (2):
ρ S a ,   % = S a b b S a a b S a b b · 100 %
where:
Sabb—Value of arithmetical mean height (Sa) before burnishing, μm;
Saab—Value of arithmetical mean height (Sa) after burnishing, μm.
The higher the positive value of the ρ S a ,   % ratio, the greater the roughness improvement due to burnishing.

3. Results

In this section, experimental measurement results of Ra are presented. The change in Ra is calculated, and manufacturing parameter setups are ranked by their efficacy in decreasing two-dimensional roughness.
Next, three-dimensional roughness measurements are demonstrated. Arithmetical mean height (Sa) experimental measurement results are listed and improvement ratios are calculated. Then, manufacturing parameter setups are ranked according to how effective those are in decreasing surface roughness.
In both cases mentioned above, empirical formulas are given for how improvement ratios depend on manufacturing parameters by trivariable function regression.

3.1. Measurement Results on Ra

The arithmetical mean deviation of the profile (average roughness values) Ra measured before and after burnishing, as well as the dimensionless roughness improvement ratio calculated by Formula (3), are summarized in Table 3.

3.2. Empirical Formulas by Function Regression to Ra Experimental Results

Using the full factorial experimental design, empirical Formulas (3)–(7) were determined by a MathCAD program. The results of calculations were illustrated in axonometric figures (Figure 5, Figure 6, Figure 7, Figure 8 and Figure 9).
ρ R a , A = 128.8878 5.594 · v 1.089 · 10 3 · f 0.491 · F + 132.947 · v · f + 0.054 · v · F + 10.987 · f · F 1.436 · v · f · F
ρ R a , B = 27.3127 + 8.822 · v + 1.947 · 10 3 · f + 0.882 · F 205.574 · v · f 0.078 · v · F 12.169 · f · F + 1.418 · v · f · F
ρ R a , C = 157.0861 9.293 · v 967.307 · f 0.813 · F + 92.34 · v · f + 0.085 · v · F + 9.231 · f · F 0.768 · v · f · F
ρ R a , D = 86.1776 1.484 · v 404.972 · f + 0.426 · F + 29.205 · v · f 0.041 · v · F 8.406 · f · F + 1.043 · v · f · F
ρ R a , E = 13.436 + 10.256 · v + 140.986 · f + 1.104 · F 71.652 · v · f 0.121 · v · F 4.865 · f · F 0.997 · v · f · F
An analysis of the effect of different burnishing parameters on surface roughness improvement for 2D roughness measurement results is shown in Figure 5, Figure 6, Figure 7, Figure 8 and Figure 9 and can be done based on the figures. Better surface roughness can be achieved by applying a burnishing force of F = 120 N (for B, C, D, E specimens). Furthermore, a lower burnishing speed (v = 8.321 m/min) and a higher feed (f = 0.05 mm/rev) result in a significant improvement in surface roughness.

3.3. Measurement Results Empirical Formulas by Function Regression on Rz and Rq

The Rz and Rq parameters were measured and evaluated similarly, as Ra can be found in Section 3.1 and Section 3.2. Without giving all the information, the resulting equations in compact form for specimen A, B, C, D, and E are in Equation (8) and Table 4.
ρ R z   o r   q = C 0 + C 1 · v + C 2 · f + C 3 · F + C 12 · v · f + C 13 · v · F + C 23 · f · F + C 123 · v · f · F

3.4. Ranking Experimental Setups by Improvement Ratios ρ R a , ρ R z and ρ R q Calculated from Measurements

The experiments performed were ranked based on improvement ratios. The highest improvement ratio 83.58 (Experiment B7) is given a value of 1 and the lowest 64.19 (C2) is given a value of 40. The results of the queuing are shown in Table 5.
Then, we rearrange the improvement values according to the different specimen sings. It is then possible to add the sequence numbers for each specimen, where the sum of the smallest sequence numbers indicates that the test pieces produced with that technology had the best overall performance, i.e., the best improvement index. It can be seen in Table 6 that the B7 cylinder had the best 2D roughness improvement ratio.
In accordance with the analysis of Figure 5, Figure 6, Figure 7, Figure 8 and Figure 9, burnishing parameter setting (v = 8.321 m/min; f = 0.05 mm/rev; F = 120 N) provides the best roughness improvement ratio value. The surface roughness improvement was similarly outstanding for the E5 and D5 specimens, for which the lower feed was used at the same F and v (f = 0.0125 mm/rev). The order of the improvement indices in Table 5 is shown for Ra in Table 6, for Rz in Table 7, and Rq in Table 8.
The improvement ratio indices on cylinders manufactured with different technologies next to the Sa, Sz, and Sq were determined as well. The summarizing result can be found in Table 9.
The roughness profiles measurement locations on the specimen, 120° relative to each other (Figure 4), before and after burnishing are shown in Figure 10.
Figure 10 demonstrates that before burnishing profile amplitudes vary between ±80 µm, after burnishing this change is under ±10 µm, so the improvement in maximum profile heights is clearly visible.
Let us consider the 3D roughness parameter as the 3D average surface roughness (Sa).

3.5. Experimental Results on Surface Roughness Values Sa

Table 10 summarizes the measured average surface roughness values Sa before and after burnishing, as well as the dimensionless roughness improvement ratio calculated by Formula (4).

3.6. Empirical Formulas by Function Regression to Sa Improvement Ratio ρ S a Data

The determined empirical formulas are in Equations (9)–(13), and their content is illustrated in axonometric figures in Figure 11, Figure 12, Figure 13, Figure 14 and Figure 15.
ρ S a , A = 161.9242 12.12 · v 1.62 · 10 3 · f 0.813 · F + 243.08 · v · f + 0.109 · v · F + 19.786 · f · F 2.921 · v · f · F
ρ S a , B = 231.2757 + 28.081 · v + 6.945 · 10 3 · f + 2.777 · F 676.858 · v · f 0.264 · v · F 60.978 · f · F + 6.037 · v · f · F
ρ S a , C = 17.5632 + 9.379 · v + 2.168 · 10 3 · f + 0.685 · F 235.476 · v · f 0.089 · v · F 20.842 · f · F + 2.53 · v · f · F
ρ S a , D = 46.0771 + 10.206 · v + 5.148 · 10 3 · f + 1.611 · F 481.992 · v · f 0.149 · v · F 63.512 · f · F + 6.014 · v · f · F
ρ S a , E = 101.2445 + 19.975 · v + 1.893 · 10 3 · f + 2.245 · F 252.075 · v · f 0.251 · v · F 32.668 · f · F + 3.87 · v · f · F
An analysis of the effect of different burnishing parameters on the surface roughness improvement ratio for 3D roughness measurement results is shown in Figure 11, Figure 12, Figure 13, Figure 14 and Figure 15 and can be done based on the figures. It can be seen that better surface roughness can be achieved by applying a burnishing force of F = 120 N to all specimens in the appropriate range. A lower burnishing speed (v = 8.321 m/min) improves (especially at lower feeds) and a lower feedrate (f = 0.0125 mm/rev) increases (especially at lower speeds) the improvement of Sa, 3D surface roughness.

3.7. Measurement Results for Empirical Formulas by Function Regression on Sz and Sq

The Sz and Sq surface roughness parameters were measured and evaluated similarly, as Sa can be found in Section 3.5 and Section 3.6 as well. Without giving all the information, the resulting equations in compact form for specimen A, B, C, D, and E are in Equation (14) and Table 11.
ρ S z   o r   q = C 0 + C 1 · v + C 2 · f + C 3 · F + C 12 · v · f + C 13 · v · F + C 23 · f · F + C 123 · v · f · F

3.8. Ranking Experimental Setups by Surface Roughness Improvement Ratios ρ S a

The queuing was also performed here based on the improvement ratios. The highest improvement ratio was obtained via experiment E5, with a value of 77.72, and experiment A8 was ranked 40th with the lowest improvement ratio, 49.53. The results of the ranking are shown in Table 12.
Again, we rearrange the improvement values according to the different specimen signs (Table 13). It is then possible to add the sequence numbers for the specimens, and the lowest sequence number indicates that the specimens produced with that technology had the best overall improvement index.
The order of the improvement indices in Table 12 is shown in Table 13. According to Table 12, the specimen marked E provided the best values based on the average surface roughness (Sa) improvement number, and the specimens marked A and C provided the worst. It can be seen from Table 12 that the specimen E5 had the best 3D roughness improvement ratio. In accordance with the analysis of Figure 11, Figure 12, Figure 13, Figure 14 and Figure 15, burnishing parameter setting (v = 8.321 m/min; f = 0.0125 mm/rev; F = 120 N) provides the best 3D roughness improvement ratio value. The surface roughness improvement was similarly outstanding for the D5 specimen with the same burnishing parameter setting.
The improvement ratio indices on cylinders manufactured with different technologies next to the Sa, Sz, and Sq were determined as well. The results of evaluation Sz and Sq are not shown here. The summarizing result can be found in Table 14.
It can be seen in Table 12 that on the cylinder, signed E5 served the best 3D roughness improvement ratio. The 2–2 3D roughness topographies on the cylinder surfaces 120° relative to each other (Figure 4) can be displayed before and after burnishing. However, these topographies are very similar in reality; that is, why only one topography of the 4 mm × 4 mm portion is demonstrated in Figure 16 is related to specimen A of measuring plane 1 before and after burnishing.
By comparing Table 9 and Table 14, the absolute order can also be determined. We do this by assigning the best, first place winner 1 point, while the last and 5th place gets 5 points. Accordingly, the absolute order was established and can be seen in Table 15.
Based on the performed experiments and analyses, it can be stated that the specimen marked E provided the best results, with the production parameters laser power P = 280.00 W and laser speed u = 1200 mm/s.
Based on the experimental results, we examined the effect of the production parameters on the improvement of the surface roughness obtainable by diamond burnishing on the specimens, and furthermore for the surface machinability of the specimens. For this purpose, we performed the ranking of the production parameters according to the power of the infill laser (Table 1), on the basis of which the following conclusions can be made.
The highest roughness improvement (best machinability) is achieved at the applied medium infill laser power and infill laser speed (specimen E, Table 11).
Compared to the production parameters of the specimen group “E”, both the decrease in the speed of movement of the infill laser speed, thereby reducing the power density (specimens A) and the decrease in the infill laser power, thereby increasing the power density (specimens B), which reduces the available surface roughness improvement (machinability).
A good result in machinability is obtained if the infill laser power and the infill laser speed are decreased simultaneously (specimens D), which leads to the power density used for specimen group E.
Increasing the infill laser power and infill laser speed simultaneously to the maximum value (specimens C) leads to the worst result in terms of machinability, although this parameter setting also results in the power density used for specimens marked E and D. This result demonstrates that power density itself is not eligible for predicting machinability, and one must go into detail regarding processing parameters.
Thus, in terms of the available roughness improvement (best machinability), the production parameters of the specimen group marked E can be considered optimal in the tested range.

4. Discussion

In this study, it was investigated as to how the surface quality of parts manufactured by additive manufacturing can be improved by a conventional technology applied as postprocessing.
The quality of the surface was characterized by the examination of Ra, Rz, and Rq, and furthermore, Sa, Sz, and Sq. Another typical feature in surface improvement examinations is the study hardness improvement, which has been previously analysed [54]. Our paper “Measurement of the surface hardness of titanium alloy samples produced by additive manufacturing” [55] is currently under publication. Variation of the parameters may seem too simple, requiring only two levels to be considered for all three parameters, but this is a feature of the full factorial experimental design. They can be defined using the main features of parameter relationships.
We selected sliding friction diamond burnishing as the postprocessing operation. In this case, we varied burnishing speed, feed, and burnishing force. Parameters of diamond burnishing were determined according to the full factorial design of the experiment with two levels and three factors, meaning that for each SLM parameter combination, eight different diamond burnishing experiments were performed. Before and after postprocessing, the two most important surface roughness characteristics were measured via the Ra 2D and the Sa 3D surface roughness parameters. Based on surface roughness characteristics, we determined roughness improvement ratio indices for each case.
The effect of burnishing parameters on surface roughness improvement was determined. Based on the results of the 2D roughness measurements, we found that the higher burnishing force F = 120 N, the lower burnishing speed (v = 8.321 m/min), and the higher feed (f = 0.05 mm/rev) resulted in a significant improvement in surface roughness. Functions fitted to the data of the 3D roughness measurement results also showed that the application of higher burnishing force and lower burnishing speed provides better surface roughness improvement, but at a lower feed rate (f = 0.0125 mm/rev). In line with the above findings, It can be stated that for both 2D and 3D roughness improvement ratios, burnishing parameter setting No. 5 (v = 8.321 m/min; f = 0.0125 mm/rev; F = 120 N) results in the most favourable roughness improvement (see samples E5, D5).
Furthermore, we evaluated in which case the best surface roughness improvement can be achieved. For this reason, we ordered and classified measurement results. It was found that the best improvement of surface quality could be achieved on samples with SLM parameter setup E, and the worst with C.
Results can be evaluated from the viewpoint of SLM energy input (see Table 1). Energy input is equal in the sample series D, E, and C, and has the value of 55.55 W/mm3. However, machinability of their surface shows substantial differences. This demonstrates the fact that energy input is not an appropriate factor to predict how the surface of an SLM manufactured part can be diamond burnished. How that energy was carried into the powder is an important factor. In the case of the E SLM parameter setup, both laser power and laser scan speed have the medium value. Similarly good results can be obtained by reducing the laser power and the laser scanning speed (SLM parameter setting D). In the case of C, the situation is just the opposite: laser power and laser scan speed are high. These three SLM parameter setups are identical from the viewpoint of the quantity of energy input, but differ in their form, and as we saw, their results in surface roughness improvement during postprocessing are just the two extremes: the best and the worst. This implies that when an SLM manufacturing process with postprocessing is being designed, the interaction of parameters of the two processes must be considered. More accurate functions can be set up with a larger number of samples.
Electron microscopic images were used to examine the surface of the samples after diamond burnishing. Figure 17 and Figure 18 show the diamond burnished surface and the macro photo of the cross-section.
Compared to Figure 2 and Figure 3, Figure 17 and Figure 18 clearly show the positive effect of sliding friction diamond burnishing. A significant reduction of surface irregularities, deformation of surface particles, and a decrease of surface pores can be observed. Diamond burnishing smoothes out surface irregularities and flattens grains and pores on the surface. The size of the pore defect is typically less than 20 µm, their number small enough to establish that their presence does not significantly affect the results of the surface treatment processes. The positive effect of sliding diamond burnishing on surface roughness was also confirmed via electron microscopy (Figure 17 and Figure 18).

5. Conclusions

In this paper, it was demonstrated that surface modification of SLM-ed Ti6Al4V cylinders with sliding friction diamond burnishing results in significant improvement of the surface roughness of selective laser melted titanium parts, especially values of Ra, Rz, and Rq, and furthermore, Sa, Sz, and Sq indices, which is confirmed by ρ R a , ρ R z , ρ R q and ρ S a data presented.
The effects of three burnishing parameters and two SLM processing parameters were studied.
Surface roughness improvement indices ρ R a   ρ R z , ρ R q and ρ S a are applicable for the complex featuring of surface roughness formed via the diamond burnishing of SLM-ed Ti6Al4V parts and grant an opportunity to compare and rank outcomes of machining, since they involve most important surface roughness parameters.
Empirical formulas fit to experimental results provide guidance for how best surface roughness can be achieved via sliding friction diamond burnishing. It was found that among the investigated burnishing parameter setting, the most favorable roughness improvement results for both 2D and 3D improvement ratios when v = 8.321 m/min; f = 0.0125 mm/rev; F = 120 N.
SLM power density (energy input) itself is not applicable for predicting machinability, and it stands in relation directly with power density and scanning speed.
Our study has attested that SLM processing parameters significantly influence machinability that is surface quality improvement by diamond burnishing. Parameter combination P = 280 W, u = 1200 mm/s was found to be optimal on a studied parameter domain. This parameter set differs from default settings of the SLM machine.
A future study may search for and reveal an explanation for this optimum-like behavior of machinability with the sliding friction diamond burnishing of parts made of Ti6Al4V material via selective laser melting.

Author Contributions

Conceptualization, G.V., G.D. and F.S., methodology, G.V., G.D., F.S., software, G.V.; validation, G.V.; formal analysis, G.V.; investigation, G.V., G.D., F.S.; resources, G.V., G.D.; data curation, G.V.; writing—original draft preparation, G.V., G.D., writing—review and editing, G.V., G.D.; visualization, G.V., G.D.; supervision, G.V., G.D. and F.S.; project administration, G.V., G.D.; funding acquisition, G.V., G.D. All authors have read and agreed to the published version of the manuscript.

Funding

This research was funded by the National Research, Development and Innovation Office (Hungary), grant number NKFI-125117. This research was co-funded by Deputy State Secretariat for the Implementation of Economic Development Programs of Hungary in a project entitled “Research of osteosynthesis of implants and development trabecular structure using additive manufacturing”, with identification number: GINOP-2.2.1-15-2017-00055.

Institutional Review Board Statement

Not applicable.

Informed Consent Statement

Not applicable.

Data Availability Statement

Not applicable.

Acknowledgments

Project no. NKFI-125117 has been implemented with the support provided from the National Research, Development, and Innovation Fund of Hungary, financed under the K_17 funding scheme. This work was co-supported by a project entitled “Research of osteosynthesis of implants and development trabecular structure using additive manufacturing”, and with identification number: GINOP-2.2.1-15-2017-00055. Test specimens were manufactured at the Biomechanical Laboratory at University of Debrecen, Hungary within the research work of the project.

Conflicts of Interest

The authors declare no conflict of interest.

References

  1. Srivastava, S.; Sharma, A.; Kushvaha, V. Applications of additive manufacturing. In Additive and Subtractive Manufacturing of Composites; Rangappa, S.M., Gupta, M.K., Siengchin, S., Song, Q., Eds.; Springer: Singapore, 2021; pp. 201–226. [Google Scholar] [CrossRef]
  2. Monkova, K.; Vasina, M.; Monka, P.P.; Vanca, J.; Kozak, D. Effect of 3D-printed PLA structure on sound reflection properties. Polymers 2022, 14, 413. [Google Scholar] [CrossRef] [PubMed]
  3. Vasina, M.; Monkova, K.; Monka, P.P.; Kozak, D.; Tkac, J. Study of the sound absorption properties of 3D-printed open-porous ABS material structures. Polymers 2020, 12, 1062. [Google Scholar] [CrossRef] [PubMed]
  4. Sun, C.; Shang, G. On application of metal additive manufacturing. World J. Eng. Technol. 2021, 9, 194–202. [Google Scholar] [CrossRef]
  5. Buican, G.R.; Oancea, G.; Lancea, C.; Pop, M.A. Influence of layer thickness on internal structure of parts manufactured from 316-L steel using SLM technology. Appl. Mech. Mater. 2015, 809–810, 369–374. [Google Scholar] [CrossRef]
  6. Yap, C.Y.; Chua, C.K.; Dong, Z.L.; Liu, Z.H.; Zhang, D.Q.; Loh, L.E.; Sing, S.L. Review of selective laser melting: Materials and applications. Appl. Phys. Rev. 2015, 2, 041101. [Google Scholar] [CrossRef]
  7. Shipley, H.; McDonnell, D.; Culleton, M.; Coull, R.; Lupoi, R.; O’Donnell, G.; Trimble, D. Optimisation of process parameters to address fundamental challenges during selective laser melting of Ti-6Al-4V: A review. Int. J. Mach. Tools Manufact. 2018, 128, 1–20. [Google Scholar] [CrossRef]
  8. Vayssette, B.; Saintier, N.; Brugger, C.; Elmay, M.; Pessard, E. Surface roughness of Ti-6Al-4V parts obtained by SLM and EBM: Effect on the high cycle fatigue life. Procedia Eng. 2018, 213, 89–97. [Google Scholar] [CrossRef]
  9. Beaucamp, A.T.; Namba, Y.; Charlton, P.; Jain, S.; Graziano, A.A. Finishing of additively manufactured titanium alloy by shape adaptive grinding (SAG). Surf. Topogr. Metrol. Prop. 2015, 3, 024001. [Google Scholar] [CrossRef]
  10. de Lima, M.S.F.; Almeida, I. Surface modification of Ti6Al4V alloy by pulsed lasers: Microstructure and hydrophobic behavior. Mat. Res. 2017, 20, 8–14. [Google Scholar] [CrossRef]
  11. Temmler, A.; Qi, S. Surface structuring by laser remelting (WaveShape): Microstructuring of Ti6Al4V for a small laser beam diameter and high scan speeds. Micromachines 2021, 12, 660. [Google Scholar] [CrossRef]
  12. Cosma, C.; Balc, N.; Moldovan, M.; Morovic, L.; Gogola, P.; Borzan, C. Post-processing of customized implants made by laser beam melting from pure Titanium. J. Optoelectron. Adv. Mater. 2017, 19, 738–747. [Google Scholar]
  13. Cosma, S.C.; Balc, N.; Moldovan, M.; Miron-Borzan, C.S. Surface treatments applied on titanium implants. Ovidius Univ. Ann. Chem. 2015, 26, 41–48. [Google Scholar] [CrossRef] [Green Version]
  14. Pyka, G.; Kerckhofs, G.; Papantoniou, I.; Speirs, M.; Schrooten, J.; Wevers, M. Surface roughness and morphology customization of additive manufactured open porous Ti6Al4V structures. Materials 2013, 6, 4737–4757. [Google Scholar] [CrossRef] [Green Version]
  15. Mierzejewska, Ż.A. Effect of laser energy density, internal porosity and heat treatment on mechanical behavior of biomedical Ti6Al4V alloy obtained with DMLS technology. Materials 2019, 12, 2331. [Google Scholar] [CrossRef] [Green Version]
  16. Hudák, R.; Schnitzer, M.; Orságová Králová, Z.; Gorejová, R.; Mitrík, L.; Rajťúková, V.; Tóth, T.; Kovačević, M.; Riznič, M.; Oriňaková, R.; et al. Additive manufacturing of porous Ti6Al4V alloy: Geometry analysis and mechanical properties testing. Appl. Sci. 2021, 11, 2611. [Google Scholar] [CrossRef]
  17. Liu, S.; Shin, Y.C. Additive manufacturing of Ti6Al4V alloy: A review. Mater. Des. 2019, 164, 107552. [Google Scholar] [CrossRef]
  18. Shunmugavel, M.; Polishetty, A.; Nomani, J.; Goldberg, M.; Littlefair, G. Metallurgical and machinability characteristics of wrought and selective laser melted Ti-6Al-4V. J. Metall. 2016, 2016, e7407918. [Google Scholar] [CrossRef] [Green Version]
  19. Kandeva, M.; Kostadinov, G.; Penyashki, T.; Kamburov, V.; Dimitrova, R.; Valcanov, S.; Nikolov, A.; Elenov, B.; Petrzhik, M. Abrasive wear resistance of electrospark coatings on Titanium alloys. Tribol. Ind. 2022, 44, 132–142. [Google Scholar] [CrossRef]
  20. Li, W.; Li, J.; Xu, Y. Optimization of corrosion wear resistance of the NiCrBSi laser-clad coatings fabricated on Ti6Al4V. Coatings 2021, 11, 960. [Google Scholar] [CrossRef]
  21. Swirad, S. Improvement of the fretting wear resistance of Ti6Al4V by application of hydrostatic ball burnishing. In IOP Conference Series: Materials Science and Engineering; IOP Publishing: Bristol, UK, 2019; Volume 521. [Google Scholar] [CrossRef]
  22. Bruschi, S.; Bertolini, R.; Bordin, A.; Medea, F.; Ghiotti, A. Influence of the machining parameters and cooling strategies on the wear behavior of wrought and additive manufactured Ti6Al4V for biomedical applications. Tribol. Intern. 2016, 102, 133–142. [Google Scholar] [CrossRef]
  23. Becker, T.H.; Beck, M.; Scheffer, C. Microstructure and mechanical properties of direct metal laser sintered ti6al4v. S. Afr. J. Ind. Eng. 2015, 26, 1–10. [Google Scholar] [CrossRef] [Green Version]
  24. Material Data Sheet EOS Titanium Ti64ELI, EOS GmbH—Electro Optical Systems. Available online: https://www.sculpteo.com/media/imagecontent/EOS-Titanium-Ti64ELI.pdf (accessed on 11 March 2022).
  25. Maximov, J.T.; Anchev, A.P.; Duncheva, G.V.; Ganev, N.; Selimov, K.F. Influence of the process parameters on the surface roughness, micro-hardness, and residual stresses in slide burnishing of high-strength aluminium alloys. J. Braz. Soc. Mech. Sci. Eng. 2017, 39, 3067–3078. [Google Scholar] [CrossRef]
  26. Hamadache, H.; Zemouri, Z.; Laouar, L.; Dominiak, S. Improvement of surface conditions of 36CrNiMo6 steel by ball bur-nishing process. J. Mech. Sci. Technol. 2014, 28, 1491–1498. [Google Scholar] [CrossRef]
  27. Vereshchaka, A.S.; Vereshchaka, A.A.; Kirillov, A. Ecologically friendly dry machining by cutting tool from layered composition ceramic with nano-scale multilayered coatings. Key Eng. Mater. 2011, 496, 67–74. [Google Scholar] [CrossRef]
  28. Vereschaka, A.A.; Vereschaka, A.S.; Grigoriev, S.N.; Kirillov, A.K.; Khaustova, O.U. Development and research of environmentally friendly dry technological machining system with compensation of physical function of cutting fluids. Procedia CIRP 2013, 7, 311–316. [Google Scholar] [CrossRef] [Green Version]
  29. Kato, H.; Ueki, H.; Yamamoto, K.; Uasunaga, K. Wear resistance improvement by nanostructured surface layer produced by burnishing. Mater. Sci. Forum 2018, 917, 231–235. [Google Scholar] [CrossRef]
  30. Krishna, R.M.; Koorapati, E.P. A study of wear resistance of non-ferrous roller burnished components. Int. J. Appl. Manag. Sci. 2012, 3, 11–24. [Google Scholar]
  31. Rao, D.S.; Hebbar, H.S.; Komaraiah, M.; Kempaiah, U.N. Investigation on the effect of ball burnishing parameters on surface roughness and corrosion resistance of HSLA dual-phase steels. East Afr. J. Sci. 2008, 2, 164–169. [Google Scholar] [CrossRef]
  32. Korzynski, M.; Dudek, K.; Palczak, A.; Kruczek, B.; Kocurek, P. Experimental models and correlations between surface param-eters after slide diamond burnishing. Meas. Sci. Rev. 2018, 18, 123–129. [Google Scholar] [CrossRef] [Green Version]
  33. Luo, H.; Liu, J.; Zhong, Q. Investigation of the burnishing process with PCD tool on non-ferrous metals. Int. J. Adv. Manuf. Technol. 2005, 25, 5–6. [Google Scholar] [CrossRef]
  34. Swirad, S. The surface texture analysis after slide burnishing with cylindrical elements. Wear 2011, 271, 576–581. [Google Scholar] [CrossRef]
  35. Tobola, P.; Rusek, D.; Czechowski, K.; Miller, T.; Duda, K. New indicators of burnished surface evaluation—Reasons of appli-cation. Metrol. Meas. Syst. 2015, 22, 263–274. [Google Scholar] [CrossRef]
  36. Maximov, J.T.; Duncheva, G.V.; Anchev, A.P.; Ganev, N.; Amudjev, I.M.; Dunchev, V.P. Effect of slide burnishing method on the surface integrity of AISI 316Ti chromium–nickel steel. J. Braz. Soc. Mech. Sci. Eng. 2018, 40, 1–14. [Google Scholar] [CrossRef]
  37. Dzierwa, A.; Markopoulos, A.P. Influence of ball-burnishing process on surface topography parameters and tribological properties of hardened steel. Machines 2019, 7, 11. [Google Scholar] [CrossRef] [Green Version]
  38. Arrazola, P.-J.; Garay, A.; Iriarte, L.-M.; Armendia, M.; Marya, S.; Le Maître, F. Machinability of titanium alloys (Ti6Al4V and Ti555.3). J. Mat. Process Technol. 2009, 209, 2223–2230. [Google Scholar] [CrossRef] [Green Version]
  39. Bertolini, R.; Ghiotti, A.; Bruschi, S. Wear behavior of Ti6Al4V surfaces functionalized through ultrasonic vibration turning. J. Mater. Eng. Perform. 2021, 30, 7597–7608. [Google Scholar] [CrossRef]
  40. Toboła, D. Impact of mechanical processes as a pre-sulphonitriding treatment on tribology properties of selected P/M tool steels. Materials 2019, 12, 3431. [Google Scholar] [CrossRef] [Green Version]
  41. Kluz, R.; Antosz, K.; Trzepieciński, T.; Bucior, M. Modelling the influence of slide burnishing parameters on the surface roughness of shafts made of 42CrMo4 heat-treatable steel. Materials 2021, 14, 1175. [Google Scholar] [CrossRef]
  42. Kato, H.; Hirokawa, W.; Todaka, Y.; Yasunaga, K. Improvement in surface roughness and hardness for carbon steel by slide burnishing process. Mat. Sci. Appl. 2021, 12, 171–181. [Google Scholar] [CrossRef]
  43. Zaleski, K.; Skoczylas, A. Effect of slide burnishing on the surface layer and fatigue life of titanium alloy parts. Adv. Mat. Sci. 2019, 19, 35–45. [Google Scholar] [CrossRef] [Green Version]
  44. Rotella, G.; Caruso, S.; Del Prete, A.; Filice, L. Prediction of surface integrity parameters in roller burnishing of Ti6Al4V. Metals 2020, 10, 1671. [Google Scholar] [CrossRef]
  45. Rotella, G.; Filice, L.; Micari, F. Improving surface integrity of additively manufactured GP1 stainless steel by roller burnishing. CIRP Ann. 2020, 69, 513–516. [Google Scholar] [CrossRef]
  46. Saffioti, M.R.; Sanguedolce, M.; Rotella, G.; Filice, L. On the Effects of Burnishing Process on Tribological Surface Resistance of Additively Manufactured Steel. Available online: https://popups.uliege.be/esaform21/index.php?id=1903 (accessed on 15 March 2022).
  47. Sanguedolce, M.; Rotella, G.; Saffioti, M.R.; Filice, L. Burnishing of AM materials to obtain high performance part surfaces. J. Ind. Eng. Manag. 2022, 15, 92. [Google Scholar] [CrossRef]
  48. Sanguedolce, M.; Rotella, G.; Saffioti, M.R.; Filice, L. Functionalized additively manufactured parts for the manufacturing of the future. Procedia Comput. Sci. 2021, 180, 358–365. [Google Scholar] [CrossRef]
  49. Teramachi, A.; Yan, J. Improving the surface integrity of additive-manufactured metal parts by ultrasonic vibration-assisted burnishing. J. Micro. Nano-Manuf. 2019, 7, 024501. [Google Scholar] [CrossRef]
  50. Karthick Raaj, R.; Vijay Anirudh, P.; Karunakaran, C.; Kannan, C.; Jahagirdar, A.; Joshi, S.V.; Balan, A.S.S. Exploring grinding and burnishing as surface post-treatment options for electron beam additive manufactured alloy 718. Surf. Coat. Technol. 2020, 397, 26063. [Google Scholar] [CrossRef]
  51. Revankar, G.D.; Shetty, R.; Rao, S.S.; Gaitonde, V.N. ‘Wear resistance enhancement of titanium alloy (Ti-6Al-4V) by ball burnishing process. J. Mater. Res. Technol. 2017, 6, 13–32. [Google Scholar] [CrossRef] [Green Version]
  52. ISO 21920-2:2021, Geometrical product specifications (GPS)—Surface texture: Profile—Part 2: Terms, Definitions and Surface Texture Parameters. Available online: https://www.iso.org/standard/72226.html (accessed on 11 April 2022).
  53. El-Taweel, T.A.; El-Axir, M.H. Analysis and optimization of the ball burnishing process through the Taguchi technique. Int. J. Adv. Manuf. Technol. 2009, 41, 301–310. [Google Scholar] [CrossRef]
  54. Dezső, G.; Szigeti, F.; Kósa, P. Investigation of surface hardness of Ti6Al4V workpieces manufactured by additive manufacturing, OGÉT-2022, XXX. In Proceedings of the International Mechanical Meeting, Székelyudvarhely, Romania, 21–24 April 2022. [Google Scholar]
  55. Dezső, G.; Szigeti, F.; Varga, G. Measurement of the surface hardness of titanium alloy samples produced by additive manufacturing, MAHEG—XXXI. In Proceedings of the International Welding Conference, Kecskemét, Hungary, 19–21 May 2022. Under Publication. [Google Scholar]
Figure 1. A schematic diagram of sliding friction burnishing (1—workpiece, 2—burnishing tool, 3—burnishing insert, A—active element of tip).
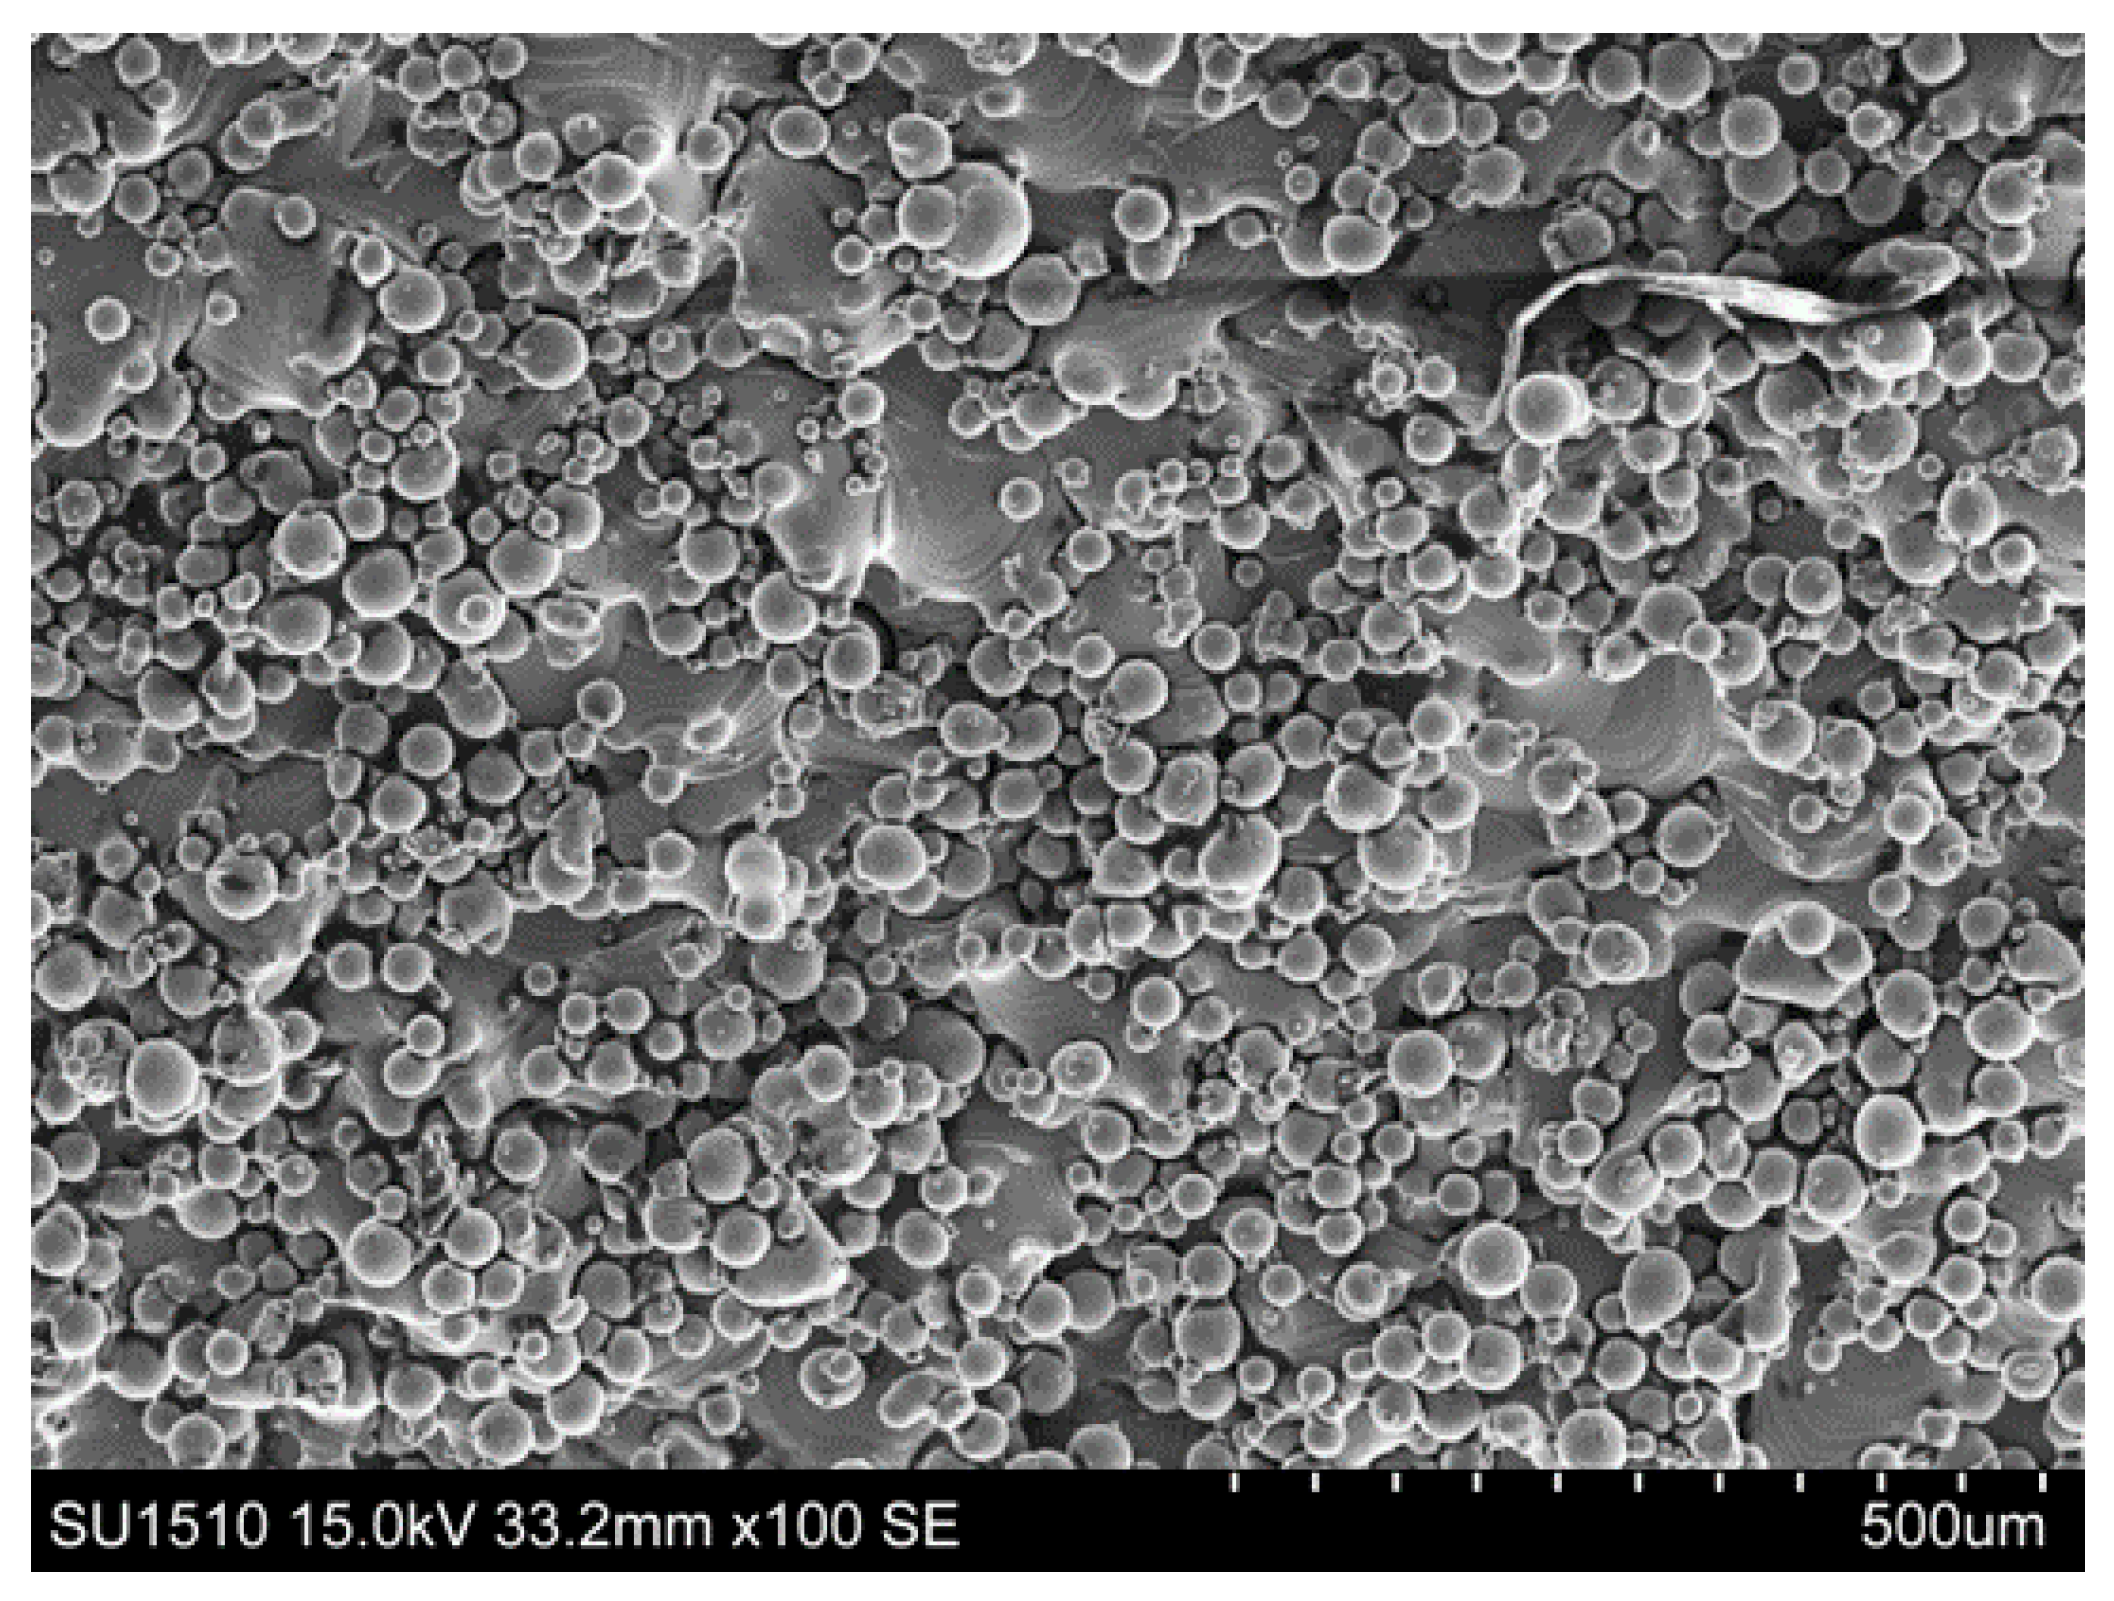
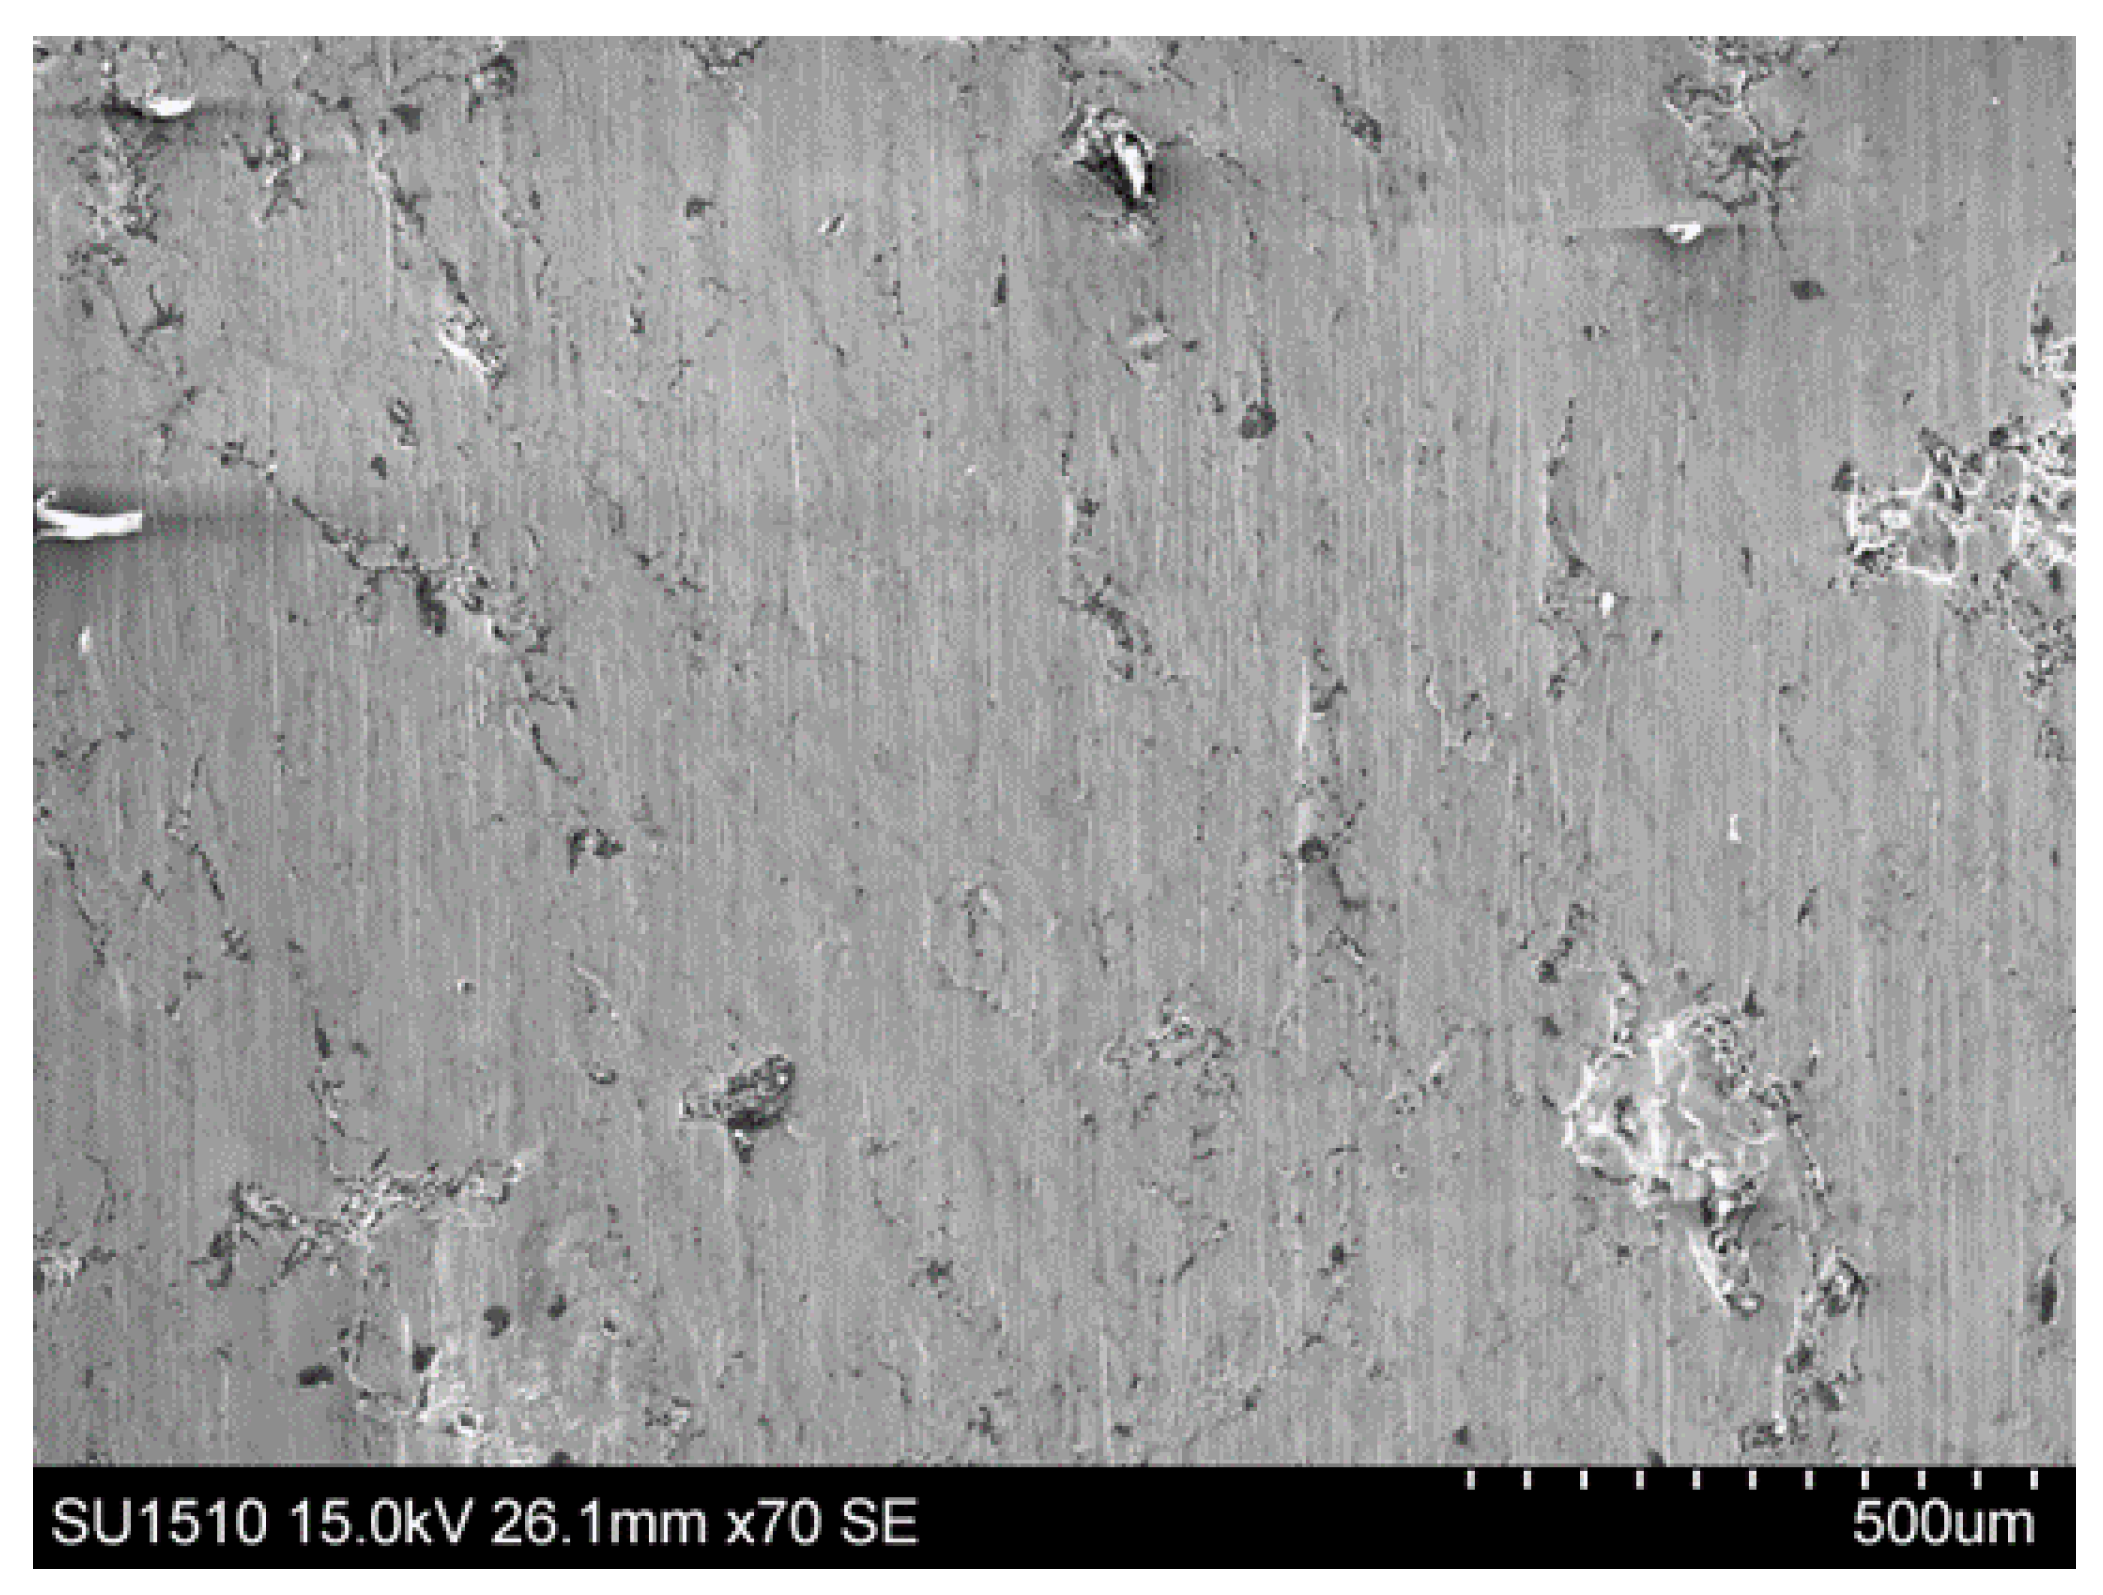
Machines 10 00400 g001
Figure 2. An electron microscopic image of sample E1, before burnishing.
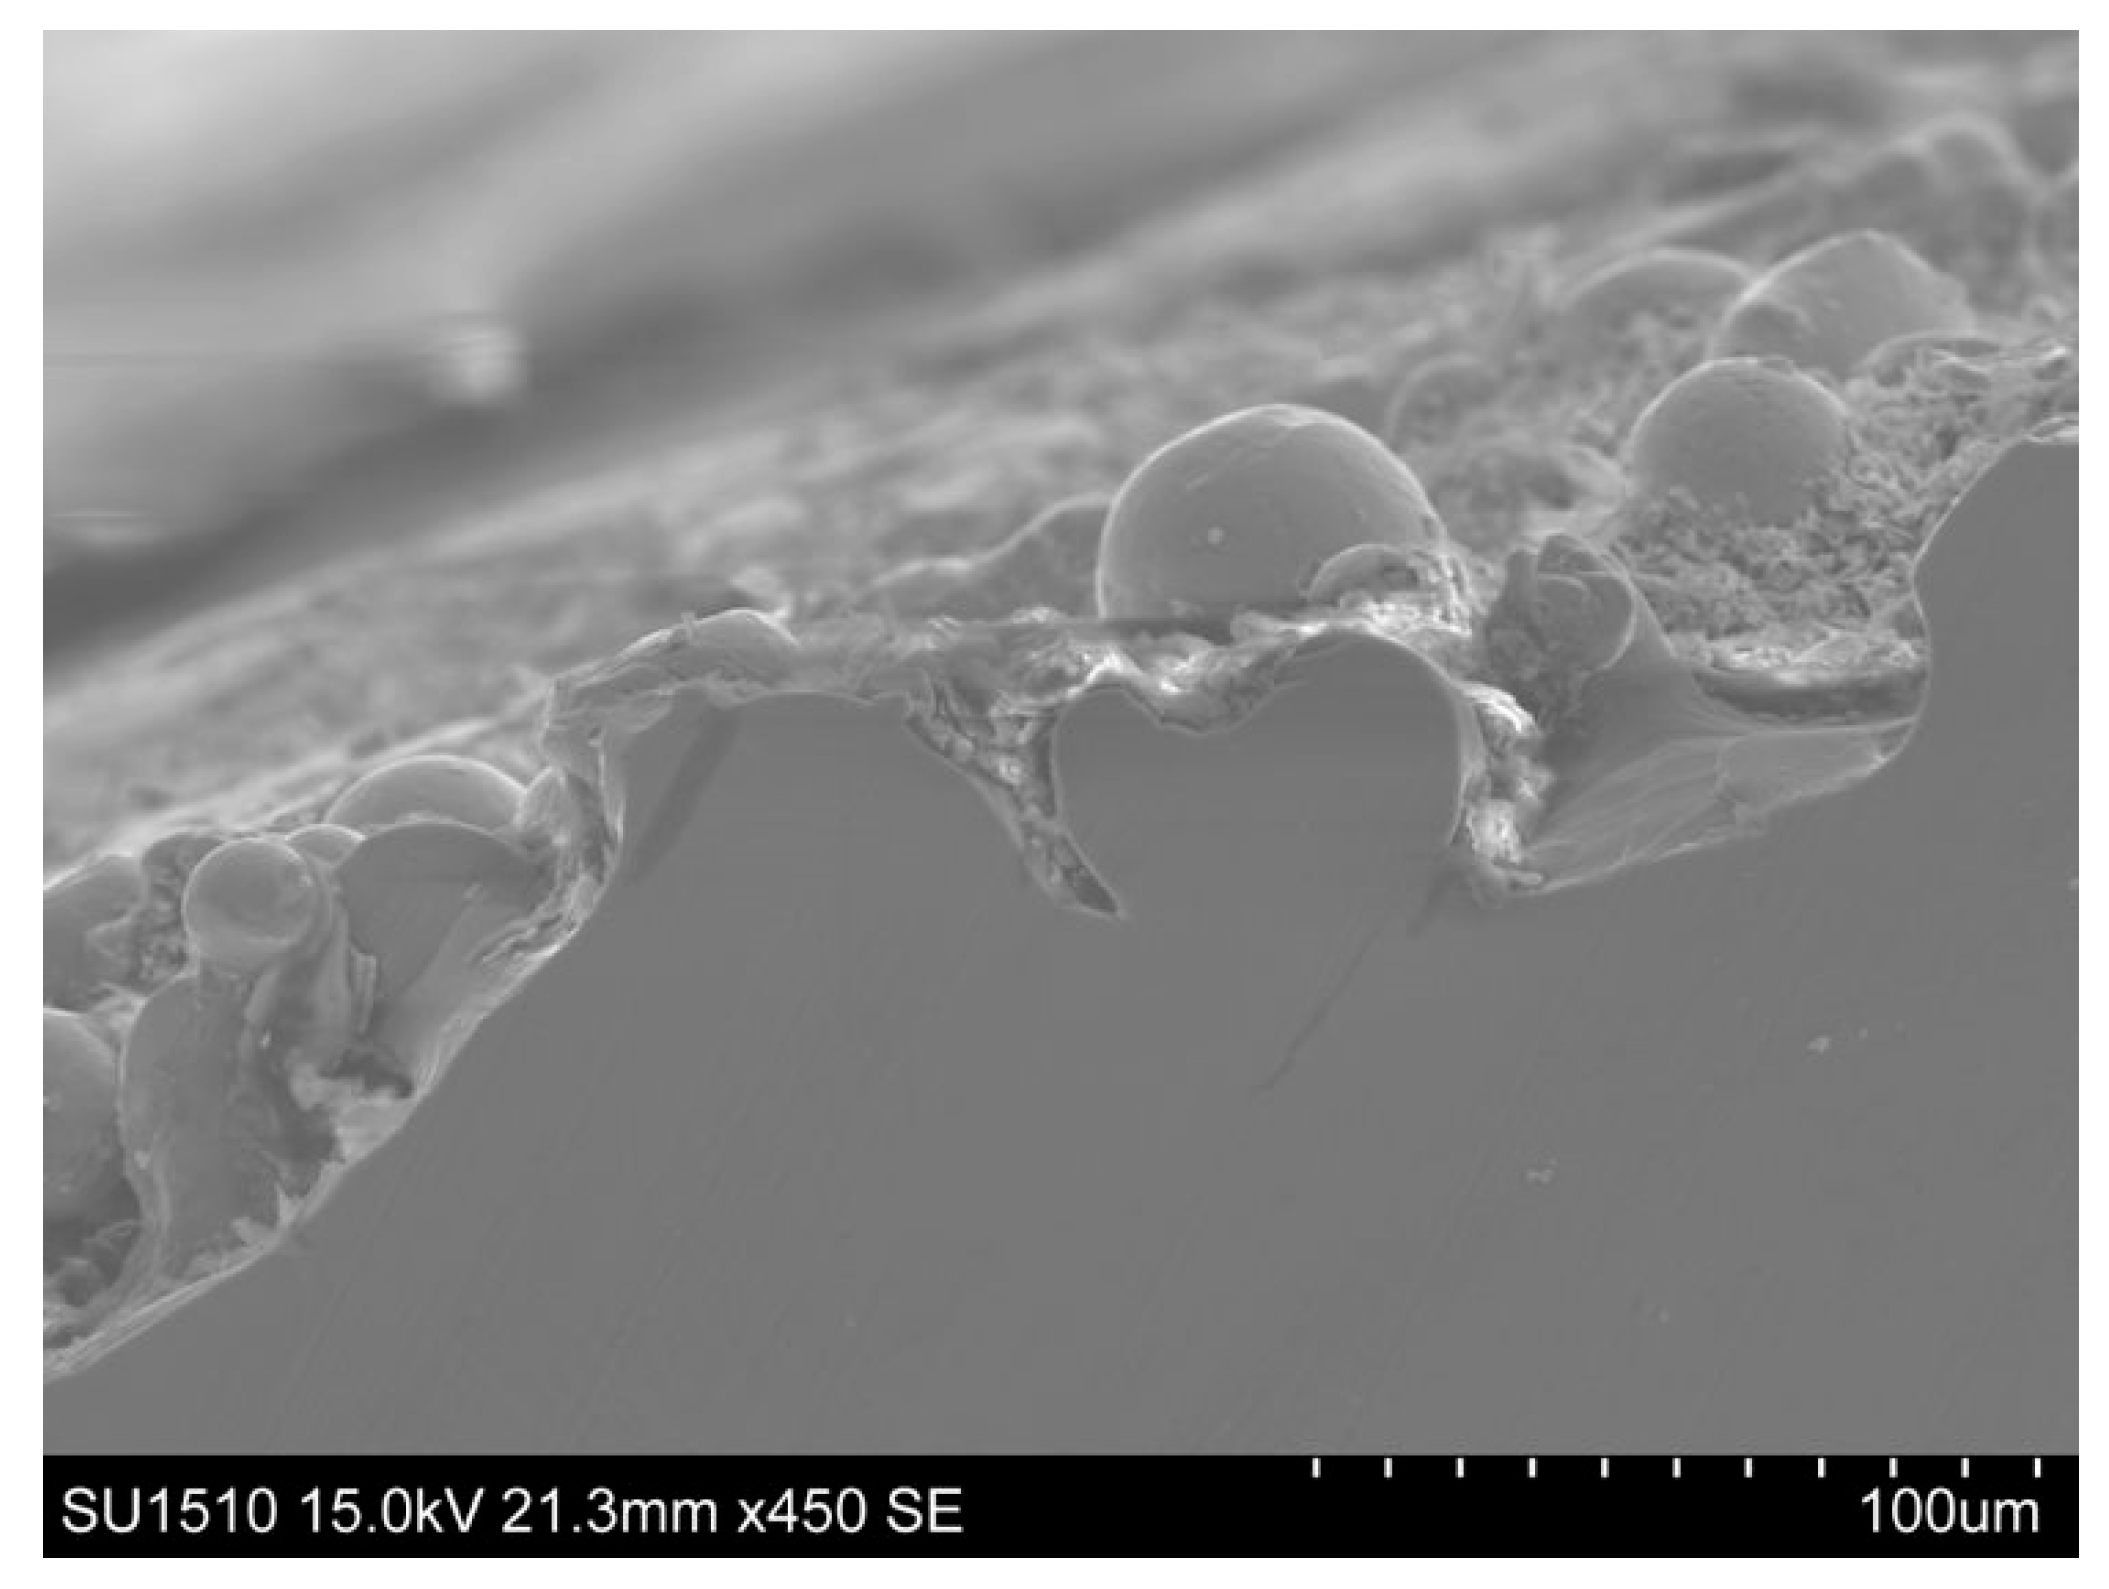
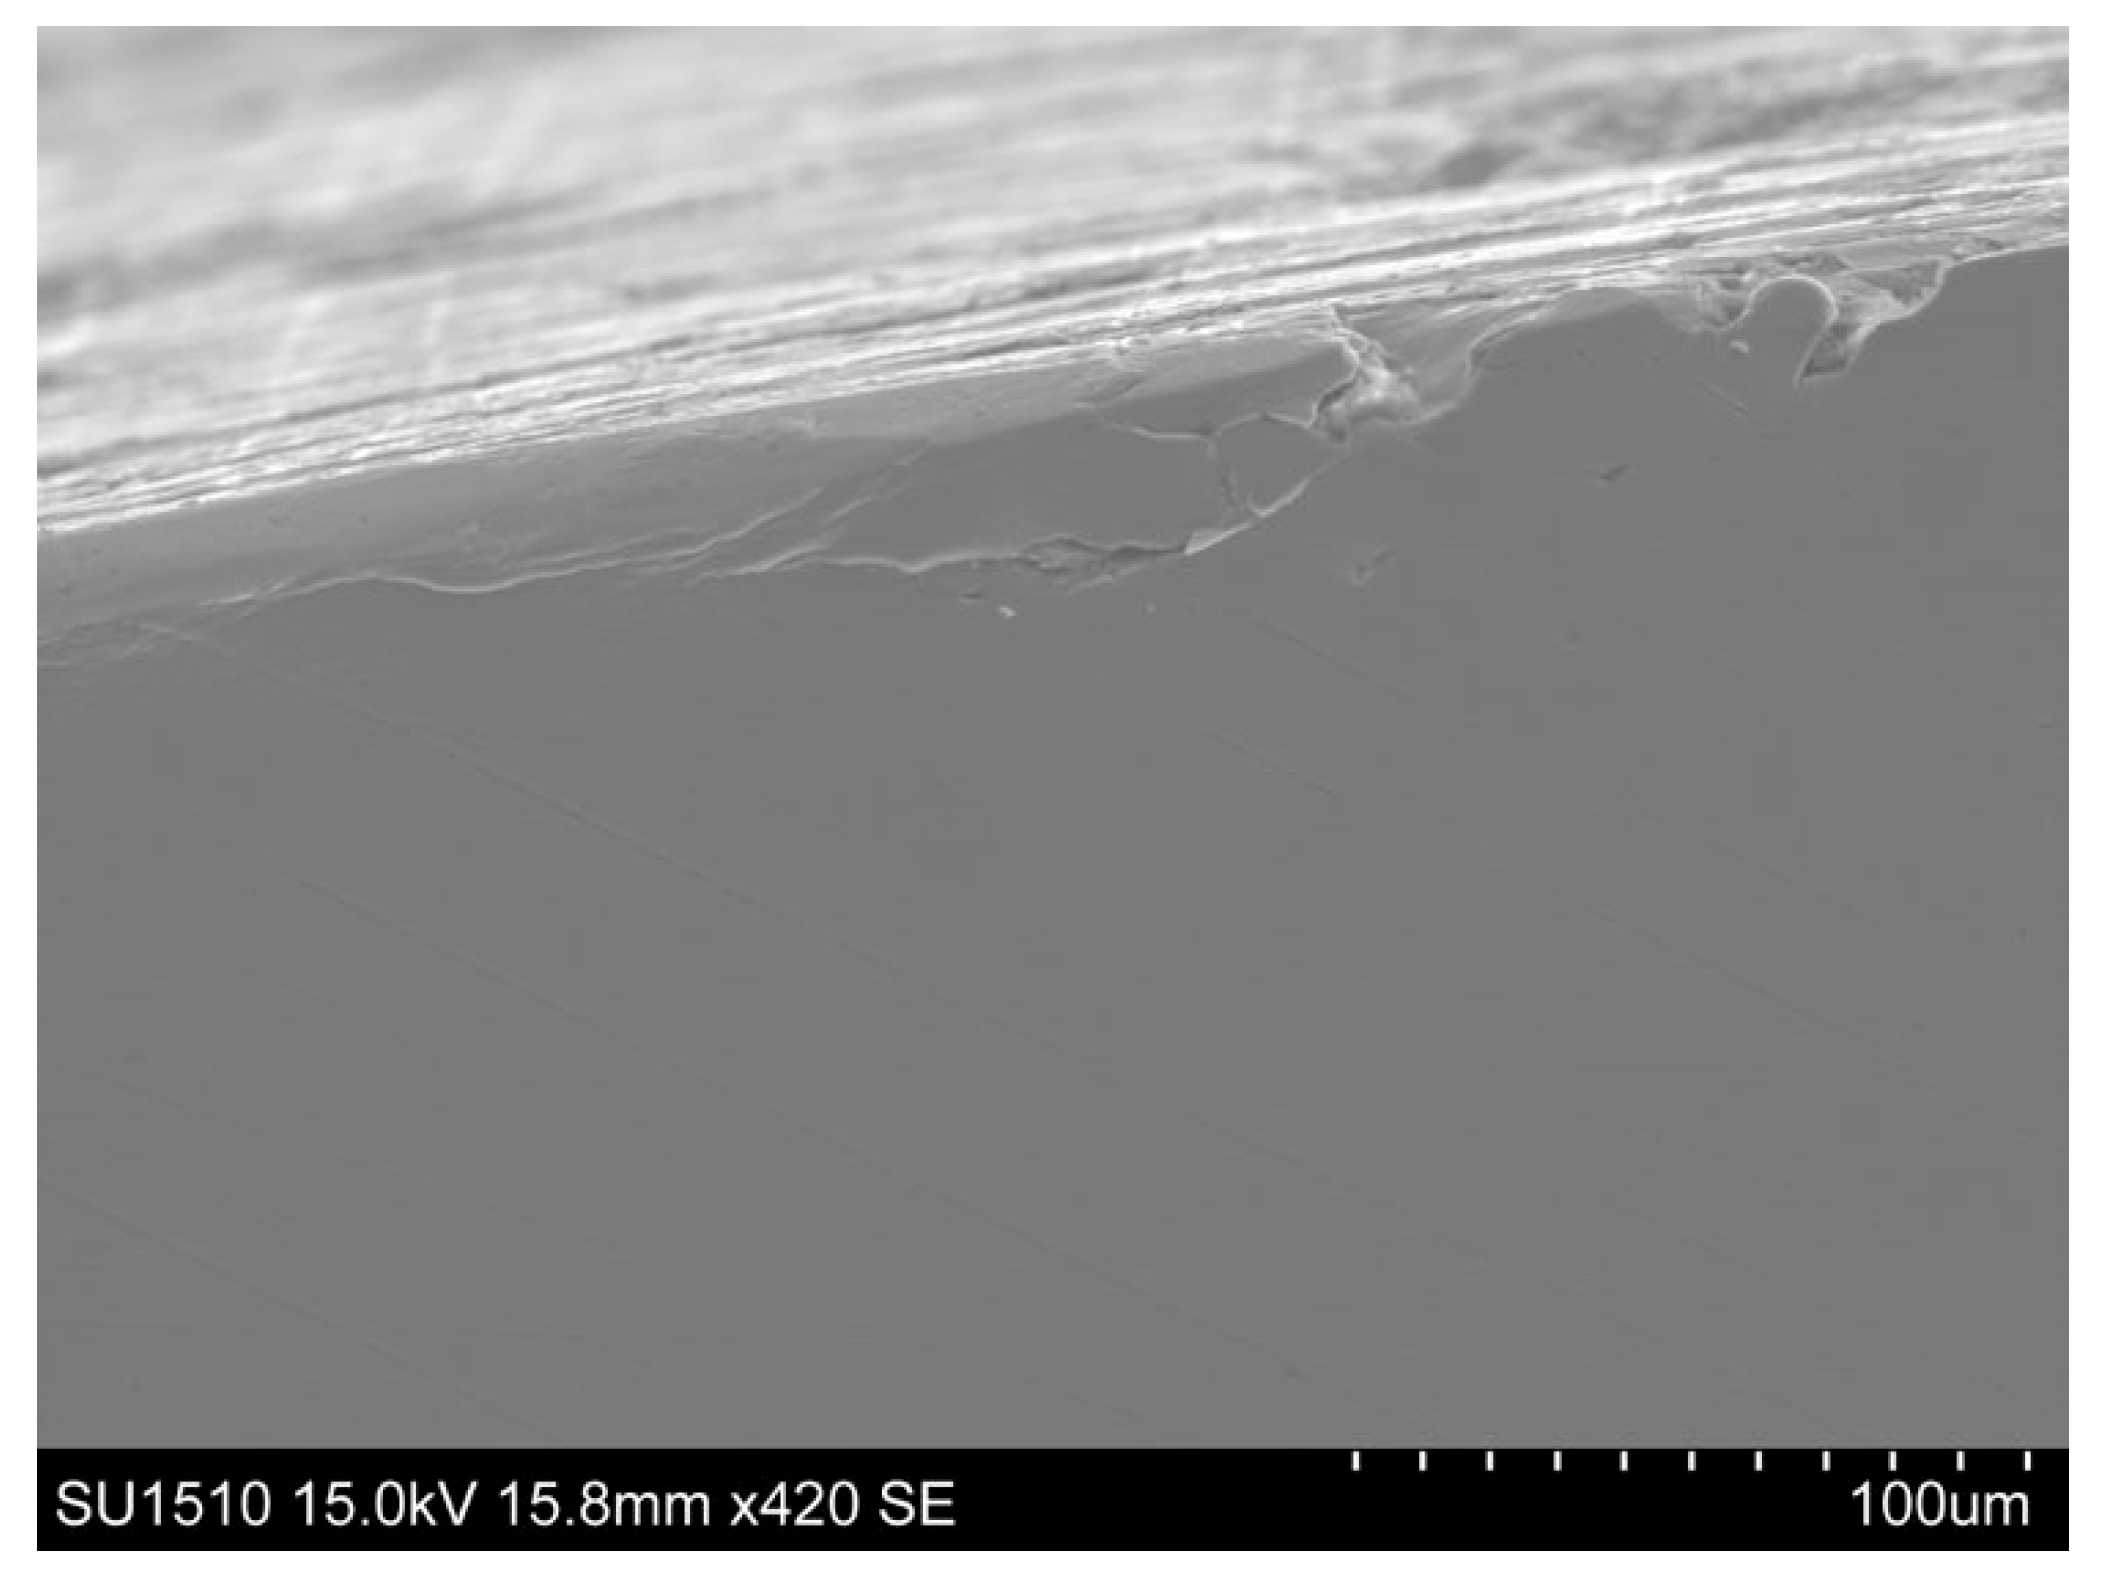
Machines 10 00400 g002
Figure 3. An electron microscopic cross-cut image of sample E1, before burnishing.
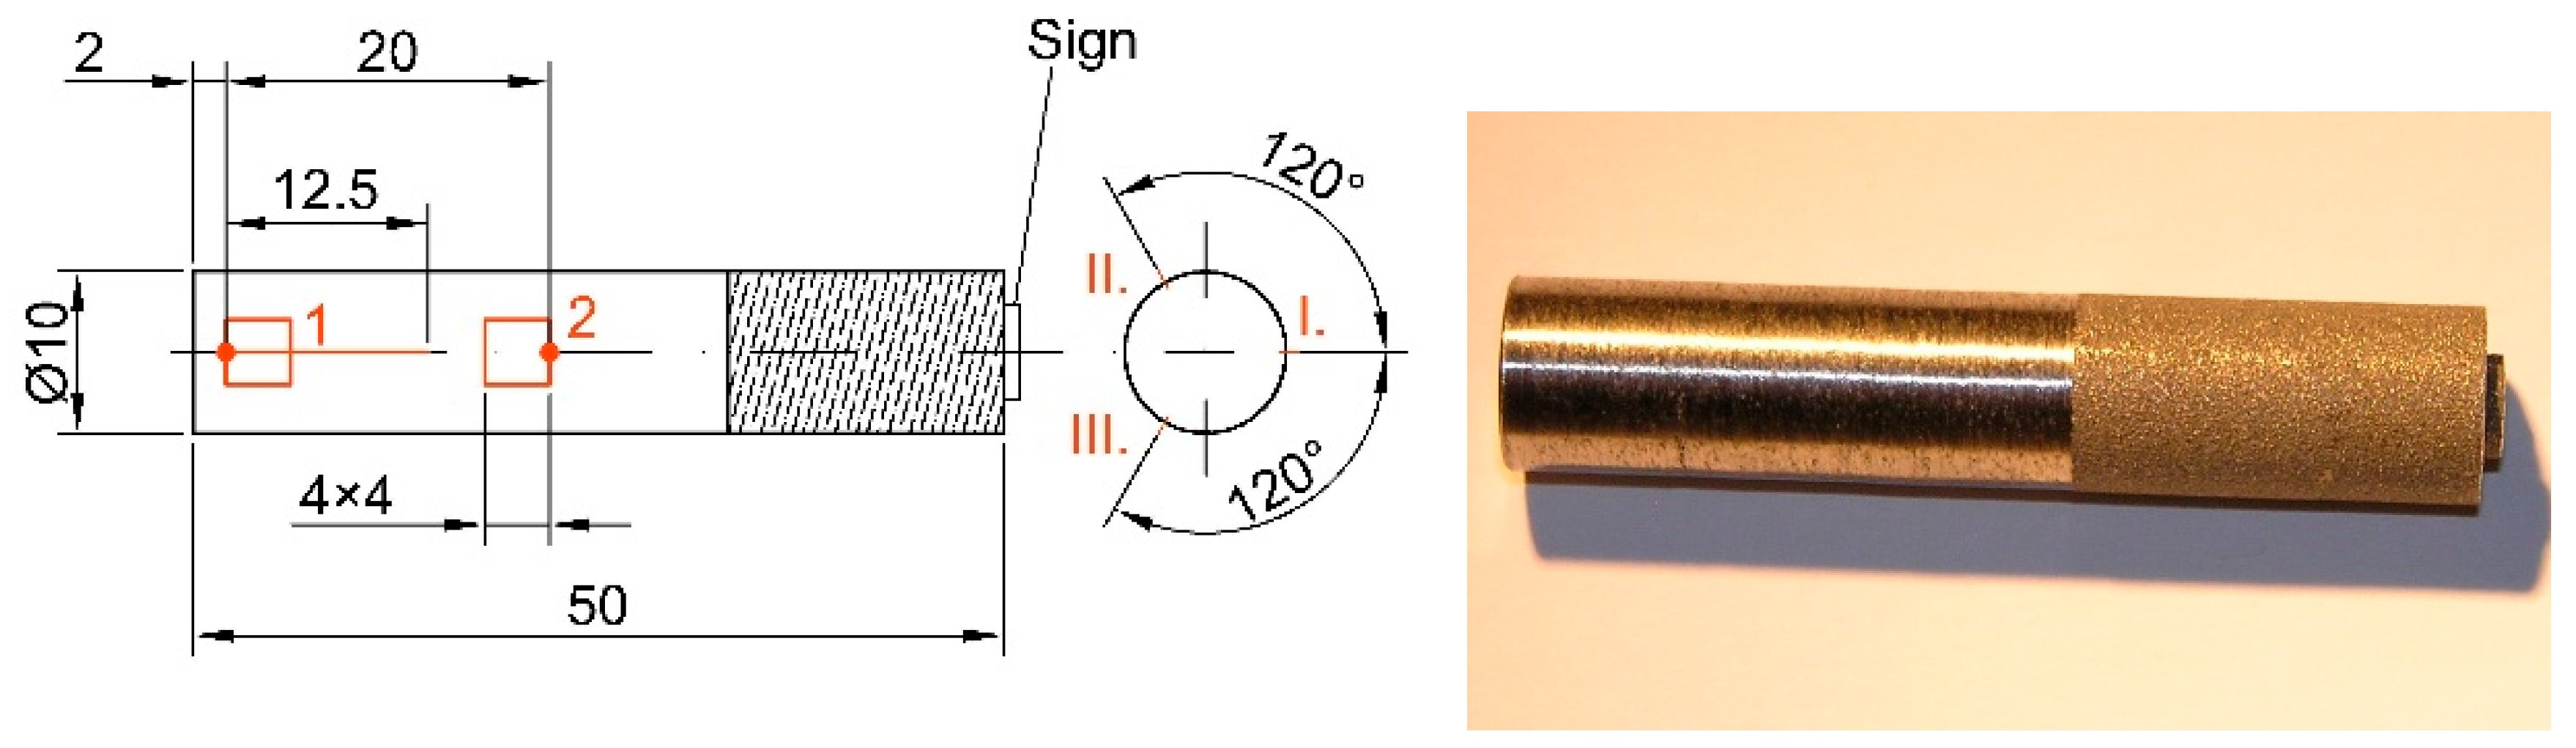
Machines 10 00400 g003
Figure 4. The roughness measurement locations on the specimen.
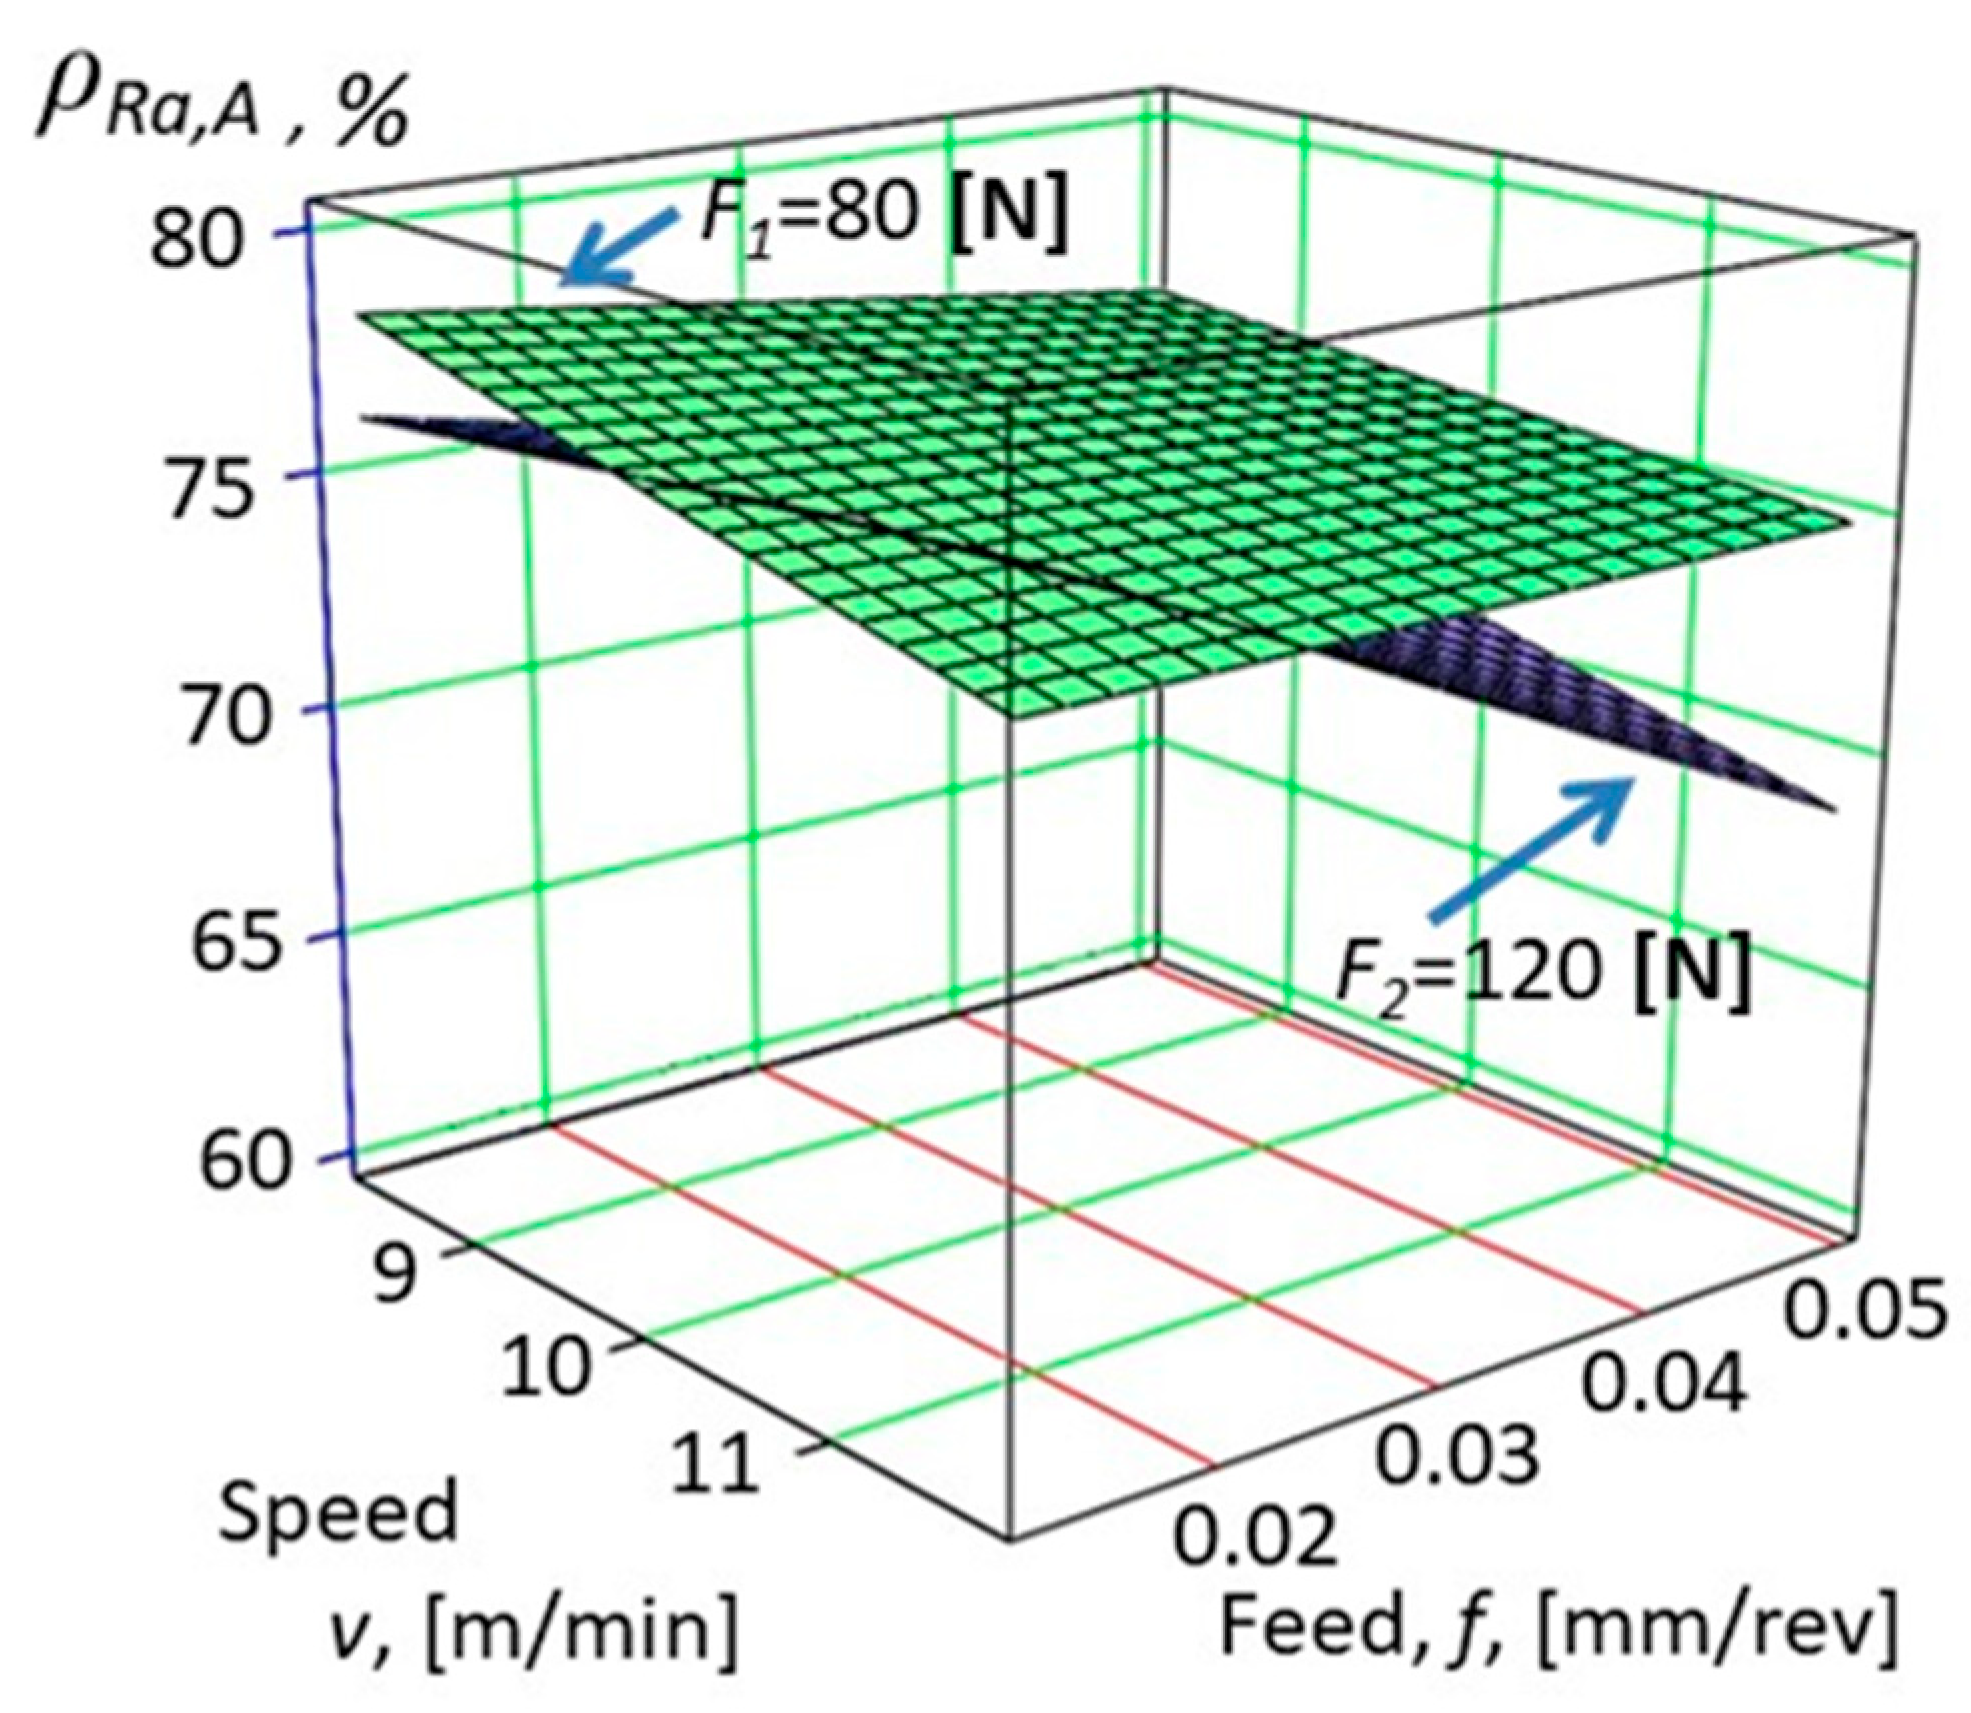
Machines 10 00400 g004
Figure 5. Improvement of the change of surface roughness ρ R a , A   on specimens marked A (see Equation (3)).
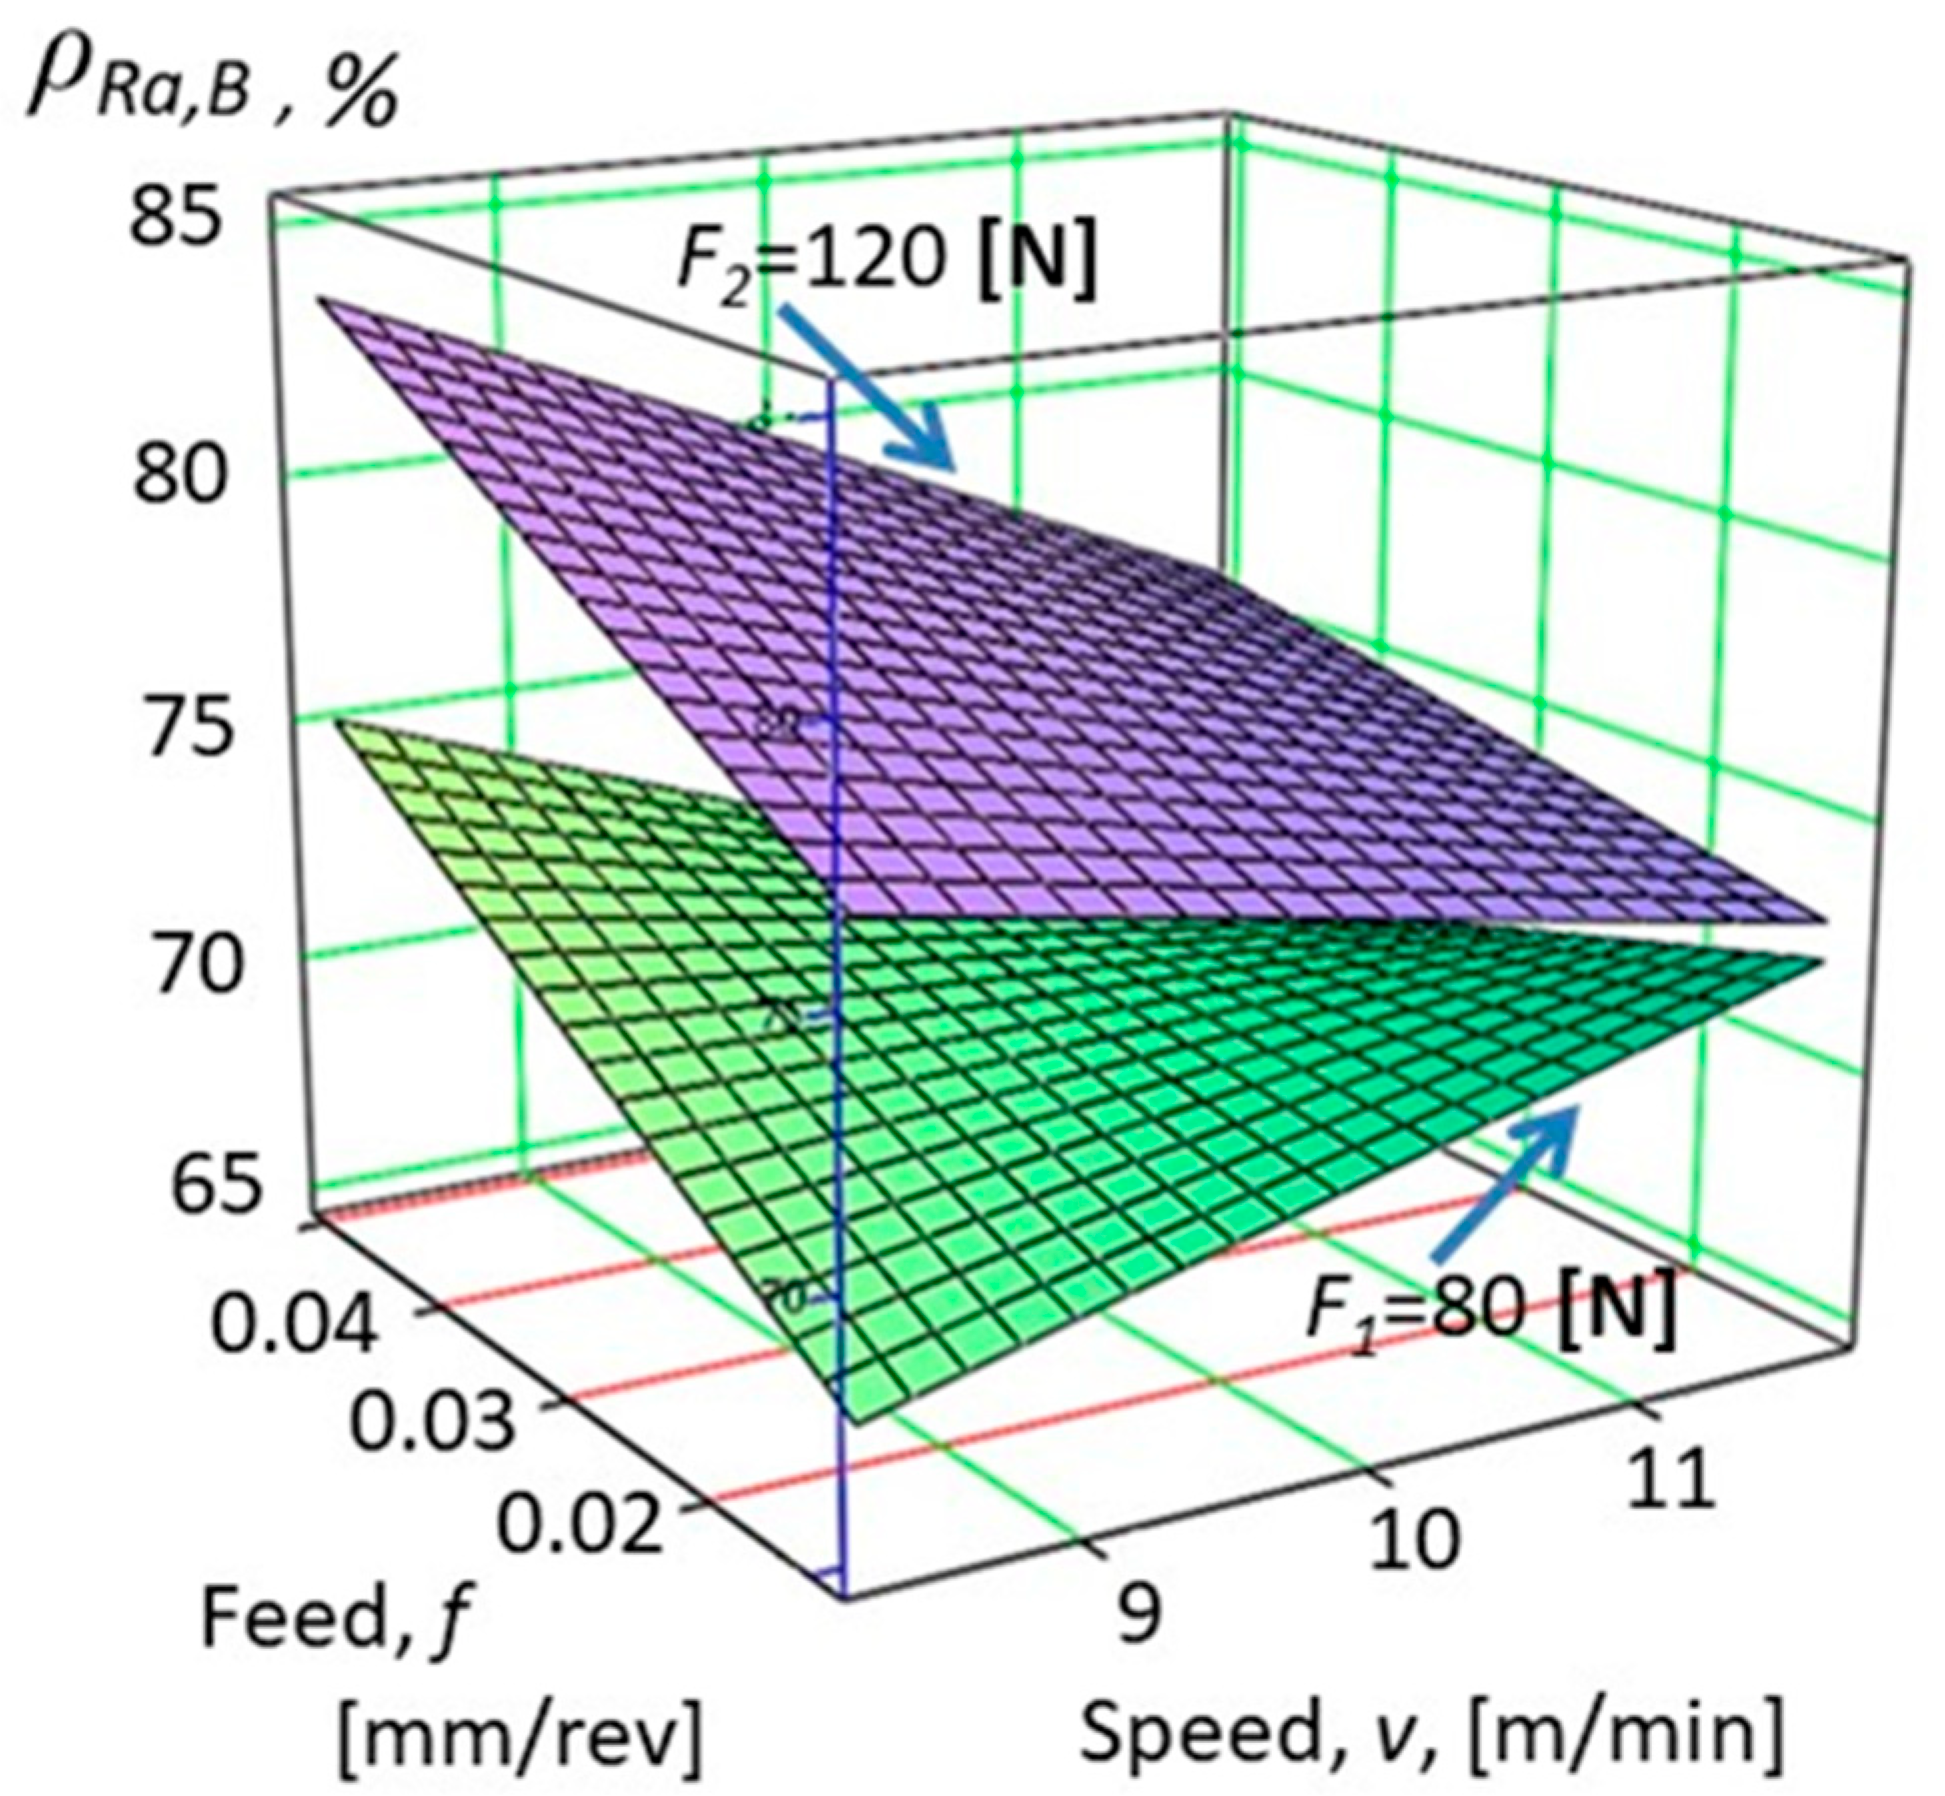
Machines 10 00400 g005
Figure 6. Improvement of the change of surface roughness ρ R a , B   on specimens marked B (see Equation (4)).
Machines 10 00400 g006
Figure 7. Improvement of the change of surface roughness ρ R a , C   on specimens marked C (see Equation (5)).
Machines 10 00400 g007
Figure 8. Improvement of the change of surface roughness ρ R a , D   on specimens marked D (see Equation (6)).
Machines 10 00400 g008
Figure 9. Improvement of the change of surface roughness ρ R a , E   on specimens marked E (see Equation (7)).
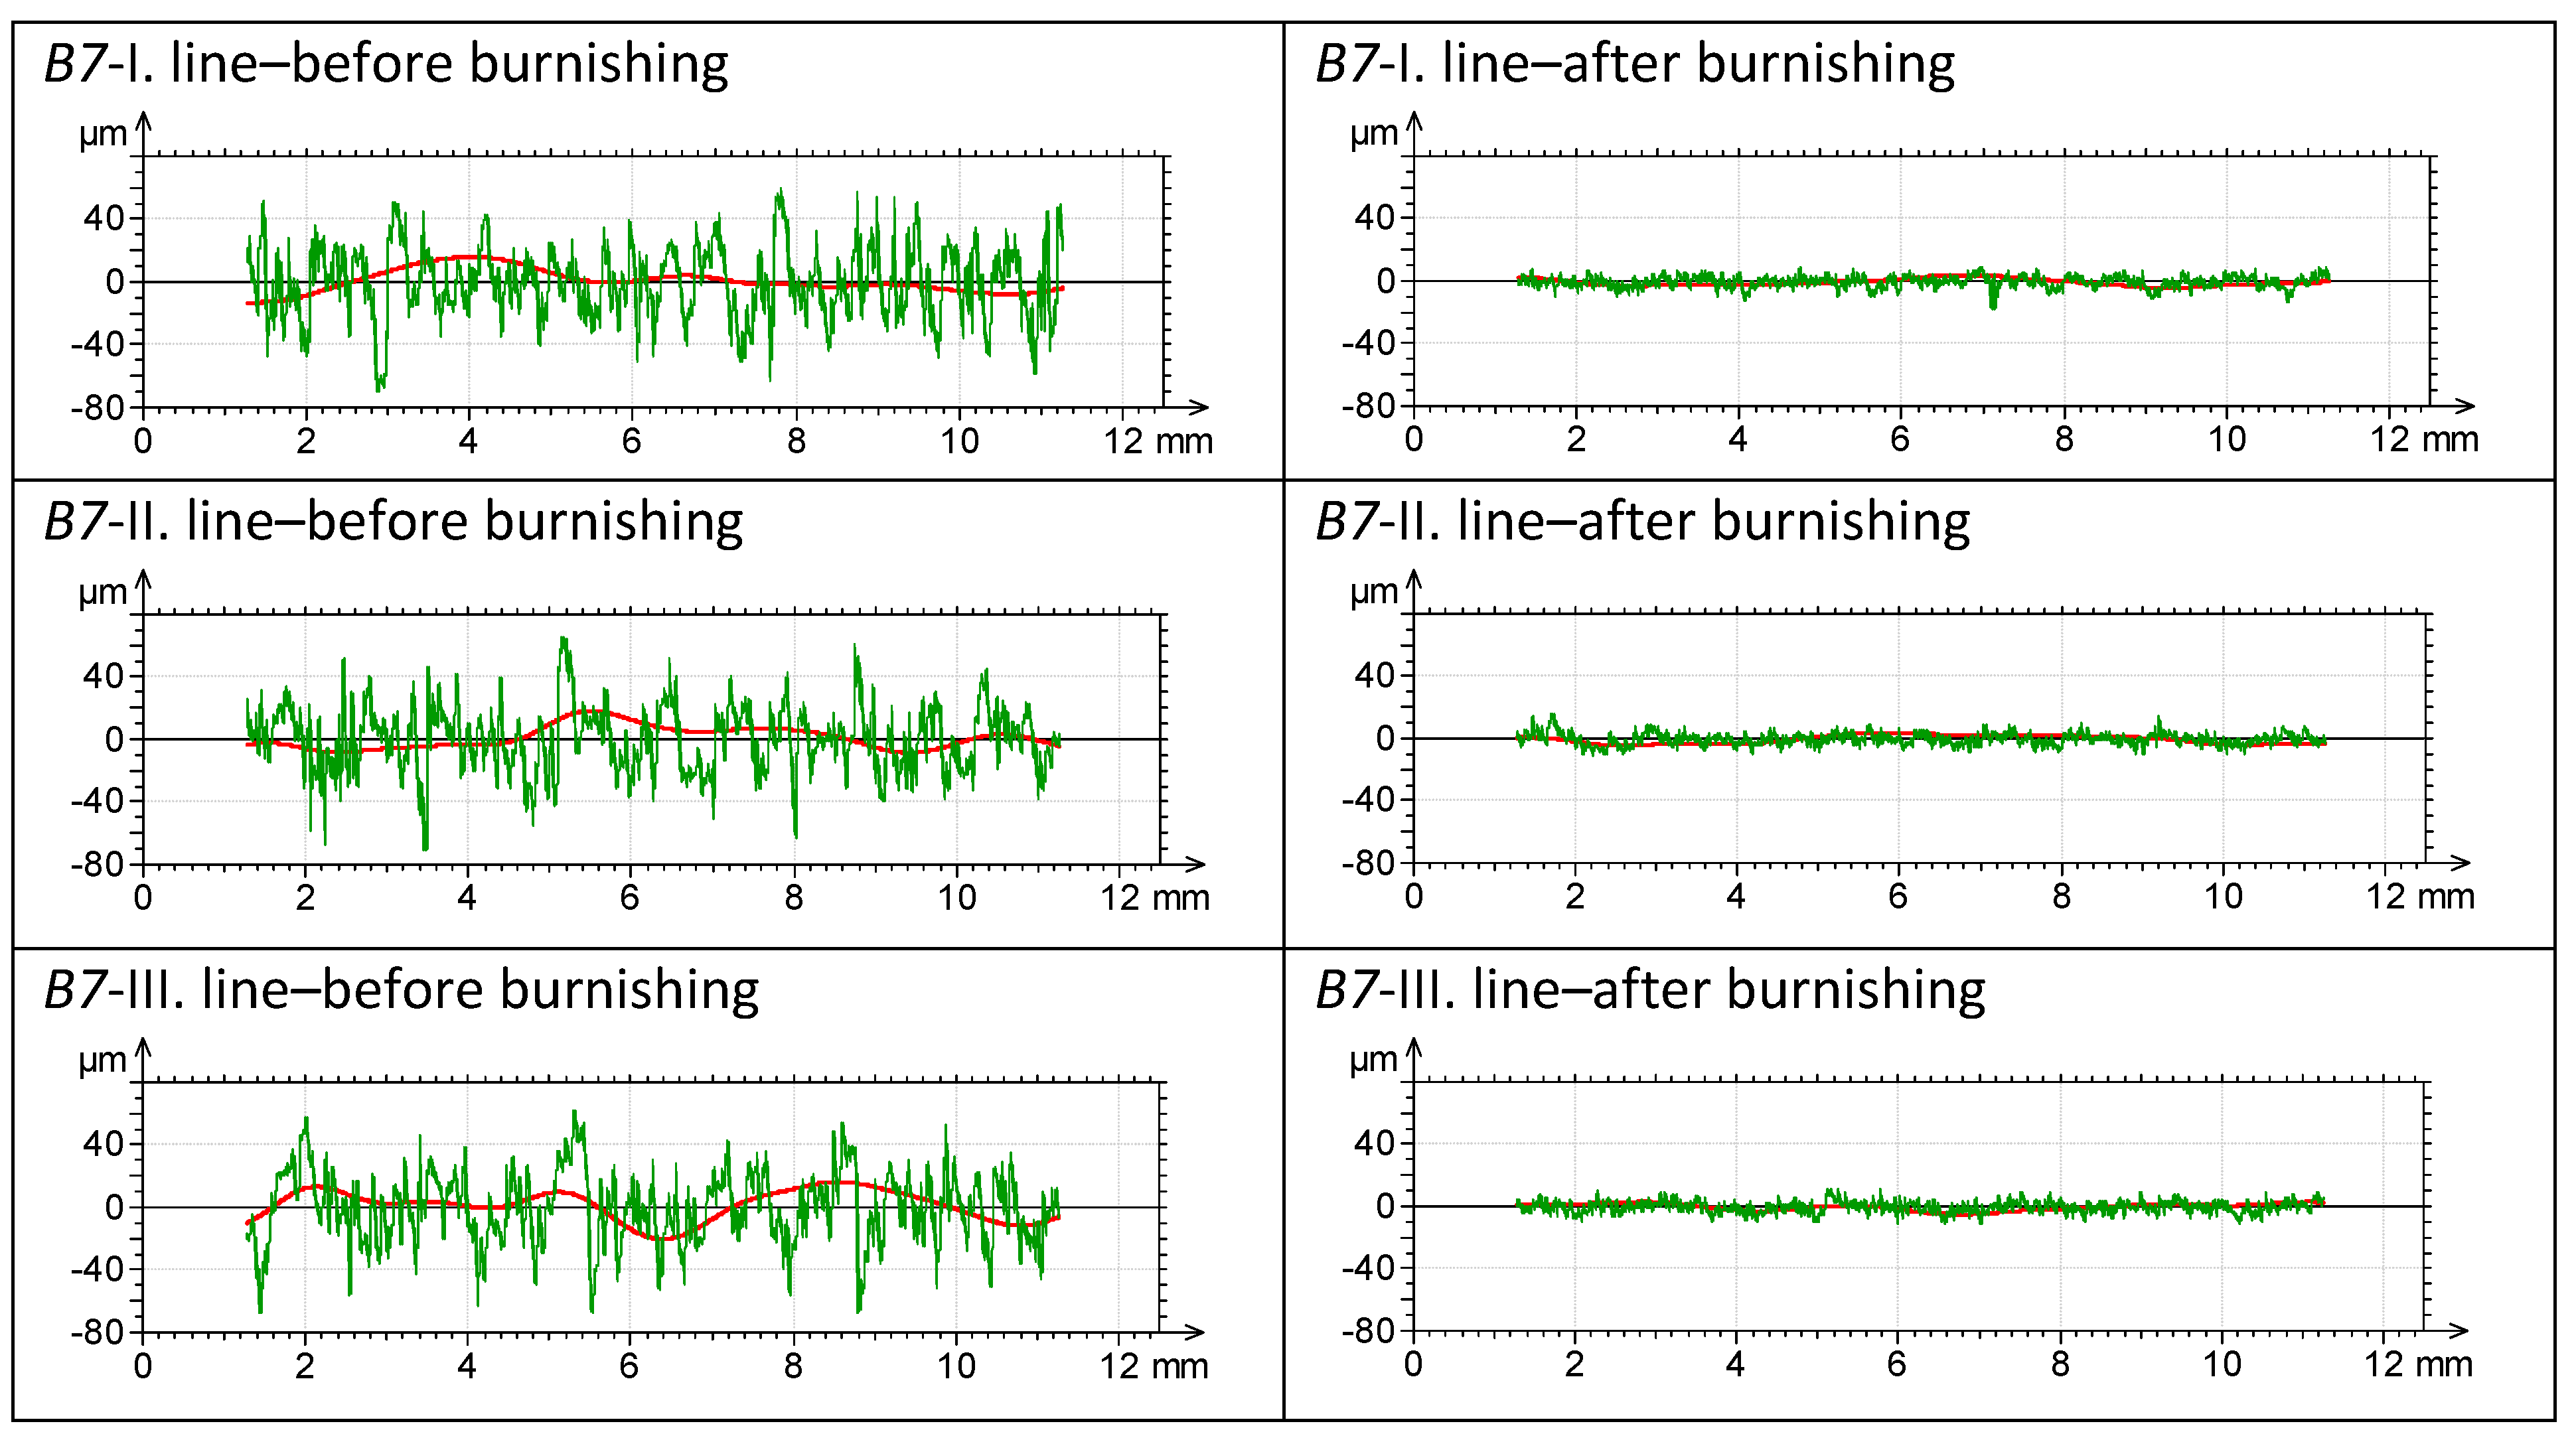
Machines 10 00400 g009
Figure 10. The change in roughness profiles before and after burnishing on specimen B7 on cylinder generatrices, 120° apart.
Machines 10 00400 g010
Figure 11. Improvement of the change of surface roughness ρ S a , A   on specimens marked A (see Equation (9)).
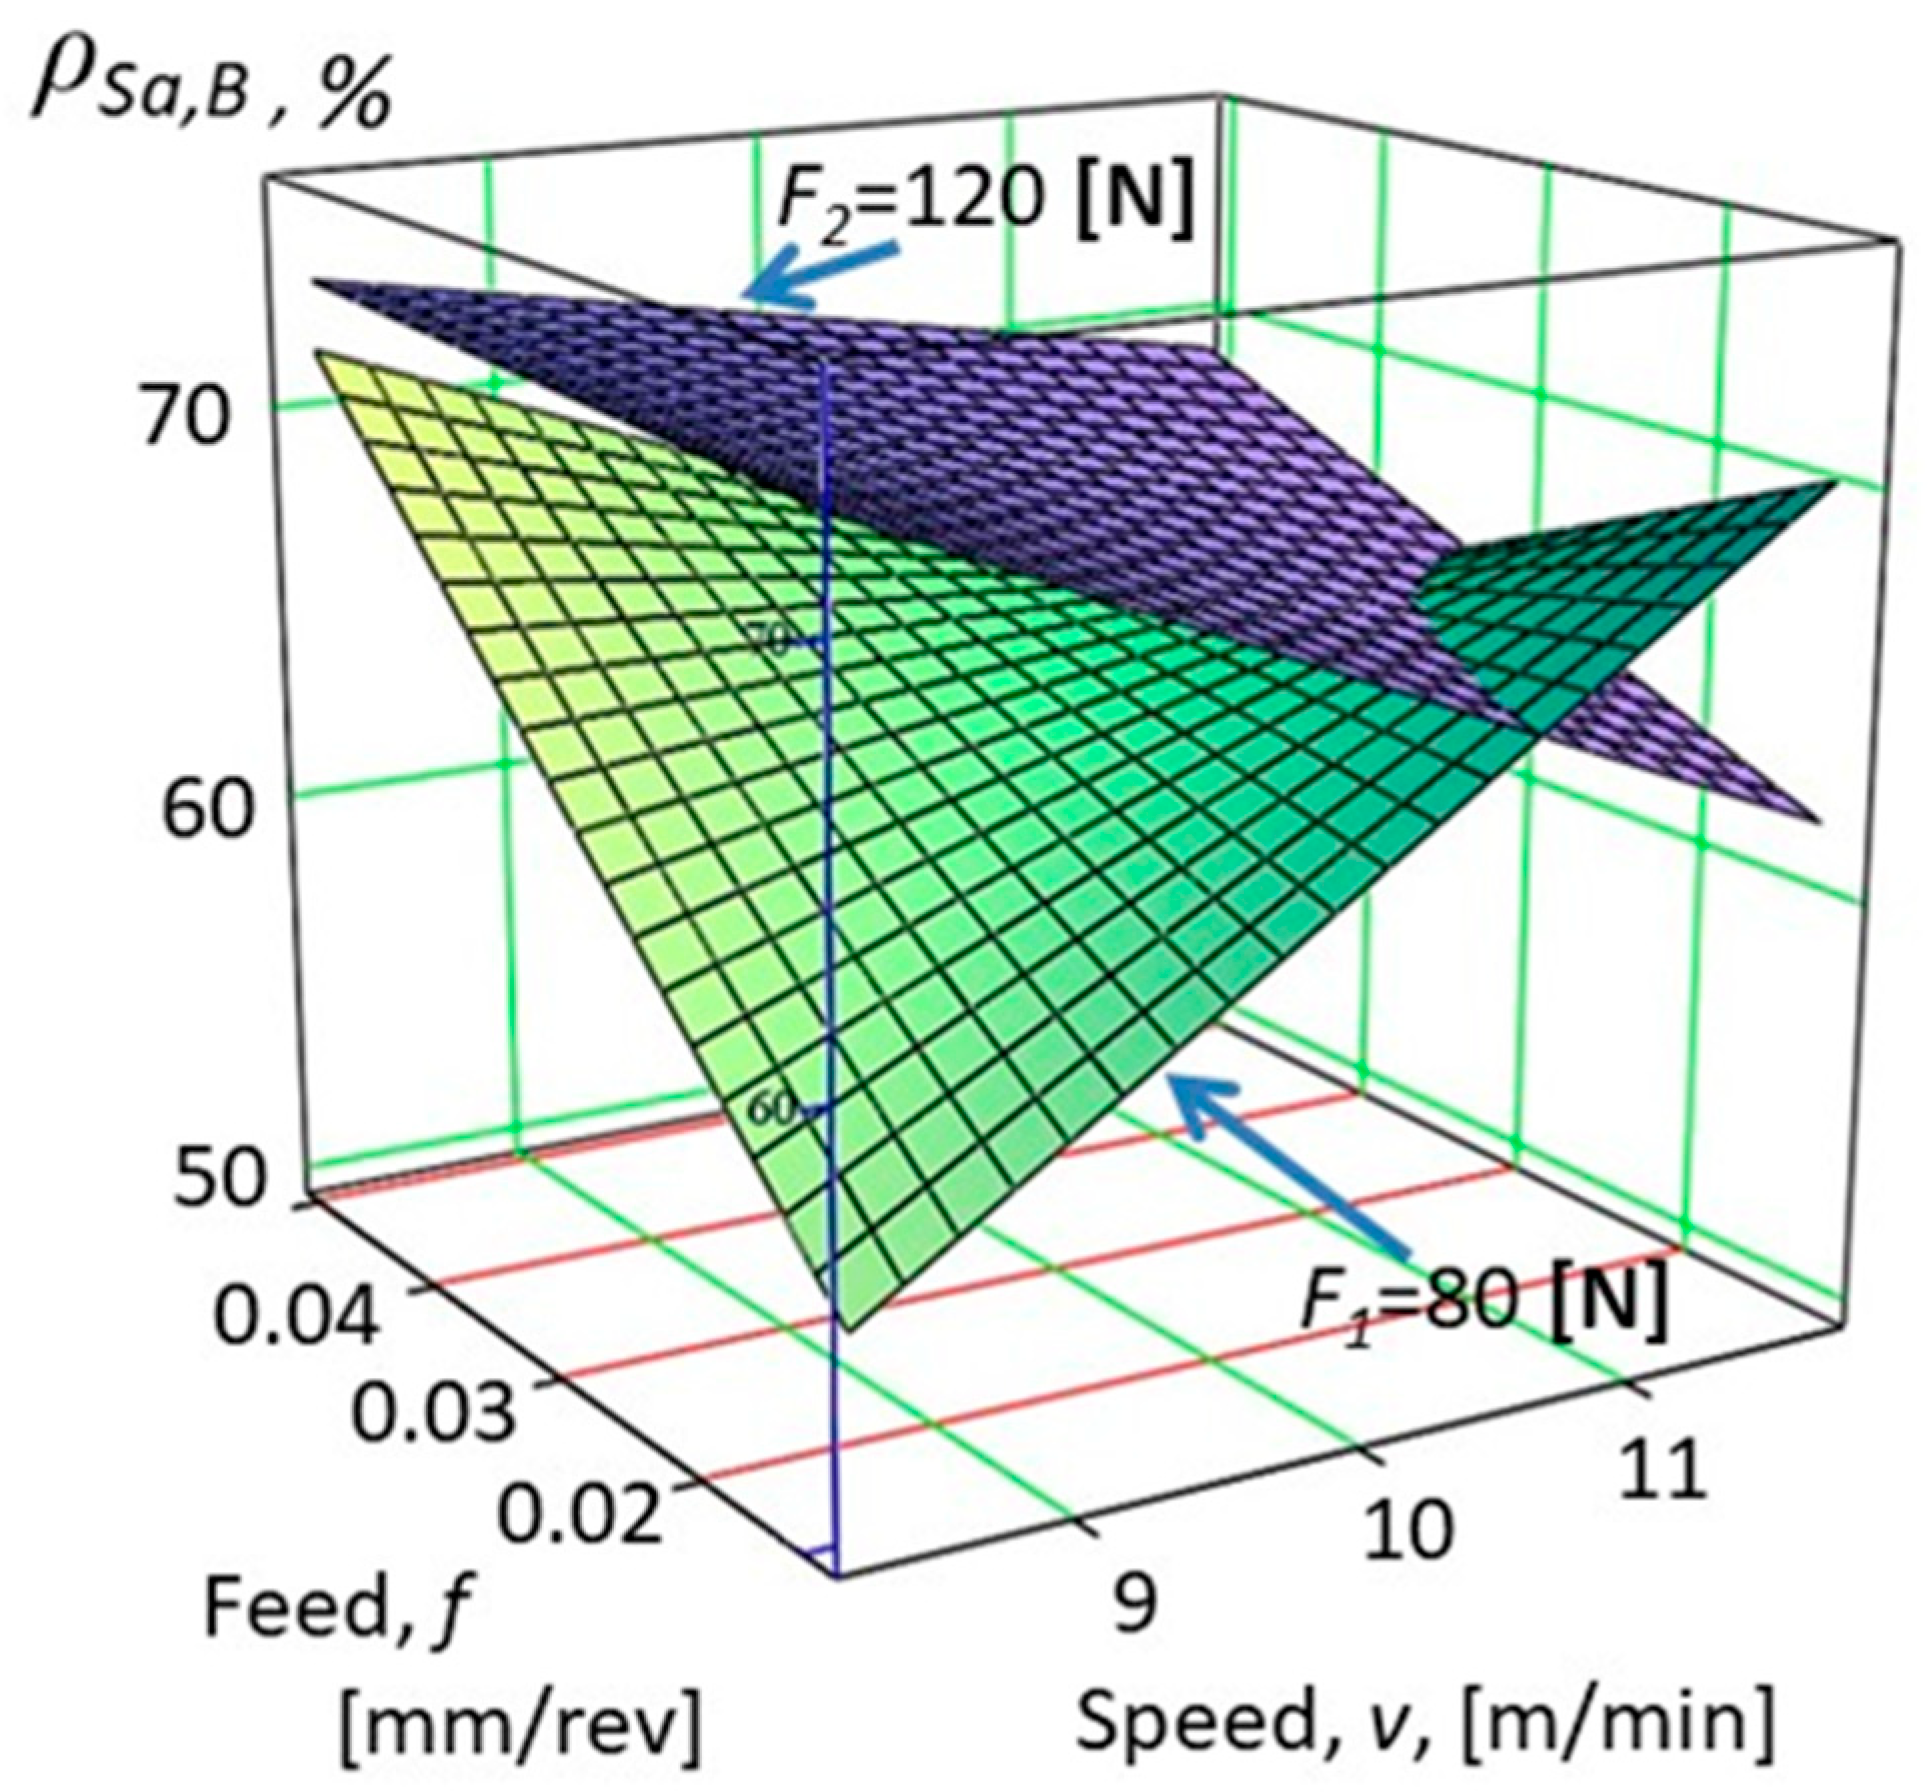
Machines 10 00400 g011
Figure 12. Improvement of the change of surface roughness ρ S a , B   on specimens marked B (see Equation (10)).
Machines 10 00400 g012
Figure 13. Improvement of the change of surface roughness ρ S a , C   on specimens marked C (see Equation (11)).
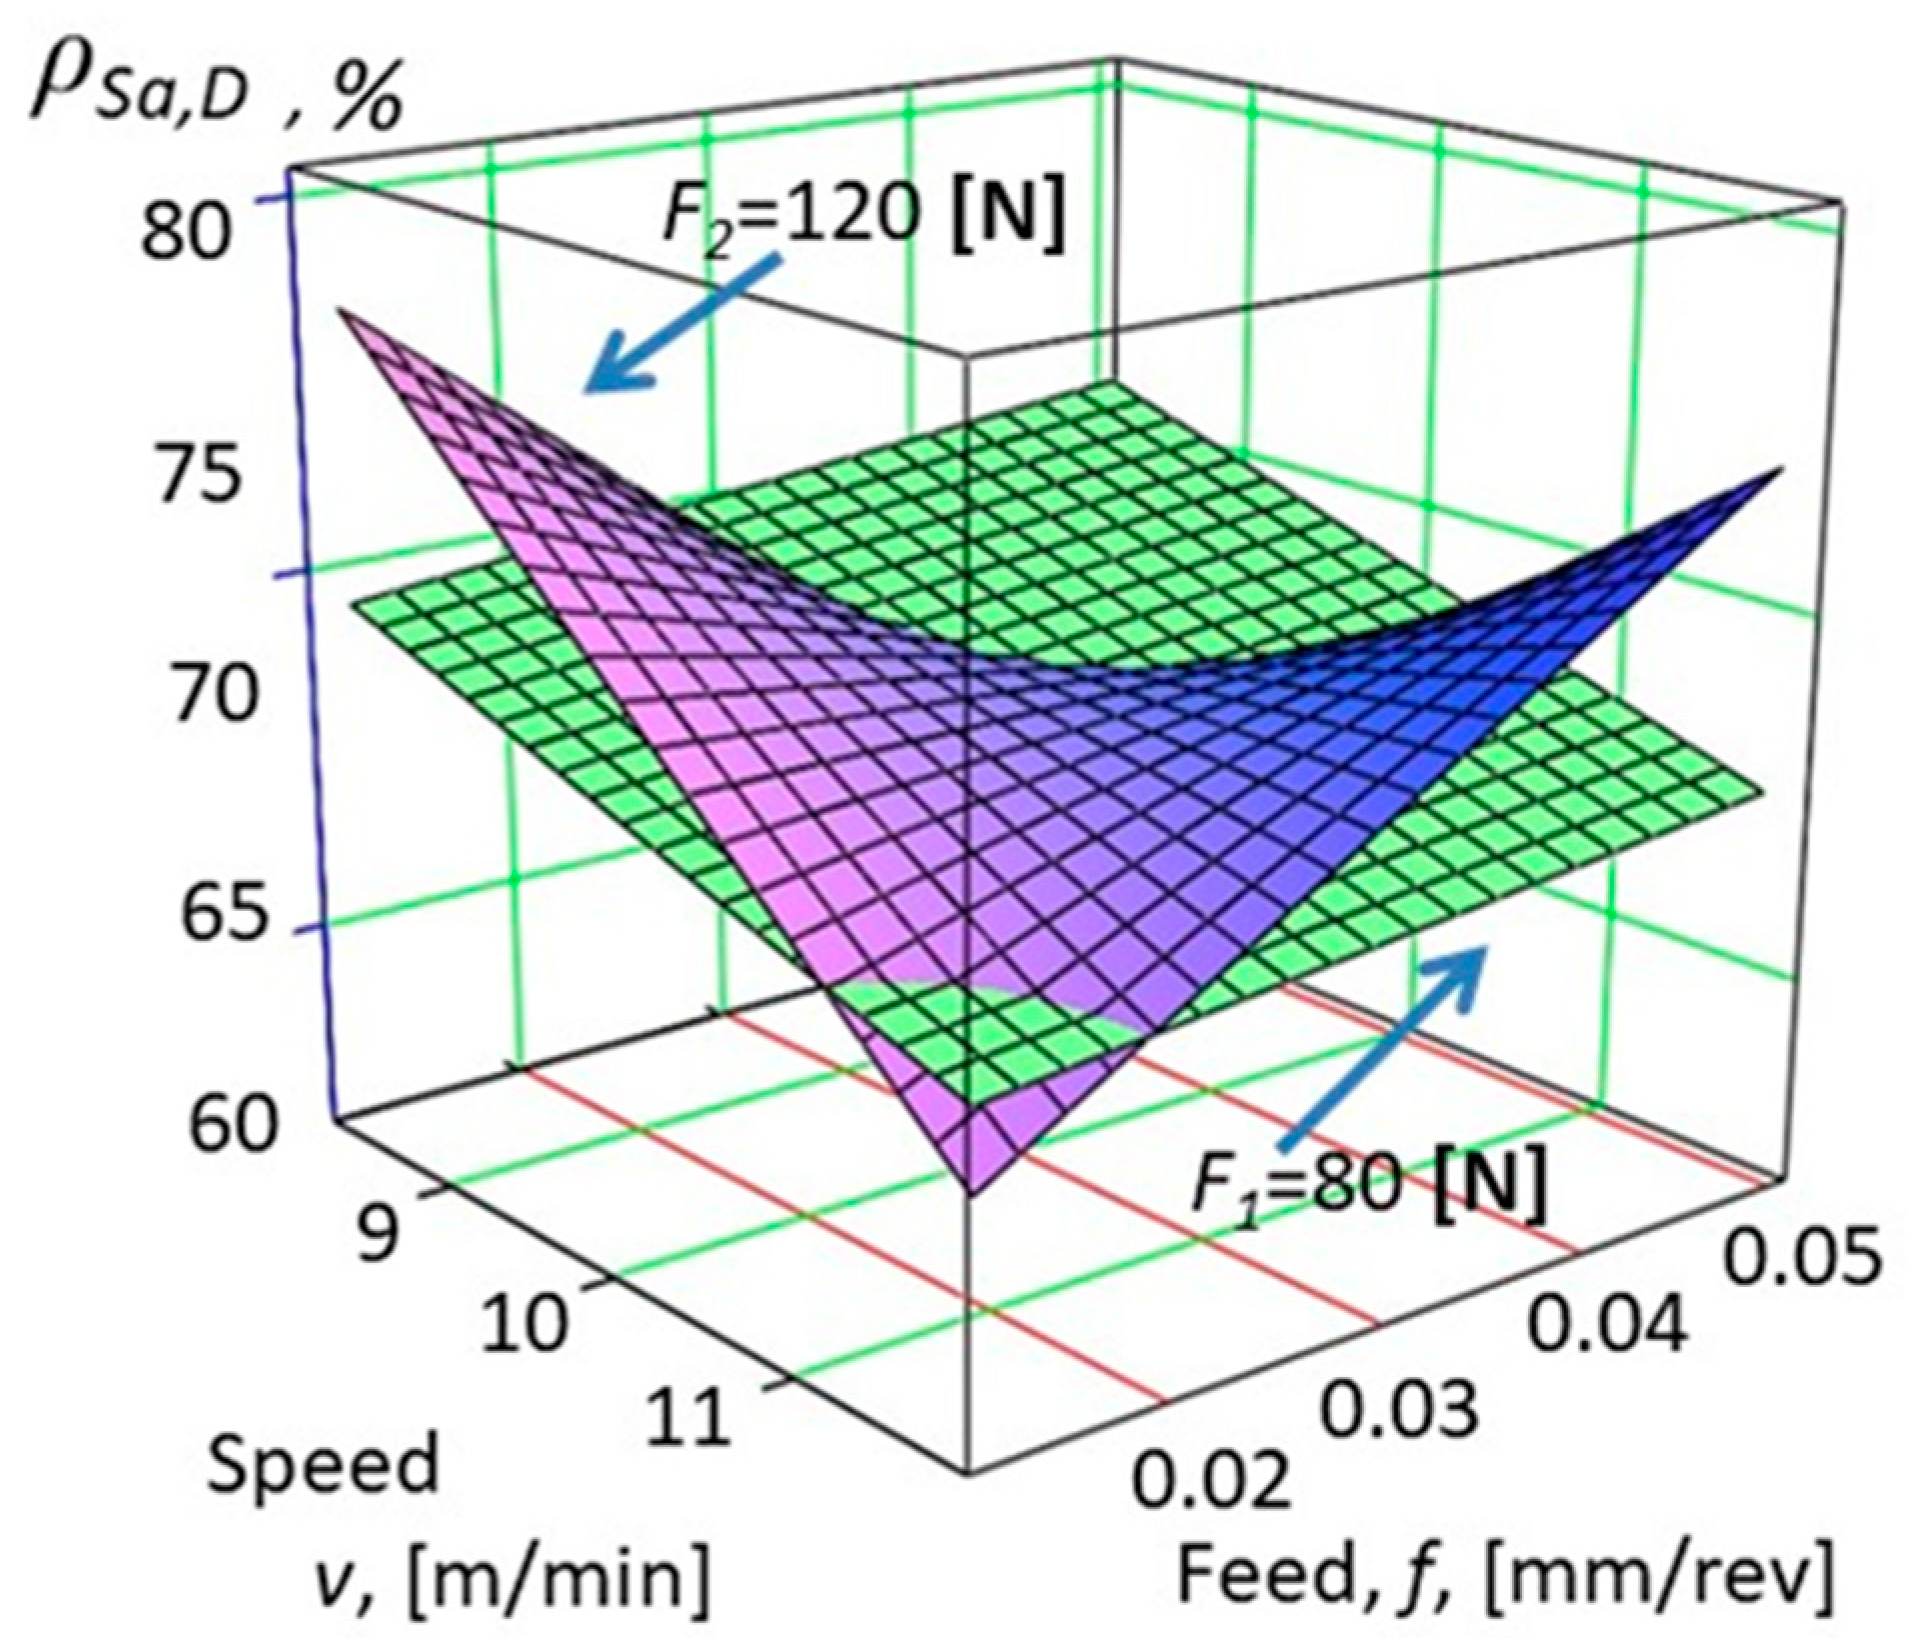
Machines 10 00400 g013
Figure 14. Improvement of the change of surface roughness ρ S a , D   on specimens marked D (see Equation (12)).
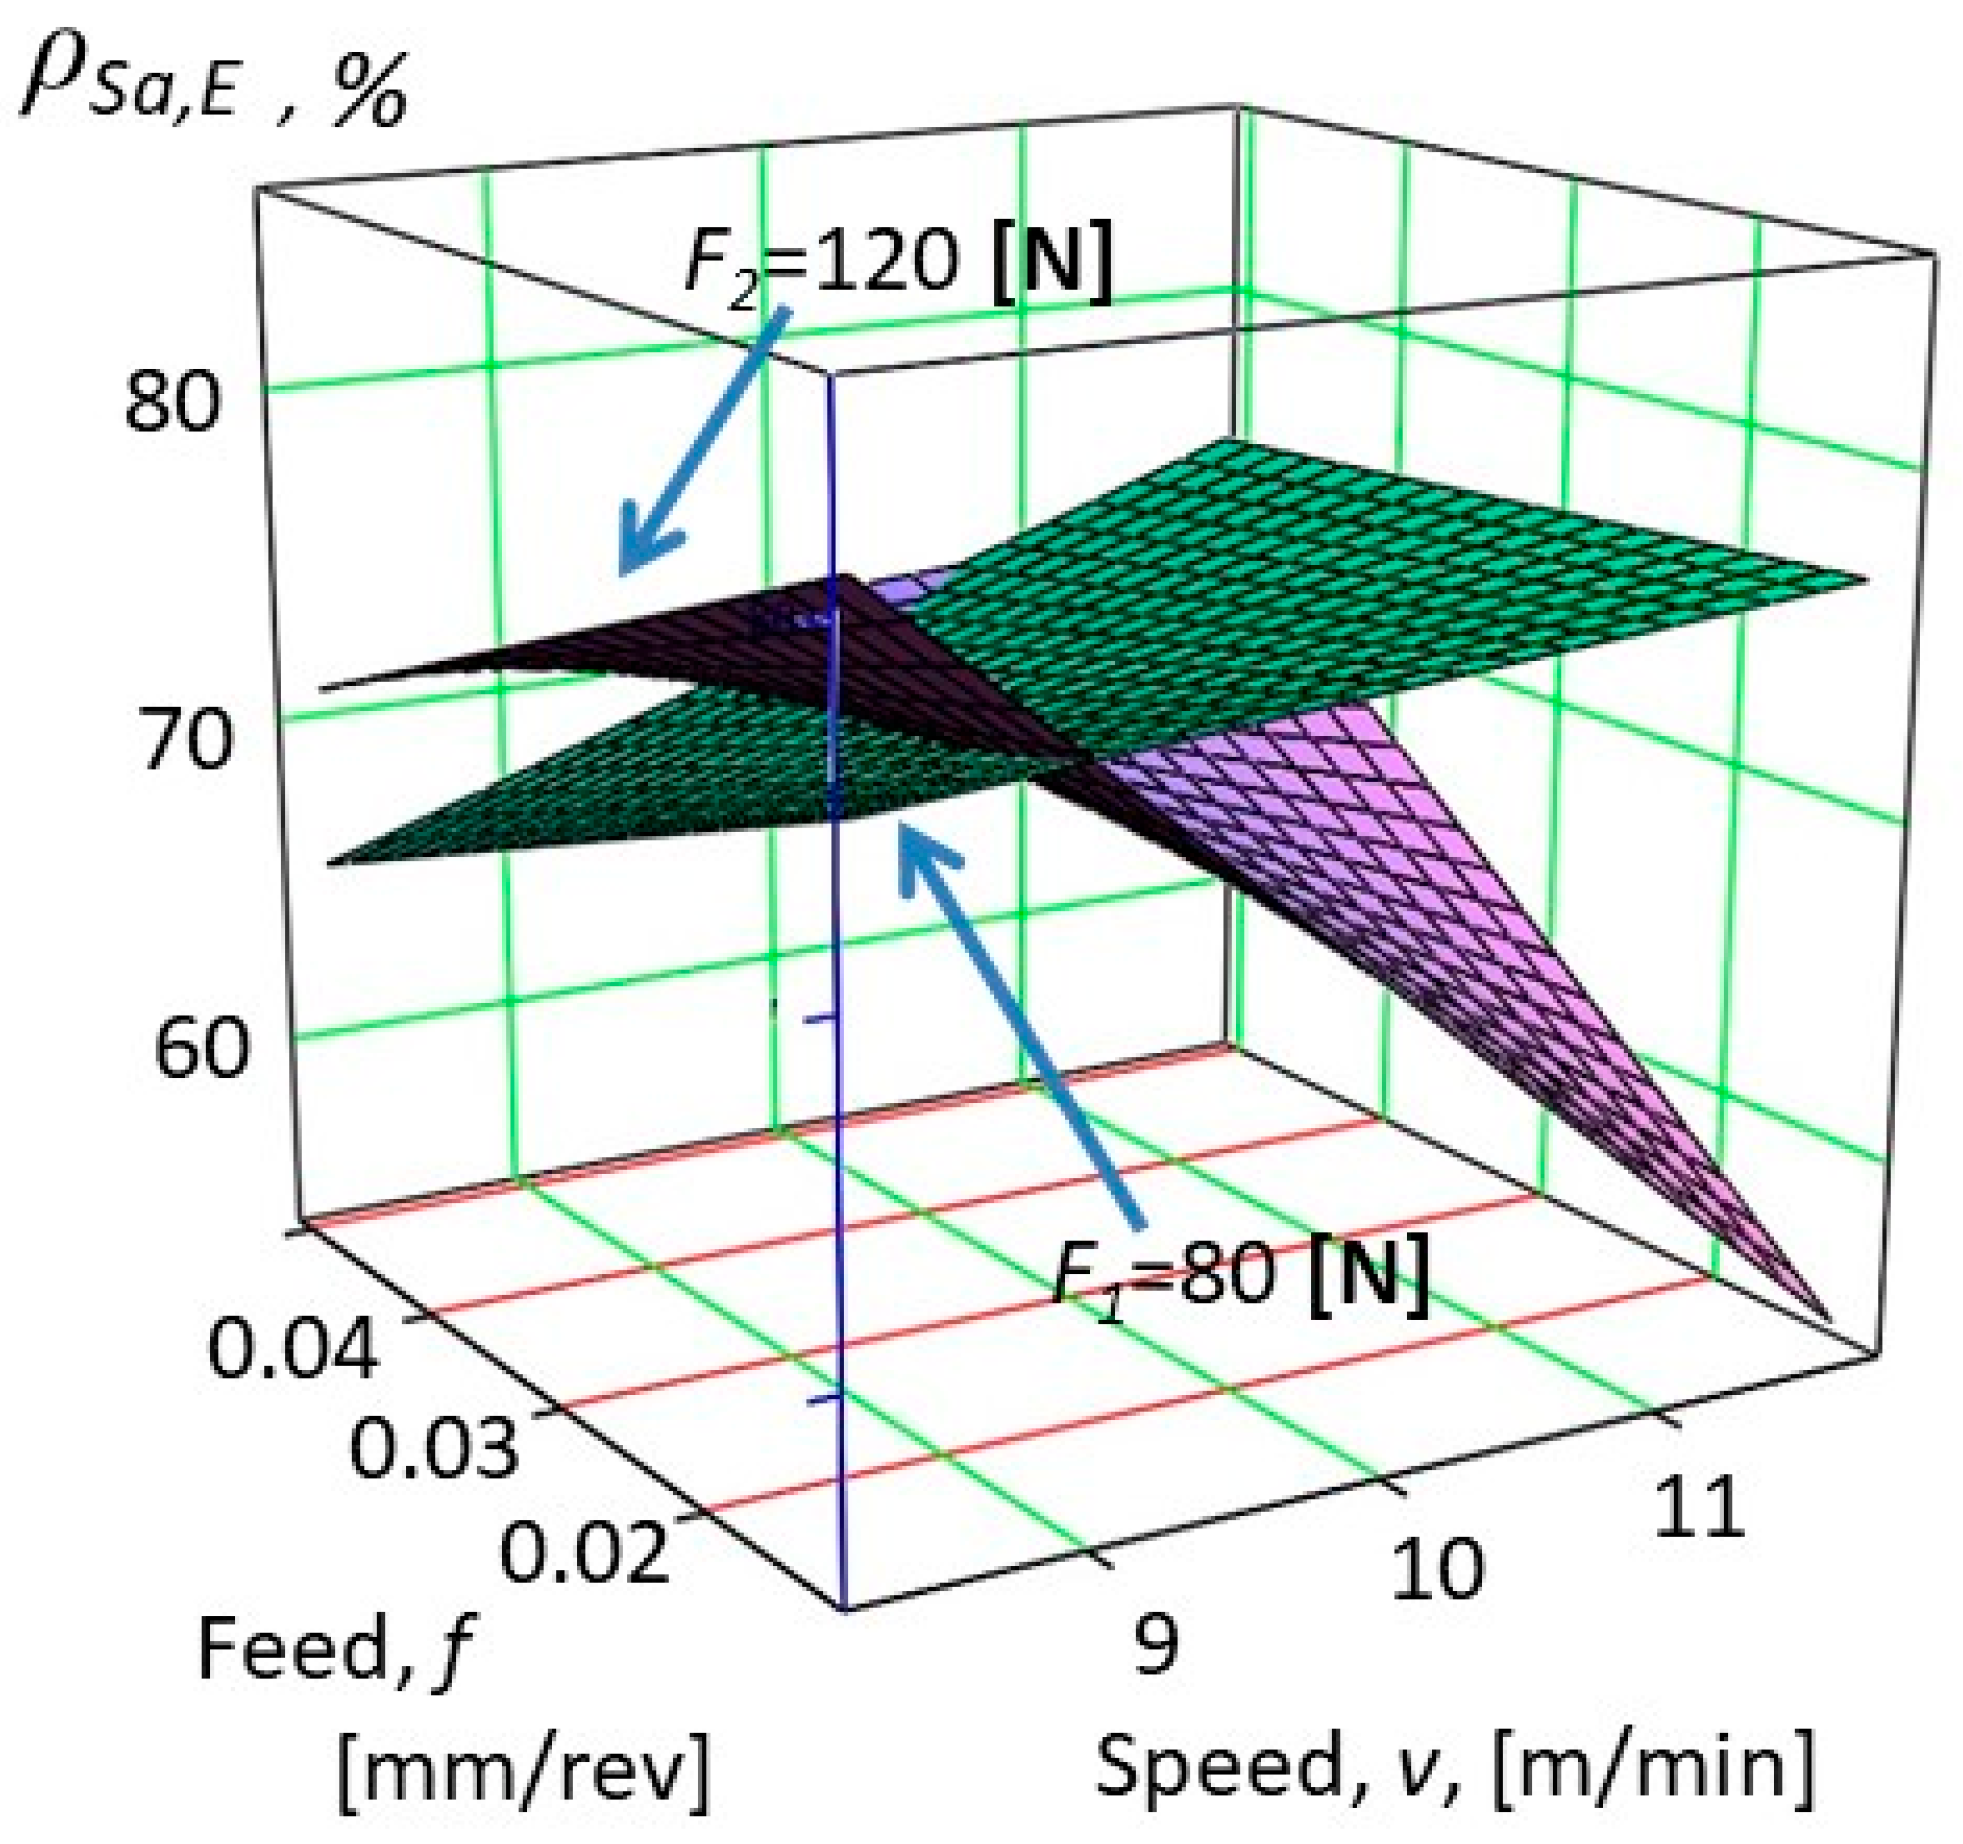
Machines 10 00400 g014
Figure 15. Improvement of the change of surface roughness ρ S a , E   on specimens marked E (see Equation (13)).
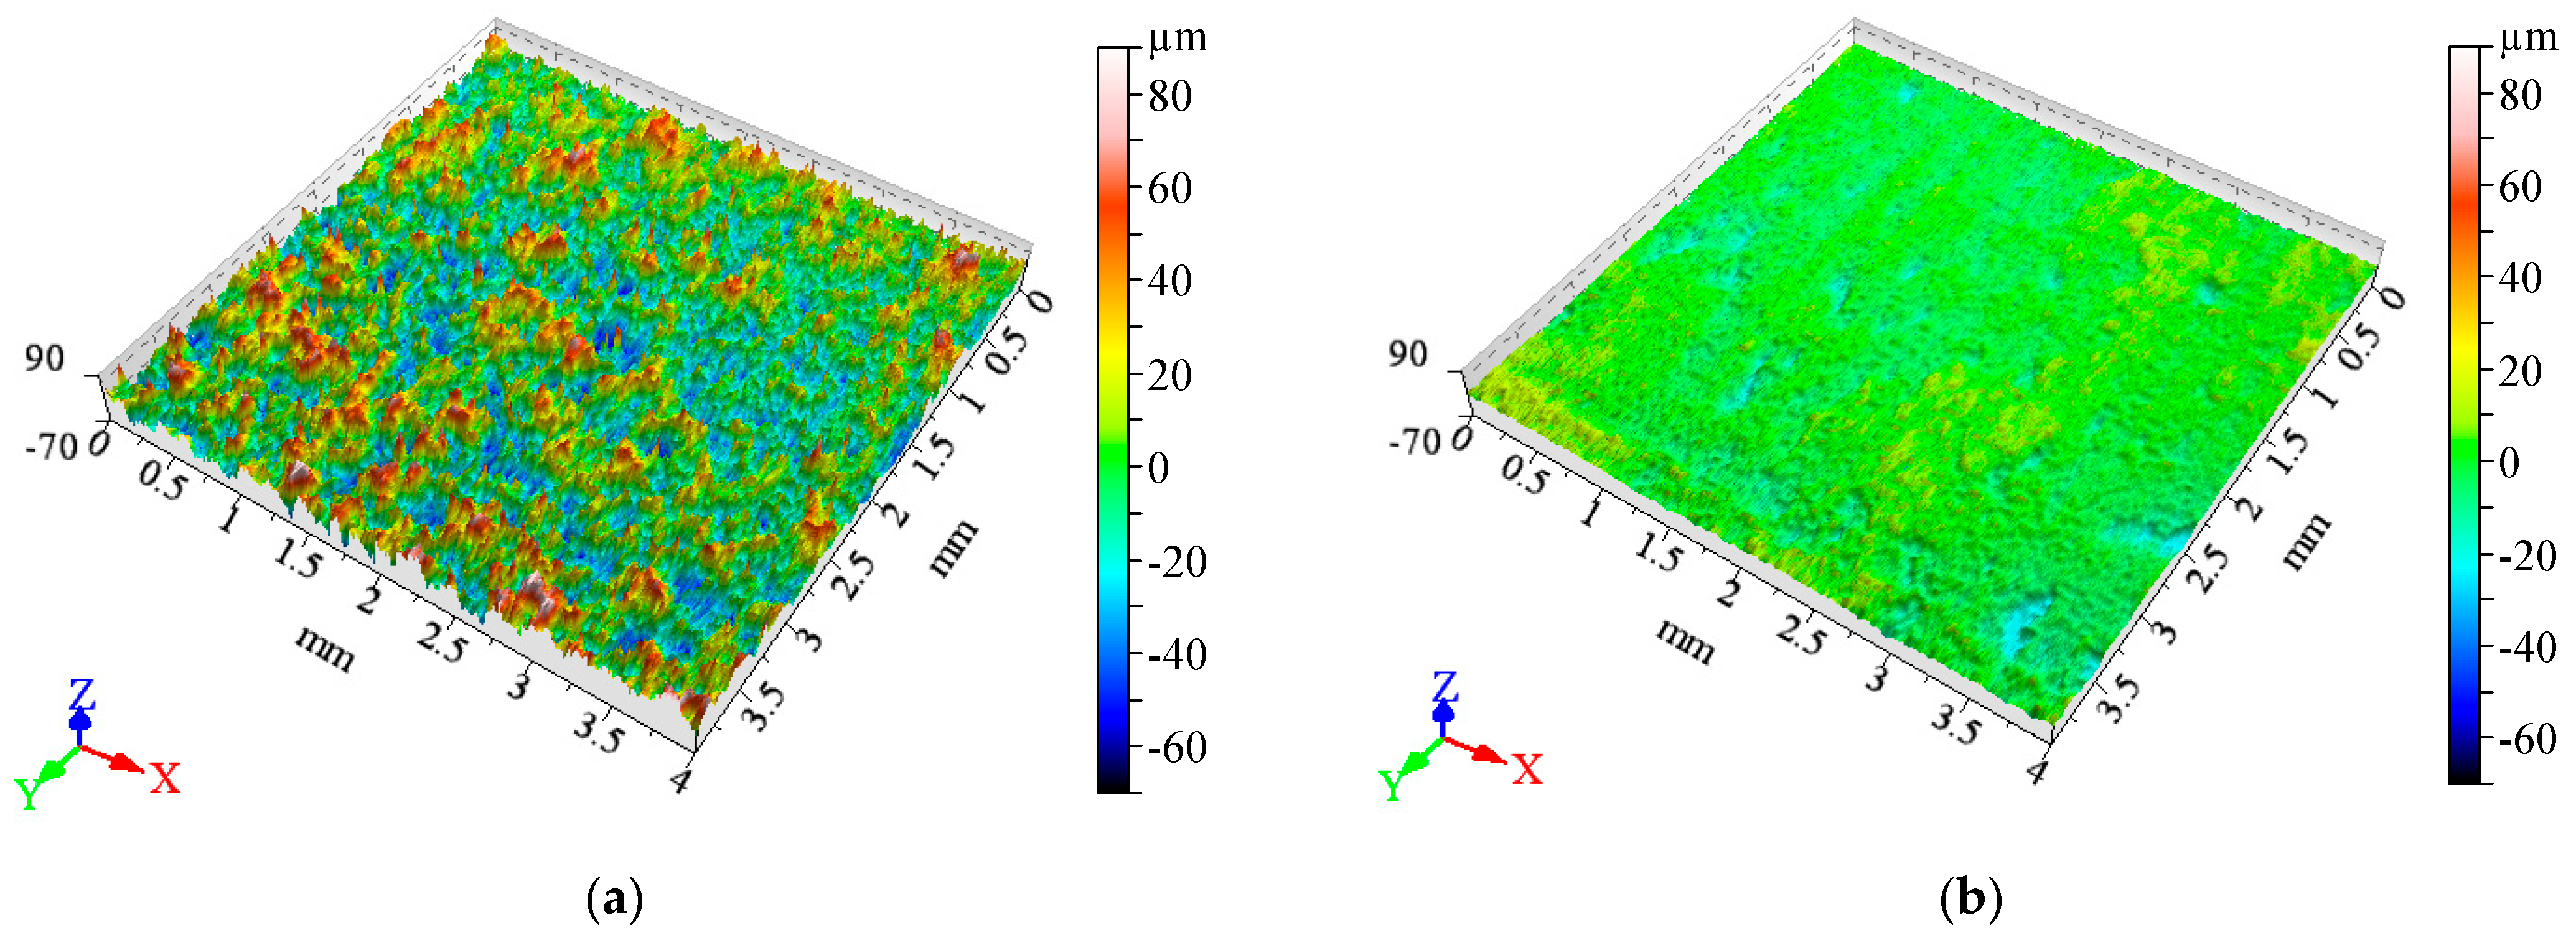
Machines 10 00400 g015
Figure 16. 3D roughness images: (a) before burnishing and (b) after burnishing on the specimen E5−1A.
Machines 10 00400 g016
Figure 17. An electron microscopic image of the top view of sample A1, after burnishing.
Machines 10 00400 g017
Figure 18. An electron microscopic cross-cut image of sample A1, after diamond burnishing.
Machines 10 00400 g018
Table 1. The manufacturing parameters of the specimens.
Code of Parameter SetupInfill Laser Power, P, [W]Infill Laser Speed, u, [mm/s]Energy Input [W/mm3]
A233.33120046.300
B280.00100066.667
C336.00144055.556
D233.33100055.556
E280.00120055.556
Table 2. The parameters of burnishing in SI system.
No.Burnishing Parameters
Speed, v [m/min]Feed, f [mm/rev]Force, F [N]
18.3210.012580
211.7750.012580
38.3210.050080
411.7750.050080
58.3210.0125120
611.7750.0125120
78.3210.0500120
811.7750.0500120
Table 3. The measured values and the calculated improvement ratios for Ra [µm].
A B C D E
Rabb,ARaab,A ρ R a , A   % Rabb,BRaab,B ρ R a , B   % Rabb,CRaab,C ρ R a , C   % Rabb,DRaab,D ρ R a , D   % Rabb,ERaab,E ρ R a , E   %
A115.693.4178.29B19.773.2067.28C111.533.2871.52D114.043.0078.64E115.883.5577.62
A210.962.7774.68B210.823.0172.20C210.323.7064.19D210.843.5866.97E215.093.0180.06
A316.143.8676.06B311.662.9175.03C311.093.0472.58D313.153.5073.38E313.904.0570.85
A412.363.1074.81B414.194.5468.02C410.363.1969.24D414.183.3676.29E416.264.1774.33
A512.112.8976.15B511.562.7376.39C511.363.5668.65D516.672.9982.06E518.903.1583.33
A612.392.7877.54B610.752.9072.97C611.113.1471.70D610.333.4666.49E612.273.5870.81
A711.643.2072.49B717.812.9383.58C712.033.1373.96D712.742.9077.20E716.012.9381.70
A810.183.1868.78B811.962.9275.58C811.322.6077.03D816.313.0081.61E814.113.4775.40
Table 4. The constants for regression improvement equations for Rz and Rq.
ConstantsConstants
ρ R z , A ρ R z , B ρ R z , C ρ R z , D ρ R z , E ρ R q , A ρ R q , B ρ R q , C ρ R q , D ρ R q , E
C 0 134.21 18.127 200.324133.716 27.24127.1 26.918156.01896.87 8.243
C 1 6.7817.482 13.264 6.50711.996 5.4778.617 9.127 2.359.856
C 2 1123.01686.0 1651.02214.0 194.5 1066.01961.0 933.27 913.56 290.76
C 3 0.6860.835 1.3710.0711.237 0.5010.883 0.8140.3321.046
C 12 135.155 182.61142.073189.353 55.565129.172 210.0786.14666.103 45.003
C 13 0.074 0.07 0.1350.01 0.1380.055 0.0770.084 0.035 0.116
C 23 12.674 10.64417.6439.195 1.19110.645 12.5739.108 3.862 0.518
C 123 1.544 1.251 1.418 0.0570.706 1.3791.484 0.7240.7210.694
Table 5. The sequence formation based on improvement ratios for Ra, Rz, and Rq.
ρ R a ρ R a ρ R a ρ R a ρ R a
1B783.589E177.6217B875.5825B672.9733C469.24
2E583.3310A677.5418E875.4026C372.5834A868.78
3D582.0611D777.2019B375.0327A772.4935C568.65
4E781.7012C877.0320A474.8128B272.2036B468.02
5D881.6113B576.3921A274.6829C671.7037B167.28
6E280.0614D476.2922E474.3330C171.5238D266.97
7D178.6415A576.1523C773.9631E370.8539D666.49
8A178.2916A376.0624D373.3832E670.8140C264.19
ρ R z ρ R z ρ R z ρ R z ρ R z
1E581.749B576.0517D471.6825A569.3533D366.53
2B781.2510D775.9718B371.6526B269.0234C466.27
3D579.8811E174.9519C771.6327E468.7435B166.11
4E279.2012A674.5320B671.4428A768.6436E365.37
5D878.5813B872.4321A470.8229A867.3337B463.87
6E778.1914A172.1722C169.9830E867.3338D263.65
7D177.1215C671.7523C369.9231E667.0939C562.93
8C876.8116A371.7224A269.7632D666.8340C262.63
ρ R q ρ R q ρ R q ρ R q ρ R q
1B783.199D777.1317B874.5425A771.5233C468.85
2E582.6310A677.1118A474.4726E471.4234C568.07
3E781.3411C876.9819A274.1727C671.2935E367.73
4D581.1712E176.9120B373.9428B271.1936B466.67
5D880.9613B576.2221C773.8329C171.1737B166.63
6E279.2314A375.0122E873.7430D371.1338D265.99
7D178.3715A574.9123B672.7131E670.0739D665.23
8A177.1616D474.7924C372.3132A869.0140C264.05
Table 6. Improvement ratio indices on cylinders manufactured with different technologies for Ra.
Point Point Point Point Point
A178.298B167.2837C171.5230D178.647E177.629
A274.6821B272.2028C264.1940D266.9738E280.066
A376.0616B375.0319C372.5826D373.3824E370.8531
A474.8120B468.0236C469.2433D476.2914E474.3322
A576.1515B576.3913C568.6535D582.063E583.332
A677.5410B672.9725C671.7029D666.4939E670.8132
A772.4927B783.581C773.9623D777.2011E781.704
A868.7834B875.5817C877.0312D881.615E875.4018
Average 18.9Average 22.0Average 28.5Average 17.6Average 15.5
Table 7. Improvement ratio indices on cylinders manufactured with different technologies for Rz.
Point Point Point Point Point
A172.1714B166.1135C169.9822D177.127E174.9511
A269.7624B269.0226C262.6340D263.6538E279.204
A371.7216B371.6518C369.9223D366.5333E365.3736
A470.8221B463.8737C466.2734D471.6817E468.7427
A569.3525B576.059C562.9339D579.883E581.741
A674.5312B671.4420C671.7515D666.8332E667.0931
A768.6428B781.252C771.6319D775.9710E778.196
A867.3329B872.4313C876.818D878.585E867.3330
Average 21.1Average 20.0Average 25.4Average 18.1Average 18.2
Table 8. Improvement ratio indices on cylinders manufactured with different technologies for Rq.
Point Point Point Point Point
A178.298B167.2837C171.5230D178.647E177.629
A274.6821B272.2028C264.1940D266.9738E280.066
A376.0616B375.0319C372.5826D373.3824E370.8531
A474.8120B468.0236C469.2433D476.2914E474.3322
A576.1515B576.3913C568.6535D582.063E583.332
A677.5410B672.9725C671.7029D666.4939E670.8132
A772.4927B783.581C773.9623D777.2011E781.704
A868.7834B875.5817C877.0312D881.615E875.4018
Average 17.6Average 21.9Average 25.4Average 18.5Average 17.1
Table 9. Improvement ratio index order for Ra, Rz, and Rq.
CodeApplied Laser Power [W]Applied Laser Speed [mm/s]
E (15.5 + 18.2 + 17.1)/3 = 16.9233.331000
D (17.6 + 18.1 + 18.5)/3 = 18.1280.001200
A (18.9 + 21.1 + 17.6)/3 = 19.2233.331200
B (22.0 + 20.0 + 21.9)/3 = 21.3280.001000
C (28.5 + 25.4 + 25.4)/3 = 26.4336.001440
Table 10. The measured values and the calculated ratios for Sa.
A B C D E
Sabb,ASaab,A ρ S a , A   % Sabb,BSaab,B ρ S a , B   %   Sabb,CSaab,C ρ S a , C   %   Sabb,JSaab,J ρ S a , D   % Sabb,KSaab,K ρ S a , E   %
A118.295.7068.81B111.945.4454.46C113.775.6958.65D116.345.0569.08E119.044.8374.65
A213.605.8057.36B213.394.0070.13C214.295.0164.94D213.895.1463.02E218.364.2576.86
A319.565.8070.35B314.214.0571.47C312.774.2067.11D316.004.5971.33E314.915.1365.58
A414.755.8860.12B417,026.4662.03C413.624.2169.12D415.655.4565.16E421.745.3875.24
A513.333.9870.17B513.913.8672.29C512.705.5456.43D520.514.7077.09E520.743.9980.77
A613.164.1268.67B614.005.3361.91C611.735.3154.75D612.694.9860.78E615.827.1155.03
A712,974.5564.93B720.095.3973.19C712.224.2565.21D715.806.4659.14E718.225.2871.00
A813.056.5949.53B814.194.4068.98C814.233.9372.36D820.365.3273.88E816.044.3772.76
Table 11. The constants for regression improvement equations for Sz and Sq.
ρ S z ρ S q
ρ S z , A ρ S z , B ρ S z , C ρ S z , D ρ S z , E ρ S q , A ρ S q , B ρ S q , C ρ S q , D ρ S q , E
C 0 64.448200.381 93.575 12.992 78.83143.615 235.25 17.406 36.448 94.384
C 1 2.669243.013.1897.6116.29 10.29328.2938.9169.34919.016
C 2 326.376562.03539.02255.01288.0 1295.07125.02110.04508.01690.0
C 3 0.0832.4051.331207.01.738 0.6442.7920.6671.5072.118
C 12 119.784 641.5 298.85 226.95 182.0208.292 694.16 221.12 427.32 233.55
C 13 0.021 0.222 0.118 0.115 0.1860.091 0.264 0.083 0.14 0.235
C 23 6.236 56.67 31.165 33.358 20.53716.132 62.182 19.713 56.908 29.579
C 123 1.5525.5912.9893.3222.5062.5166.1442.3375.4443.56
Table 12. The sequence formation based on improvement ratios for Sa.
ρ S a ρ S a ρ S a ρ S a ρ S a
1E577.729D371.3317C469.1225C264.9433A460.12
2D577.0910E770.6518D169.0826A764.9334D759.14
3E275.5811E870.5319B868.9827D263.0235C158.65
4D873.8812E470.4220A168.8128E362.6736A257.36
5B773.1913A370.3521A668.6729E662.2237C556.43
6C872.3614A570.1722C367.1130B462.0338C654.75
7B572.2915B270.1323C765.2131B661.9139B154.46
8B371.4716E169.7824D465.1632D660.7840A849.53
Table 13. Improvement ratio indices on cylinders manufactured with different technologies for Sa.
Point Point Point Point Point
A168.8120B154.4639C158.6535D169.0818E169.7816
A257.3636B270.1315C264.9425D263.0227E275.583
A370.3513B371.478C367.1122D371.339E362.6728
A460.1233B462.0330C469.1217D465.1624E470.4212
A570.1714B572.297C556.4337D577.092E577.721
A668.6721B661.9131C654.7538D660.7832E662.2229
A764.9326B773.195C765.2123D759.1434E770.6510
A849.5340B868.9819C872.366D873.884E870.5311
Average 25.4Average 19.2Average 25.4Average 15.8Average 13.8
Table 14. Improvement ratio indices on cylinders manufactured with different rapid prototyping technologies for Sa, Sz and Sq.
Applied Laser Power [W]Applied Laser Speed [mm/s]
E (13.8 + 12.2 + 12)/3 = 12.7280.001200
D (15.8 + 19 + 20)/3 = 18.3233.331000
B (19.2 + 24.5 + 20)/3 = 21.2280.001000
A (25.4 + 22.6 + 24.6)/3 = 24.2233.331200
C (25.4 + 24.1 + 25.9)/3 = 25.1336.001440
Table 15. Improvement ratio indices for cylinders manufactured with different technologies (parameter setup, referring to Table 1) for Ra, Rz, and Rq; furthermore, Sa, Sz, and Sq.
Code of Parameter SetupOrderAverageRanking
Based on Ra, Rz and Rq ImprovementBased on Sa, Sz and Sq Improvement
A343.53
B433.53
C544.55
D2222
E1111
Publisher’s Note: MDPI stays neutral with regard to jurisdictional claims in published maps and institutional affiliations.

