An Experimental Test Bench for Cable-Driven Transmission


1
Mechanical Engineering Faculty, Universidad Tecnológica de Pereira, Pereira 660003, Colombia
2
Department of Electrical, Electronic and Computer Engineering, Universidad Nacional de Colombia, Manizales 170003, Colombia
*
Author to whom correspondence should be addressed.
Machines 2021, 9(5), 83; https://0-doi-org.brum.beds.ac.uk/10.3390/machines9050083
Submission received: 23 January 2021
/
Revised: 14 April 2021
/
Accepted: 20 April 2021
/
Published: 22 April 2021
(This article belongs to the Section Machines Testing and Maintenance)
Abstract
:Cable-driven transmissions are used widely in robotic applications. However, design variables and parameters of this kind of transmission remain under study, both analytically and experimentally. In this paper, an experimental test bench to evaluate the behavior of medium-low power pulley-cable transmissions is presented. The design of the test bench allows manipulating variables such as dimensions, external load, speed, and cable tension. The system consists mainly of a brushless direct current (DC) motor, two load cells to measure the mechanical reactive force in the motor, two dismountable pulleys, two drums, a perforated disk, and several masses that provide the load and the inertial load, and electronic modules to control the speed and position of the pulley. Special attention was paid to the calibration of the load cells, focused in compensating the effect of creep. Validation tests were carried out in order to evaluate the device design. Next, pilot experiments were performed to estimate the friction behavior in the transmission. Preliminary results suggest that the friction in the transmission is largely governed by the friction behavior of the bearings.
1. Introduction
A mechanical transmission is used to transmit power over distance and change torque or speed from input to output. Current available geared transmissions such as harmonic and cycloidal drives, planetary gears, and other gearboxes, are usually noisy, require very good lubrication and seals, and have low back drivability [1,2]. Cable-driven transmissions, on the other hand, usually have low friction, minimum backlash, high back drivability, and silent operation [3,4]. When developing robotic systems that aim towards physical human–robot interaction (pHRI), it is desired to count on devices that have a high open-loop back-drivability. In applications such as exoskeleton construction, pinion-based articulations prove to be difficult to back-drive, thus requiring a variety of force sensors that translate the operator intentions to the machine, and thus enabling an ergonomic interaction with it [5,6]. Cable-driven transmissions are easier to back-drive, and pose less danger to humans [7,8]. Cable-driven transmissions have been used for diverse robotic purposes ranging from research to physical human–robot interaction applications [9,10]. Arguably, the best known commercial cable-driven transmission application in robots is the Barrett WAM arm [3], used in different areas such as assembly [11], patient rehabilitation [12,13], and other physical human–robot interaction activities.
The mechanical design of the cable transmission is closely related to the load characteristics and the intended application; hence, it is not possible to use a standardized design method yet. Various studies on cable-driven transmissions have focused on different aspects of mechanical transmission design such as stiffness, transmission ratio, screw, cable material, and cable tension. Some of those studies are: Starkey [14] applied experimentation and simulation to formulate an equation as an initial insight into the behavior of a combined capstan amplifier system. Luo [15] presented a mathematical model of the drive stiffness that includes the pre-tension force, coefficient of friction, wraps of cable, and load on the transmission. Xie [16] developed a mathematical model to predict the cable tension and transmission backlash of a precise cable-driven transmission. Mazumdar [17] evaluated the use of synthetic rope instead of steel cables. Rahmati [18] studied pre-tensioning methods, and cable arrangements, whereas Chua and Lu [19,20] settled criteria for cable wrapping and cable grove. Jung [21,22] incorporated the effect of the inertia, bending rigidity, and non-linear friction in a theoretical model that aims to explain the friction in cable-driven systems. Some researchers have been working on dynamic model identification of the Barrett WAM arm [23,24,25,26]. Most of the friction models utilized include several components, such as the sliding friction or Coulomb friction, the breakdown friction or stiction, and the viscous friction; but none of these models involves, in their formulation, the particular design parameters of the transmission evaluated [27]. In general terms, dynamic modeling is important for realistic simulations and for improving the control performance in dynamic systems. However, it often happens that the predicted performance of a model is impaired by an inappropriate friction model. Accurate models of the dynamics of cable transmissions enable researchers to develop safer and more precise robotic parts, adequate to interact with humans in a multitude of scenarios [12,13]. As a main interest of our research team, pHRI development demands the availability of appropriate test equipment and benches.
Previous works on cable-driven transmissions [28,29,30,31,32] have involved the use of test benches developed specifically for each research project, but the majority of these systems have issues that need to be considered in more detail to evaluate friction. In this paper, a test bench for a cable-driven transmission is proposed; this test bench was developed at the Universidad Tecnológica de Pereira, in alliance with Universidad Nacional de Colombia. Some differential features of this new test bench from the previous ones are: (i) the ability to evaluate the effect of more than one turn of cable wrapping, (ii) the chance to change input shaft and pulley to evaluate different transmission ratios and possible materials, with and without groves, and (iii) here there is no transmission behind the cable transmission.
2. Test Bench Design
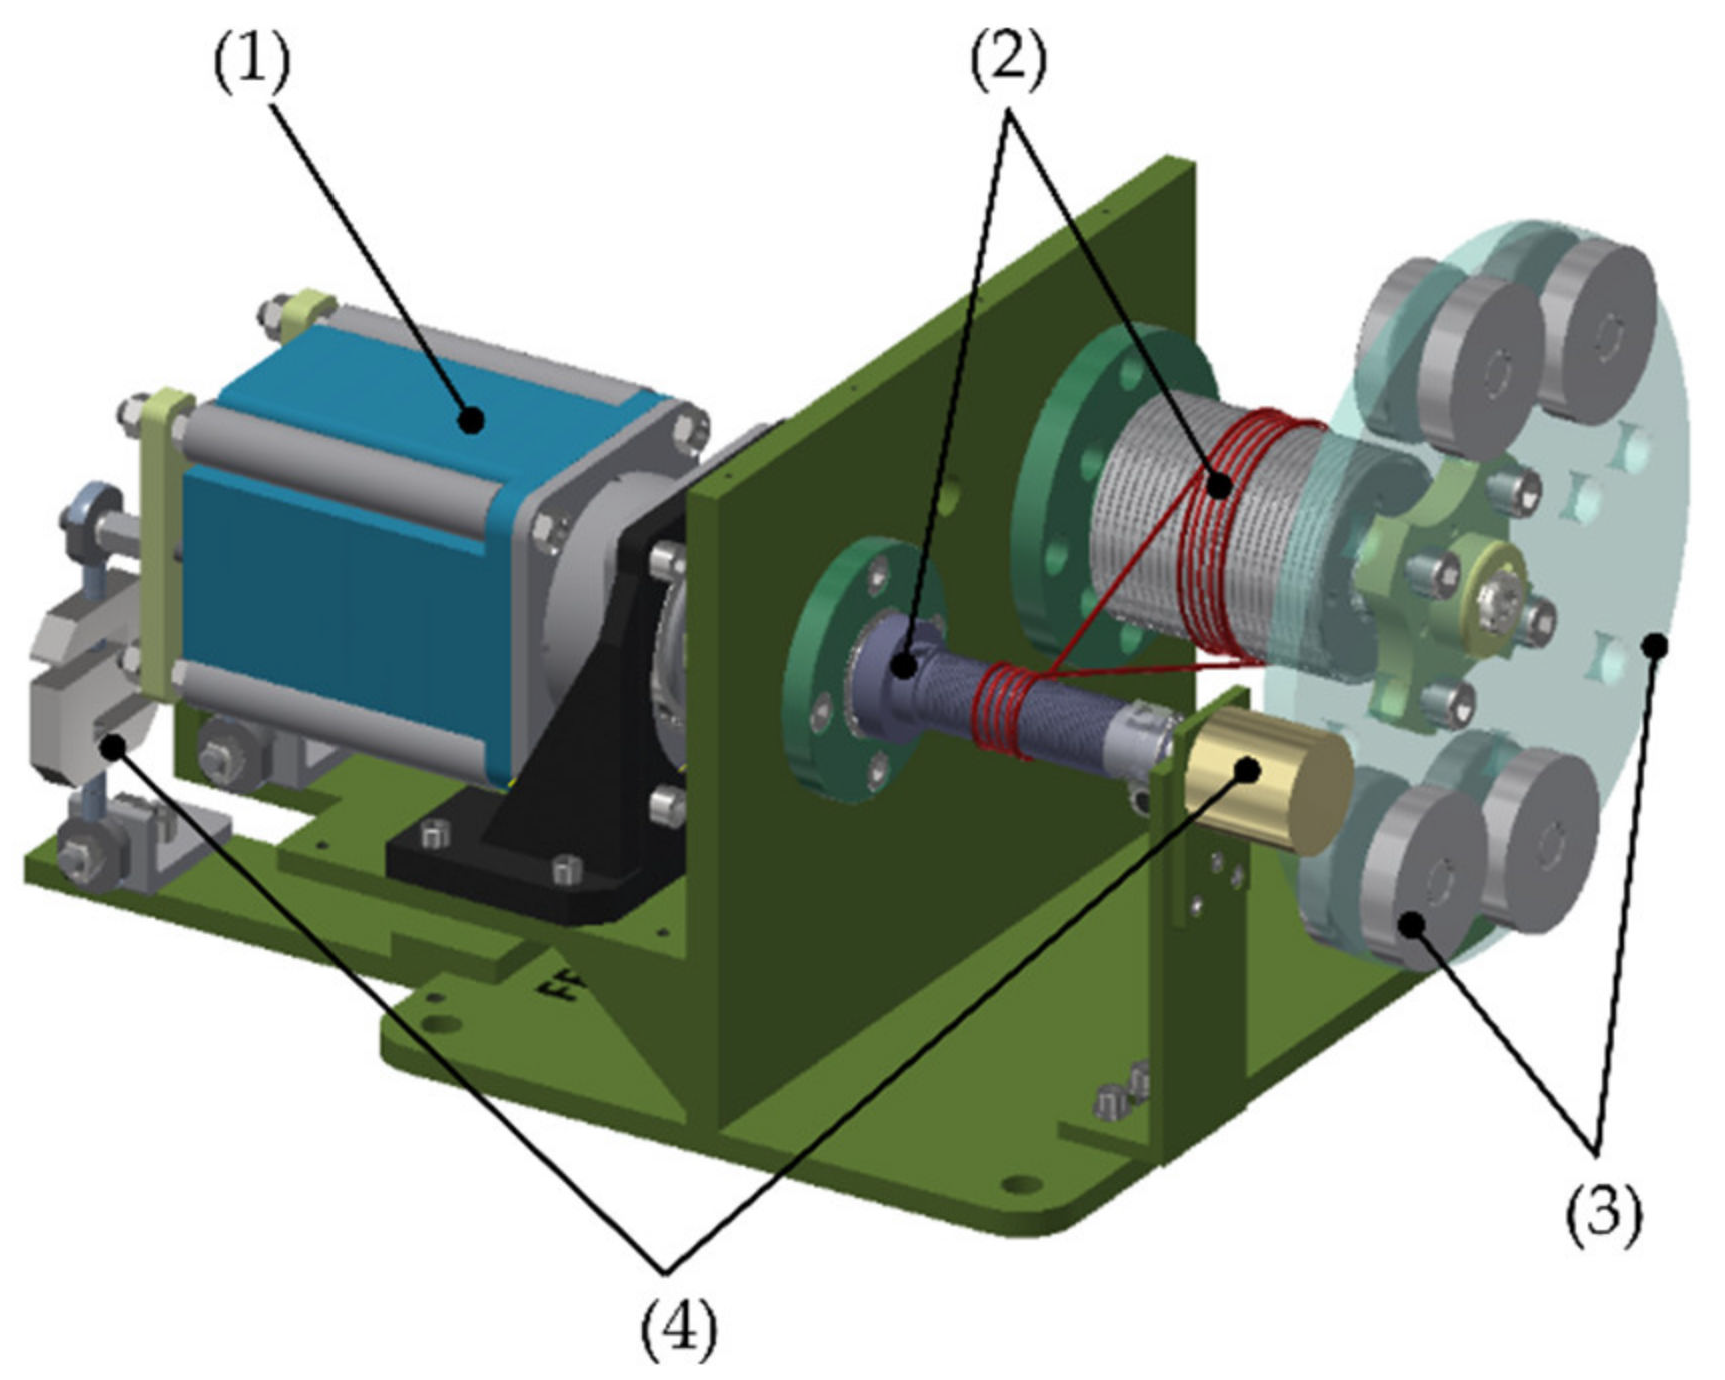
The test bench is based on the Barrett WAM arm developed at the Massachusetts Institute of Technology, and it is composed of six modules as follows: power source module, transmission module, link module, command module, measurement module, and data acquisition module. The mechanical modules are shown in Figure 1.
2.1. Link Module
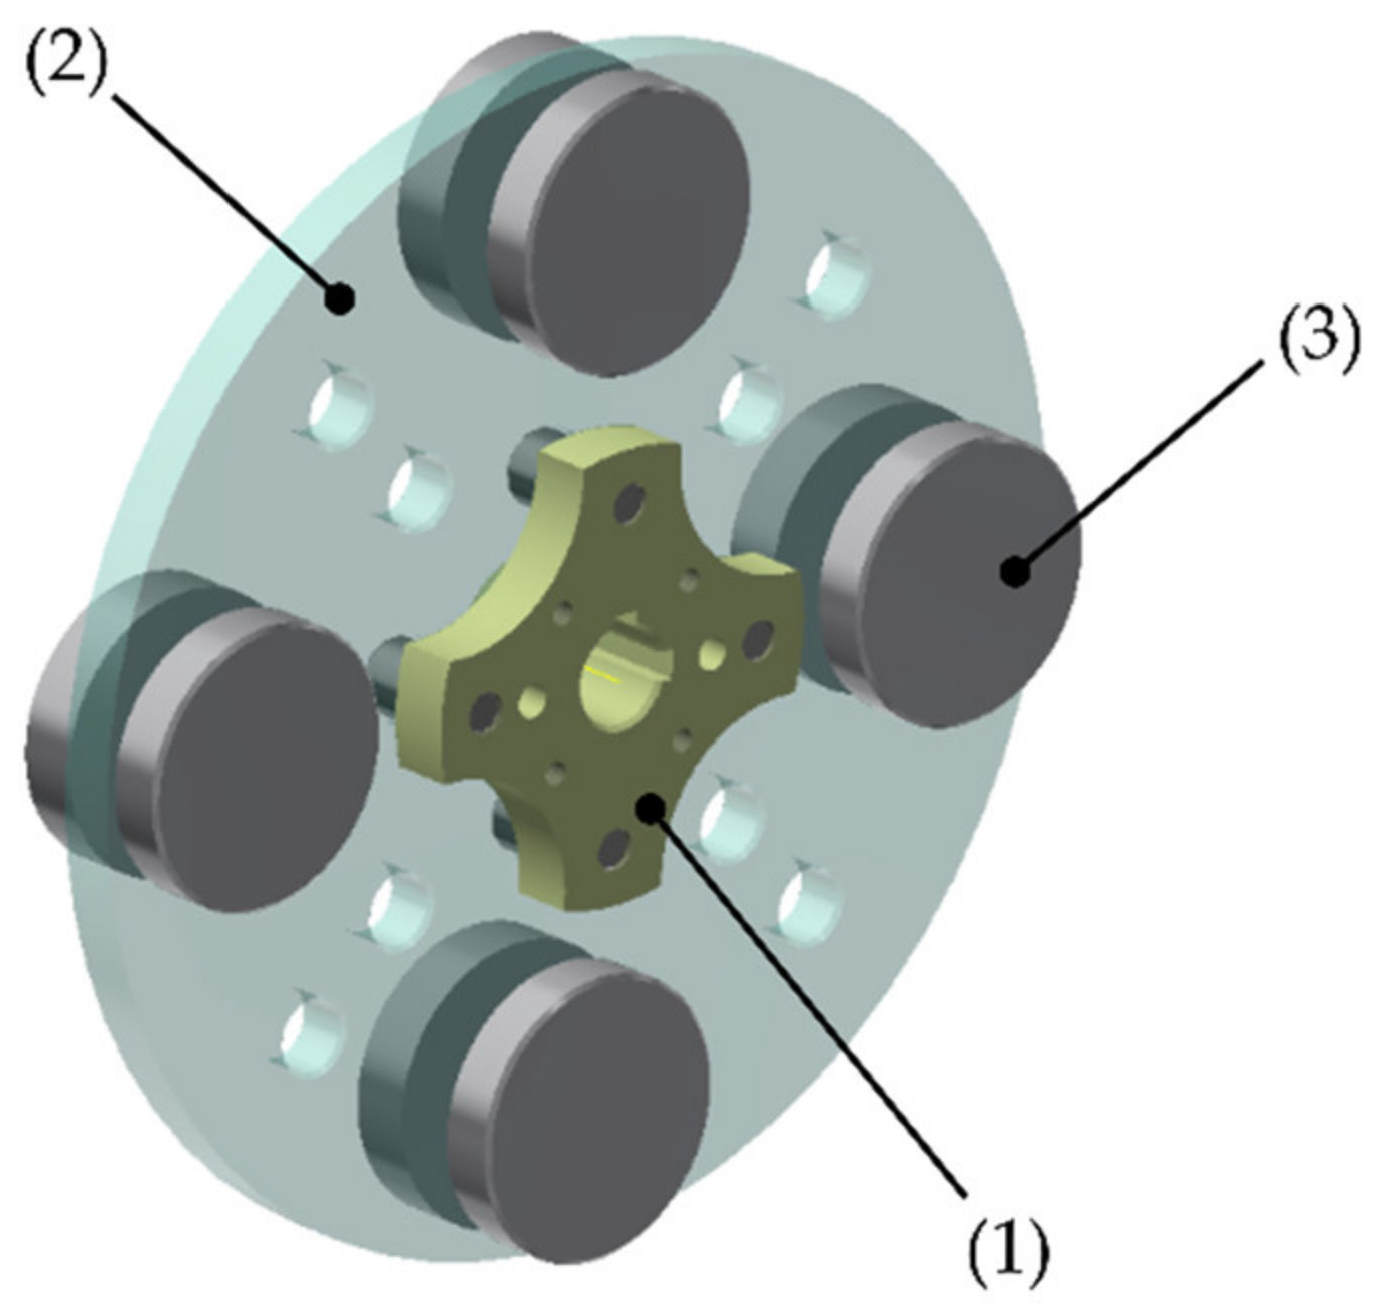
The payload to the transmission is provided by the link module. For the simultaneous application of torque and load on the transmission shaft, a perforated disk and pairs of masses assembled to the disk were used (Figure 2). The disk has 12 holes distributed in two circumferences, so the distribution of the masses in the disc allows several configurations of load and external torque.
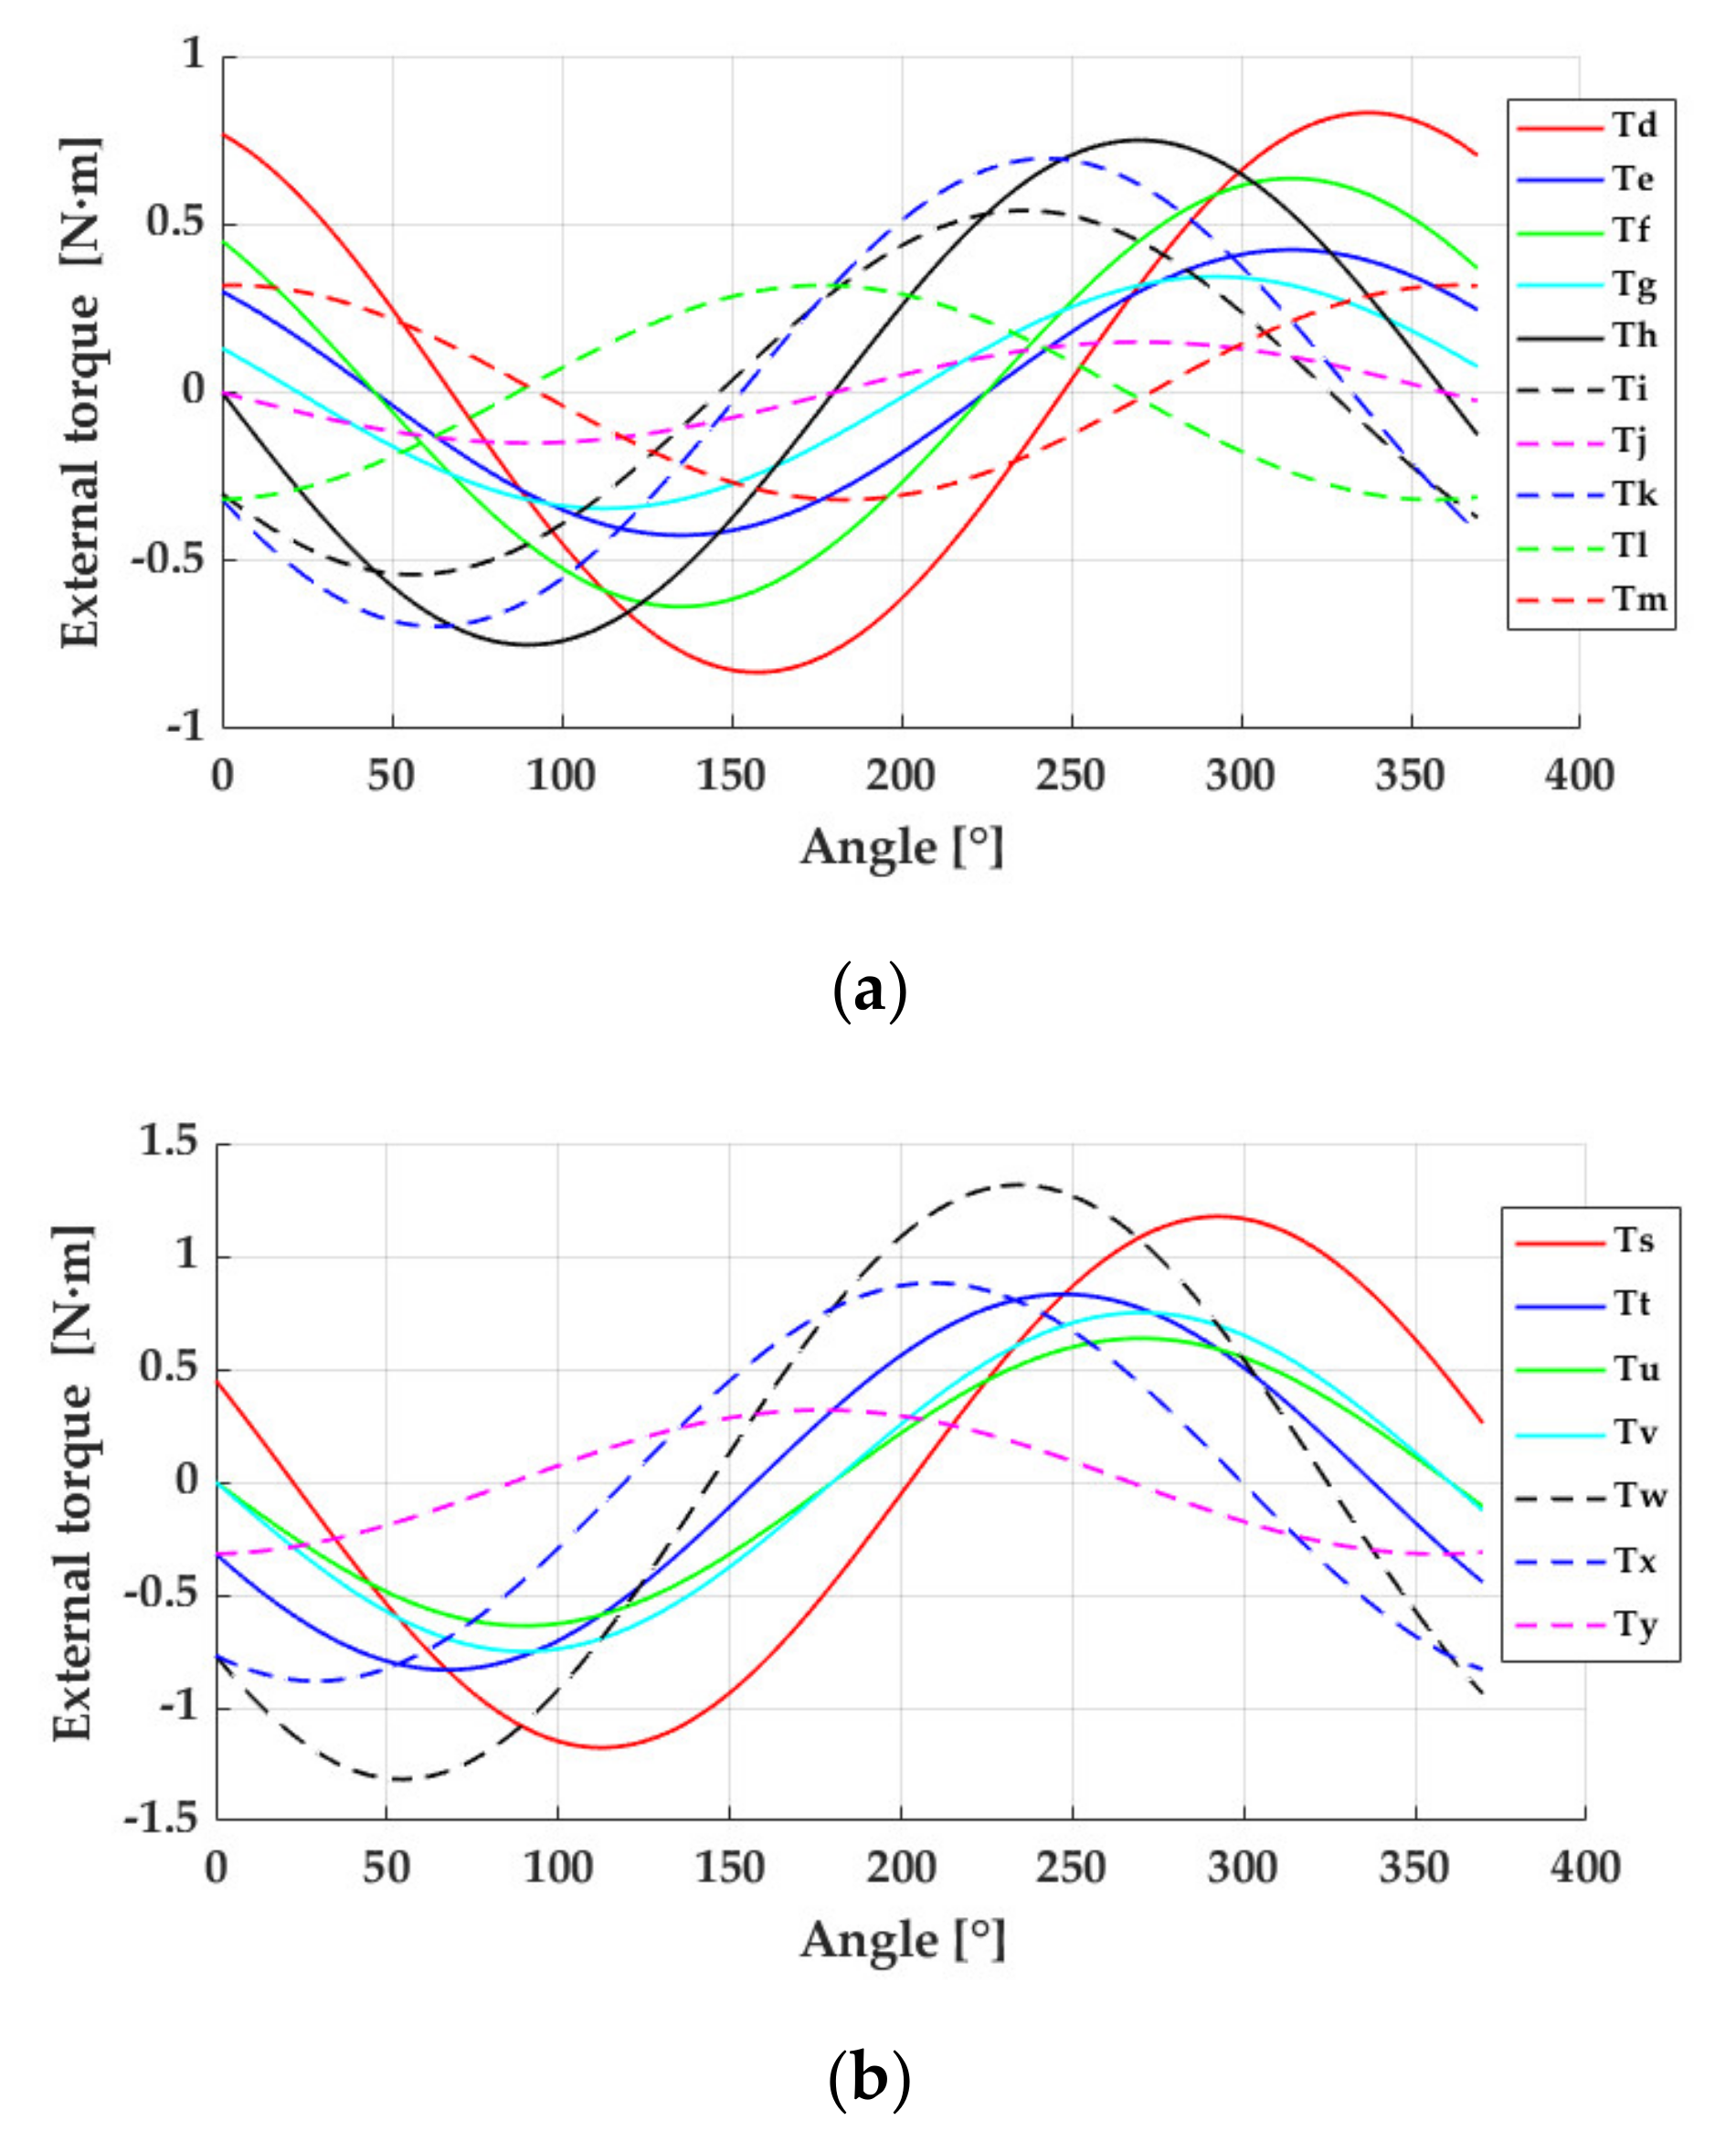
Just by using two sets of masses and positioning them at the same time, that is, two occupied holes in the disk, 12 different load schemes would be obtained. The resultant external torque by (a) two sets of masses and (b) four sets of masses, located asymmetrically in the perforated disk are reported in Figure 3. It is worth noting that masses located symmetrically do not induce external torques.
2.2. Transmission Module
The transmission module is configured by a cable or rope and two systems: (a) a pulley system, which is coupled to the link module, and (b) a motor shaft system, which is coupled with the motor or power source. The proposed transmission has some differences from those in the test benches used by Xie and Lu [16,28]. The most important differences are: (a) Our transmission is multi-turn, (b) the cable in our transmission can have multi wraps on the pulley and motor shaft and (c) in our transmission, the pulley, and the motor shaft can be easily changed.
The current design of the transmission module makes it possible to vary several physical parameters to evaluate how the transmission performance is affected by these changes. Therefore, in addition to speed and load, it is possible to change: the dimensions and the material of the motor shaft and pulley, the tension and material of the cable, and whether the guide grooves in the motor shaft and pulley are to be used or not.
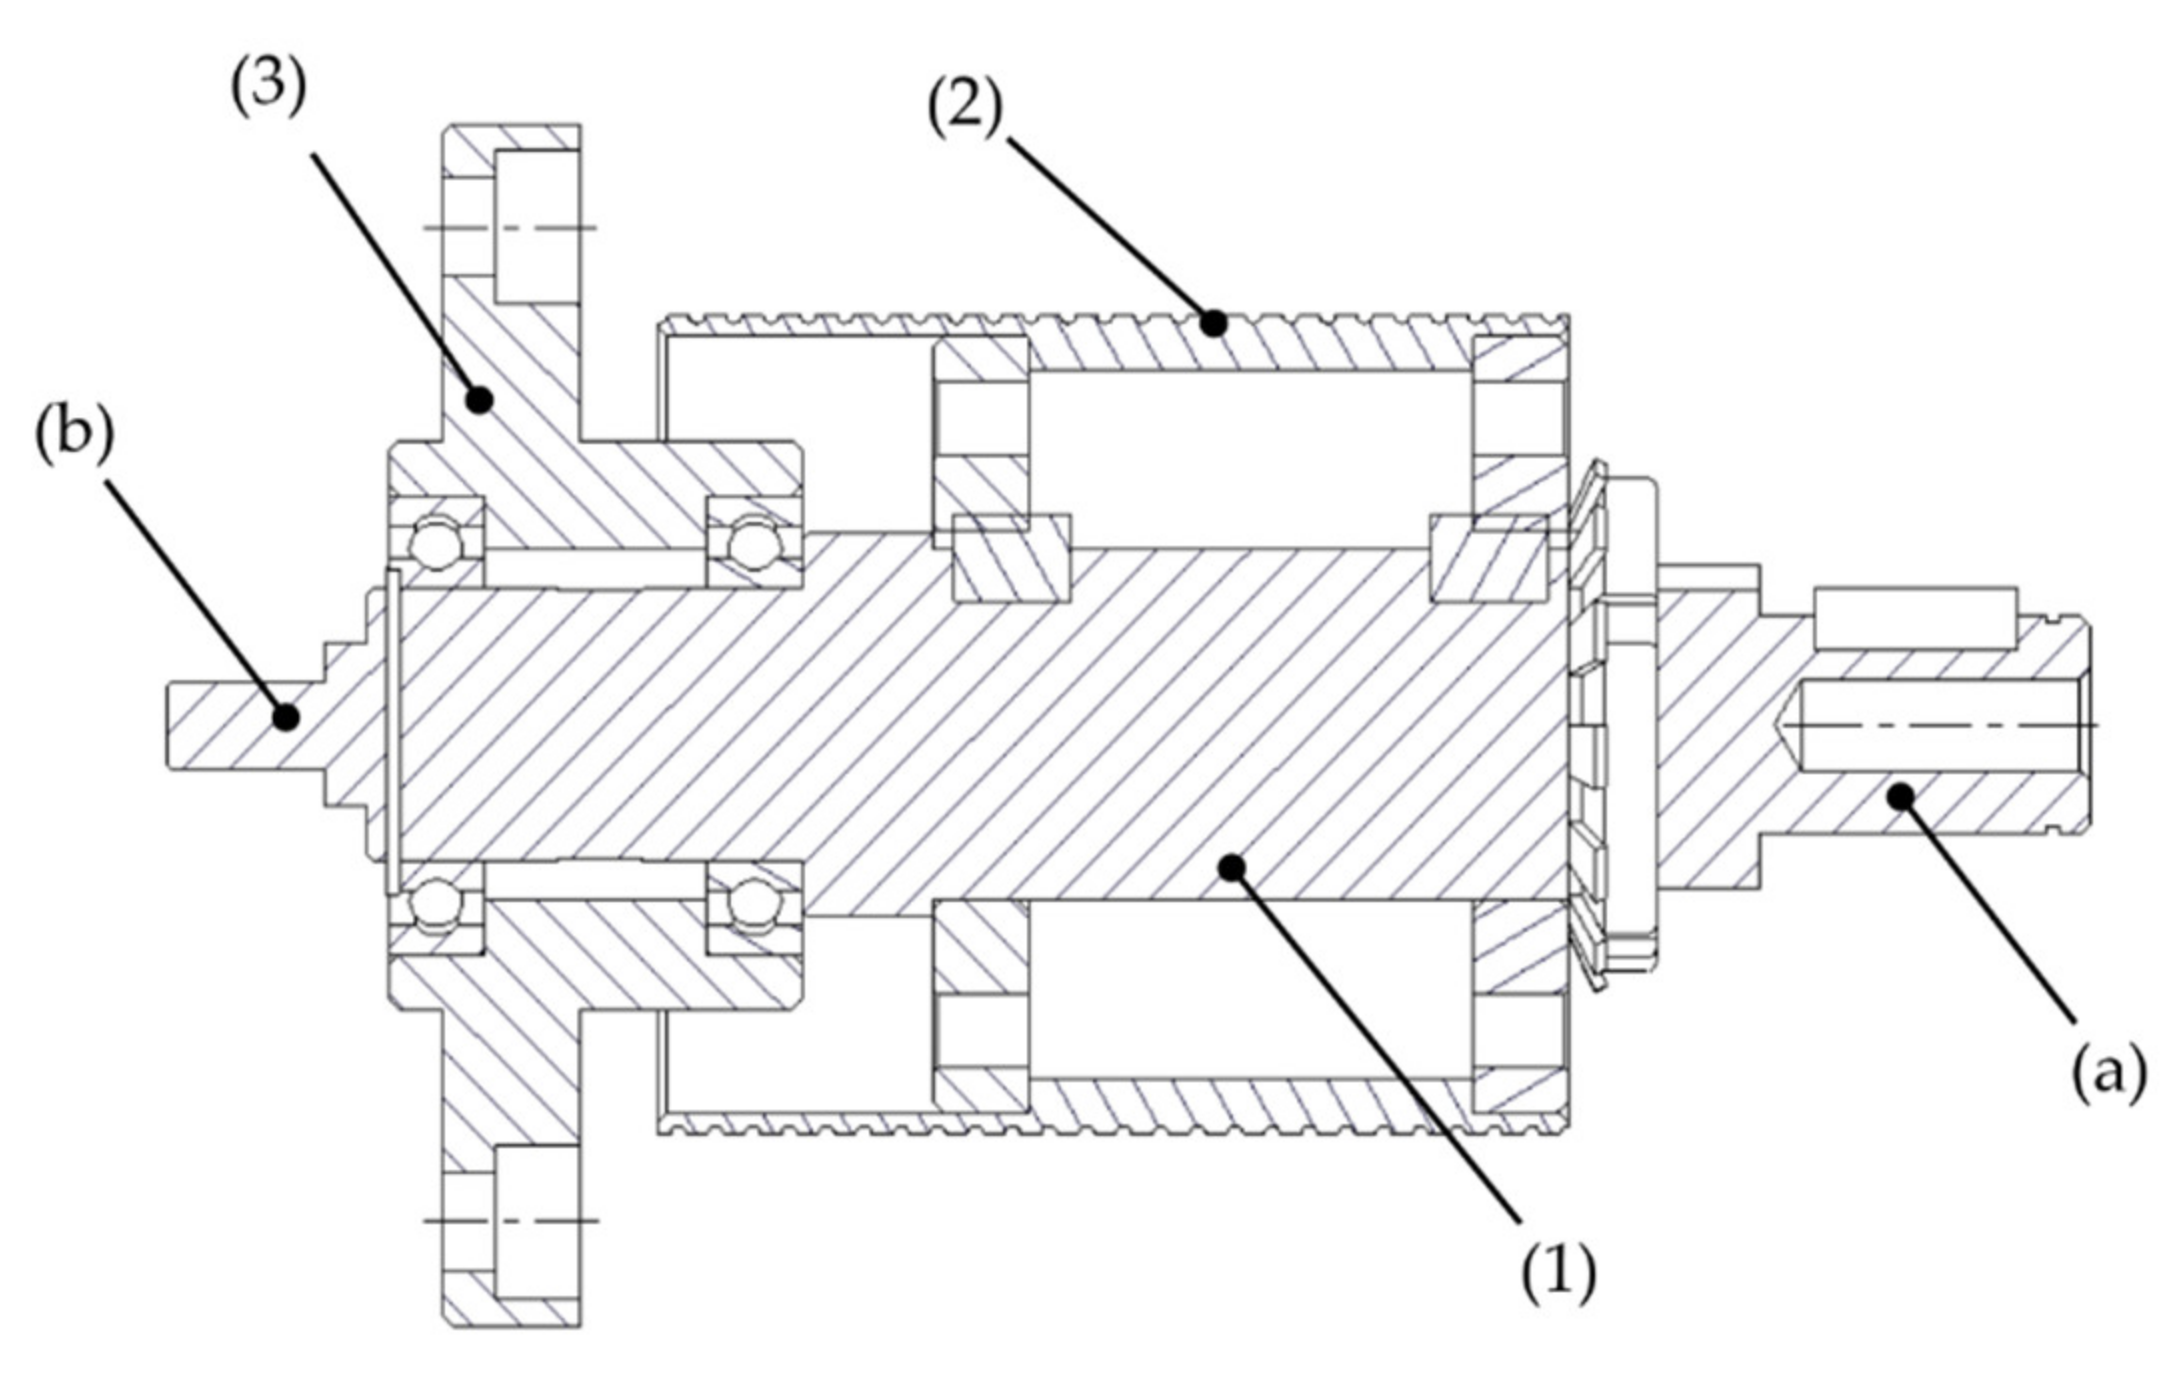
The assembly of the pulley system is shown in Figure 4. The pulley assembly is made up of three main elements: the shaft (1), the pulley body (2), and the bracket (3). The shaft, in addition to supporting the pulley body, is used to hold the link module at its end (a), and an encoder in its end (b). The pulley body (2) is the piece of the pulley that can be changed, and the bracket (3) is the piece that joins the pulley system to the main structure of the test bench. Currently, there are two different sizes for the motor shaft and two pulley bodies; the combination of these allows us to have four transmission ratios in the machine. No special tools are required for mounting the system or changing the pulley body.
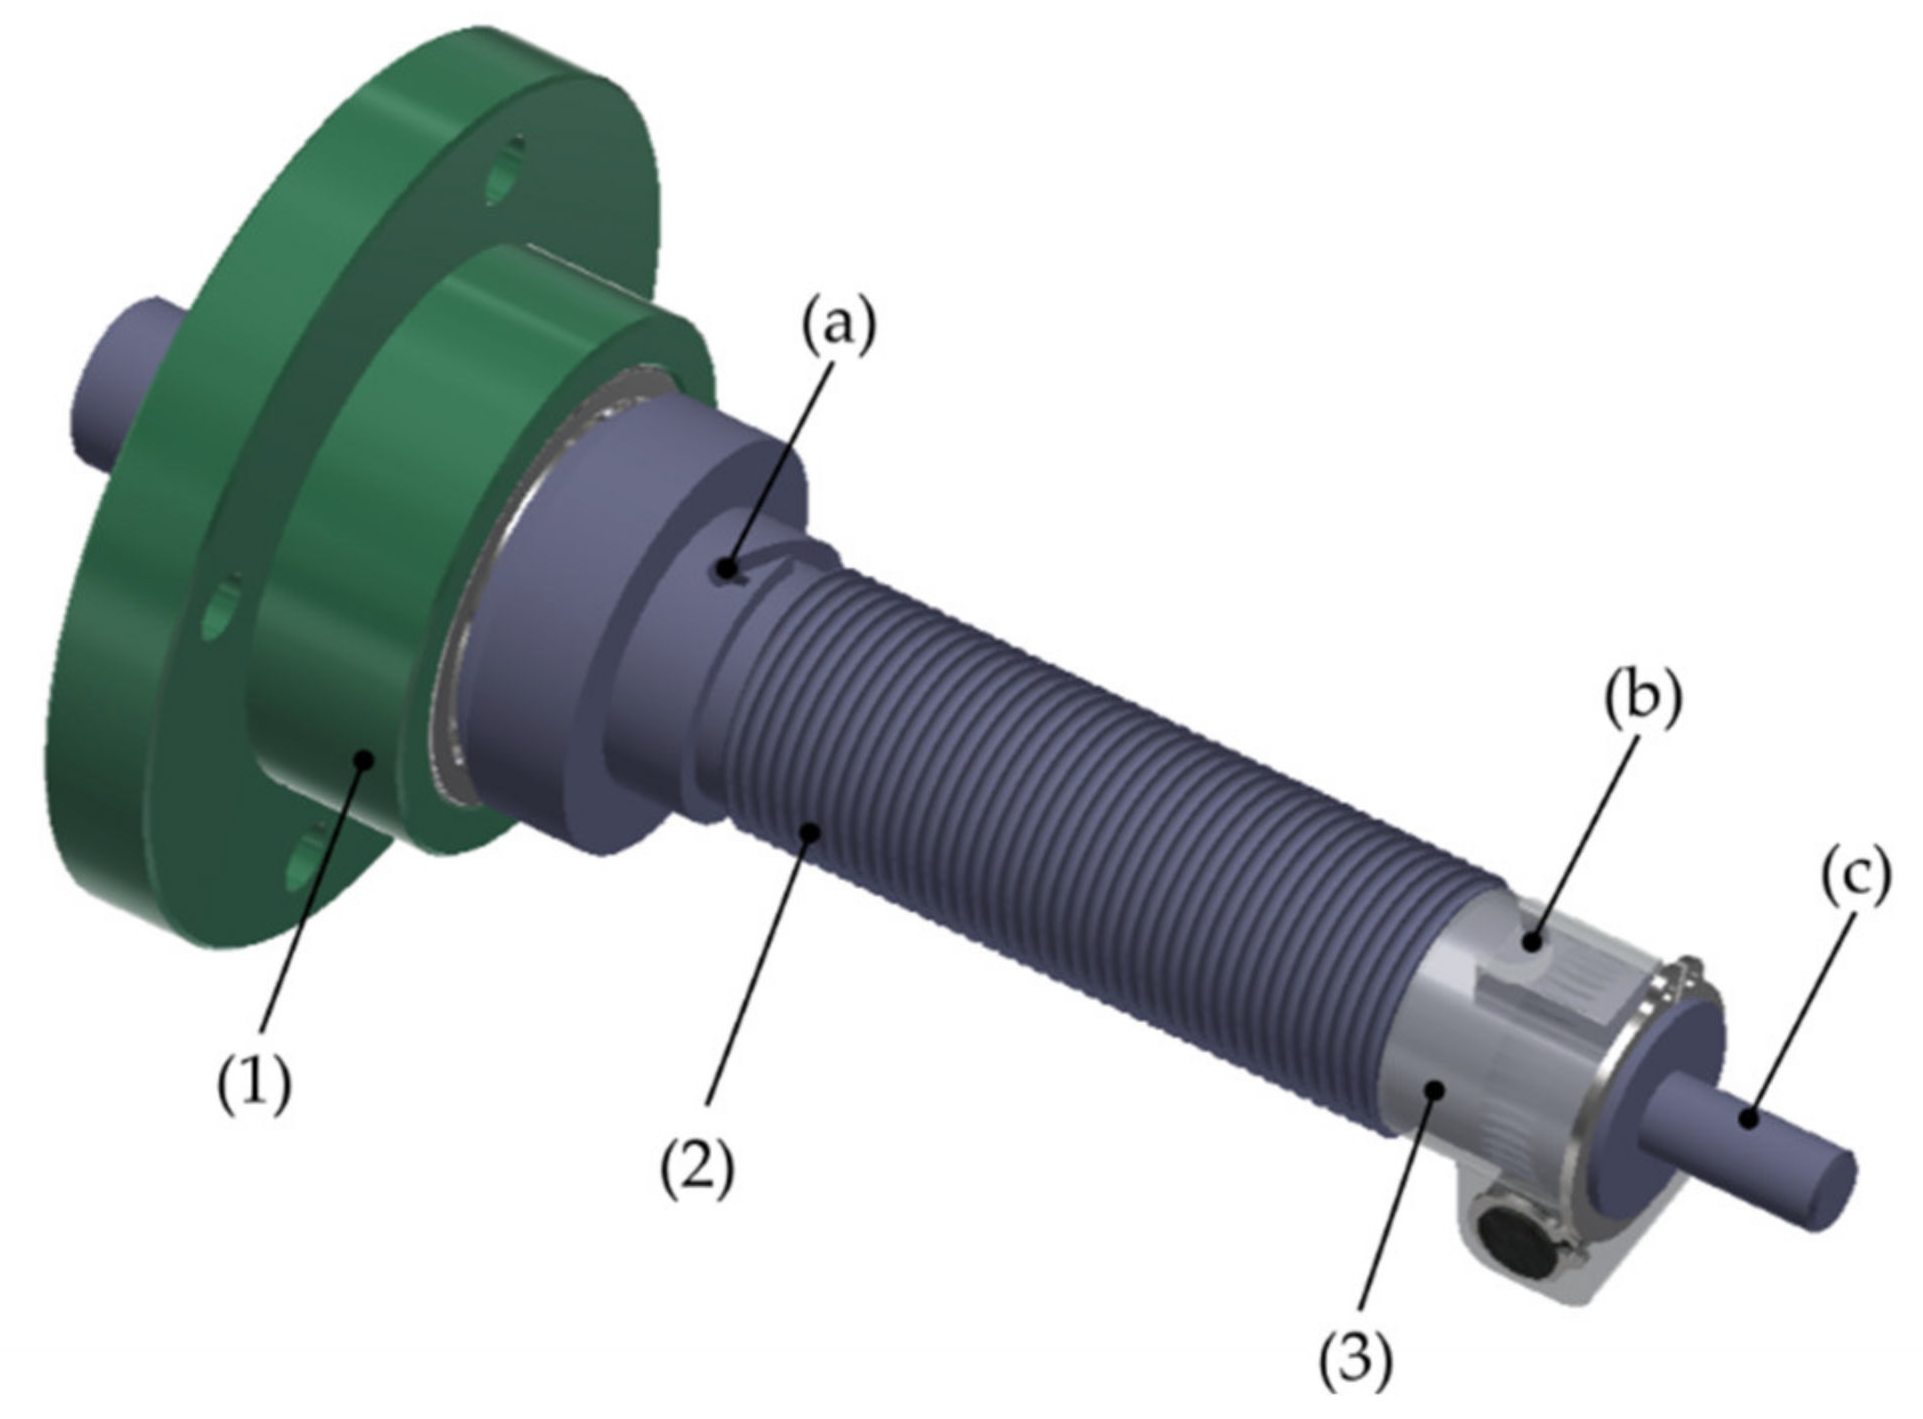
The motor shaft assembly, shown in Figure 5, consists of the bracket (1), the shaft (2), and the tensioner (3). In this case, the shaft has grooves over its surface for cable guidance. The movement from the motor shaft to the pulley is transmitted using a single cable; this cable has coupling ends that fit at points (a) and (b) in the shaft. The input encoder is coupled at point (c) of the shaft.
The grooves and the shaft length allow multiple winding turns of the cable; both, in the motor shaft, and in the pulley, and enable the transmission to be multi-turn, unlike the aforementioned test benches in which the rotation range of the transmission is limited to a portion of a turn.
2.3. Power Source Module
The power source module of the test bench is configured by an electric motor and its controller. The selection of the electric motor was focused on its ability to supply constant torque over a wide speed range, starting at very low speeds, without using speed reducers between the motor and the transmission module.
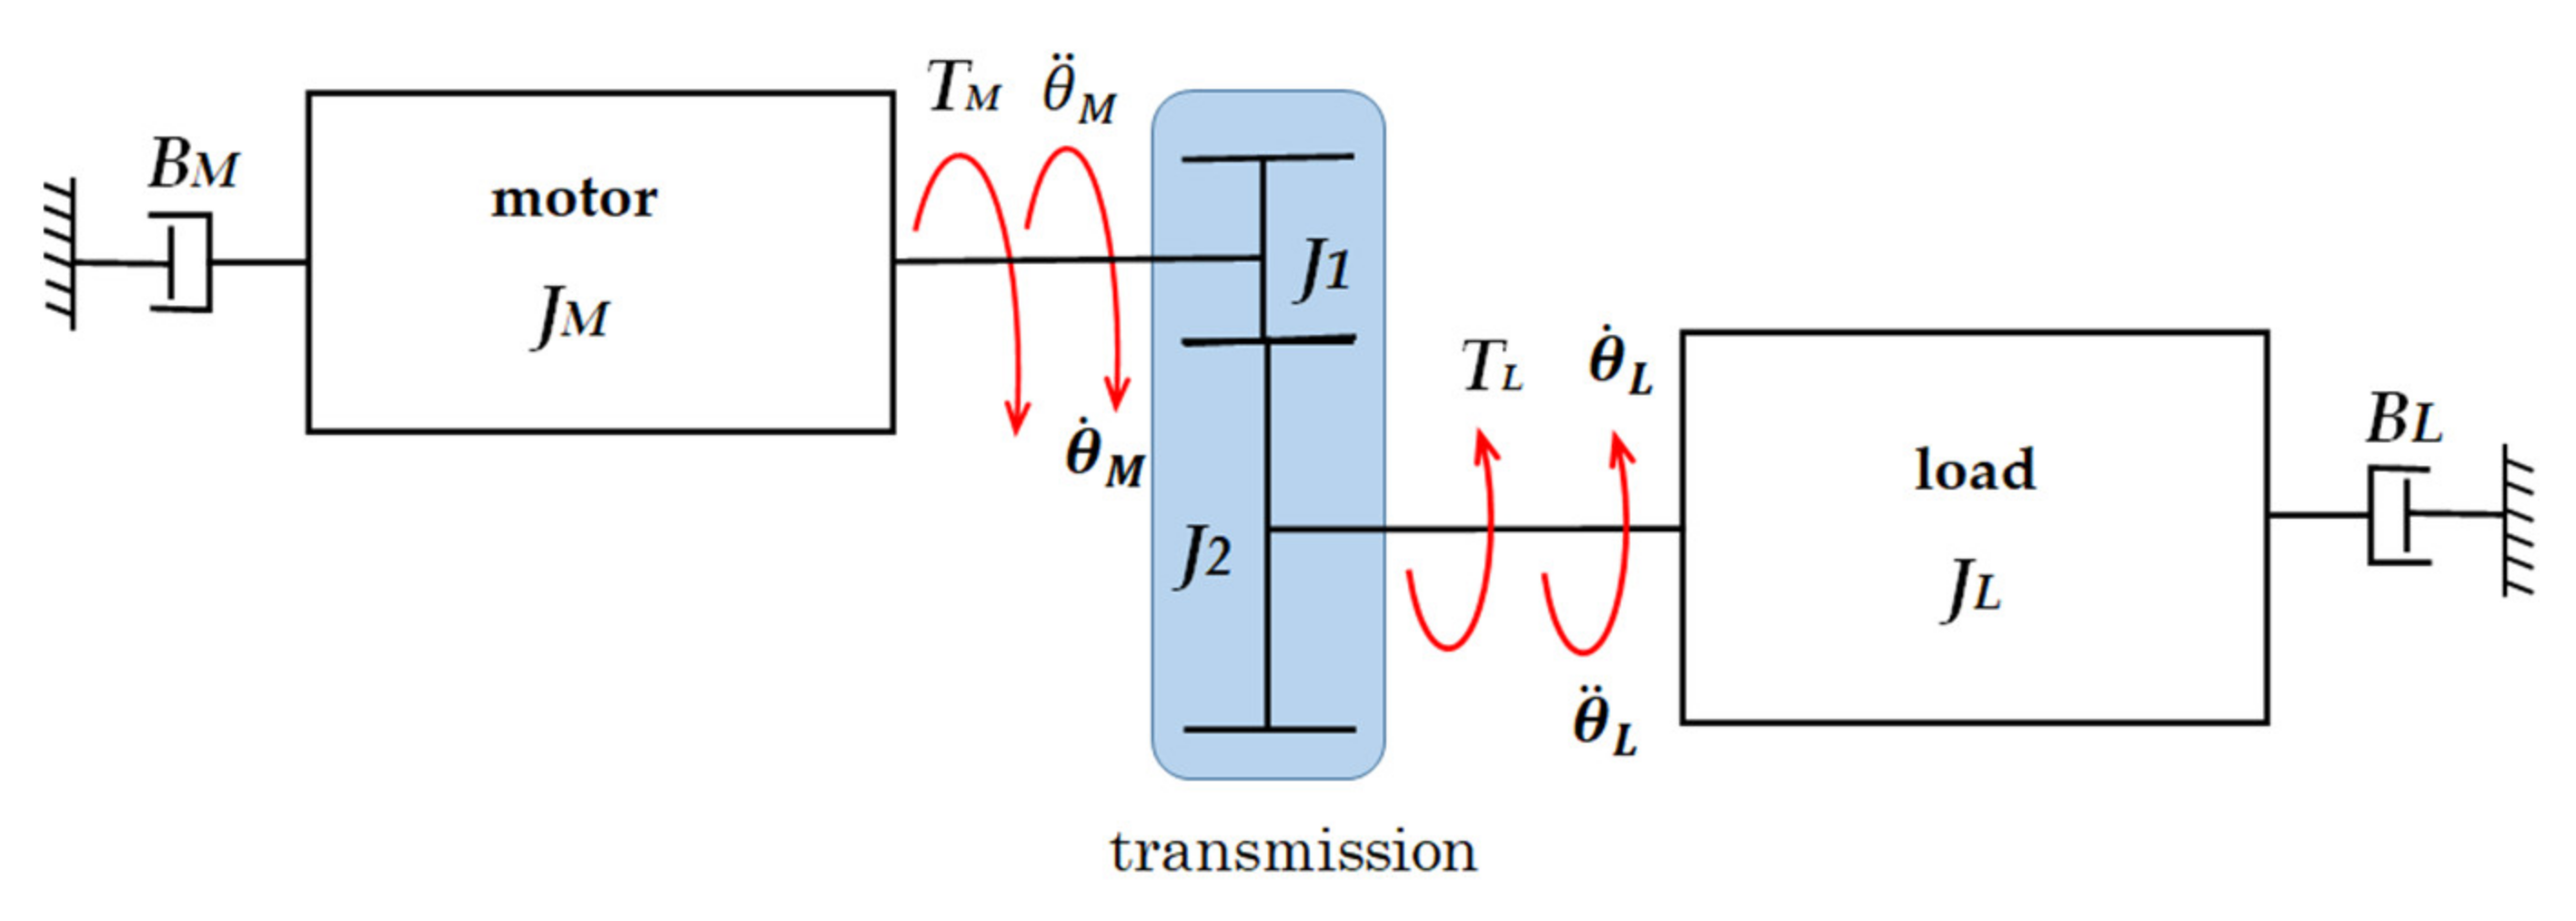
The approximated motor torque required was taken from the simplified model of a mechanical transmission (Figure 6). In this model, the elasticity and the viscous component of the transmission have not been included.
Equation (1) represents the torque balance for the system shown in Figure 6. In this equation, friction, backlash, and elasticity have not been considered.
where TM is the motor torque, TL is the load torque, JM the motor inertia, JL the load inertia, R is the transmission ratio, BM is the viscous damping coefficient of the motor, BL is the viscous damping coefficient of the load, is the load speed, and is the acceleration of the load.
The last term of the Equation (1) quantifies the motor and load viscous friction. Not knowing the viscous damping coefficients in advance forces us to assume this as a percentage of the motor torque for preliminary calculation purposes. The mass and moment of inertia of the perforated disc with its coupling plate were obtained from its CAD model. The moment of inertia for the load was calculated for four pairs of masses located in the outermost holes of the disk, this is the maximum external load condition on the test bench. The inertia of the motor is generally very low compared to the inertia of the load and the transmission. After a value was chosen, and the motor was selected, the motor torque calculation was updated.
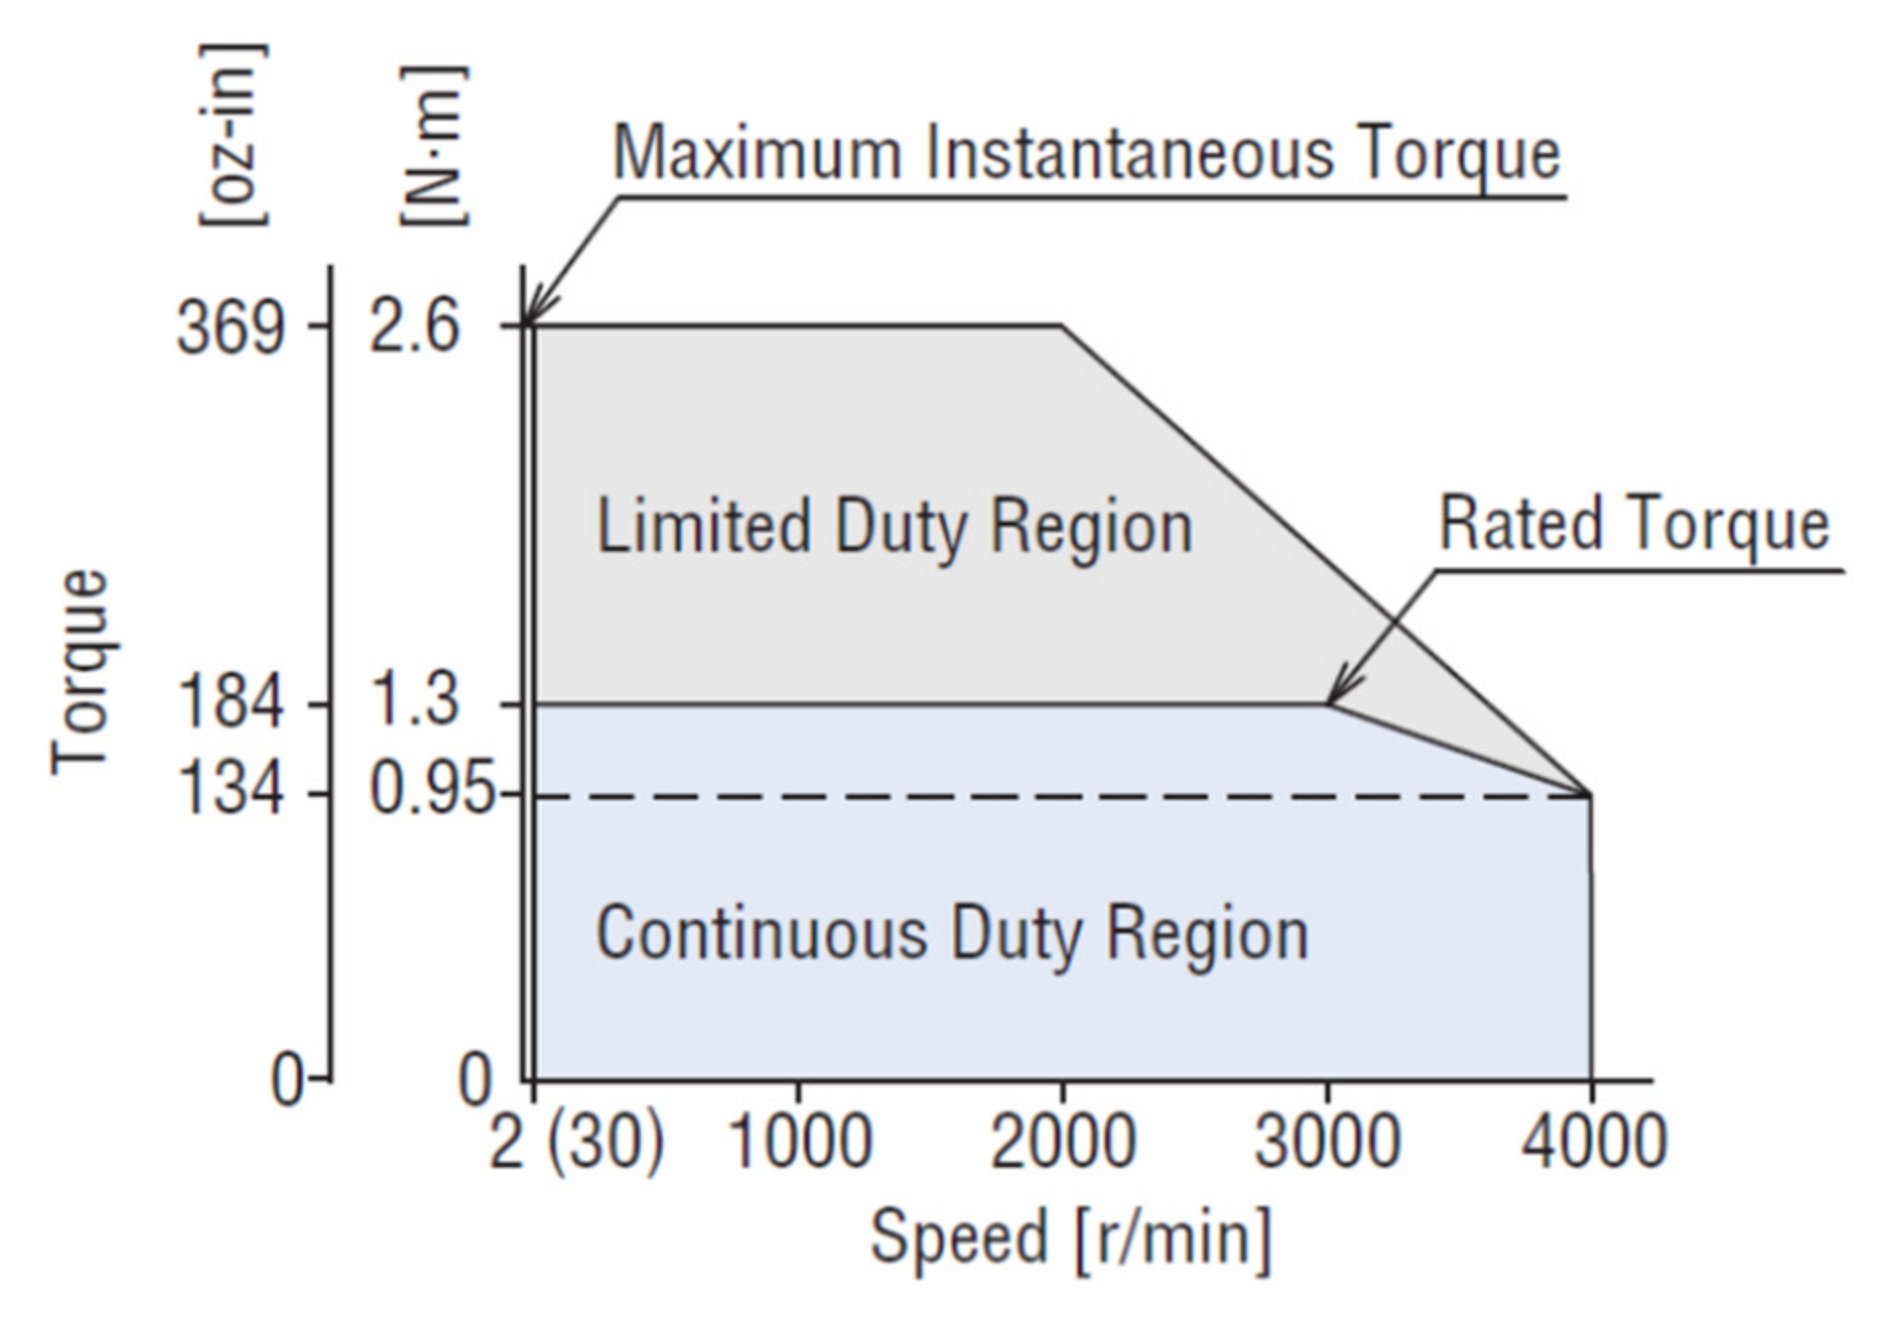
Once the motor torque was calculated, and the transmission requirements were established, a BLDC (brushless DC motor) was selected. This BLDC motor is powered by 200–240 single-phase or three-phase VAC, it has a power of 400 W (1/2 hp) and can vary its speed between 2 and 4000 rpm. The maximum permissible instantaneous torque is 2.6 N·m and the maximum torque for continuous operation up to a speed of 3000 rpm is 1.3 N·m·(Figure 7).
3. Measurement Module
3.1. Torque Measurement
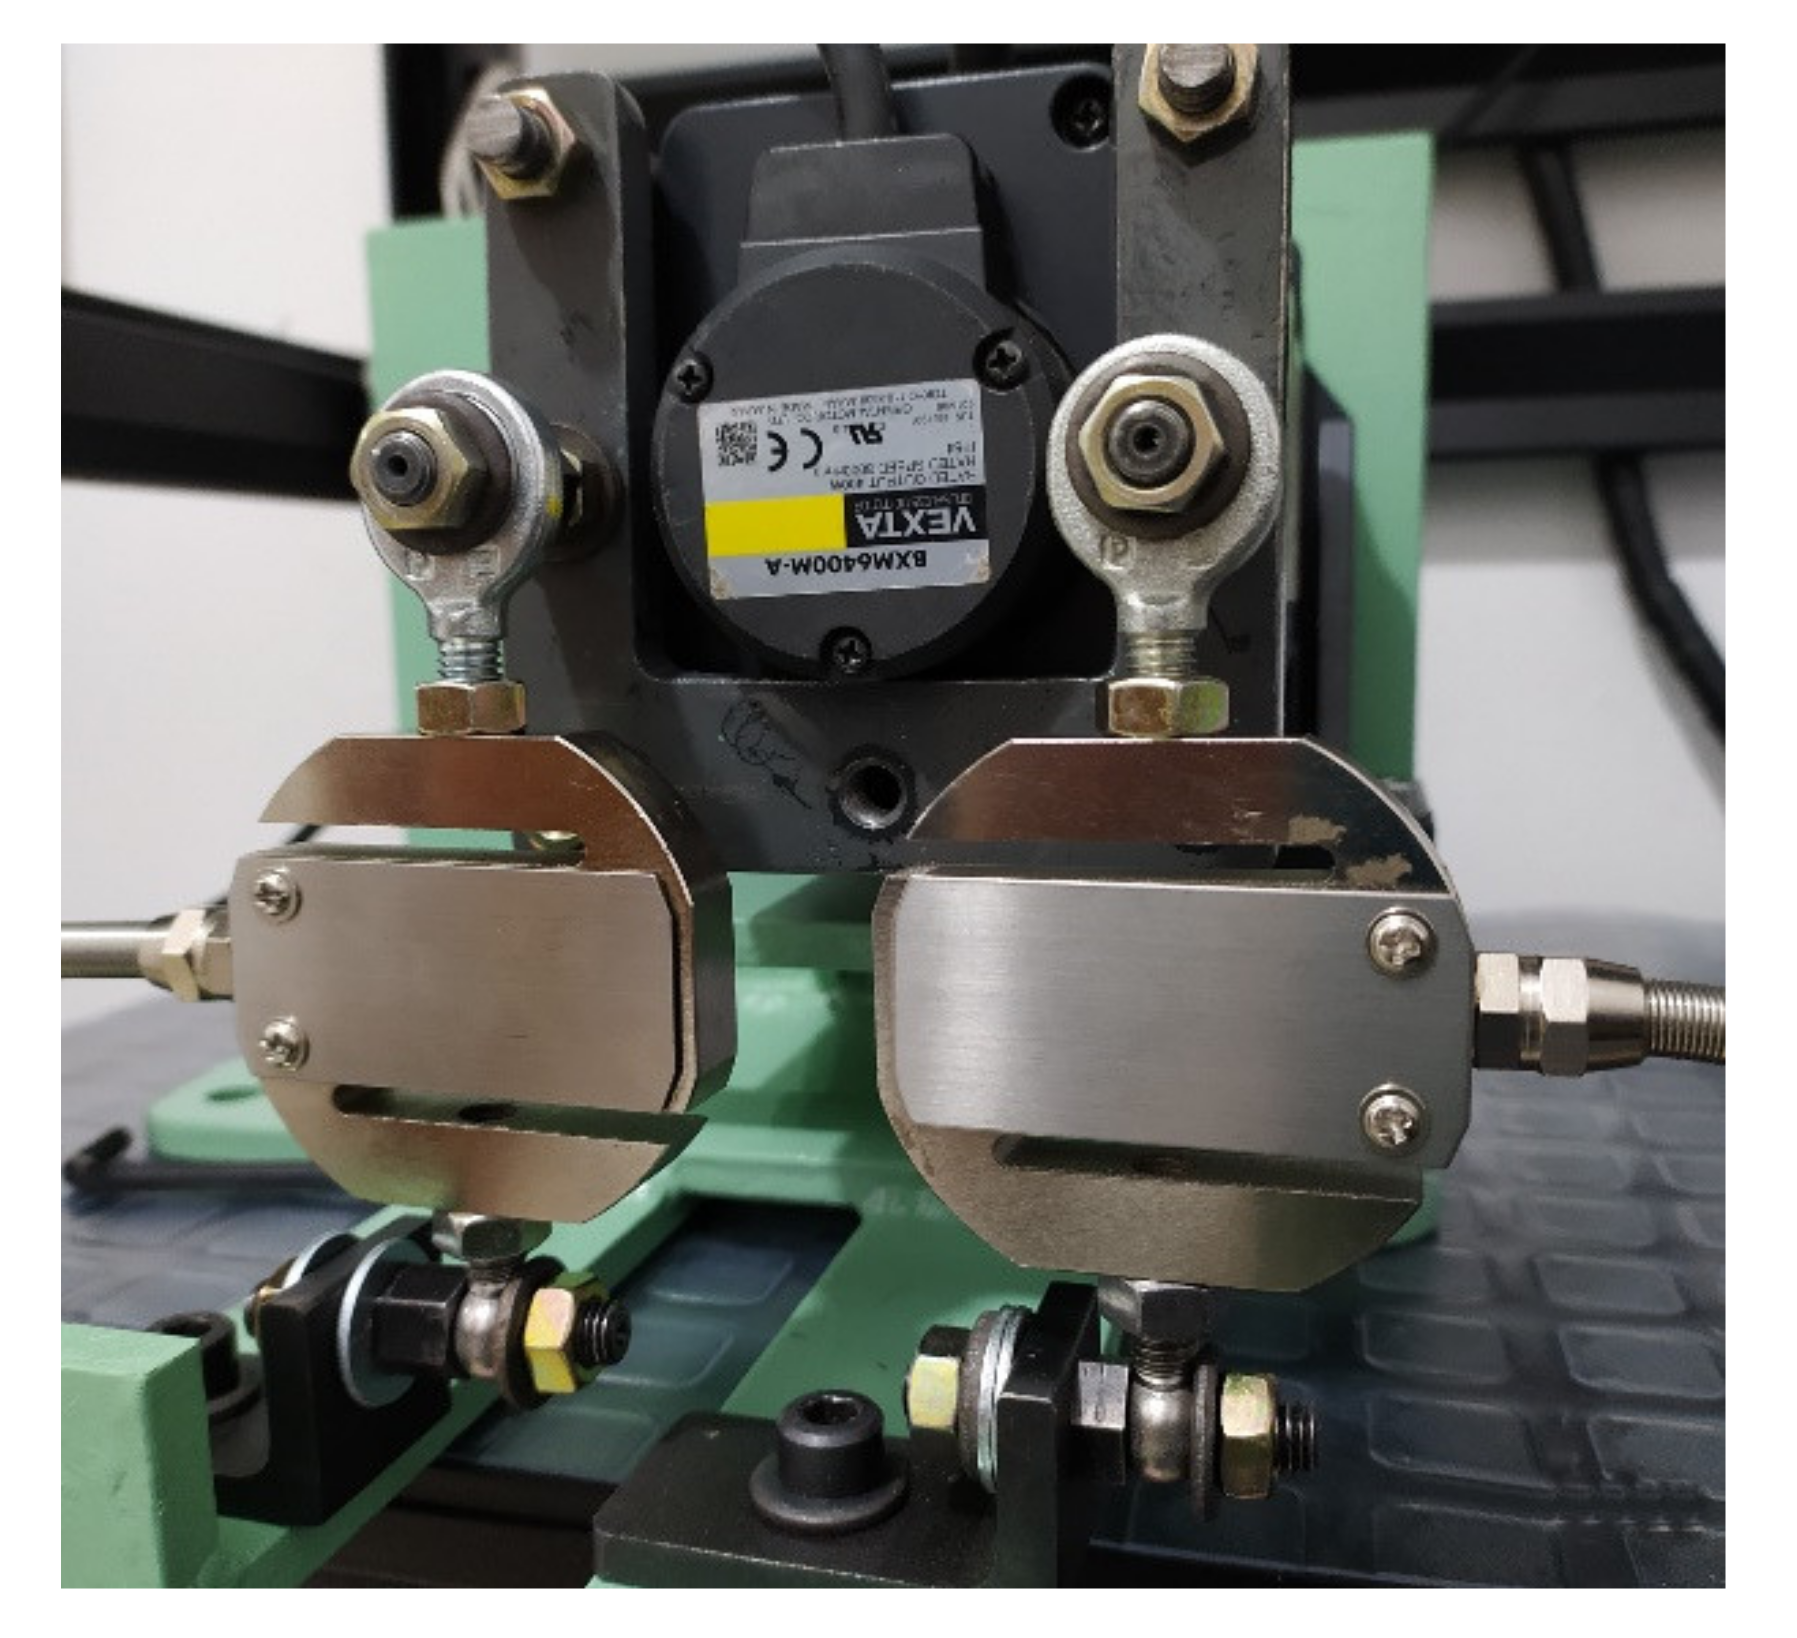
It was decided to use the motor support forces to estimate the reactive torque. To measure the reactive torque, it was necessary to redesign the way the motor is fixed to the structure of the machine; normally, the motors are screwed to their base. The screws between the motor base and the machine were eliminated; instead, a system was designed in which the motor body is connected by an extension to two ball bearings. This system allows the motor to swing around an imaginary axis passing through the motor shaft. As shown in Figure 8, the motor body (1) is screwed to the internal coupling (2), which is assembled to the internal part of the bearings (3). The bearings are assembled to the external coupling (4) which is fixed with screws to the support (6). The support is screwed to the machine frame; thereby, the motor can rotate freely about the axis (5). Load cells type S are used to restrict the free rotation of the motor body around the axis (5); they are mounted at equal distances from the motor shaft on the rear of the motor. With this configuration, one of the cells is subjected to a compression force, while the other is subjected to a tension force, as seen in Figure 9.
When a load cell is affected by a force, a voltage that is proportional to the force is produced at its output; this voltage in the order of millivolts is usually amplified to bring it up to the volt scale. In the test bench, the output value of the amplifiers was used to estimate the force applied to each load cell; that is, the reactive forces on the motor body.
When using load cells, it is advisable to consider creep. In a load cell, creep is defined as the change in the output value of the load cell measured in time, keeping the constant load and all environmental conditions and other variables. Therefore, to obtain the correct value, it is necessary to establish a form of correction for the value read as a function of time. The characterization of the load cell was carried out in three stages: instant calibration of the load cell, characterization of the load cell creep, and establishing the creep compensation.
3.1.1. Instant Cell Calibration
Instant calibration is undertaken using calibrated weights. First, the zero value is adjusted, then the maximum value of the cell is adjusted; this process is repeated until the smallest possible deviation is obtained between the voltage value at the output of the amplifier and the theoretical value for the load cell.
3.1.2. Load Cell Creep Measurement
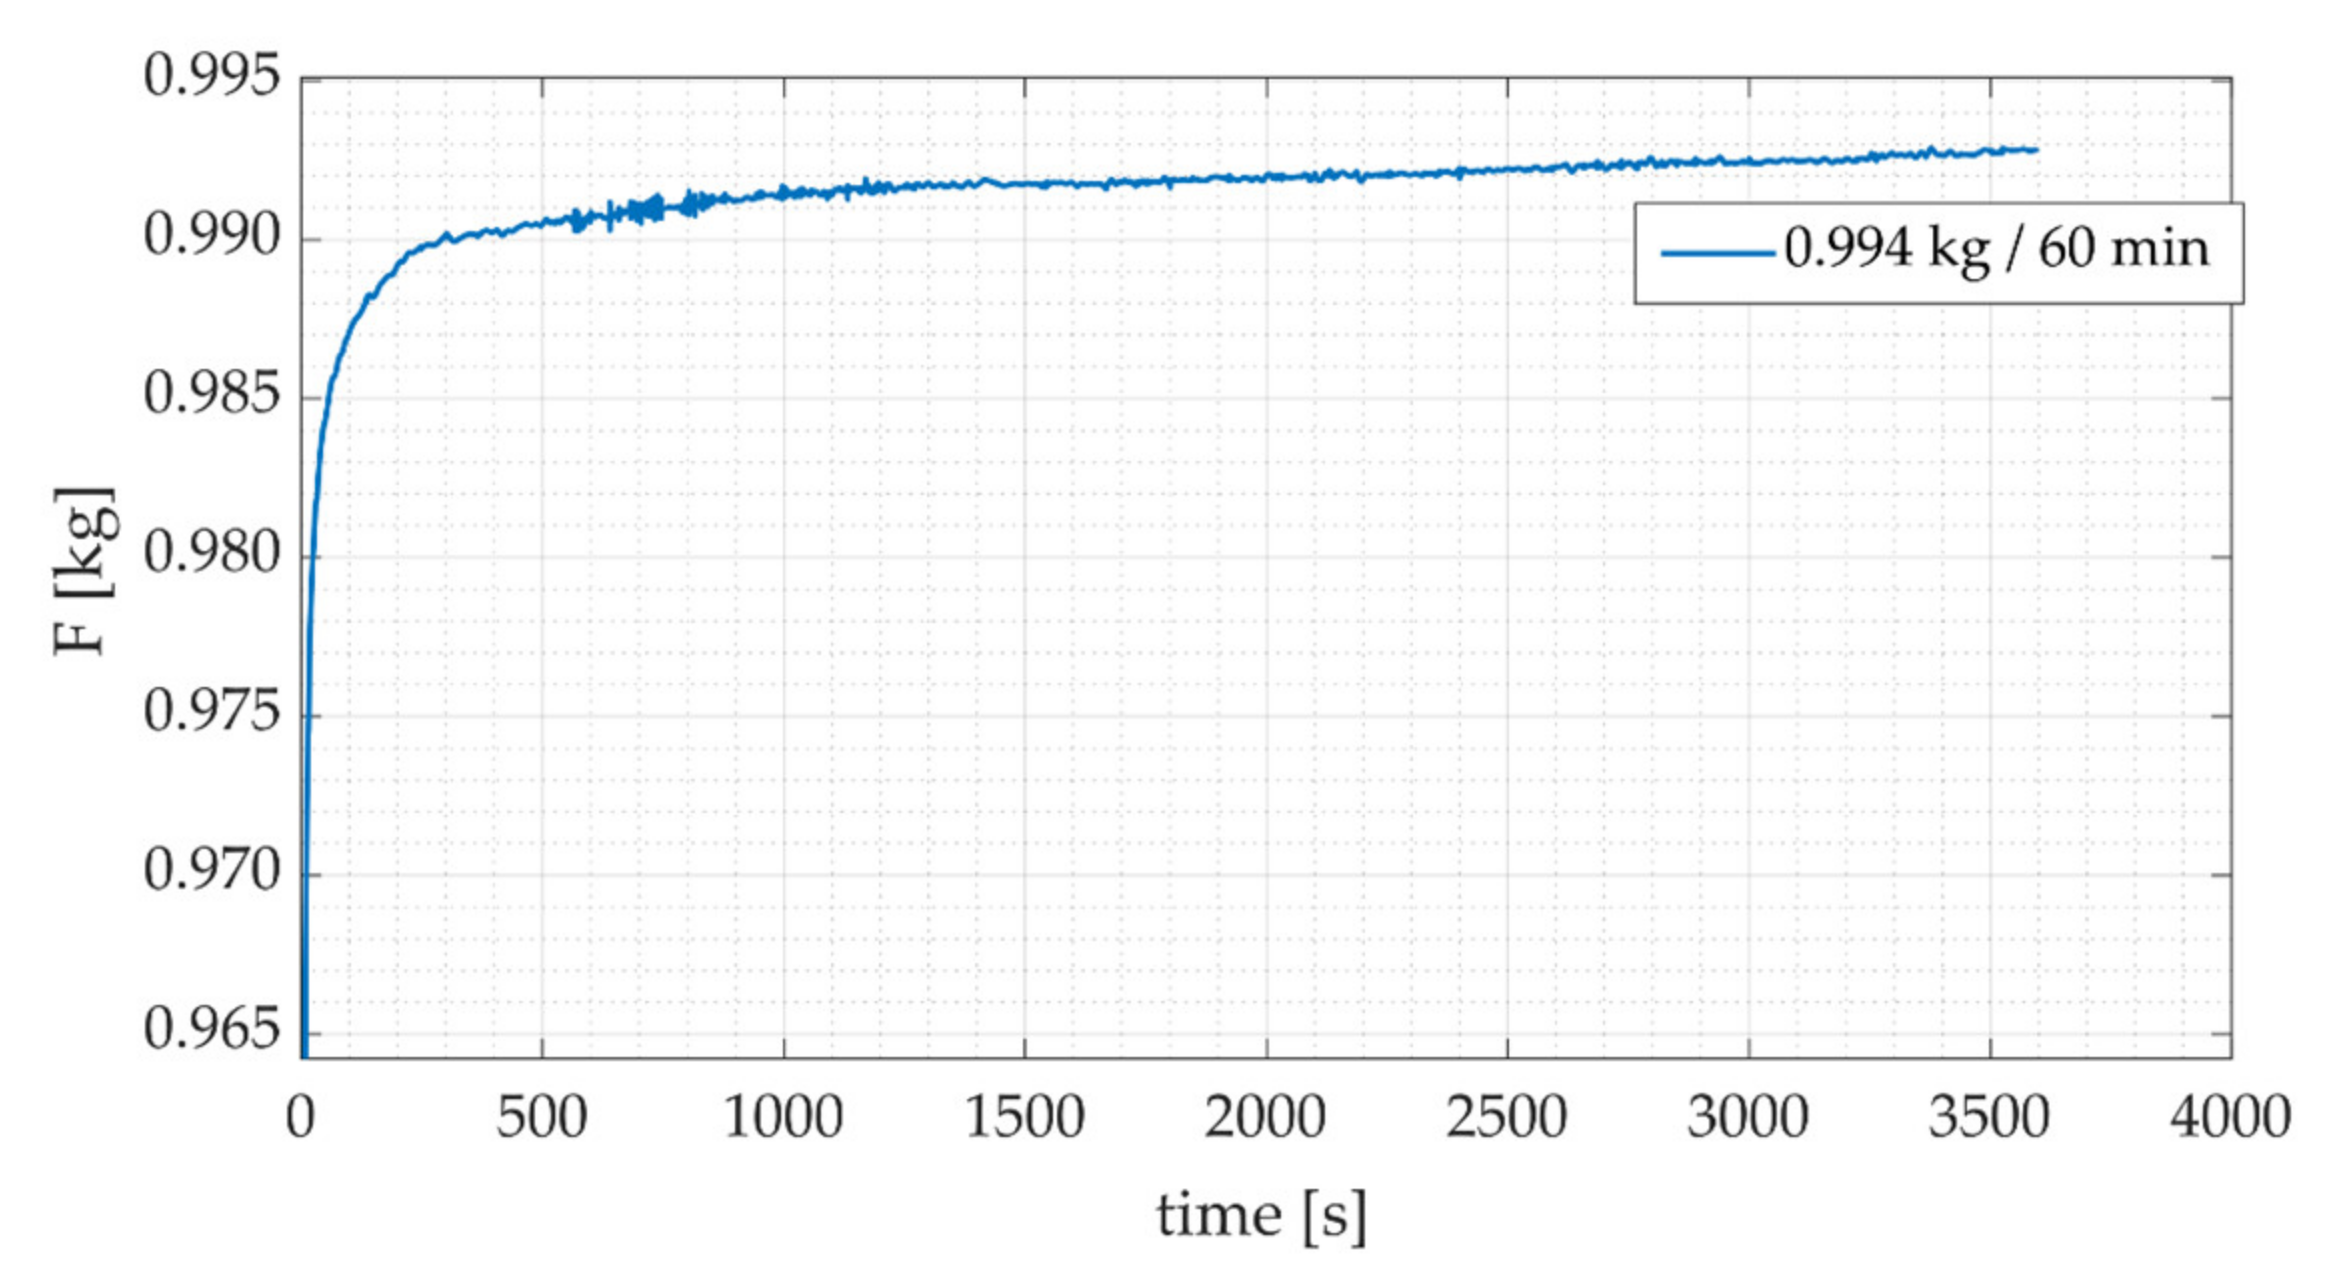
To determine the creep, various tests were performed using different calibrated weights and different measurement times. The overall results obtained match those observed in early studies [33,34,35,36]: (a) the creep value depends on the applied load, so the higher the load, the greater the creep, (b) the creep stabilizes after 30 min. In addition, from the data graphs it was observed that the initial behavior of the reading is not linear and that it is not possible, by simple inspection, to identify the exact point where the creep begins (Figure 10). However, despite not being able to identify the beginning of the creep, it is possible to establish that 95% of the load is reached about one second after the load has been applied.
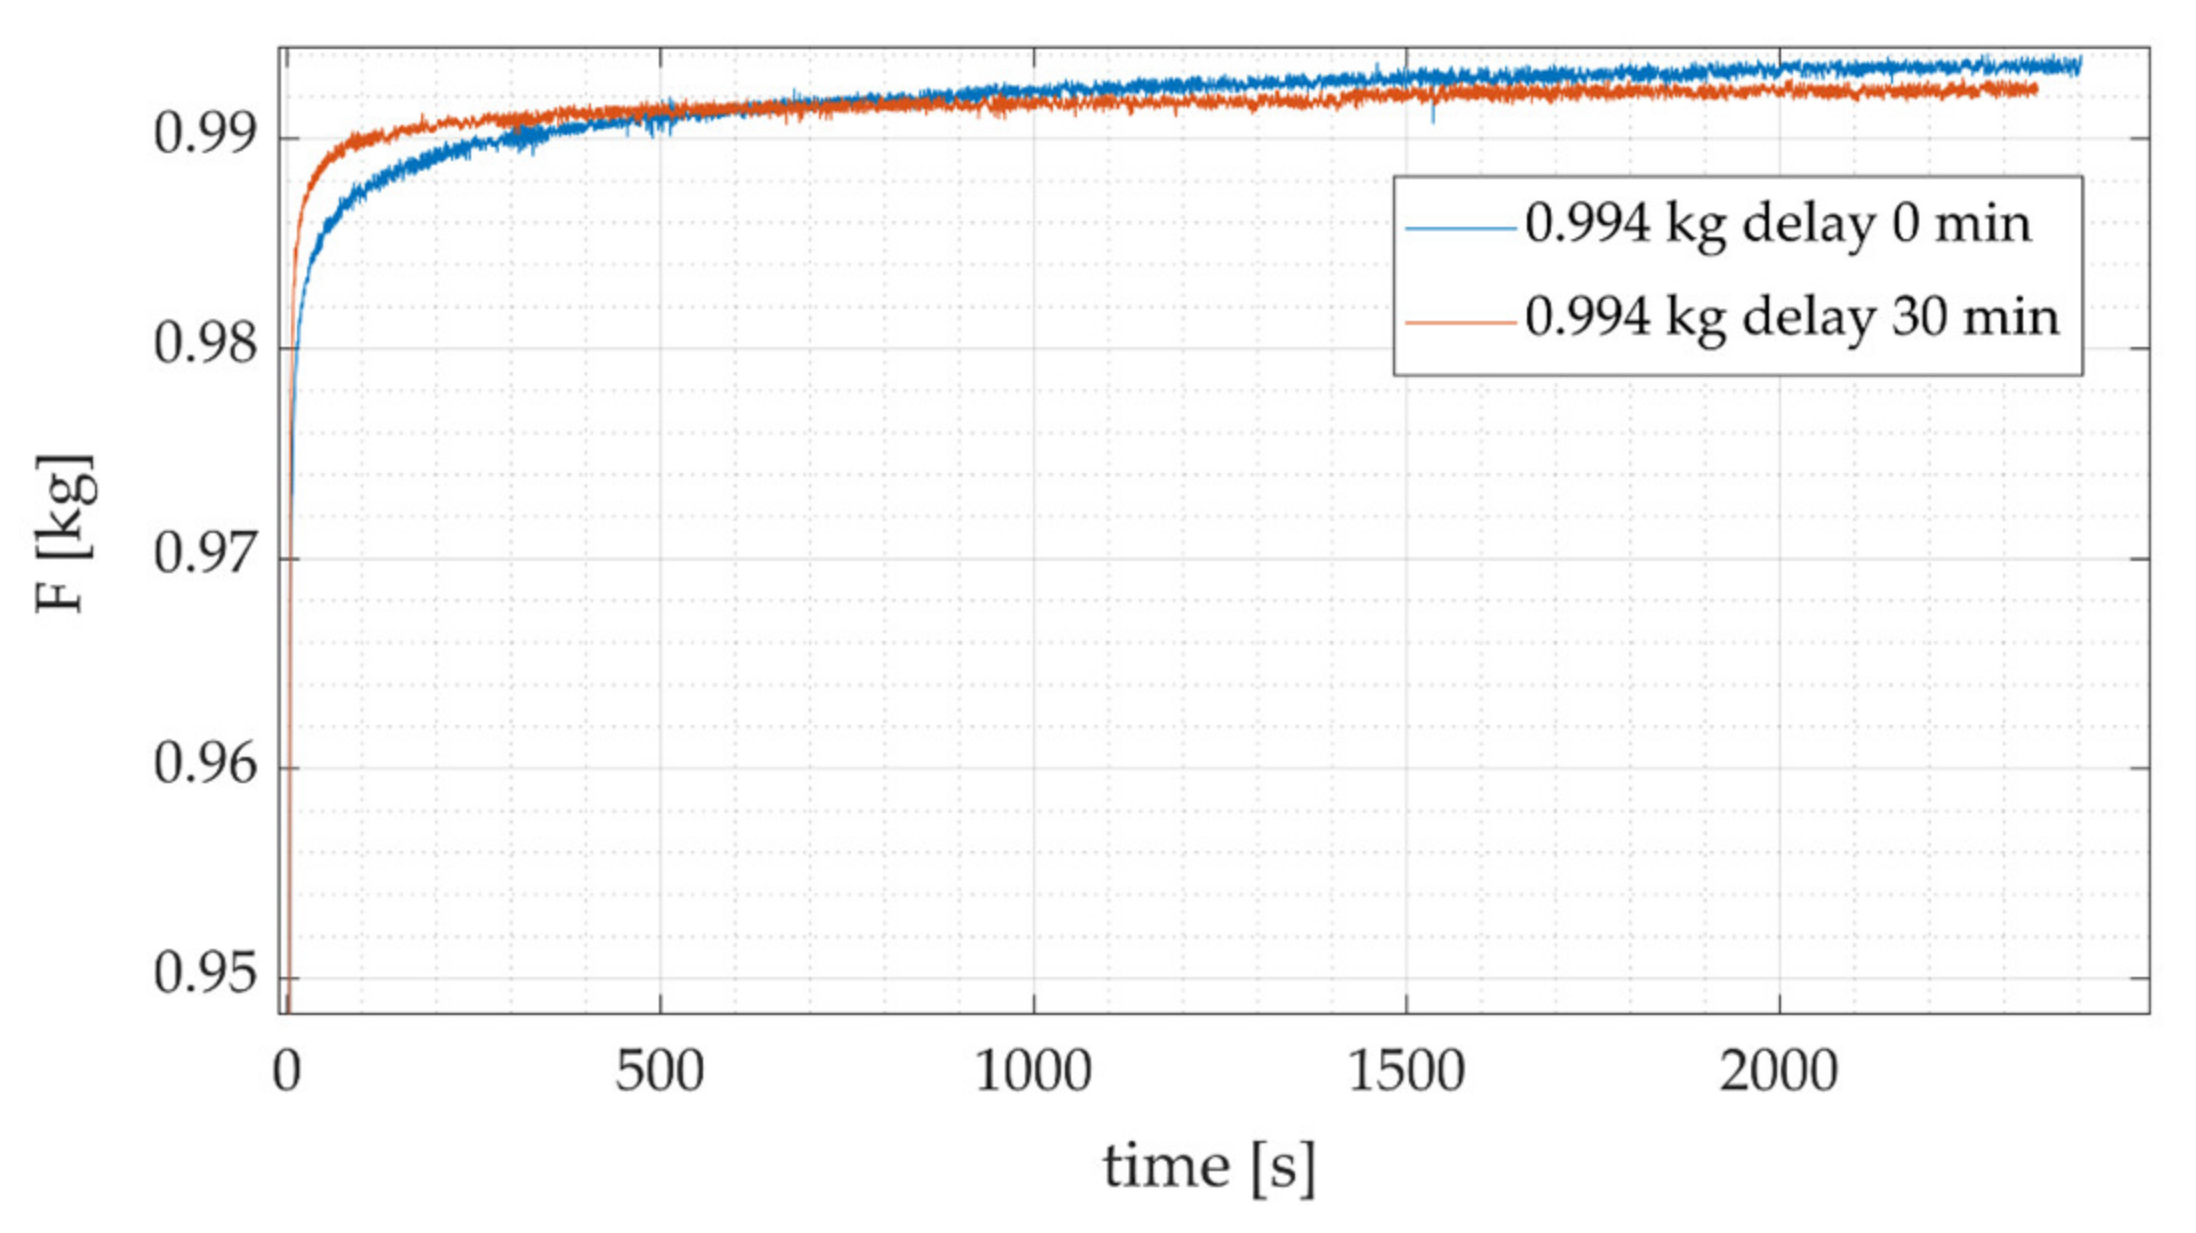
An important finding is that creep behavior varies as a function of the time elapsed between the instant the load cell is energized and the instant the measurement is performed. The creep behavior for the same load, measured just after the load cell has been energized, and measured with a time interval of 30 min after it is energized, is shown in Figure 11. The two measurements show the typical creep behavior, however:
- Although creep seems to start at the same time in both cases, the measured value starts at a higher value for the delayed measurement than the one made just after the load cell is energized.
- For the measurement with a 30-min delay, the creep variation stabilizes quickly, which does not happen when the measurement is performed just after the load cell is energized.
3.1.3. Creep Compensation for Motor Torque Measurements
The adjustment equation developed only includes external load and time. Because of the way creep varies as a function of time, two intervals were established to determine the adjustment equations: (a) time between 1 and 10 s, (b) time greater than 10 s. Moreover, because creep is proportional to the applied load, the adjustment equation was established in relation to a load of 2 kg, the maximum payload of the load cell used.
Creep is the difference between the measured value and the real value of the applied load, Equation (2).
where Fa is the applied load, and Fm is the value measured from the load cell, and t is the time measured after load application.
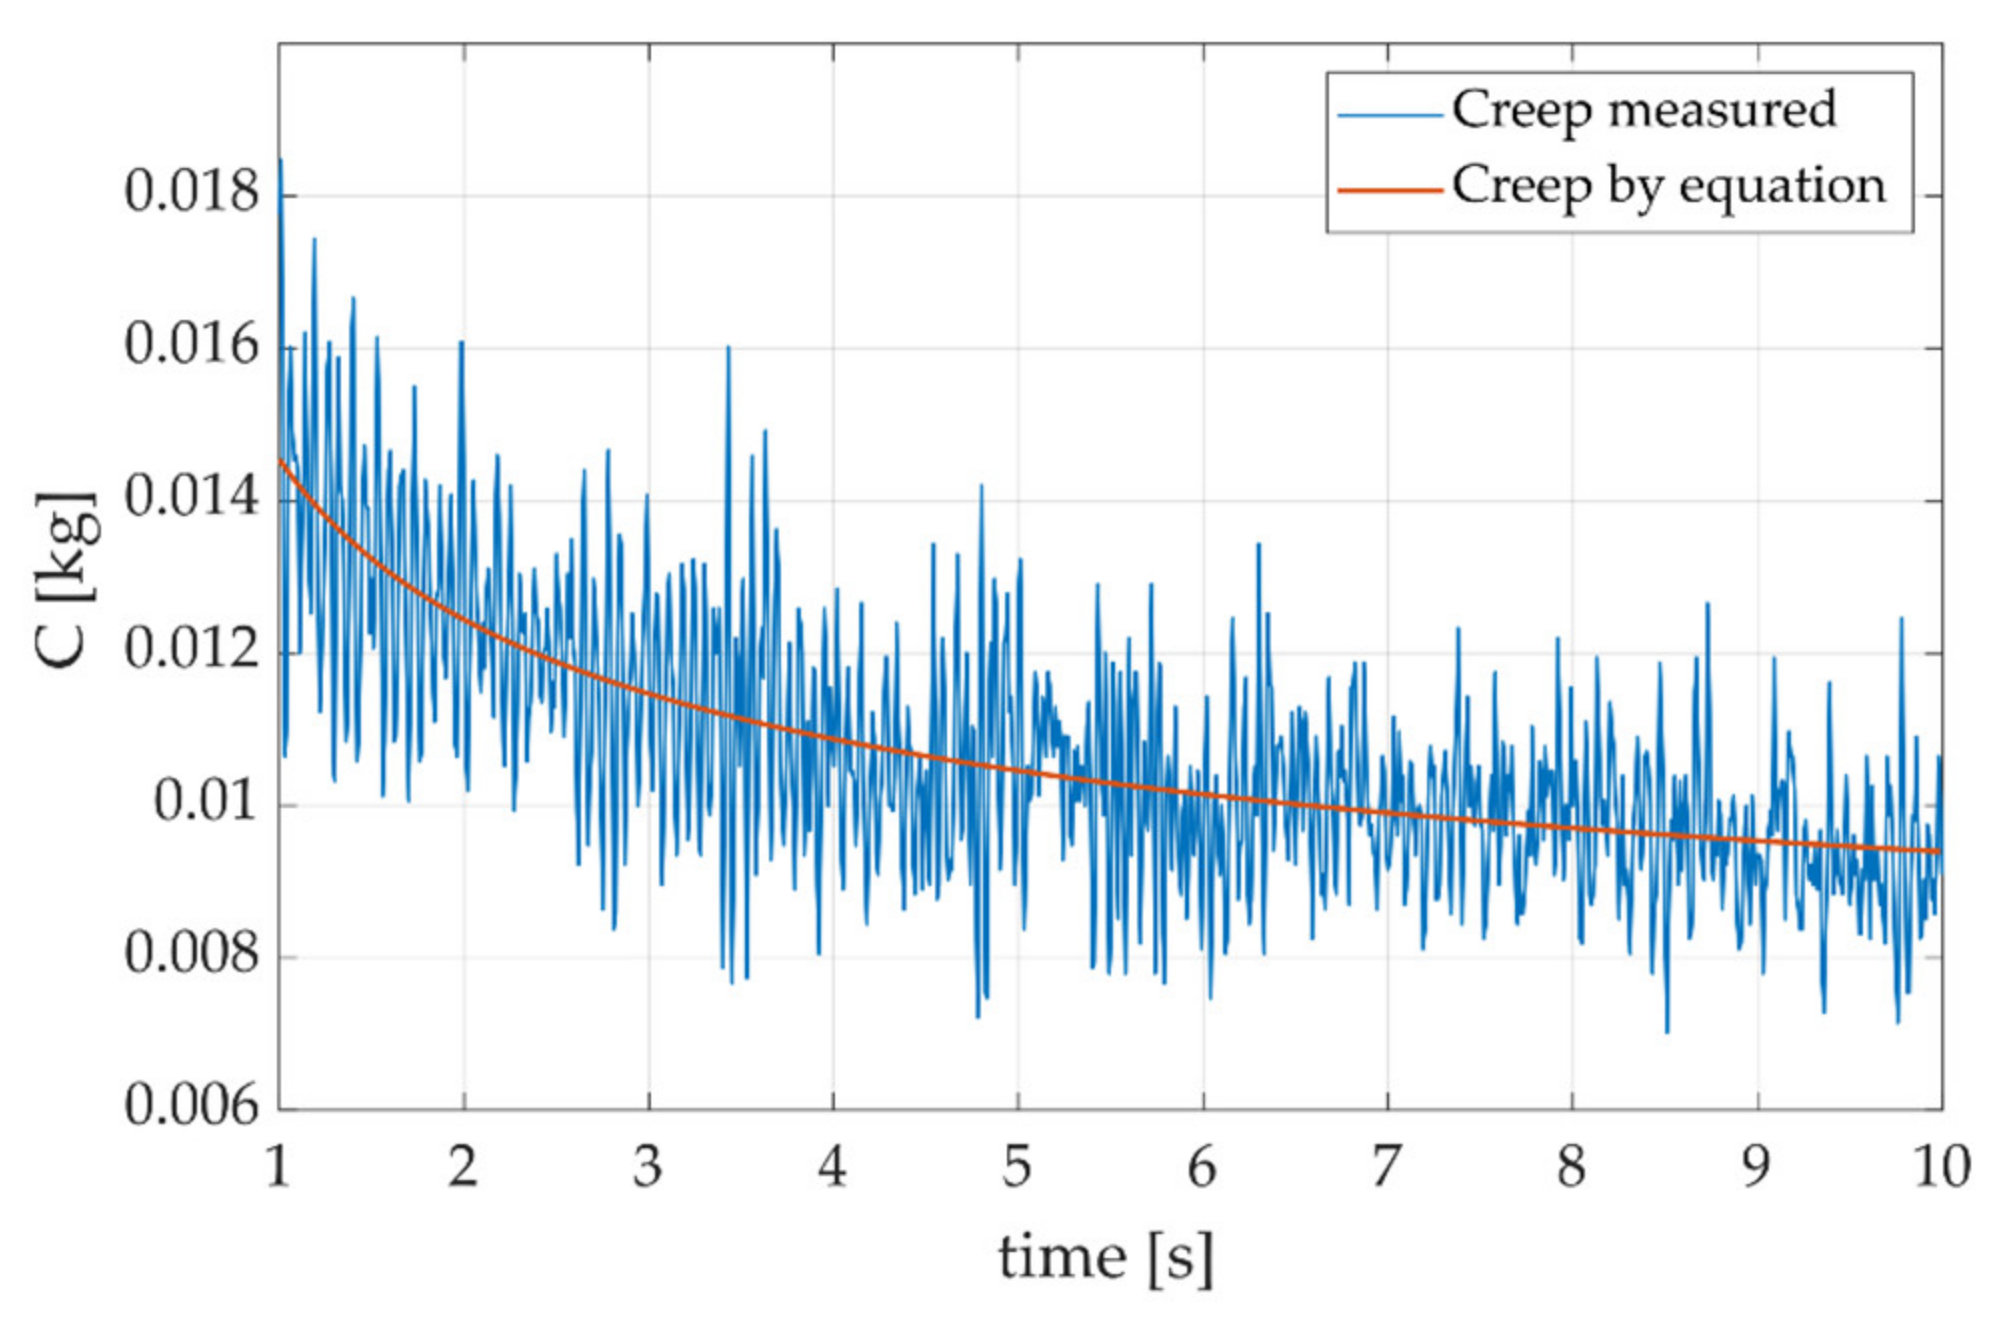
Several types of regression were modeled for creep in each interval. In the end, the regression function chosen to approximate the creep in the interval between 1 and 10 s is depicted in Equation (3). For times over 10 s, the regression presented in Equation (4) was selected. Figure 12 shows the measured creep curve and the creep curve obtained with Equation (3).
Given that the creep is proportional to the applied load, the general adjustment equation for loads up to 2 kg is given by the Equation (5):
where Fa is the applied load and A(t) is the adjustment value to apply.
The real load applied can be estimated by using the defined adjustment equation and the measured value from the load cell, Equation (6).
As can be seen in Equation (6), the actual force applied to the load cell (Fa) can be estimated based on the measured force (Fm) and the time (t) elapsed between the application of the force and its measurement. Figure 13 shows the measured load and the load adjusted using Equation (6).
3.2. Speed Measurement
The machine has the features to locate two encoders to measure speed, one encoder can be installed on the transmission input shaft to estimate the input speed, and the other encoder can be installed at one end of the pulley system and could be used to estimate the speed transmission output. By using the data from the two encoders, it can be determined if there is slippage or backlash in the transmission.
4. Command Module
The command module is responsible for managing the motor. The motor manufacturer provides software (MEXE02) for loading up to 16 step-type speed profiles into the motor controller; a complementary command system was developed and implemented to manage these profiles and make it possible to use other types of profile. This complementary system consists of an application named “Control” developed in Matlab, and an Arduino program running on an Intel Galileo Gen 2 card.
The Control application has three speed-based operation modes and one position-based operation mode:
- (1)
- “Function” operating mode: in this mode, it is possible to write speed as a function of time; then the data can be graphed and sent to the motor controller. The only restriction for the type of function is that these functions are included in the Matlab engine.
- (2)
- “Profiles” operating mode: allows the generation of step-type speed profiles, but unlike the profiles that can be created with the MEXE02 software, the transition between speeds (acceleration-deceleration) is not a fixed value, it is a function of the extreme values of the speeds and the time established for this change. Data entry is done in a table, indicating the initial speed, the final speed, and the time of each interval.
- (3)
- “Speed” operating mode: this mode allows executing one of the 16 step-type speed profiles previously stored in the controller. It is possible to concatenate up to three continuous speed profiles. The interface of the “Control” program in the “Speed” operating mode is shown in Figure 14.
- (4)
- “Position” operating mode: in this operating mode, in addition to the speed, it is necessary to indicate the displacement to be executed for that speed. It is possible to have 16 different speed-displacement pairs. The speed profiles are of the step type, whose values correspond to those previously entered in the controller using MEXE02.
5. Data Acquisition Module
In the test bench implemented, it is possible to measure the input speed to the transmission and the reactive forces of the engine in the load cells. For the acquisition of these signals a National Instruments DAQ data acquisition system was used. The DAQ specifications are shown in Table 1.
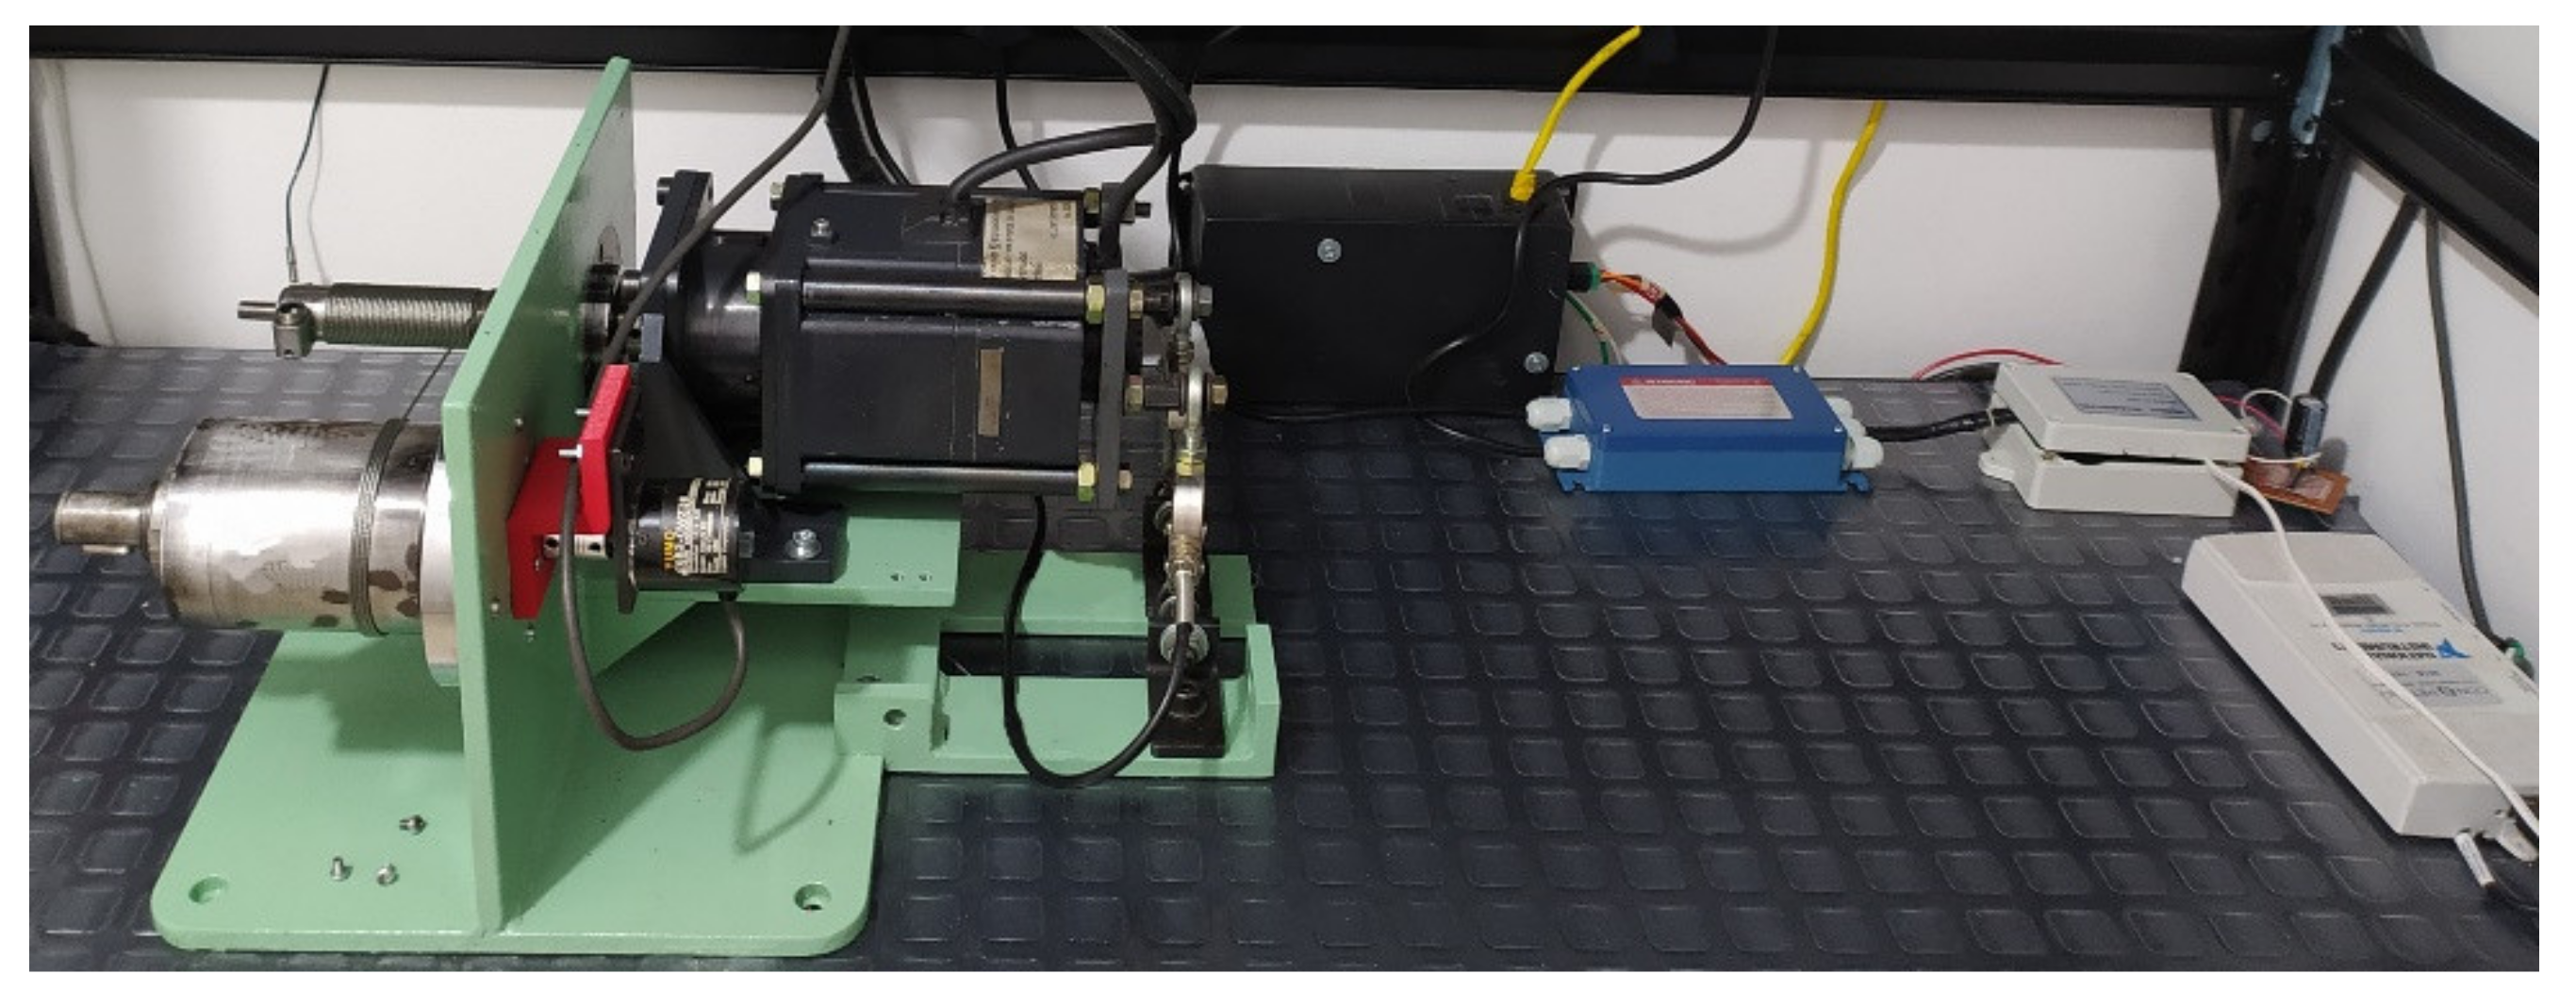
The experimental test bench implemented is presented in Figure 15.
6. Experimental Tests and Results
The first experimental tests were performed to evaluate the different modules developed. Next, pilot experiments were carried out to estimate the friction behavior in four cable-driven transmission configurations:
- (a)
- Cable-driven transmission 25–75 G, with the following characteristics:
- A motor shaft of 25 mm in diameter, with round guiding grooves.
- A pulley of 75 mm in diameter without guiding grooves.
- A steel cable of 1.6 mm in diameter.
- Four turns of cable wrapping over the pulley.
- The cable is wound in a straight pattern around the motor shaft and the pulley.
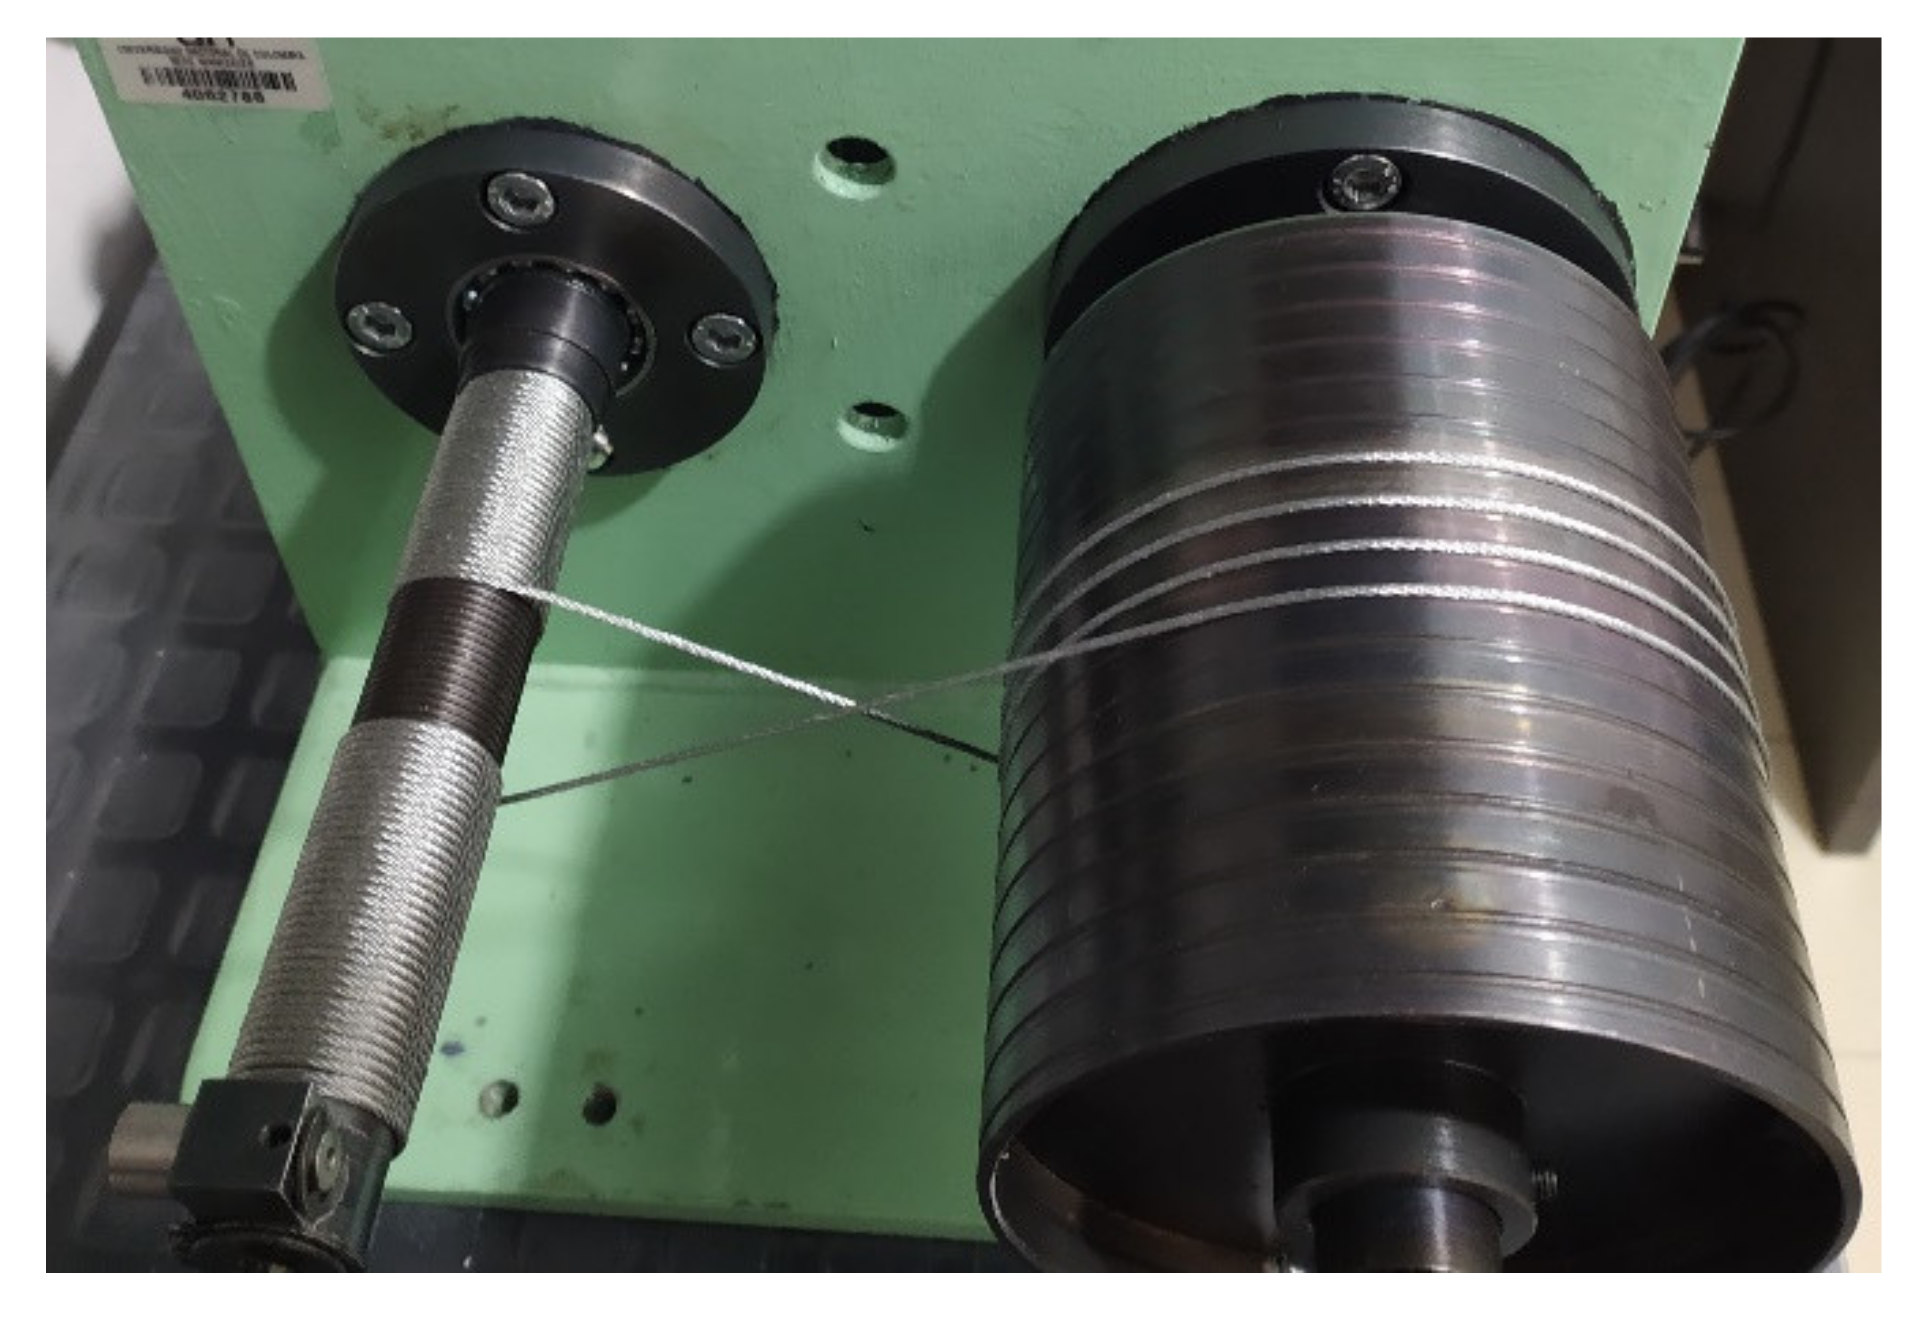
The assembly of the transmission 25–75 G is shown in Figure 16.
- (b)
- Cable-driven transmission 35–75 G, with these characteristics:
- A motor shaft of 35 mm in diameter, with round guiding grooves.
- A pulley of 75 mm in diameter without guiding grooves.
- A steel cable of 1.6 mm diameter.
- Four turns of cable wrapping over the pulley.
- The cable is wound in a straight pattern around the motor shaft and the pulley.
- (c)
- Cable-driven transmission 25–104 P, with these characteristics:
- A motor shaft of 25 mm in diameter, with round guiding grooves.
- A pulley of 104 mm in diameter with round guiding grooves.
- A steel cable of 1.6 mm diameter.
- Four turns of cable wrapping over the pulley.
- The cable is wound in a straight pattern around the motor shaft and the pulley.
- (d)
- Cable-driven transmission 25–104 X, with these characteristics:
- A motor shaft of 25 mm diameter, with round guiding grooves.
- A pulley of 104 mm diameter with round guiding grooves.
- A steel cable of 1.6 mm diameter.
- Four turns of cable wrapping over the pulley.
- The cable is wound in an eight pattern around the motor shaft and the pulley.
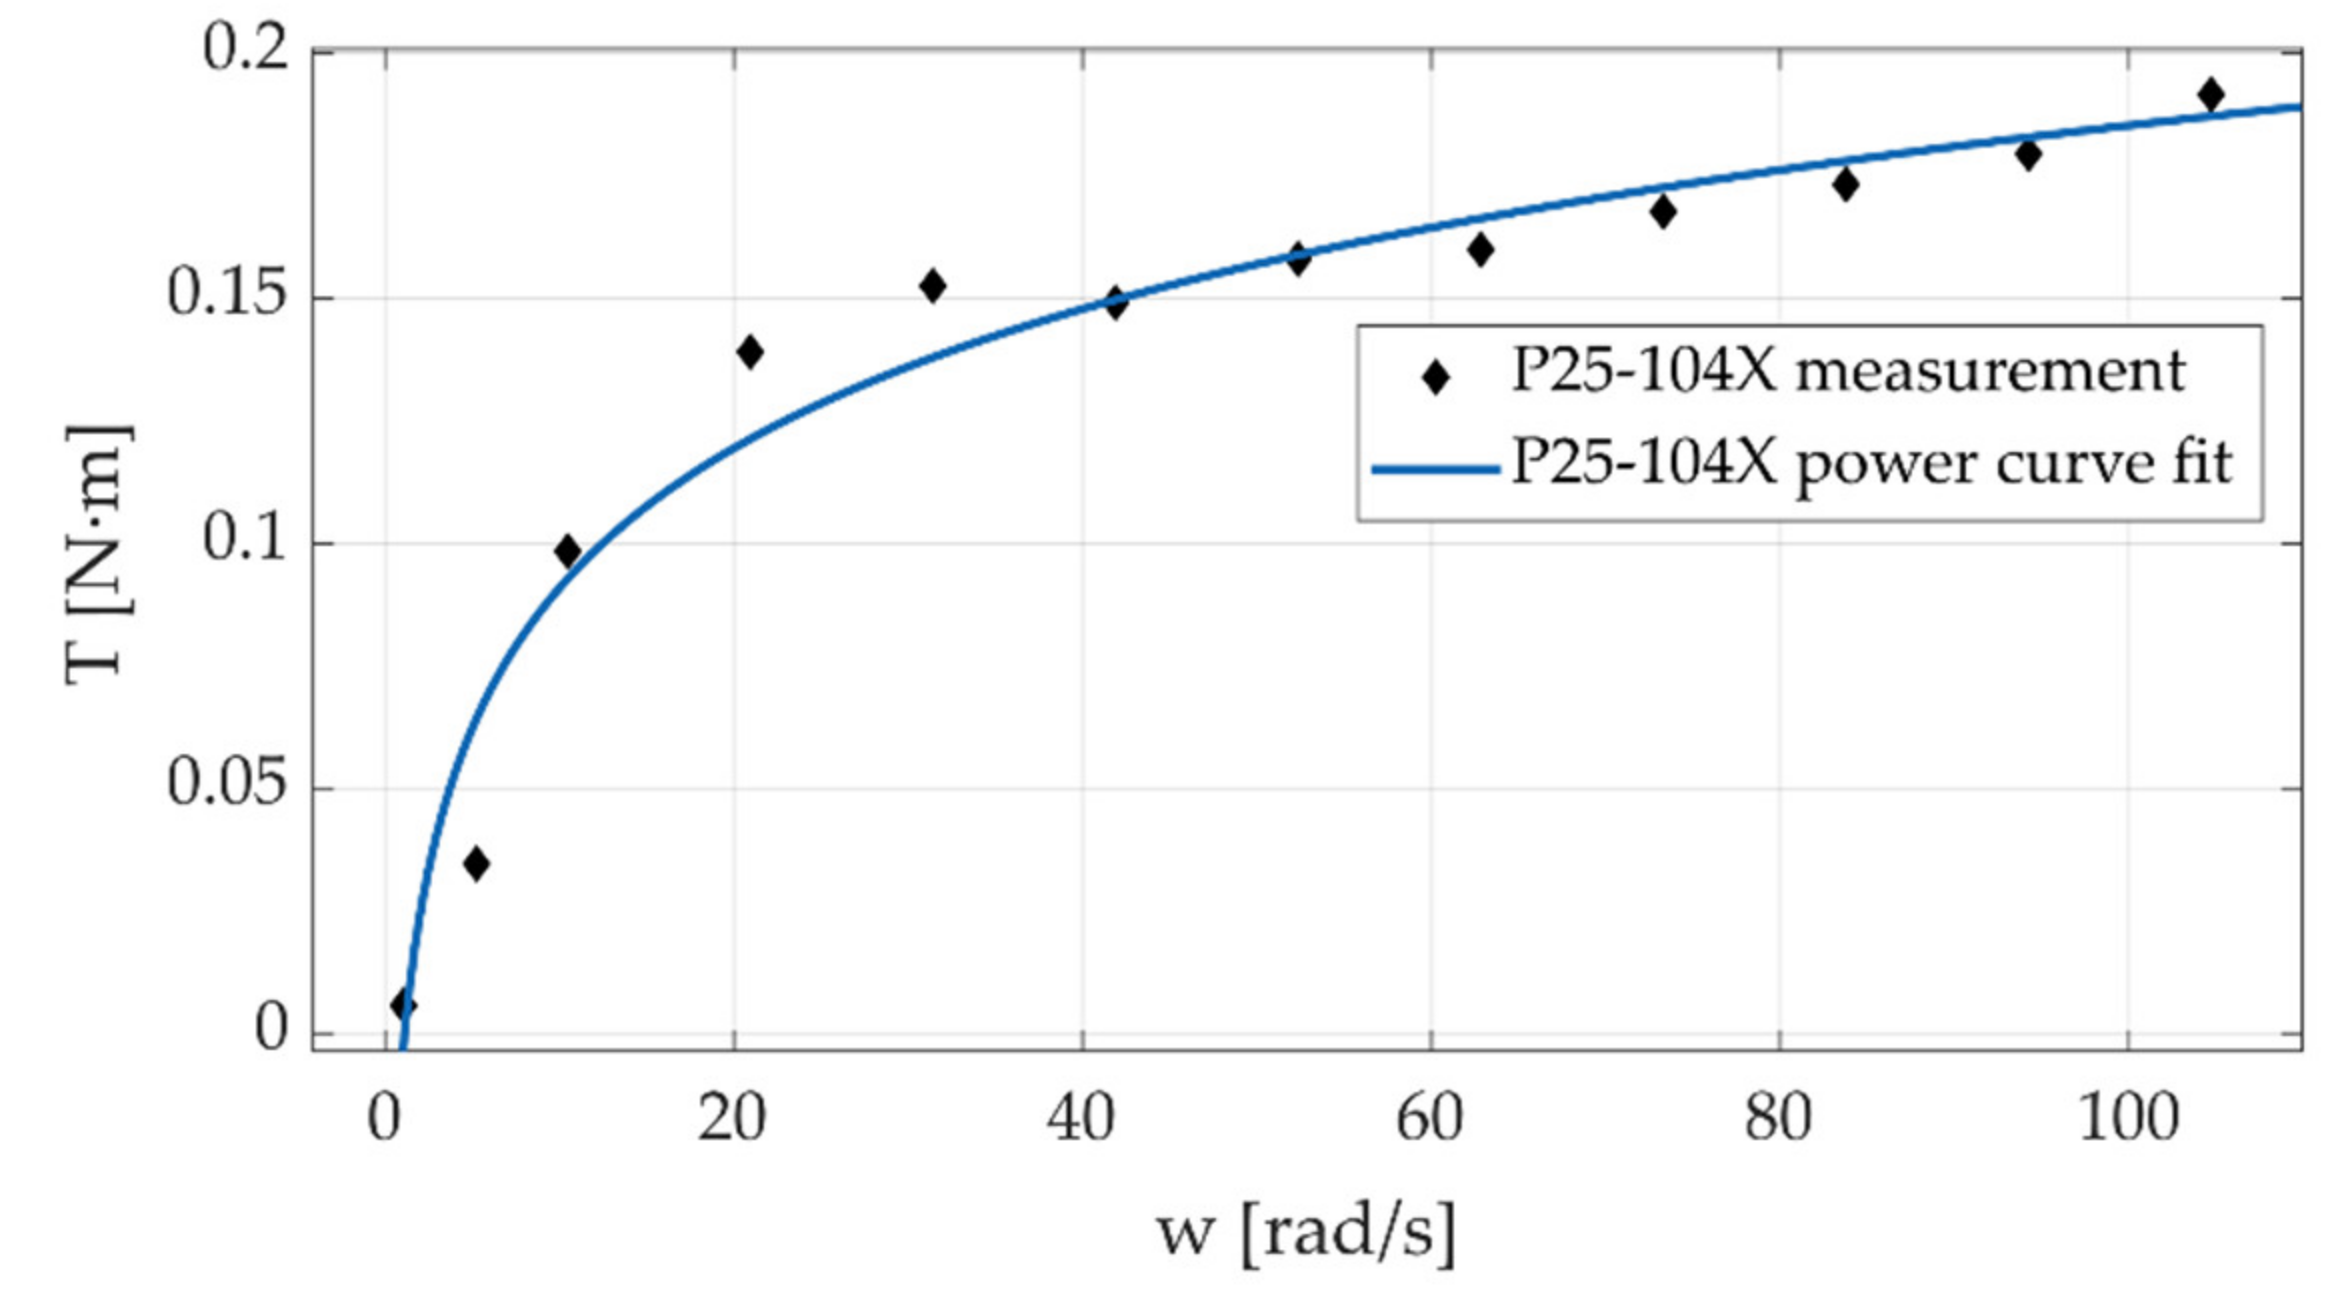
The assembly of the transmission 25–104 X is shown in Figure 17.
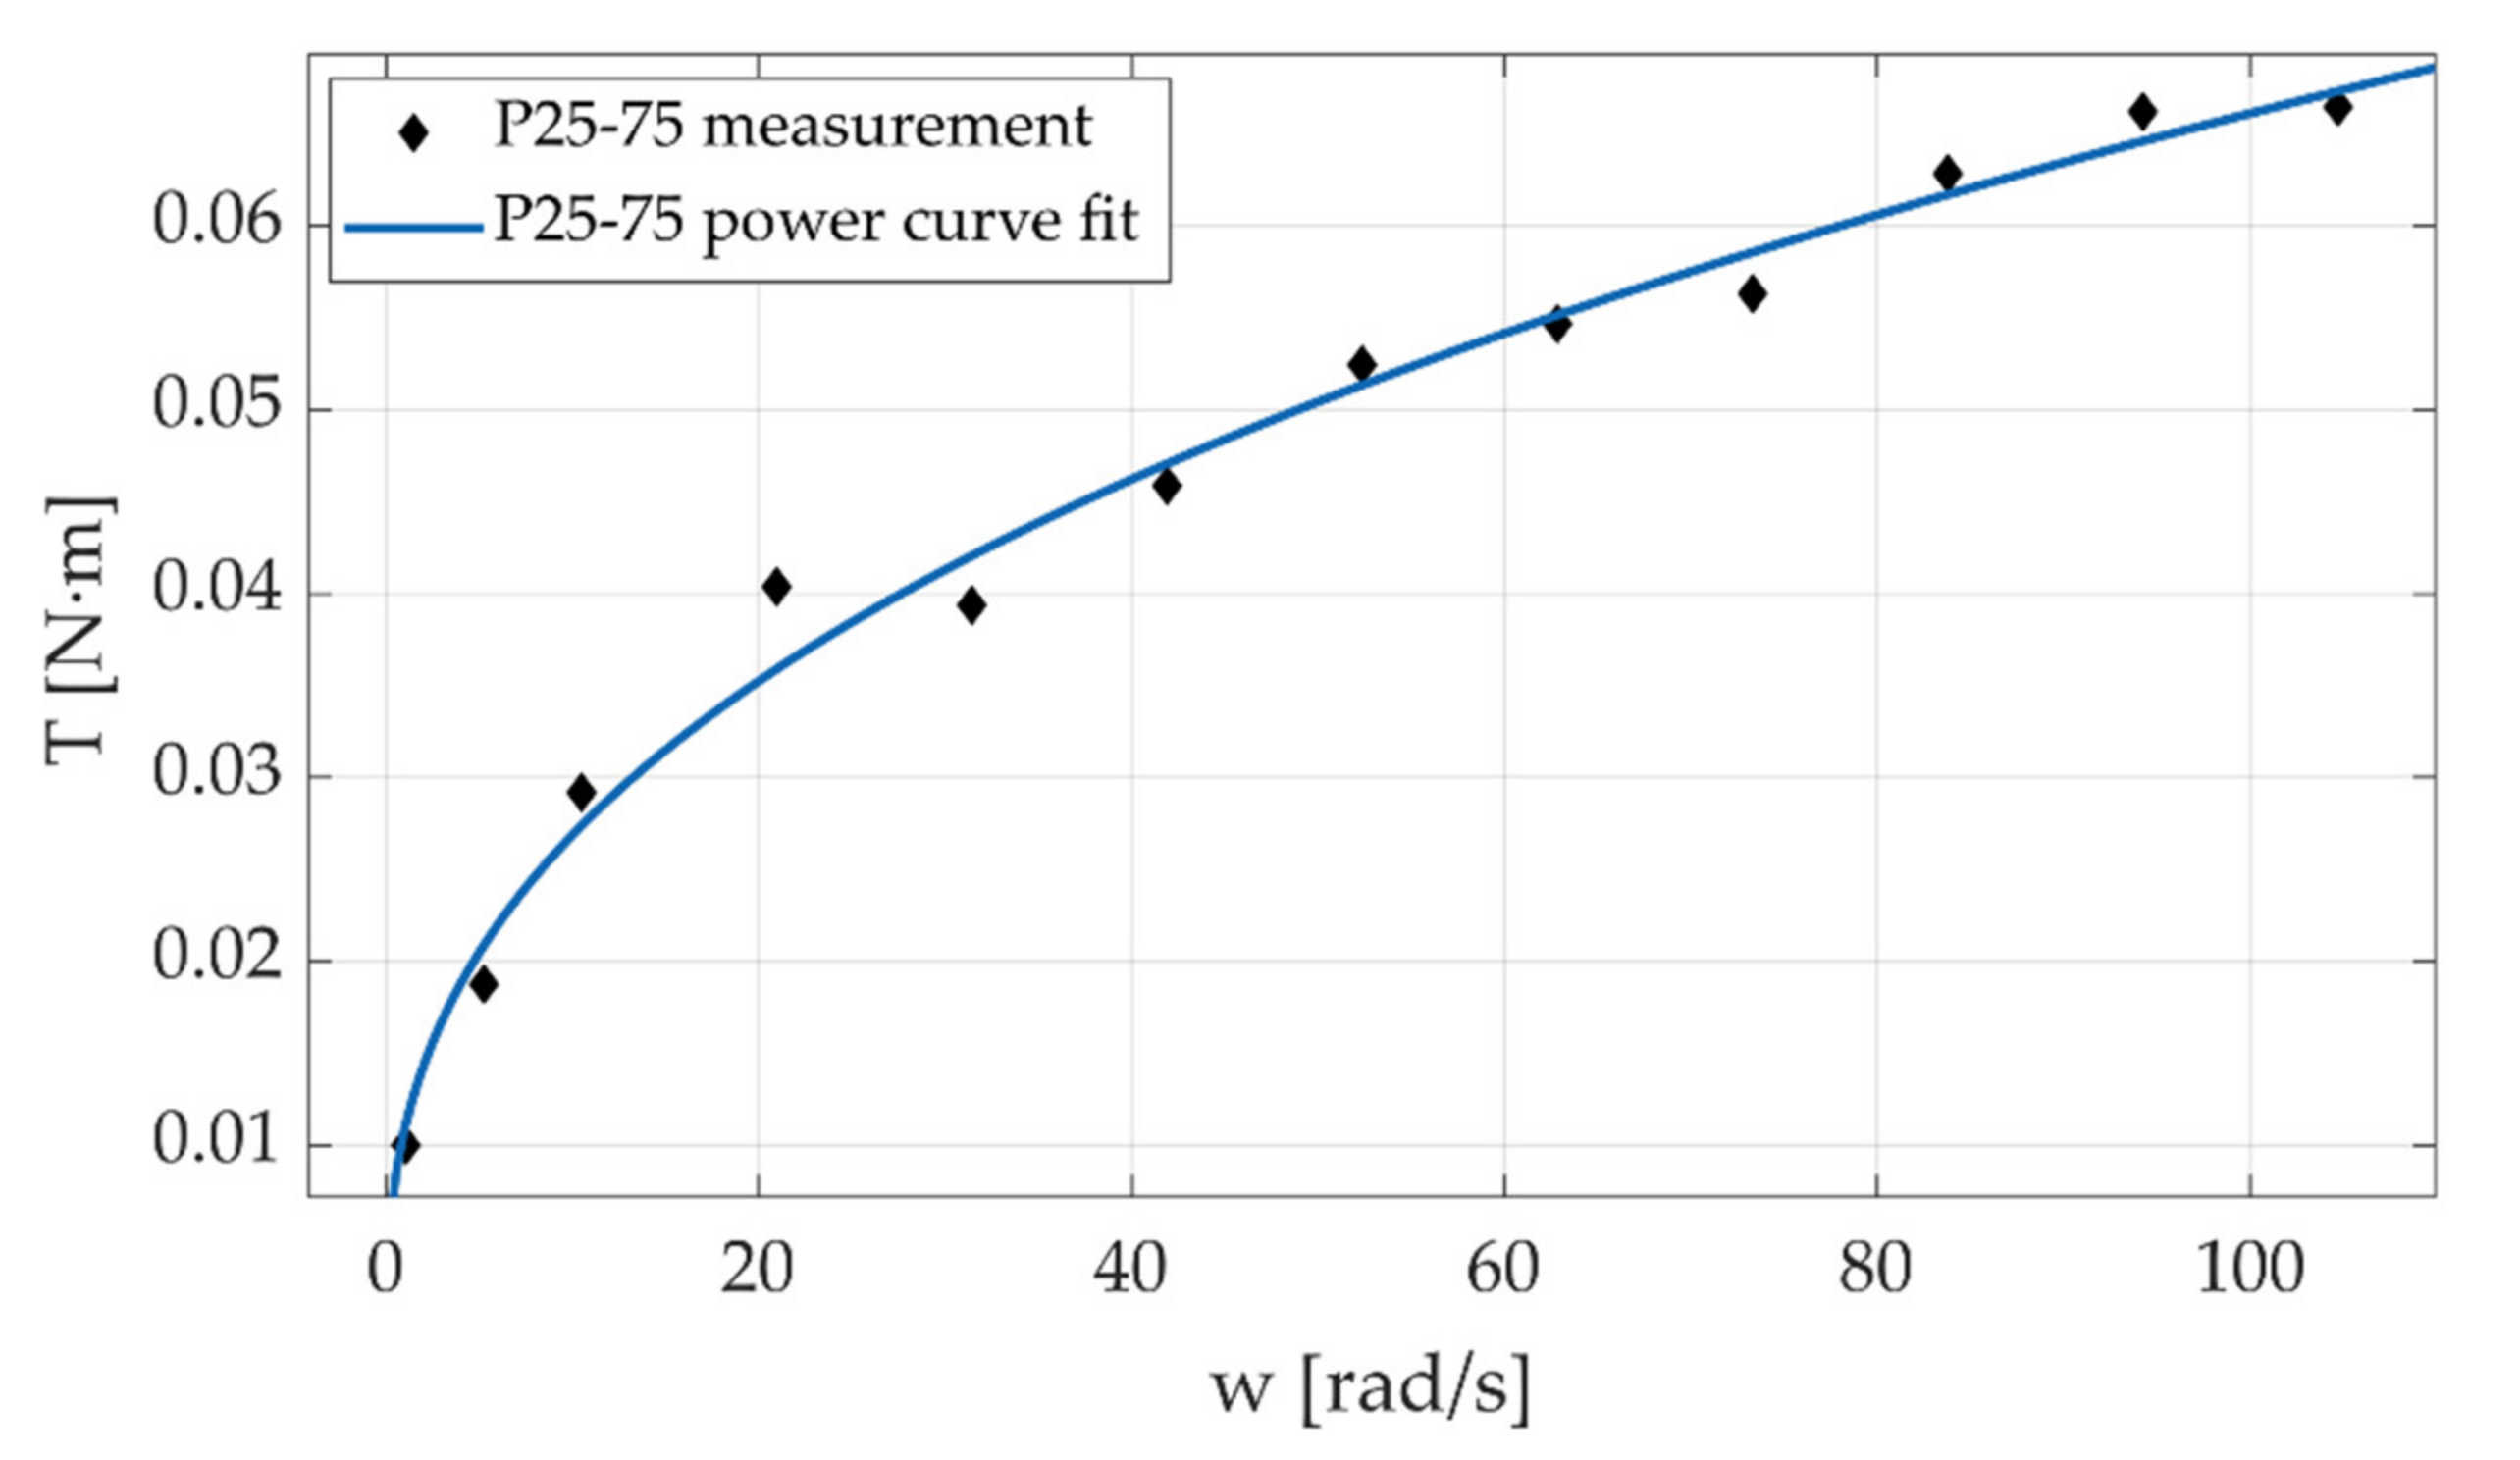
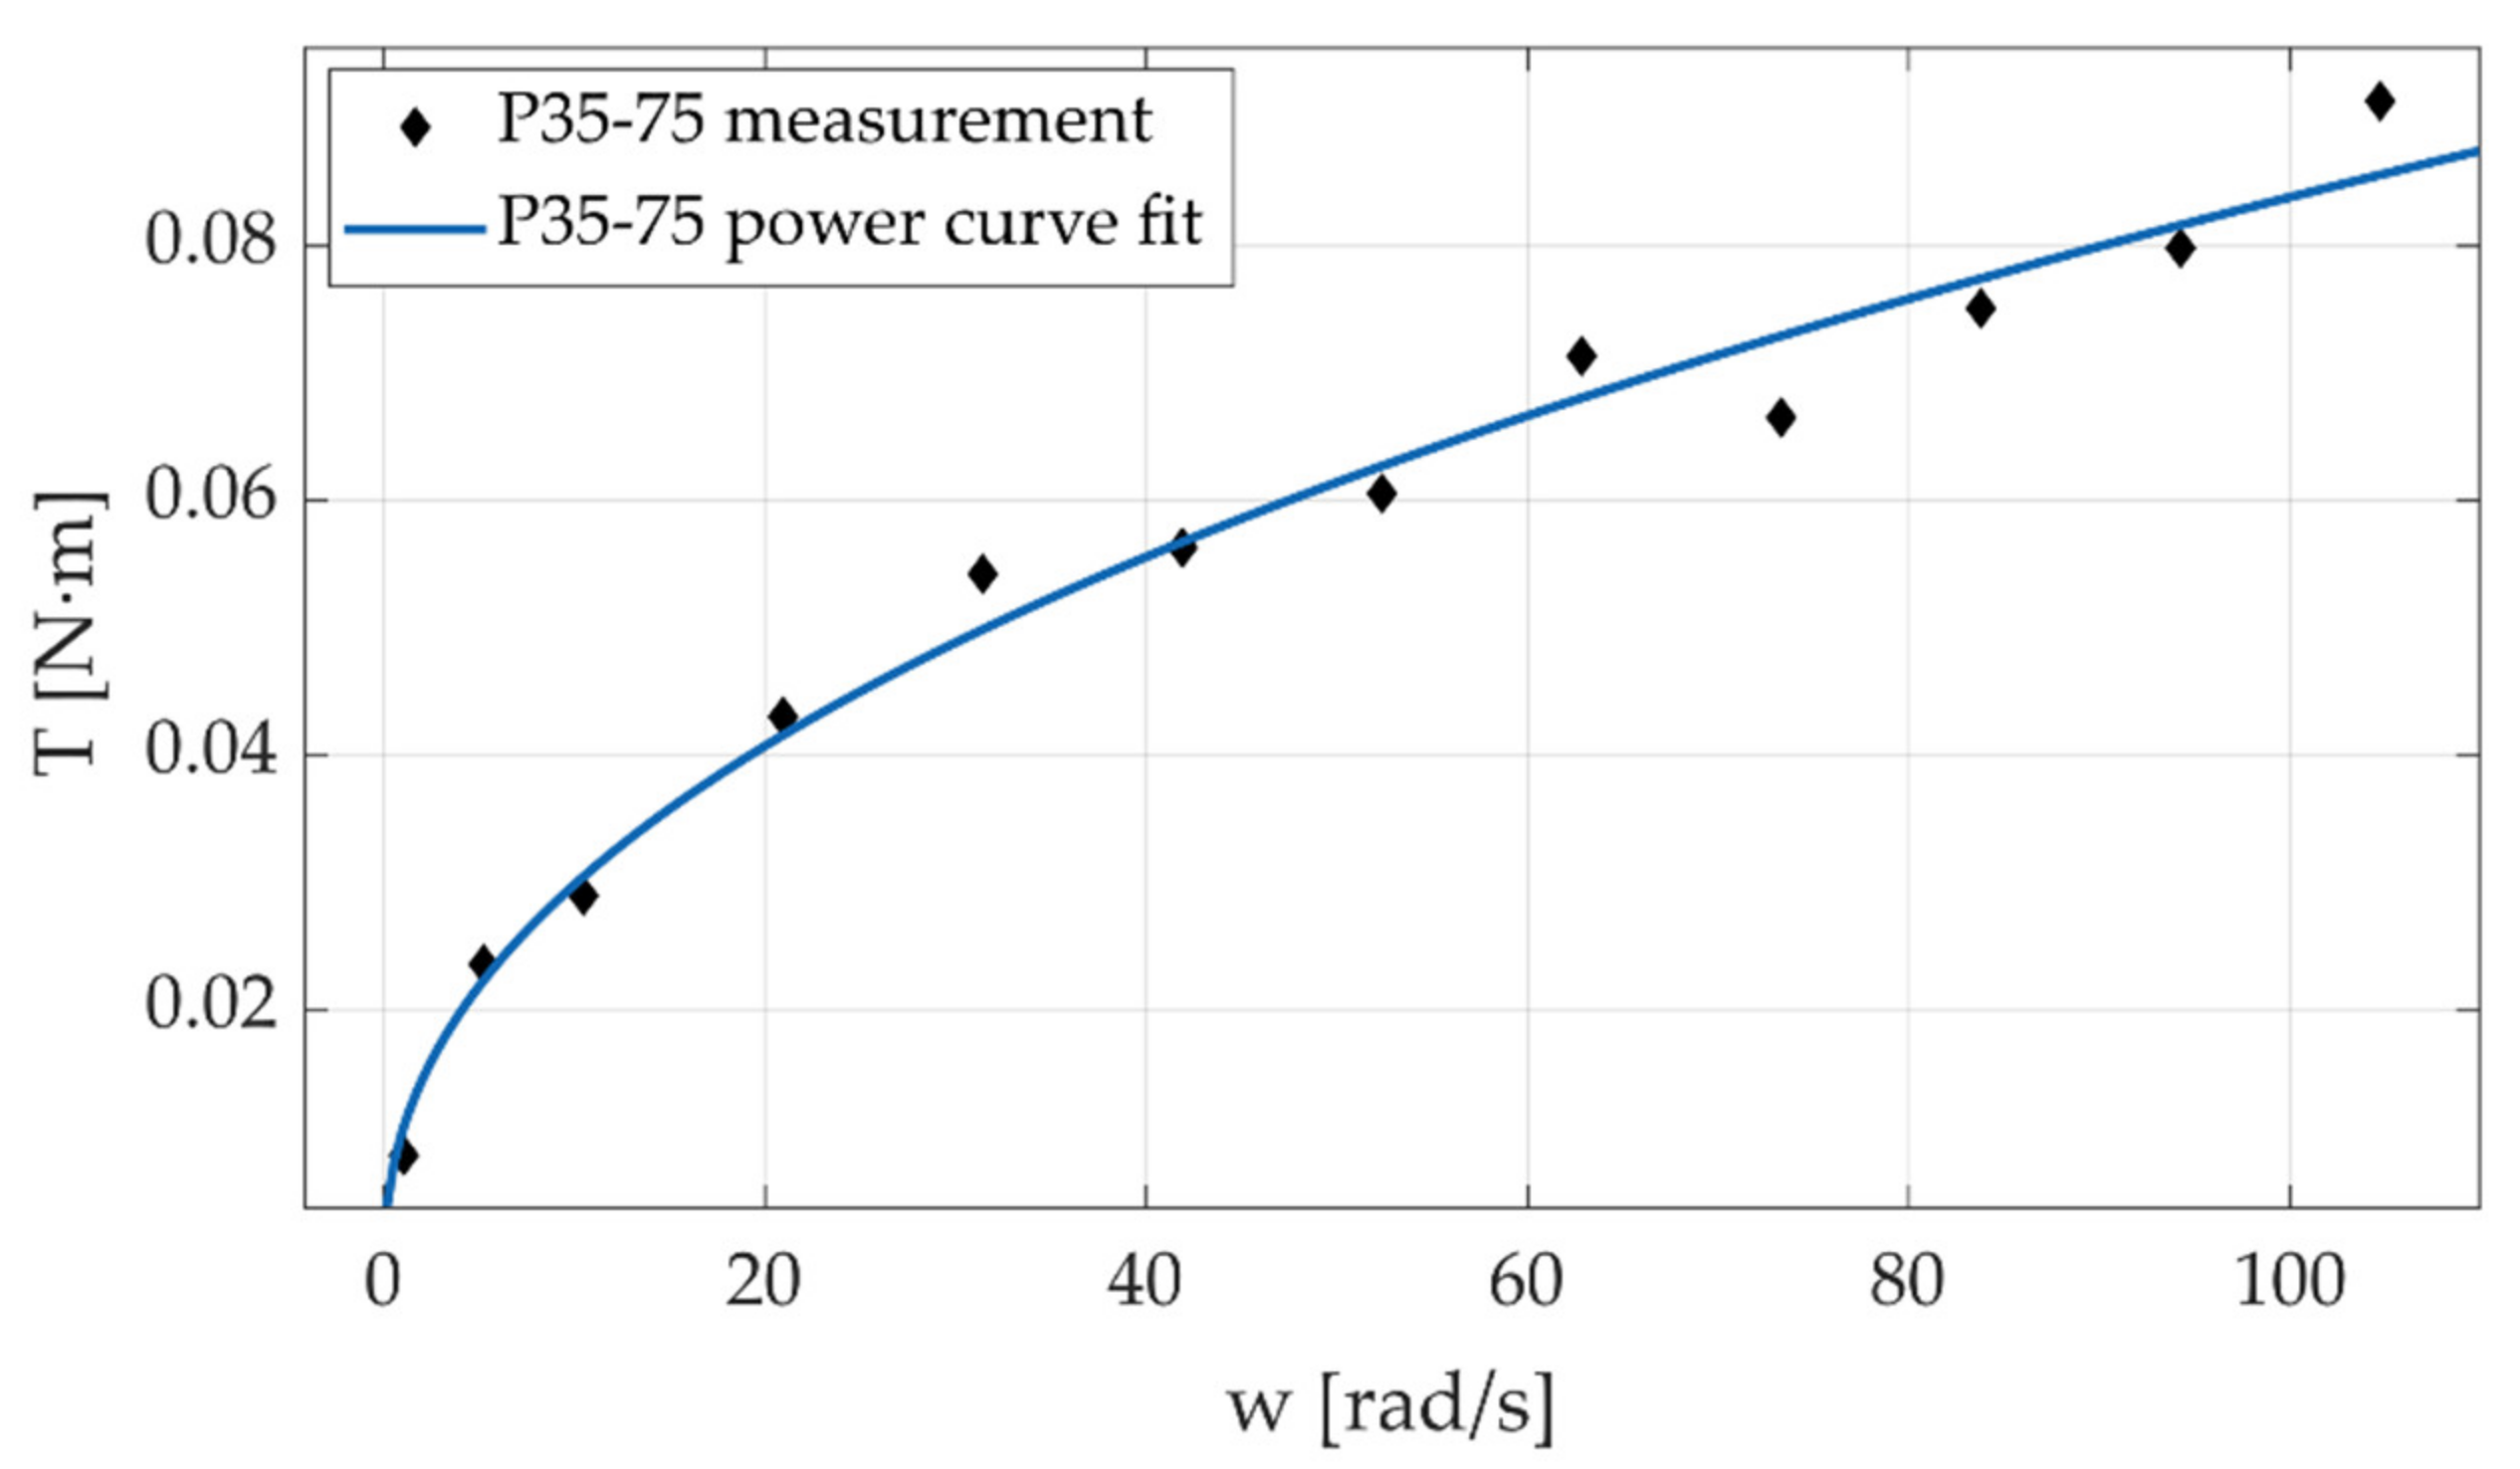
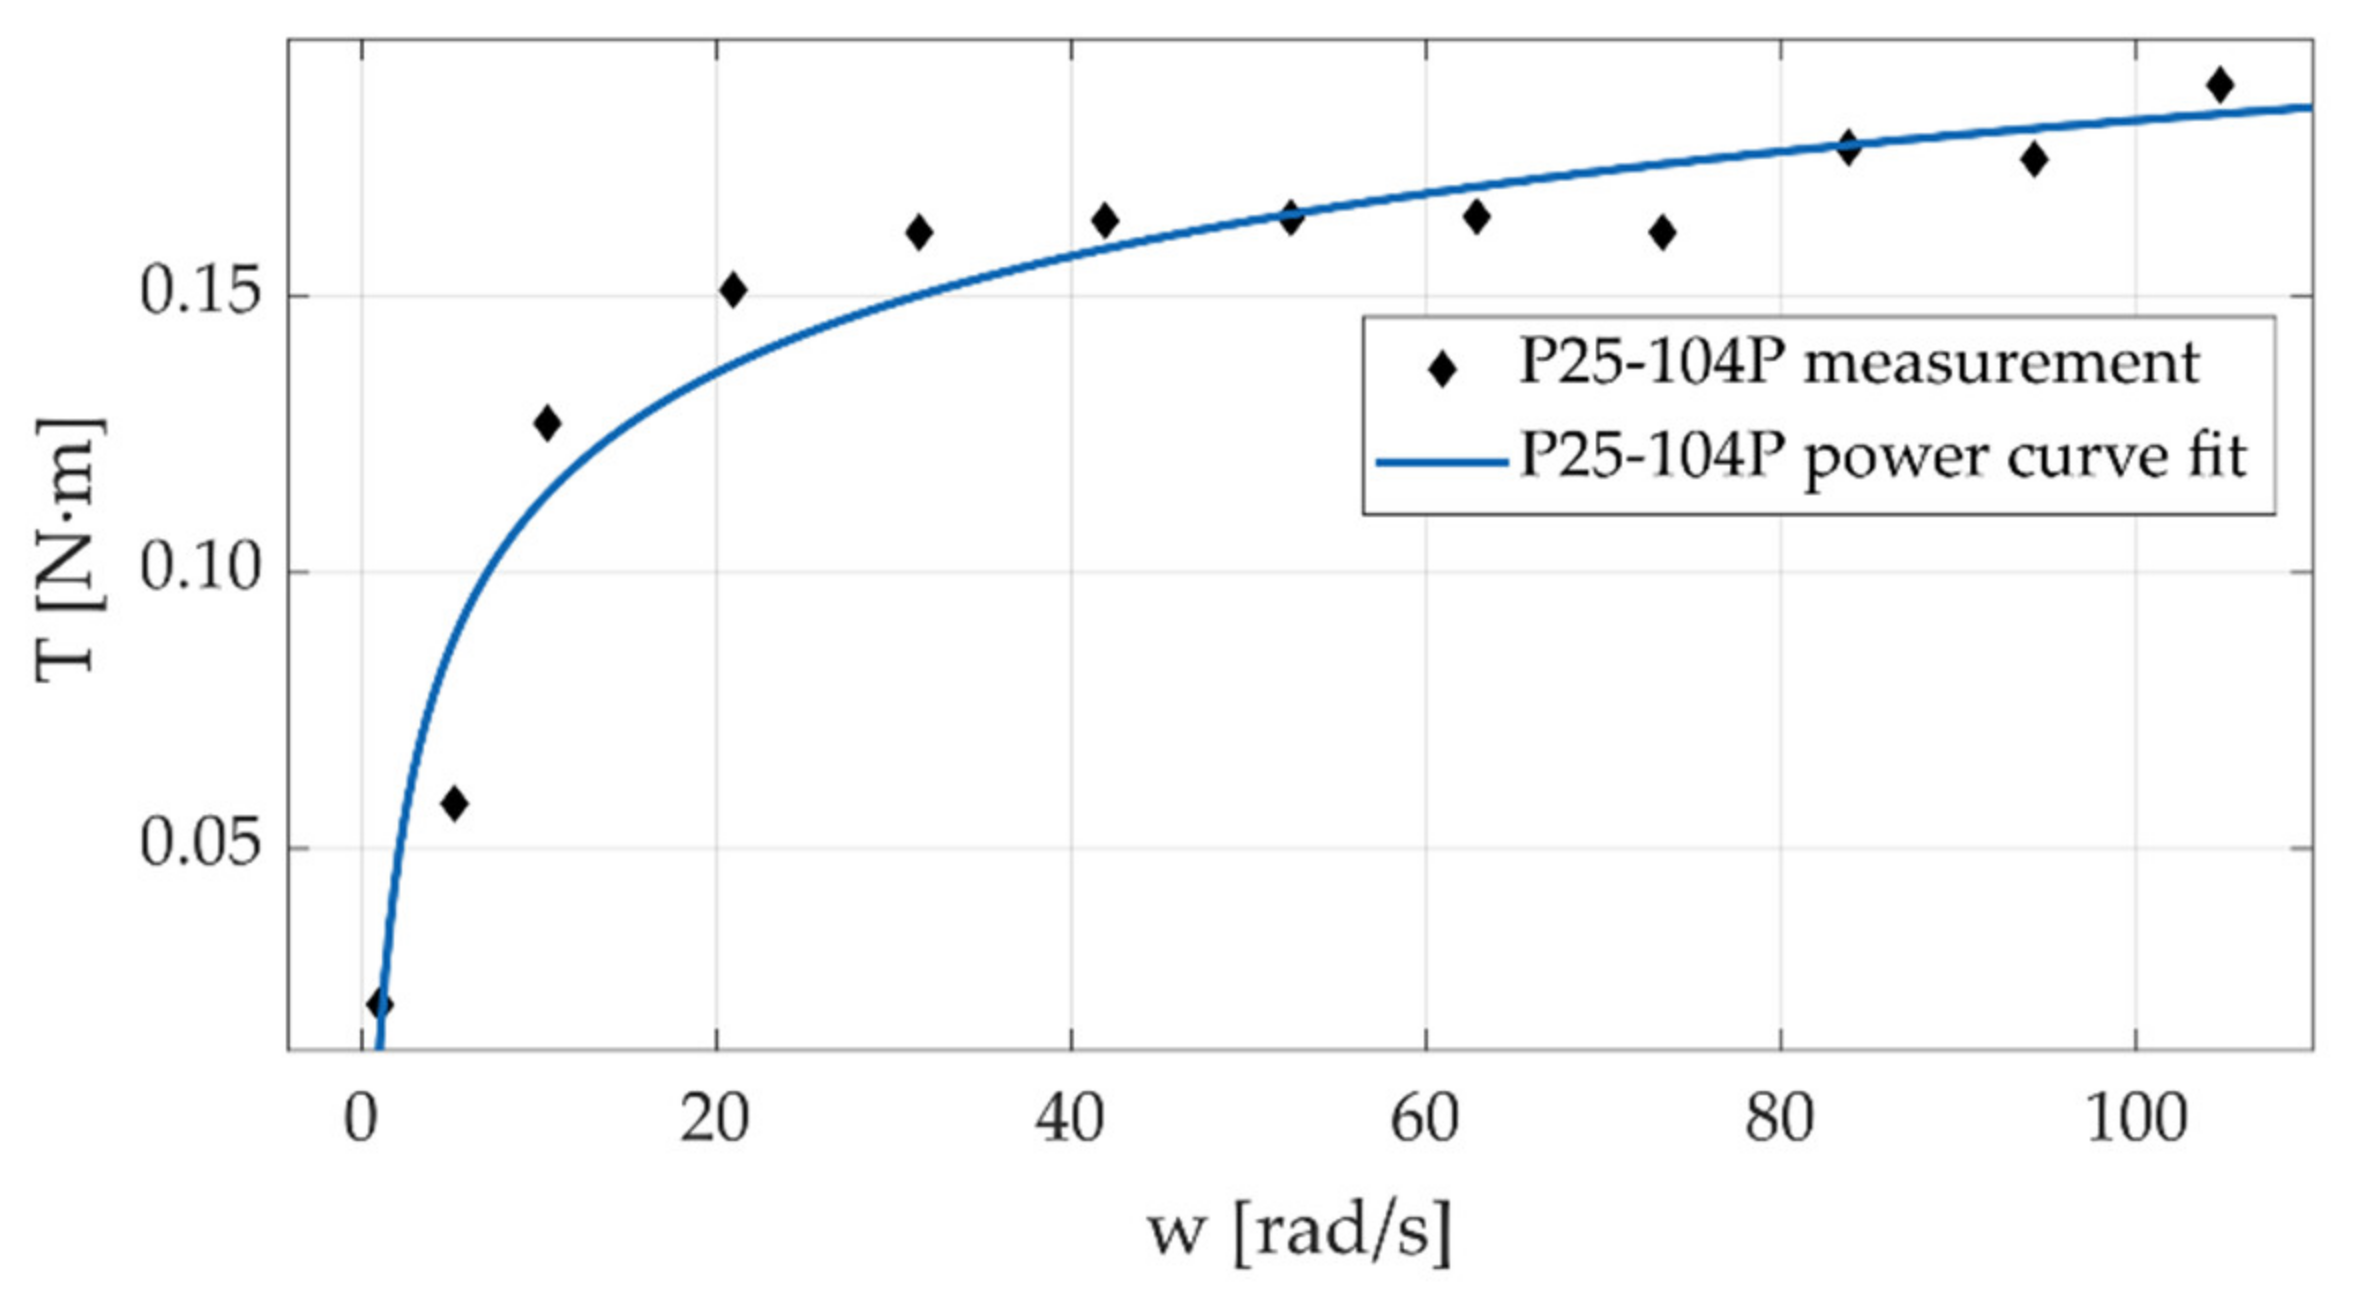
In these first experiments, the motor was moved following a trapezoidal velocity pro-file at different magnitudes. Testing was conducted ranging from 1 rad/s to 105 rad/s; the angular position of the motor shaft and reactive forces in the load cells were sampled at 5 kHz. The speed range chosen for the experiments covers a wide range of speeds found in commercial robotic manipulator joints. By using the 25 mm screws, the bench can be adjusted to produce transmission ratios up to 10:1. Before performing the torque calculation, the reactive force signals were filtered using wavelets (db10 with 10 levels). The measurements of angular position and the corresponding sampling time were employed to compute the velocity of the input shaft in each experiment. The values of torque and velocity during the constant velocity stage of the trajectory were averaged and used to construct the torque-speed plots (Figure 18, Figure 19, Figure 20 and Figure 21).
Preliminary results shown in Figure 18, Figure 19, Figure 20 and Figure 21 reveal that torque exhibits a behavior similar to that produced in deep groove ball bearings [37,38]; hence suggesting that the friction in the transmission is largely governed by the friction in the bearings. This behavior is consistent with the characteristics of the transmission: the input axis and the pulley axis are supported in deep groove bearings lubricated with heavy grease. The design of the test bench allows to “lock-in” the contribution of bearing conditions to friction behavior when evaluating different geometric configurations. Note that our design allowed us to change the input shaft and the pulley body, keeping the same support bearings.
The 35–75 G and 25–75 G configurations differ in the motor shaft diameter, and the other parameters remain the same. The results show that there is a slight difference in the friction values for speeds over 30 rad/s; for lower speeds, there is no significant difference. This behavior may be due to the small difference in motor shaft size between configurations, which in turn induces a small difference in static load on the bearings. The 25–104 P and 25–104 X configurations have similar physical parameters, the difference being the way the cable was wrapped around the motor shaft and pulley in each configuration. Both configurations show higher friction torque values than configurations 25–75 G and 35–75 G, but there were no significant differences between them. These preliminary results suggest that friction is governed mainly by friction in the bearings, which is directly related to the load, in this case, the weight of the pulley and the motor shaft. The type of winding does not significantly affect the friction behavior in the cable.
Further evaluation of the transmission operating conditions is required to establish a suitable friction model. However, these first experiments made it possible to evaluate the test bench and establish a baseline for the next experiments to be carried out. These first experiments were conducted at a constant speed and no payload, however, the test bench is intended to be used to evaluate friction behavior which includes some additional factors that could contribute to friction fluctuation, such as temperature, transmission ratio, and payload.
7. Conclusions
This paper presents the design and preliminary testing of a new test bench to evaluate the friction in a cable-driven transmission.
In the document, we present details about the design of the test bench, highlighting the procedure followed to both determine the driving power, and carry out the cell calibration. Our approach provides the possibility to vary the input shaft and pulley in the transmission, allowing different gear ratios and materials to be evaluated, with the ability to assess the effect of having more than one turn of cable winding on the pulley, improving the number of configurations that can be studied in our bench compared to previous works. Although the main goals were achieved, future improvements can be made to this testing test bench. For instance, at the mechanical level, the development of an improved cable tensor system for easy setup.
The methodology we used to model friction utilizes the output of the load cells instead of the electrical input signals to the motor. Nevertheless, the test bench can be easily augmented by the introduction of such sensory parts.
Results obtained in preliminary tests suggest that the steady-state friction behavior is governed primarily by the deep groove ball bearings. However, further evaluation of the transmission operating conditions is required.
The use of the testing bench to evaluate the friction behavior for different configurations of the cable-driven transmission could be an issue for future analysis and discussion.
Author Contributions
Conceptualization, G.T.C. and J.B.G.M.; methodology, G.T.C.; software, G.T.C.; validation, G.T.C., and J.B.G.M.; investigation, G.T.C.; writing—original draft preparation, G.T.C.; writing—review and editing, J.B.G.M.; visualization, G.T.C.; supervision, J.B.G.M.; project administration, G.T.C. All authors have read and agreed to the published version of the manuscript.
Funding
This work was funded by Universidad Nacional de Colombia (Project HERMES 34923) and Universidad Tecnológica de Pereira (Project CIE 8-18-5).
Institutional Review Board Statement
Not applicable.
Informed Consent Statement
Not applicable.
Data Availability Statement
The data presented in this study are available on request from the corresponding author.
Conflicts of Interest
The authors declare no conflict of interest.
References
- Wang, A.; Kim, S. Directional Efficiency in Geared Transmissions: Characterization of Backdrivability towards Improved Proprioceptive Control. In Proceedings of the 2015 IEEE International Conference on Robotics and Automation (ICRA), Seattle, WA, USA, 26–30 May 2015; pp. 1055–1062. [Google Scholar]
- Sensinger, J.W.; Lipsey, J.H. Cycloid vs. Harmonic Drives for Use in High Ratio, Single Stage Robotic Transmissions. In Proceedings of the 2012 IEEE International Conference on Robotics and Automation, Saint Paul, MN, USA, 14–18 May 2012; Volume 60611, pp. 4130–4135. [Google Scholar]
- Townsend, W.T.; Guertin, J.A. Teleoperator Slave—WAM Design Methodology. Ind. Robot Int. J. 1999, 26, 167–177. [Google Scholar] [CrossRef] [Green Version]
- Rooks, B. The Harmonious Robot. Ind. Robot Int. J. 2006, 33, 125–130. [Google Scholar] [CrossRef] [Green Version]
- Whitsell, B.; Artemiadis, P. Physical Human–Robot Interaction (PHRI) in 6 DOF With Asymmetric Cooperation. IEEE Access 2017, 5, 10834–10845. [Google Scholar] [CrossRef]
- Lee, H.; Lee, B.; Kim, W.; Gil, M.; Han, J.; Han, C. Human-Robot Cooperative Control Based on PHRI (Physical Human-Robot Interaction) of Exoskeleton Robot for a Human Upper Extremity. Int. J. Precis. Eng. Manuf. 2012, 13, 985–992. [Google Scholar] [CrossRef]
- Pervez, A.; Ryu, J. Safe Physical Human Robot Interaction-Past, Present and Future. J. Mech. Sci. Technol. 2008, 22, 469–483. [Google Scholar] [CrossRef]
- Li, H.; Liu, W.; Wang, K.; Kawashima, K.; Magid, E. A Cable-Pulley Transmission Mechanism for Surgical Robot with Backdrivable Capability. Robot. Comput. Integr. Manuf. 2018, 49, 328–334. [Google Scholar] [CrossRef]
- Zinn, M.; Roth, B.; Khatib, O.; Salisbury, J.K. A New Actuation Approach for Human Friendly Robot Design. Int. J. Robot. Res. 2004, 23, 379–398. [Google Scholar] [CrossRef]
- Morris, M.M.; Shoham, M.; Nahon, M. Applications and Theoretical Issues of Cable-Driven Robots. In Proceedings of the Florida Conference on Recent Advances in Robotics, Boca Raton, FL, USA, 21–22 May 2009; pp. 1–29. [Google Scholar]
- Saric, A.; Xiao, J.; Shi, J. Reducing Uncertainty in Robotic Surface Assembly Tasks Based on Contact Information. In Proceedings of the 2014 IEEE International Workshop on Advanced Robotics and its Social Impacts, Evanston, IL, USA, 11–13 September 2014; pp. 94–100. [Google Scholar]
- Phan, S.; Lioulemes, A.; Lutterodt, C.; Makedon, F.; Metsis, V. Guided Physical Therapy through the Use of the Barrett WAM Robotic Arm. In Proceedings of the 2014 IEEE International Symposium on Haptic, Audio and Visual Environments and Games (HAVE) Proceedings, Richardson, TX, USA, 10–11 October 2014; pp. 24–28. [Google Scholar]
- Vicentini, F.; Pedrocchi, N.; Malosio, M.; Molinari Tosatti, L. SafeNet: A Methodology for Integrating General-Purpose Unsafe Devices in Safe-Robot Rehabilitation Systems. Comput. Methods Programs Biomed. 2014, 116, 156–168. [Google Scholar] [CrossRef] [PubMed]
- Zakeri, F.; Hirobe, T.; Akbari Noghabi, K. Biological Effects of Low-Dose Ionizing Radiation Exposure on Interventional Cardiologists. Occup. Med. 2010, 60, 464–469. [Google Scholar] [CrossRef] [Green Version]
- Luo, H.; Tang, Y.G.; Shen, J. A Study on Drive Capstan Stiffness of Cable-Driven Picking Manipulator. Adv. Mater. Res. 2012, 605–607, 1113–1119. [Google Scholar] [CrossRef]
- Xie, X.; Qi, C.; Tan, R.; Fan, D. Design and Performance Analysis of a Many-to-One Configuration Precise Cable Drive Mechanism with High Precision and Large Torque. Proc. Inst. Mech. Eng. Part C J. Mech. Eng. Sci. 2019, 233, 5903–5915. [Google Scholar] [CrossRef]
- Mazumdar, A.; Spencer, S.J.; Hobart, C.; Dabling, J.; Blada, T.; Dullea, K.; Kuehl, M.; Buerger, S.P. Synthetic Fiber Capstan Drives For Highly Efficient, Torque Controlled, Robotic Applications. In IEEE Robotics and Automation Letters; IEEE: Piscataway, NJ, USA, 2016; pp. 554–561. [Google Scholar]
- Rahmati, Z.; Behzadipour, S. Analysis and Design of a Cable-Driven Mechanism for a Spherical Surgery Robot. In Proceedings of the 2015 22nd Iranian Conference on Biomedical Engineering (ICBME), Tehran, Iran, 25–27 November 2015; pp. 221–226. [Google Scholar]
- Chua, J.Y. Design of a Wearable Cobot; The Florida State University: Tallahassee, FL, USA, 2006. [Google Scholar]
- Lu, Y.; Fan, D. Non-Intervene Cable Wrapping Method for Precise Cable Drive. In Proceedings of the 2012 International Conference on Optoelectronics and Microelectronics, Changchun, China, 23–25 August 2012; pp. 378–383. [Google Scholar]
- Jung, J.H.; Pan, N.; Kang, T.J. Generalized Capstan Problem: Bending Rigidity, Nonlinear Friction, and Extensibility Effect. Tribol. Int. 2008, 41, 524–534. [Google Scholar] [CrossRef]
- Jung, J.H.; Pan, N.; Kang, T.J. Capstan Equation Including Bending Rigidity and Non-Linear Frictional Behavior. Mech. Mach. Theory 2008, 43, 661–675. [Google Scholar] [CrossRef]
- Desai, J.P.; Howe, R.D. Towards the Development of a Humanoid Arm by Minimizing Interaction Forces through Minimum Impedance Control. In Proceedings of the Proceedings 2001 ICRA, IEEE International Conference on Robotics and Automation (Cat. No.01CH37164), Seoul, Korea, 21–26 May 2001; Volume 4, pp. 4214–4219. [Google Scholar]
- Pineda Rico, Z.; Lecchini-Visintini, A.; Quian Quiroga, R. Iterative Feedback Tuning for the Joint Controllers of a 7-DOF Whole Arm Manipulator. In Proceedings of the 2012 IEEE 51st IEEE Conference on Decision and Control (CDC), Maui, HI, USA, 10–13 December 2012; pp. 544–549. [Google Scholar]
- Rico, Z.P. The WAM Arm: Modelling, Control and Its Application in a HMI Based on Gaze Tracking; University of Leicester: Leicester, UK, 2014. [Google Scholar]
- Colome, A.; Planells, A.; Torras, C. A Friction-Model-Based Framework for Reinforcement Learning of Robotic Tasks in Non-Rigid Environments. In Proceedings of the 2015 IEEE International Conference on Robotics Automation (ICRA), Seatle, WA, USA, 26–30 May 2015; pp. 5649–5654. [Google Scholar] [CrossRef] [Green Version]
- Khan, Z.A.; Chacko, V.; Nazir, H. A Review of Friction Models in Interacting Joints for Durability Design. Friction 2017, 5, 1–22. [Google Scholar] [CrossRef] [Green Version]
- Lu, Y.; Fan, D. Transmission Backlash of Precise Cable Drive System. Proc. Inst. Mech. Eng. Part C J. Mech. Eng. Sci. 2013, 227, 2256–2267. [Google Scholar] [CrossRef]
- Baser, O.; Ilhan Konukseven, E. Theoretical and Experimental Determination of Capstan Drive Slip Error. Mech. Mach. Theory 2010, 45, 815–827. [Google Scholar] [CrossRef]
- Werkmeister, J.; Slocum, A. Theoretical and Experimental Determination of Capstan Drive Stiffness. Precis. Eng. 2007, 31, 55–67. [Google Scholar] [CrossRef]
- Xie, X.; Qi, C.; Zhang, L.; Fan, D. Analytical and Experimental Research on Transmission Backlash in Precise Cable Drive for an Electro-Optical Targeting System. Adv. Mech. Eng. 2019, 11, 168781401986605. [Google Scholar] [CrossRef] [Green Version]
- Hwangbo, J.; Tsounis, V.; Kolvenbach, H.; Hutter, M. Cable-Driven Actuation for Highly Dynamic Robotic Systems. In Proceedings of the 2018 IEEE/RSJ International Conference on Intelligent Robots and Systems (IROS), Madrid, Spain, 1–5 October 2018; pp. 8543–8550. [Google Scholar]
- Mohamed, M.I.; Hasan, E.H.; Aggag, G. Study of Creep Behavior of Load Cells. Meas. J. Int. Meas. Confed. 2009, 42, 1006–1010. [Google Scholar] [CrossRef]
- Holdsworth, S.R. Constitutive equations for creep curves and predicting service life. In Creep-Resistant Steels; Elsevier: Amsterdam, The Netherlands, 2008; pp. 403–420. ISBN 9781845691783. [Google Scholar] [CrossRef]
- Makabe, M.; Kohashi, T. High Accurate Creep Compensation Method for Load Cell. In Proceedings of the SICE Annual Conference 2007, Takamatsu, Japan, 17–20 September 2007; pp. 29–36. [Google Scholar]
- Ohtsuka, A.; Koyama, T.; Kohashi, T.; Adachi, M. Digital Creep Compensation Method for Load Cell in Various Loading Patterns. In Proceedings of the ICCAS-SICE 2009, Fukuoka, Japan, 18–21 August 2009; pp. 369–373. [Google Scholar]
- Chao, W.Y.; Xin, H.Y.; Wei, W.; Rong, L.J. Frictional Analysis of Deep-Groove Ball Bearings with Varying Circumference Radial Preloads. Adv. Mech. Eng. 2017, 9, 168781401770389. [Google Scholar] [CrossRef]
- Wang, Y.; Lin, F.; Jiang, H.; Yuan, W. Investigation on Frictional Characteristic of Deep-Groove Ball Bearings Subjected to Radial Loads. Adv. Mech. Eng. 2015, 7, 168781401558611. [Google Scholar] [CrossRef]
Figure 1.
CAD model of the test bench: (1) power source module; (2) transmission module; (3) link module; (4) measurement module.
Figure 1.
CAD model of the test bench: (1) power source module; (2) transmission module; (3) link module; (4) measurement module.

Figure 2.
CAD model of the link module: (1) link coupling plate; (2) disk; (3) additional masses.

Figure 3.
External variable torque: (a) produced by 2 pairs of masses, (b) produced by 4 pairs of masses.
Figure 3.
External variable torque: (a) produced by 2 pairs of masses, (b) produced by 4 pairs of masses.

Figure 4.
Pulley system assembly: (1) shaft; (2) pulley body; (3) bracket; (a) end of the shaft for connection of link module; (b) end of the shaft for encoder clamping.
Figure 4.
Pulley system assembly: (1) shaft; (2) pulley body; (3) bracket; (a) end of the shaft for connection of link module; (b) end of the shaft for encoder clamping.

Figure 5.
CAD model of the motor shaft system: (1) bracket; (2) shaft; (3) tensioner; (a,b) cable connection points; (c) end of the shaft for encoder clamping.
Figure 5.
CAD model of the motor shaft system: (1) bracket; (2) shaft; (3) tensioner; (a,b) cable connection points; (c) end of the shaft for encoder clamping.

Figure 6.
Schematic of the simplified model of a mechanical transmission.

Figure 7.
Speed-torque characteristics for the BXM6400M-A-3 motor.

Figure 8.
Swing arm motor mount: (1) motor body; (2) internal coupling; (3) bearings; (4) external coupling; (5) motor axis; (6) screws; (7) load cell support.
Figure 8.
Swing arm motor mount: (1) motor body; (2) internal coupling; (3) bearings; (4) external coupling; (5) motor axis; (6) screws; (7) load cell support.

Figure 9.
Mounting of load cells.

Figure 10.
Force measurement for 0.994 kg.

Figure 11.
Force measurement for 0.994 kg with and without delay.

Figure 12.
Creep and creep compensation for 1 ≤ t ≤ 10 s.

Figure 13.
Force measured and adjusted by creep for 1 ≤ t ≤ 10 s.

Figure 14.
Control application: speed mode operation.

Figure 15.
Experimental test bench for cable-driven transmission.

Figure 16.
Cable-driven transmission 25–75 G.

Figure 17.
Cable-driven transmission 25–104 X.

Figure 18.
Friction torque of the cable-driven transmission 25–75 G.

Figure 19.
Friction torque of the cable-driven transmission 35–75 G.

Figure 20.
Friction torque of the cable-driven transmission 25–104 X.

Figure 21.
Friction torque of the cable-driven transmission 25–104 P.


Table 1.
DAQ NI USB-6211 SPECIFICATIONS.
| Analog Input | Digital Input | ||
|---|---|---|---|
| Number of channels | 8 differential or 16 single-ended | Number of channels | 4 |
| ADC (Analogue to digital Converter) resolution | 16 bits | Number of counters | 2 |
| Max. single sample rate | 250 kS/s | Resolution | 32 bits |
| Max. multichannel sample rate | 250 kS/s | Internal base clocks | 80 MHz, 20 MHz, 0.1 MHz |
Publisher’s Note: MDPI stays neutral with regard to jurisdictional claims in published maps and institutional affiliations. |
© 2021 by the authors. Licensee MDPI, Basel, Switzerland. This article is an open access article distributed under the terms and conditions of the Creative Commons Attribution (CC BY) license (https://creativecommons.org/licenses/by/4.0/).
Share and Cite
MDPI and ACS Style
Torres Charry, G.; Gómez Mendoza, J.B. An Experimental Test Bench for Cable-Driven Transmission. Machines 2021, 9, 83. https://0-doi-org.brum.beds.ac.uk/10.3390/machines9050083
AMA Style
Torres Charry G, Gómez Mendoza JB. An Experimental Test Bench for Cable-Driven Transmission. Machines. 2021; 9(5):83. https://0-doi-org.brum.beds.ac.uk/10.3390/machines9050083
Chicago/Turabian StyleTorres Charry, Giovanni, and Juan Bernardo Gómez Mendoza. 2021. "An Experimental Test Bench for Cable-Driven Transmission" Machines 9, no. 5: 83. https://0-doi-org.brum.beds.ac.uk/10.3390/machines9050083
Note that from the first issue of 2016, this journal uses article numbers instead of page numbers. See further details here.