Article

ANN-Based Pattern Recognition for Induction Motor Broken Rotor Bar Monitoring under Supply Frequency Regulation

by
Ashish Kumar Sinha
1,
Ananda Shankar Hati
2,*,
Mohamed Benbouzid
3,* and
Prasun Chakrabarti
4
1
Department of Electrical Engineering, Bengal College of Engineering and Technology, Durgapur, West Bengal 713212, India
2
Department of Mining Machinery Engineering, Indian Institute of Technology (Indian School of Mines), Dhanbad 826004, India
3
Institut de Recherche Dupuy de Lôme, UMR CNRS 6027 IRDL, University of Brest, 29238 Brest, France
4
Techno India NJR Institute of Technology, Udaipur 313003, India
*
Authors to whom correspondence should be addressed.
Submission received: 23 March 2021 / Revised: 20 April 2021 / Accepted: 23 April 2021 / Published: 27 April 2021
(This article belongs to the Section Machines Testing and Maintenance)

Abstract

:
The requisite of direct-on-line (DOL) starting for various applications in underground mines subjects the rotor bars of heavy-duty squirrel cage induction motors (SCIMs) to severe stresses, resulting in sustained fault in the rotor bars, unlike the applications where mostly reduced voltage starting is preferred. Furthermore, SCIMs working in underground mines are also affected by unforeseen frequency fluctuations. Hence, the paper proposes a discrete wavelet transform (DWT)-based broken rotor bar detection scheme using the stator current analysis of SCIM when subjected to a frequency regulation (±4% of 50 Hz supply) in steady-state, as prevalent in underground mines. In this regard, the level-seven detailed coefficient obtained by the DWT-based multi-resolution analysis of stator current corresponding to the healthy rotor is compared with that of the faulty rotor to extract the necessary features to identify the fault. Further implementation of the proposed scheme is done using artificial neural network (ANN)-based pattern recognition techniques, wherein both feed-forward backdrops and cascaded forward backdrop type ANNs have been used for fault pinpointing based on the feature extraction results obtained from DWT. The scheme is developed and analysed in MATLAB/Simulink using 5.5 kW, 415 V, 50 Hz SCIM, which is further validated using the LabVIEW-based real-time implementation.

1. Introduction

Pervasive applications, low cost, reasonably small size, ruggedness, and low maintenance requirement have made induction motor (IM) the mainstay of industrial prime movers. However, IMs are subjected to undesirable stresses, resulting in various faults, which may become catastrophic and severely hamper the production if not detected in incipient stages. Therefore, condition monitoring is indispensable for increasing machine availability, reducing consequential damage, and improving operational efficiency [1,2,3].
Of the various undesirable stresses that the IM is subjected to, a broken rotor bar is the most frequent fault that squirrel cage induction motors (SCIMs) encounter in underground coal mine scenarios. This is due to thermal, magnetic, residual, dynamic, mechanical, and environmental stresses arising from overload, supply unbalance, sparking, unbalanced magnetic pull, electromagnetic noise, vibration, manufacturing defects, unbalanced shaft torque, centrifugal forces, loose laminations, contamination, and abrasion [4,5,6,7,8]. Moreover, the rotor bars of heavy-duty SCIMs are stressed thermally and mechanically pertaining to the direct-on-line (DOL) start for various applications in underground coal mines, unlike their applications for serving other industrial needs, wherein mostly reduced voltage starting is preferred [9,10]. Hence, the detection of rotor bar cracks under a supply frequency regulation is exceptionally crucial for the machine’s satisfactory working in the underground coal mines to minimise unwanted downtime.
Condition monitoring is primarily based on transient and steady-state analysis [11,12,13,14,15,16,17,18,19,20,21,22,23,24,25]. Traditional methods for monitoring the rotor health under steady-state conditions include the fast Fourier transform (FFT) based analysis of stator current [11], mechanical vibration [12], axial leakage flux [9], and rotor speed [13]. One of the significant drawbacks of these schemes [9,11,12,13] is their non-applicability to non-stationary signals since FFT is incapable of providing simultaneous time-frequency spectrum analysis [14]. Hence, [9,11,12,13] the fault detection process is miscarried under a frequency regulation, which is a widespread phenomenon in any practical application. Furthermore, another technique is short-time Fourier transform (STFT), which has been in relative use for possible monitoring of non-stationary current and vibration signals. However, STFT suffers from a major drawback in which it severely affects the resolution of the signal. This is due to the fact that the window length of the STFT remains constant throughout the time duration of the signal [14]. The discrete wavelet transform (DWT)-based techniques effectively analyse different spectrums under both the steady-state and start-up transient of an IM, thus establishing DWT-based techniques’ suitability over the FFT- and STFT-based techniques for the rotor fault detection in SCIM [10].
Several cage fault detection techniques based on wavelet transform (WT) have been used recently [16,17,18,19,20,21,22,23,24,25]. The WT-based cage fault detection scheme of soft starter operated motors in the transient state is reported in [16], whereas [17] proposes a spectrum ‘synth’ technique for the detection of the cage and bearing faults in IM. Furthermore, the authors of [18] have analysed the motor start-up current using the wavelet approximation signal that isolates a characteristic component in the case of a broken rotor bar. Authors [19,20] also highlight outer cage fault detection schemes for double cage IM in the transient regime and the drawbacks associated with traditional techniques. All these WT-based methods [16,18,19,20] overcome the primary disadvantage of FFT, i.e., non-applicability in transient state. The rest of the literature [21,22,23,24,25] are situation-centric approaches. Such as the continuous WT-based rotor fault detection scheme [21], recursive wavelet packet technique, and directed acyclic graph support vector machines, which are employed to classify various IM faults [22]. The impact of axial cooling ducts, analysis of texture characteristics, feature extraction, and pattern classification using DWT-based techniques for the rotor fault detection in IM are discussed in [23,24,25]. These WT-based approaches discussed so far have not reported their applicability for non-stationary signals in a steady state.
Moreover, all these DWT-based approaches are complex and computation-intensive. Furthermore, many researchers have dedicated the artificial neural network (ANN) in the recent past towards the design of an effective fault detection algorithm [26,27,28,29]. The works done in [26,27] deploy convolutional neural networks with an inherent adaptive design for the fusion of feature extraction and classification phases of the fault detection into a single learning body. Furthermore, the authors of [28] concentrate on stator winding fault detection using a fuzzy detection system. Moreover, a comprehensive review of ANN-based techniques used to detect bearing damage and broken rotor bars is presented in [29]. Herein, vibration signals are used for feature extraction, followed by a hybrid feature reduction technique. It is evident from the recent research that while some of the works employ FFT for feature extraction, which makes it non-applicable in a transient state, the rest of the work uses the hybrid method on ANN, which is likely to make the computational process highly cumbersome. This, in turn, is likely to make the algorithm execution feature more sluggish.
Furthermore, the excessive use of instrumentation system based filter banks, spectrum analysers, and fuzzy logic approaches make the schemes used in the past highly computation intensive and cumbersome [11,12,13,14,15,16,17,18,19,20,21,22,23,24,25]. This is highly undesirable in certain hazardous work environments such as underground mines.
Hence, the present work’s objective is to propose a simple DWT-based SCIM cage fault detection scheme robust to supply the frequency regulation in underground coal mines. The multi-resolution analysis (MRA) of motor line current signal is employed in the proposed fault detection scheme for the feature extraction using stator current signatures. In this regard, the drawbacks of FFT-based analysis are also examined. The work shows that with the choice of proper mother wavelet and sampling frequency, it is possible to detect the rotor bar crack even by analysing the level-seven detailed coefficient (i.e., [d7]) of DWT under a steady-state frequency regulation. Furthermore, a three-layer ANN of both feed-forward backdrop type and cascade forward backdrop type is examined using different algorithms to design an effective and fast ANN using pattern recognition and curve fitting. The proposed study is carried out in MATLAB/Simulink using 5.5 kW SCIM. The LabVIEW-based real-time implementation is also done as a validation of the proposed fault detection scheme. This proposed approach’s execution requires a minimum instrumentation system compared to the schemes and algorithms used in the available and presented literature [11,12,13,14,15,16,17,18,19,20,21,22,23,24,25], which is highly desirable for the scheme’s reliable working under dusty and hazardous mine environments.

2. Modelling of Rotor Bar Crack Fault

This section presents the rotor bar crack fault simulation for variable frequency fed SCIM using the winding function model.

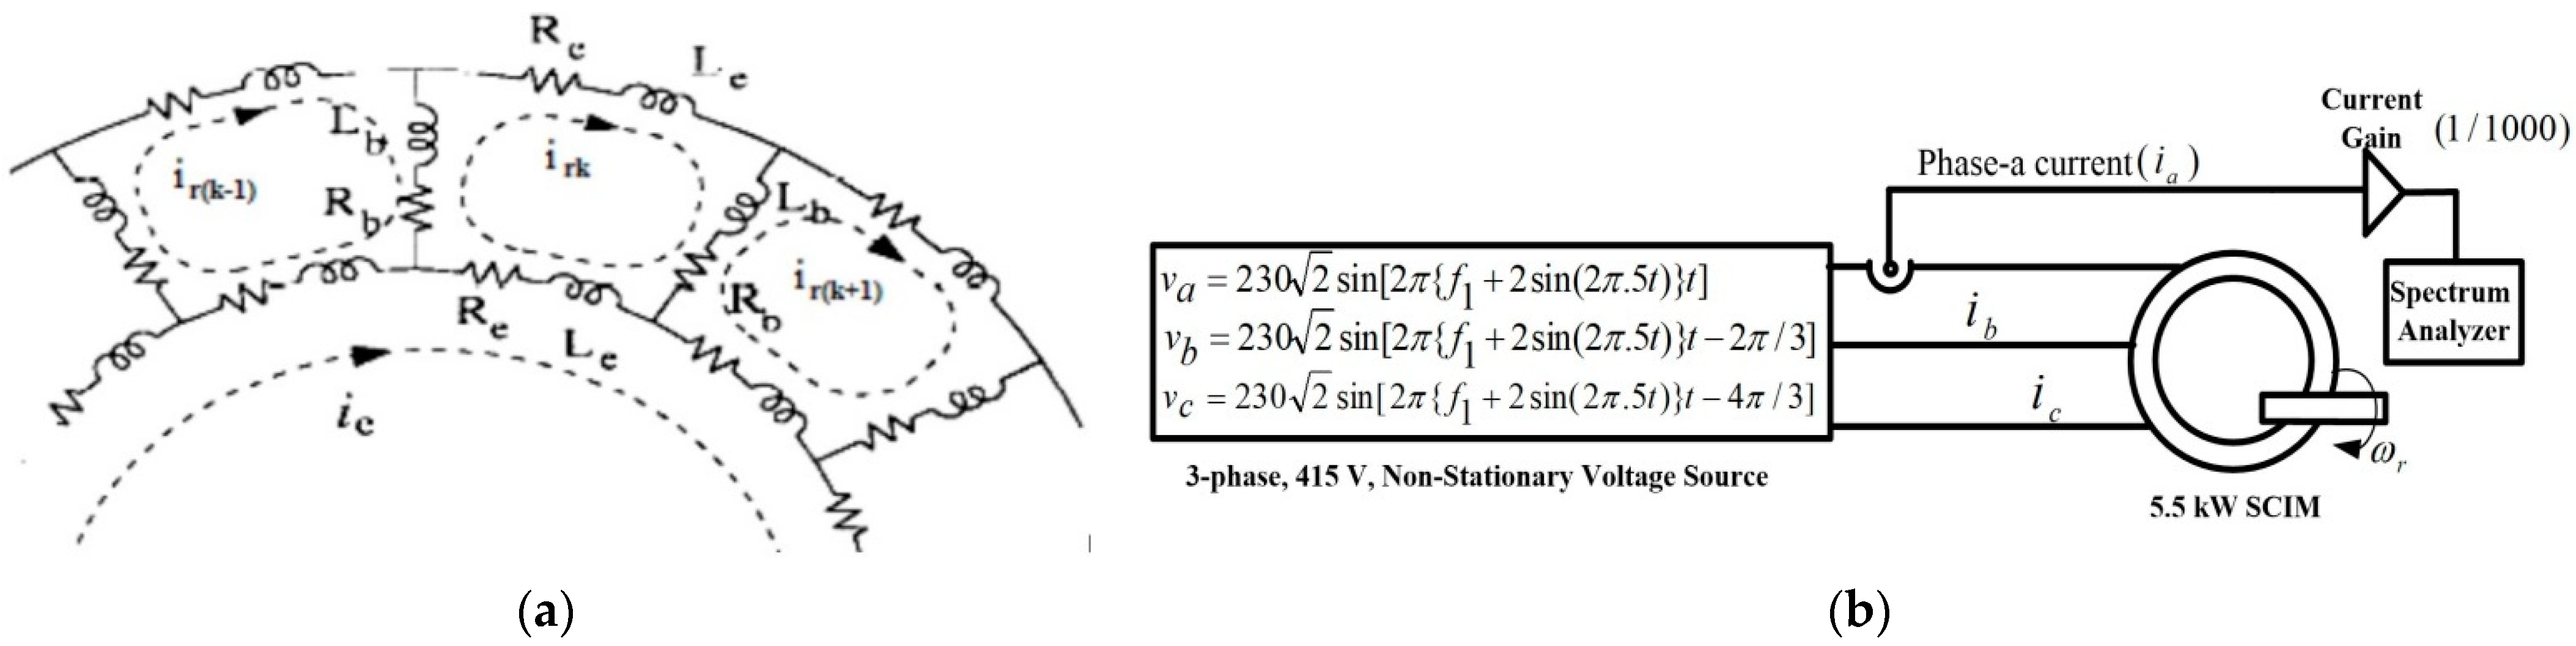
2.1. Winding Function Theory-Based Modelling of SCIM

The winding function theory [30] considers that both stator and rotor consist of multiple inductive circuits coupled together, and the current in each circuit is assumed to be an independent variable. Figure 1a shows the current distribution in the rotor loops. The overall machine model can be represented as:
Stator   voltage :   [ V S ] = [ R S ] [ I s ] + d dt [ φ s ]
Rotor   voltage :   [ 0 ] = [ R r ] [ I r ] + d dt [ φ r ]
Stator   flux :   [ φ S ] = [ L s ] [ I s ] + [ L sr ] [ I r ]
Rotor   flux :   [ φ r ] = [ L sr ] [ I s ] + [ L r ] [ I r ]
Electromagnetic   torque :   T em = [ I s ] T [ d d θ r L sr ] [ I r ]
Elements   of   inductance   matrices   are :   L i j = ( μ 0 l r g ) 0 2 π N I ( θ r , φ ) N J ( θ r , φ ) d φ
For sinusoidal distribution of stator windings, the winding functions for the three phases are given as:
N a ( θ r , φ ) = N s 2 p cos ( p φ )
N a ( θ r , φ ) = N s 2 p cos ( p φ 2 π 3 )
N a ( θ r , φ ) = N s 2 p cos ( p φ   + 2 π 3 )
where the effective number of turns of the stator winding is N S = 4 π NK d K p K s and the actual number of turns of windings is N S 1 =   pN tsp N spp .
For the rotor, the winding function of each rotor loop can be written as:
N k ( θ r , φ ) = {   α r 2 π ,   0 < φ < θ k 1 ( α r 2 π ) ,   θ k < φ < θ k   + 1 α r 2 π ,   θ k   + 1 < φ < θ k
Based on the above winding function theory, the final expressions of the inductances for stator and rotor circuits are given as:
L a =   L b =   L c = ( N s 2 p ) 2 ( π μ 0 Lr g ) =   L ms
L ab =   L bc =   L ca = ( N s 2 p ) 2 ( π μ 0 Lr 2 g ) = L ms 2
L k k = ( μ 0 L r g ) ( 1 α r 2 π ) α r
L k 1 ki = 2 π ( μ 0 Lr g ) α r 2
L ak =   L m cos ( p ( θ r + ( k   1 ) α r +   δ ) )
L bk =   L m cos ( p ( θ r + ( k   1 ) α r +   δ ) 2 π 3 )
L bk =   L m cos ( p ( θ r + ( k   1 ) α r +   δ ) + 2 π 3 )
The fault detection analysis as carried out in the preceding sections is done using the winding function model of SCIM.

2.2. Modelling of SCIM Subjected to Frequency Regulation

In practice, the supply frequency varies within 49.2–50.3 Hz (i.e., roughly by ±1.5% from 50 Hz, as mentioned in the Central Electricity Authority 2010 amendment). In this work, ±4% (worst case) regulation in the nominal frequency is generated by a slowly varying sine wave of frequency 5 Hz and amplitude 2 V in each of the three phases to generate a non-stationary supply (Figure 1b).
This three-phase, 415 V, non-stationary voltage is fed to the 5.5 kW SCIM as designed in MATLAB/Simulink using the winding function theory. The winding function theory is used to design SCIM in the present work pertaining to the simpler nature of the winding function model compared to the other existing models such as the d-q model. This shall make the computation process less complex. The scaled-down (1/1000) phase-a current spectrum (ia), in accordance with the prospective ratings of the spectrum analyser, is used for the proposed cage fault detection scheme.

2.3. Modelling of Rotor Bar Crack

An occurrence of a broken/cracked rotor bar causes variation in the rotor core’s magnetic properties pertaining to the changes in the air-gap properties. This upsurge of the magnetic flux linkages in the rotor bar has affected part of the machine’s definite loading. This additional flux induces eddy currents in the rotor slots [8,14]. Consequently, the machine flux becomes asymmetrical, resulting in an introduction of fault resistance in the rotor circuit, affecting the motor line current spectrum [5]. The incremental rotor resistance (Rinc) with the number of cracked bars can be mathematically expressed as [31]:
R inc = n b ( N 3 )   n b ( 2 N 1 ) 2 N 3 R b
In practice, the contiguous number of cracked bars (nb) is considerably small compared to the number of rotor bars (N). Hence, (1) can be approximated as [32,33]:
R inc = 3 n b N ( 2 N 1 ) 2 N 3 R b
Since nb<<N and the machine are not run in the underground mining setup, it is sent for maintenance as soon as even one damaged bar is detected, hence, (2) is quite applicable for the modelling of cracked rotor bars in the present work.

3. Simulation Results

The present section deals with the FFT, DWT, and ANN results obtained using the designed simulation model.

3.1. FFT-Based Analysis

The crack in the rotor bar is ultimately reflected as side-band frequencies around the principal slot harmonics in the stator current spectrum. These are given as [34]:
f lsb =   f 1 ( 1 2 s ) Hz
f usb =   f 1 ( 1 + 2 s ) Hz  
Otherwise, the side-band frequencies (fsb) around the higher-order slot harmonics can be obtained as [35]:
f sb =   f 1 { k p ( 1   s ) ± s } Hz ,   where ,   k p = 1 , 2 , .
MCSA using FFT is done on the phase-a current signal in MATLAB/Simulink in the following sub-sections [36].

3.1.1. Choice of Sampling Frequency

It is observed that the 6.25 kHz sampling frequency generates prominent side-bands (12) around the principal slot harmonics. Hence, initially, the 6.25 kHz sampling frequency is chosen for the FFT analysis of the phase current. However, it is presented later that the sampling frequency varying in the range of 6.1–6.35 kHz provides similar results.

3.1.2. Analysis of Stationary Current Signal Using FFT

Figure 2a shows a scaled-down phase current signal of 5.5 kW SCIM with one bar cage fault under constant frequency (50 Hz) and full load torque (35 Nm). Figure 2b shows the corresponding FFT spectrum, which illustrates the presence of dominant fault side-bands (flsb and fusb appearing at 45 and 54 Hz, respectively) with 3.49 and 3.65% amplitudes w.r.t fundamental (i.e., 50 Hz). According to (14), dominant fault side-band magnitudes Alsb and Ausb must occur within 45–47 and 53–55 Hz, respectively, depending on the 3–5% variation in the machine slip. Therefore, MCSA using FFT produces precise and expected outcomes under a constant frequency operation.
Similar tests have also been carried out with the motor, subjected to a stationary supply frequency, operating at 50% of rated load torque (i.e., 17.5 Nm), and the results obtained are similar to those obtained when the motor is running at a rated load torque.

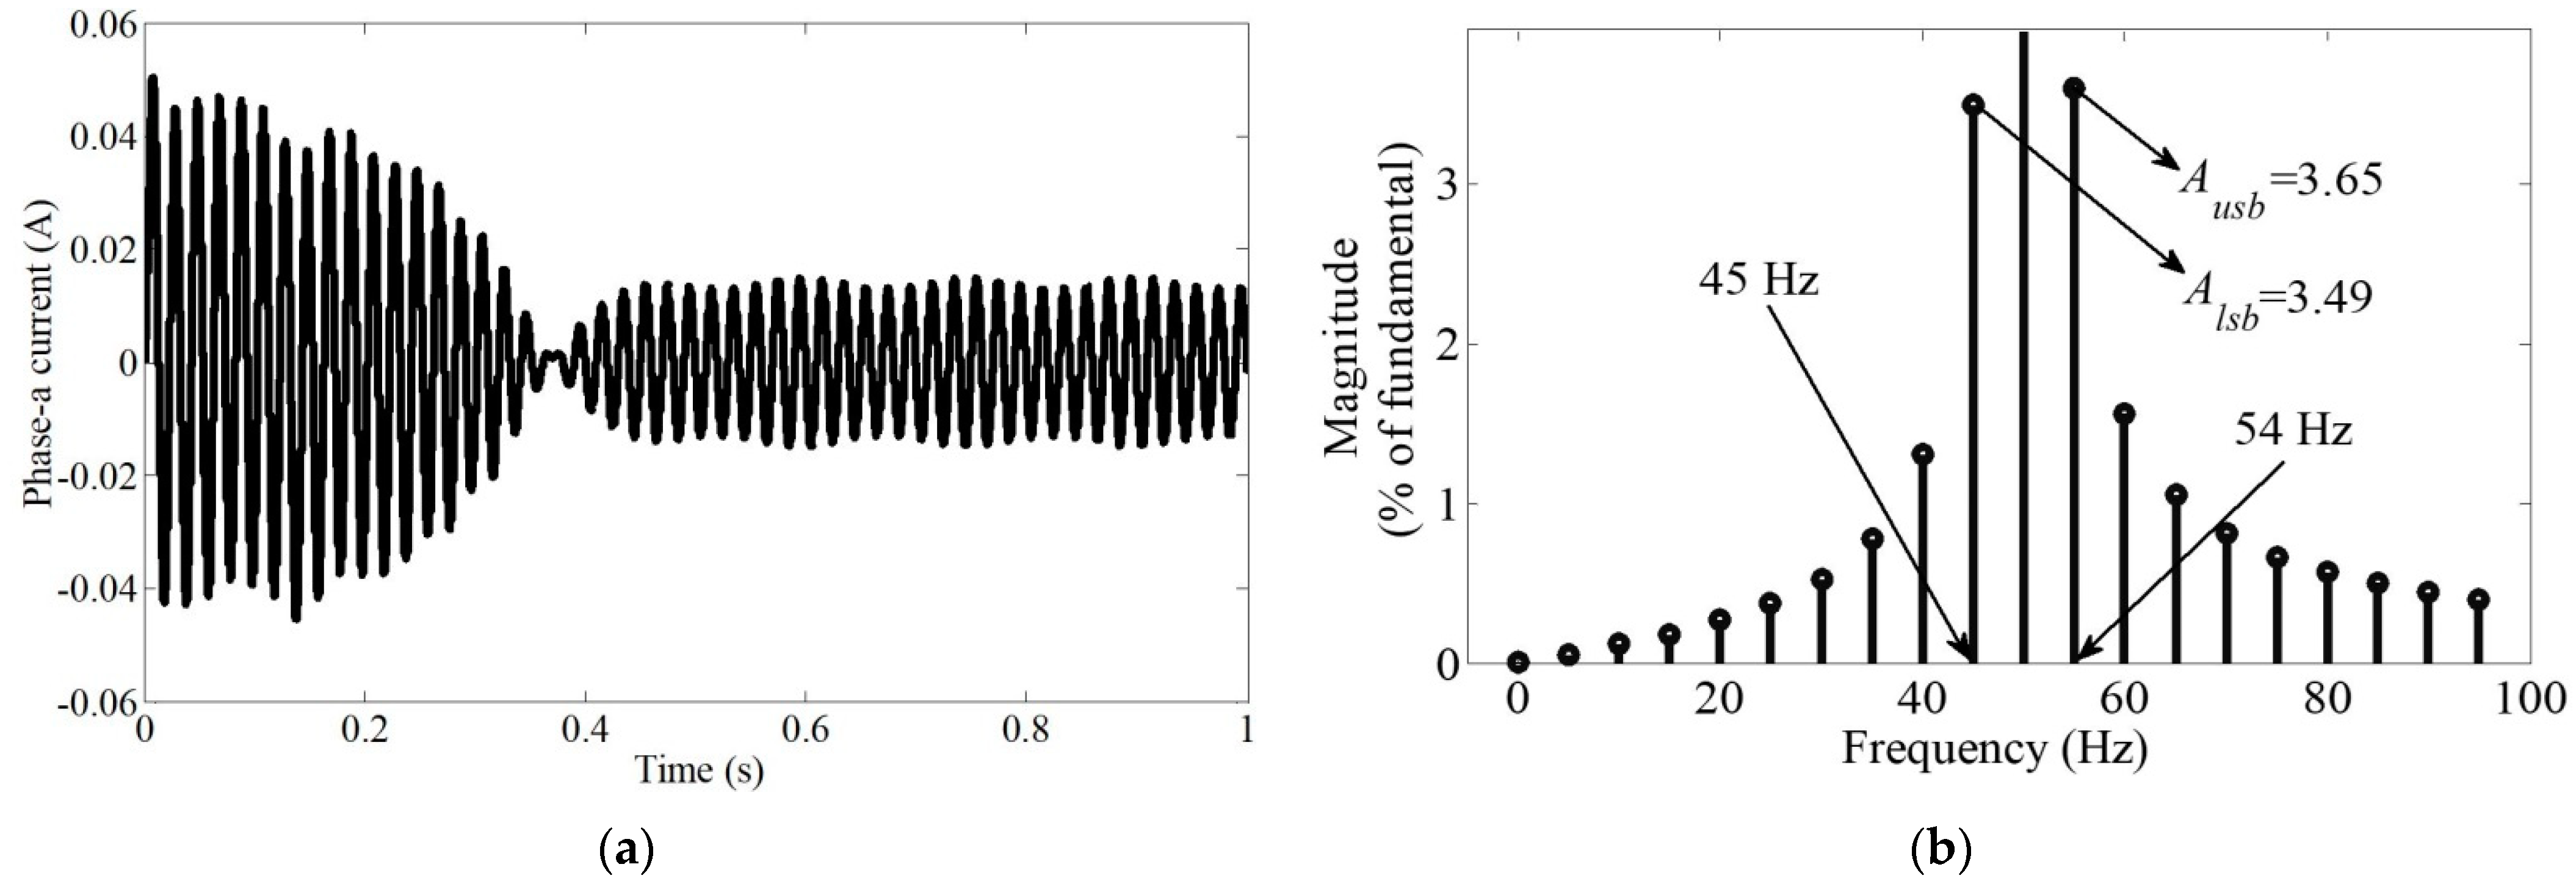
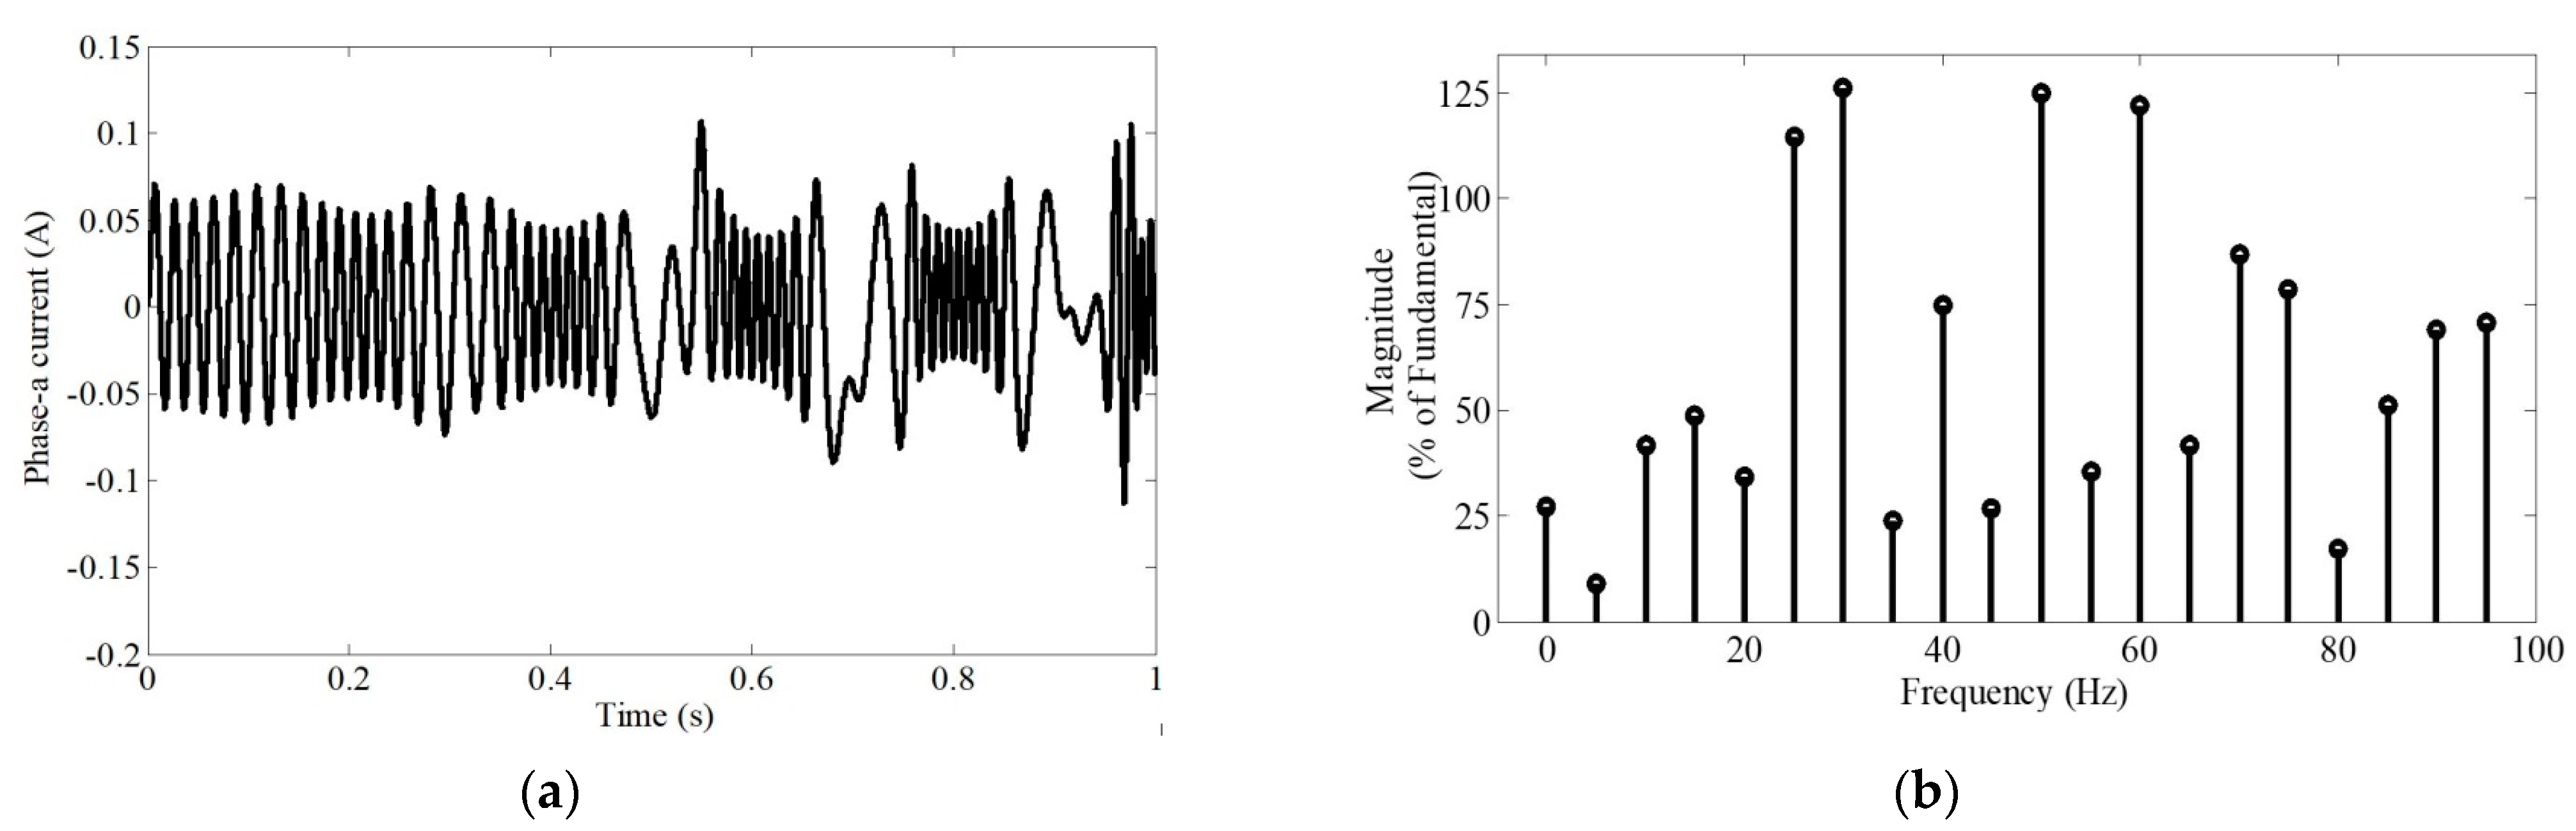
3.1.3. Analysis of Non-Stationary Current Signal

In practice, the supply frequency does not remain constant. Moreover, it keeps varying by ±1.5% (approx.) around the fundamental frequency (50 Hz in the present case), resulting in a non-stationary current waveform. The Simulink model generates a typical scaled-down non-stationary phase-a current under a full load torque with ±4% frequency regulation (worst case) (Figure 1b) and is shown in Figure 3a.
Figure 3b shows the corresponding FFT-based amplitude spectrum of the non-stationary phase current (Figure 3a) when fed to a SCIM under a cage fault operating at a rated load torque. Since no prevailing fault side-band amplitudes exist in Figure 3b as per (14) hence, the cage fault under such circumstances cannot be detected using the FFT analysis. This demands an alternative solution to detect the cage fault of SCIM under a frequency regulation in a steady state. The following sub-sections present the DWT-based MRA of motor line current spectrum. Moreover, similar tests have also been carried out with the motor, subjected to a non-stationary supply frequency, operating at 50% of rated load torque (i.e., 17.5 Nm), and the results obtained are similar to those obtained when the motor is running at the rated load torque.

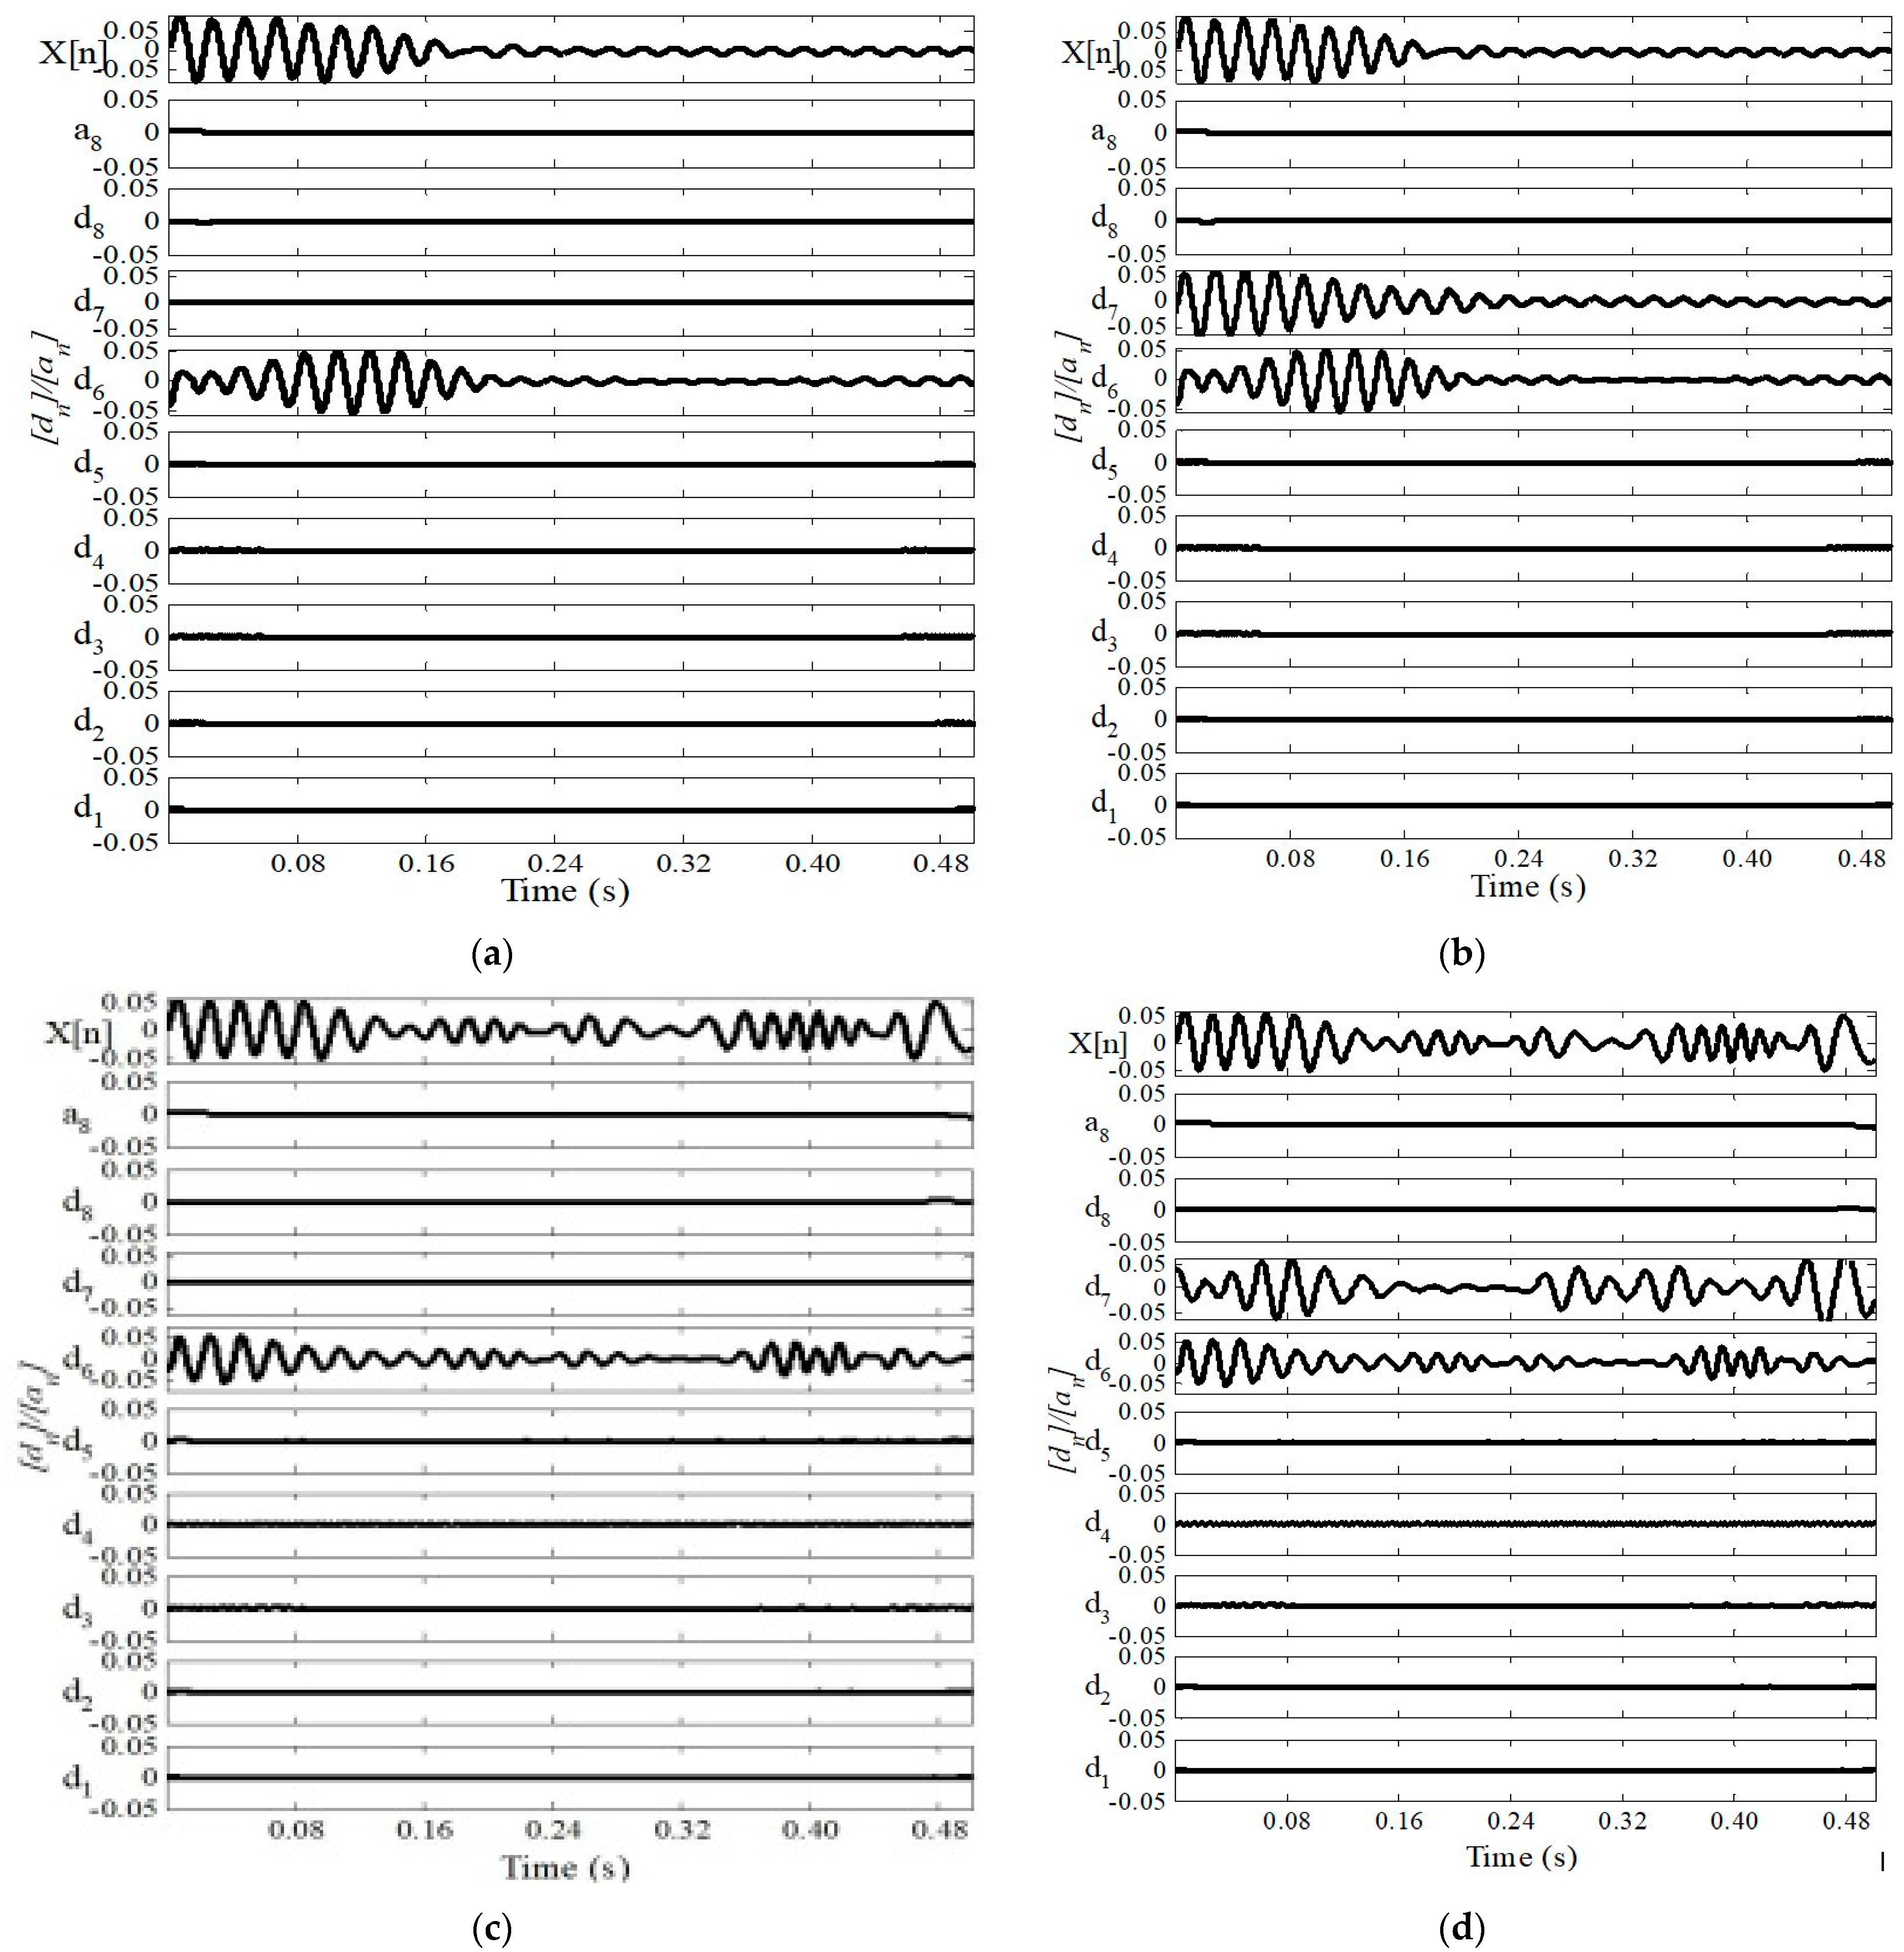
3.2. DWT-Based MULTI-Resolution Analysis

The discrete wavelet transform (DWT)-based multi-resolution analysis (MRA) [37] decomposes a signal X[n] into several sub-bands known as detailed and approximated signals, with each corresponding to different frequency bands as [31]:
X [ n ] = j [ a n ] ϕ j [ n ] + n   = 1 L   1 j [ d n ] ψ n , j [ n ]
where ϕ and ψ are the scaling function and mother wavelet, respectively, and n is the discrete sample number. In addition, [an] and [dn] are the approximated and detailed coefficients, respectively that correspond to different frequency bands (in the present work) depending upon the scaling function and the mother wavelet defined as:
ϕ j [ n ] = 2 L / 2 ϕ ( 2 n     j )   [ i . e . ,   scale   of   2   which   is   shifted   by   j   samples ]
Ψ j [ n ] = 2 L / 2 Ψ ( 2 L n     j )   [ i . e . ,   scale   of   2 L ,   also   shifted   by   j   samples ]
The MRA of the electrical signal can provide coincident information on the presence of a certain frequency component in the spectrum and the time of its occurrence. Therefore, the DWT-based MRA can be effectively used as an online condition monitoring tool.

3.2.1. Choice of Sampling Frequency for DWT Analysis

The frequency bands corresponding to the detailed and approximated signals at each level obtained using MRA are contingent upon the sampling frequency and the maximum number of decomposition levels. The corresponding frequency bands can be obtained as [0, 2 ( L   + 1 ) ] and [ 2 ( n   + 1 ) F s , 2   n F s ], respectively [31].
Table 1 shows the numerical values of the frequency bands of the detailed and approximated signals for different sampling frequencies.
As observed from Table 1, the desired side-band frequencies (i.e., 45–47 and 53–55 Hz as per (14)) in the line current spectrum for SCIM under cage fault lie in different detailed coefficients, i.e., [d7] and [d6] coefficients, respectively. This corresponds to the sampling frequencies in the range of 6100 to 6350 Hz. Isolation of fault frequency components in different detailed coefficients is highly desirable in contention with ambiguity-less fault detection. In practice, the sampling frequency may not remain fixed due to the sampler’s variation of parameters. Hence, the analysis reveals that any sampling frequency within the specified range is suitable for the proposed fault detection scheme’s satisfactory execution. However, in the present work, a 6250 Hz sampling frequency is used.

3.2.2. Choice of Mother Wavelet and Number of Decomposition Levels

The choice of a suitable mother wavelet is a crucial aspect of the proposed DWT-based fault detection scheme. It is done by computing the correlation coefficients of a particular mother wavelet with the signal of interest [38]. It has been observed that the correlation coefficients as calculated for ‘db41’ with a stationary current signal and ‘sym34’ with a non-stationary current signal are 0.87 and 0.90, respectively, which are closest to unity in comparison to the other mother wavelets. Hence, ‘db41’ is used to analyse the stationary current signal, whereas ‘sym34’ is used to analyse the present work’s non-stationary current signal.
Further, the number of maximum decomposition levels for the proposed scheme can be obtained as [39]:
L log ( F s f 1 ) log 2 + 1
L   =   n f + 2
Based on (26) and (27), it is found that each of ‘dB41’ and ‘sym34’ with the 8th level of decomposition is sufficient to carry out MRA of both the stationary and non-stationary current signals, respectively.

3.2.3. Analysis of Stationary and Non-Stationary Current Signals by DWT for a Motor operating at Variable Load

Figure 4 shows the approximated and detailed coefficients for the 8th level decomposition of the phase-a current signal of stationary and non-stationary natures under both the healthy and faulty cases when the motor is operating at a rated load torque (i.e., 35 Nm). The analysis reveals that [d1]-[d5], [d8], and [a8] do not contain any substantial ripple in any case (Figure 4a–d), since the magnitudes of the other fault side-band frequencies around the other higher-order slot harmonics are progressively smaller and hence, are not reflected in [d1]-[d5], while [d8] and [a8] represent the low-frequency bands (less than the fundamental frequency).
Hence, these coefficients are not of great concern in the process of fault detection. On the contrary, the presence of significant undulations, as shown in Figure 4b,d, correspond to the frequency bands of 49–97 and 24–48 Hz, respectively, as per Table 1 under the faulty cage. Hence, it is established that the upper and lower side-band frequencies (54 and 45 Hz) around the principle slot harmonics (50 Hz) of line current spectrum lie in [d6] and [d7], respectively, during the cage fault. The amplitudes of variations in such cases are appreciably higher than those for the healthy cases, as shown in Figure 4a,c due to the presence of both the upper side-band and principal slot harmonics. Furthermore, Figure 4a,c shows the nonexistence of any variation of [d7], which indicates the absence of the lower side-band frequency around the principle slot harmonic under the healthy motor condition. In contrast, the variation as reflected in [d6] is similar (having lesser magnitude) to the faulty one (Figure 4b,d) owing to the presence of principal slot harmonics only.
Finally, there is a distinct difference in both the nature and amplitude of [d7] for the healthy and the faulty conditions of the SCIM (Figure 4). Therefore, the point-to-point standard deviation of [d7] is considered for the fault detection algorithm’s edifice in the present work.

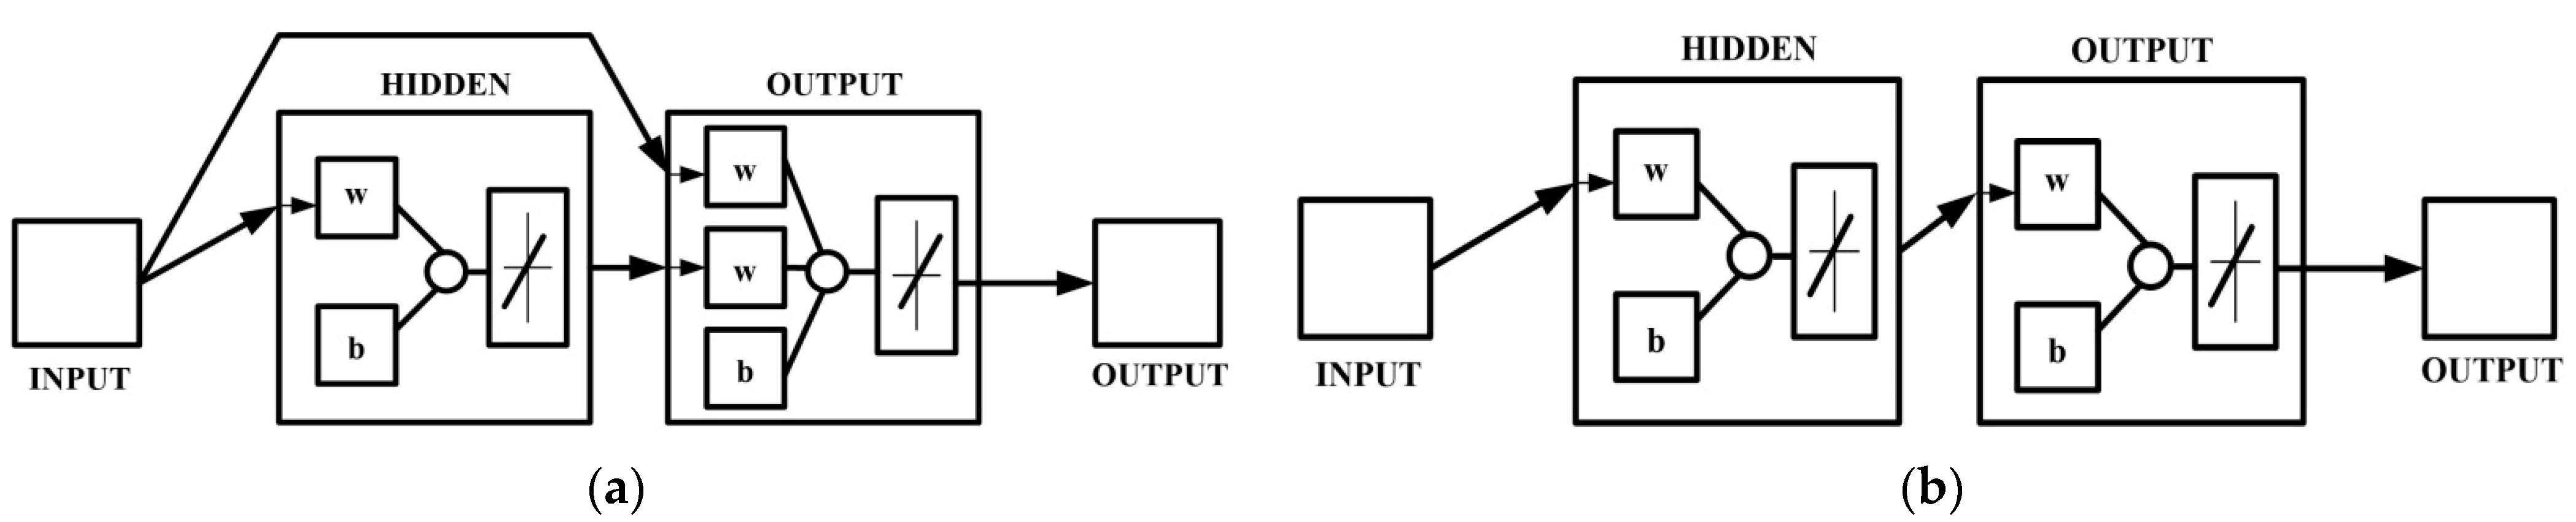
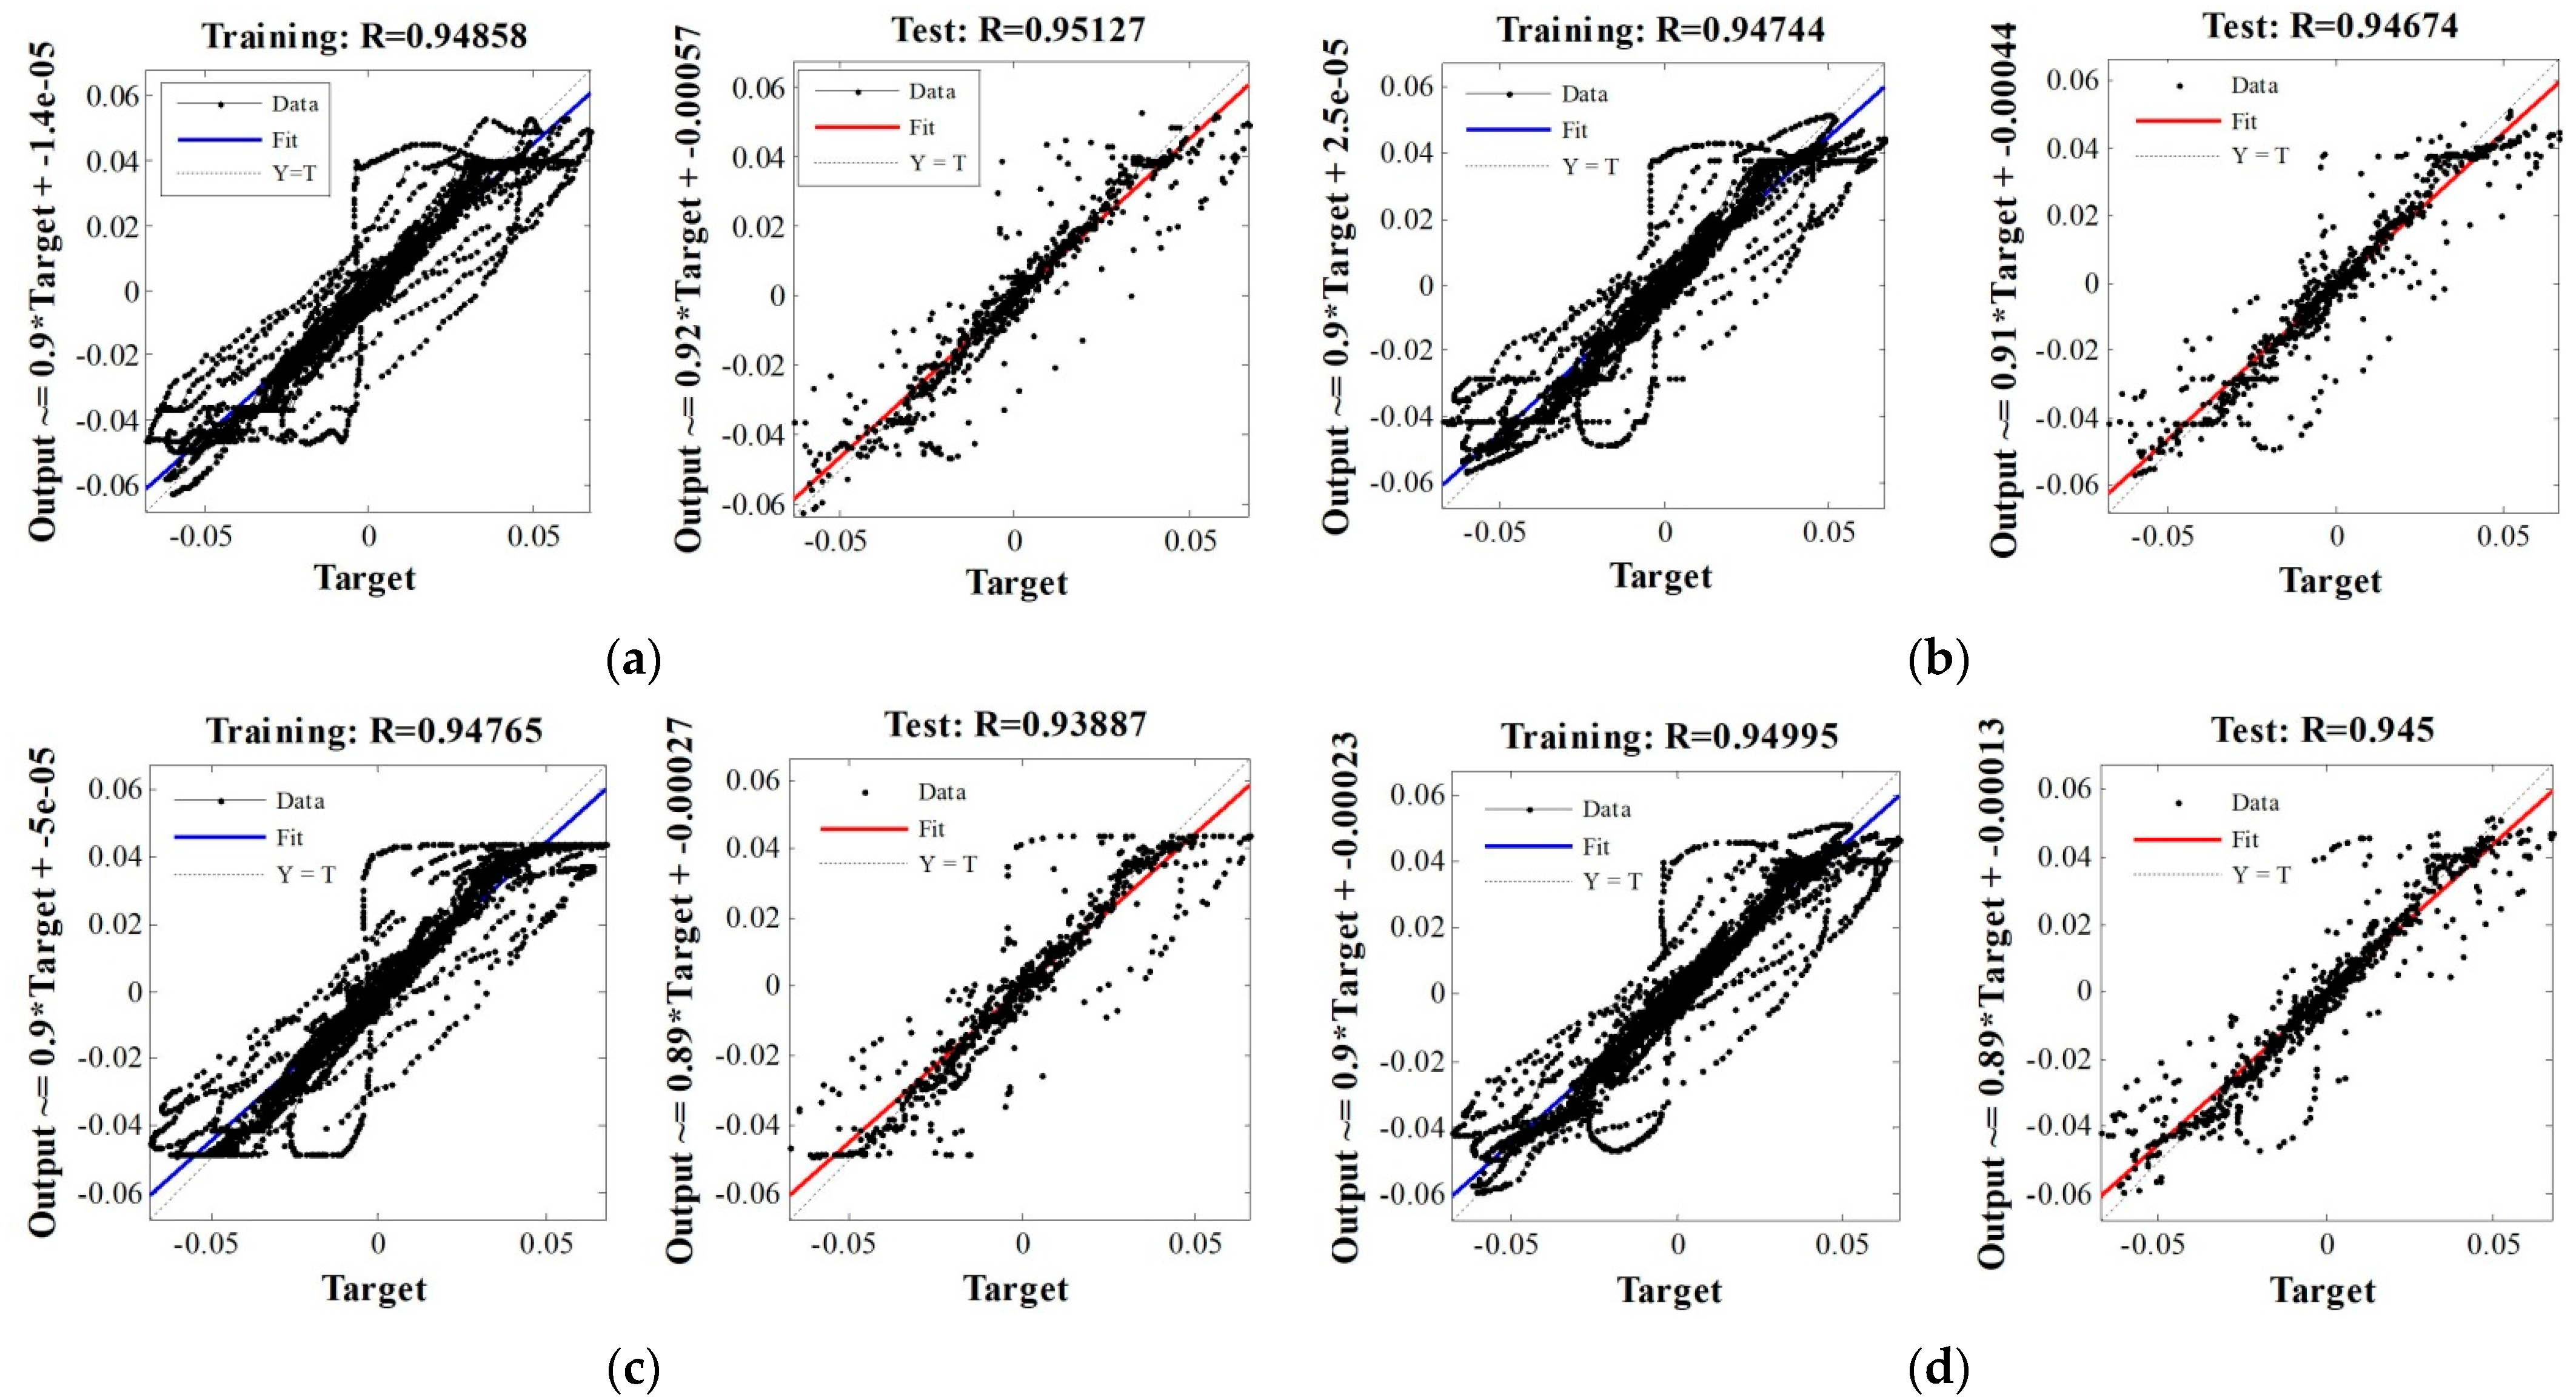
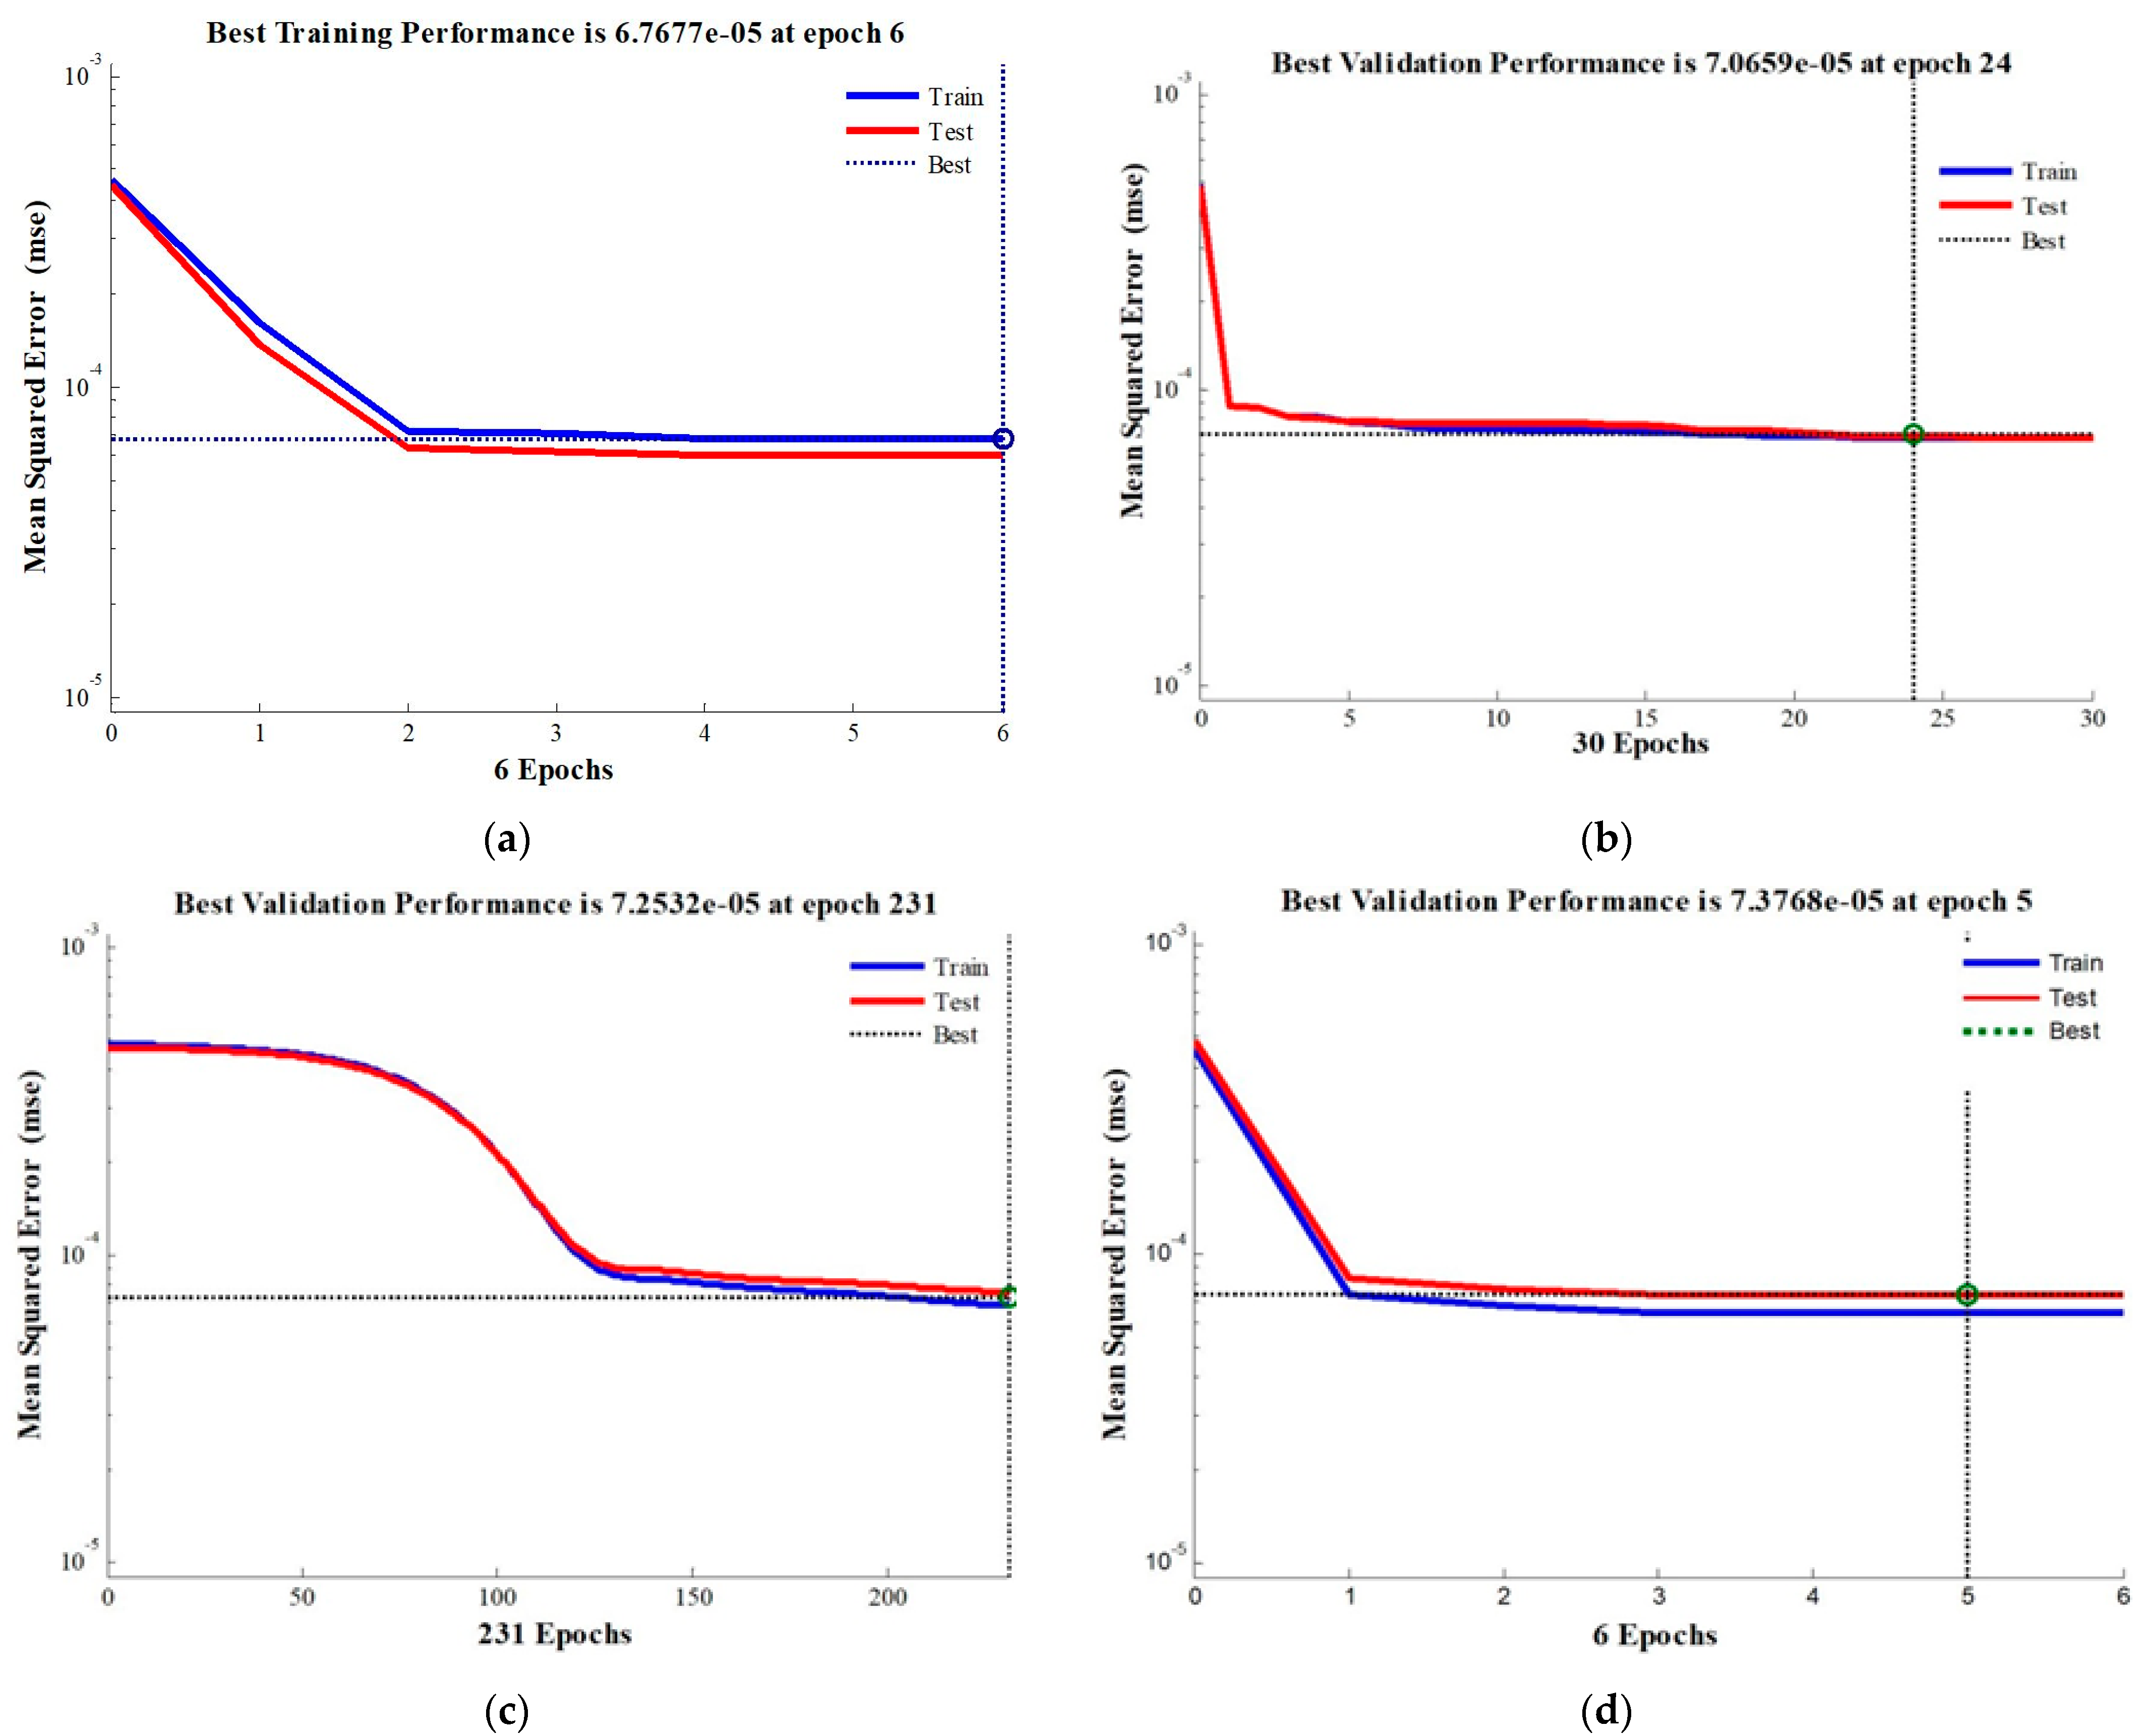
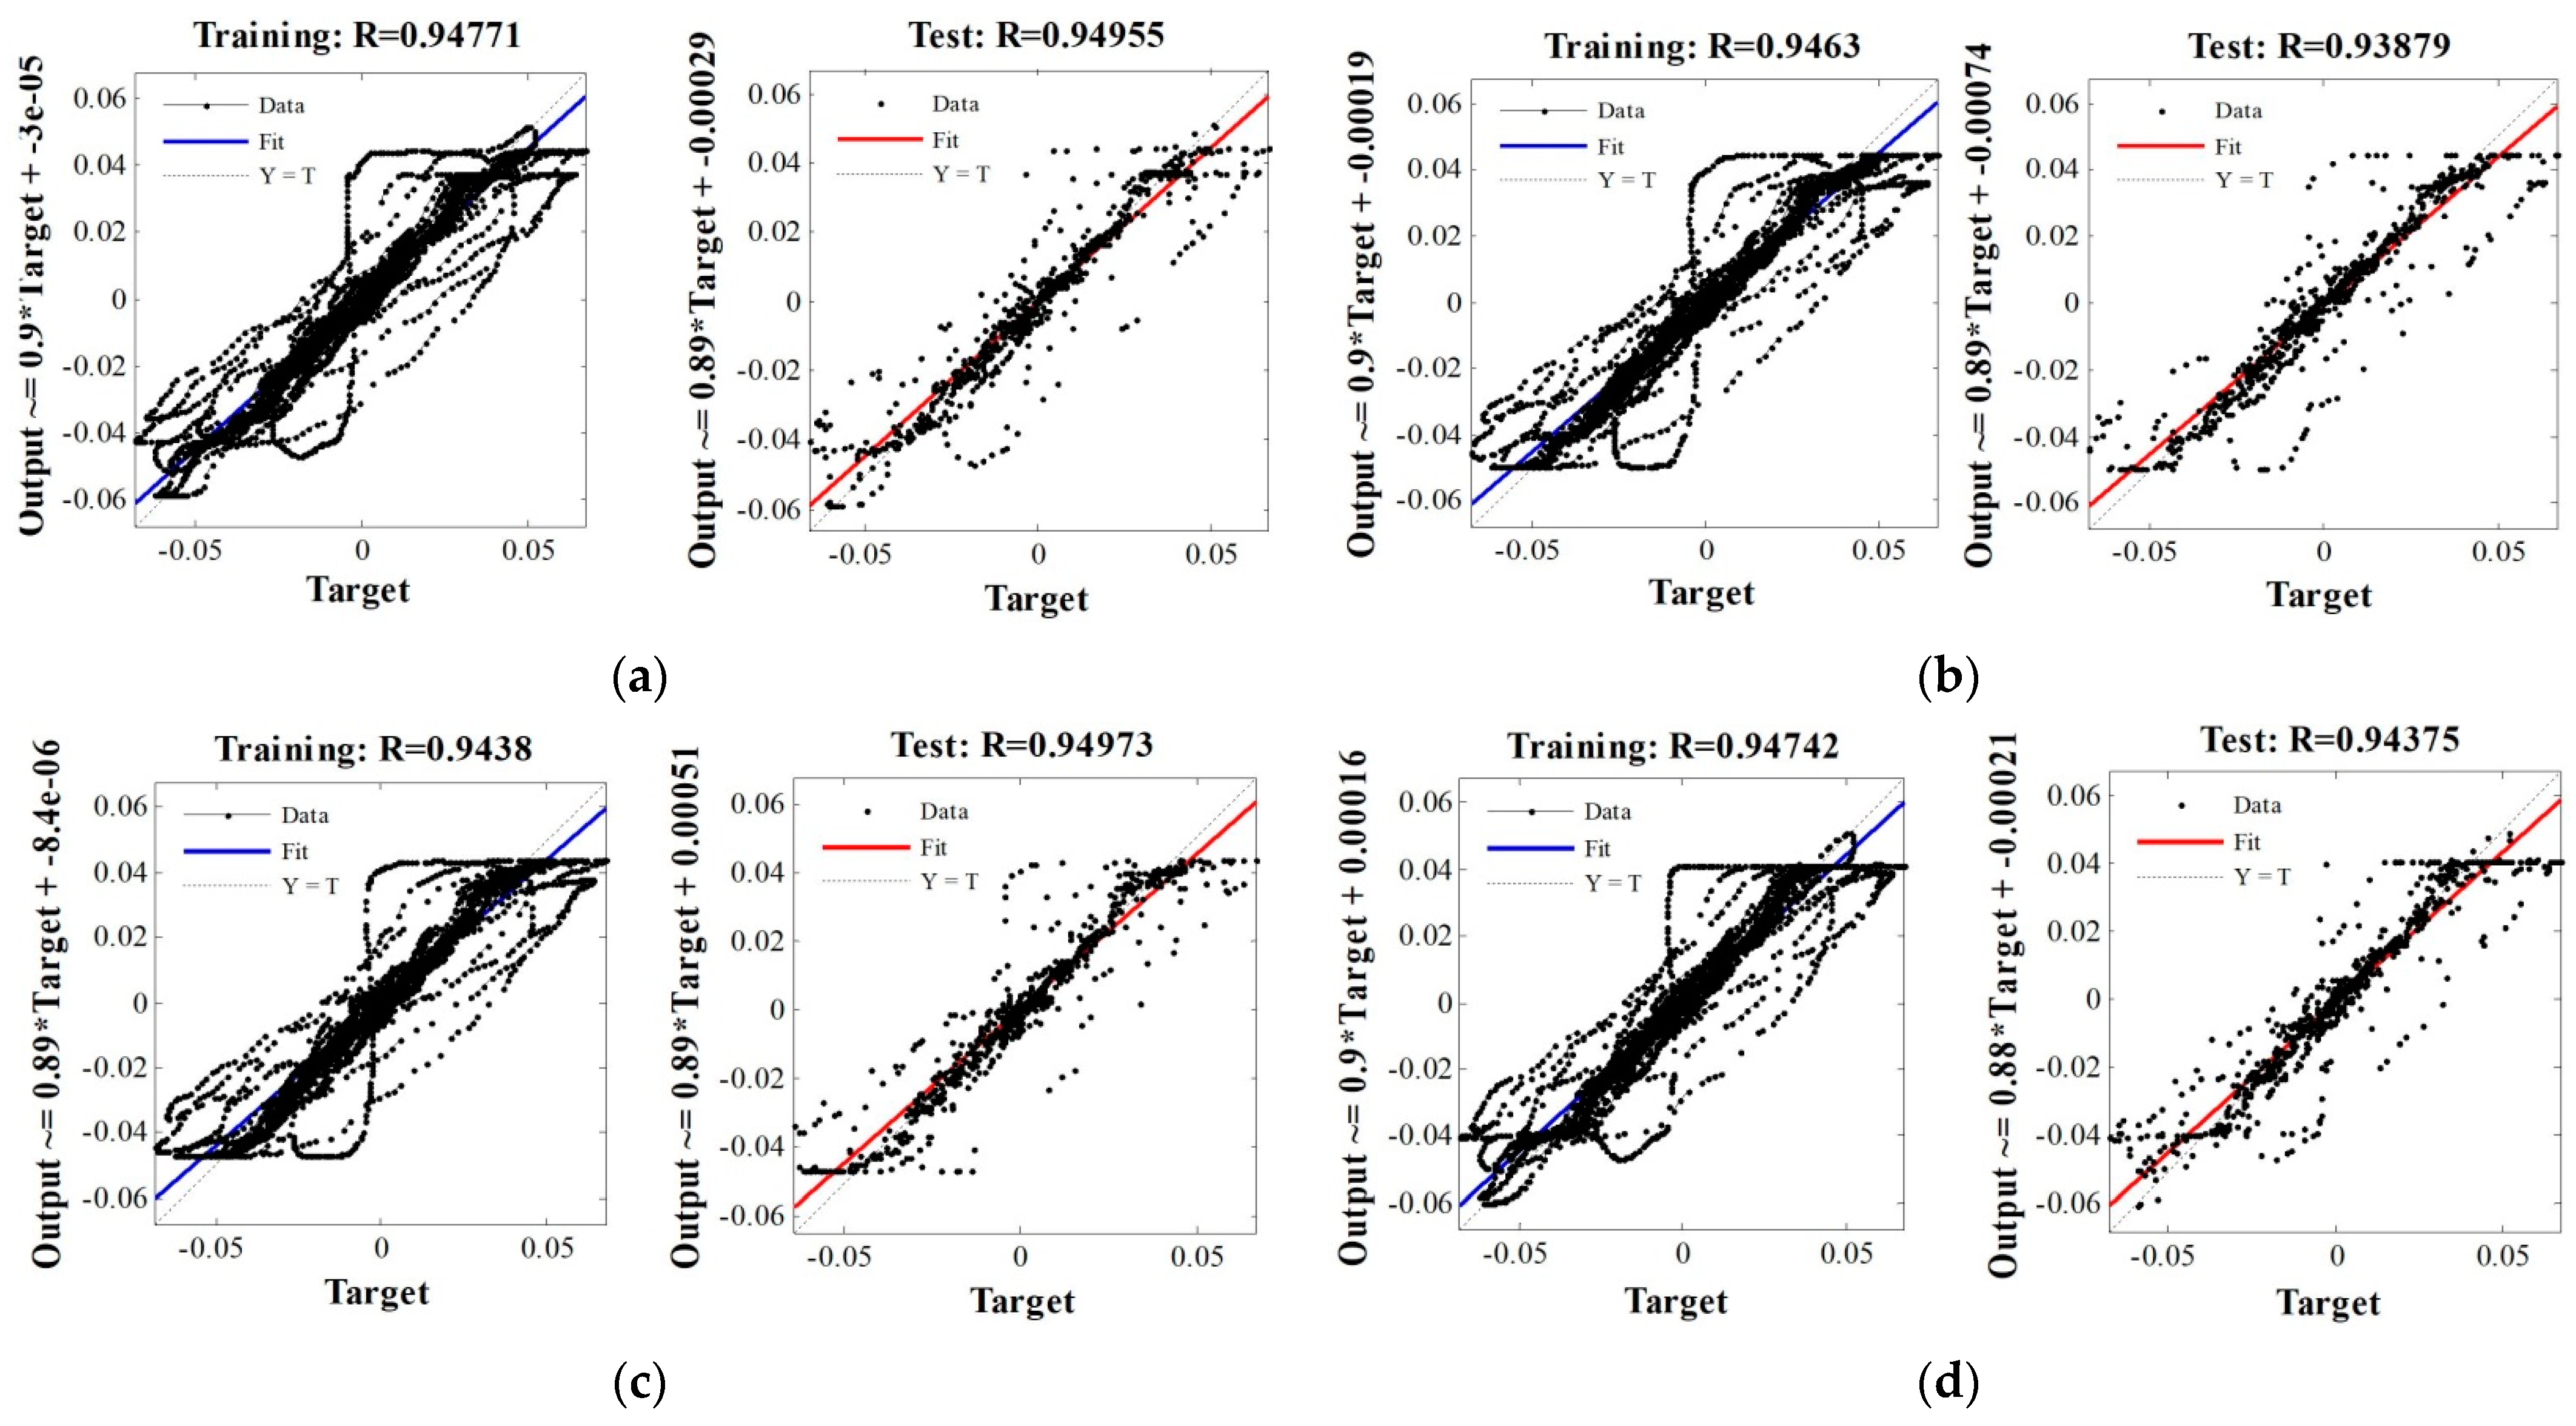
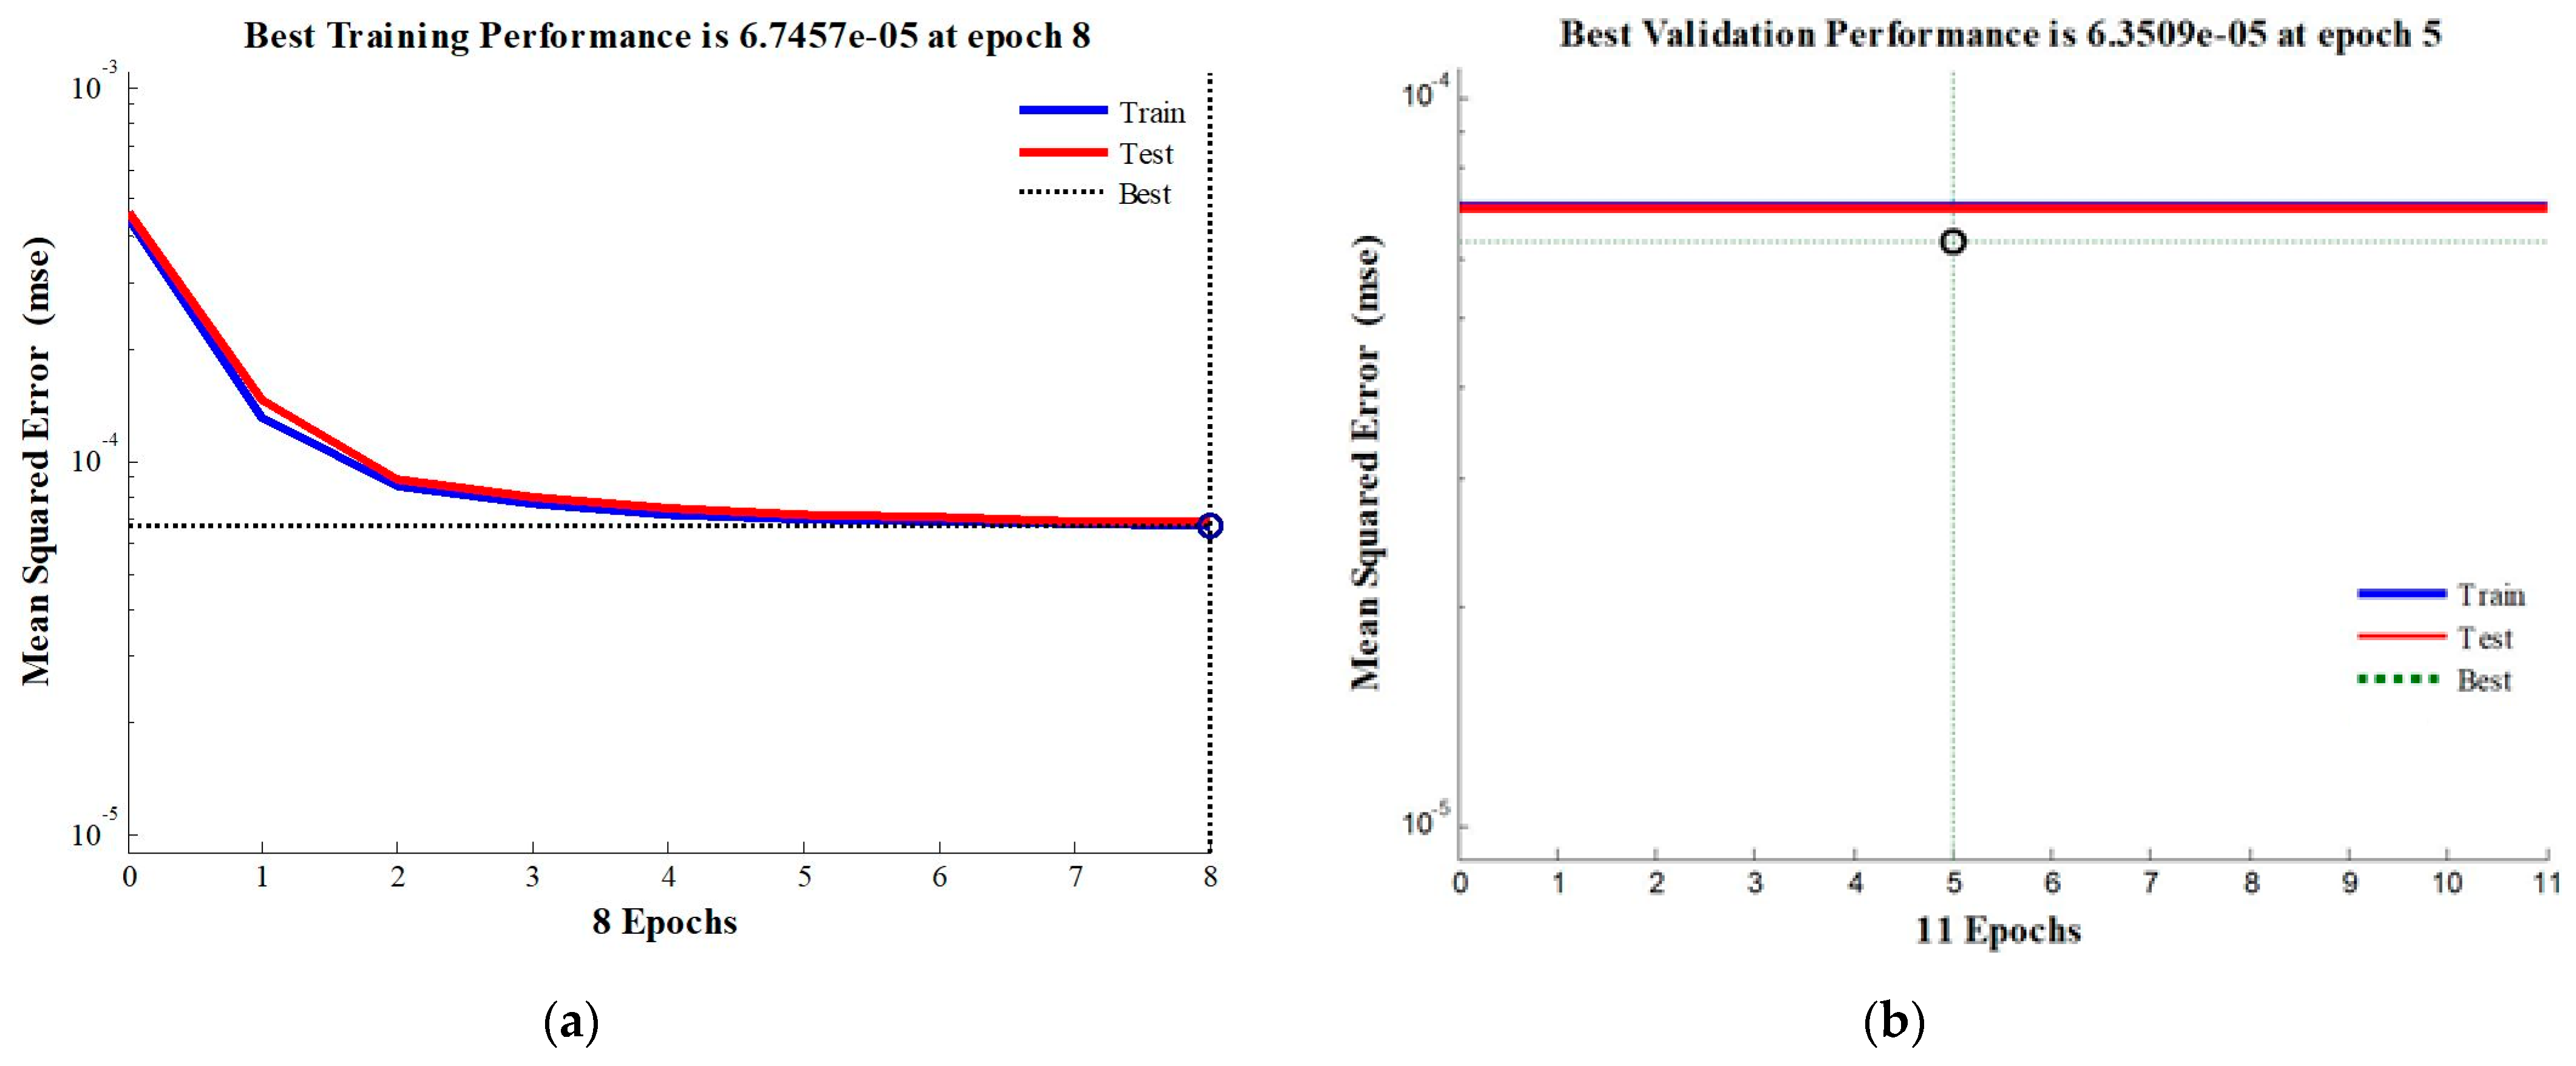
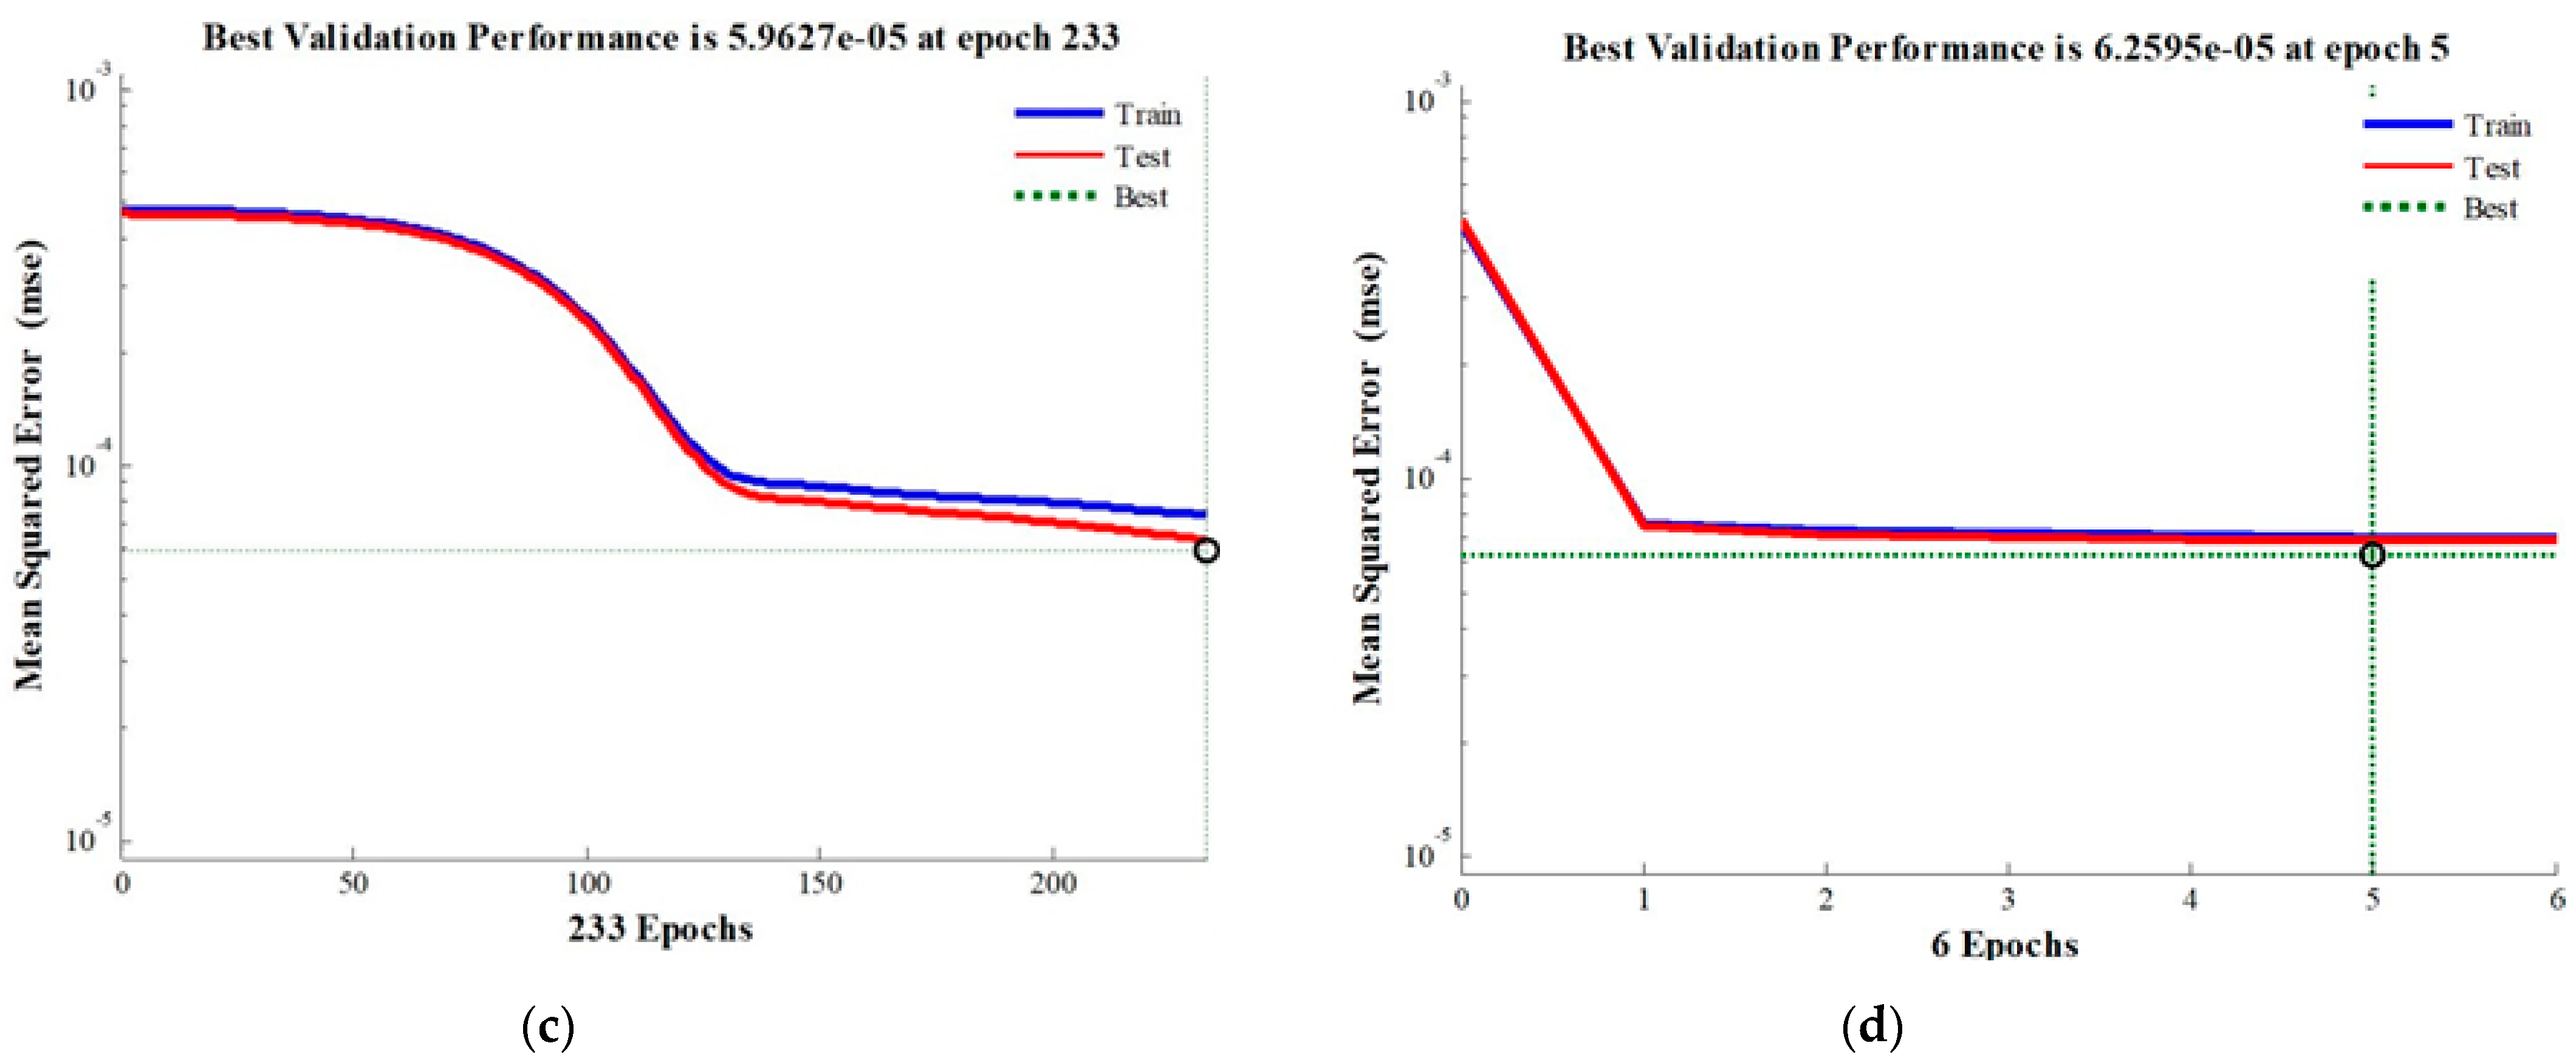
3.3. ANN-Based Analysis

It is evident from the results obtained in Section 3.2 that the instantaneous values of [d7] detailed coefficient are a good indicator of the broken/cracked rotor bar damage. Hence, the instantaneous values of the [d7] detailed coefficient are used for the training of the ANN. A three-layered ANN having 10 neurons in each layer is designed in the present work. Two types of ANN are designed and tested in the present work using cascaded forward backdrop and feed-forward backdrop-based designs, as shown in Figure 5a,b, respectively [14,27,29,31,40,41,42,43,44,45].
ANN training is done using four different algorithms: Bayesian Regulation, Polak-Ribiere Restarts, Gradient Descent with momentum and adaptive learning rate, and finally, Levenberg Marquardt algorithm. The pattern recognition technique is used to identify broken rotor bars using the value of coefficients of correlation (R) of curve fitting between the input and the target values. The main motive behind using the pattern recognition-based curve fitting technique is that it is one of the most trivial ways of identifying a curve pattern. Furthermore, the drastic difference in the nature of the curve corresponding to a faulty induction machine to that corresponding to a healthy induction machine makes the process of pattern recognition all the more effective. Moreover, the use of epochs to check the point of convergence is in direct contention with the fast detection of faults that is indispensible w.r.t. for the process of fault detection, as it helps minimise the damage of an induction machine due to prolonged subjection to a prospective fault. Figure 6 shows the pattern recognition-based curve fitting diagram for the different algorithms using the cascaded forward backdrop type of ANN.
It is seen from Figure 6 that the maximum value of the coefficient of correlation is achieved for Bayesian Regulation. However, the choice of the apt algorithm for the proposed ANN cannot be made based solely on the value of the coefficient of correlation. Another critical factor in the selection of the algorithm is the epoch value of mean square error. The value of the mean square error for the different algorithms is shown in Figure 7. It is seen from Figure 7 that the mean square error reaches the minimum value at the earliest on Epoch 5 for the Lavenberg-Marquardt algorithm.
Based on the results obtained in Figure 6 and Figure 7, it is inferred that both the Bayesian Regulation and Levenberg-Marquardt algorithm give highly satisfactory results in the present work. Furthermore, a similar test is done using the feed-forward backdrop type ANN, and the results are compiled in Figure 8 and Figure 9 for the curve fitting diagram and mean square diagram, respectively.
It is seen from Figure 8 and Figure 9 that both Bayesian Regulation and Levenberg-Marquardt algorithm give highly satisfactory results both in terms of the values of coefficient of correlation and the mean square error values. The values of mean square errors and coefficient of correlation for the different algorithms are further tabulated in Table 2.
It is clear from the values encapsulated in Table 2 that the best results in terms of coefficient of correlation, mean square error, and epoch value are obtained using the Levenberg-Marquardt algorithm. Moreover, it is also seen that the obtained values are better in the case of the cascaded forward backdrop type of ANN than compared to the feed-forward backdrop type of ANN. Hence, the cascaded forward backdrop type ANN with Levenberg-Marquardt algorithm is used in the present work for the detection of broken rotor bars using pattern recognition and curve fitting.

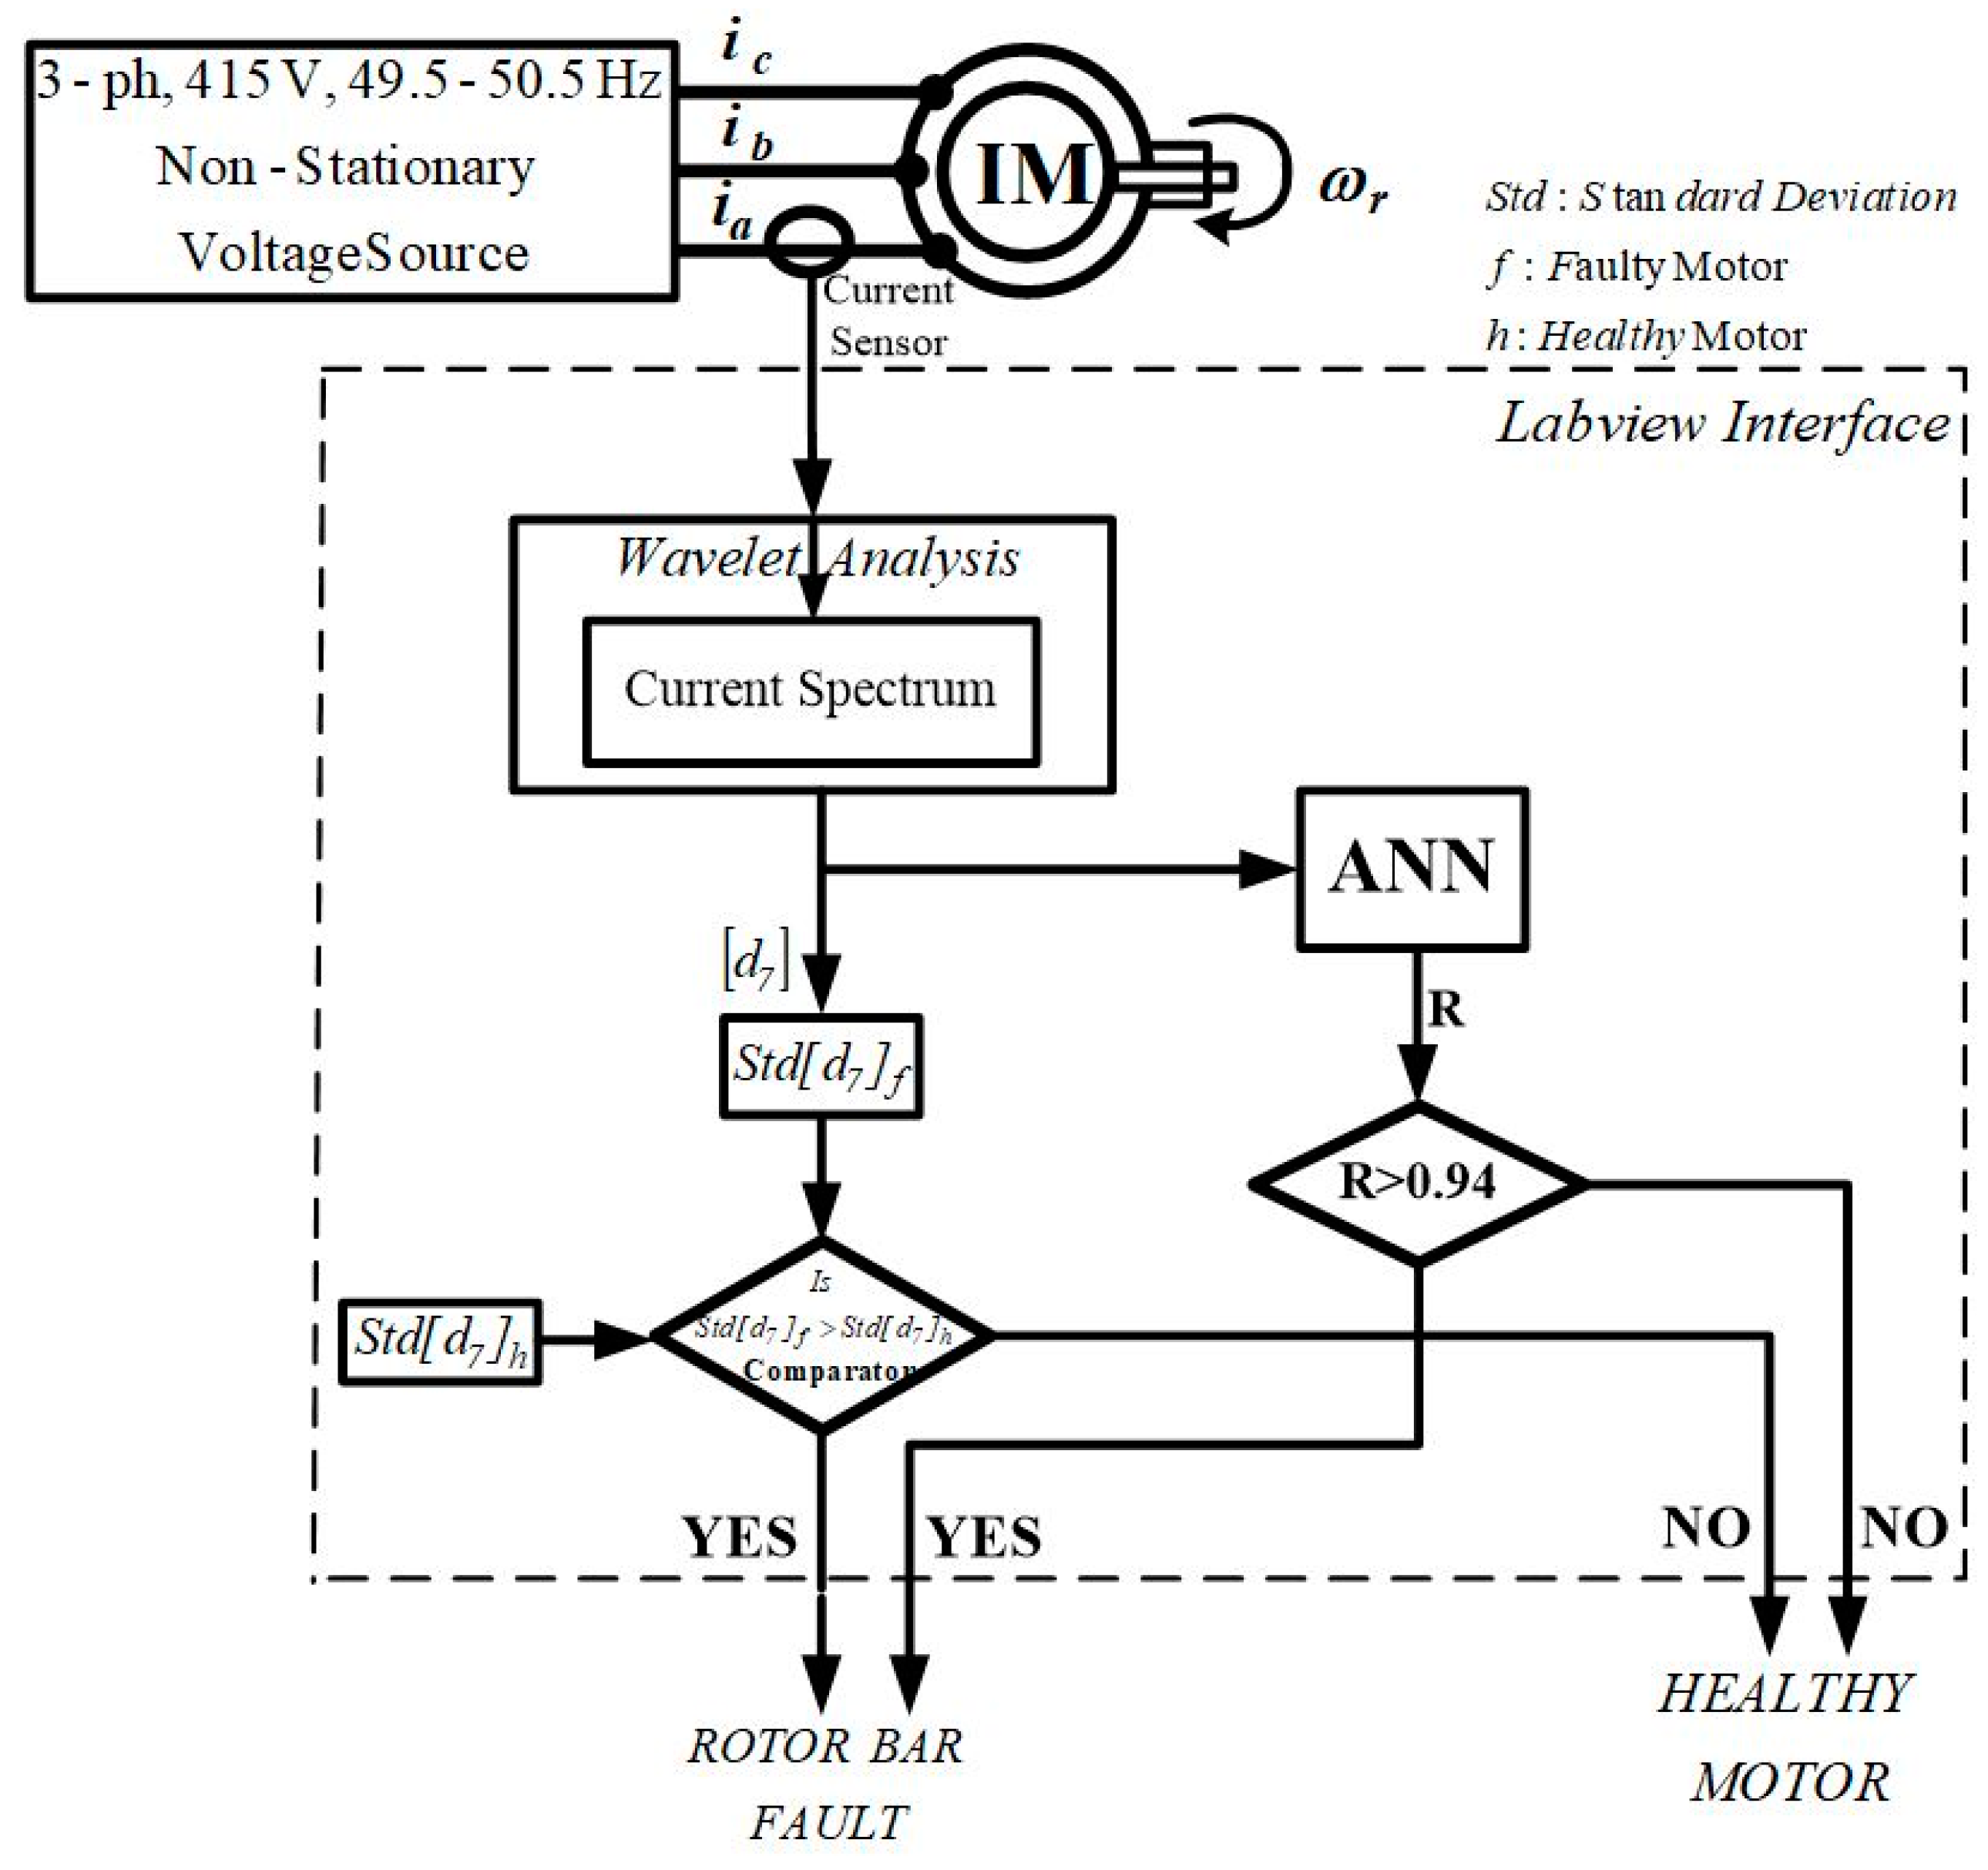
3.4. Modelling of DWT-Based Fault Detection Scheme

Figure 10 shows the scheme representative of both the simulation model and experimental setup for DWT- and ANN-based cage fault detection of SCIM.
A three-phase, 415 V, 50 ± 1.5% Hz non-stationary source is fed to the SCIM. The scaled-down (1/1000) current of phase-a (ia) is used for MRA in the simulation study. In addition, ‘dB34’ is used for scrutinising stationary signals in the ‘wavelet analysis’ block. The point-to-point standard deviation of [d7] obtained from the ‘wavelet analysis’ block is compared with the pre-fed values of the standard deviation of [d7] obtained by analysing the healthy motor state in the ‘comparator’ block. The standard deviation of [d7] obtained from the motor with a faulty cage running in real-time is consistently higher than that of the motor in a healthy state, which indicates the presence of a fault. Furthermore, the instantaneous values of the [d7] detailed coefficient are fed to the ‘ANN’ block, wherein the cascaded forward backdrop-based design has been adopted, and the execution is done using the Levenberg-Marquardt algorithm. The value of the coefficient of correlation (R) obtained from the ANN block is fed to a comparator block which checks whether the value of R value is more than 0.94. A value greater than 0.94 indicates damaged rotor bars, whereas a lesser value indicates a healthy rotor bar. This is justified based on the values obtained in Table 2.

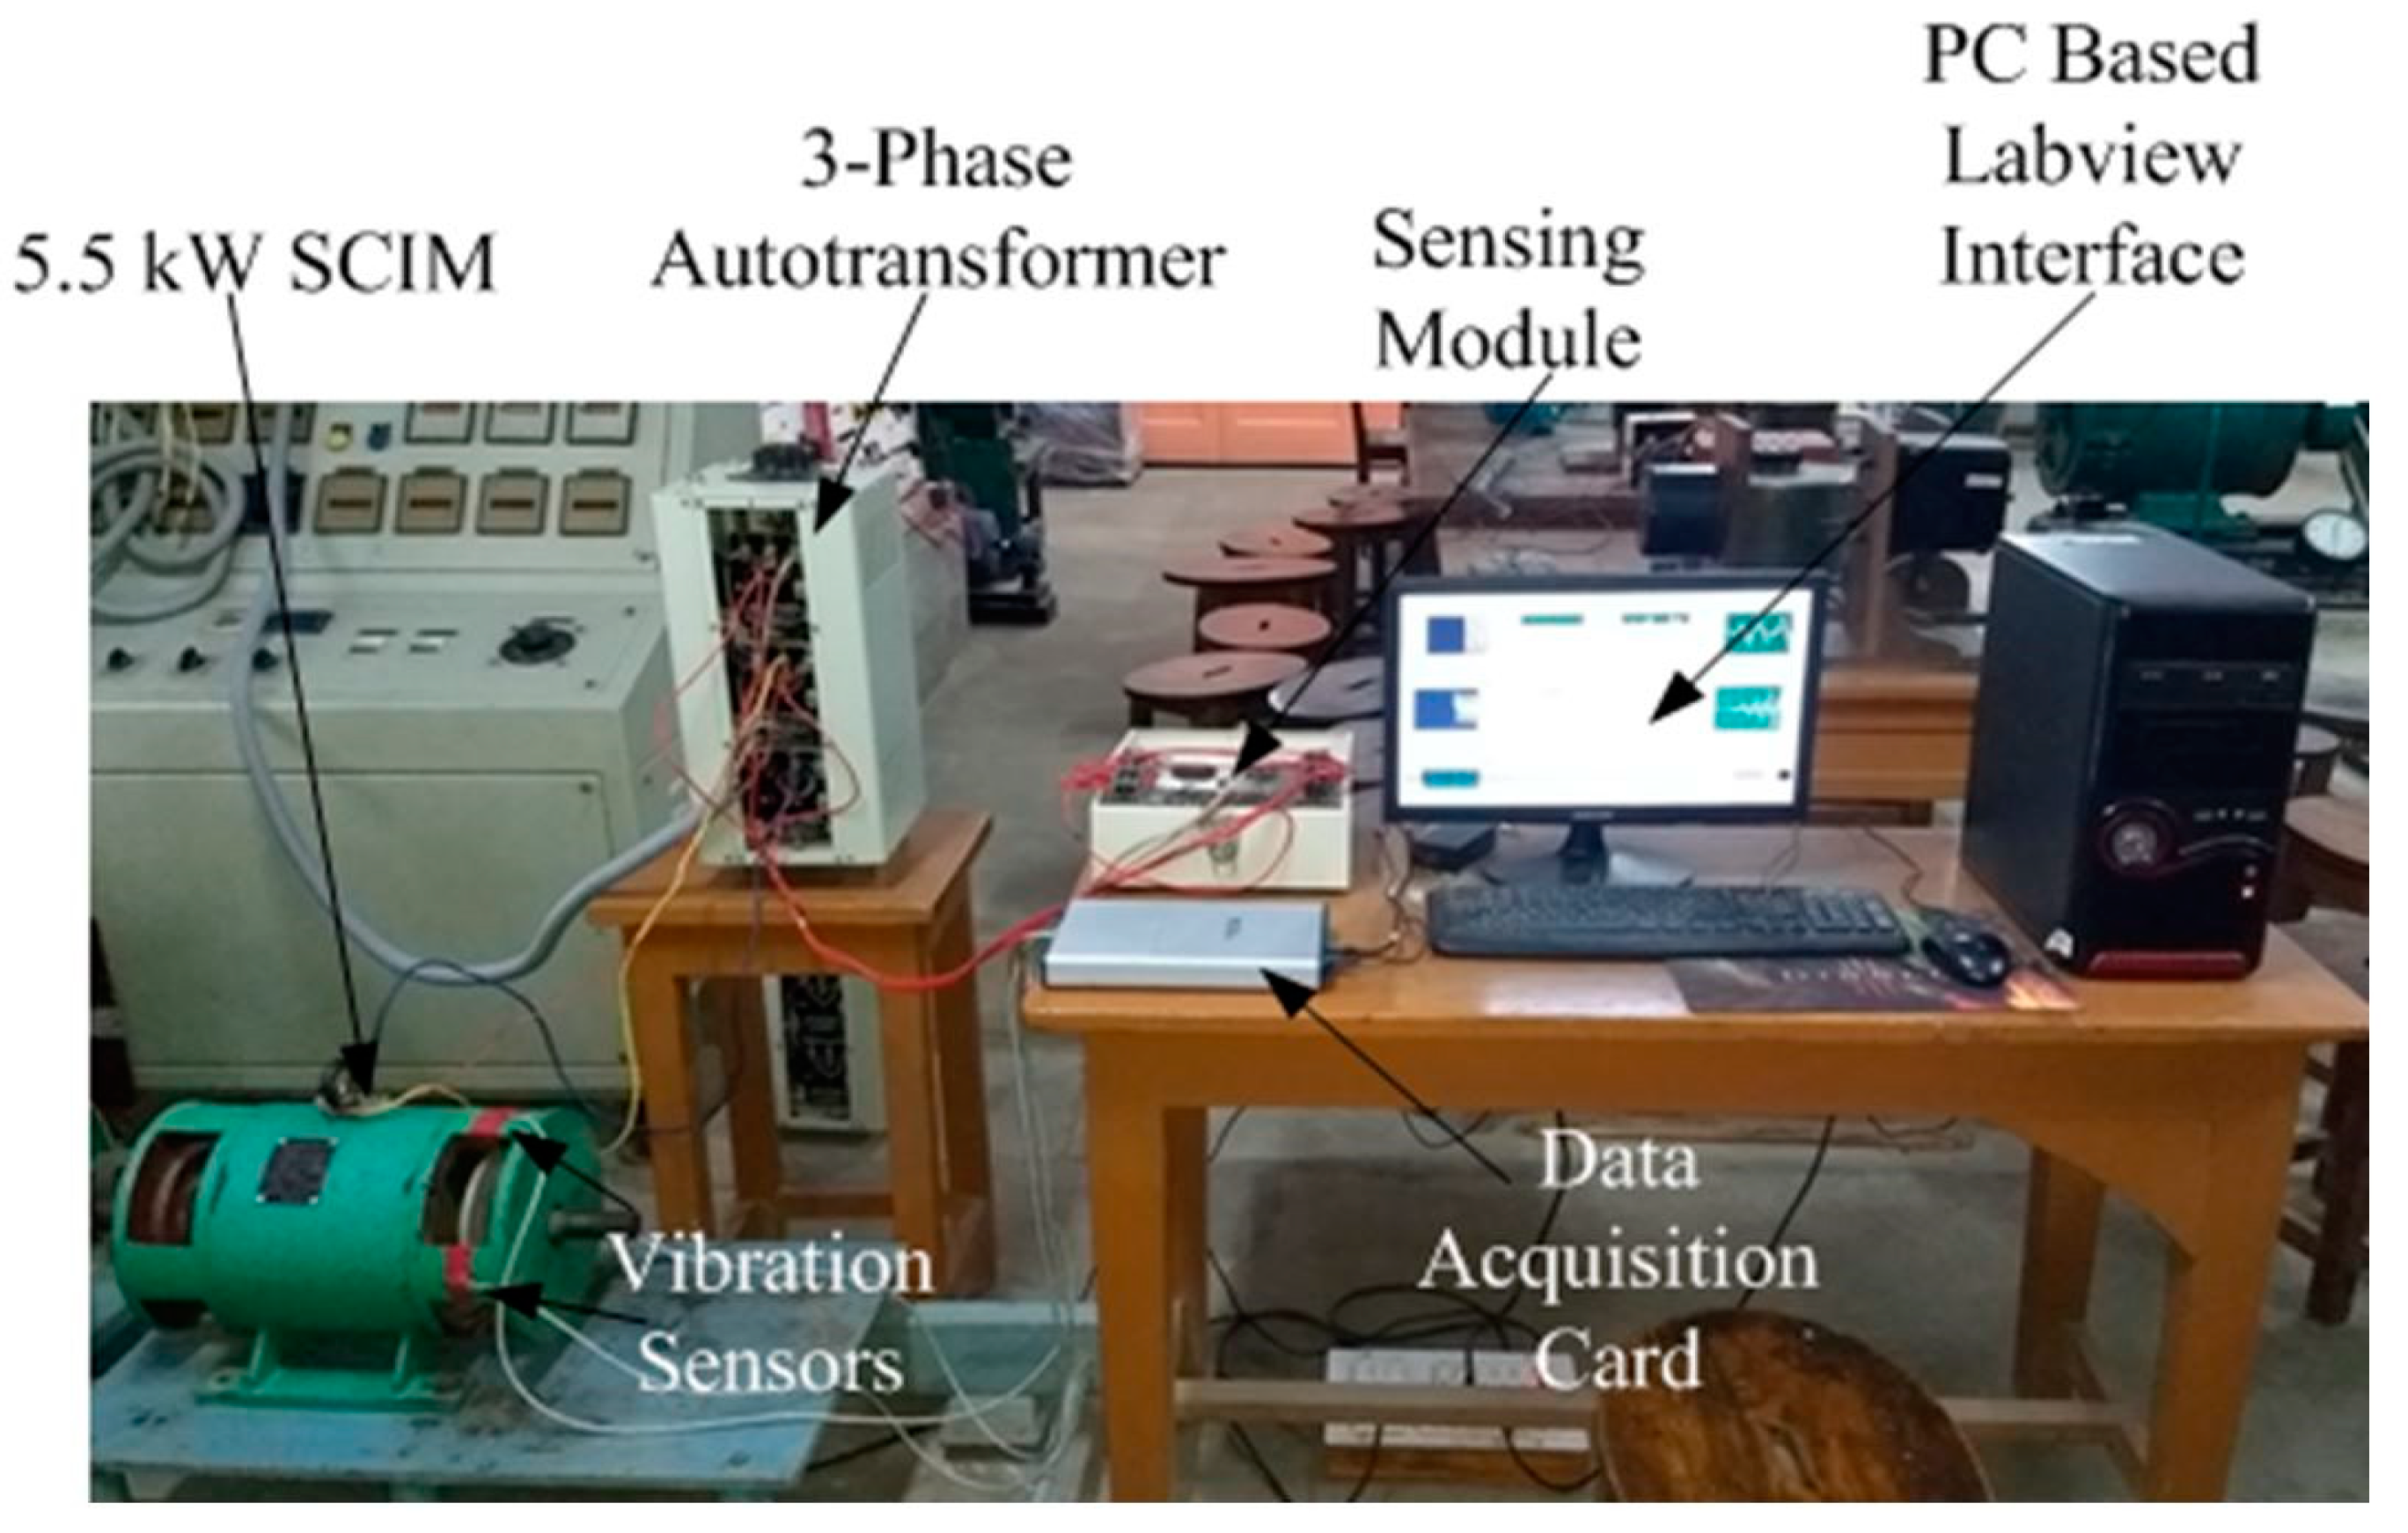
4. Real-Time Validation

This section details the real-time validation of the proposed cage fault detection scheme in the LabVIEW-based SCIM laboratory prototype.

4.1. LabVIEW-Based Laboratory Prototype

The LabVIEW-based laboratory prototype for cage fault detection of 5.5 kW, three-phase, 415 V, 4 pole SCIM (Appendix A) is shown in Figure 11. The motor line current is sensed in the sensing module using LEM current sensors (0–5 A). This line current is filtered, discretised, and further digitised using an A/D converter in the data acquisition card (11–30 V (dc), 30 W) for feeding into the LabVIEW interface. The real-time code corresponding to Figure 10 is generated in LabVIEW. The cage fault detection algorithm is implemented using the acquired data. A sampling frequency of 6.2 kHz and ‘sym34’ mother wavelet (since the supply frequency constantly regulates by ±1.5%, making the current signal non-stationary) are used to implement the fault detection algorithm.

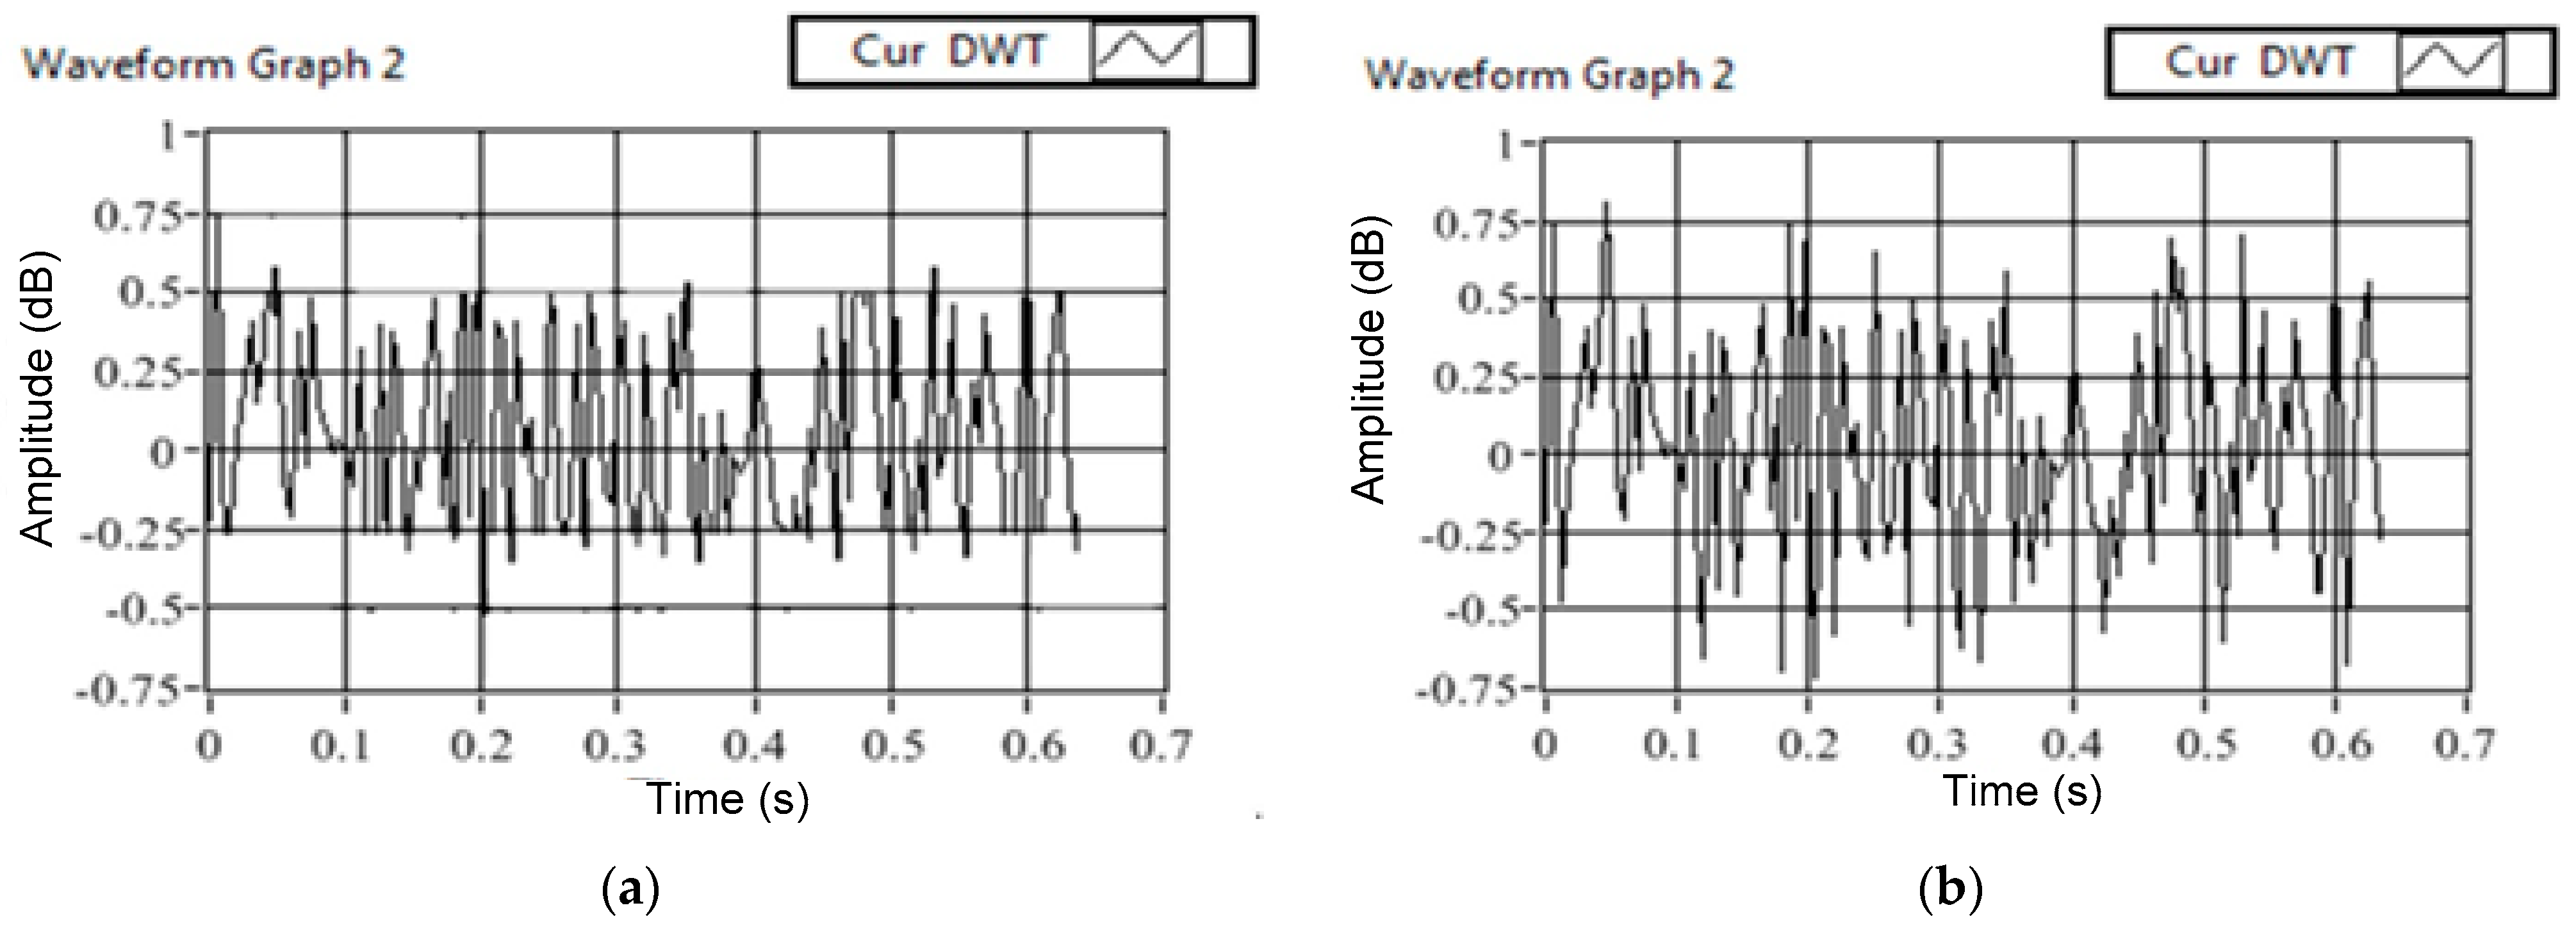
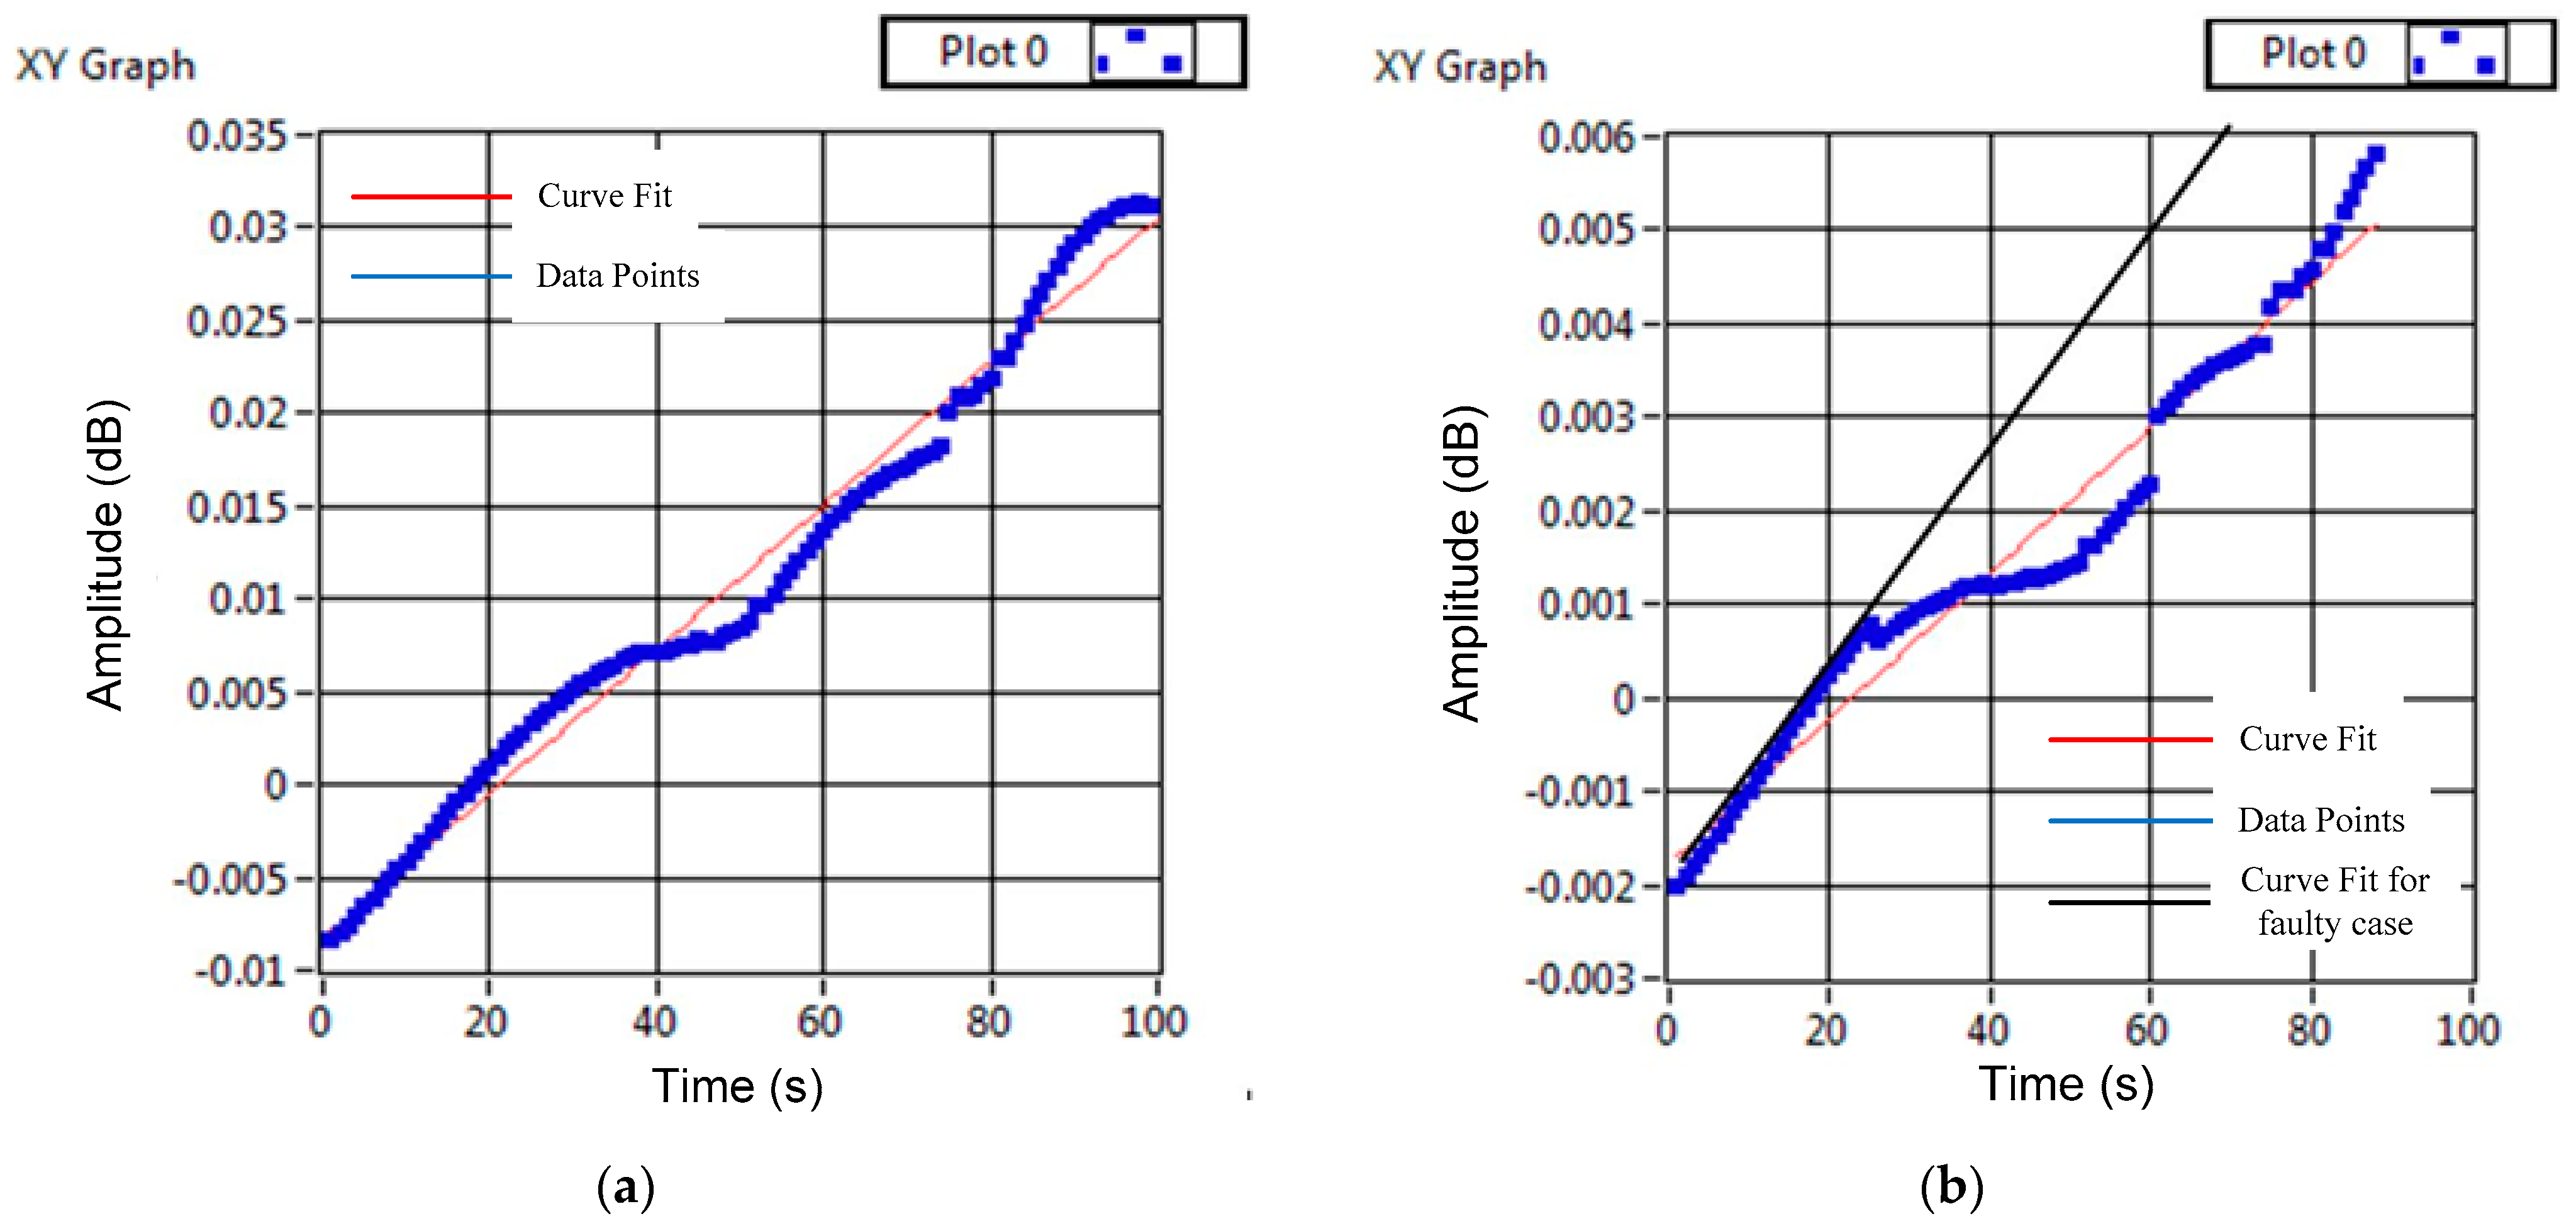
4.2. Results of Fault Detection

Figure 12 shows the experimental results obtained by the LabVIEW-based SCIM laboratory prototype to validate the simulation study. Moreover, the real-time signals are inherently non-stationary in nature due to the supply frequency regulation ±1.5% (approx.). Hence, the experimental validation for SCIM at the rated load torque (35 Nm) subjected to only the non-stationary signal at an operating sampling frequency of 6.2 kHz is presented.
Figure 12a shows the variation in the [d7] coefficient for SCIMs operating at a rated load torque under healthy conditions. The [d7] components in these cases show significantly lesser variations from the pre-fed values, a characteristic of the healthy machine. Furthermore, Figure 12b shows the [d7] coefficient for SCIMs operating at a rated load torque having broken rotor bars. It is evident that the deviation of the [d7] coefficient is much greater than those shown in Figure 12a.
Furthermore, Figure 13 shows the curve fitting-based pattern recognition diagram of ANN for the detection of broken rotor bars.
The value of correlation coefficients for the SCIM in the faulty case is at 0.9536, and that for the healthy case is at 0.69, which further goes on to validate the proposed fault detection scheme (Figure 10).

5. Conclusions

The cage fault detection at an incipient juncture results in reducing the unwanted downtime of the drive system, especially in the underground mines. This paper proposes a two-tier approach using the DWT-based MRA of motor line current and ANN to detect the rotor bar crack for SCIMs operating under a supply frequency regulation, which is a common phenomenon in the Indian industrial scenario which leads to the presence of non-stationary signals as sources for the SCIM. The rigorous analysis in MATLAB/Simulink ensures that even the level-seven detailed coefficient [d7] alone is sufficient to detect the rotor bar crack provided the analysing mother wavelet and working sampling frequency are selected accurately. In the present work, it is found that ‘db41’ is suitable for analysing the stationary current signal, whereas ‘sym34’ is the proper choice for the non-stationary current signal in the MRA. Furthermore, it is also observed that the use of cascaded forward backdrop type ANN using the Levenberg-Marquardt algorithm gives highly satisfactory results for the process of fault detection.
Moreover, pattern recognition and curve-fitting make the proposed scheme simplistic, robust, and less erroneous. The scheme is further validated by a real-time implementation on a LabVIEW-based 5.5 kW SCIM laboratory prototype. The proposed scheme is also robust to the ±2% (approx.) sampling frequency variation from the operating frequency. Implementing this proposed approach requires a minimum instrumentation system that is highly desirable for the scheme’s reliable working under dusty and hazardous mine environments.

Author Contributions

Conceptualization, A.K.S., A.S.H.; methodology, A.K.S., A.S.H., M.B. and P.C.; software, A.K.S., A.S.H.; validation, A.K.S., A.S.H., M.B. and P.C.; formal analysis, A.K.S., A.S.H., M.B., and P.C.; writing—original draft preparation, A.K.S., A.S.H.; writing—review and editing, A.K.S., A.S.H., M.B. and P.C. All authors have read and agreed to the published version of the manuscript.

Funding

This research received no external funding.

Institutional Review Board Statement

N/A.

Informed Consent Statement

N/A.

Data Availability Statement

N/A.

Conflicts of Interest

The authors declare no conflict of interest.

Nomenclature

SymbolDescription
sSlip of the machine (%)
f1Supply frequency (Hz)
pNumber of pole pairs
ΩrRotor speed (rad/s)
Rb,LbRotor bar resistance (Ω), inductance (H)
RincIncrease in rotor resistance ( Ω )
Re, LeEnd-ring resistance ( Ω ), inductance (H)
N1Turn number of one stator winding
NTotal number of rotor bars
NbContiguous number of cracked bars
fsbHigher-order slot harmonics
[Vs][Ir]Stator voltage, rotor loop current matrices
[Rr][Lr]Rotor resistance, inductance matrices
Φs, ΦrTotal flux linkages of stator and rotor winding
θrAngular rotor position
ΦParticular point along the air-gap
lEffective length of the motor
Ntsp, NsppNumber of turns/slot/phase, number of slots/pole/phase
Nkr, φ)Winding function of rotor windings
La, Lb, Lc, Lab, Lbc, LcaElements of [ L s ]
Lk1……LkkElements of [ L r ]
Lak, Lbk, LckElements of [ L s r ]
θkAngular position of bar ‘k’
Alsb, AusbLower, upper fault side-band amplitude (%)
va, vb, vcVoltages of phase-a, phase-b, phase-c (V)
ia, ib, icCurrents of phase-a, phase-b, phase-c (A)
FsSampling frequency (Hz)
tTime (s)
LNumber of decomposition levels
nfDetailed coefficient containing 50 Hz
flsb, fusbLower, upper side-band frequency (Hz)
[Is]Stator current vector
[Rs]Stator winding resistance matrix
[Ls]Stator winding inductance matrix
[Lsr]Stator to rotor mutual inductance matrix
Tem, TLElectromagnetic, load torques (Nm)
JRotor inertia (Kg-m2)
FCoefficient of friction
μ0Permeability of air
rAir-gap average radius (mm)
Ns, Ns1Effective, the actual number of turns of the stator winding
gAir-gap length (mm)
N1r, φ), Njr, φ)Winding function of circuit I and J
Kp, Kd, KsPitch, distribution, skew factors
Na, Nb, NcWinding function of stator windings
αrAngle between any two adjacent bars

Appendix A. Motor Parameters

ParametersRatings
Shaft power5.5 kW
Rated voltage415 V
Frequency50 Hz
Synchronous speed1500 rpm
Stator resistance/phase1.83 Ω
Stator inductance/phase0.0074 H
Rotor resistance referred to stator/phase1.26 Ω
Rotor inductance referred to stator/phase0.007 H
Mutual inductance0.198 H
Number of stator slots36
Number of rotor slots28
Number of poles4

References

  1. Krichen, M.; Elbouchikhi, E.; Benhadj, N.; Chaieb, M.; Benbouzid, M.E.H.; Neji, R. Motor current signature analysis-based permanent magnet synchronous motor demagnetisation characterisation and detection. Machines 2020, 8, 35. [Google Scholar] [CrossRef]
  2. Mortazavizadeh, S.A.; Mousavi, S.M.G. A review on condition monitoring and diagnostic techniques of rotating electrical machines. J. Phys. Sci. 2014, 310–338. [Google Scholar] [CrossRef]
  3. Elbouchikhi, E.; Choqueuse, V.; Benbouzid, M.E.H. Induction machine faults detection using stator current parametric spectral estimation. Mech. Syst. Signal Process. 2015, 52, 447–464. [Google Scholar] [CrossRef] [Green Version]
  4. Zhang, P.; Du, Y.; Habetler, T.G.; Lu, B. A survey of condition monitoring and protection methods for medium-voltage induction motors. IEEE Trans. Ind. Appl. 2011, 47, 34–46. [Google Scholar] [CrossRef]
  5. Nandi, S.; Toliyat, H.A. Condition monitoring and fault diagnosis of electrical motors—A review. IEEE Trans. Energy Convers. 2005, 20, 719–729. [Google Scholar] [CrossRef]
  6. Tavner, P.; Ran, L.; Penman, J.; Sedding, H. Condition Monitoring of Rotating Electrical Machines; IET: London, UK, 2008; Volume 56. [Google Scholar]
  7. Gritli, Y.; Bellini, A.; Rossi, C.; Casadei, D.; Filippetti, F.; Capolino, G.A. Condition monitoring of mechanical faults in in-duction machines from electrical signatures: Review of different techniques. In Proceedings of the IEEE 11th international symposium on diagnostics for electrical machines, power electronics and drives (SDEMPED), Tinos, Greece, 29 August–1 September 2017; pp. 77–84. [Google Scholar]
  8. Jigyasu, R.; Sharma, A.; Mathew, L.; Chatterji, S. A review of condition monitoring and fault diagnosis methods for induction motor. In Proceedings of the International Conference on Intelligent Computing and Control Systems (ICICCS), Madurai, India, 14–15 June 2018; pp. 1713–1721. [Google Scholar]
  9. Cabanas, M.F.; Pedrayes, F.; González, M.R.; Melero, M.G.; Rojas, C.H.; Orcajo, G.A.; Cano, J.M.; Nuno, F. A New Electronic Instrument for the Early Detection of Broken Rotor Bars in Asynchronous Motors Working Under Arbitrary Load Conditions. In Proceedings of the 5th IEEE International Symposium on Diagnostics for Electric Machines, Power Electronics, and Drives (SDEMPED), Vienna, Austria, 7–9 September 2005; pp. 1–6. [Google Scholar]
  10. Douglas, H.; Pillay, P.; Ziarani, A.K. Broken rotor bar detection in induction machines with transient operating speeds. IEEE Trans. Energy Convers. 2005, 20, 135–141. [Google Scholar] [CrossRef]
  11. Benbouzid, M.E.H. (Ed.) Signal Processing for Fault Detection and Diagnosis in Electric Machines and Systems; IET: London, UK, 2020; p. 284. ISBN 978-1-83953-025-8. [Google Scholar]
  12. Rodriguez, P.J.; Belahcen, A.; Arkkio, A. Signatures of electrical faults in the force distribution and vibration pattern of induction motors. IEEE Proc. Electr. Power Appl. 2006, 163, 526–529. [Google Scholar] [CrossRef]
  13. Filippetti, F.; Franceschini, G.; Tassoni, C.; Vas, P. AI techniques in induction machines diagnosis including the speed ripple effect. IEEE Trans. Ind. Appl. 1998, 34, 98–108. [Google Scholar] [CrossRef]
  14. Mehala, N.; Dahiya, R. A Comparative Study of FFT, STFT and Wavelet Techniques for Induction Machine Fault Diagnostic Analysis. In Proceedings of the 7th WSEAS International Conference on Computational Intelligence, Man-Machine Systems and Cybernetics, Cairo, Egypt, 29–31 December 2008; Volume 2931. [Google Scholar]
  15. Riera-Guasp, M.; Antonino-Daviu, J.A.; Roger-Folch, J.; Palomares, M.P.M. The use of the wavelet approximation signal as a tool for the diagnosis of rotor bar failures. IEEE Trans. Ind. Appl. 2008, 44, 716–726. [Google Scholar] [CrossRef] [Green Version]
  16. Corral-Hernandez, J.A.; Antonino-Daviu, J.; Pons-Llinares, J.; Climente-Alarcon, V.; Frances-Galiana, V. Transient-based rotor cage assessment in induction motors operating with soft starters. IEEE Trans. Ind. Appl. 2015, 51, 3734–3742. [Google Scholar] [CrossRef]
  17. Li, D.Z.; Wang, W.; Ismail, F. A spectrum synch technique for induction motor health condition monitoring. IEEE Trans. Energy Convers. 2015, 30, 1348–1355. [Google Scholar] [CrossRef]
  18. Naha, A.; Samanta, A.K.; Routray, A.; Deb, A.K. A method for detecting half-broken rotor bar in lightly loaded induction motors using current. IEEE Trans Instrum. Meas. 2016, 65, 1614–1625. [Google Scholar] [CrossRef] [Green Version]
  19. Gritli, Y.; Lee, S.B.; Filippetti, F.; Zarri, L. Advanced diagnosis of outer cage damage in double-squirrel-cage induction motors under time-varying conditions based on wavelet analysis. IEEE Trans. Ind. Appl. 2014, 50, 1791–1800. [Google Scholar] [CrossRef]
  20. Antonino-Daviu, J.; Riera-Guasp, M.; Pons-Llinares, J.; Park, J.; Lee, S.B.; Yoo, J.; Kral, C. Detection of broken outer-cage bars for double-cage induction motors under the start-up transient. IEEE Trans. Ind. Appl. 2012, 48, 1539–1548. [Google Scholar] [CrossRef]
  21. Pons-Llinares, J.; Antonino-Daviu, J.A.; Riera-Guasp, M.; Lee, S.B.; Kang, T.J.; Yang, C. Advanced induction motor rotor fault diagnosis via continuous and discrete time-frequency tools. IEEE Trans. Ind. Electron. 2015, 62, 1791–1802. [Google Scholar] [CrossRef]
  22. Keskes, H.; Braham, A. Recursive undecimated wavelet packet transform and DAG SVM for induction motor diagnosis. IEEE Trans. Ind. Inform. 2015, 11, 1059–1066. [Google Scholar] [CrossRef]
  23. Yang, C.; Kang, T.J.; Hyun, D.; Lee, S.B.; Antonino-Daviu, J.A.; Pons-Llinares, J. Reliable detection of induction motor rotor faults under the rotor axial air duct influence. IEEE Trans. Ind. Appl. 2014, 50, 2493–2502. [Google Scholar] [CrossRef]
  24. Kang, M.; Kim, J.M. Reliable fault diagnosis of multiple induction motor defects using a 2-D representation of shannon wavelets. IEEE Trans. Magn. 2014, 50, 1–13. [Google Scholar] [CrossRef]
  25. Antonino-Daviu, J.; Aviyente, S.; Strangas, E.G.; Riera-Guasp, M. Scale invariant feature extraction algorithm for the automatic diagnosis of rotor asymmetries in induction motors. IEEE Trans. Ind. Inform. 2013, 9, 100–108. [Google Scholar] [CrossRef]
  26. Kumar, P.; Hati, A.S. Deep convolutional neural network based on adaptive gradient optimiser for fault detection in SCIM. ISA Trans. 2021, 111, 350–359. [Google Scholar] [CrossRef]
  27. Kumar, P.; Hati, A.S. Convolutional neural network with batch normalisation for fault detection in squirrel cage induction motor. IET Electr. Power Appl. 2020, 15, 39–50. [Google Scholar] [CrossRef]
  28. Verma, A.K.; Jain, A.; Radhika, S. Neuro-fuzzy Classifier for Identification of Stator Winding Inter-Turn Fault for Industrial Machine. In Proceedings of the International Conference on Modelling, Simulation and Intelligent Computing, Dubai, UAE, 29–31 January 2020; Springer: Singapore, 2020; pp. 101–110. [Google Scholar]
  29. Kumar, P.; Hati, A.S. Review on machine learning algorithm based fault detection in induction motors. Arch. Comput. Methods Eng. 2020, 28, 1–12. [Google Scholar] [CrossRef]
  30. Ibrahim, A.K.; Marei, M.I.; El-Gohary, H.S.; Shehata, S.A.M. Modeling of induction motor based on winding function theory to study motor under stator/rotor internal faults. In Proceedings of the 14th International Middle East Power Systems Conference (MEPCON’10), Cairo, Egypt, 19–21 December 2010; pp. 494–500. [Google Scholar]
  31. Taher, S.A.; Malekpour, M. A novel technique for rotor bar failure detection in single-cage induction motor using FEM and MATLAB/SIMULINK. Math. Probl. Eng. 2011, 2011, 1–15. [Google Scholar]
  32. Alger, P.L. Induction Machines; Gordon and Breach: New York, NY, USA, 1970. [Google Scholar]
  33. Bellini, A.; Filippetti, F.; Franceschini, G.; Tassoni, C.; Kliman, G.B. Quantitative evaluation of induction motor broken bars by means of electrical signature analysis. IEEE Trans. Ind. Appl. 2001, 37, 1248–1255. [Google Scholar] [CrossRef]
  34. Sinha, A.K.; Das, S.; Chatterjee, T.K. Empirical relation for broken bar determination in SCIM. COMPEL Int. J. Comput. Math. Electr. Electron. Eng. 2018, 37, 242–265. [Google Scholar] [CrossRef]
  35. Halem, N.; Zouzou, S.E.; Srairi, K. Analysis of induction motor with broken bars and constant speed using circuit-field coupled method. J. Fundam. Appl. Sci. 2011, 3, 111–125. [Google Scholar] [CrossRef] [Green Version]
  36. Marcelo, C.; Fossatti, J.P.; Terra, J.I. Fourier Transform-Signal Processing; Salih, S., Ed.; Intech: Rijeka, Croatia, 2012. [Google Scholar]
  37. Burrus, C.S.; Guo, H. Introduction to Wavelets and Wavelet Transforms: A Primer; Prentice-Hall: Hoboken, NJ, USA, 1998. [Google Scholar]
  38. Shashidhara, S.M.; Raju, P.S. Tradeoff analysis of wavelet transform techniques for the detection of broken rotor bars in induction motors. Adv. Electron. Electr. Eng. 2013, 3, 1019–1030. [Google Scholar]
  39. Shi, P.; Chen, Z.; Vagapov, Y. Wavelet transform based broken rotor-bar fault detection and diagnosis performance evaluations. Int. J. Comput. Appl. 2013, 69, 36–43. [Google Scholar] [CrossRef]
  40. Aggarwal, C.C. Neural Networks and Deep Learning; Springer International Publishing: Basel, Switzerland, 2018. [Google Scholar]
  41. Su, H.; Chong, K.T. Induction Machine Condition Monitoring Using Neural Network Modeling. IEEE Trans. Ind. Electron. 2007, 54, 241–249. [Google Scholar] [CrossRef]
  42. Verma, A.K.; Nagpal, S.; Desai, A.; Sudha, R. An efficient neural-network model for real-time fault detection in industrial machine. Neural Comput. Appl. 2021, 33, 1297–1310. [Google Scholar] [CrossRef]
  43. Sharma, A.; Mathew, L.; Chatterji, S.; Goyal, D. Artificial Intelligence-Based Fault Diagnosis for Condition Monitoring of Electric Motors. Int. J. Pattern Recognit. Artif. Intell. 2020, 34, 2059043. [Google Scholar] [CrossRef]
  44. Serin, G.; Sener, B.; Ozbayoglu, A.M.; Unver, H.O. Review of tool condition monitoring in machining and opportunities for deep learning. Int. J. Adv. Manuf. Technol. 2020, 109, 953–974. [Google Scholar] [CrossRef]
  45. Mohanraj, T.; Yerchuru, J.; Krishnan, H.; Aravind, R.N.; Yameni, R. Development of tool condition monitoring system in end milling process using wavelet features and Hoelder’s exponent with machine learning algorithms. Measurement 2021, 173, 108671. [Google Scholar] [CrossRef]
Figure 1. Simulation and modelling of SCIM: (a) Current distribution in rotor loops using the winding function theory, and (b) block diagram of MATLAB/Simulink model of variable frequency voltage fed SCIM.
Machines 09 00087 g001
Figure 2. Analysis of rotor bar crack fault of a 5.5 kW SCIM (1 faulty bar) in stationary regime: (a) Phase-a current (ia) with 50 Hz frequency, and (b) FFT spectrum of stationary ia.
Machines 09 00087 g002
Figure 3. Analysis of rotor bar crack fault of a 5.5 kW SCIM (1 faulty bar) in non-stationary regime: (a) Phase-a current (ia) with variable frequency, and (b) FFT spectrum of non-stationary ia.
Machines 09 00087 g003
Figure 4. Approximated [ a n ] and detailed [ d n ] coefficients obtained by the DWT-based MRA of phase-a current of 5.5 kW SCIM running at a rated load torque: Under constant frequency operation: (a) In the absence of cage fault, (b) in the presence of cage fault, and under frequency regulation: (c) In the absence of cage fault, (d) in the presence of cage fault.
Machines 09 00087 g004
Figure 5. Artificial neural network design based on (a) cascaded forward backdrop and (b) feed-forward backdrop based design.
Machines 09 00087 g005
Figure 6. Pattern recognition-based regression diagram for cascaded forward backdrop using (a) Bayesian Regulation, (b) Polak-Ribiere Restarts, (c) Gradient Descent with momentum and adaptive learning rate, and (d) Levenberg-Marquardt Algorithm.
Machines 09 00087 g006
Figure 7. Mean square error diagram for cascaded forward backdrop using (a) Bayesian Regulation, (b) Polak-Ribiere Restarts, (c) Gradient Descent with momentum and adaptive learning rate, and (d) Levenberg-Marquardt Algorithm.
Machines 09 00087 g007
Figure 8. Pattern recognition based regression diagram for feed-forward backdrop using (a) Bayesian Regulation, (b) Polak-Ribiere Restarts, (c) Gradient Descent with momentum and adaptive learning rate, and (d) Levenberg-Marquardt Algorithm.
Machines 09 00087 g008
Figure 9. Mean square error diagram for feed-forward backdrop using (a) Bayesian Regulation, (b) Polak-Ribiere Restarts, (c) Gradient Descent with momentum and adaptive learning rate, and (d) Levenberg-Marquardt Algorithm.
Machines 09 00087 g009aMachines 09 00087 g009b
Figure 10. Scheme for DWT- and ANN-based cage fault detection of SCIM.
Machines 09 00087 g010
Figure 11. Experimental setup for the validation of the proposed fault detection scheme.
Machines 09 00087 g011
Figure 12. The [d7] coefficient for SCIMs operating at a rated load torque obtained using the LabVIEW-based laboratory prototype under (a) healthy state, and (b) faulty state.
Machines 09 00087 g012
Figure 13. ANN-based pattern recognition diagram for the detection of broken rotor bars using the stator current for SCIM: (a) With broken rotor bars and (b) without broken rotor bars.
Machines 09 00087 g013
Table 1. Frequency bands of [dn]/[an] for various sampling frequencies [31].
[dn]/[an]Sampling Frequency Fs (Hz)
610061506200625063006350
d11525–30501537–30751550–31001562–31251575–31501588–3175
d2762–1525769–1537775–1550781–1562788–1575794–1588
d3381–762384–769388–775390–781394–788397–794
d4191–381192–384194–388195–390197–394198–397
d595–19196–19297–19498–19597–19799–198
d648–9548–9648–9749–9849–9849–98
d724–4824–4824–4825–4925–4925–49
d812–2412–2412–2413–2513–2513–25
a80–120–120–120–130–130–13
Table 2. Values of mean square errors and regression for the different algorithms.
Correlation Coefficient Value (R)Mean Square Error Epoch Value
Cascaded Forward BackdropFeed-Forward BackdropCascaded Forward BackdropFeed-Forward Backdrop
Bayesian Regulation0.951270.9495568
Polak-Ribiere Restarts0.9450.95373245
Gradient Descent with momentum and adaptive learning rate0.945570.95264231233
Levenberg-Marquardt0.949350.9492555
Publisher’s Note: MDPI stays neutral with regard to jurisdictional claims in published maps and institutional affiliations.

