Article

Parametric Optimization for Cutting Forces and Material Removal Rate in the Turning of AISI 5140

1
Mechanical Engineering Department, Technology Faculty, Selcuk University, Selçuklu, Konya 42130, Turkey
2
Key Laboratory of High Efficiency and Clean Mechanical Manufacture, School of Mechanical Engineering, Shandong University, Jinan 250061, China
3
Department of Automated Mechanical Engineering, South Ural State University, 454080 Chelyabinsk, Russia
4
Department of Mechanical Engineering, Sinop University, Sinop 57000, Turkey
5
School of Mechanical and Design Engineering, University of Portsmouth, Portsmouth PO1 3DJ, UK
*
Authors to whom correspondence should be addressed.
Submission received: 13 April 2021 / Revised: 25 April 2021 / Accepted: 28 April 2021 / Published: 29 April 2021
(This article belongs to the Section Material Processing Technology)

Abstract

:
The present paper deals with the optimization of the three components of cutting forces and the Material Removal Rate (MRR) in the turning of AISI 5140 steel. The Harmonic Artificial Bee Colony Algorithm (H-ABC), which is an improved nature-inspired method, was compared with the Harmonic Bee Algorithm (HBA) and popular methods such as Taguchi’s S/N ratio and the Response Surface Methodology (RSM) in order to achieve the optimum parameters in machining applications. The experiments were performed under dry cutting conditions using three cutting speeds, three feed rates, and two depths of cuts. Quadratic regression equations were identified as the objective function for HBA to represent the relationship between the cutting parameters and responses, i.e., the cutting forces and MRR. According to the results, the RSM (72.1%) and H-ABC (64%) algorithms provide better composite desirability compared to the other techniques, namely Taguchi (43.4%) and HBA (47.2%). While the optimum parameters found by the H-ABC algorithm are better when considering cutting forces, RSM has a higher success rate for MRR. It is worth remarking that H-ABC provides an effective solution in comparison with the frequently used methods, which is promising for the optimization of the parameters in the turning of new-generation materials in the industry. There is a contradictory situation in maximizing the MRR and minimizing the cutting power simultaneously, because the affecting parameters have a reverse effect on these two response parameters. Comparing different types of methods provides a perspective in the selection of the optimum parameter design for industrial applications of the turning processes. This study stands as the first paper representing the comparative optimization approach for cutting forces and MRR.

1. Introduction

One of the greatest challenges for machining industries is to overcome excessive energy consumption [1]. The fundamental necessity for reducing outgoings is to shorten the machining time [2]. The power employed for chip removing needs to be considered for this reason as well. Machining time is directly affected by the material removal rate assigned with basic machining parameters, i.e., cutting speed, feed rate, and the depth of the cut [3]. Cutting powers, as well as cutting force, are also affected mostly by these three parameters. Theoretically, the cutting force is obtained by multiplying the specific cutting force by the chip area, which is a function of feed rate and depth of cut [4]. Because increasing the cutting parameters increases MRR and cutting power at the same time, there are uncertainties in the selection process of suitable parameter combinations [5]. Therefore, there is always a need for an effective optimization method to determine the optimum combination of parameters [6,7,8]. This is important in terms of the sustainability assessment, which covers the consumed energy, machining costs, and eco-friendly manufacturing [9,10,11].
The resultant cutting force is divided into three components of cutting force in a simple turning operation: tangential (FC), axial (FF) and radial (FR). The motive for measuring the cutting forces in machining operations comes from their major effect on cutting tool wear, cutting temperatures, the vibration mechanism and consequently the surface texture of the workpiece [12,13]. As such, cutting forces are one of the significant characteristics in machining operations [14,15]. Although cutting forces are calculated theoretically, complex turning processes can reveal unexpected developments. Therefore, actual measurements become important, especially for industrial applications, as they provide cleaner results.
In general, based on operation types such as rough, semi-rough and finishing, the depth of cut is accommodated first. Then, the feed rate and cutting speed are adjusted by taking into consideration of used materials and required cutting power, respectively [16]. At this point, in order to maximize MRR, a high level of cutting parameters is needed, but this leads to excessive growth of cutting forces, short tool life and poor surface integrity. Numerous papers have been published on the optimization of the cutting parameters for cutting forces in the turning of widespread types of materials. Laghari et al. [17] performed the parametric optimization of the turning parameters for composite materials using RSM. According to results, the first level of cutting speed, feed rate and depth of cut are proposed among the four levels as the optimal values presenting the highest desirability value. The paper showed the success of RSM in the optimization of three components of cutting forces. Zerti et al. [18] minimized the cutting force and cutting power to maximize productivity for an AISI 420 turning operation via RSM. The main outcome was that the maximum cutting speed along with a minimum depth of cut and feed rate should be selected for optimum responses. Toulfatzis et al. [19] studied the machinability of brass alloy for an optimal solution during a turning operation. Similarly, the maximum cutting speed, minimum feed rate and minimum depth of cut values were suggested for reduced cutting force using Taguchi’s S/N ratio. Selvaraj et al. [20] used the Taguchi method to optimize the cutting speed and feed rate for a variety of responses for nitrogen-alloyed duplex stainless steel in the turning process. The authors emphasized that the highest value of cutting speed and lowest value of feed rate produce the minimum cutting force. Kuntoglu and Saglam [16] determined the optimal cutting speed and feed rate values in turning of AISI 1050 steel with S/N ratios. The minimum tangential cutting force was obtained with a high cutting speed and low feed rate according to the authors’ findings. Aouici et al. [21] obtained optimum cutting forces in three components during the turning of AISI H11 steel. An interesting result was found with RSM based on ranges for the best cutting conditions. The findings provide an important source as being a meaningful solution in turning a specified material in the industry. Aslan [22] found optimum conditions in turning operations for all of the components of cutting force using RSM. According to the author’s deductions, two components of cutting force can be minimized with high desirability, except for radial one. The outlined papers have common outcomes for the success of Taguchi and RSM in the optimization of cutting forces while turning several materials.
Some of the papers—without applying an optimization approach—investigated the effect of parameters and noted or figured the optimal solutions. For example, Leksycki et al. [23] presented stainless steel turning for the three components of cutting forces. Both feed rate and depth of cut have an influence, and their increase directly increases the responses. The importance of the study is that, regardless of the cooling conditions, an enhanced feed rate and depth of cut increase each cutting force component. Lalwani et al. [24] carried out an experimental study in the finish hard turning of MDN250 steel. The prominent result is that the cutting speed has no importance on cutting forces, the depth of cut has an impact on axial cutting force, and both the feed rate and depth of cut influence the tangential cutting force. Korkmaz et al. [25] investigated a Nimonic 80A superalloy material during turning. The most important result noted by the authors was that the depth of cut influences the tangential and axial force, while the feed rate is dominant over the radial cutting force. Cutting force optimization brings multiple advantages not only in terms of productivity but also for understanding cutting mechanisms during the turning process.
MRR represents productivity containing the removed material in unit time. As such, it is one of the most desired optimization parameters and directly considers the amount of material removed from the surface. The definition can be extended as the volume of the removed material in a given moment. Thus, the optimization issues of MRR have been an attractive subject for the producers and researchers from the past to the present. Bouzid et al. [26] carried out a Taguchi S/N-based optimization work in the turning of stainless steel. The paper exhibited the importance of MRR using both mono- and multi-objective optimizations via Taguchi and grey relational analysis. Mia et al. [27] also presented a Taguchi-based S/N optimization in hard turning. The study purposed optimization for economical consumption of resources considering a lot of parameters along with MRR. Kaladhar [28] integrated cutting speed, feed rate, depth of cut, nose radius and coating types into the turning of AISI 304 steel. According to the author’s result, a lower nose radius and the third level of cutting speed along with a maximum depth of cut and feed rate should be selected for maximum MRR. Kini and Chincholkar [29] studied the effect of turning parameters and their optimization during the machining of reinforced polymer pipes. As an important outcome of the study, it was noted that the depth of cut was found to be an effective parameter on MRR, followed by the nose radius. Kumar [30] used C360 copper alloy during a micro-turning operation considering MRR. Taguchi optimization showed its effectiveness for optimization processes in the micro-turning operation. The common part of the mentioned papers is the usage of the maximum value of depth of cut to optimize MRR without looking at the method. In addition, a consensus was observed about the utility of MRR optimization and its contribution to the machining economy.
The Artificial Bee Colony (ABC) algorithm is one of the nature-inspired algorithms frequently used in the literature. The ABC algorithm was inspired by the method of bees searching for fruitful flowers. Similarly, the ABC algorithm searches the best parameters for a maximum value of an objective function. In studies investigating cutting parameter optimization using the ABC algorithm, the researchers made inferences on the effectiveness and lack of this method. Yildiz et al. [31] contributed an improved hybrid ABC algorithm by comparing it with nine nature-inspired algorithms from the literature. They focused on finding better optimal solutions in a shorter time. Therefore, they integrated Taguchi’s robust parameter design into the initial swarm generation stage of ABC. Thus, they improved the performance of the ABC algorithm. However, their method was exhaustive due to the determination of several constraints. Prasanth et al. [32] searched the optimum parameter design of the cutting speed, feed rate, depth of cut and tool nose radius by using the ABC algorithm for the best results. They presented a comparative study between the ABC algorithm, genetic algorithm, and ant colony algorithm. They concluded that the ABC algorithm is the best among the three algorithms. These two results above also inspired us to focus on the ABC algorithm in order to improve its searching strategy. Öztürk et al. [33] used a bee algorithm to optimize a contradictive multi-objective function for the determination of cutting speed, feed rate, and cutting depth. Their way of integrating two objectives into one fitness function can be replaced by using quadratic regression models of the cutting forces. This study differs from the literature in terms of an algorithm developed to optimize conflicting objectives, i.e., cutting forces and MRR. A harmony memory was simply integrated into the searching steps of the ABC algorithm, and the constraints were determined according to the experimental input range of the cutting speed, feed rate, and cutting depth.
Despite several initiatives about cutting forces and MRR in the open literature, no study was found about a comparative optimization approach for these response parameters. In a nutshell, Taguchi-based optimization and RSM were referred to many times as optimization approaches in the open literature. Some studies included nature-inspired algorithms in turning for the application of important response parameters in the past [31,32,33,34,35], but none of them considered the three components of cutting forces and MRR simultaneously. In this study, in order to find the optimum solutions, the popular optimization methods, namely Taguchi S/N ratio, RSM and nature-inspired algorithms, HBA and H-ABC were proposed to obtain the optimum levels of the cutting speed, feed rate and depth of cut values. The methods presented in this study are expected to make significant contributions to the practical applications of multiple optimizations incorporating the time and cost minimization approach.

2. Materials and Methods

2.1. Cutting Tool and Workpiece Specifications

The workpiece material AISI 5140 was prepared as cylindrical shapes (Ø75 × 500 mm) for the physical tests. Before beginning the tests, 1 mm of the oxide layer was removed from the surface to preserve the cutting tool from unstable machining. In order to perform the tests, a centre hole was composed to provide stability for the fastening between the chuck and tailstock during turning due to the length of the workpiece bars. As AISI 5140 steel is a common material used in the automotive and manufacturing industries, the machinability of AISI 5140 is an important issue. The chemical composition of the material is given in Table 1. The content of chrome (0.85%) presents a challenging environment which enables tool vibrations, high cutting forces and, as a result, poor surface texture because this element allows us to create hard carbides. A new bar was prepared for each test to complete the experimental design. In every test chip removal was performed as six times, using a new cutting insert code of WCMT 06 T308-AP301U (Achteck-China) which is PVD-coated P25 grade carbides. It is noteworthy to state that the special design dynamometer used in this study was also utilized as a cutting tool holder. In this way, specific cartridges with a 75° approaching angle designed for carrying the inserts were used in the tests.

2.2. Experimental Design and Physical Tests

Based on the literature knowledge [4,36,37,38,39] and the cutting tool manufacturer’s catalog, three different cutting speeds (150, 200 and 300 m/min), three feed rates (0.06, 0.12 and 0.24 mm/rev) and two depths of cut (1 and 1.5 mm) were integrated into the experimental design. For the experimental design, Taguchi L18 was preferred, as is shown in Table 2. Based on the preliminary tests and collected data, such as chip formation and chatter vibrations, the proper data group was composed. It was desired to produce controllable chips without tangling and high vibrations which may cause excessive cutting forces.
In the tests, a conventional lathe (De Lorenzo S547-8899-Italy) was used and 18 cutting experiments were carried out according to the full factorial design principle under dry cutting conditions during the process. Before the tests, an extensive preliminary test study was implemented to check the validity of the values suggested by the manufacturer. A dynamometer (TelC-Germany) was used for the measurement of the cutting forces in three axes as tangential, axial and radial components. As mentioned, the dynamometer can be mounted on the carriage of the machine tool in order to use it as a tool holder. The main advantage of the dynamometer is that it can directly transfer data with its software (Telc XKM 2000-Germany) without the need for any additional equipment. Figure 1 represents the value of three cutting force components at a moment of the experiments, and the amount of data captured from the computer screen. As can be seen in the horizontal axes in Figure 1, the dynamometer and its software are capable of measuring ten data points in a second. Figure 1 represents the value of the three cutting forces for twenty seconds in the first experiment. Each number on the axes indicates the actual second count. After collecting data during the tests, data visualization and processing can be performed using the same interface. In the evaluation phase, the average cutting force data was calculated and considered. In Figure 2, the experimental details for machine tool, cutting insert, data measurement and collection are represented.

2.3. Quadratic Regression Model

Being a statistical modeling technique, quadratic regression defines the correlation between a dependent variable and at least two independent variables. Among the regression models, the second-order regression equation or quadratic regression is popular for prediction in particular [40,41]. In order to provide an improvement in quality engineering, predictive modeling embraces the requirements not only in the economical aspect but also from social and environmental points of view. Therefore, the integration of prediction models has a valuable impact on the sustainability of the process by providing the optimal solutions. Especially in a turning operation, instant changes deteriorate the quality and make prediction difficult. The quadratic regression models generated for the three components of cutting forces and MRR were integrated into the H-ABC algorithm to check their validity under specific conditions for AISI 5140 steel. The following equations are handled as objective functions in H-ABC and HBA.
In order to derive the quadratic equations, a treatment equation is described in Equation (1) containing the parameters and error constant.
A = f ((vC), (f), (ap)) + Error
here, A represents the cutting force parameters, and the Equation (1) is transformed into Equation (2), representing the quadratic regression model.
A = B 0 + i = 1 3 B i X i + i = 1 3 B i i X i 2 + i < j 3 B i j X i X j
where B0 is constant and Bi, Bii and Bij are linear, square and interaction coefficients, respectively. Due to the number of the degree of freedom, the square value of the depth of cut cannot be estimated by the software. Then, the equation is transformed into its final form:
A = B0 + B1 · vC + B2 · f + B3 · ap + B11 · vC 2 + B22 · f2 + B12 · vC · f + B23 · f · ap + B13 · ap · vC
The parameters vC, f, ap in these equations are set in a range: cutting speeds 150 < vC < 330 m/min, feed rates 0.06 < f < 0.24 mm/rev and depth of cuts 1 < ap < 1.5 mm. For cutting forces, Equations (4)–(6) can be described as follows. According to the quadratic regression model developed, the accuracy of these equations was found to be 93.83%, 81.87% and 89.96% for the FC, FF and FR coefficients. Furthermore, the uncertainties were calculated as 6.17%, 18.13% and 10.04%, respectively. These results were estimated by response surface regression analysis in the Minitab 16 software.
FC = 964.163 − 8.16642 · vc + 200.219 · f + 79.7426 · ap + 0.0158733 · vc2 + 559.877
· f2 + 0.597705 · vc · f − 0.259394· vc · ap + 476.286 · f · ap
FF = 436.921 − 3.75155 · vc − 132.978 · f + 77.4777 · ap + 0.00719718 · vc2 + 154.090
· f2 + 1.31582 · vc · f − 0.148916 · vc · ap + 84.4365 · f · ap
FR = 401.779 − 2.50486 · vc − 112.883 · f − 103.758 · ap + 0.00389017 · vc2 − 387.346
· f2 + 0.118337 · vc · f − 0.329519 · vc · ap + 328.492 · f · ap

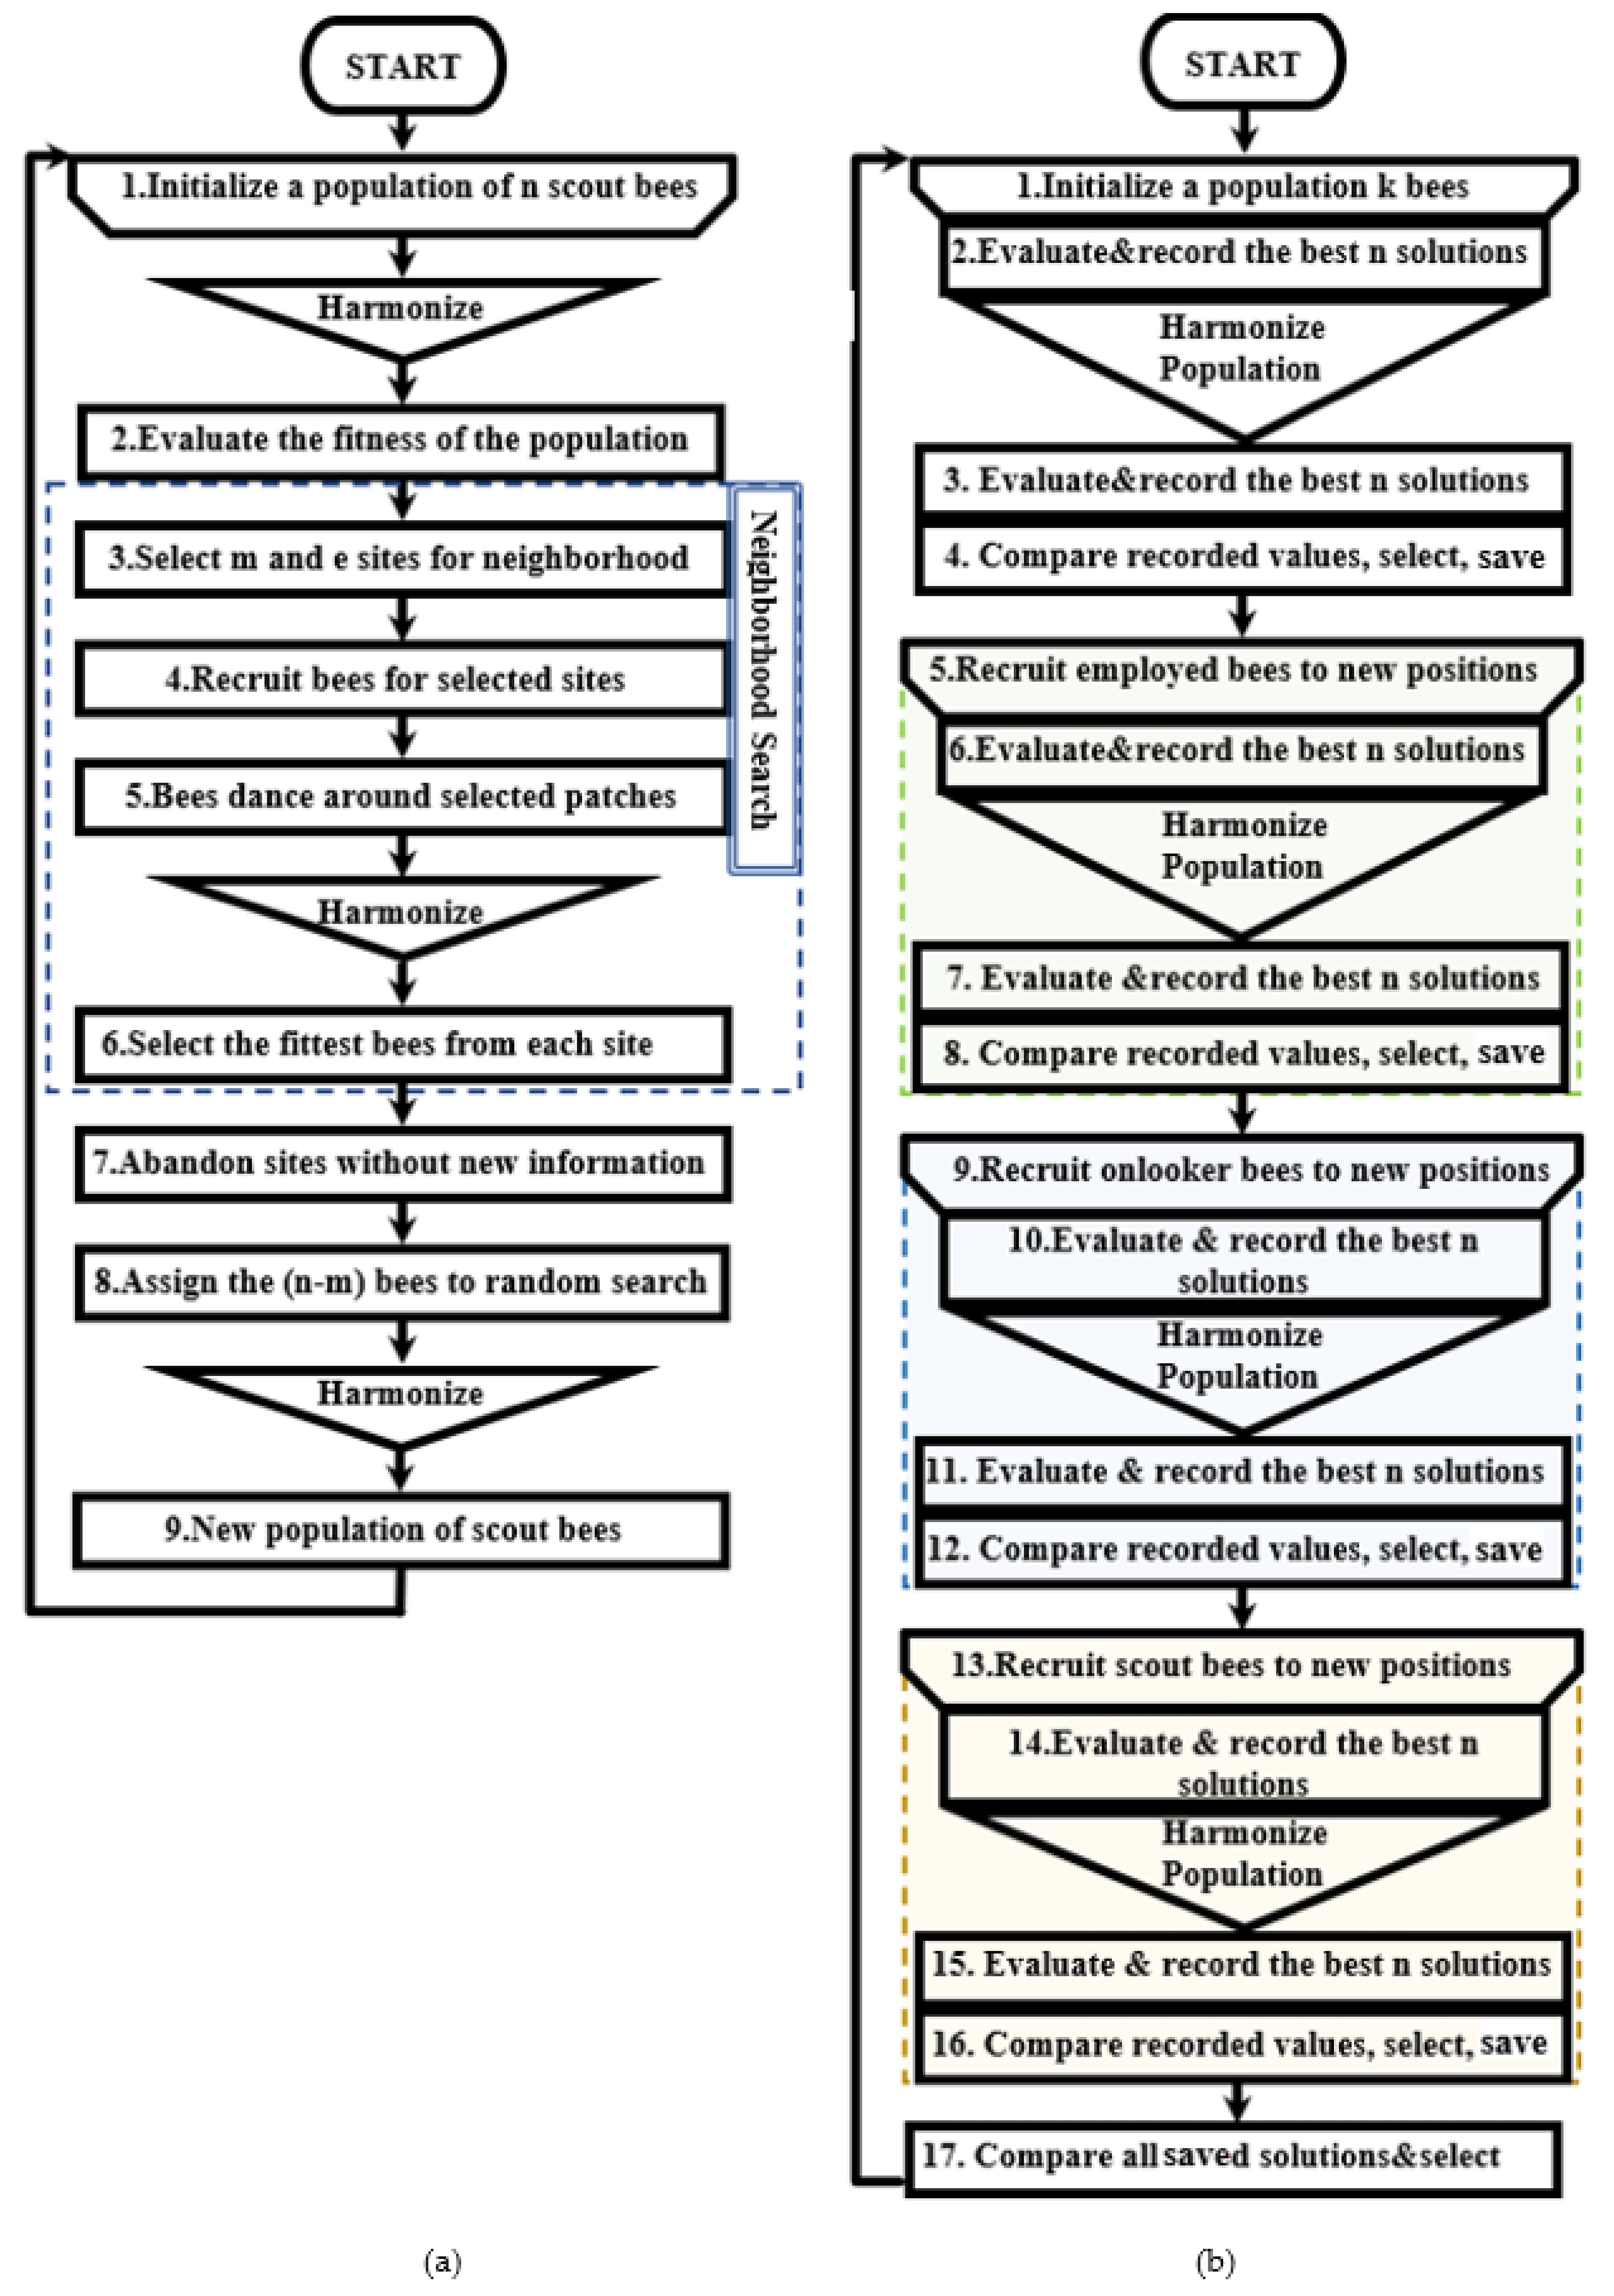
2.4. Harmonic Artificial Bee Colony Algorithm

The harmony search algorithm was inspired by the aesthetic estimation of musical sounds [42,43]. The algorithm evaluates and selects objective function depending on the parameters defined within a range by the operator; likewise, the aesthetic estimation is composed of a set of sounds from instruments played by an operator [44]. The selected value of the objective function is improved in each iteration just as the aesthetic estimation progresses through practice.
The significant step of the harmony search algorithm is the creation of the Harmony Memory (HM), as illustrated in Figure 3. The HM is inspired by a jazz trio composed of a fiddle, saxophone, and keyboard. In a single performance, the instruments produce random sounds (G, D, A), (E, F, D) and (D, G, E) recorded in HM, respectively, as shown in Figure 3. The evaluations of the harmonic sound are sequenced based on quality, e.g., excellent, good, and fair. This evaluation is improved by practicing. In the research paper, the three sounds of instruments are regarded as the three parameters vC, f, ap of the objectives: FC, FF, FR, and MRR. The randomly produced parameter values in HM are replaced interchangeably to evaluate objective functions with various values. In this way, the searching method increases the chance of finding global extreme points by evaluating all combinations of randomly produced parameter values in HM. This study integrated the HM into the searching process of the Artificial Bee Colony (ABC) algorithm to increase the chance of finding the global extreme point.
The ABC algorithm is composed of three significant main steps [45]:
  • Place the employed bees on the food sources in the memory.
  • Place the onlooker bees on the food sources in the memory.
  • Place the scouts in the search area for the discovery of a new food source.
The steps mentioned above are repeated until the defined conditions are met. The objective functions were optimized by using both HBA and H-ABC. The procedure of HBA and H-ABC are comparatively shown in Figure 4a,b. The integration is performed into the afore-mentioned three steps, as shown in Figure 4b. The steps are illustrated within different background colors, i.e., green, blue, and brown, respectively. The H-ABC was set by using only two parameters: a population that was set to 100 and an iteration that was set to 100. On the other hand, the HBA was set by using seven parameters: number of scout bees n = 60, number of sites selected out of n visited sites m = 10, number of best sites out of m selected sites e = 4, number of bees recruited for the other (m-e) selected sites nsp = 10, number of bees recruited for best e sites nep = 20, the initial size of patches ngh = 0.001, and iterations = 100. The parameter values of the algorithms were defined from the literature [42,46].
The optimization operation was performed for four objective functions: FC, FF, FR and MRR. FC, FF and FR were minimized and MRR was maximized. In this context, the objectives were handled in turn. The Pareto front was obtained from each of the objective functions by using both H-ABC and HBA. The Pareto front parameters were used to calculate the values of the rest of the objective functions from the optimized one. The values were graphed as shown in Figure 5a–h. The graph was used for the actual selection of the optimal values from the Pareto front. The actual optimal value was selected from the quadrilateral area between the line fits of the objective function results in the graph of the Pareto front.
The Algorithm procedure in Figure 4b is the only kind used as an algorithm to search for the best values of cutting parameters. The procedure starts by producing k number of populations of vC, f, ap in a scattered space in the range of design parameters. The algorithm provides a primary selection among the results of HM. Therefore, the first step focuses on a particular space in the range of design parameters. The second step shortens the space of the design parameters to search by using the same method after the HM. Consequently, the third step finds the best of the design parameters in the focused space. However, this is not the complete final solution, because the focused space resulting from the three steps is only one local extreme point. However, the algorithm can save the local extreme and converge to the global extreme point at the end of the iteration. The HM, which is applied for the first time within the ABC algorithm, provides significant sensitivity in the searching operation.

2.5. Taguchi’s S/N Ratio Method

Taguchi’s approach introduces a design methodology for reduced labor costs with increased efficiency [47,48,49]. Its main purpose is quality engineering. Taguchi applied the idea of the variability of the material and process to the experimental design phenomenon instead of hypothetical innovations. As such, a new method appeared, which aims at robust and reliable design in manufacturing for better quality and low costs [50,51]. There are numerous applications in engineering, and especially for machining studies, integrating Taguchi [52,53,54,55]. This method is available for experimental design, optimization and prediction. Taguchi uses an objective function for the determination of a deviation from the desired value of the response parameters. The response parameter is defined as the measured and dependent variable in the experimental plan. In order to determine the aim of the experiment, Taguchi presents several S/N ratio calculation equations according to the maximization or minimization targets. Two of these equations are listed below:
Smaller is better to minimize the cutting force components:
S/N = −10 log 1/n (Σy2)
Larger is better to maximize the MRR:
S/N = −10 log 1/n (Σ(1/y)2)

2.6. Response Surface Methodology

RSM covers mathematical and statistical techniques to provide optimum solutions for a response parameter which constitutes the main purpose of an engineering problem [56]. The method offers to model all parameters in the experimental plan dividing them into dependents and independents. The modeling, analysis and viewing with graphs and tables should be performed step by step in the application. Each independent parameter is arbitrarily included in the model according to the desired response or dependent parameter. As it is being applied to optimization algorithms, the objective function should be consulted to make the response the maximum or minimum. An identical approach is implemented here with the former for the optimization of the responses. The prominent advantage of this method is to provide feasibility for both mono and multiple optimizations. Furthermore, defining the weights and importance bring a clear advantage for practical applications with the determination of the significance of the responses. The broad application field can be implemented with RSM, especially for machining. A variety of researchers selected this method in the open literature [57,58,59]. Therefore, it is desired to apply this method for the provision of successful, reliable and robust modeling.

3. Results

In the experimental design, three cutting speeds and feed rates along with two depths of cut were used to formulate a full factorial design. This approach promises to obtain the effect of each parameter on the responses, which brings a clear advantage in determining the optimum results. Table 3 includes the design parameters, and the responses belong to 18 experiments. In the context of this topic, three different approaches were applied to the cutting speed, feed rate and depth of cut for the parametric optimization. Respectively, the H-ABC, HBA Taguchi S/N ratio and RMS algorithms were identified and explained in detail.

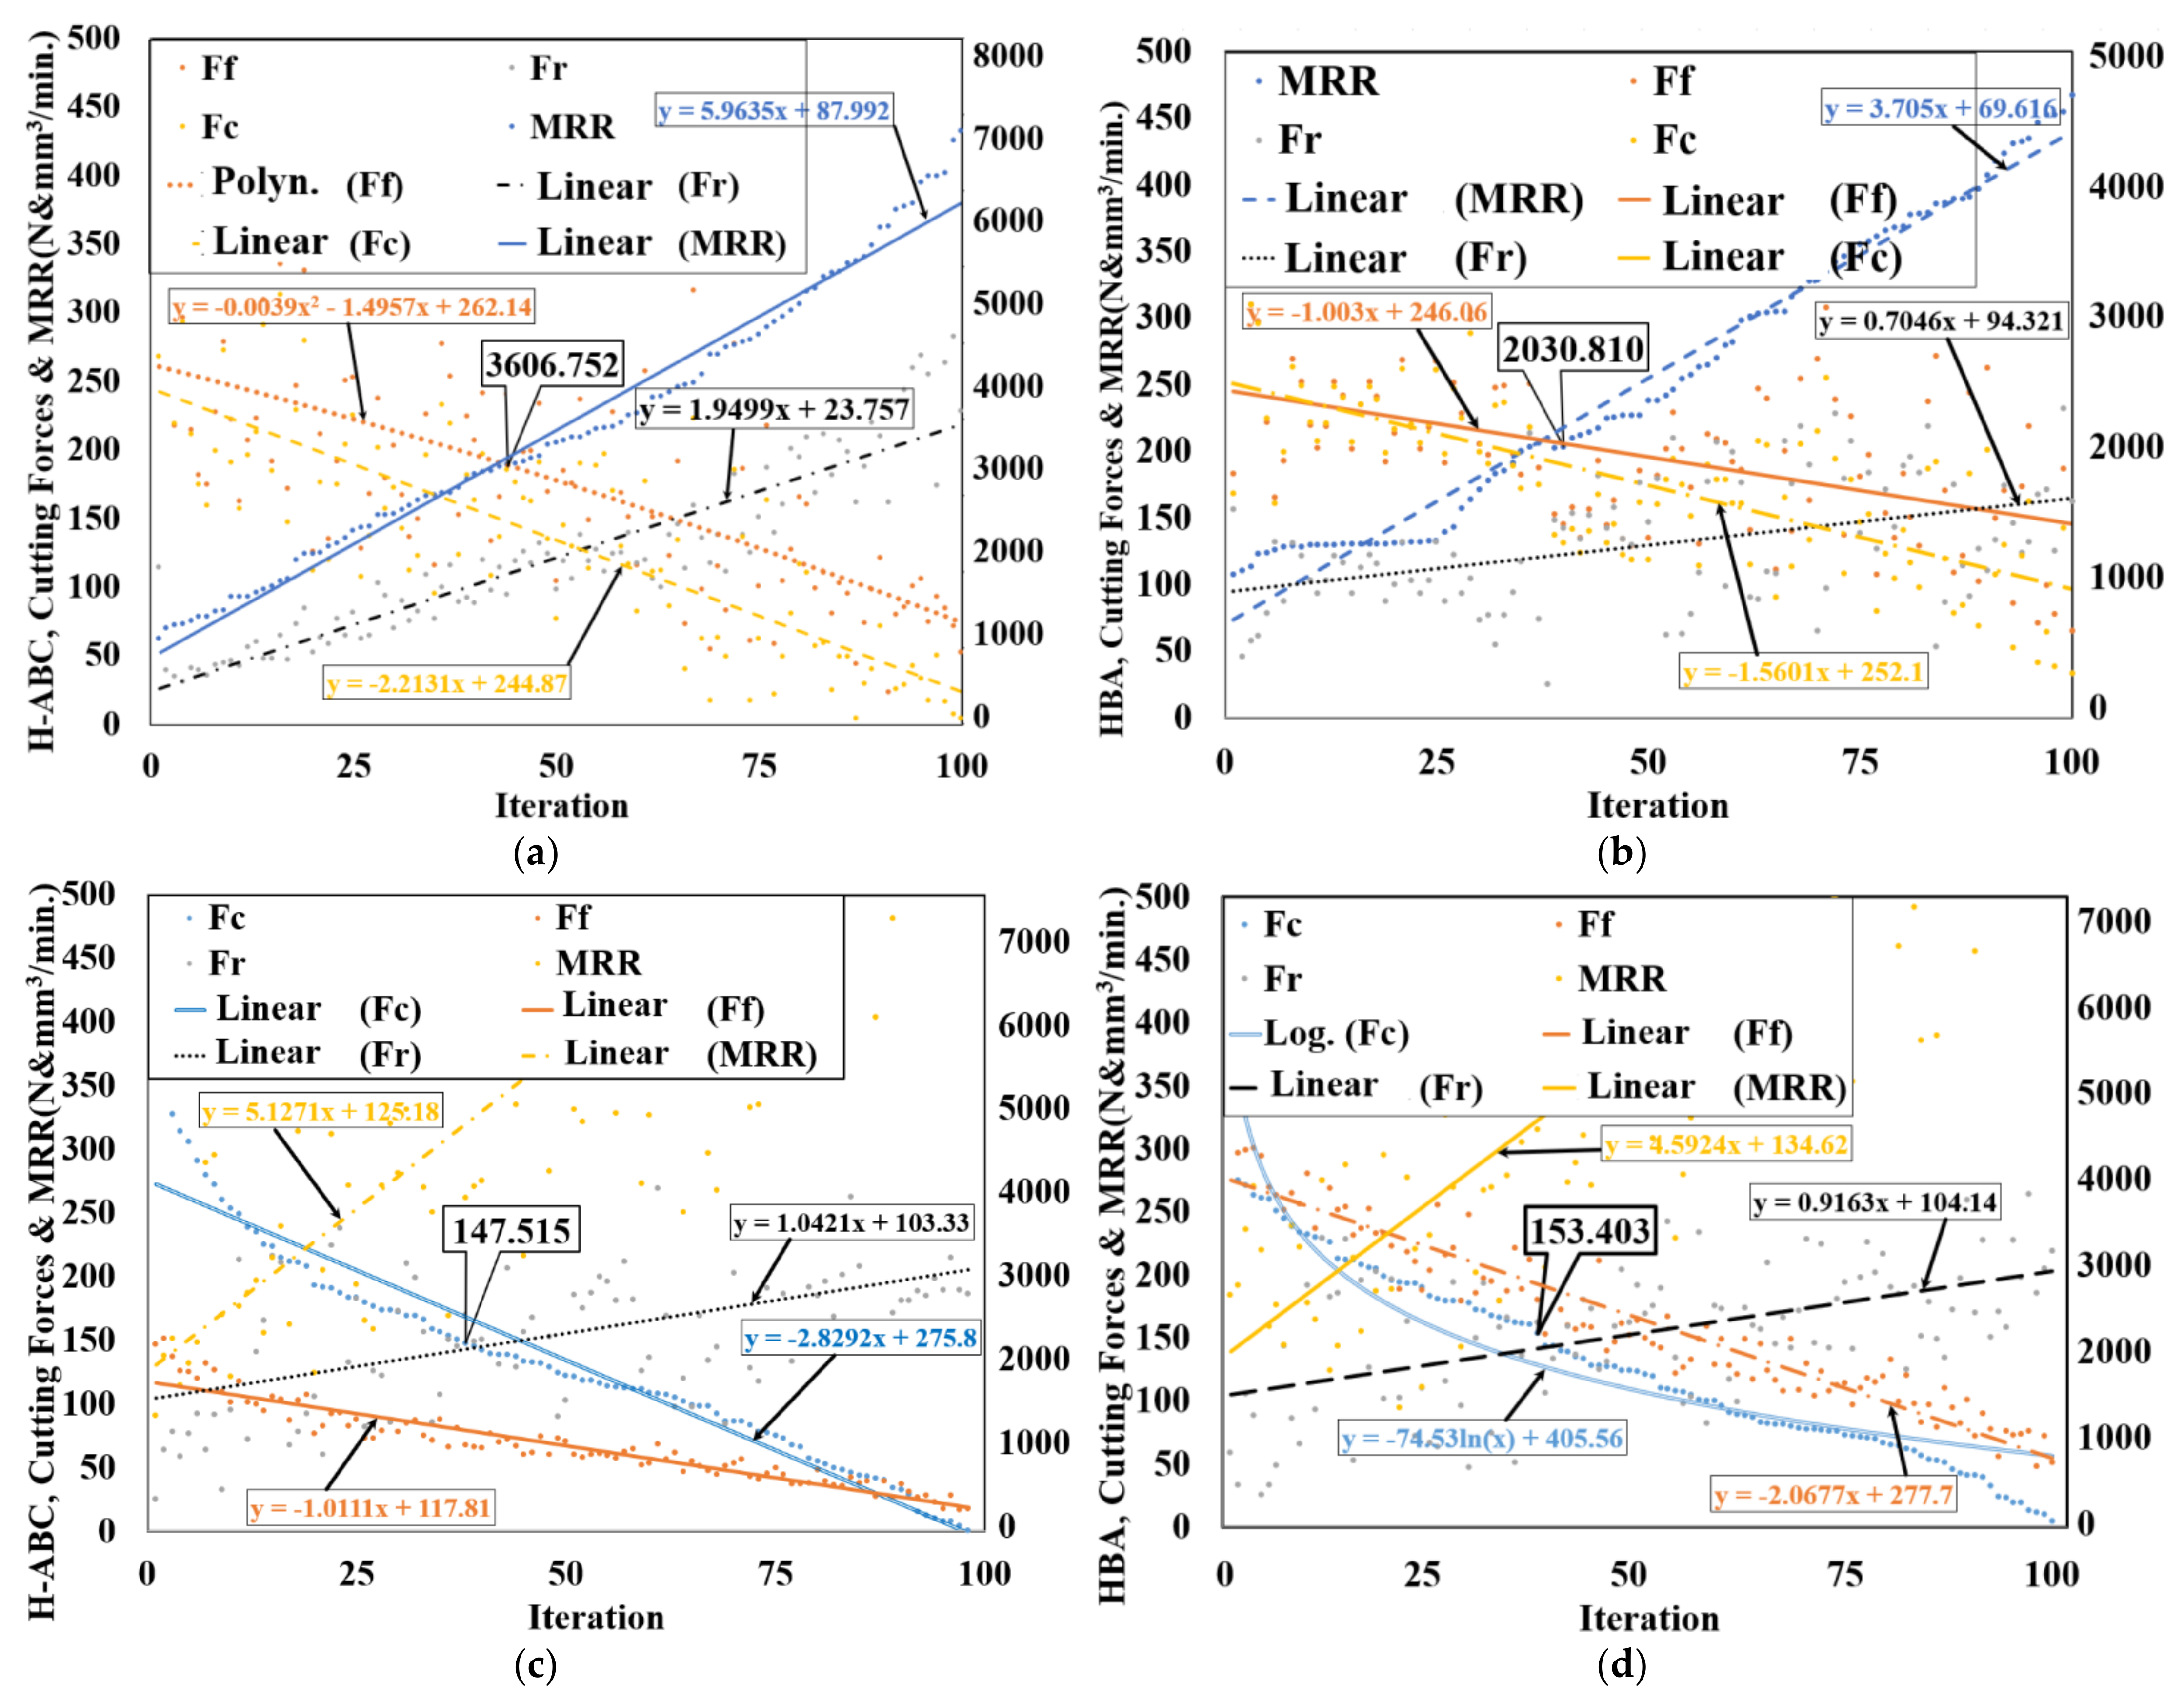
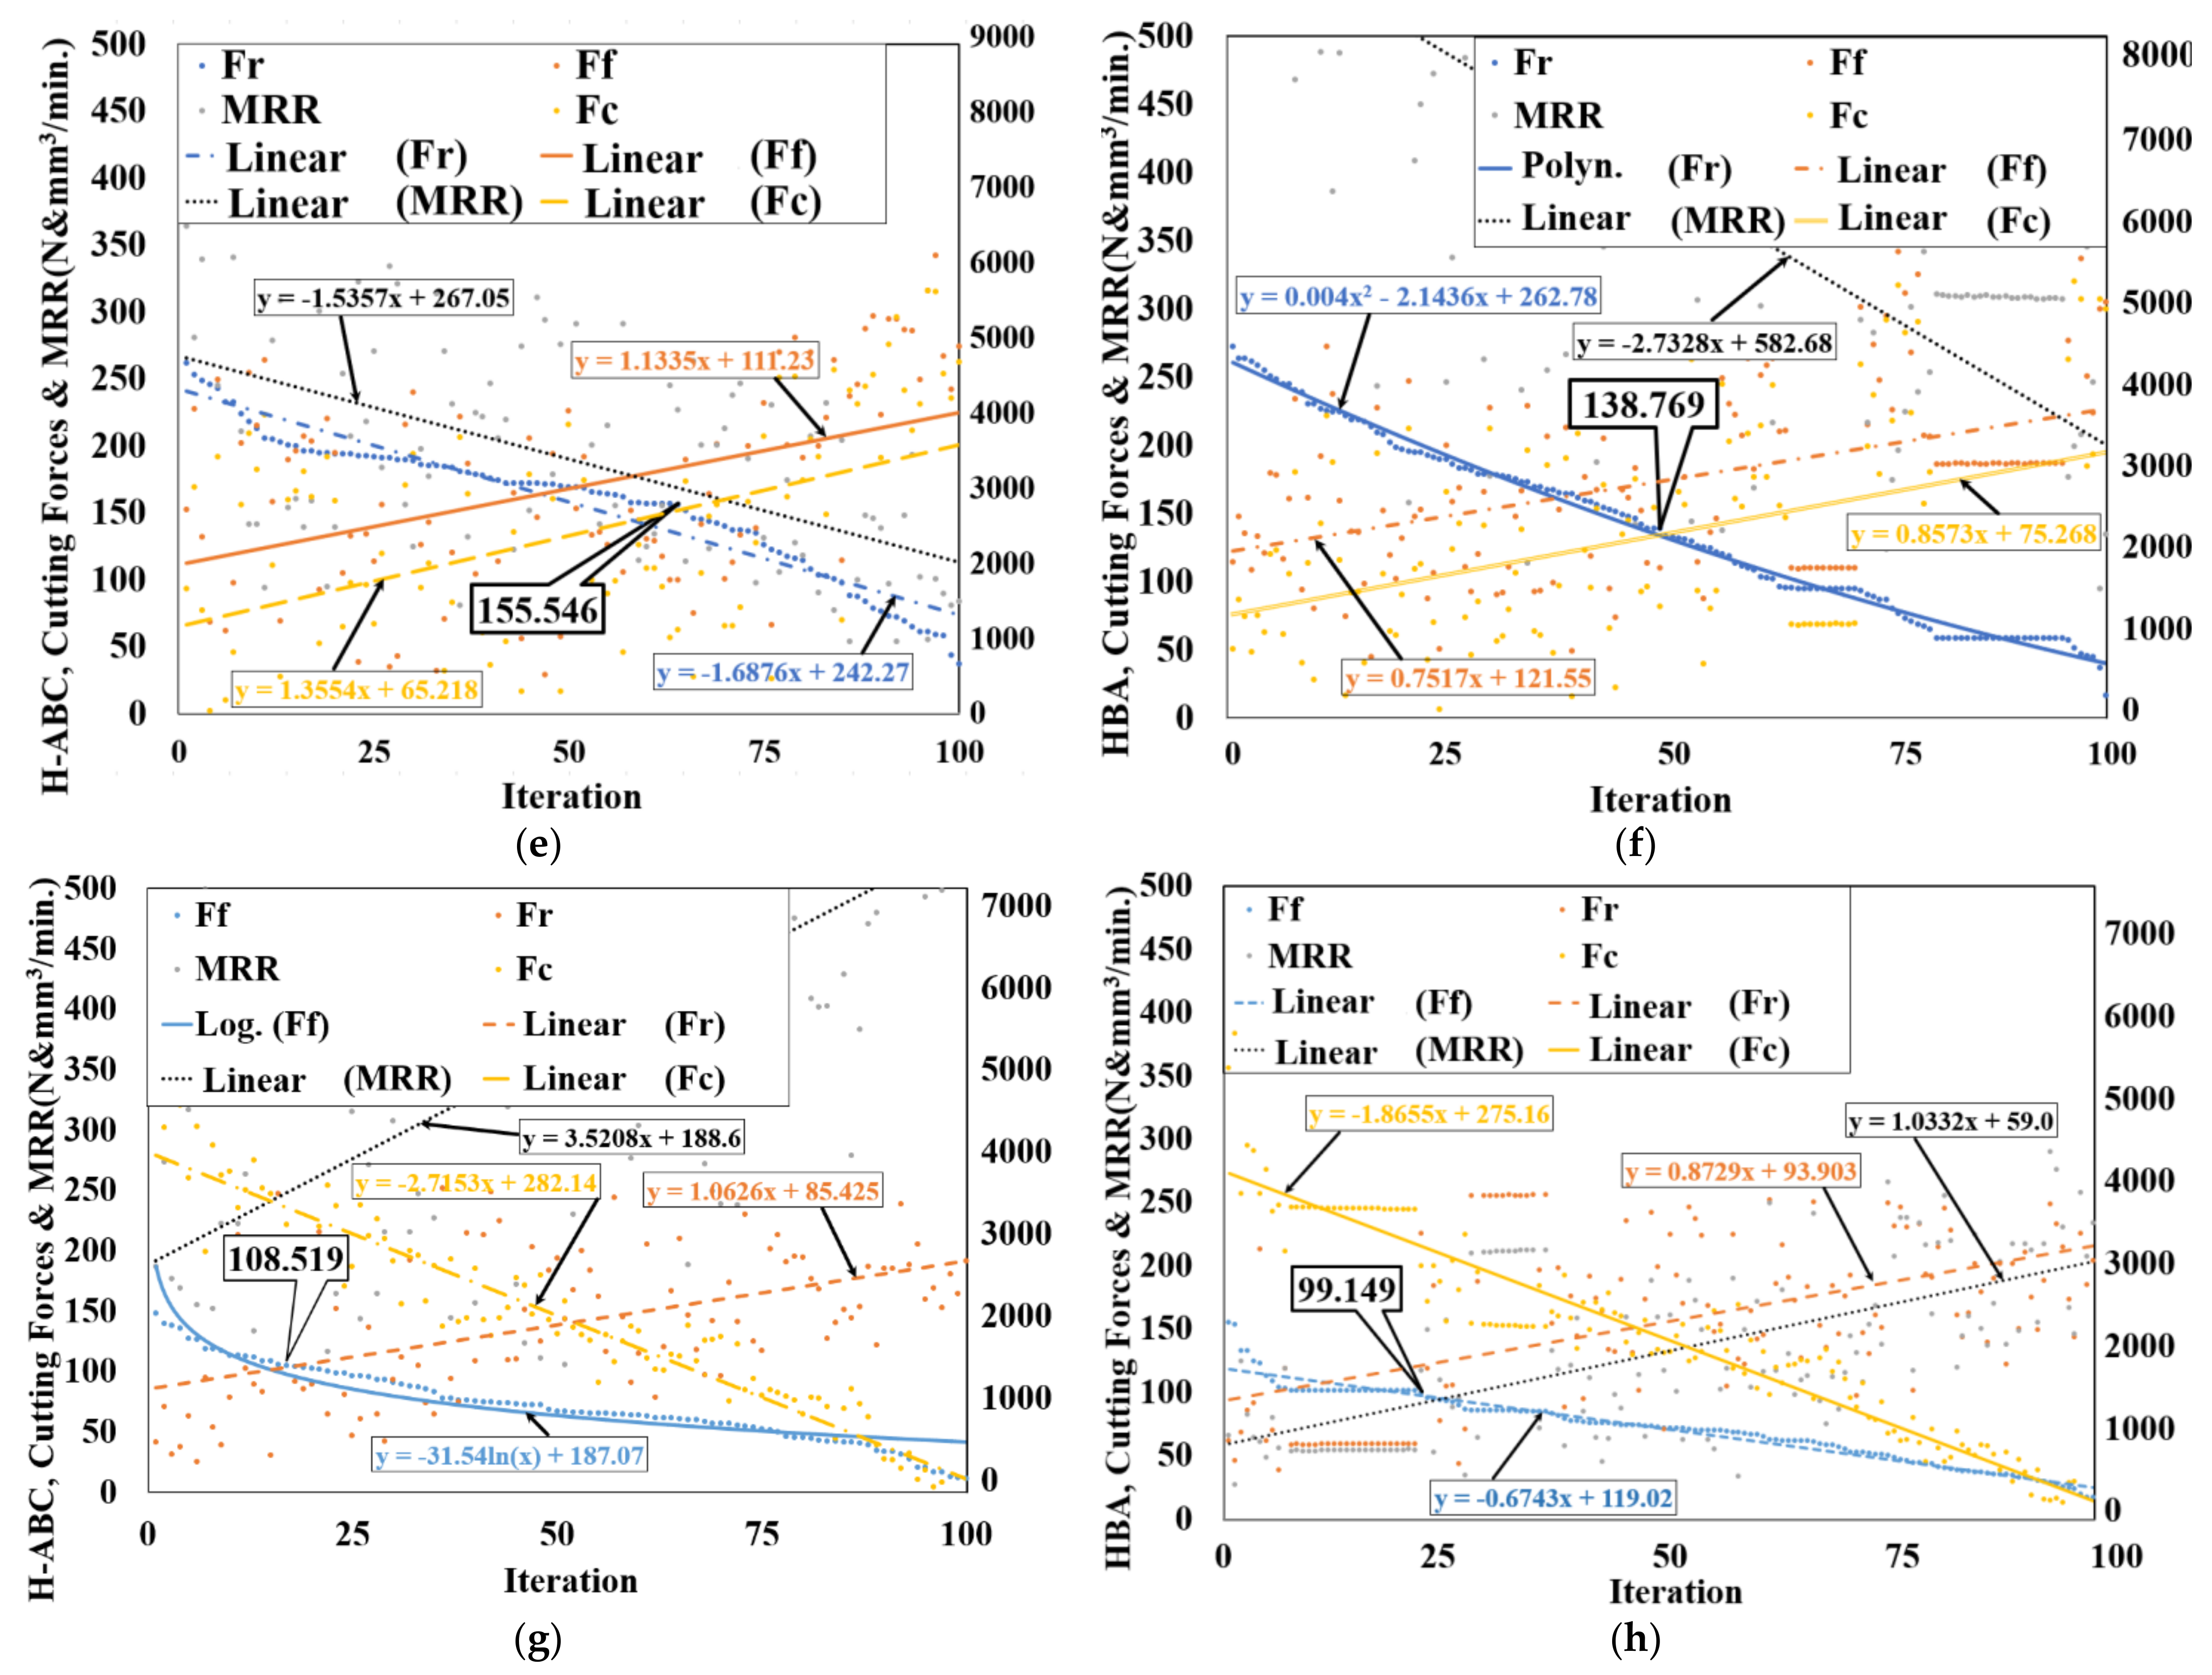
3.1. Optimization with H-ABC and HBA Algorithms

The H-ABC algorithm produces random values for the parameters—cutting speed, feed rate and depth of cut—in the range determined from Table 2. By using the randomly produced parameter values, the objective function for MRR given as in Equation (9) is calculated, sequenced, and compared. The biggest n values are selected in each step, as shown in Figure 4b. When the iteration is completed, the selected best values for MRR are graphed. Additionally, the parameters for the optimal MRR are used to calculate the values of Fc, FF, FR in Equations (4)–(6), respectively. The line fit is drawn for the four objective function values as shown in Figure 5a,c,e and g. The line fits compose a quadrilateral area by intersecting with each other. The optimum value of MRR is at the top of the quadrilateral area. The objective functions Fc, FF, and FR are expected to have the minimum plausible values because the objective function MRR is expected to have maximum plausible value. Therefore, the quadrilateral intersection area of the line fits are used to select the plausible maximum value of MRR instead of a possible maximum value of the Pareto Front. If the possible maximum value of MRR in the Pareto Front were selected, the values of Fc, FF, FR would be unrealistic and counterintuitive. The HBA procedure is shown in Figure 4a. The optimal value is determined in the quadrilateral area as in Figure 5b,d,f and h.
MRR = 3966.67 − 17.5000 · vc − 28333.3 · f − 3173.33 · ap + 1.71857 E − 17 · vc2 +
1.80505 E − 11 · f2 + 125.000 · vc · f − 14.0000 · vc · ap + 22666.7 · f · ap
All of the objective functions are individually optimized by using both H-ABC and HBA. Therefore, mentioning a similar procedure for each of the objective functions is unnecessary. However, there is a different operation step in the optimization of FC, FF, and FR. Because, these objective functions are expected to be minimized, the minimum value of the objective function in the quadrilateral intersection area must be selected as the optimum. H-ABC is used to optimize FR, as shown in Figure 5e. HBA is also used to optimize FR, as shown in Figure 5f. Mostly, the line fits of objective function values were drawn in Figure 5f, although the polynomial curve fit of the values of objective function FR was drawn. Because of this, when it is drawn as a line fit, the quadrilateral intersection area includes no value of FR. A comparative table of all of the values of the objectives and parameters for these optimal selections was given in Table 2. The optimal values of FF are shown in Figure 5g,h, which resulted from H-ABC and HBA, respectively. Because the quadrilateral intersection area does not include FF values when the line fits or polynomial fits are used, the logarithmic curve fitting is preferred, as shown in Figure 5g.
The objective functions are individually optimized in the proposed approach. The algorithms selected the best value for the objective function in each iteration. The selected best values composed a Pareto Front population at the end of the iteration. The Pareto Front of the optimized objective converges to a minimum or maximum value. However, the converged value cannot be selected as the optimum because the problem includes conflicting multiple objective functions. Therefore, all of the objective functions are calculated by using the optimal parameters obtained in each iteration by using the H-ABC or HBA methods. The results of the calculations are taken in the same graph with the optimized objective function. A line fit is then drawn for each of the objective functions. The quadrilateral area formed by intersecting line fits is used to find the optimum of the objective function. When the HM is integrated into the searching steps of the algorithms in Figure 4a,b, the optimization converges upon better solutions. If Table 4 is examined, the most meaningful difference is between the optimal values of MRR resulting from H-ABC or HBA. Therefore, selecting the optimal cutting parameters by using Figure 5a gives the best values. Table 5 represents the optimum results for the HBA and H-ABC methods including the predicted and measured values. The optimal parameters and related responses at these cutting conditions are indicated with their accuracy, respectively. The findings showed that H-ABC optimization is much more effective than HBA in determining the optimum results.

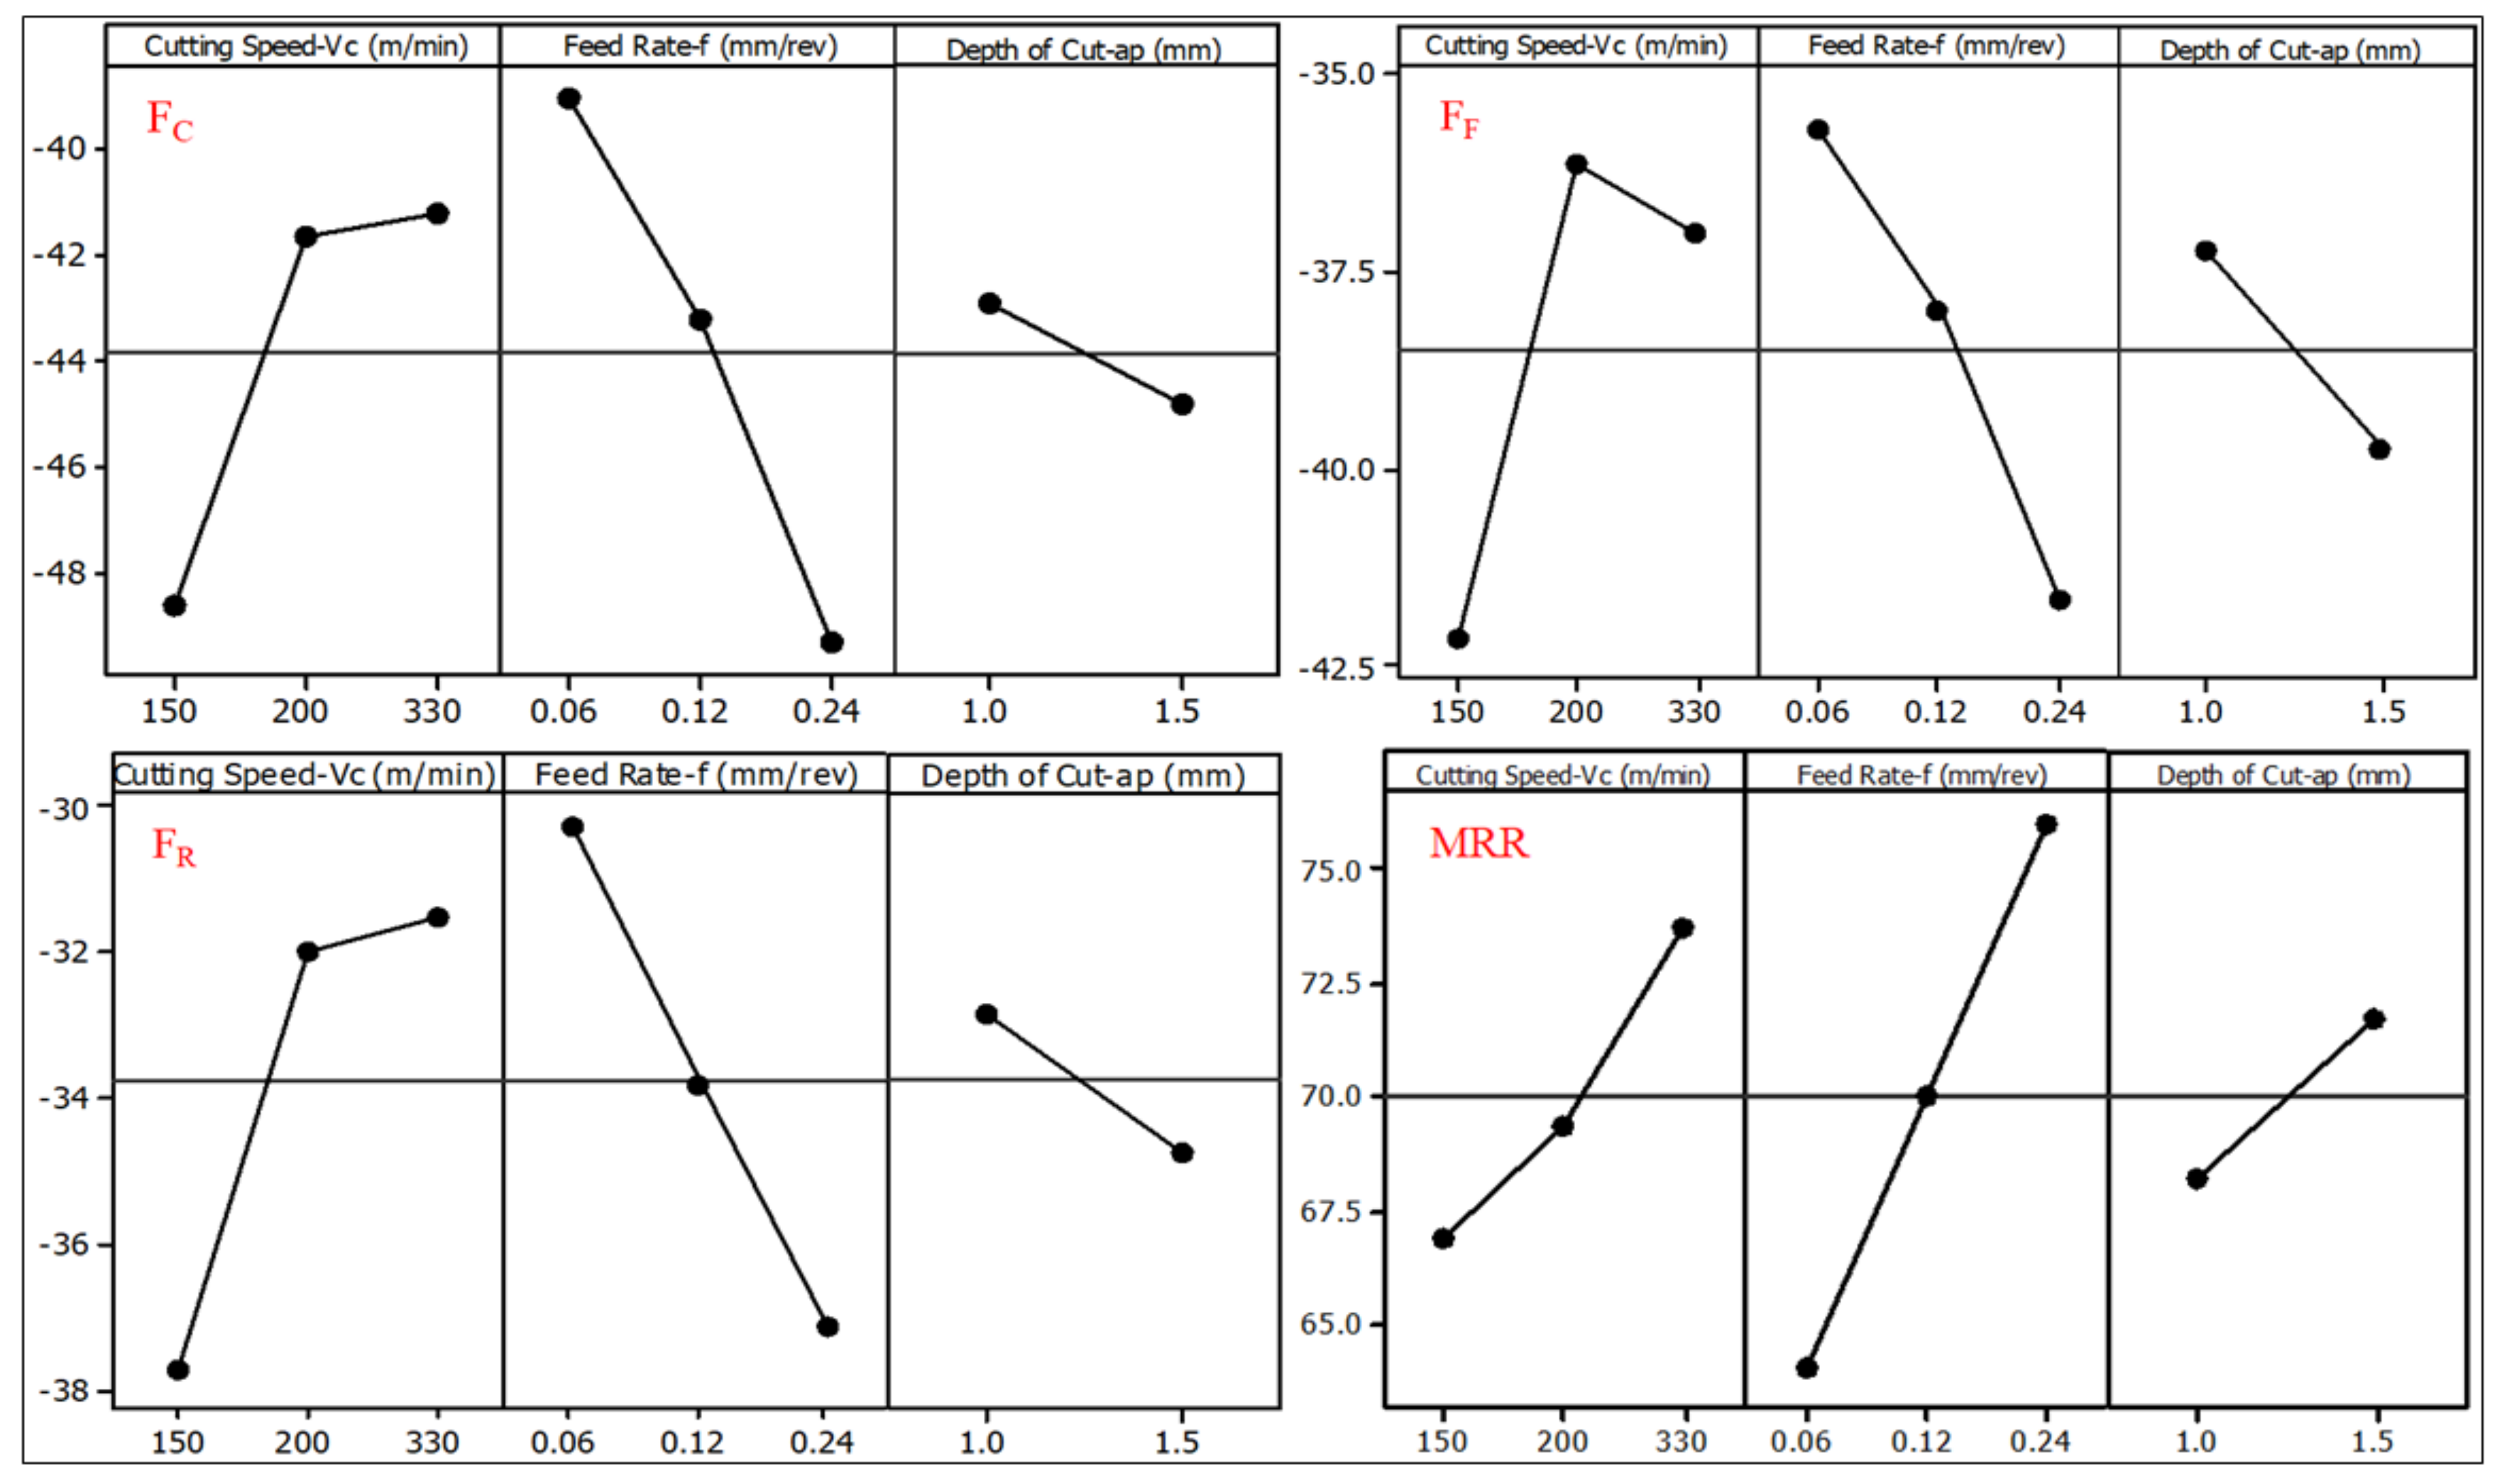
3.2. Optimization with Taguchi S/N Ratio

Taguchi provides the optimum results using the S/N ratio and orthogonal arrays according to an experimental plan. In this study, the “smaller is better” approach was selected for all of the cutting forces, while “larger is better” was chosen for the MRR. The Taguchi-based optimization was carried out using Minitab software in the scope of this study. Figure 6 represents the optimum solutions for the response parameters according to the S/N ratios.
It should be noted that the highest value of the S/N ratio shows the optimum cutting parameter for each result. The results indicated that vC: 330 m/min, f: 0.06 mm/rev, and aP: 1 mm values need to be selected for FC and FR. The FF component is different from the other two cutting forces with vC: 200 m/min. For MRR, the Taguchi approach suggested choosing the highest values for all of the parameters, i.e., vC: 330 m/min, f: 0.24 mm/rev, and aP: 1.5 mm. There is a distinctive difference between the cutting forces and MRR in that the feed rate and depth of cut influence them oppositely. FC was found as 55.78 N according to the calculated S/N ratios; the optimum value is shown in the experiment table. The FF component was found as 45.78 N, which demonstrates the difference between the minimum values 36.45 N with a 20% error rate. The FR value was obtained as 21.45 N while the minimum value was observed as 19.77 N, which had 8% error rate. The obtained optimal solutions with the Taguchi method exist in the original experimental plan; therefore, there is no need for confirmation experiments.

3.3. Optimization with Response Surface Methodology

The employment of the RSM was carried out using Minitab software for multiple optimizations of the response parameters. It was created as a response surface design, and the analysis of this design was performed using analysis of variance. In this analysis process, cross-interaction between parameters was considered. In order to evaluate the parameters as interactive, the optimization approach is listed in Table 5. While building the models, toward the mechanism of turning and the objective of the study, the cutting forces were minimized and the MRR was maximized. The lower and upper values belonging to each parameter were selected from the results table and the target value was assigned according to the objective function. For a clear definition of the optimized parameters, the weight and importance values were determined as 1. Applying the mentioned specifications, the predicted values with their desirability are indicated. For multiple optimizations, vC: 280 m/min, f: 0.18 mm/rev, and aP: 1 mm were found as the optimum solutions. Remarkably, the multiple optimization approach reduces the desirability of each cutting force parameter and MRR, especially. The composite desirability here is calculated by the following formula:
(d1 × d2 × d3 × d4)1/n*
Here, d1–4 represents the desirability of each individual parameter, and n is the signature of the number of parameters.
The possibility of applying both mono and multiple optimizations provides an extended point of view for the producer and researcher. Because machining has a variety of parameters and customers have several demands, these various options to optimize the responses are beneficial in different ways. Therefore, it is possible to present different advantages to meet the expectations. In Table 6, multiple optimization results for selected responses are demonstrated as a list. First, the predicted values with RSM and their confirmed experimental results are given. The difference between them is calculated and identified with accuracy and error rates. Then, the optimum values for each parameter obtained from the experiment table are listed and their error rates are also calculated. The results show that high accuracy can be obtained via RSM in multiple optimizations for the MRR and FR parameters, and the proximity of these results to the optimum values is satisfying. It was decided that using this method is reliable, considering all of the responses without looking at the partial high error rates for tangential and axial cutting forces.

4. Discussion

The Taguchi method is widely used in engineering applications. Because Taguchi applies a guaranteed design approach, high-quality solutions and reliable optimization can be obtained. The only drawback of Taguchi is the lack of multiple optimization options. RSM is also a highly reliable technique practice for mono and multiple optimizations, which are popular in the field of machining. On the other hand, nature-inspired algorithms develop and apply optimization procedures that need to be integrated and experienced many times in order to validate their competence. The existence of the widespread applications of traditional methods gives researchers different points of view in order to obtain the best choices in the experiments. However, the new generation of optimization methods is hard to compare within itself and with other methods. Especially for nature-inspired algorithms, they are highly available for development because the structure is based on the observation of natural events. It is recommended that these methods should be tried for different types of machining studies.
Table 7 includes the optimum conditions, the desirability of each response parameter and their total desirability for the Taguchi, RSM, HBA and H-ABC algorithms, respectively. All of the optimized solutions were evaluated and compared with the predicted values calculated in the previous sections. In Table 7, we discuss their total effectiveness in optimizing the cutting force components and MRR at the same time. For the calculation of the provided values, the maximum and minimum values in the experimental table are regarded as the references in order to determine desirability. After calculating each desirability function belonging to the response parameters, the total desirability is found. Taguchi’s approach provided three optimum conditions, while the others served one solution. As such, six different optimized parameter series were identified. Accordingly, individual and composite desirability values are achieved, because the RSM has the most accurate composite desirability (72.1%), followed by the H-ABC algorithm (64%). For the individual success of the responses under these two methods, H-ABC seems more effective to obtain the optimum cutting forces; however, the RSM is much better for the acquisition of the maximum MRR. In order to determine the optimal solution, this extended approach provides a perspective in manufacturing. Except for this, other methods may provide excellent solutions for specified cutting force/s, but which are insufficient for composite desirability. The Pareto frontiers of the parameters for different types of optimization methods are shown in Figure 7. The findings also confirm the calculated results, as explained and demonstrated before in the paper.

5. Conclusions

Optimization is one of the important approaches to solve engineering problems, and it brings many advantages when an approach is accurately modified and integrated. The main contribution of the optimization approach is bringing productivity with a reduction in costs. As a result, each parameter can be optimized for efficient manufacturing with minimal errors in less time. To this end, it is significant to work under cutting conditions determined for the sustainability of the manufacturing chain. In the context of this study, it is desirable to present different approaches such as RSM, Taguchi S/N ratio, H-ABC, and HBA algorithms for the comparison of their success in parametric optimization. The integration of nature-inspired algorithms into machining operations for the optimization process is rarely seen in the open literature. Here, for the first time, optimization approaches were compared for MRR and cutting forces. In addition to the comparison of different types of optimization methods, the newly developed H-ABC algorithm was also adopted for turning operations. From the findings of the study, the following inferences can be made:
  • Although traditional methods such as Taguchi and RSM provided reliable optimum results in the past, new methods should be applied to turning operations and related academic studies in order to understand their capabilities.
  • The complexity of the machining operations makes it hard to reach optimal solutions for cutting parameters. Therefore, it is very important to obtain the best results for improved machining quality. However, momentary alterations due to vibrations and tool wear, etc., usually lead to underperformance relative to the purposed performance criteria. The main aim here was to observe which optimization approach provides the best solution in terms of cutting forces. We expected to obtain limited results because MRR and cutting forces require opposite levels of cutting parameters. If one approach is aimed purely at MRR or cutting forces, higher accuracy can be determined.
  • Taguchi presents absolute solutions concerned with the experimental plan. In this way, the optimized parameters and results can be found without additional experiments. Because the method provides only individual optimization, it is not possible to observe the interactive solutions. Thus, Taguchi explored the experimental lines which lead to reduced error rates in the predicted response parameters, such as FC and MRR (0%), FF (20%), FR (8%).
  • RSM gives multiple optimization results at intermediate values which require further confirmation experiments. According to the results, vc = 280 m/min, f = 0.18 mm/rev, and aP = 1 mm values were determined as the optimum solution by RSM. An additional experiment was carried out under these cutting conditions, which exhibited the high accuracy (80.2–98.3%) and validity of the model.
  • The comparison of the two nature-inspired algorithms demonstrated that the newly developed H-ABC showed preferable results compared to the HBA algorithm. The FC, FF and MRR parameters were obtained with high accuracy (91%, 84.3% and 84.6%), and FR was achieved within an acceptable error rate (28.7%). The HBA algorithm indicated low accuracy for all of the response parameters.
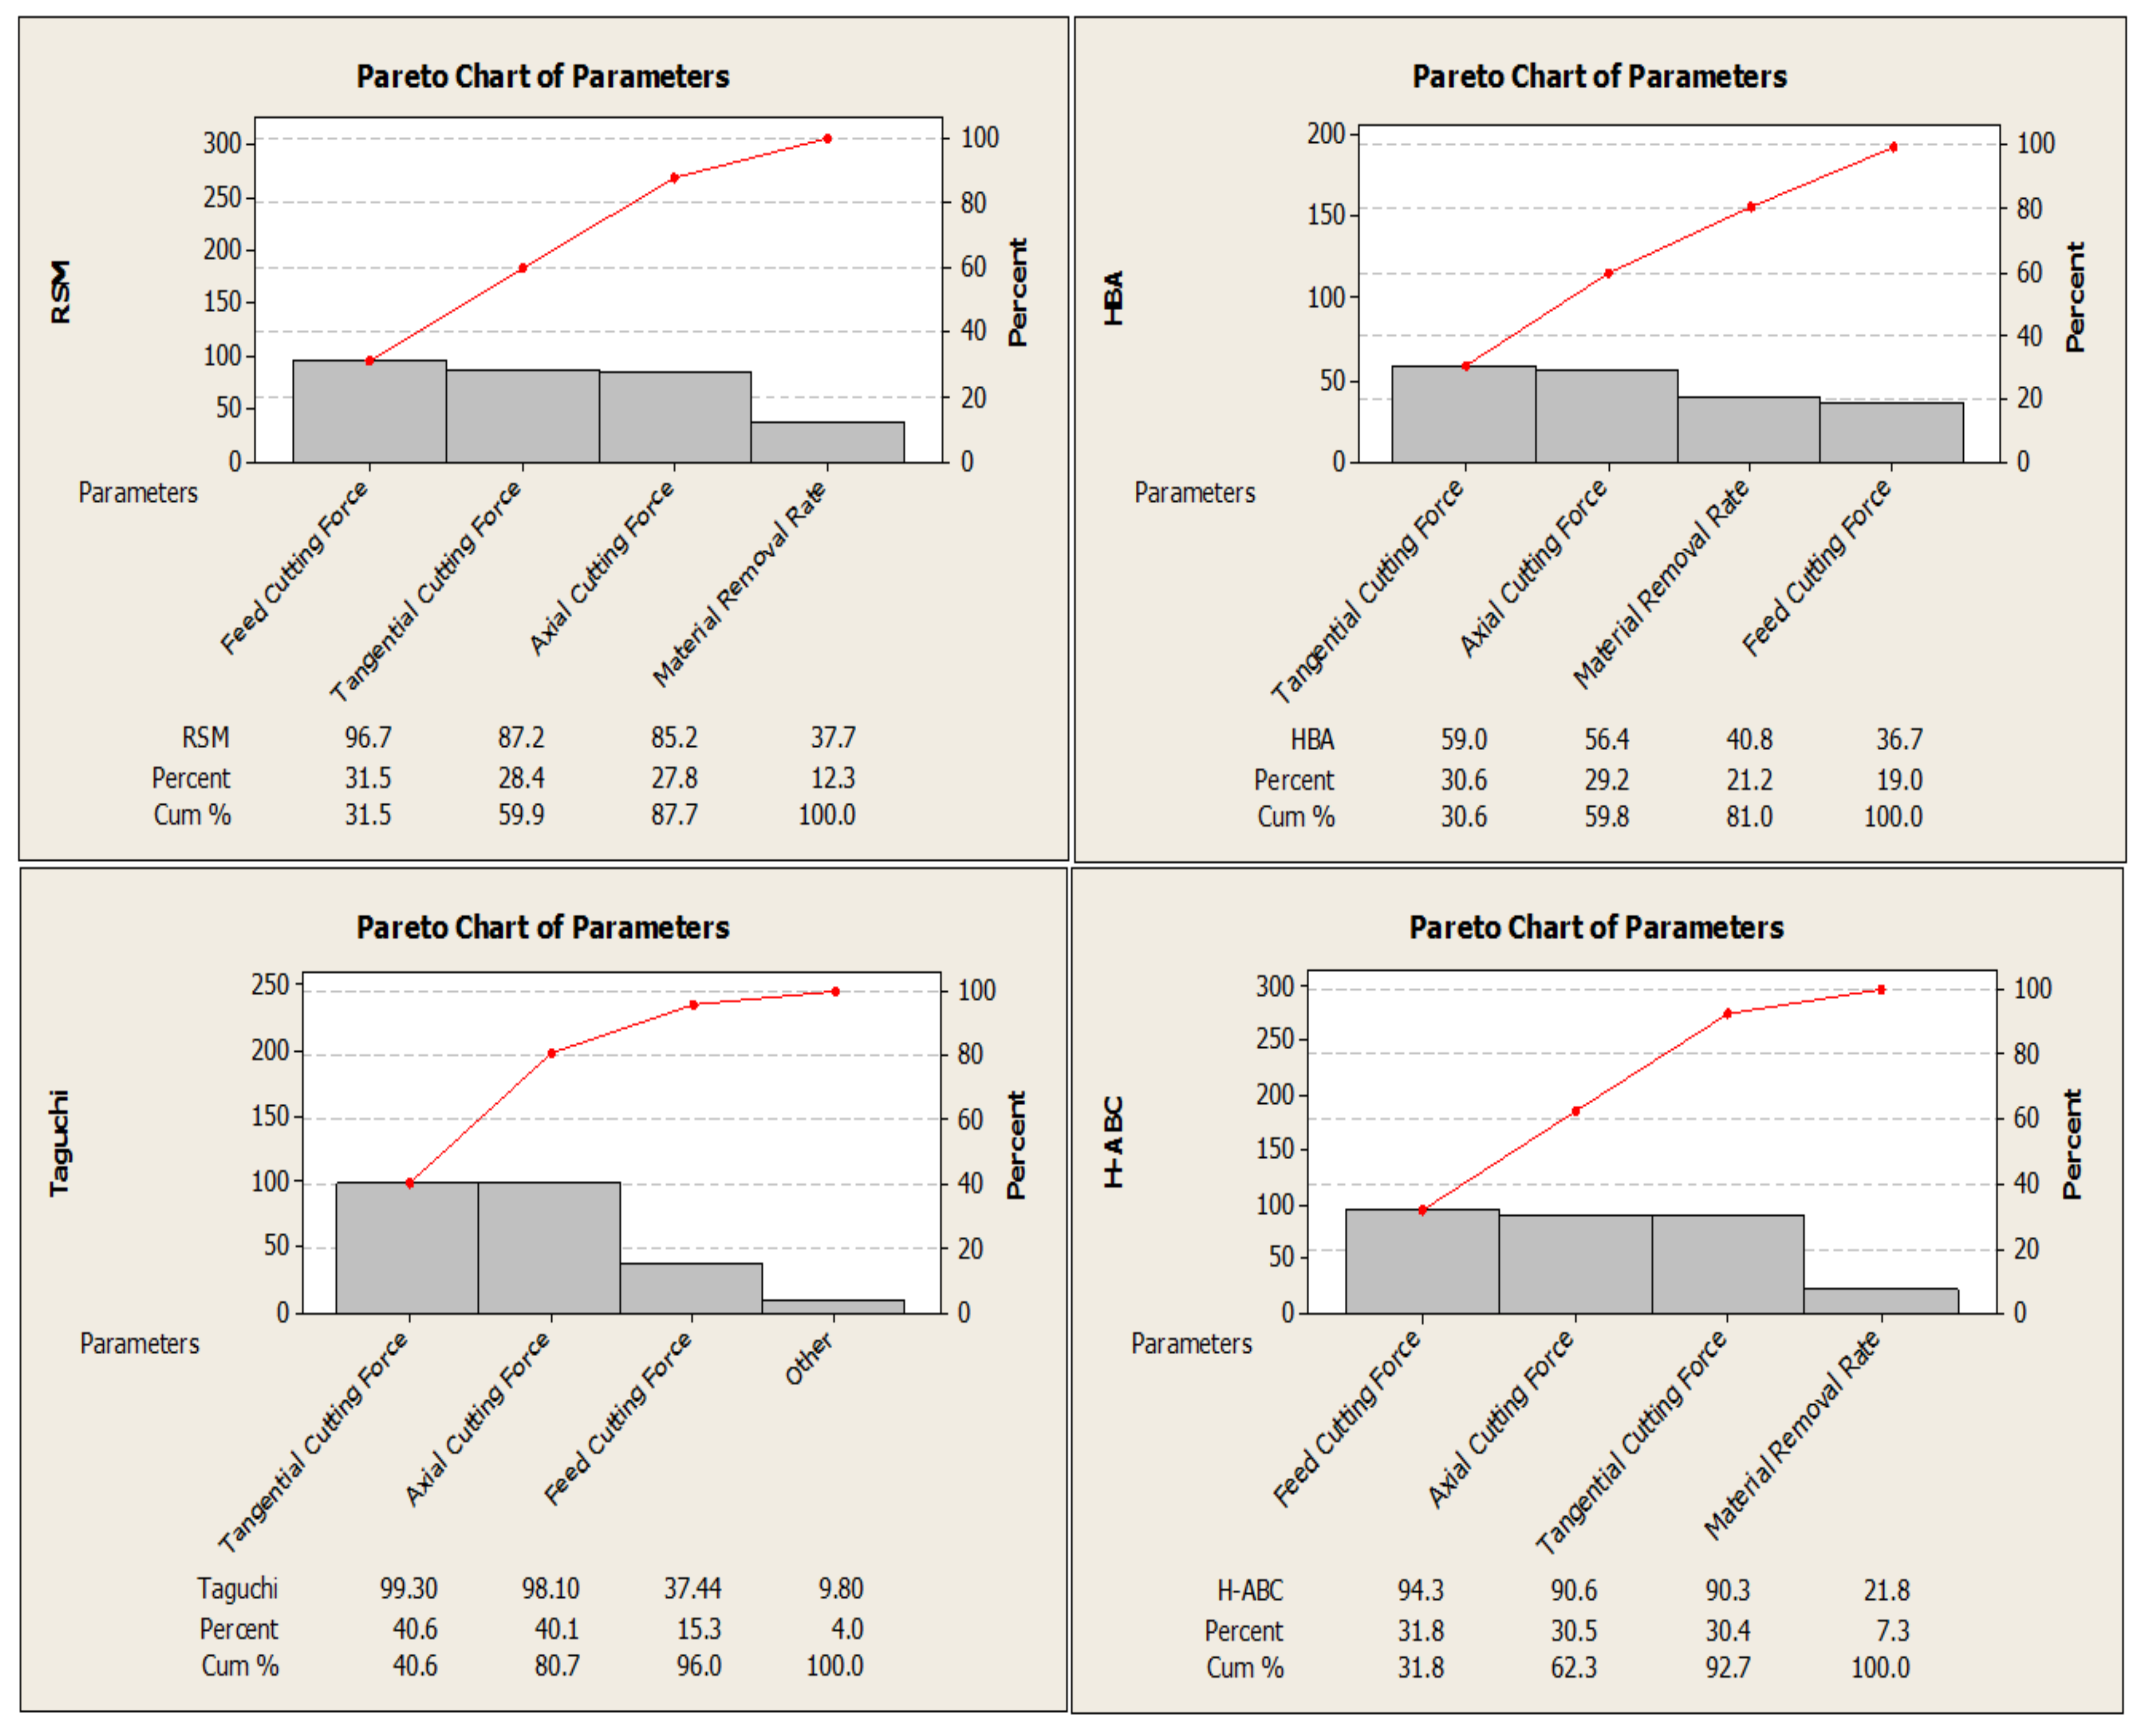
  • In order to compare the four optimization methods and provide a clear discussion about their success, the individual and composite desirability of each method for FC, MRR, FF, and FR were calculated. Accordingly, RSM and H-ABC provide higher composite desirability with 72.1% and 64%, respectively, compared to Taguchi (40.2–43.4%) and HBA (47.2%). Because RSM and H-ABC prove the validity with additional experiments, good desirability ratios make them useful for simultaneous optimization.

Author Contributions

Conceptualization, M.K., O.A.; Methodology, M.K., O.A.; Software, M.K., O.A.; Validation, M.K., O.A., H.S., M.K.G.; Analysis, M.K., O.A.; Investigation, M.K., O.A., Resources, M.K., O.A., M.S., H.S., M.K.G., D.Y.P.; Writing—Review and Editing, M.K., O.A., M.K.G., H.S., M.S., K.G., D.Y.P.; Visualization, M.K., O.A., M.K.G.; Supervision, H.S., M.K.G., O.A., M.S., K.G., D.Y.P.; Project Administration, H.S.; Funding Acquisition, K.G., D.Y.P. All authors have read and agreed to the published version of the manuscript.

Funding

This research received no external funding.

Institutional Review Board Statement

Not applicable.

Data Availability Statement

Not applicable.

Conflicts of Interest

The authors declare no conflict of interest.

Nomenclature

FCTangential cutting force
FFAxial cutting force
FRRadial cutting force
S/NTaguchi signal-to-noise ratio
HBAHarmonic bee algorithm
H-ABCHarmonic artificial bee colony algorithm
RSMResponse surface methodology

References

  1. Gupta, M.K.; Song, Q.; Liu, Z.; Sarikaya, M.; Mia, M.; Jamil, M.; Singla, A.K.; Bansal, A.; Pimenov, D.Y.; Kuntoğlu, M. Tribological performance based machinability investigations in cryogenic cooling assisted turning of α-β titanium alloy. Tribol. Int. 2021, 160, 107032. [Google Scholar] [CrossRef]
  2. Kundrak, J.; Molnar, V.; Deszpoth, I. Comparative analysis of machining procedures. Machines 2018, 6, 13. [Google Scholar] [CrossRef] [Green Version]
  3. Gupta, M.K.; Mia, M.; Pruncu, C.I.; Kapłonek, W.; Nadolny, K.; Patra, K.; Mikolajczyk, T.; Pimenov, D.Y.; Sarikaya, M.; Sharma, V.S. Parametric optimization and process capability analysis for machining of nickel-based superalloy. Int. J. Adv. Manuf. Technol. 2019, 102, 3995–4009. [Google Scholar] [CrossRef] [Green Version]
  4. Kuntoğlu, M.; Sağlam, H. Investigation of signal behaviors for sensor fusion with tool condition monitoring system in turning. Measurement 2021, 173, 108582. [Google Scholar] [CrossRef]
  5. Razeghiyadaki, A.; Molardi, C.; Talamona, D.; Perveen, A. Modeling of material removal rate and surface roughness generated during electro-discharge machining. Machines 2019, 7, 47. [Google Scholar] [CrossRef] [Green Version]
  6. Su, Y.; Zhao, G.; Zhao, Y.; Meng, J.; Li, C. Multi-objective optimization of cutting parameters in turning aisi 304 austenitic stainless steel. Metals 2020, 10, 217. [Google Scholar] [CrossRef] [Green Version]
  7. Kilickap, E.; Yardimeden, A.; Çelik, Y.H. Mathematical modelling and optimization of cutting force, tool wear and surface roughness by using artificial neural network and response surface methodology in milling of ti-6242s. Appl. Sci. 2017, 7, 1064. [Google Scholar] [CrossRef] [Green Version]
  8. Vu, N.-P.; Nguyen, Q.-T.; Tran, T.-H.; Le, H.-K.; Nguyen, A.-T.; Luu, A.-T.; Nguyen, V.-T.; Le, X.-H. Optimization of grinding parameters for minimum grinding time when grinding tablet punches by cbn wheel on cnc milling machine. Appl. Sci. 2019, 9, 957. [Google Scholar] [CrossRef] [Green Version]
  9. Azim, S.; Noor, S.; Khalid, Q.S.; Khan, A.M.; Pimenov, D.Y.; Ahmad, I.; Babar, A.R.; Pruncu, C.I. Sustainable manufacturing and parametric analysis of mild steel grade 60 by deploying cnc milling machine and taguchi method. Metals 2020, 10, 1303. [Google Scholar] [CrossRef]
  10. Markopoulos, A.P.; Karkalos, N.E.; Mia, M.; Pimenov, D.Y.; Gupta, M.K.; Hegab, H.; Khanna, N.; Aizebeoje Balogun, V.; Sharma, S. Sustainability assessment, investigations, and modelling of slot milling characteristics in eco-benign machining of hardened steel. Metals 2020, 10, 1650. [Google Scholar] [CrossRef]
  11. Pimenov, D.Y.; Abbas, A.T.; Gupta, M.K.; Erdakov, I.N.; Soliman, M.S.; El Rayes, M.M. Investigations of surface quality and energy consumption associated with costs and material removal rate during face milling of aisi 1045 steel. Int. J. Adv. Manuf. Technol. 2020, 107, 3511–3525. [Google Scholar] [CrossRef]
  12. Lyu, Y.; Jamil, M.; He, N.; Gupta, M.K.; Pimenov, D.Y. Development and testing of a high-frequency dynamometer for high-speed milling process. Machines 2021, 9, 11. [Google Scholar] [CrossRef]
  13. Yaldız, S.; Ünsaçar, F. A dynamometer design for measurement the cutting forces on turning. Measurement 2006, 39, 80–89. [Google Scholar] [CrossRef]
  14. Kuntoğlu, M.; Aslan, A.; Pimenov, D.Y.; Usca, Ü.A.; Salur, E.; Gupta, M.K.; Mikolajczyk, T.; Giasin, K.; Kapłonek, W.; Sharma, S. A review of indirect tool condition monitoring systems and decision-making methods in turning: Critical analysis and trends. Sensors 2020, 21, 108. [Google Scholar] [CrossRef]
  15. Salur, E.; Aslan, A.; Kuntoğlu, M.; Güneş, A.; Şahin, Ö.S. Optimization of cutting forces during turning of composite materials. Acad. Platf. J. Eng. Sci. 2020, 8, 423–431. [Google Scholar] [CrossRef]
  16. Kuntoğlu, M.; Sağlam, H. Investigation of progressive tool wear for determining of optimized machining parameters in turning. Measurement 2019, 140, 427–436. [Google Scholar] [CrossRef]
  17. Laghari, R.A.; Li, J.; Mia, M. Effects of turning parameters and parametric optimization of the cutting forces in machining sicp/al 45 wt% composite. Metals 2020, 10, 840. [Google Scholar] [CrossRef]
  18. Zerti, A.; Yallese, M.A.; Meddour, I.; Belhadi, S.; Haddad, A.; Mabrouki, T. Modeling and multi-objective optimization for minimizing surface roughness, cutting force, and power, and maximizing productivity for tempered stainless steel aisi 420 in turning operations. Int. J. Adv. Manuf. Technol. 2019, 102, 135–157. [Google Scholar] [CrossRef]
  19. Toulfatzis, A.I.; Pantazopoulos, G.A.; David, C.N.; Sagris, D.S.; Paipetis, A.S. Machinability of eco-friendly lead-free brass alloys: Cutting-force and surface-roughness optimization. Metals 2018, 8, 250. [Google Scholar] [CrossRef] [Green Version]
  20. Selvaraj, D.P.; Chandramohan, P.; Mohanraj, M. Optimization of surface roughness, cutting force and tool wear of nitrogen alloyed duplex stainless steel in a dry turning process using taguchi method. Measurement 2014, 49, 205–215. [Google Scholar] [CrossRef]
  21. Aouici, H.; Yallese, M.A.; Chaoui, K.; Mabrouki, T.; Rigal, J.-F. Analysis of surface roughness and cutting force components in hard turning with cbn tool: Prediction model and cutting conditions optimization. Measurement 2012, 45, 344–353. [Google Scholar] [CrossRef]
  22. Aslan, A. Optimization and analysis of process parameters for flank wear, cutting forces and vibration in turning of aisi 5140: A comprehensive study. Measurement 2020, 163, 107959. [Google Scholar] [CrossRef]
  23. Leksycki, K.; Feldshtein, E.; Lisowicz, J.; Chudy, R.; Mrugalski, R. Cutting forces and chip shaping when finish turning of 17-4 ph stainless steel under dry, wet, and mql machining conditions. Metals 2020, 10, 1187. [Google Scholar] [CrossRef]
  24. Lalwani, D.; Mehta, N.; Jain, P. Experimental investigations of cutting parameters influence on cutting forces and surface roughness in finish hard turning of mdn250 steel. J. Mater. Process. Technol. 2008, 206, 167–179. [Google Scholar] [CrossRef]
  25. Korkmaz, M.E.; Yaşar, N.; Günay, M. Numerical and experimental investigation of cutting forces in turning of nimonic 80a superalloy. Eng. Sci. Technol. Int. J. 2020, 23, 664–673. [Google Scholar] [CrossRef]
  26. Bouzid, L.; Boutabba, S.; Yallese, M.A.; Belhadi, S.; Girardin, F. Simultaneous optimization of surface roughness and material removal rate for turning of x20cr13 stainless steel. Int. J. Adv. Manuf. Technol. 2014, 74, 879–891. [Google Scholar] [CrossRef]
  27. Mia, M.; Dey, P.R.; Hossain, M.S.; Arafat, M.T.; Asaduzzaman, M.; Ullah, M.S.; Zobaer, S.T. Taguchi s/n based optimization of machining parameters for surface roughness, tool wear and material removal rate in hard turning under mql cutting condition. Measurement 2018, 122, 380–391. [Google Scholar] [CrossRef]
  28. Kaladhar, M. Evaluation of hard coating materials performance on machinability issues and material removal rate during turning operations. Measurement 2019, 135, 493–502. [Google Scholar] [CrossRef]
  29. Kini, M.V.; Chincholkar, A. Effect of machining parameters on surface roughness and material removal rate in finish turning of ±30 glass fibre reinforced polymer pipes. Mater. Des. 2010, 31, 3590–3598. [Google Scholar] [CrossRef]
  30. Kumar, S.L. Measurement and uncertainty analysis of surface roughness and material removal rate in micro turning operation and process parameters optimization. Measurement 2019, 140, 538–547. [Google Scholar] [CrossRef]
  31. Yildiz, A.R. Optimization of cutting parameters in multi-pass turning using artificial bee colony-based approach. Inf. Sci. 2013, 220, 399–407. [Google Scholar] [CrossRef]
  32. Prasanth, R.S.S.; Raj, K.H. Optimization of straight cylindrical turning using artificial bee colony (abc) algorithm. J. Inst. Eng. (India) Ser. C 2017, 98, 171–177. [Google Scholar] [CrossRef]
  33. Öztürk, O.; Kalyoncu, M.; Ünüvar, A. Multi objective optimization of cutting parameters in a single pass turning operation using the bees algorithm. In Proceedings of the 1st International Conference on Advances in Mechanical and Mechatronics Engineering, Ankara, Turkey, 8–9 November 2018. [Google Scholar]
  34. Bhor, Y.; Kakuste, N.S.; Gaynar, S. Optimization of Turning Parameters Using Taguchi’s Method and Artificial Bee Colony Algorithm; IOP Conference Series: Materials Science and Engineering; IOP Publishing: Bristol, UK, 2020; p. 012064. [Google Scholar]
  35. Shettigar, A.K.; Patel, G.M.; Chate, G.R.; Vundavilli, P.R.; Parappagoudar, M.B. Artificial bee colony, genetic, back propagation and recurrent neural networks for developing intelligent system of turning process. SN Appl. Sci. 2020, 2, 1–21. [Google Scholar] [CrossRef] [Green Version]
  36. Kuntoğlu, M.; Aslan, A.; Pimenov, D.Y.; Giasin, K.; Mikolajczyk, T.; Sharma, S. Modeling of cutting parameters and tool geometry for multi-criteria optimization of surface roughness and vibration via response surface methodology in turning of aisi 5140 steel. Materials 2020, 13, 4242. [Google Scholar] [CrossRef] [PubMed]
  37. Kuntoglu, M. Sensor Fusion Based Tool Condition Monitoring in Machining. Ph.D. Thesis, Selcuk University, Selçuklu, Turkey, 2020. [Google Scholar]
  38. Kuntoğlu, M.; Aslan, A.; Sağlam, H. Investigation of the effects of approaching angle and cutting parameters on machinability of aisi 5140 steel during turning. J. Polytech. 2010, 135, 99–114. [Google Scholar]
  39. Kuntoğlu, M.; Aslan, A.; Sağlam, H.; Pimenov, D.Y.; Giasin, K.; Mikolajczyk, T. Optimization and analysis of surface roughness, flank wear and 5 different sensorial data via tool condition monitoring system in turning of aisi 5140. Sensors 2020, 20, 4377. [Google Scholar] [CrossRef] [PubMed]
  40. Lin, Y.-C.; Wu, K.-D.; Shih, W.-C.; Hsu, P.-K.; Hung, J.-P. Prediction of surface roughness based on cutting parameters and machining vibration in end milling using regression method and artificial neural network. Appl. Sci. 2020, 10, 3941. [Google Scholar] [CrossRef]
  41. Asiltürk, İ. Predicting surface roughness of hardened aisi 1040 based on cutting parameters using neural networks and multiple regression. Int. J. Adv. Manuf. Technol. 2012, 63, 249–257. [Google Scholar] [CrossRef]
  42. Lee, K.S.; Geem, Z.W. A new structural optimization method based on the harmony search algorithm. Comput. Struct. 2004, 82, 781–798. [Google Scholar] [CrossRef]
  43. Acar, O.; Sağlam, H.; Şaka, Z. Measuring curvature of trajectory traced by coupler of an optimal four-link spherical mechanism. Measurement 2021, 176, 109189. [Google Scholar] [CrossRef]
  44. Geem, Z.W.; Kim, J.H.; Loganathan, G.V. A new heuristic optimization algorithm: Harmony search. Simulation 2001, 76, 60–68. [Google Scholar] [CrossRef]
  45. Karaboga, D.; Basturk, B. A powerful and efficient algorithm for numerical function optimization: Artificial bee colony (abc) algorithm. J. Glob. Optim. 2007, 39, 459–471. [Google Scholar] [CrossRef]
  46. Pham, D.; Kalyoncu, M. Optimisation of a fuzzy logic controller for a flexible single-link robot arm using the bees algorithm. In Proceedings of the 2009 7th IEEE International Conference on Industrial Informatics, Cardiff, Wales, UK, 13–16 June 2009; IEEE: Piscataway, NJ, USA, 2009; pp. 475–480. [Google Scholar]
  47. Şap, E.; Usca, Ü.A.; Gupta, M.K.; Kuntoğlu, M.; Sarıkaya, M.; Pimenov, D.Y.; Mia, M. Parametric optimization for improving the machining process of cu/mo-sicp composites produced by powder metallurgy. Materials 2021, 14, 1921. [Google Scholar] [CrossRef]
  48. Stratogiannis, F.I.; Galanis, N.I.; Karkalos, N.E.; Markopoulos, A.P. Optimization of the manufacturing strategy, machining conditions, and finishing of a radial impeller. Machines 2020, 8, 1. [Google Scholar] [CrossRef] [Green Version]
  49. Kyratsis, P.; Tzotzis, A.; Markopoulos, A.; Tapoglou, N. Cad-based 3d-fe modelling of aisi-d3 turning with ceramic tooling. Machines 2021, 9, 4. [Google Scholar] [CrossRef]
  50. Taguchi, G. System of Experimental Design: Engineering Methods to Optimize Quality and Minimize Costs; Unipub: New York, NY, USA, 1987. [Google Scholar]
  51. Şap, E.; Usca, U.A.; Gupta, M.K.; Kuntoğlu, M. Tool wear and machinability investigations in dry turning of cu/mo-sic p hybrid composites. Int. J. Adv. Manuf. Technol. 2021, 114, 379–396. [Google Scholar] [CrossRef]
  52. Kechagias, J.D.; Aslani, K.-E.; Fountas, N.A.; Vaxevanidis, N.M.; Manolakos, D.E. A comparative investigation of taguchi and full factorial design for machinability prediction in turning of a titanium alloy. Measurement 2020, 151, 107213. [Google Scholar] [CrossRef]
  53. Viswanathan, R.; Ramesh, S.; Maniraj, S.; Subburam, V. Measurement and multi-response optimization of turning parameters for magnesium alloy using hybrid combination of taguchi-gra-pca technique. Measurement 2020, 159, 107800. [Google Scholar] [CrossRef]
  54. Sultana, M.; Zaman, P.B.; Dhar, N.R. Gra-pca coupled with taguchi for optimization of inputs in turning under cryogenic cooling for aisi 4140 steel. J. Prod. Syst. Manuf. Sci. 2020, 1, 10. [Google Scholar]
  55. Salur, E.; Aslan, A.; Kuntoglu, M.; Gunes, A.; Sahin, O.S. Experimental study and analysis of machinability characteristics of metal matrix composites during drilling. Compos. Part B Eng. 2019, 166, 401–413. [Google Scholar] [CrossRef]
  56. Joardar, H.; Das, N.; Sutradhar, G.; Singh, S. Application of response surface methodology for determining cutting force model in turning of lm6/sicp metal matrix composite. Measurement 2014, 47, 452–464. [Google Scholar] [CrossRef]
  57. Yadav, R.N. A hybrid approach of taguchi-response surface methodology for modeling and optimization of duplex turning process. Measurement 2017, 100, 131–138. [Google Scholar] [CrossRef]
  58. Parida, A.K.; Maity, K. Modeling of machining parameters affecting flank wear and surface roughness in hot turning of monel-400 using response surface methodology (rsm). Measurement 2019, 137, 375–381. [Google Scholar] [CrossRef]
  59. Abbas, A.T.; Ragab, A.E.; Benyahia, F.; Soliman, M.S. Taguchi robust design for optimizing surface roughness of turned aisi 1045 steel considering the tool nose radius and coolant as noise factors. Adv. Mater. Sci. Eng. 2018, 2018, 1–9. [Google Scholar] [CrossRef] [Green Version]
Figure 1. Measured and recorded cutting force data via XKM software.
Machines 09 00090 g001
Figure 2. Experimental details [37,38,39].
Machines 09 00090 g002
Figure 3. The pattern of Harmony Memory.
Machines 09 00090 g003
Figure 4. Algorithm procedures: (a) Harmonic Bee Algorithm, (b) Harmonic ABC algorithm.
Machines 09 00090 g004
Figure 5. Optimal MRR, Fc, FF, and FR values obtained by using H-ABC and HBA algorithms. (a) Optimization of MRR by using H-ABC and (b) by using HBA, (c) optimization of Fc by using H-ABC and (d) by using HBA, (e) optimization of FR by using H-ABC and (f) by using HBA, and (g) optimization of FF by using H-ABC and (h) by using HBA.
Machines 09 00090 g005aMachines 09 00090 g005b
Figure 6. Optimal solutions for the response parameters according to the Taguchi method.
Machines 09 00090 g006
Figure 7. Pareto frontiers of the calculated results for the different optimization methods.
Machines 09 00090 g007
Table 1. Chemical composition of the material [4,36,37,38,39].
ElementCMnCrNiSiCuSMoP
Composition0.450.70.850.140.280.010.0650.050.02
Table 2. Taguchi L18 factorial plan.
Experiment NumberFactors and Levels
Factor 1
(Depth of Cut)
Factor 2
(Cutting Speed)
Factor 3
(Feed Rate)
1111
2112
3113
4121
5122
6123
7131
8132
9133
10211
11212
12213
13221
14222
15223
16231
17232
18233
Table 3. Full factorial experimental design and results.
Exp. NumberDesign ParametersResponses
Cutting Speed
vC (m/min)
Feed
Rate
f (mm/rev)
Depth of Cut
ap
(mm)
Material
Removal Rate
MRR (mm3/min)
Tangential
Cutting Force
FC
(N)
Axial
Cutting Force
FF
(N)
Radial
Cutting Force
FR
(N)
11500.061900167.4100.8584.81
21500.1211800254.28103.9987.44
31500.2413600302.05107.588.03
42000.061120068.1936.4519.77
52000.121240086.245.7825.44
62000.2414800275.2135.4562.57
73300.061198055.7837.4421.45
83300.121396074.3865.7831.82
93300.2417920235.1389.7741.11
101500.061.51350206.97132.4148.07
111500.121.52700310.78167.1163.59
121500.241.55400471.11184.49108.50
132000.061.5180066.0158.8232.44
142000.121.53600128.1861.7254.66
152000.241.57200233.4187.7971.11
163300.061.5297060.0349.3921.55
173300.121.55940142.0278.4656.88
183300.241.511,880294.42152.7781.79
Table 4. The optimization results for HBA and H-ABC.
Optimal Cutting Parameter ValuesObjective Functions
AlgorithmsCutting Speed
vC (m/min)
Feed Sate f (mm/rev)Depth of Cut
ap
(mm)
Material Removal Rate
MRR (mm3/min)
Tangential Cutting Force
FC
(N)
Axial Cutting Force
FF
(N)
Radial Cutting Force
FR
(N)
H-ABC (Calc.)1650.11.23600113.4551.7539.38
H-ABC (Meas.)1650.11.2330095.7544.8228.1
H-ABC (% Acc.)-9184.384.671.3
HBA (Calc.)2450.21.12030153.499.14138.7
HBA (Meas.)2450.21.15390225.78130.1558.44
HBA (% Acc.)-37.76876.242.2
Table 5. Response surface methodology parameter design and predicted responses for both the mono and multiple optimizations.
ParameterGoalLower ValueTarget ValueUpper ValueWeight/
Importance
Predicted ValueDesirability (%)
Material removal rate (mm3/min)Max.90090011,88015129.1838.5
Tangential cutting force
(N)
Min.55.7855.78471.111100.5789.2
Axial cutting force
(N)
Min.36.4536.45184.49149.4591.2
Radial cutting force
(N)
Min.19.7719.77108.5126.3192.6
Desirability-73.4
Table 6. The optimization results for RSM.
Optimal Cutting
Parameter Values
Objective Functions
AlgorithmsCutting Speed vC (m/min)Feed Rate f
(mm/rev)
Depth of Cut ap (mm)Material Removal Rate
MRR (mm3/min)
Tangential Cutting Force
FC
(N)
Axial Cutting Force
FF
(N)
Radial Cutting Force
FR
(N)
RSM-Mult. (Calc.)2800.1815129.18100.5749.4526.31
RSM-Mult. (Meas.)2800.1815040108.6341.2232.84
RSM-Mult. (% Acc.)-98.392.683.480.2
Table 7. The optimization results for all of the methods.
Optimal Cutting Parameter ValuesThe Desirability of Objective Functions
AlgorithmsCutting Speed
vC
(m/min)
Feed Rate
f
(mm/rev)
Depth of Cut
ap
(mm)
Material Removal Rate
MRR (mm3/min)
Tangential Cutting Force
FC
(%)
Axial Cutting Force
FF
(%)
Radial Cutting Force
FR
(%)
Composite Desirability (%)
Taguchi3300.0619.899.337.4498.143.4
Taguchi 2000.0612.79710010040.2
Taguchi3300.241.510042.521.430.140.6
RSM2800.18137.787.296.785.272.1
HBA2450.21.140.85936.756.447.2
H-ABC1650.11.221.890.394.390.664
Publisher’s Note: MDPI stays neutral with regard to jurisdictional claims in published maps and institutional affiliations.

