
Simulation of Energy Absorption Performance of the Couplers in Urban Railway Vehicles during a Heavy Collision


1
Trans-Continental Railroad Research Team, Northern Railroad Research Division, Korea Railroad Research Institute, Uiwang 16105, Korea
2
Graduate School of Railroad, Seoul National University of Science & Technology, Seoul 01811, Korea
3
Mechanical System Design Engineering, Seoul National University of Science & Technology, Seoul 01811, Korea
*
Author to whom correspondence should be addressed.
Machines 2021, 9(5), 91; https://0-doi-org.brum.beds.ac.uk/10.3390/machines9050091
Submission received: 9 April 2021
/
Revised: 27 April 2021
/
Accepted: 28 April 2021
/
Published: 30 April 2021
(This article belongs to the Section Vehicle Engineering)
Abstract
:Railway vehicles are generally operated by connecting several vehicles in a row. Mechanisms connecting railway vehicles must also absorb front and rear shock loads that occur during a train’s operation. To minimize damage, rail car couplers are equipped with a buffer system that absorbs the impact of energy. It is difficult to perform a crash test and evaluate performance by applying a buffer to an actual railway vehicle. In this study, a simulation technique using a mathematical buffer model was introduced to overcome these difficulties. For this, a model of each element of the buffer was built based on the experimental data for each element of the coupling buffer system and a collision simulation program was developed. The buffering characteristics of a 10-car train colliding at 25 km/h were analyzed using a developed simulator. The results of the heavy collision simulation showed that the rubber buffer was directly connected to the hydraulic shock absorber in a solid contact state, and displacement of the hydraulic buffer hardly occurred despite the increase in reaction force due to the high impact speed. Since the impact force is concentrated on the vehicle to which the collision is applied, it may be appropriate to apply a deformation tube with different characteristics depending on the vehicle location.
1. Introduction
Railway vehicles are generally operated in the form of trains, which are a connected series of vehicles. A coupler is a mechanism used to connect rolling stock in a train and absorbs the front and rear impact loads that occur while operating trains. Therefore, laws and regulations mandate the application of buffers to minimize damage in the event of vehicle collisions.
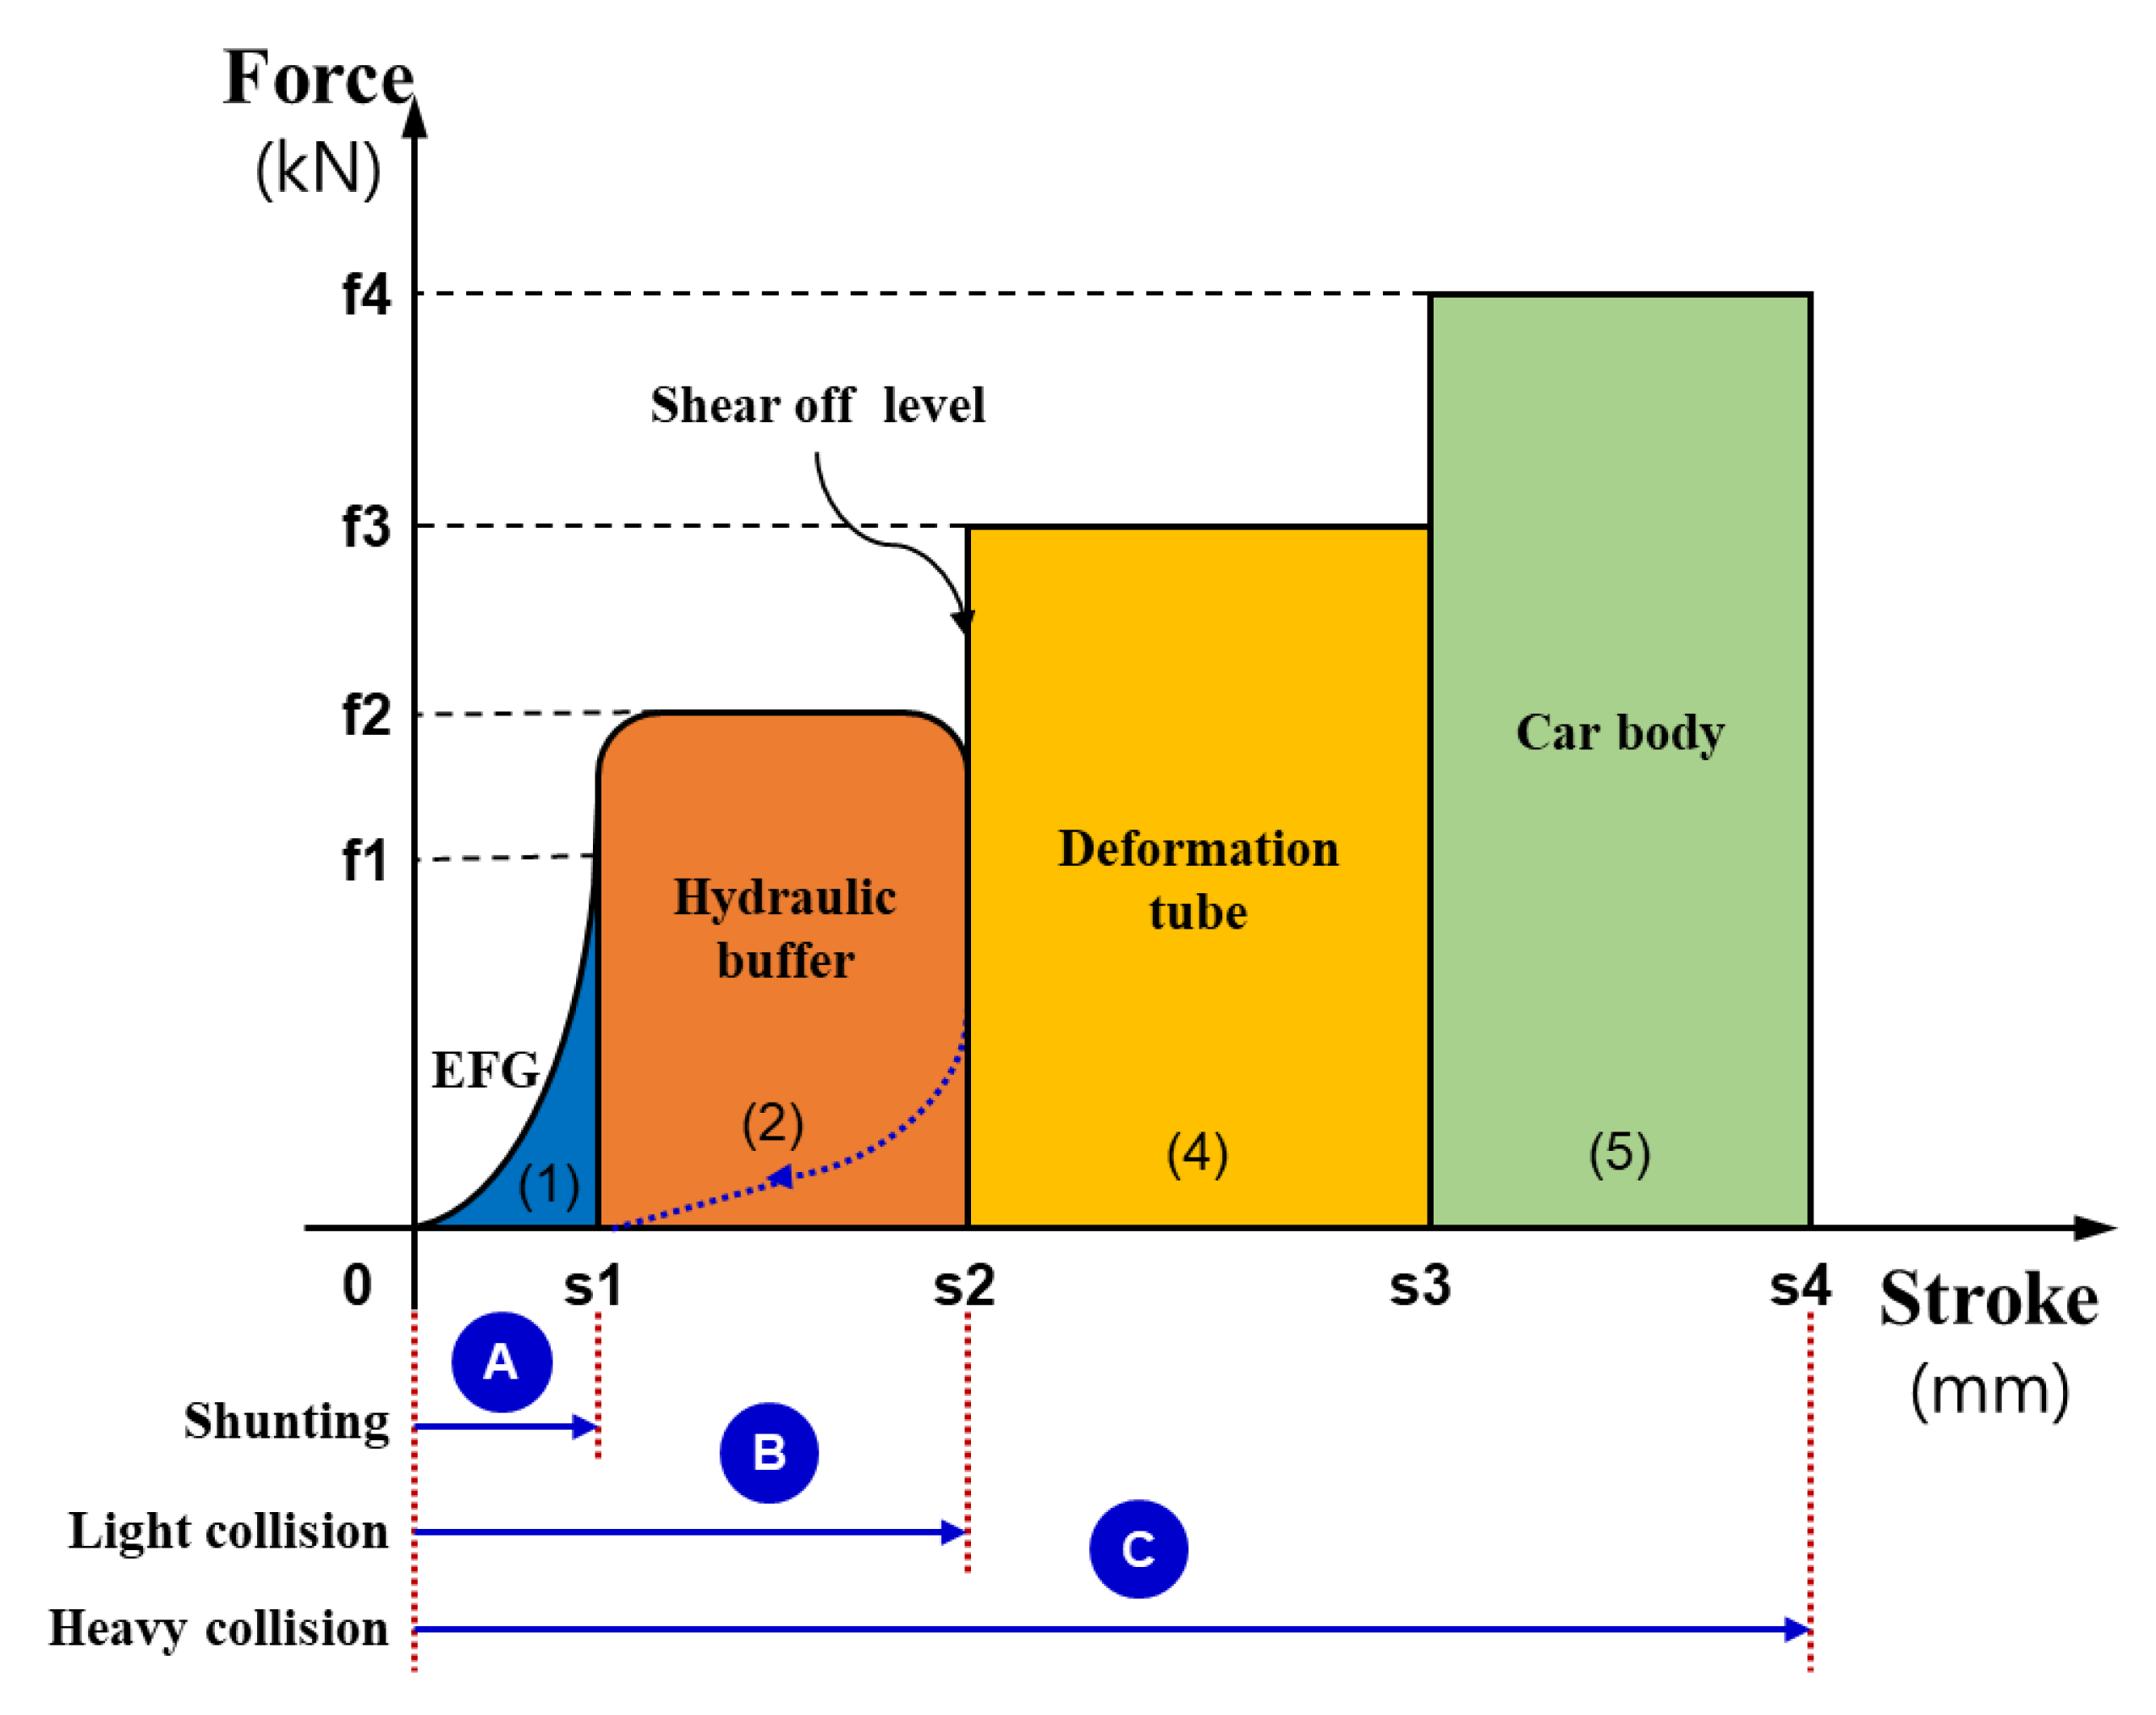
The coupling buffer systems applied to collision safety design consist of rubber buffers, hydraulic buffers, deformation tubes, and a vehicle body deformation structure. As shown in Figure 1, the rubber buffer absorbs the collision energy of the area (1), a hydraulic buffer absorbs the collision energy of the area of (2) and a deformation tube and vehicle body deformation structure absorb the collision energy of the area of (4) and (5). Rubber and hydraulic buffers can be reused after absorbing the collision energy caused by deformation and returning to their original state. However, deformation tubes and body deformation cannot be reused due to plastic deformation.
In terms of safety regulations related to the coupling buffers in railway vehicles in Korea, the Rules on the Safety Standards for Urban Railway Vehicles [1] were enacted in 2000. These rules apply to urban railway vehicles, and stipulate that the vehicle body should not be damaged in a collision at 5 km/h which corresponds to a shunting collision. In 2005, as these rules were revised, the collision speed was increased to 10 km/h, which corresponds to a light collision, and hydraulic buffers were added in addition to the rubber buffers in the coupling systems to meet these safety regulations. In 2016, the rules were revised to further strengthen the Urban Railway Vehicle Technical Standards, so that the coupling buffer system and vehicle body absorb collision energy at 25 km/h, which corresponds to a heavy collision. Therefore, higher performance than that of the existing coupling buffer system was required, and deformable tubes and vehicle body were added to the coupling systems to meet these collision standards.
The most challenging aspect of developing coupling buffer systems for railway vehicles that absorb large amounts of collision energy is applying the buffers to actual railway vehicles to perform collision tests and evaluate their performance [2]. Therefore, techniques are used to predict the performance of buffers in trains through simulations, but there are difficulties in implementing the rubber buffer, hydraulic buffer and deformable tubes in a mathematical model [3]. To overcome these difficulties, many studies are being conducted to develop and validate models through performance tests on each component of the buffer and are using these models to develop a simulation model for trains [4,5,6]. It is necessary to establish a systematic process for testing, analyzing and developing models to establish highly reliable models with this method. Validated simulation models can be used in various design processes, such as the optimization and comparative evaluation of railway vehicle buffer systems [7,8].
In accordance with the reinforcement of the crash safety standards, studies on the use of rubber buffers in connectors were conducted in light collisions [9], and studies were expanded to the use of hydraulic buffers as rubber buffers in heavy collisions [10,11]. In heavy collisions, the use of a deformation tube is required.
In this study, the buffering characteristics of large capacity buffer systems were analyzed during heavy collisions. Collision tests were carried out on each component of the coupling buffer system to investigate their performance, and based on these results, a mathematical model for collision was completed and a collision simulation program was developed. The buffering characteristics of a 10-car train crashing at 25 km/h were then analyzed.
2. Collision Test for Coupling Buffer System
The collision tests were carried out to examine the performance of each component constituting the coupling buffer system in a railway vehicle and to develop a mathematical model. The tests were performed on each component as it is difficult to carry out collision tests on assembled buffers.
2.1. Components of Coupling Buffer System
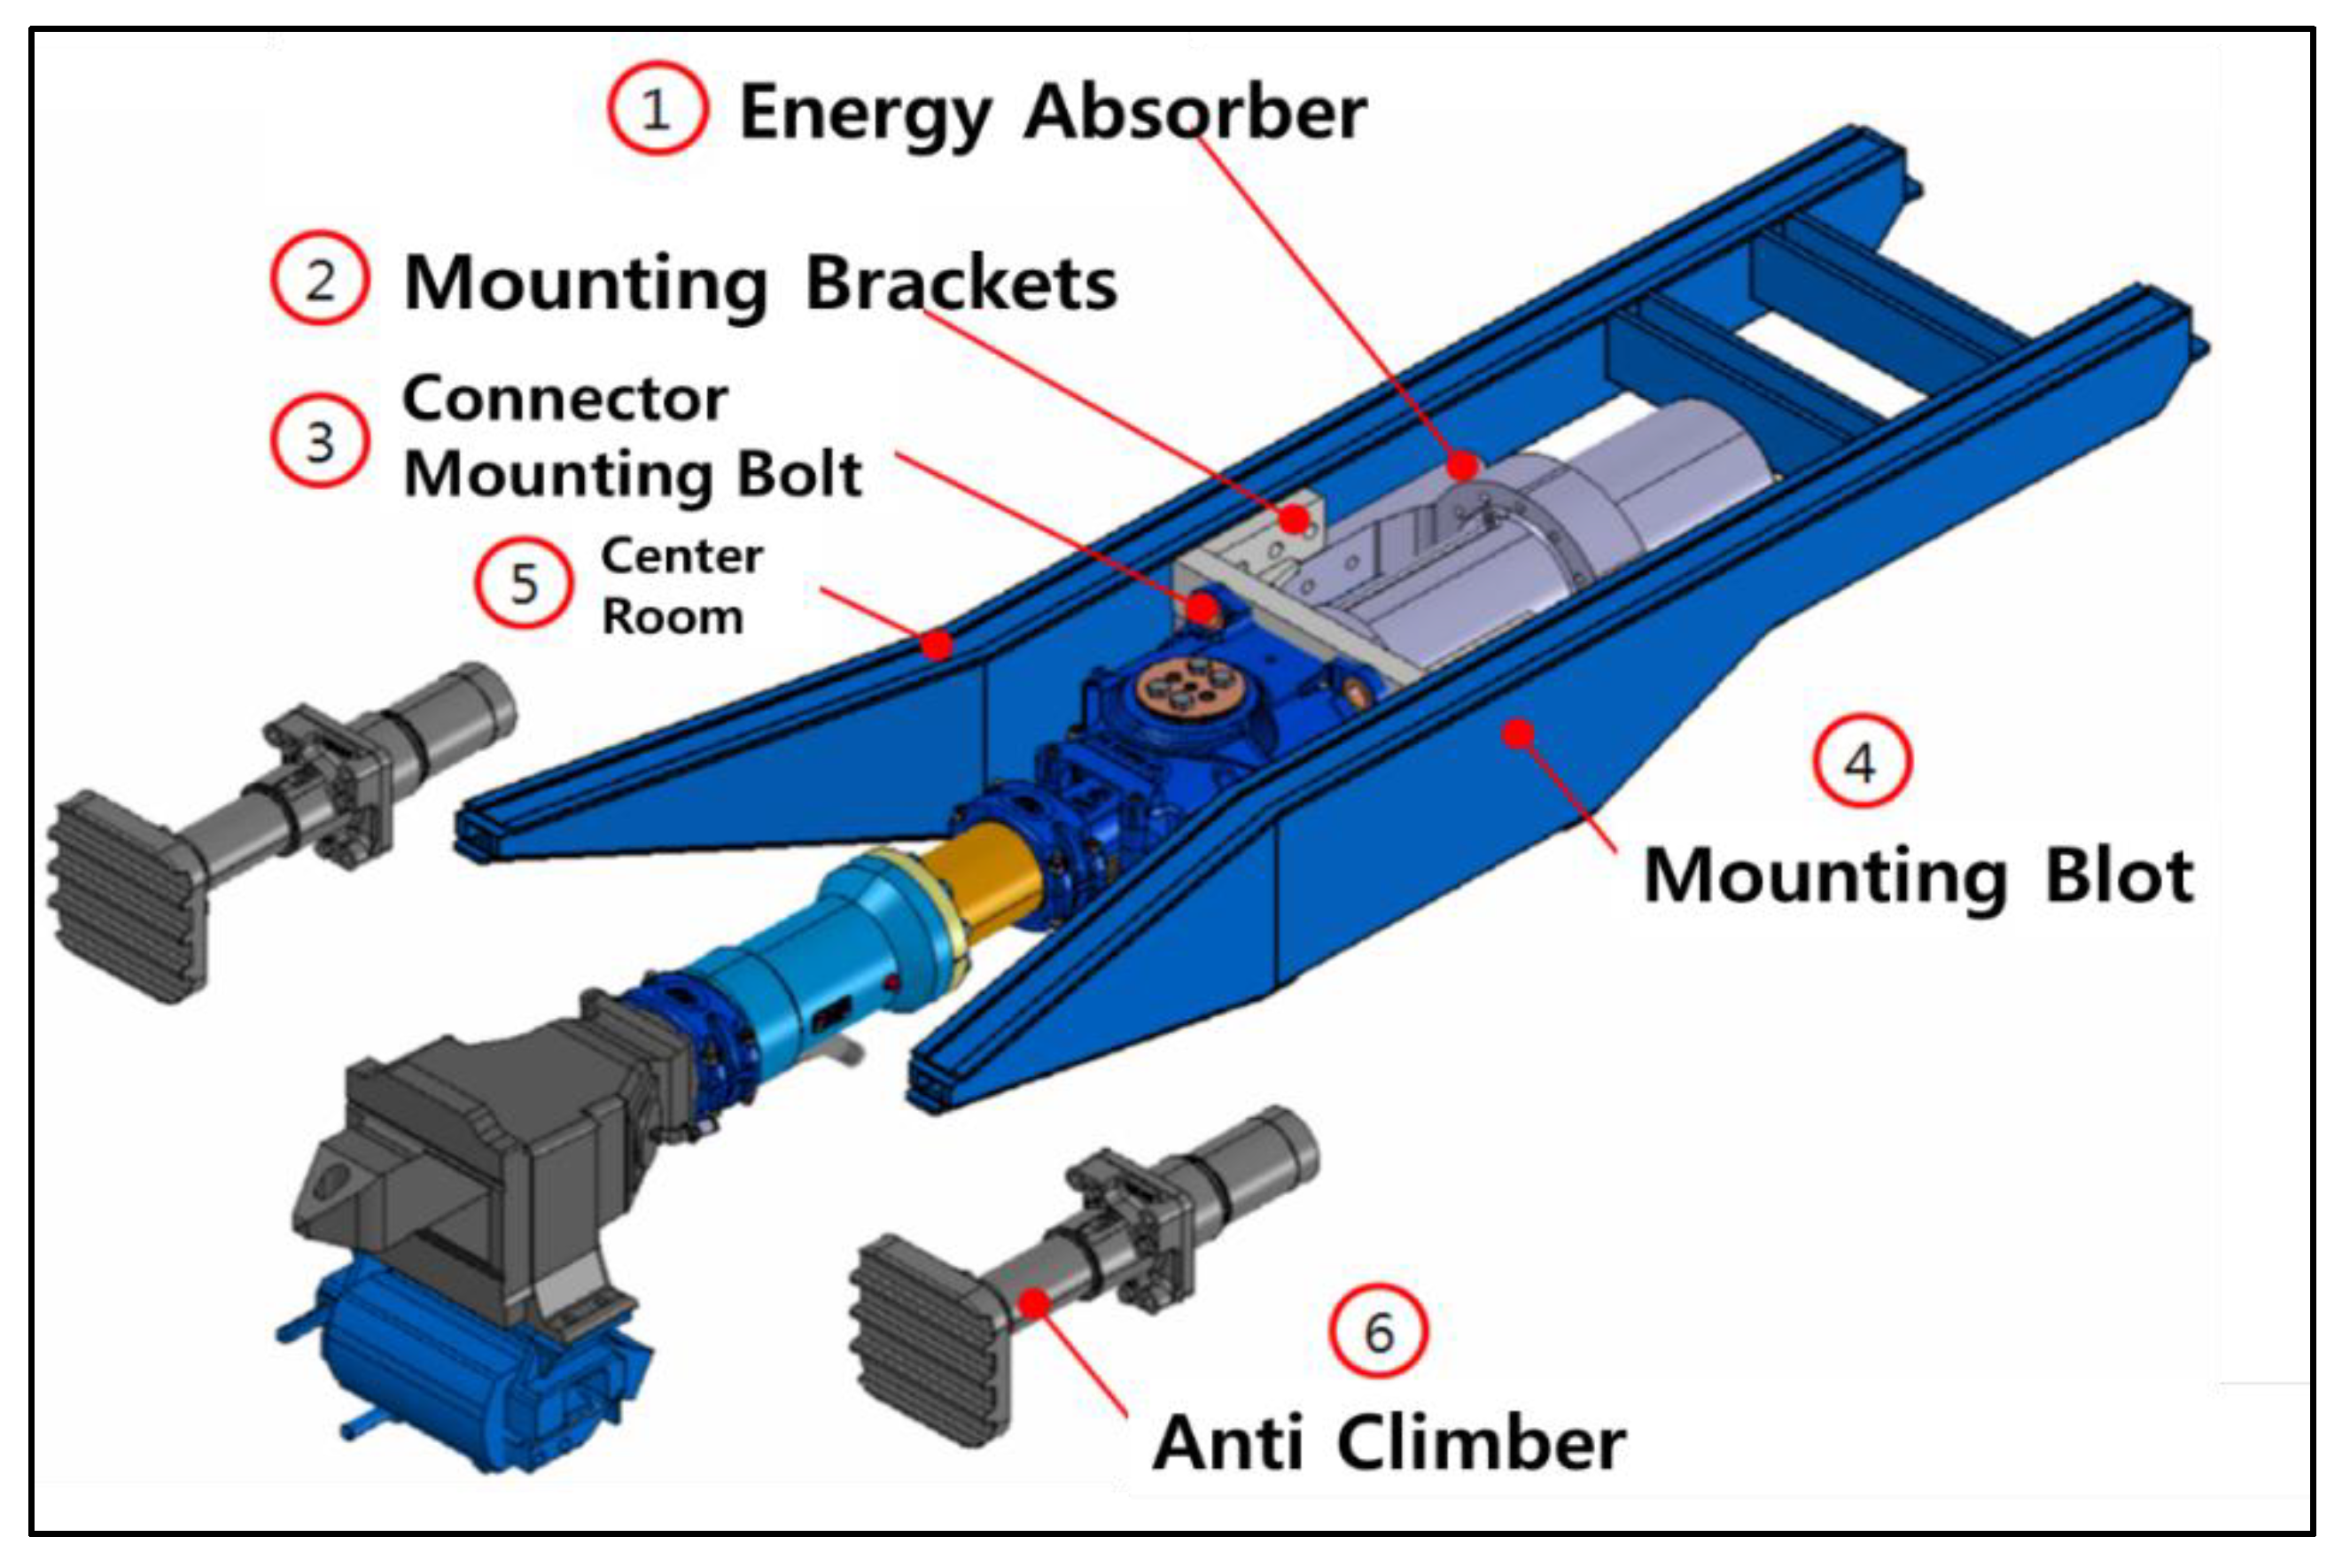
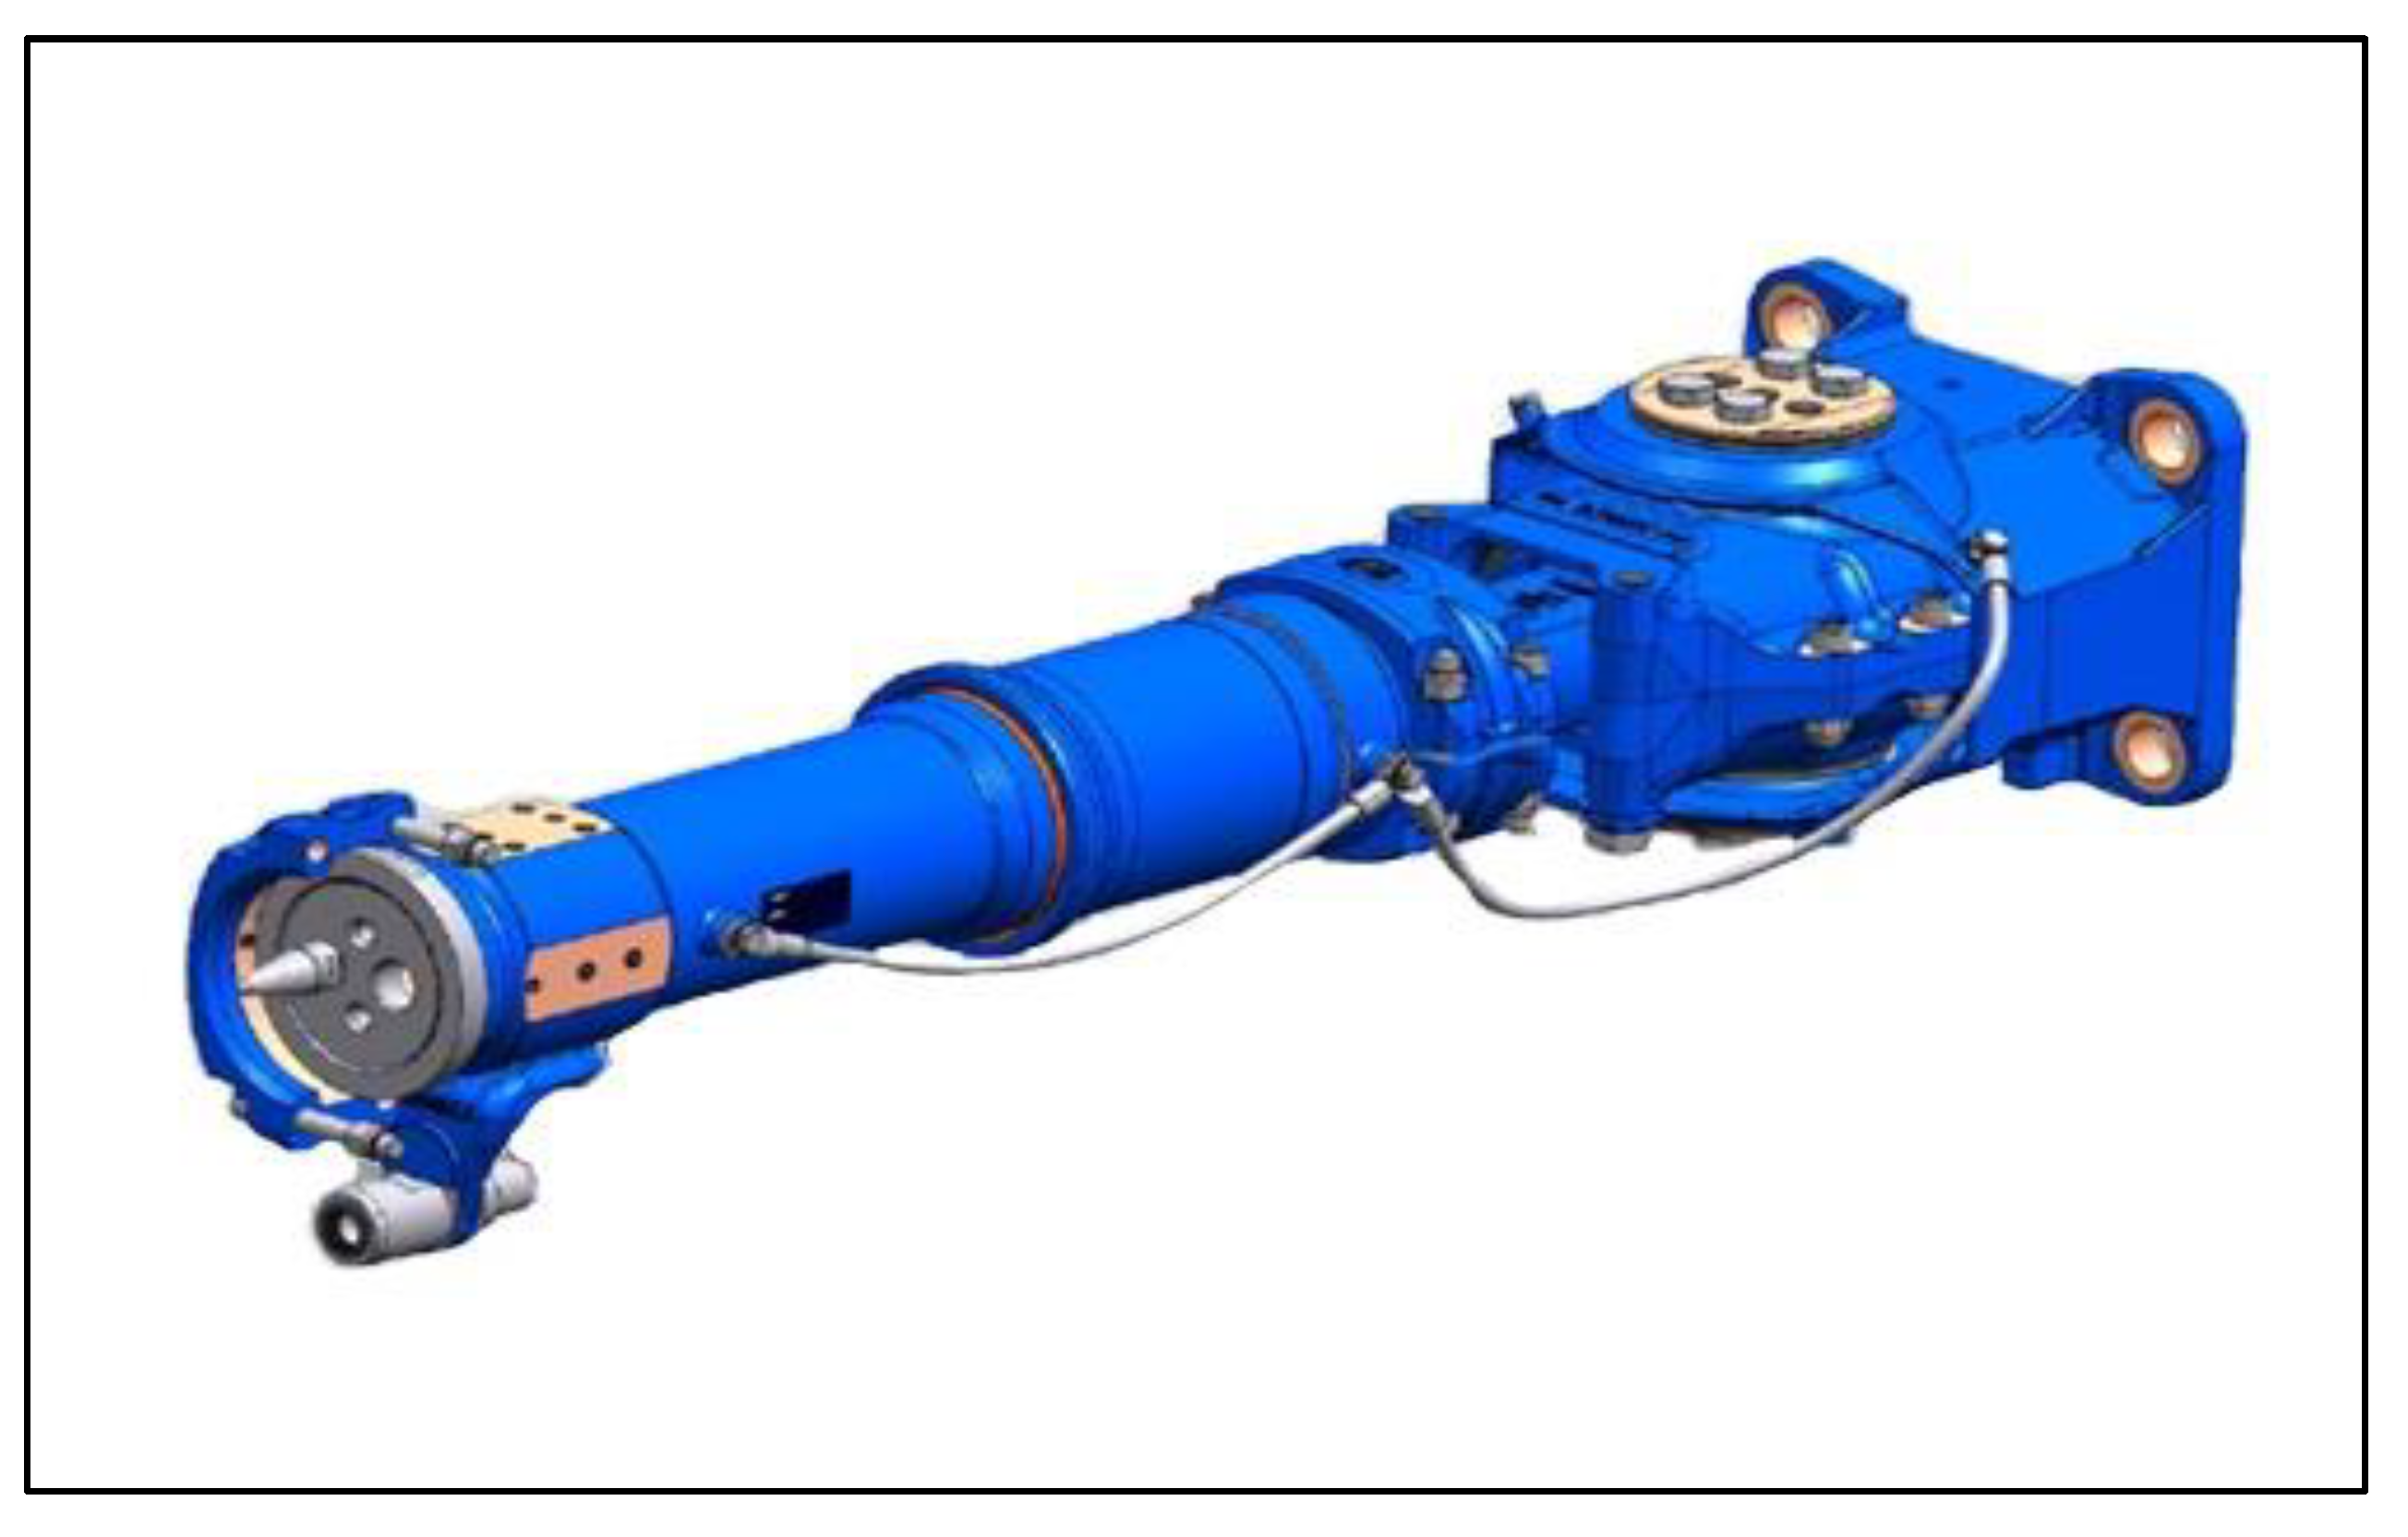
As shown in Figure 2, in the front and rear coupler of an urban railway vehicle, the head including the electrical connection device, rubber buffer and hydraulic buffer are connected in series, and the deformation tube and shear bolts are installed at the rear of the coupler. Figure 3 shows the structure of an intermediate coupler installed between vehicles, which consists of a rubber buffer and deformation tube in series to absorb energy in the event of collisions.
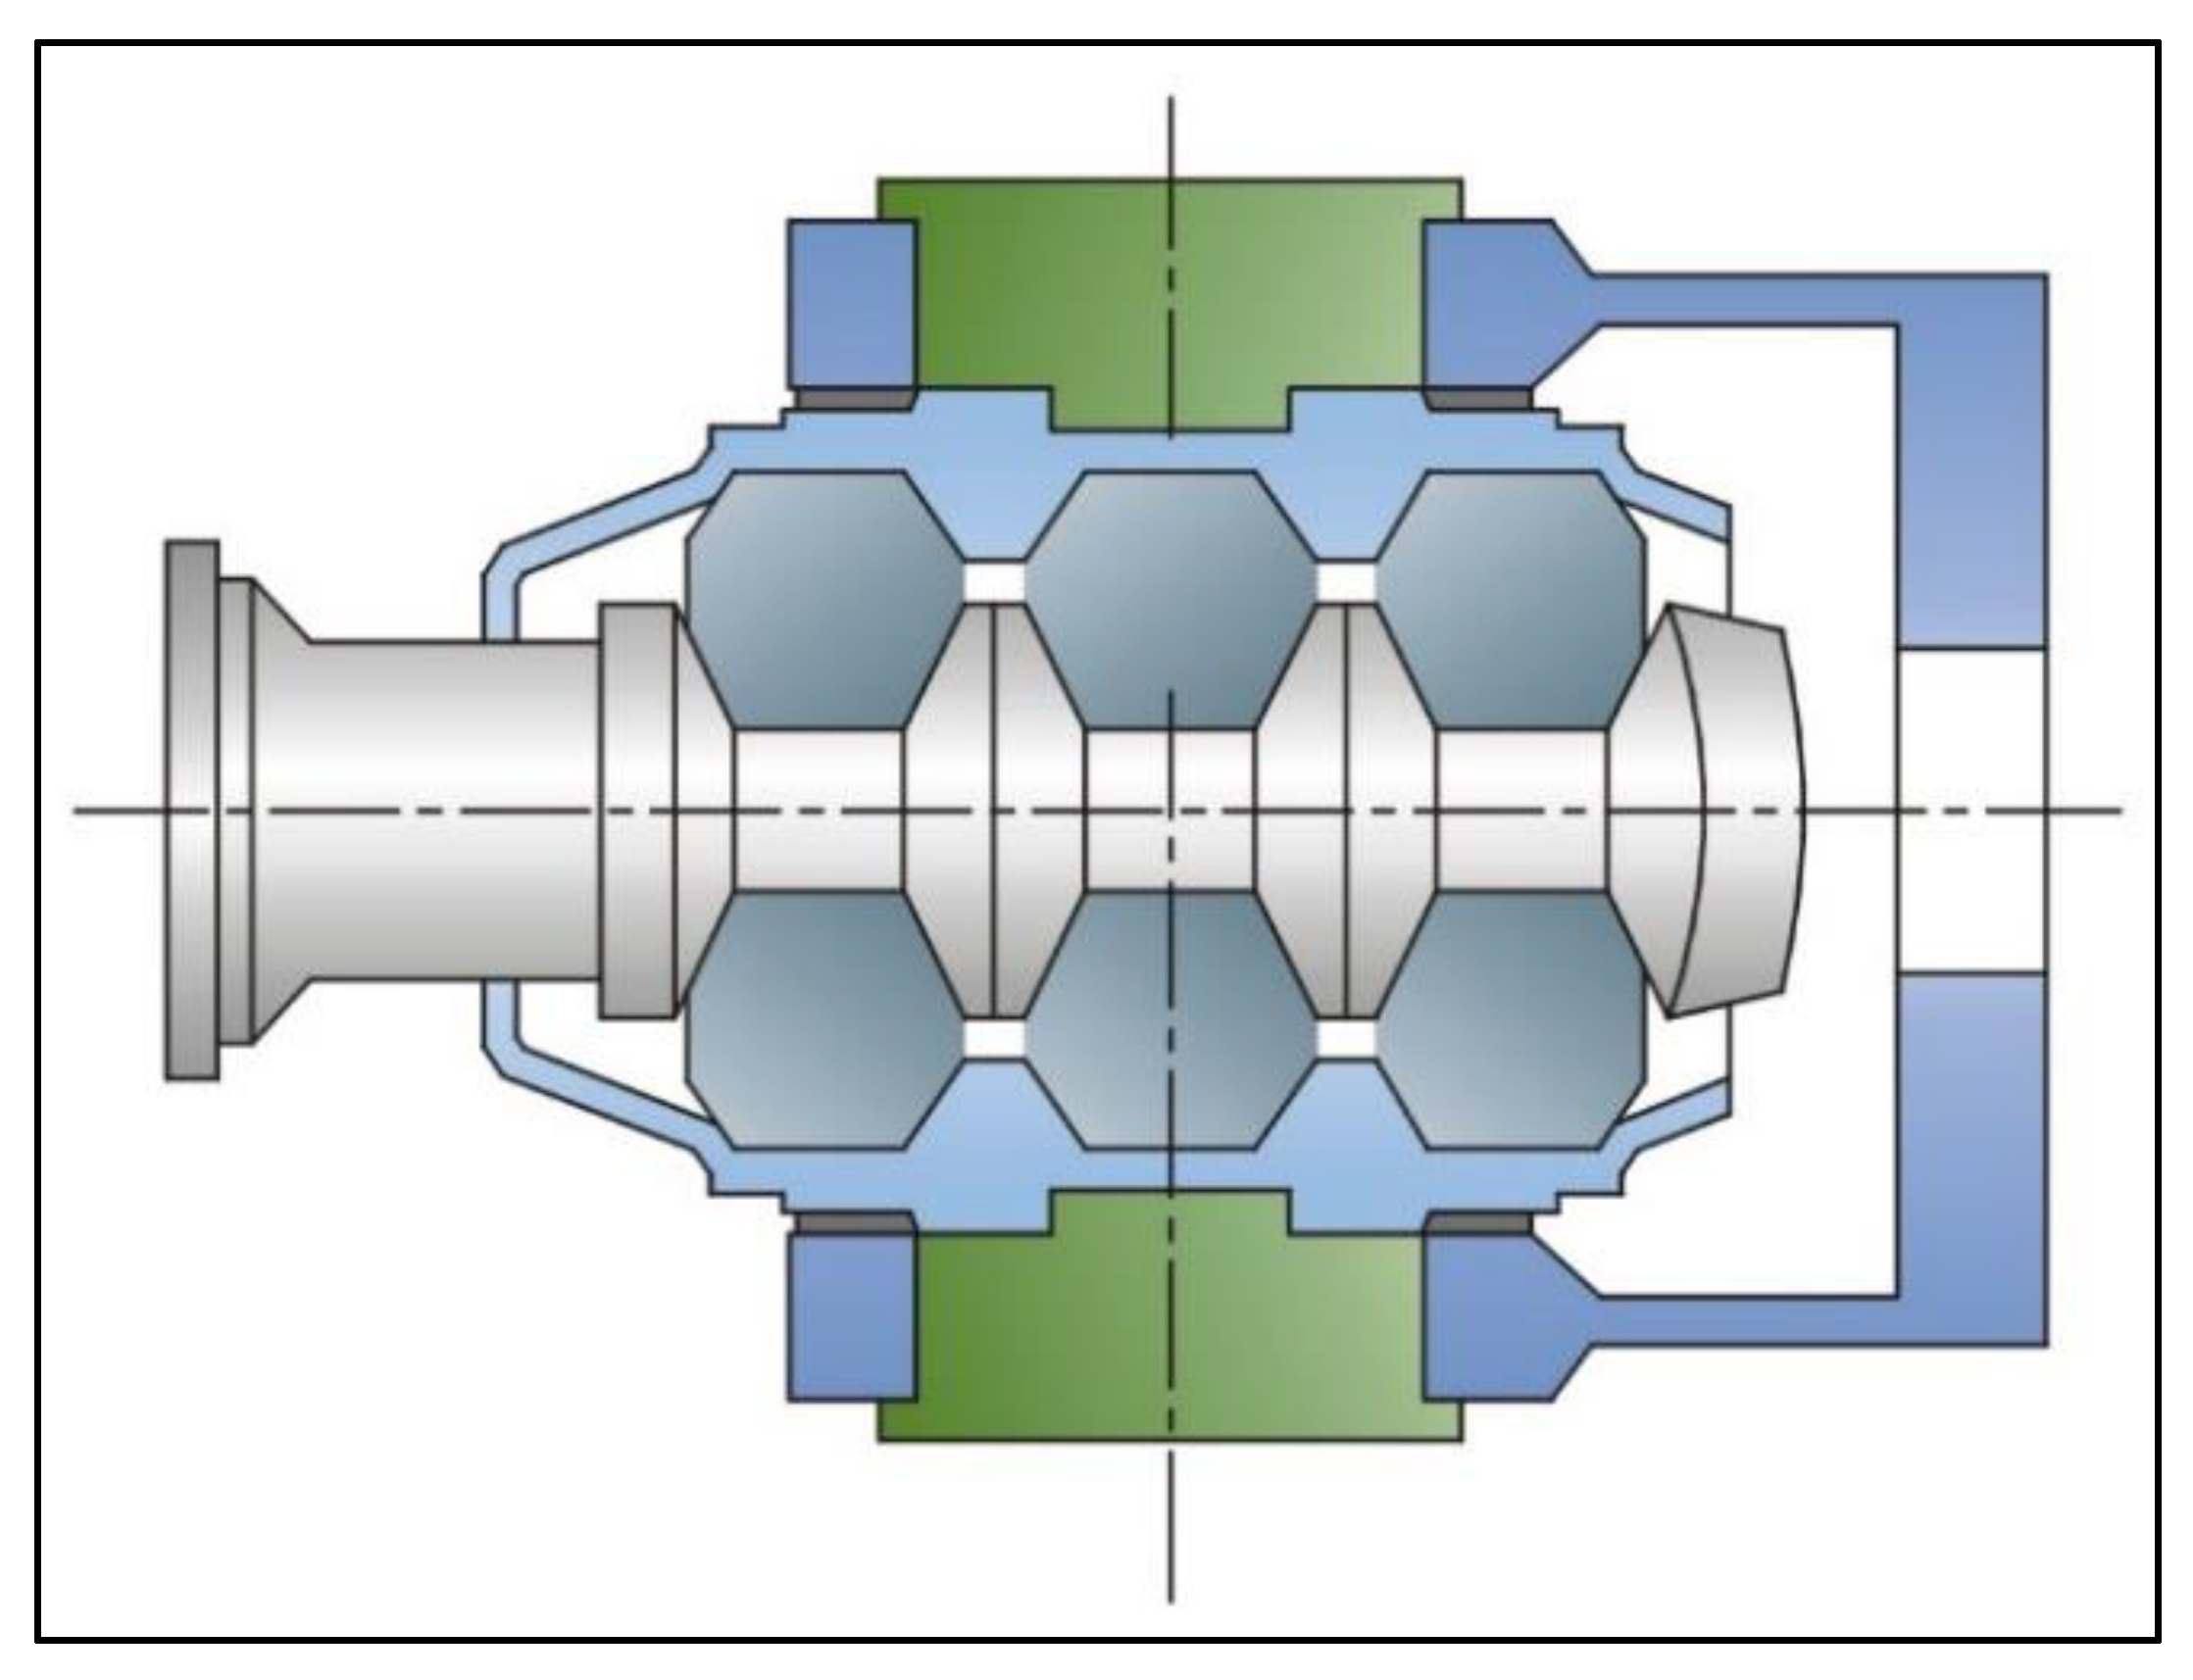
As shown in Figure 4, the most commonly used jointed rubber buffer consists of several rubber buffer rings and exhibits nonlinear characteristics according to the tensile and compression properties of rubber. Figure 5 shows the general characteristic curve for a rubber buffer consisting of a rising compression line and a declining-tensile line due to the properties of rubber [13]. The hysteresis between the two lines refers to the amount of energy dissipated by the buffer during a collision. A jointed rubber buffer absorbs the impact in a limited displacement range and transfers the load directly to the body by solid contact when exceeding this displacement range [14]. Figure 2, Figure 3 and Figure 5 refer to the characteristic data of the rubber buffer in [12].
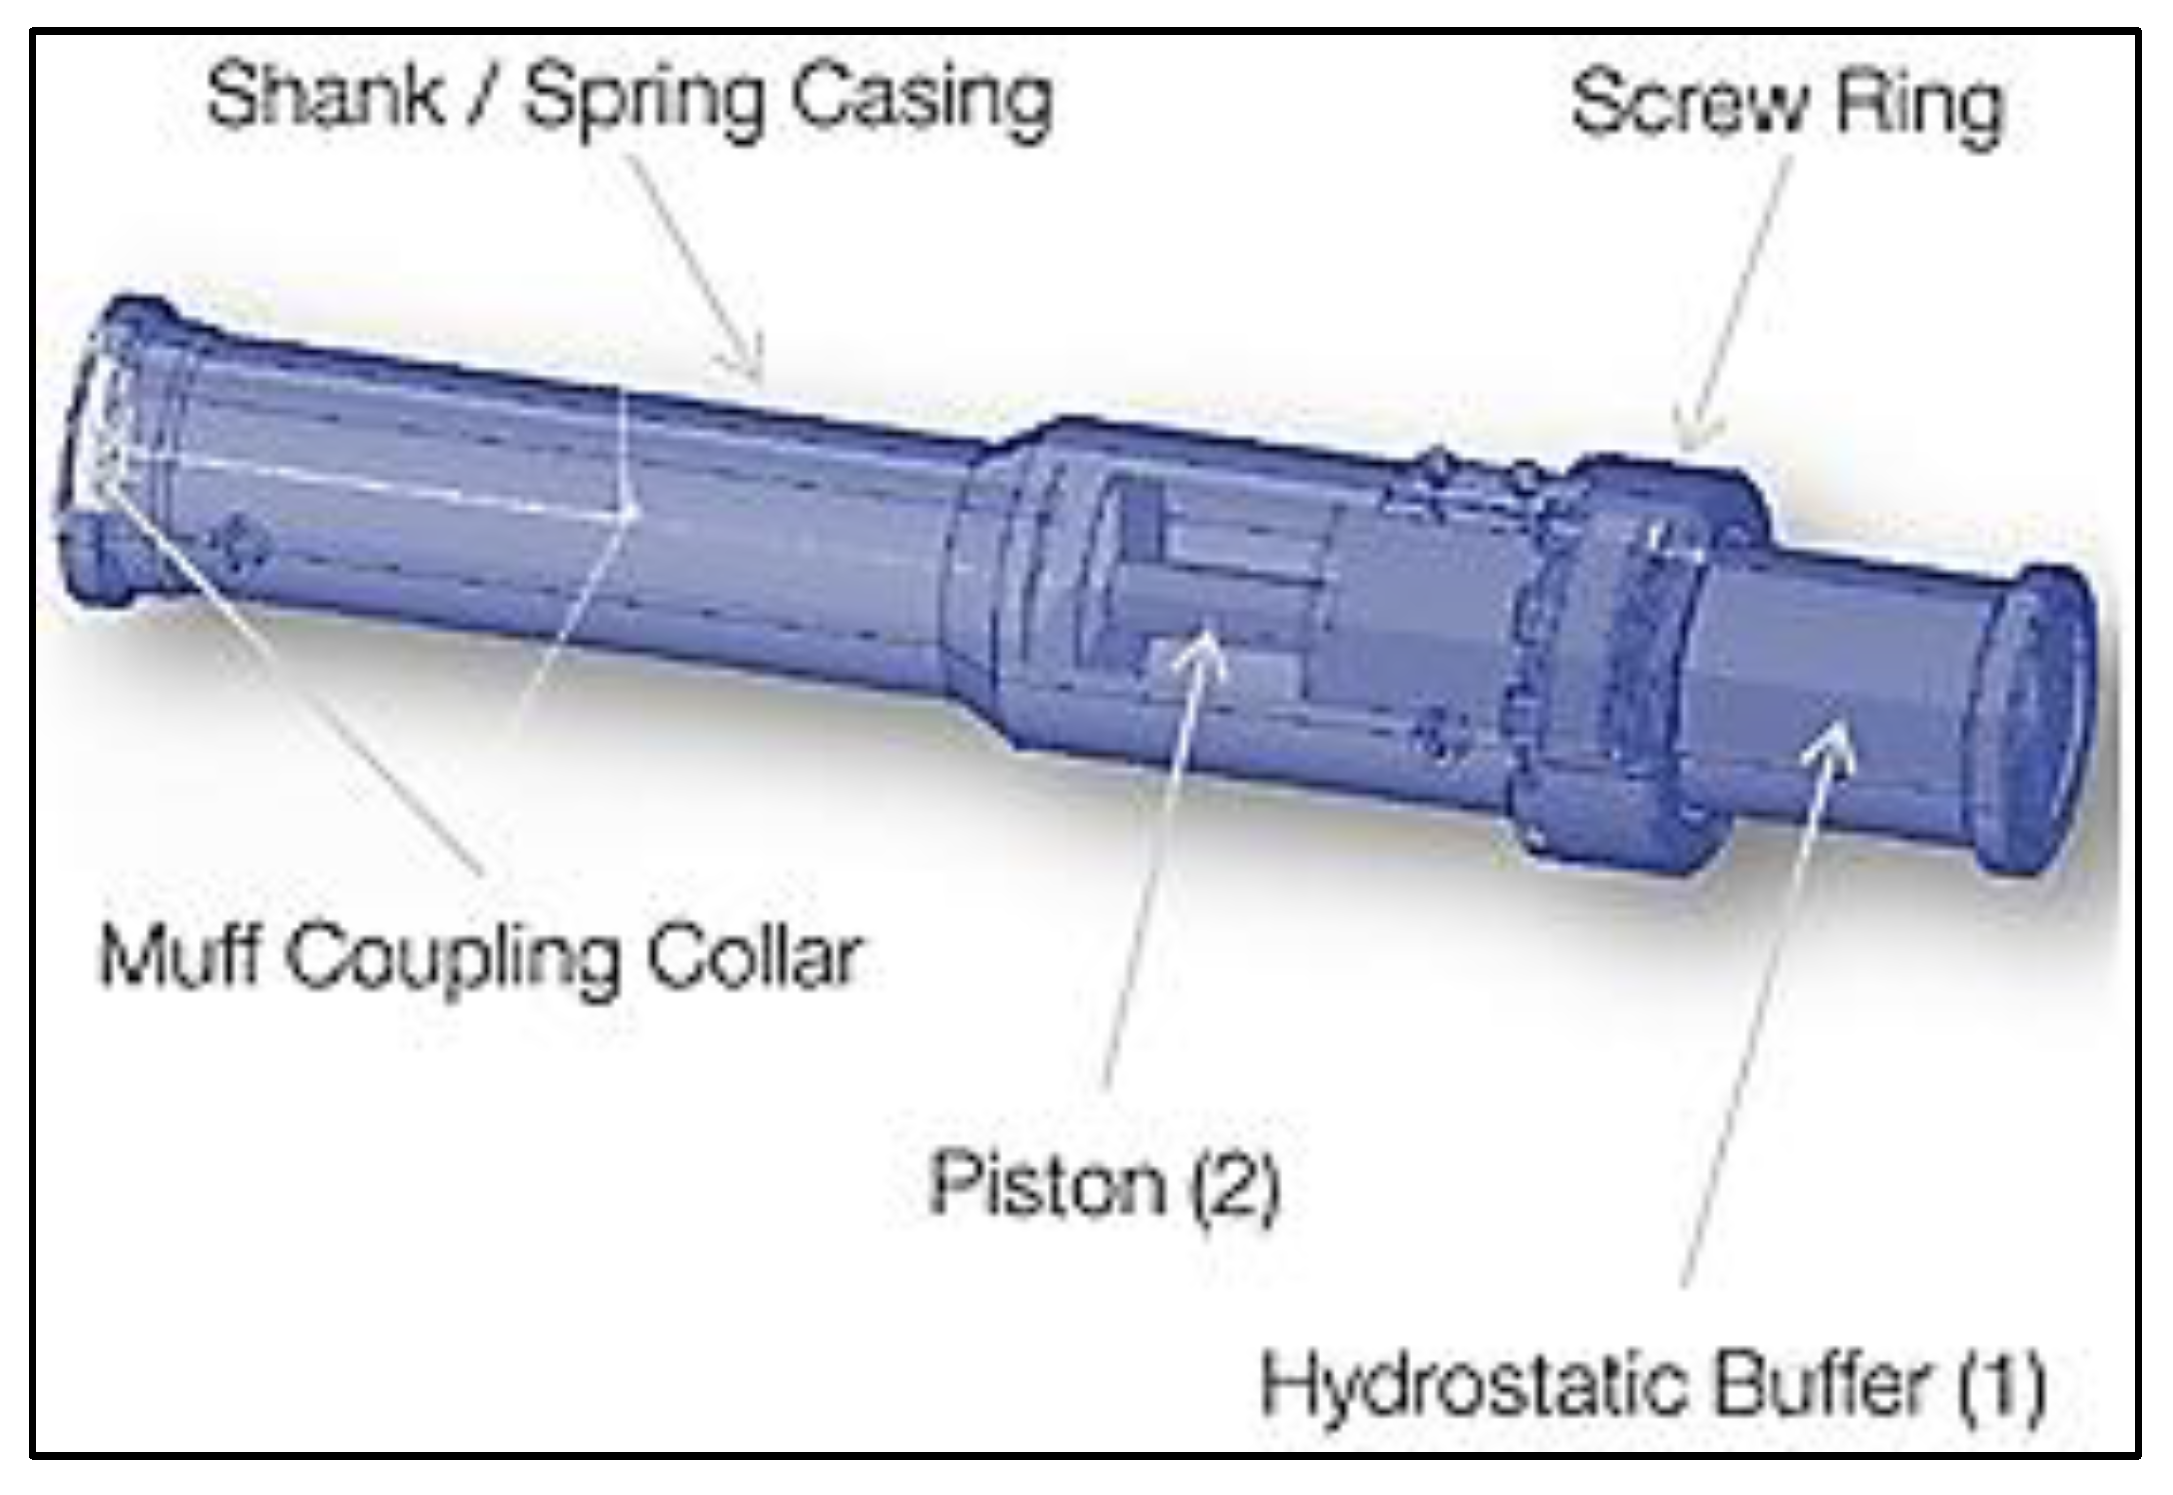
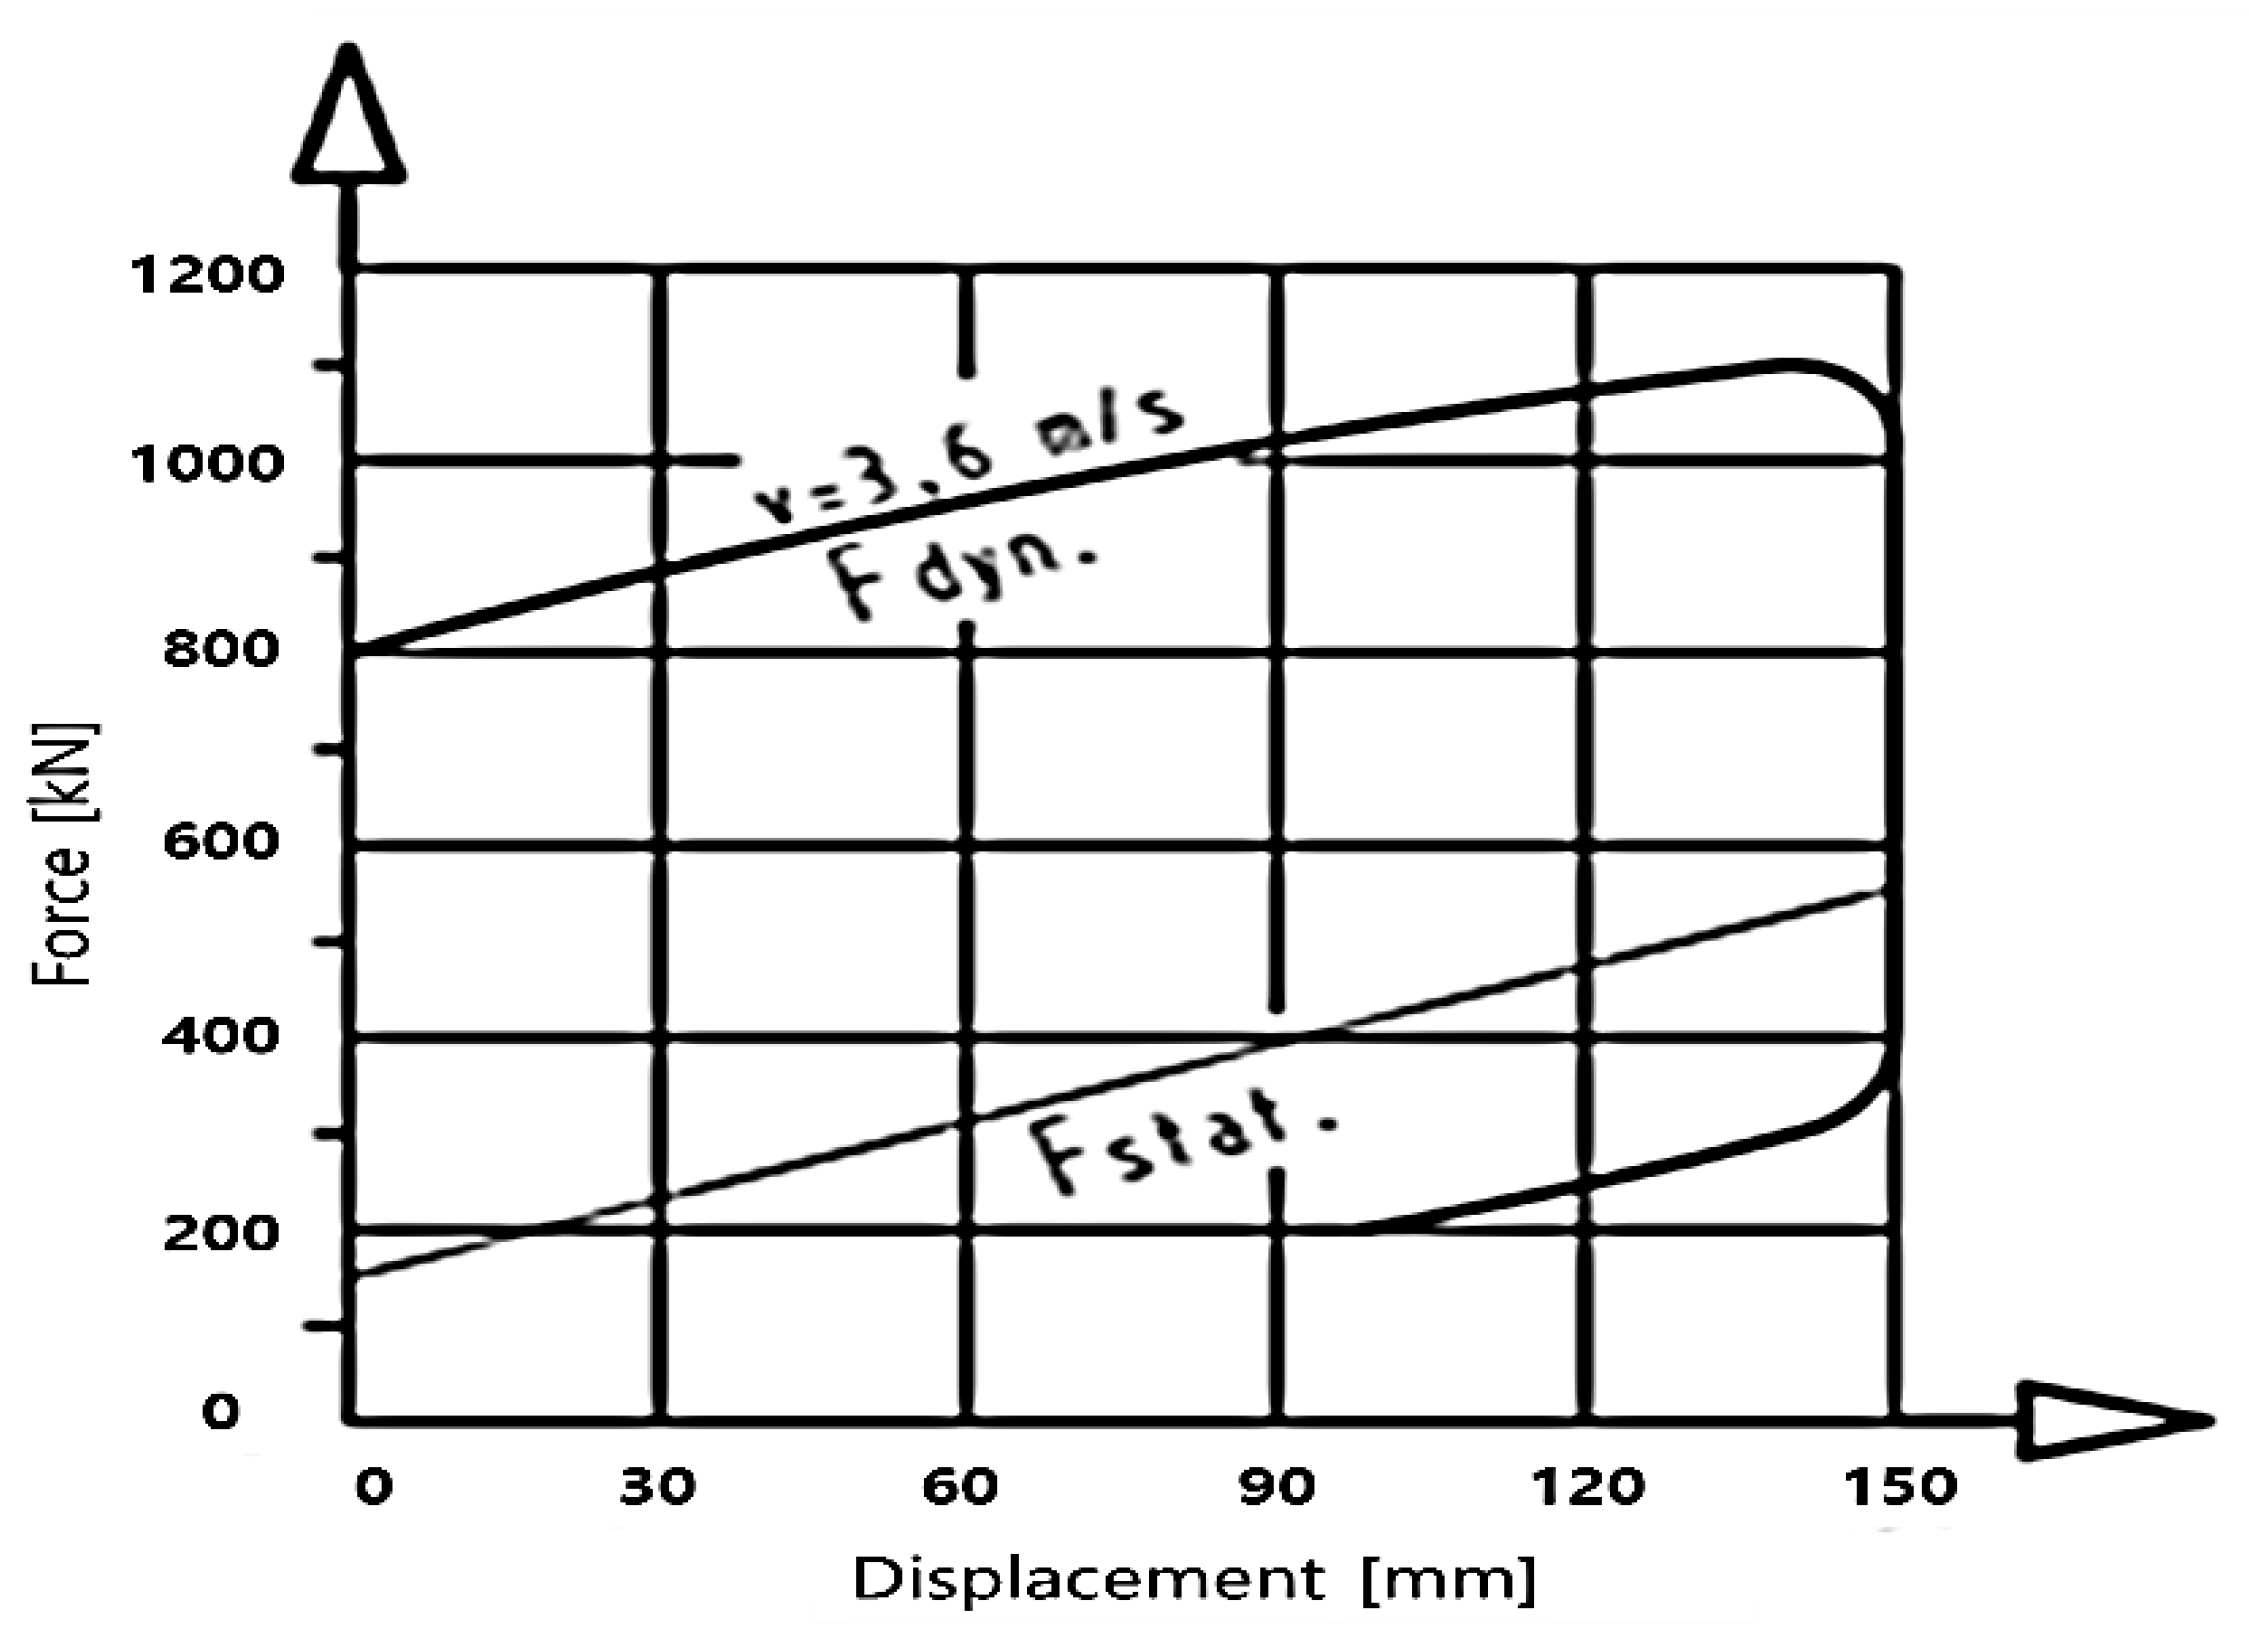
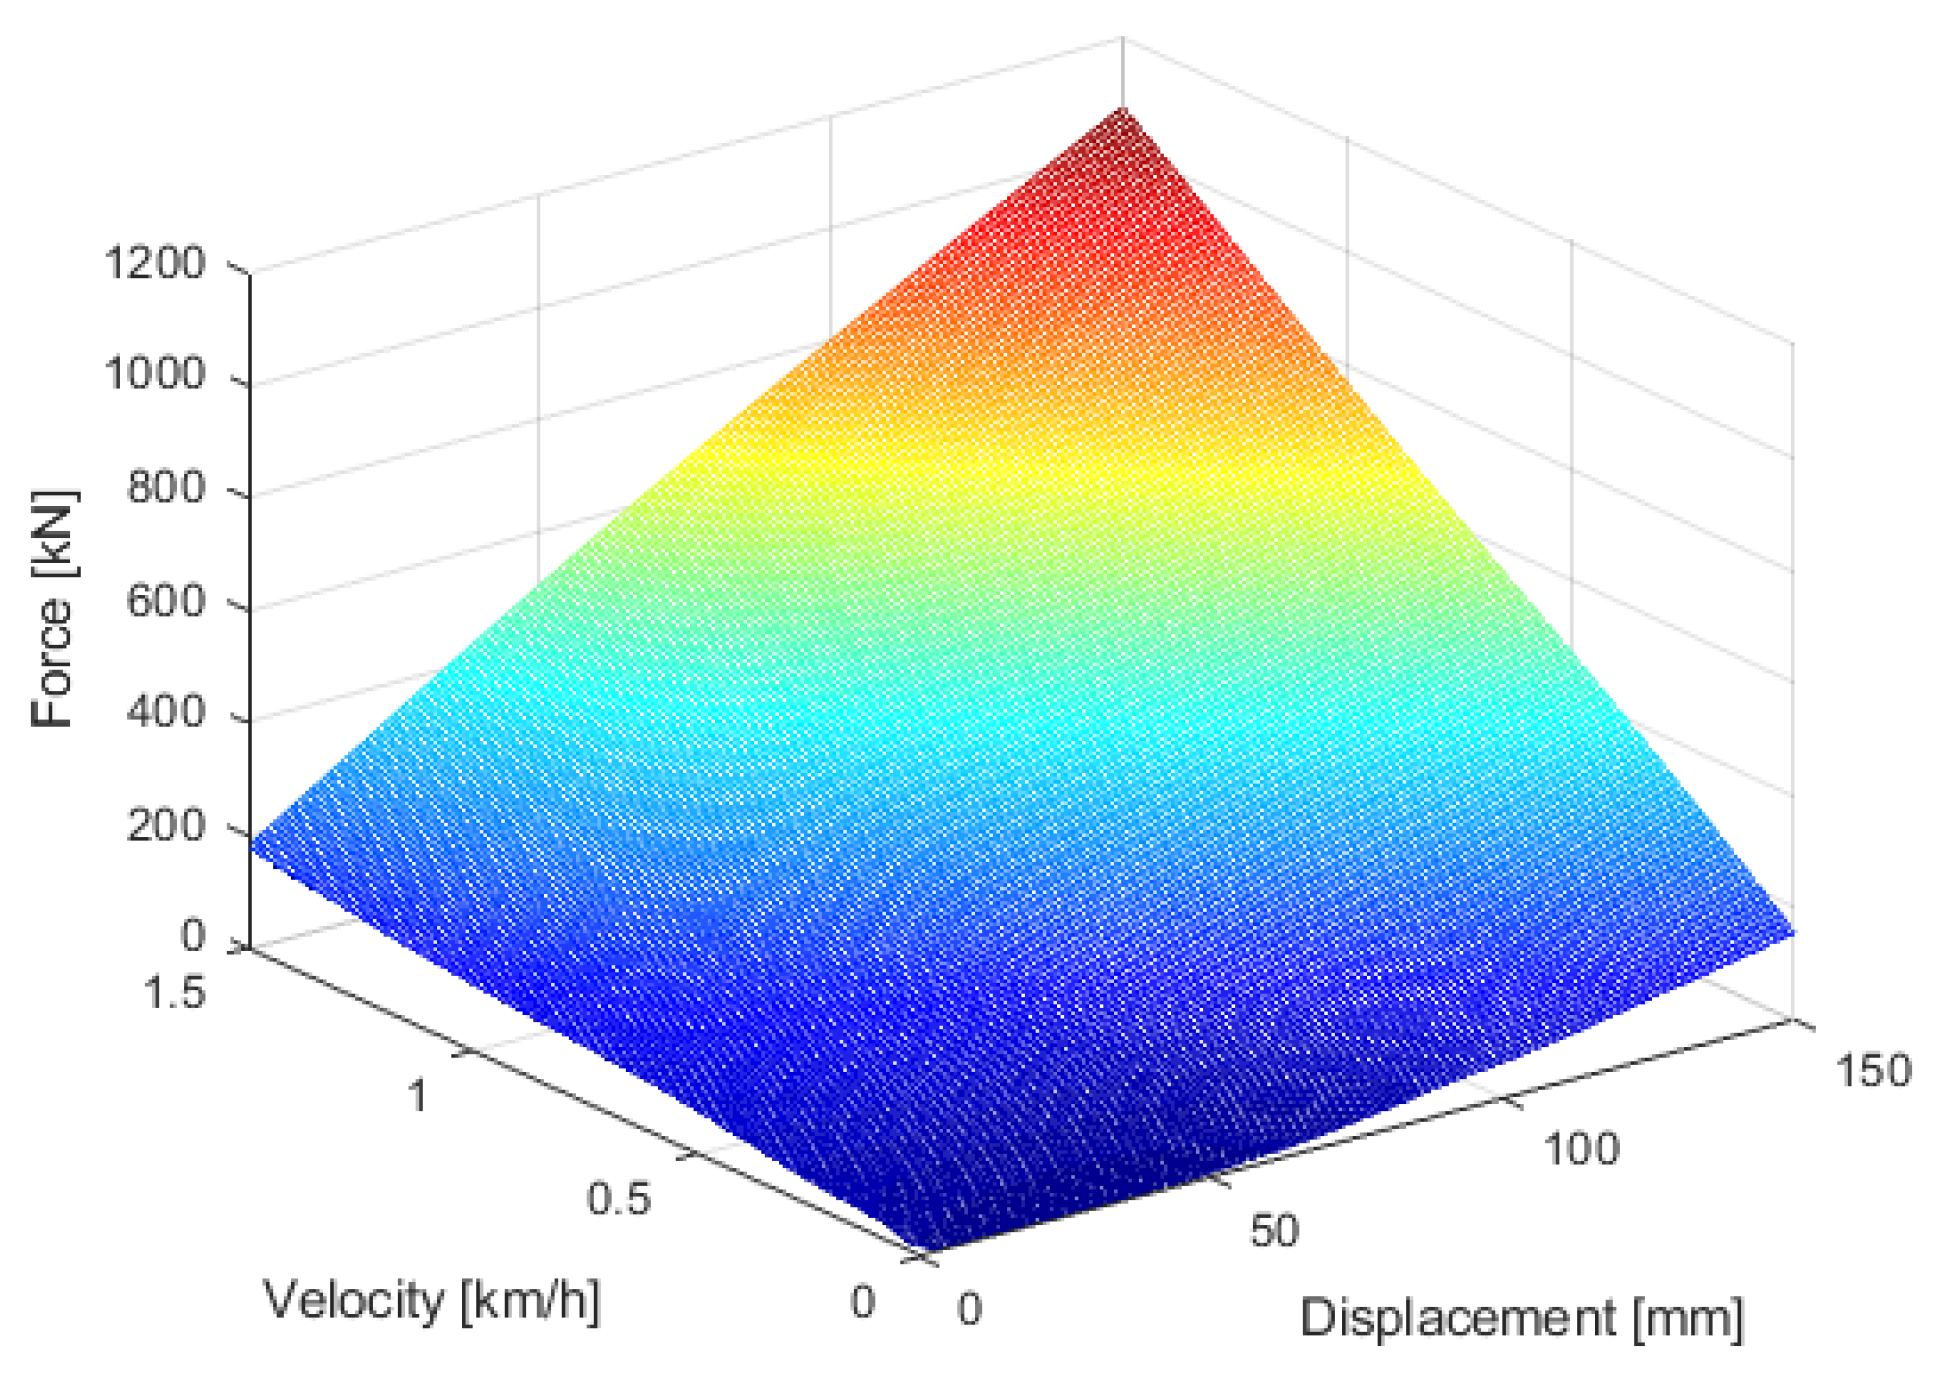
As shown in Figure 6, hydraulic buffers dissipate energy by the damping generated by the flow of fluids in the cylinder when a certain amount of force is applied to operate the hydraulic cylinder. As hydraulic buffers reflect the damping characteristics of the fluid, the buffering characteristics change depending on the operating speed. Therefore, the characteristic curve is a 3D diagram composed of displacement, velocity and buffering force lines, and Figure 7 shows the characteristic curve of a hydraulic buffer at a specific velocity. Hydraulic buffers can be reusable [13]; the characteristic data of the hydraulic shock absorber can be found in [12].
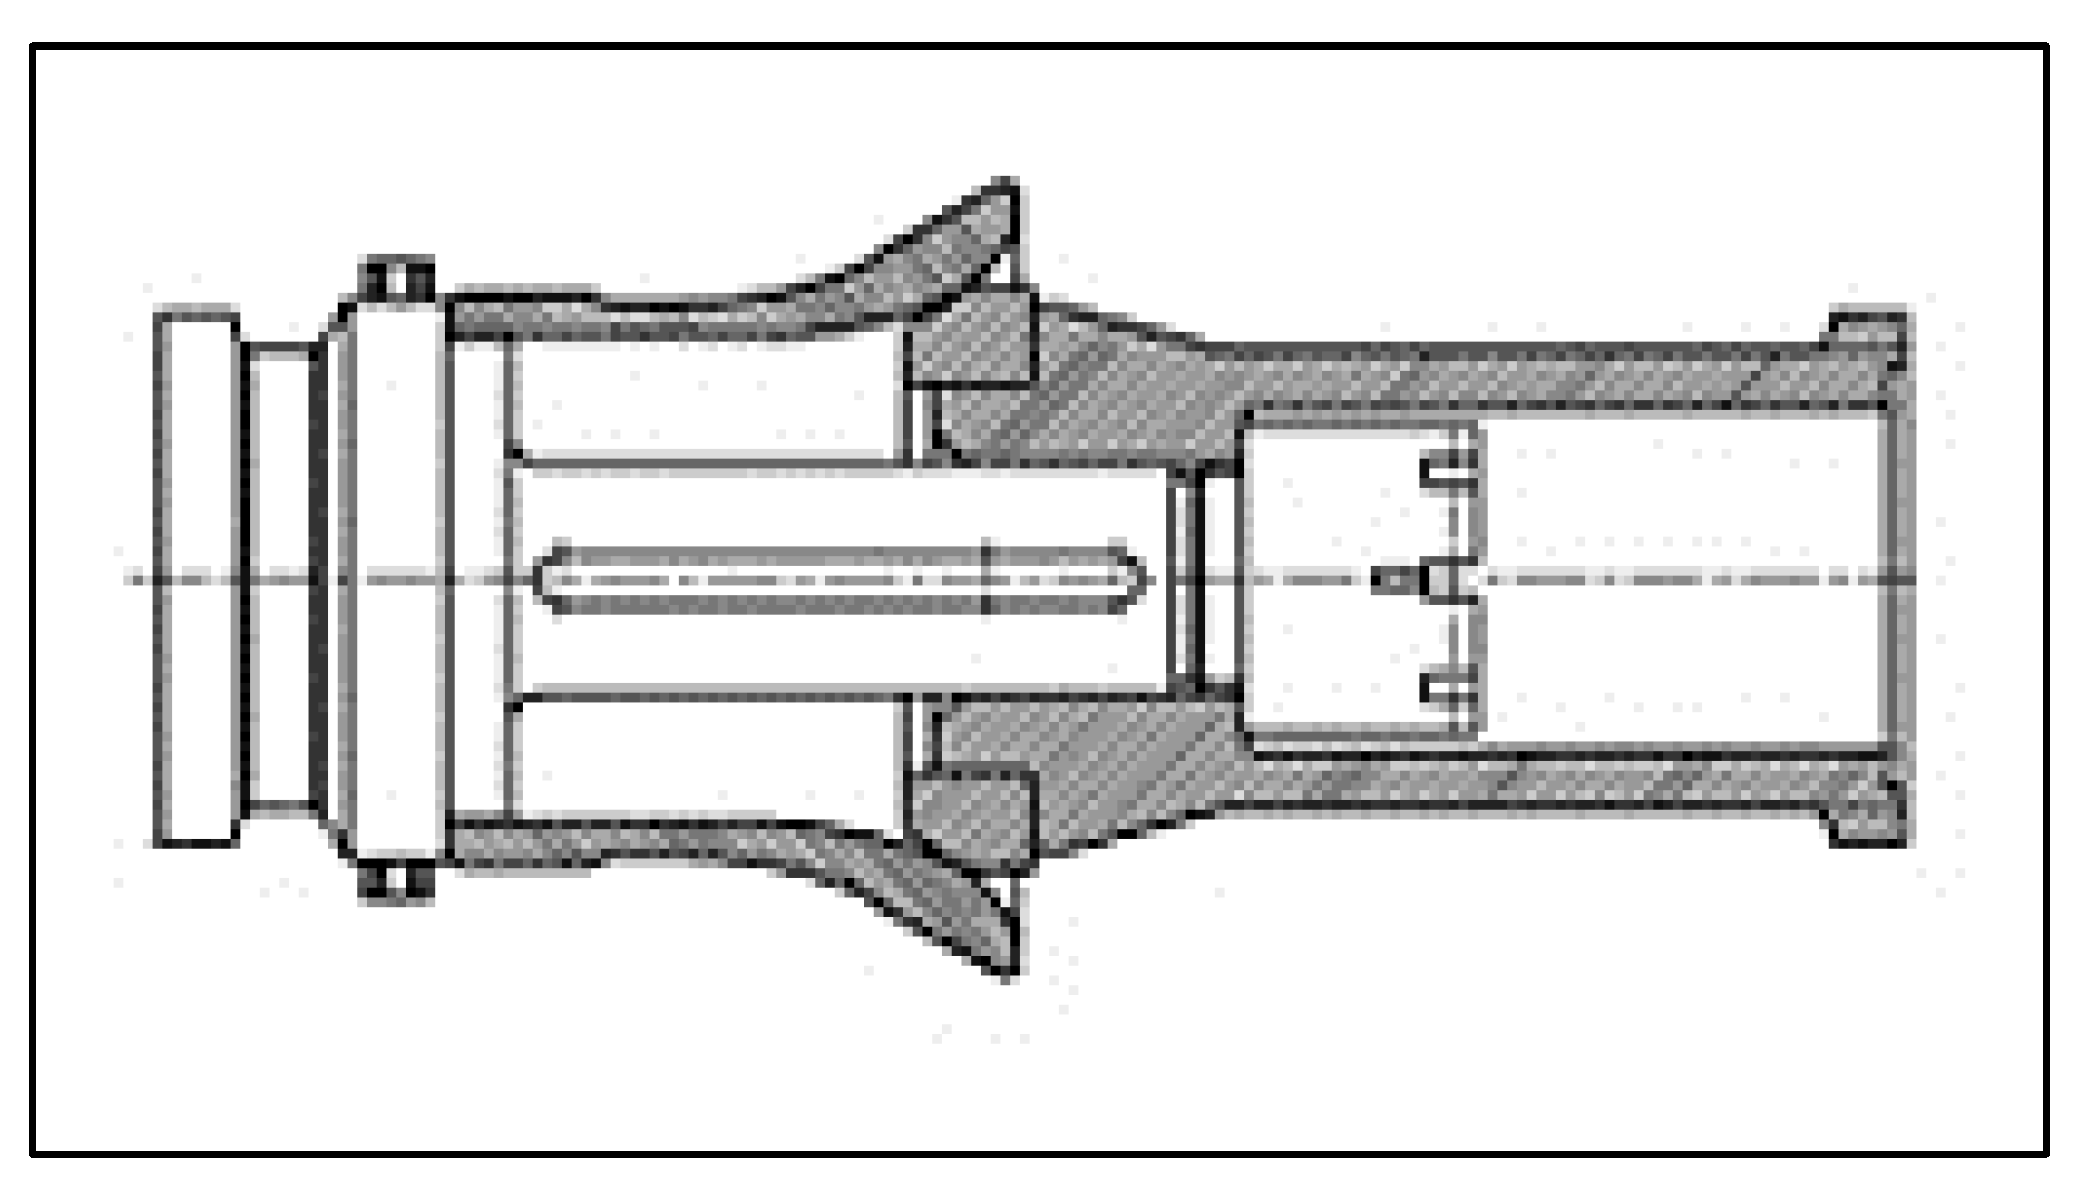
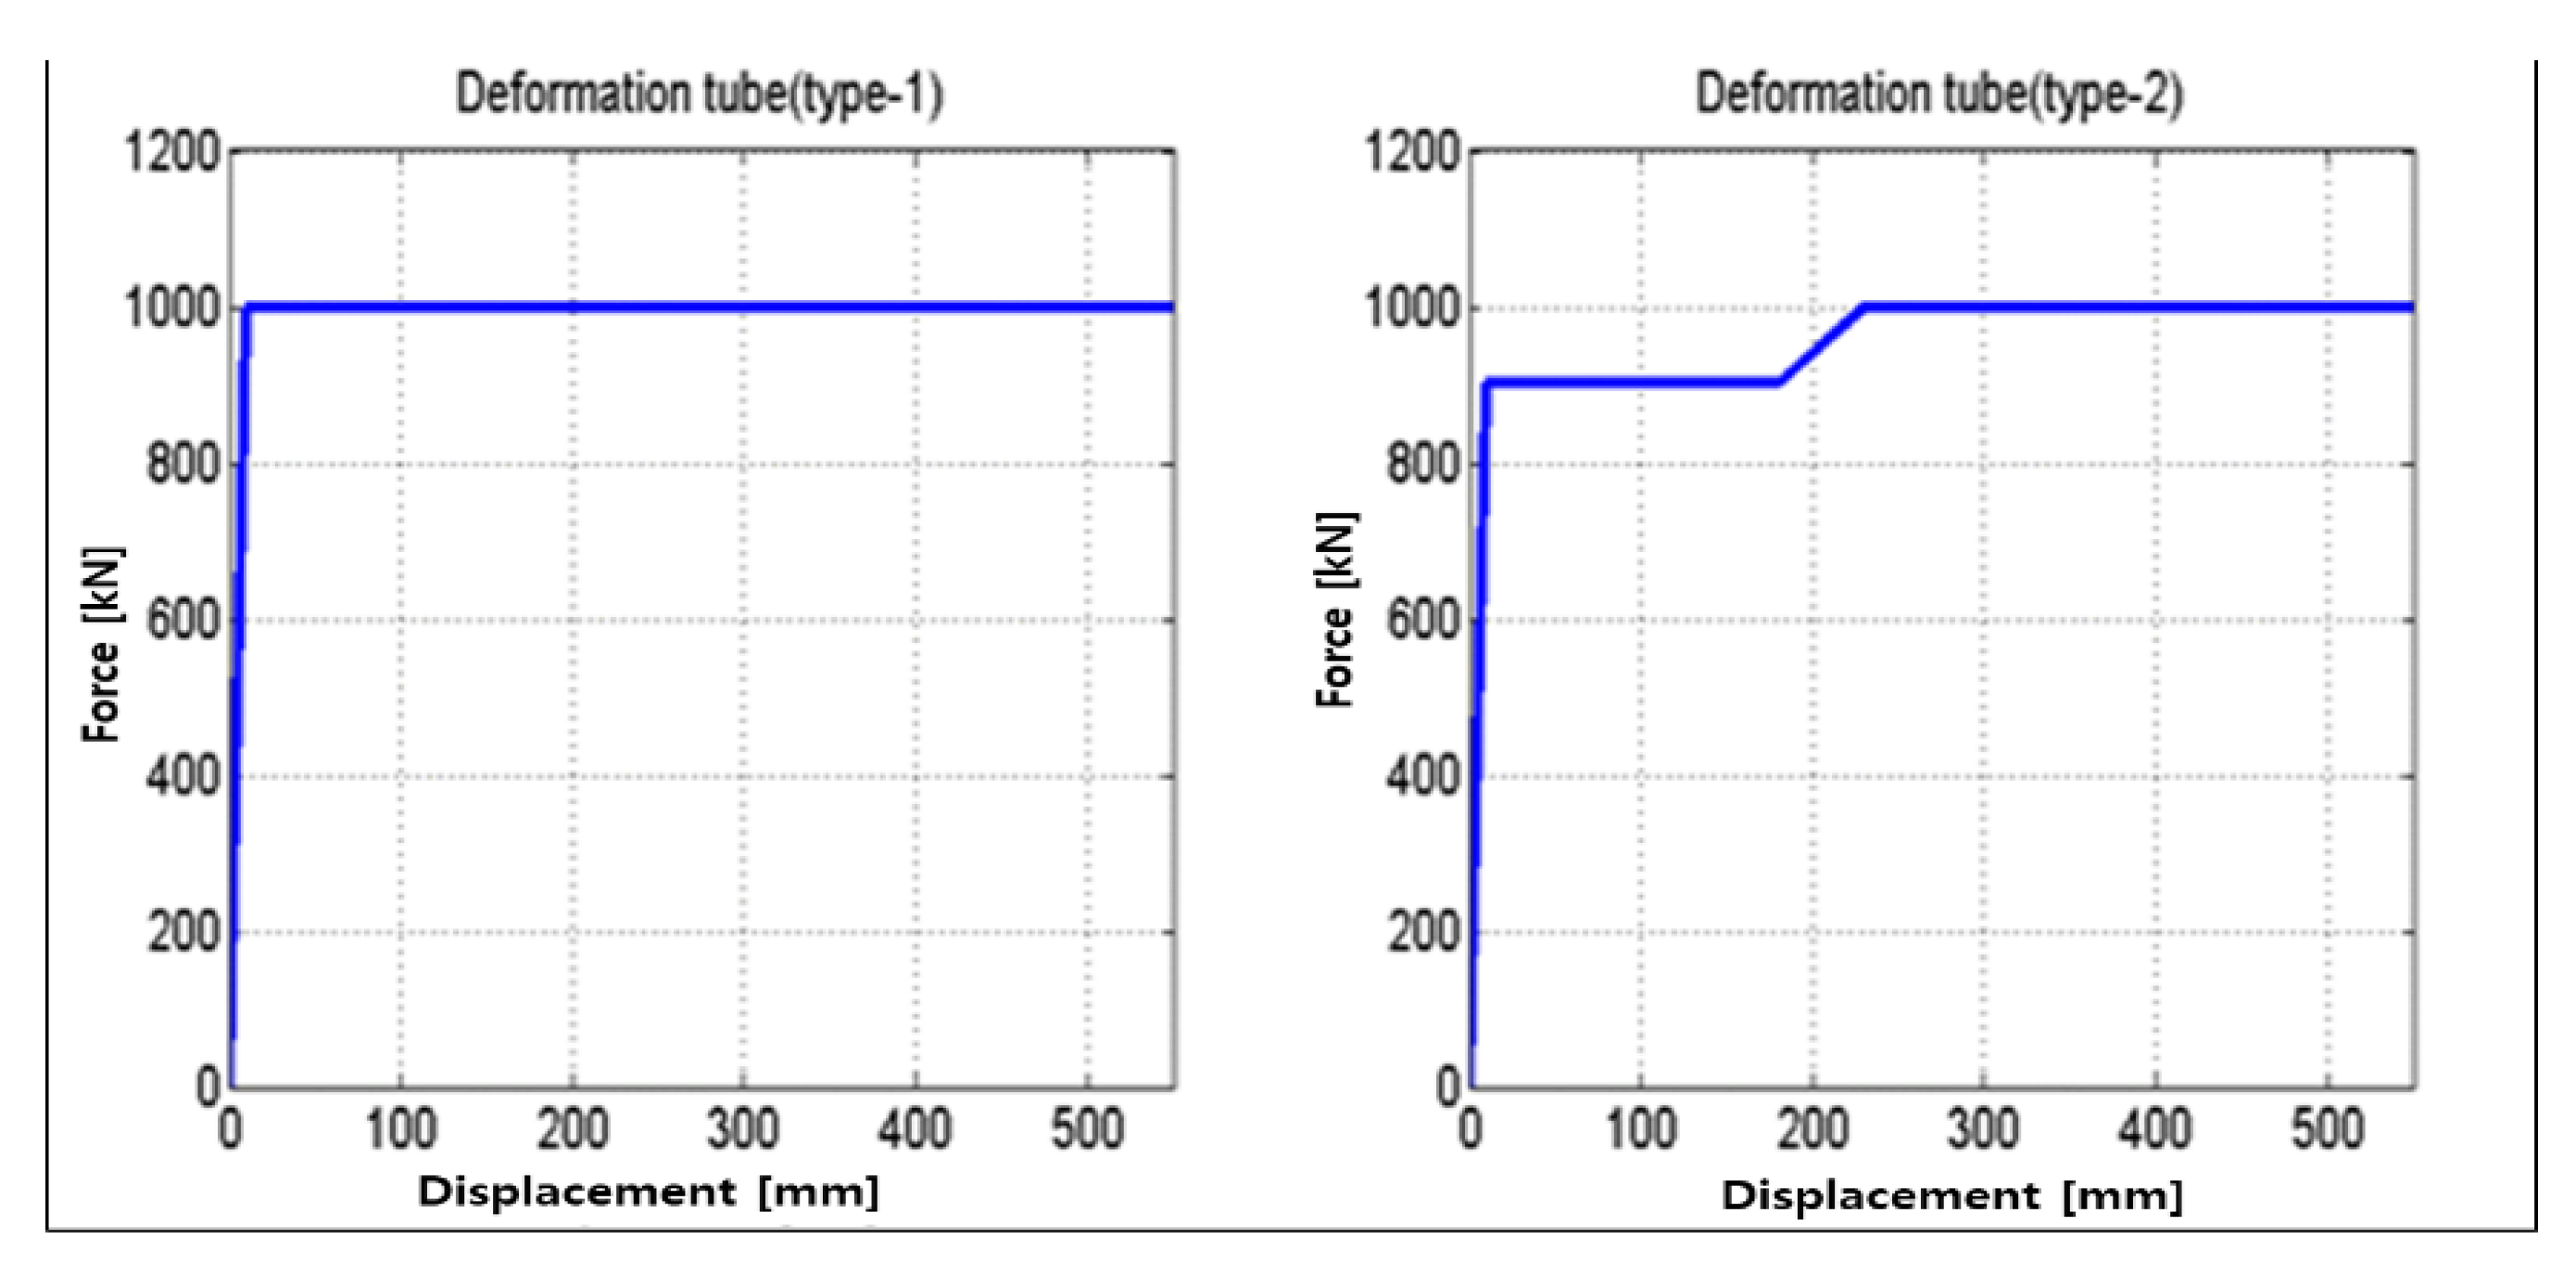
As shown in Figure 8, deformation tubes dissipate energy by the plastic deformation of the outer tube by the inner tube when a compressive force is applied on the coupler. As shown in the characteristic curve in Figure 9, deformation occurs only when the applied force exceeds the yield point and, depending on the design shape of the outer tube, the characteristic can be doubled. Deformation tubes cannot be reusable as plastic deformation occurs.
2.2. Collision Test Configuration
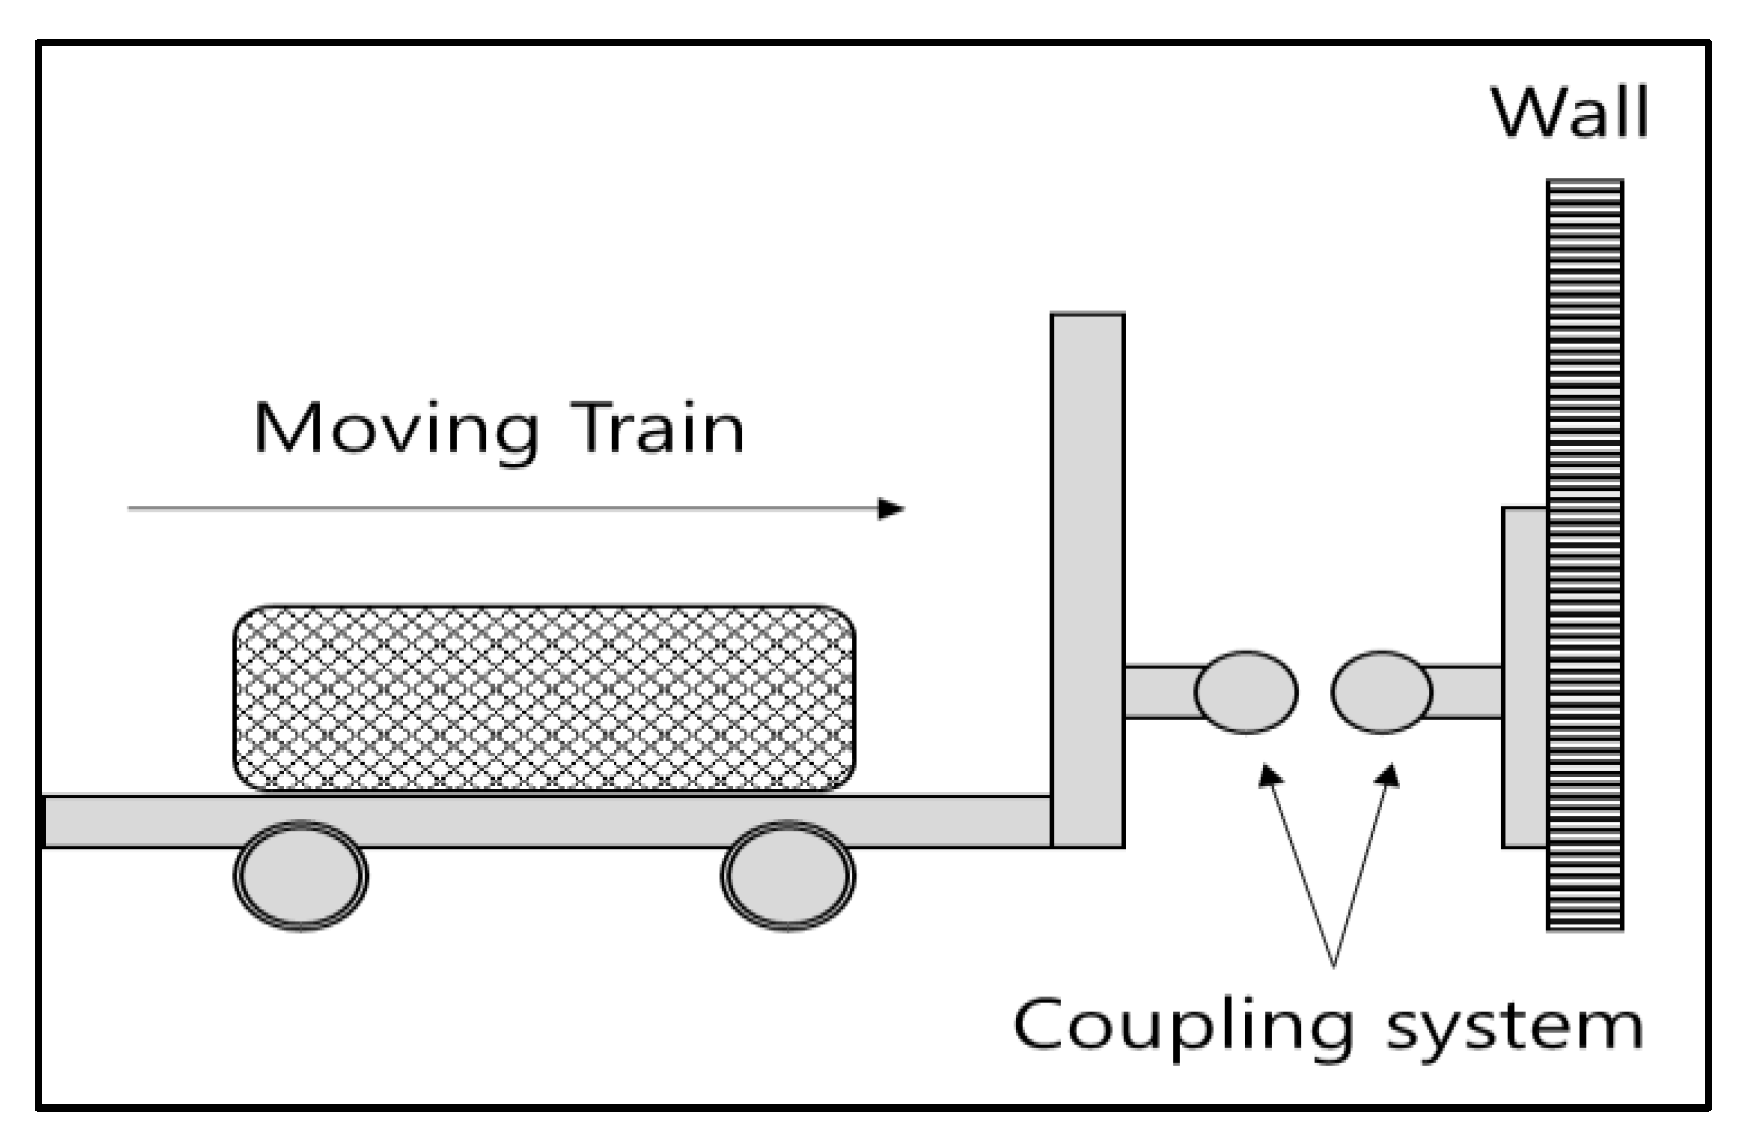
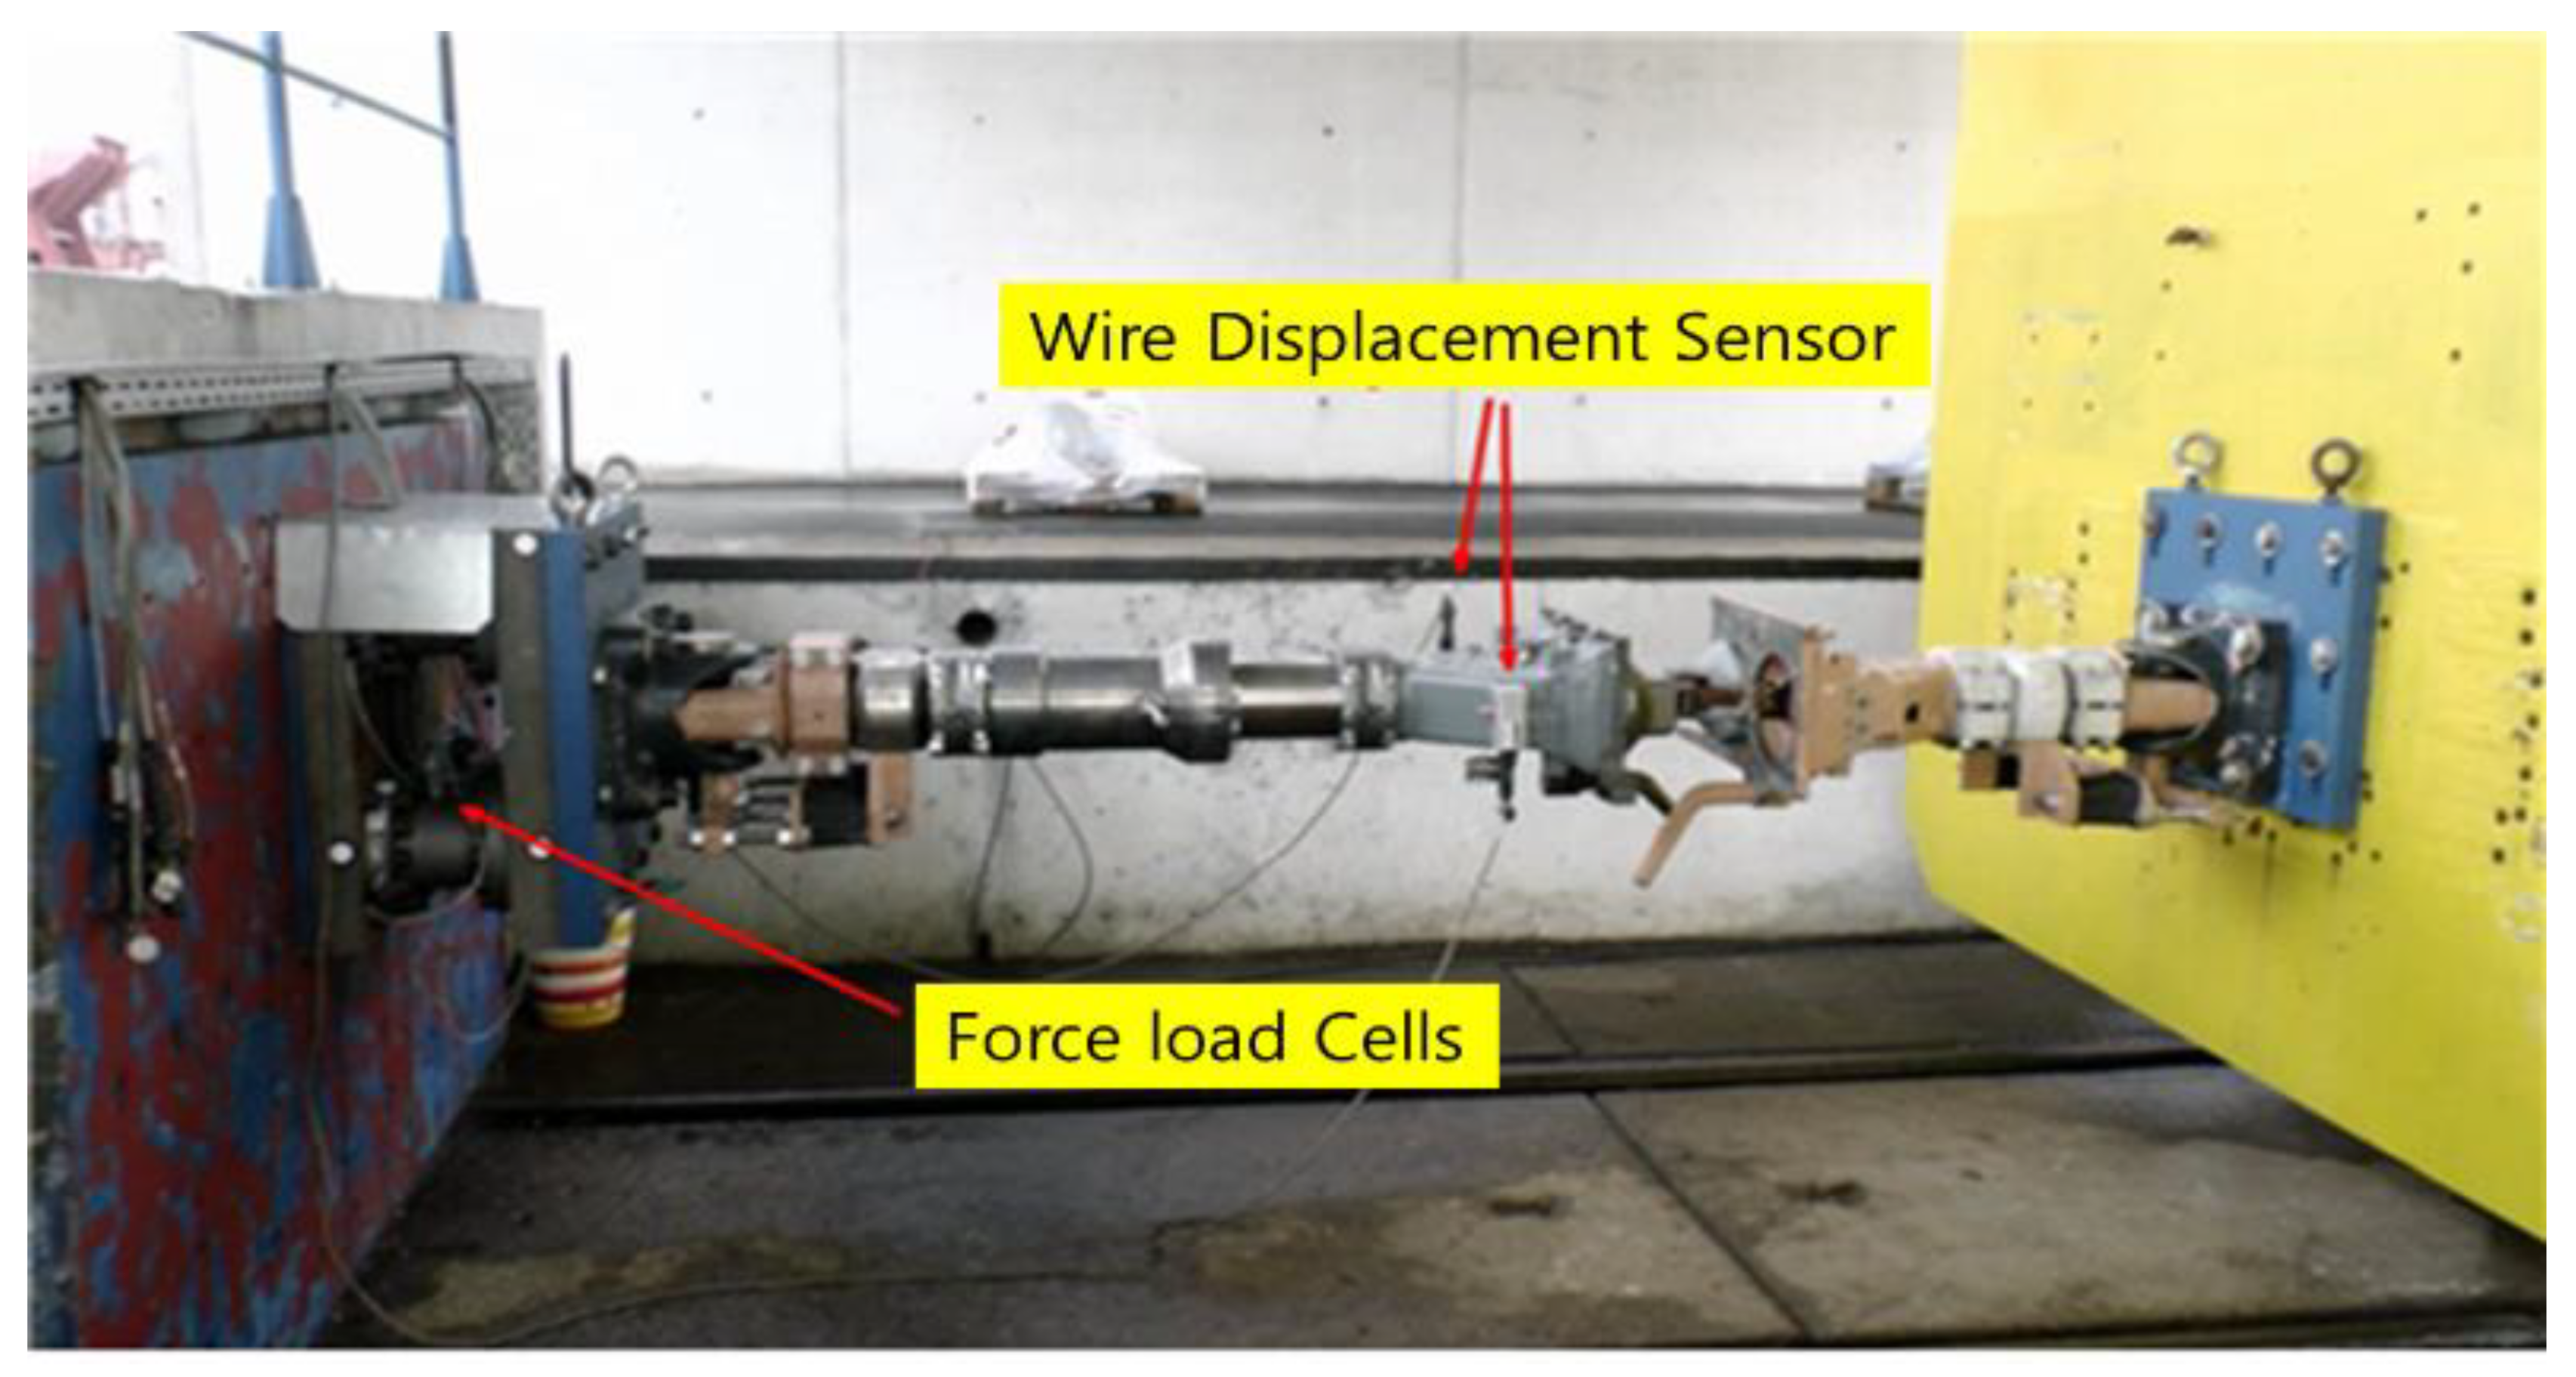
The collision tests were carried out on each component at the collision test center of the Korea Railroad Research Institute and the Görlitz Test Center in Germany. The tests were carried out under the conditions of the Korean Railway Safety Act [1] and the EN 15,227 standard [2]. Figure 10 shows a schematic configuration of the collision tests, and Figure 11 shows a photo of a collision test [2,15].
The collision tests were carried out by making a jig mount the buffer, installing it on the wall, and towing a train at the determined test speed to crash the train into the fixed wall. The test speed was determined by considering the weight of the vehicle and the characteristics of the buffer. High-speed cameras, force sensors, displacement sensors and speed sensors were installed to measure the collision characteristics.
As shown in Table 1, the rubber buffer was tested at 20.5 tons. Although rubber buffer characteristics do not change according to speed, six tests were carried out within the range of 2.3–7.0 km/h to confirm this. Since the characteristics of hydraulic buffers change according to speed, six tests were carried out within the range of 2.0–5.6 km/h at 81.1 tons. In the case of the middle connector, one collision test was carried out at 14.7 km/h and 20.5 tons. The deformation tube was tested in the assembly form of an intermediate coupler.
2.3. Collision Test Results
Through the collision tests, a graph was extracted showing the results of the collision tests in term of collision velocity versus displacement from the force.
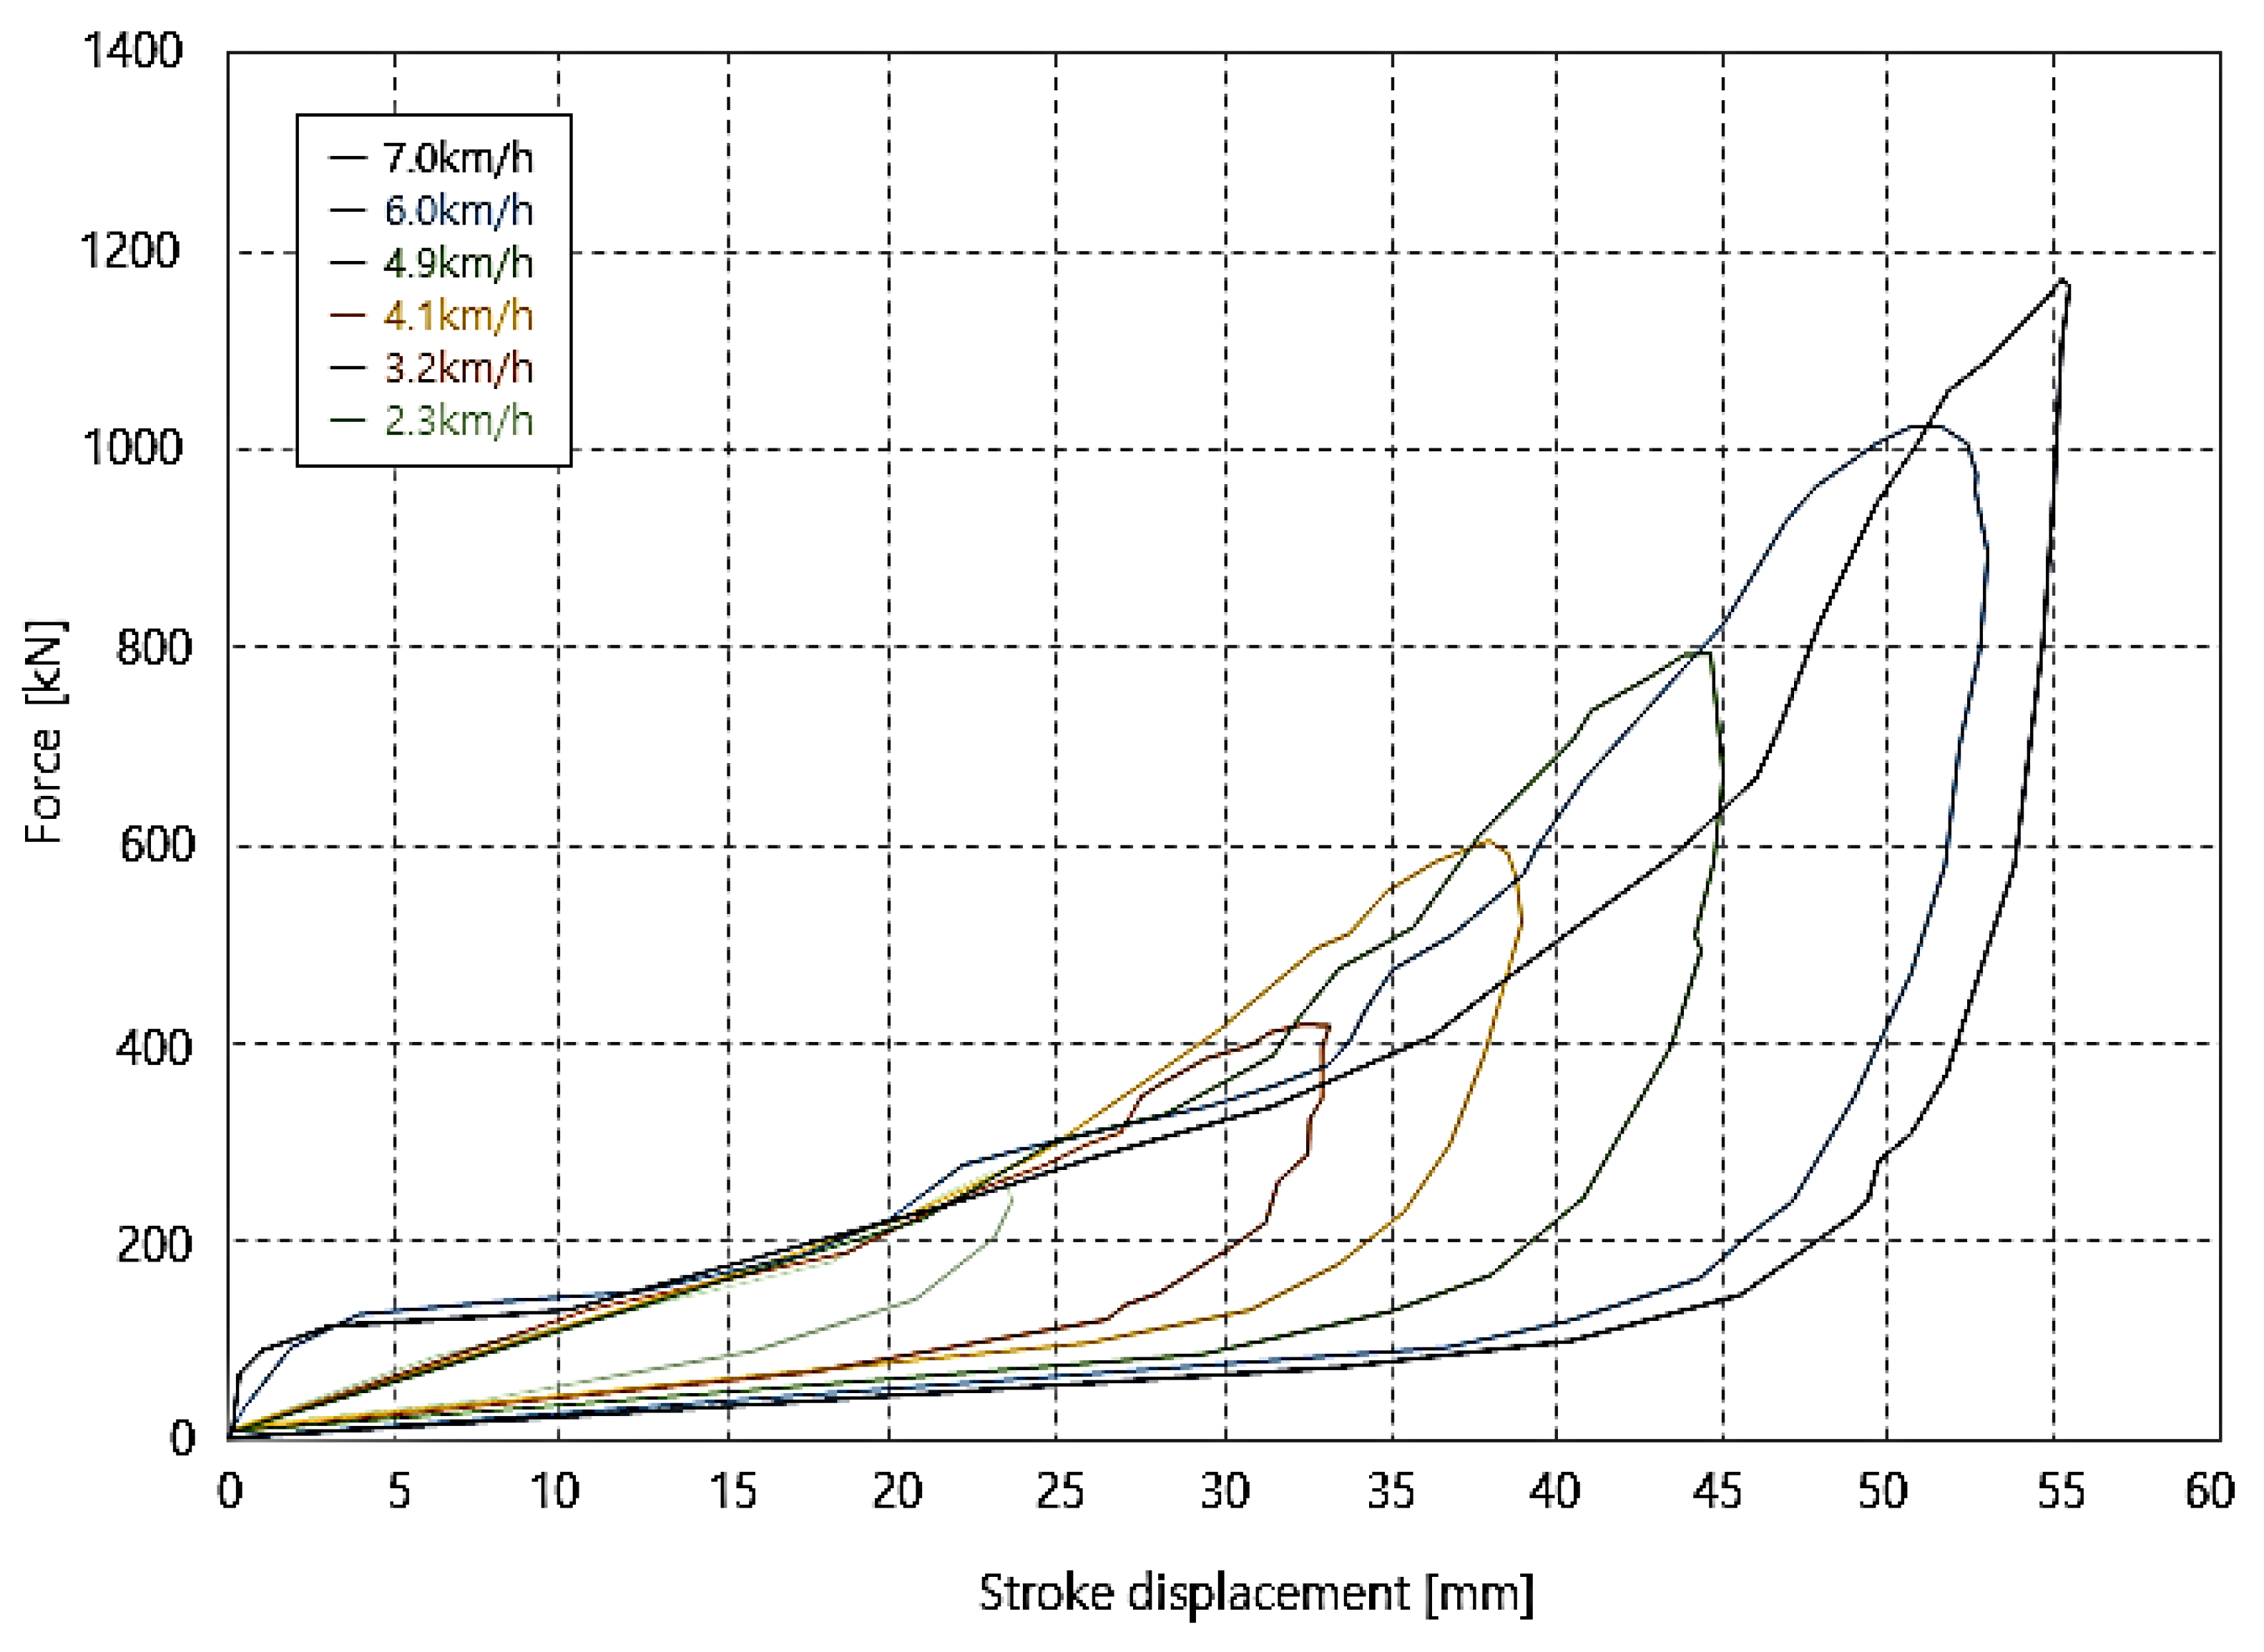
Figure 12 shows the characteristics of the rubber buffer. The maximum load was about 1180 kN at a collision velocity of 7.0 km/h. The curve shows that the energy absorption capacity and maximum load increased in proportion to the collision velocity [16]. When the applied load increased along the rising line of compression and then decreased along the decreasing line of tension, the load changed rapidly inside the rubber itself due to inherent properties of rubber. Since the rubber buffer was completely deformed at the collision velocity of 7.0 km/h, the test was carried out up to this speed.
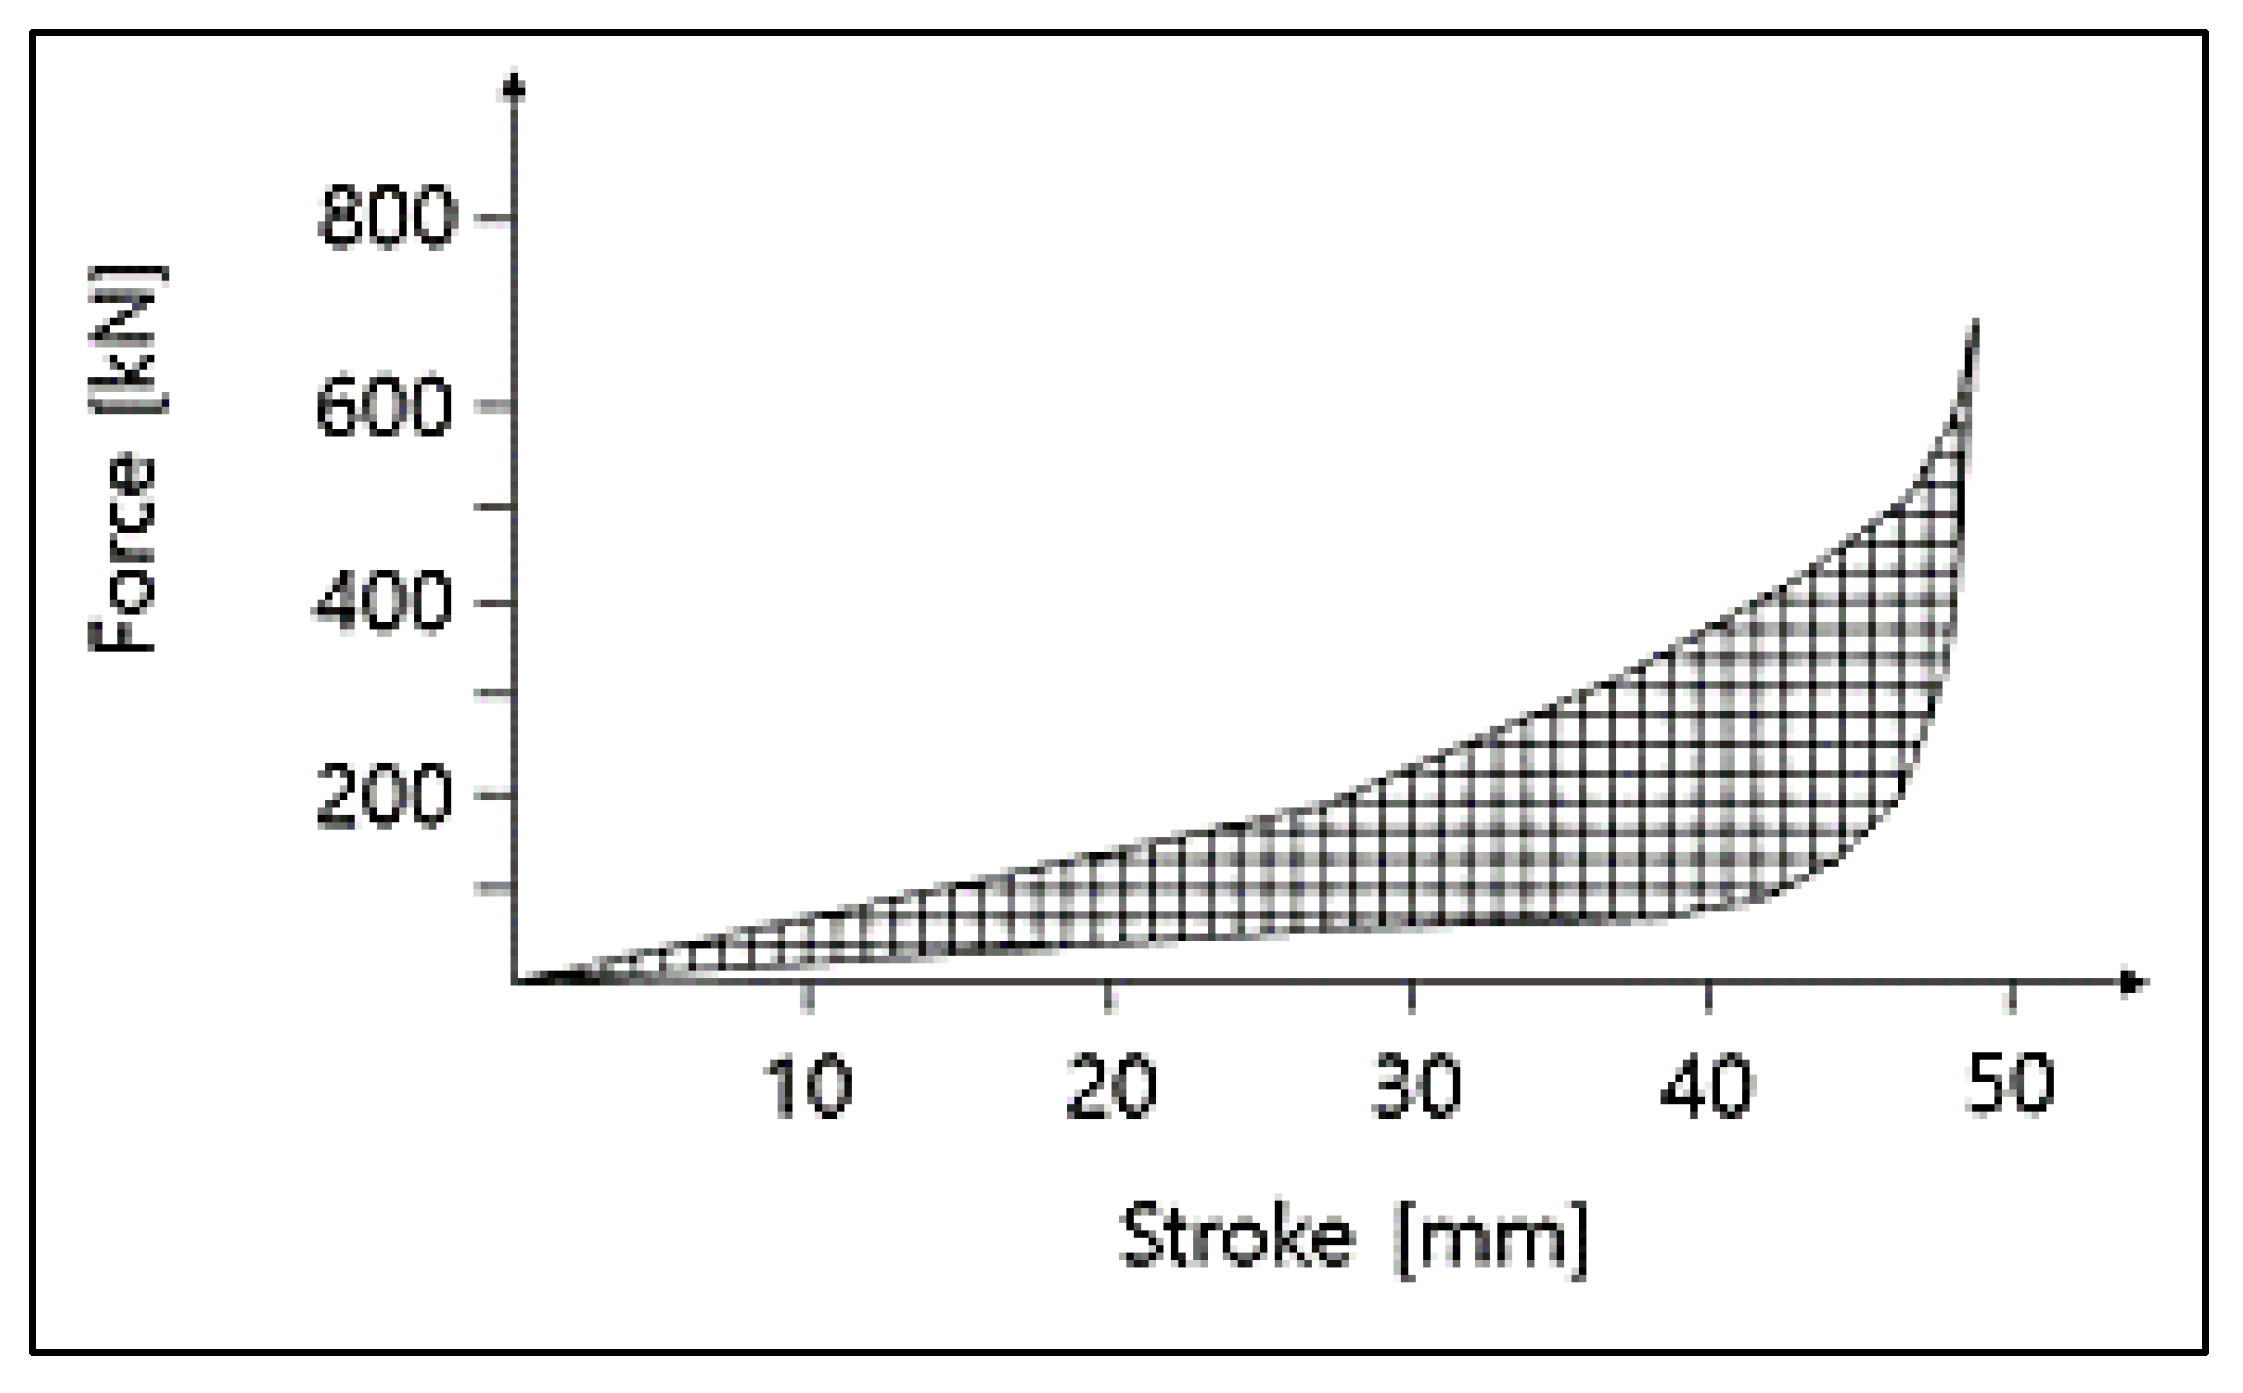
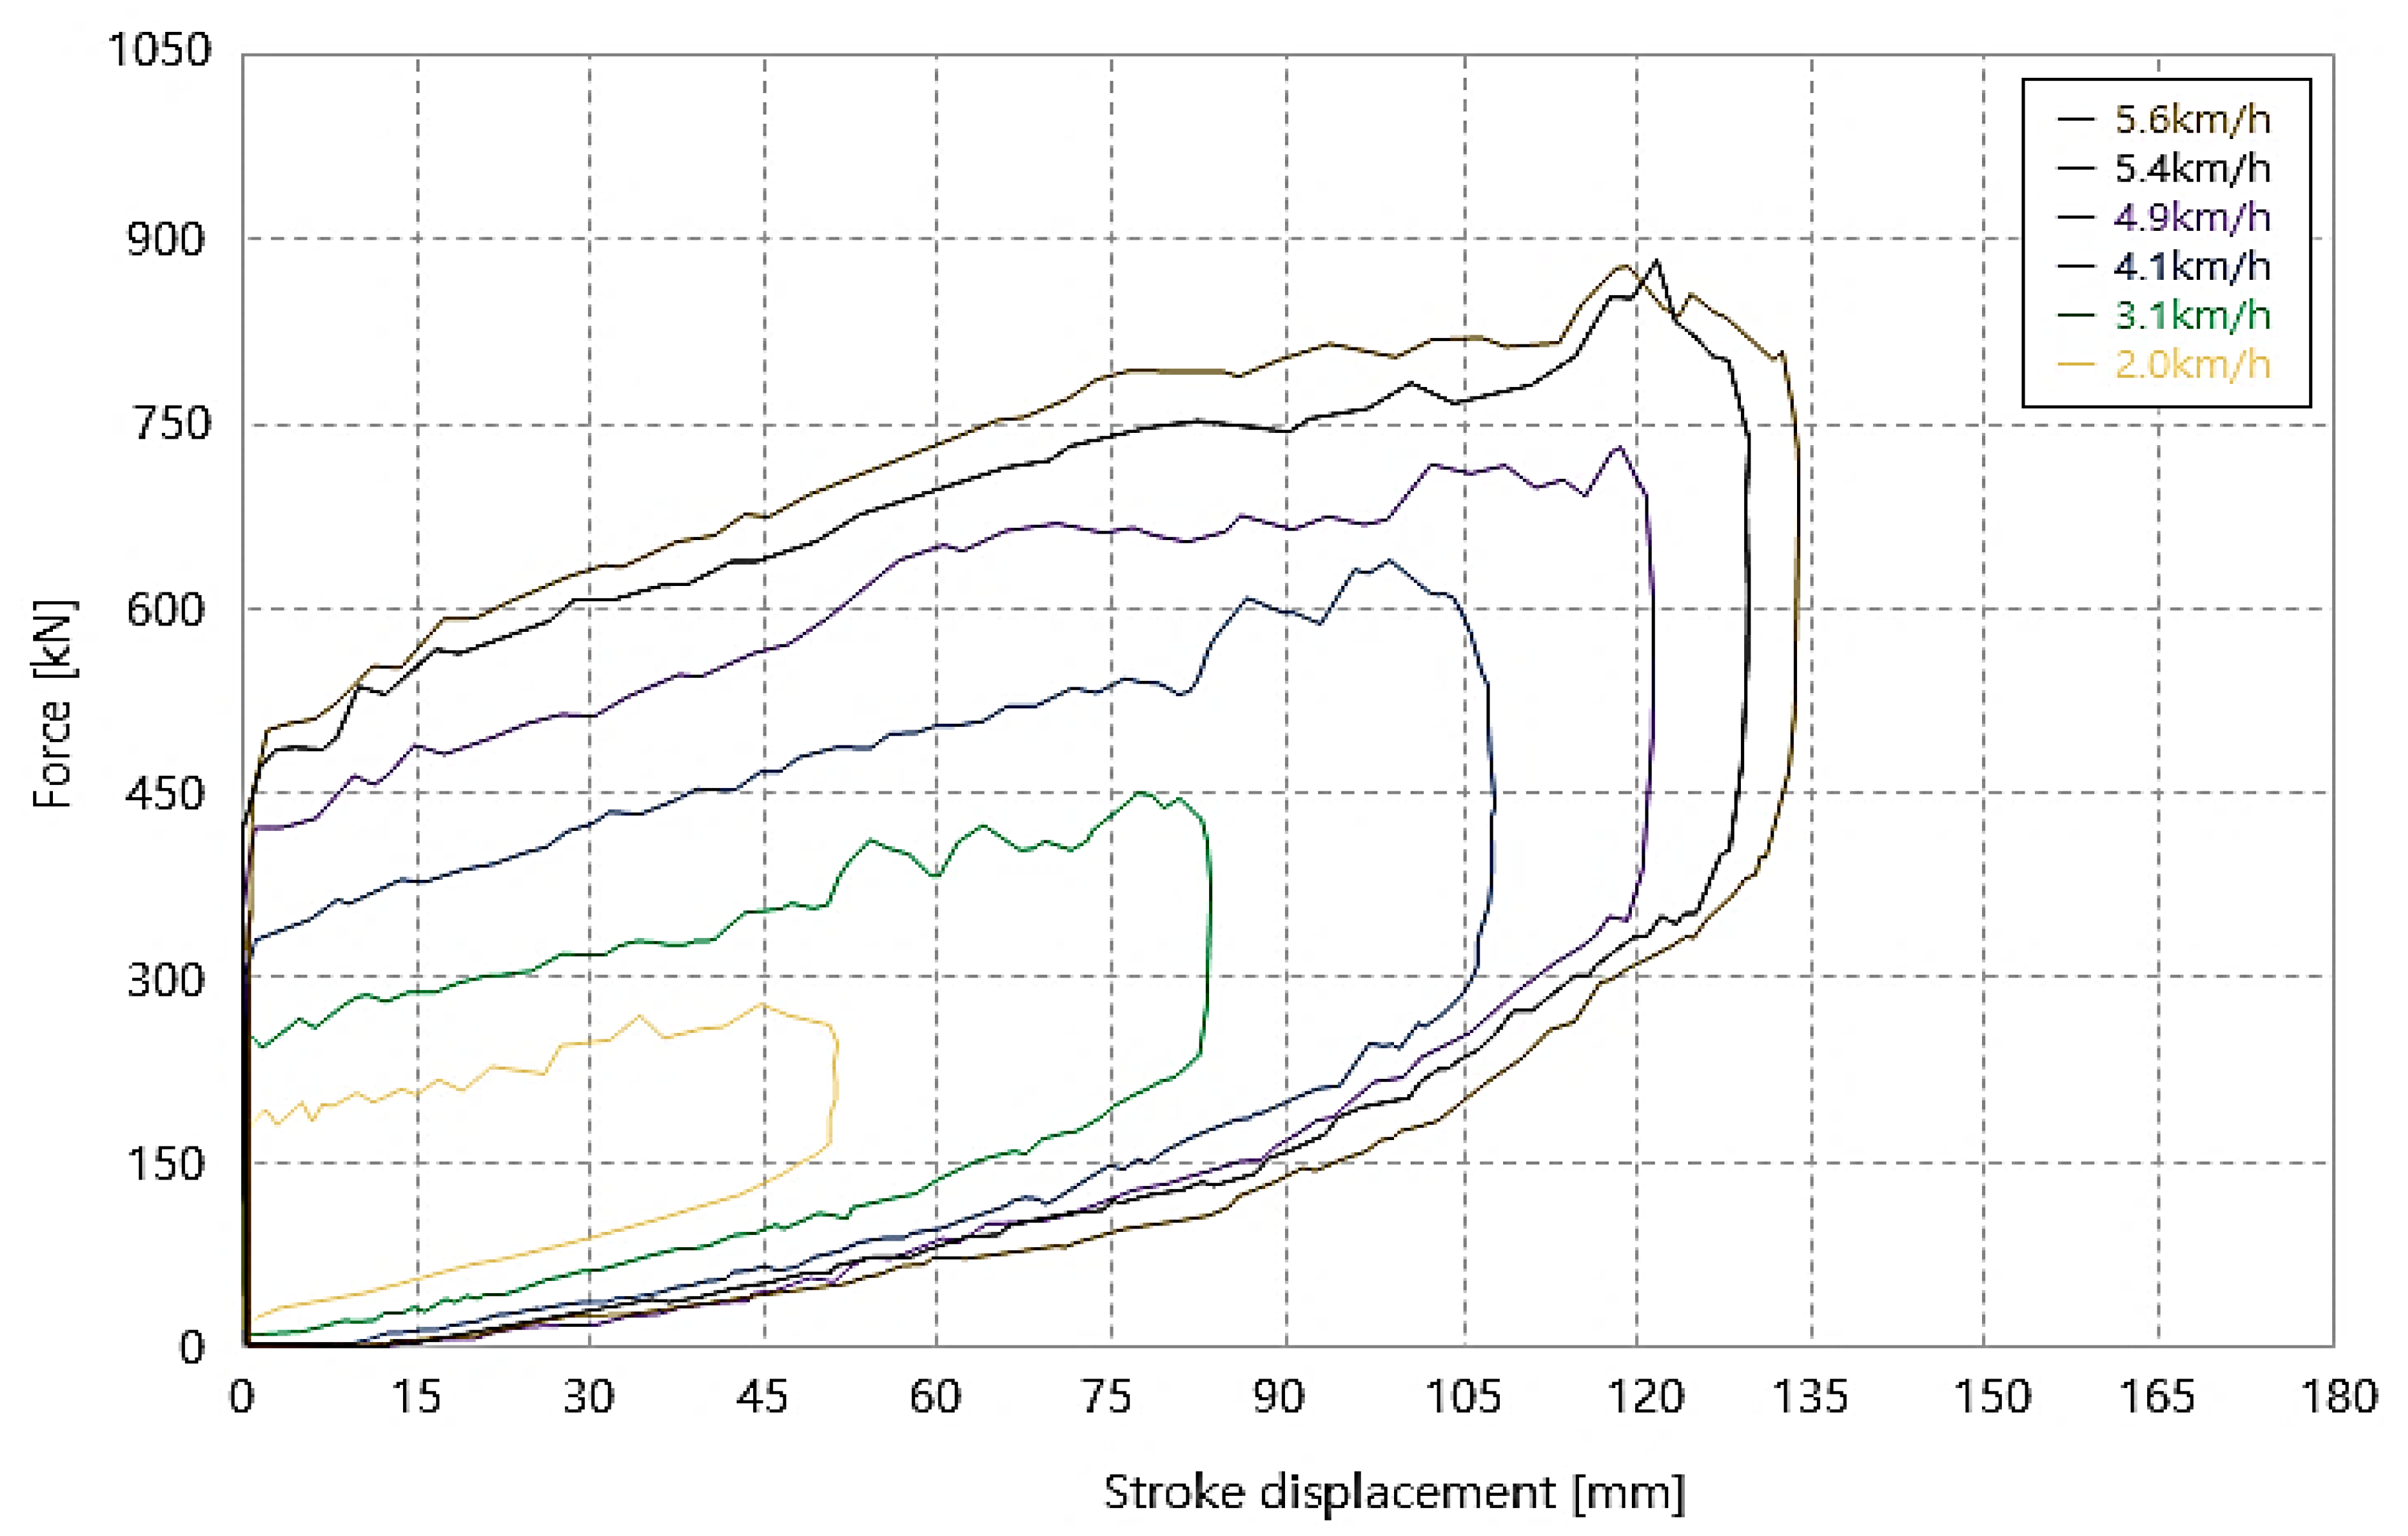
Figure 13 shows the results of the hydraulic buffer at six speeds from 2.0 to 5.6 km/h. At a collision velocity of 2.0 km/h, the stroke moved 51 mm, the maximum load was 280 kN, and the energy absorption was 12 kJ. The curve at each collision speed shows similar shapes proportional to the collision velocity, and in proportion to the collision velocity the hydraulic buffer did not move until it reached a certain load. The tests were carried out up to 5.6 km/h, which is the maximum capacity capable of indicating buffering performance.
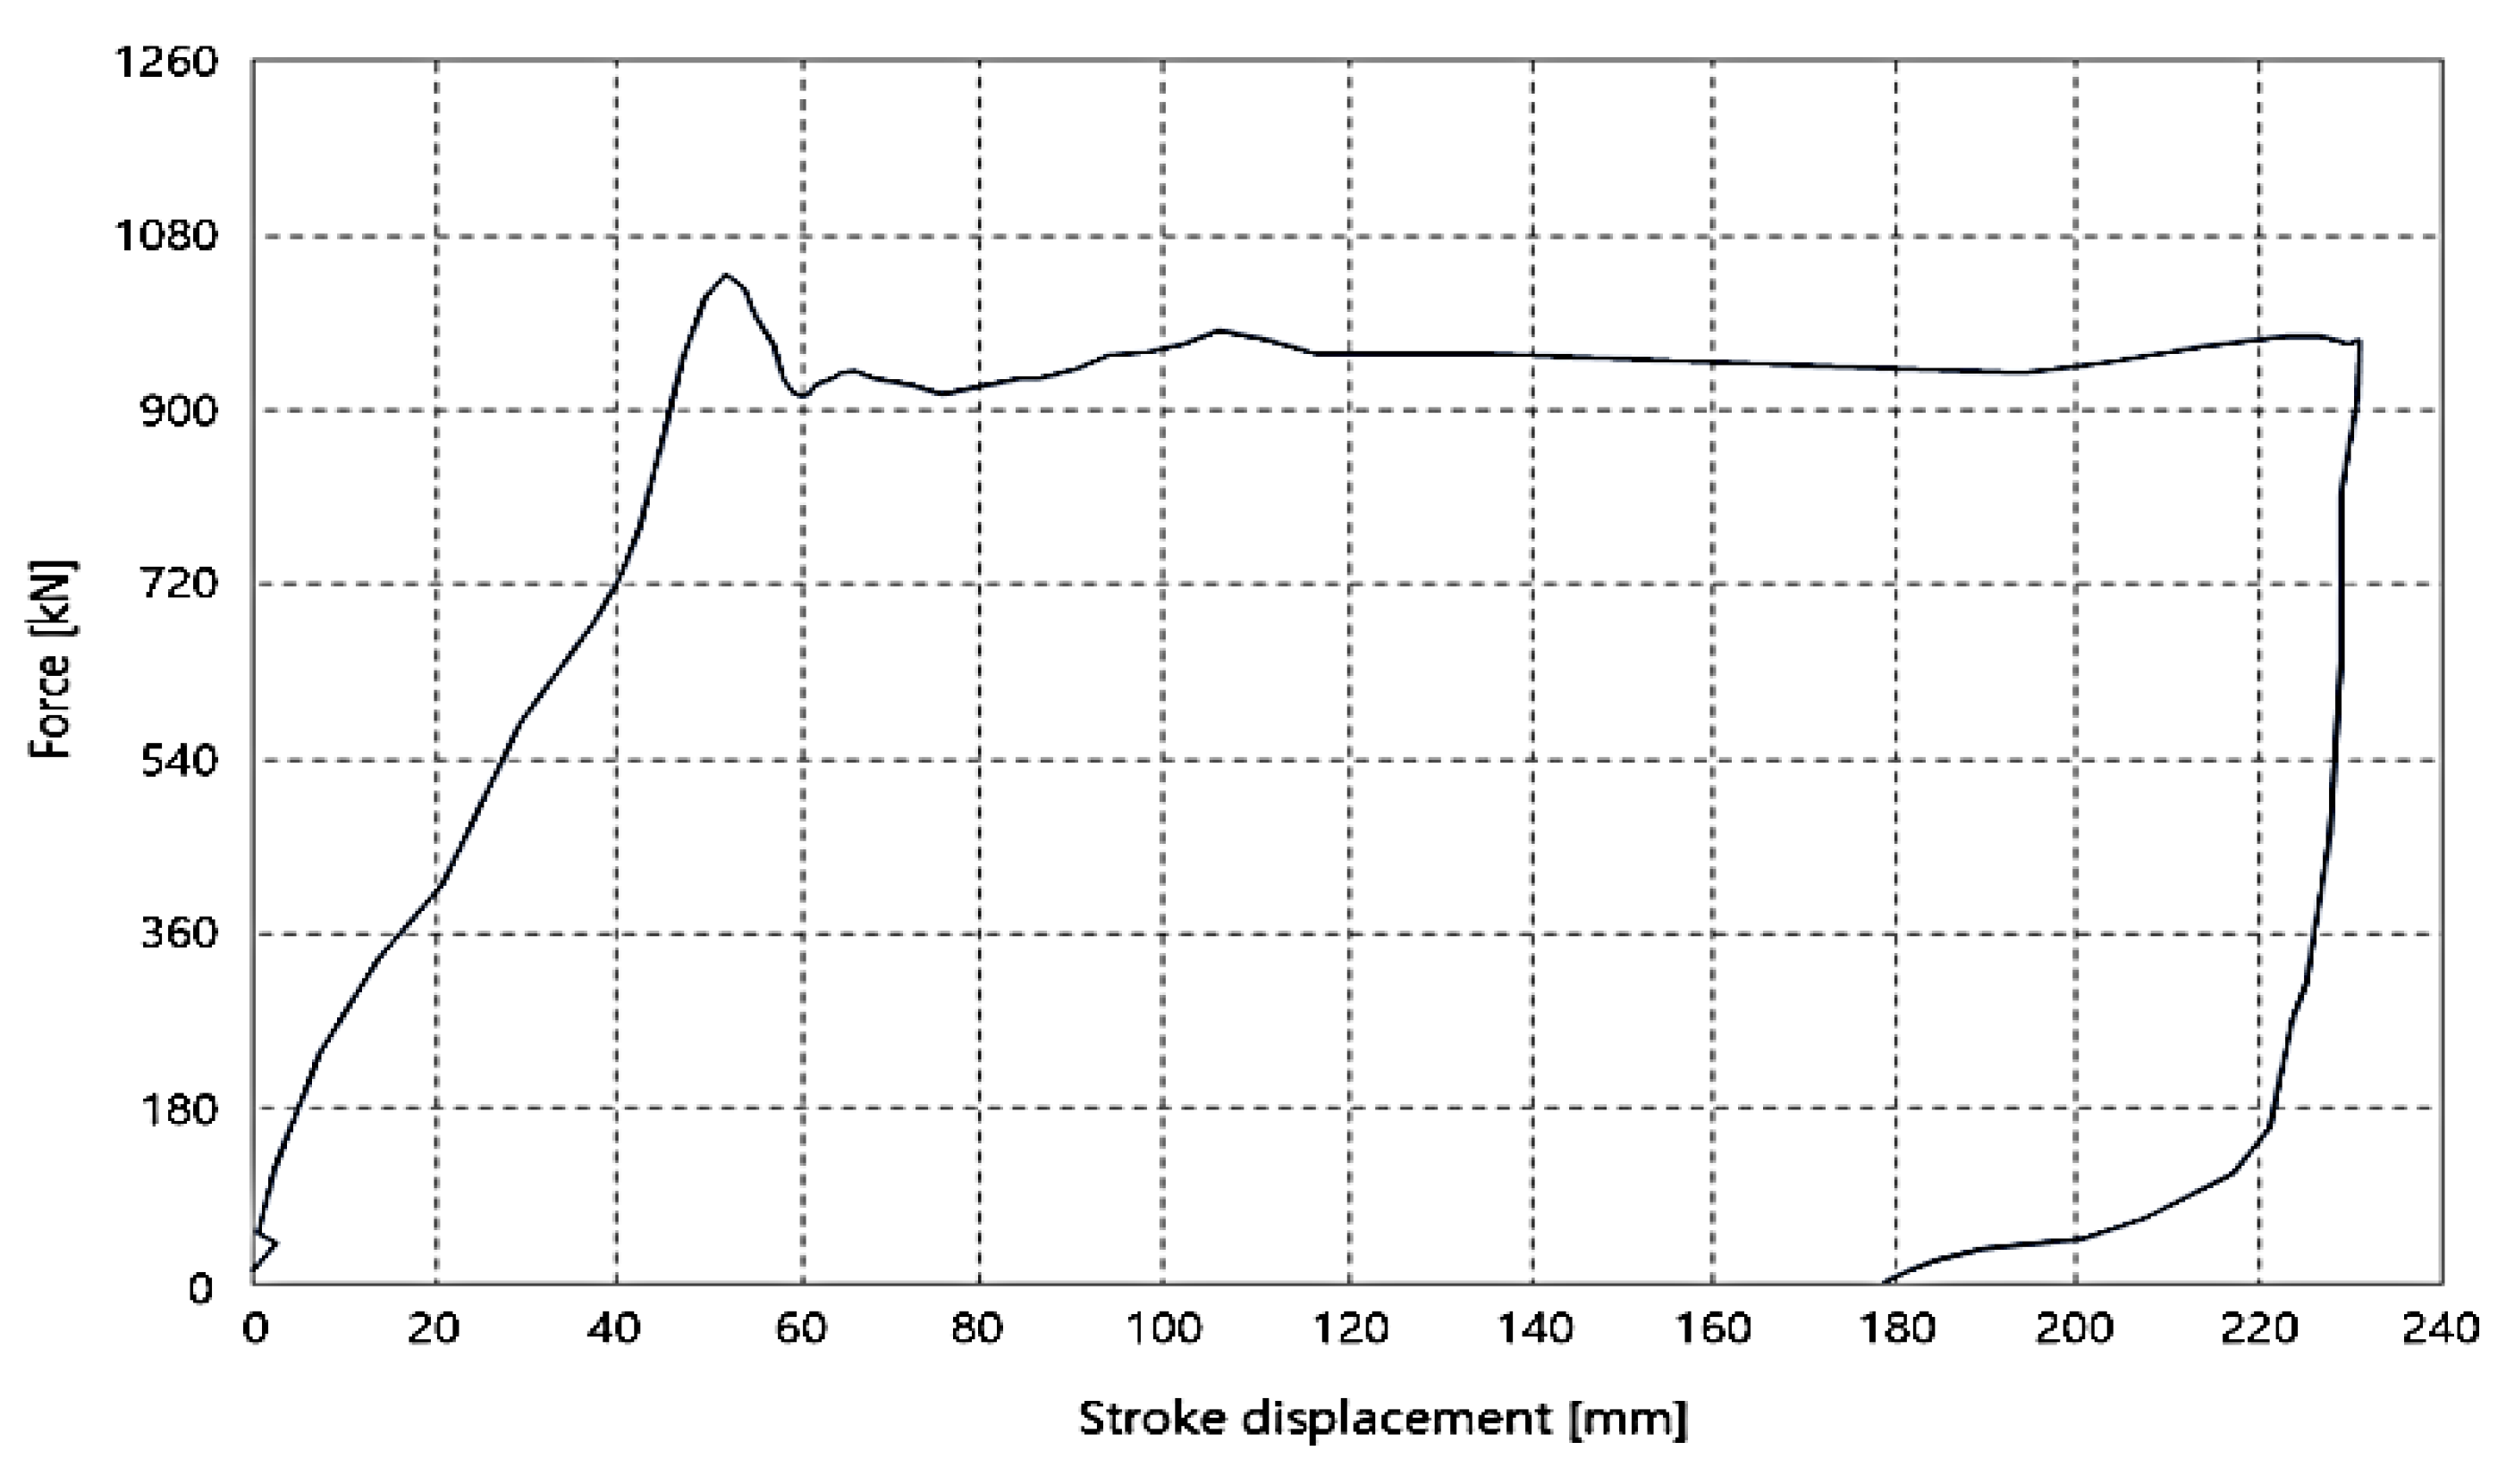
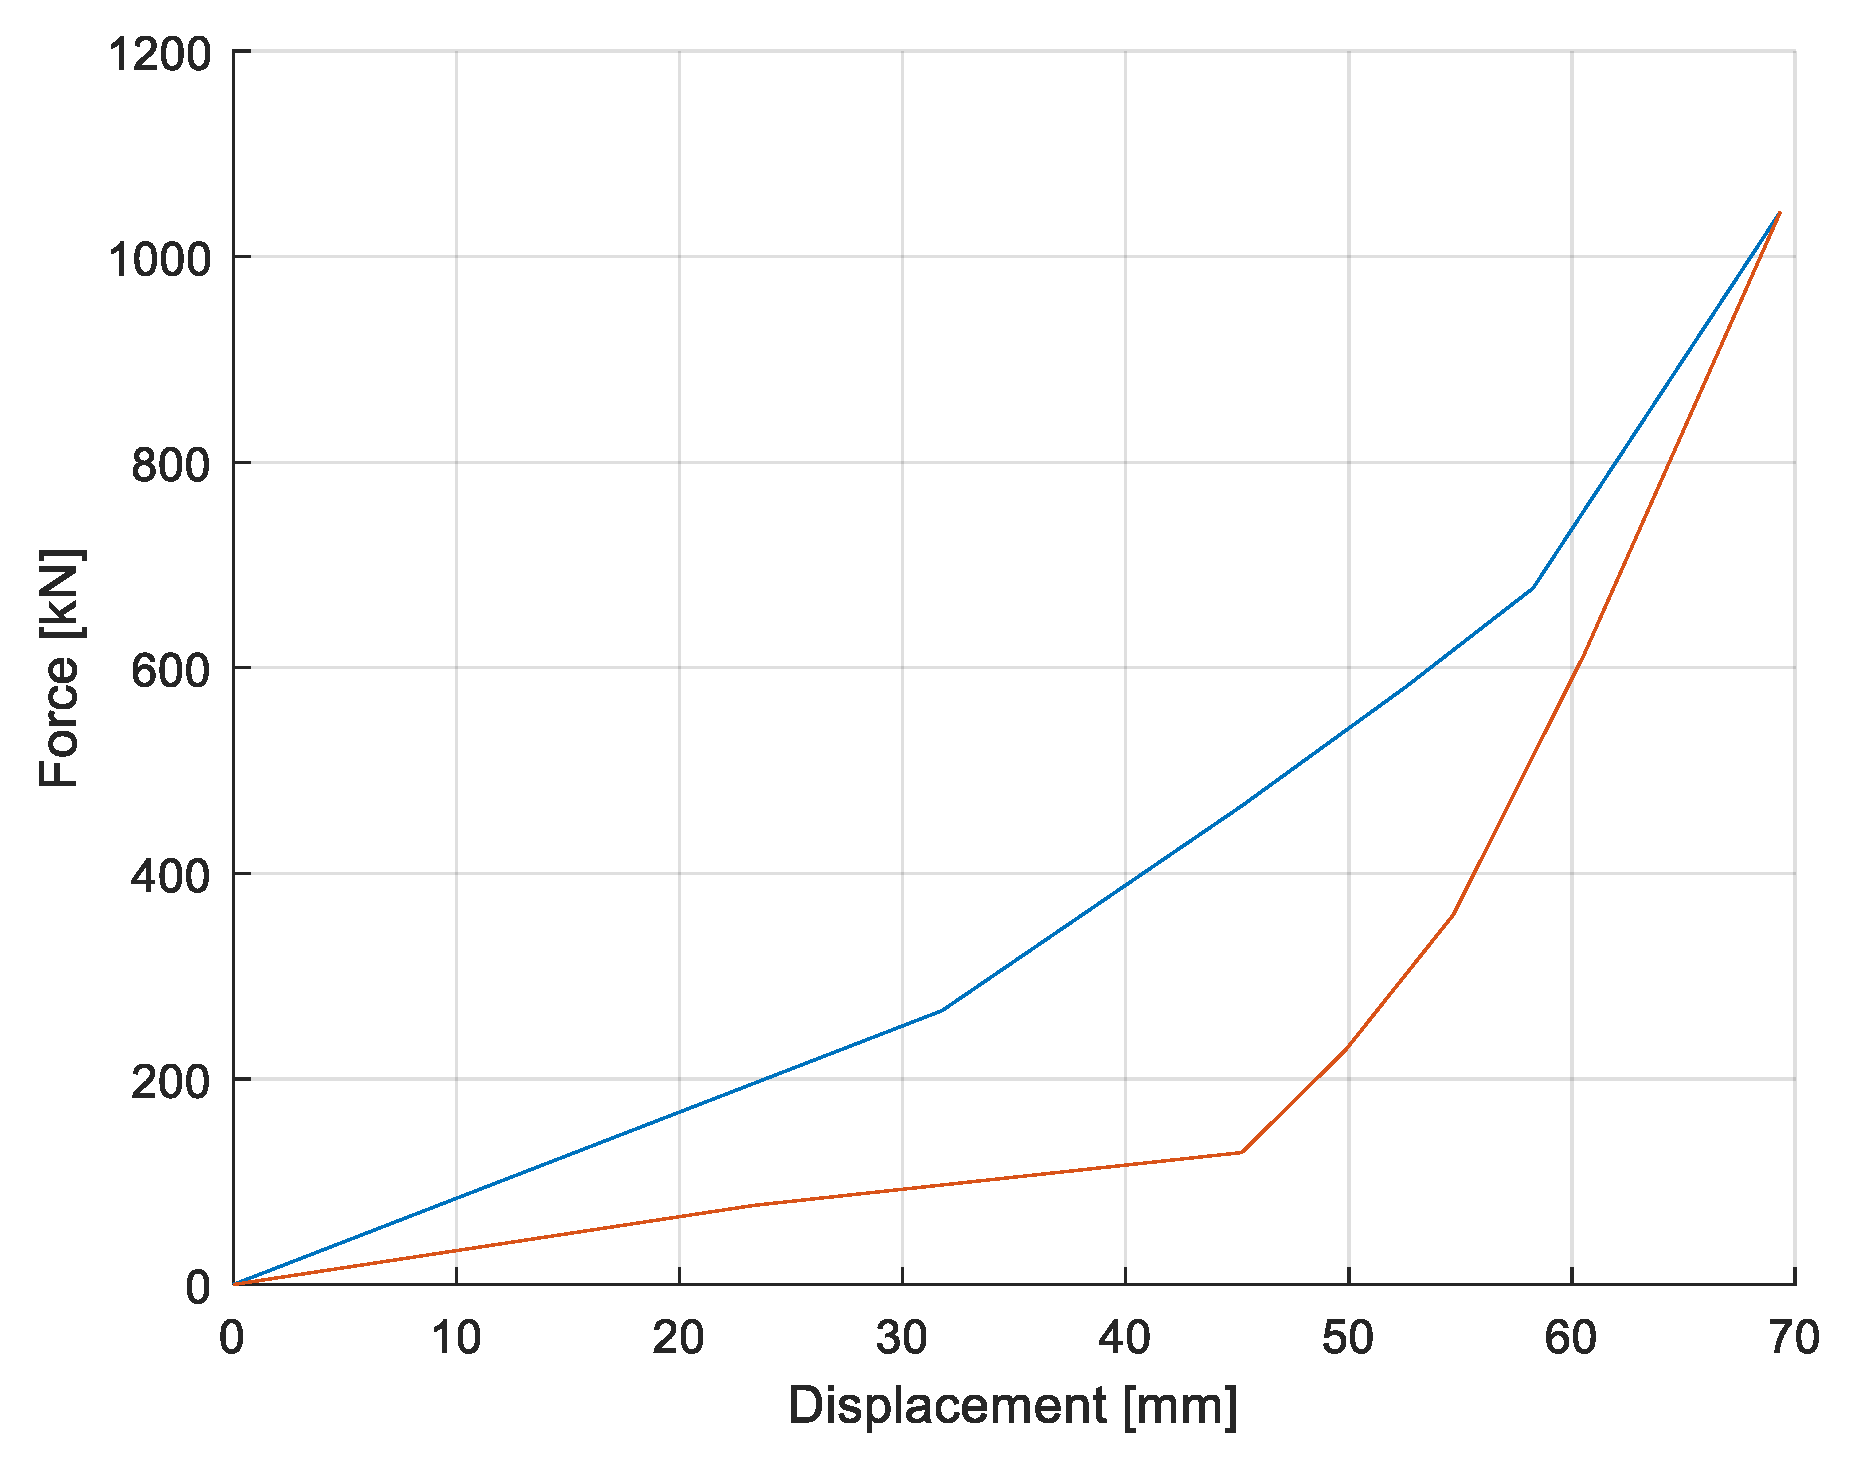
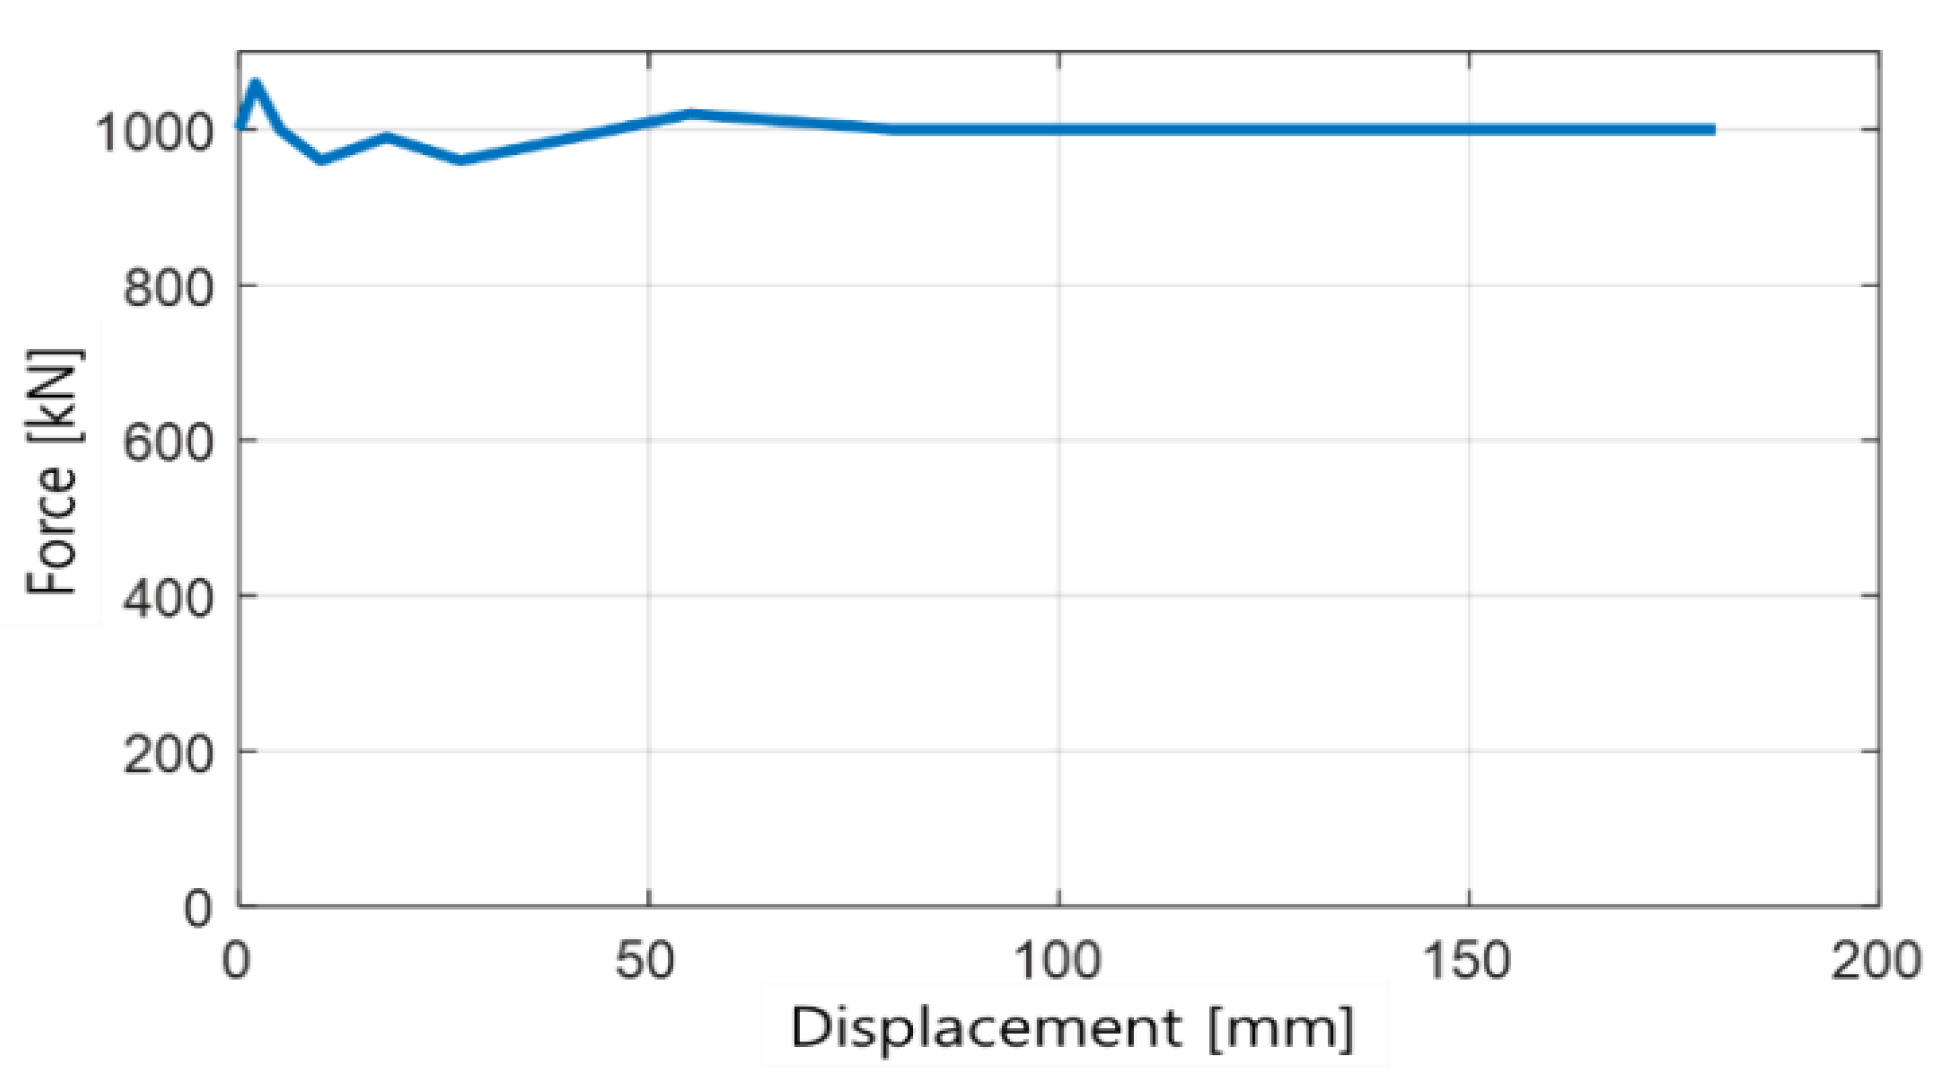
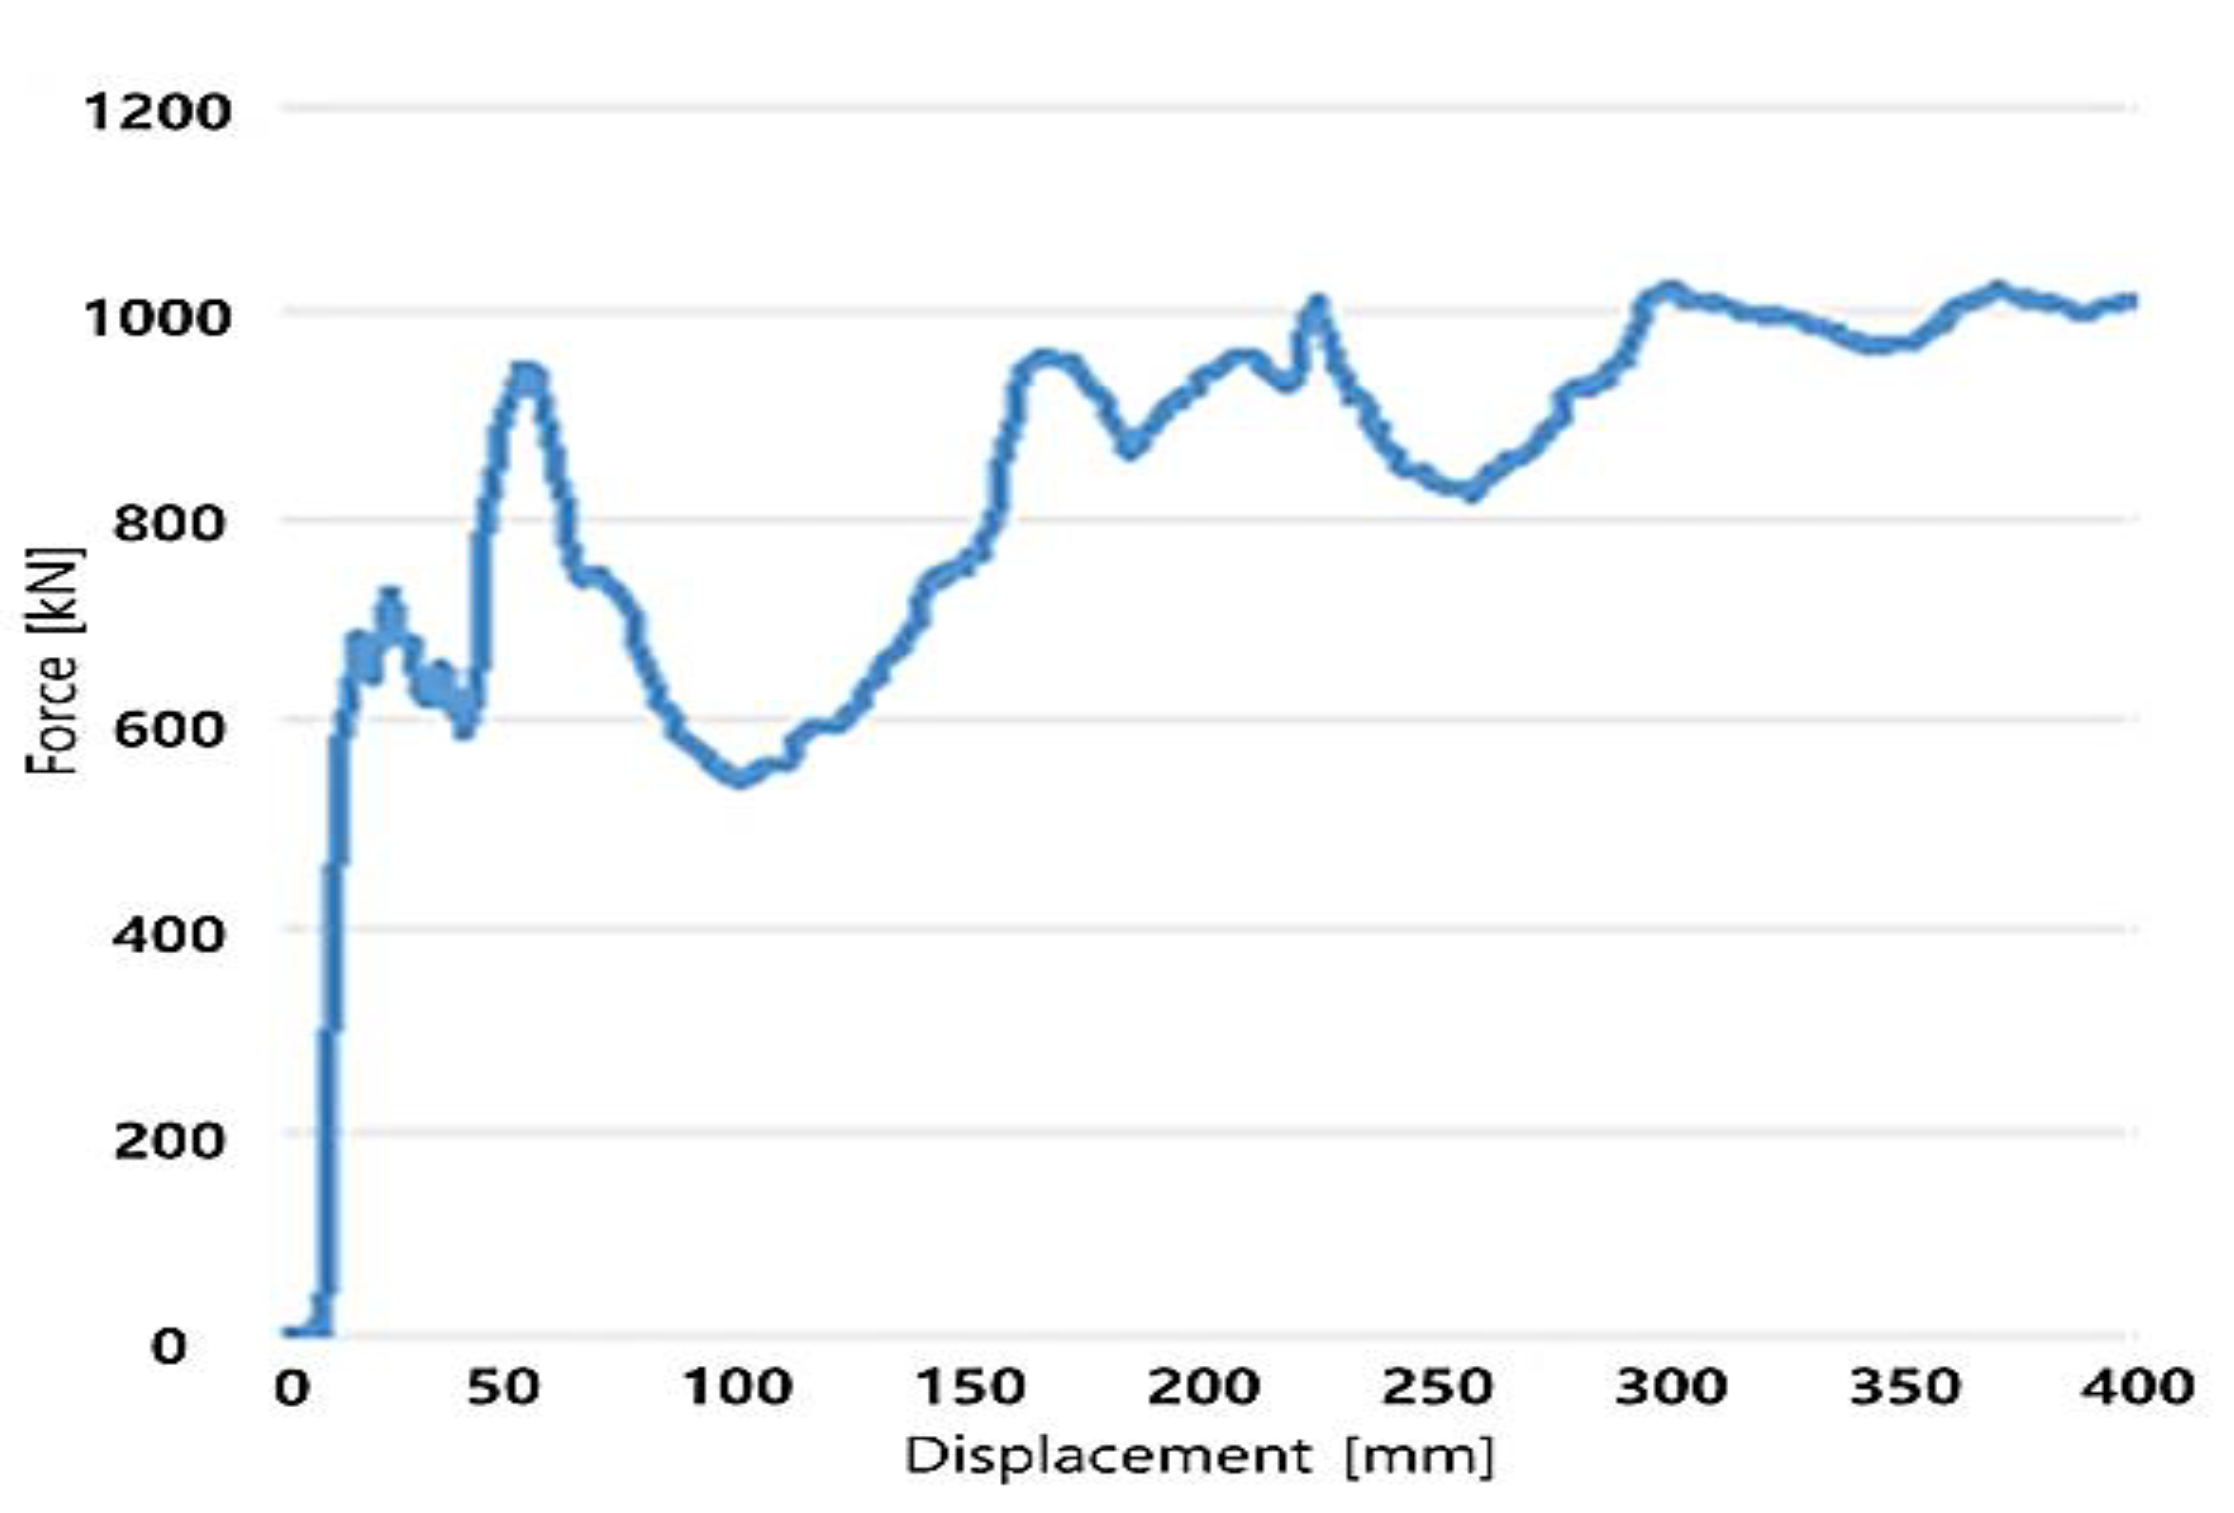
Figure 14 shows the collision test results for the intermediate coupler, which was a combination of a rubber buffer and deformation tube. Due to the characteristics of the deformation tube, only deformation of the rubber buffer occurred until the displacement and maximum load reached 52 mm and 867 kN, respectively; the deformation tube started to deform from then on. Therefore, in the test results, the curve after 52 mm deformation shows the characteristics of the deformation tube. The deformable tube showed an overshoot phenomenon at the beginning of deformation, had a constant load characteristic near 800 kN and deformed up to a maximum displacement of 180 mm.
3. Collision Simulation
If a collision simulation of trains properly simulates actual collision behavior, it is possible to predict the vehicle behavior, impact force and energy balance that occur when railway vehicles collide through the simulation. In addition, these results can be useful for verification of the design of coupling buffers.
3.1. Railway Vehicle and Coupling Buffer System Model
Mathematical models of railway vehicles and coupling buffers were required to simulate the train collisions. In the coupling buffer model, rubber buffers, hydraulic buffers and deformation tubes were included. The mathematical models of coupling buffers were developed based on the collision test results provided in Figure 12, Figure 13 and Figure 14.
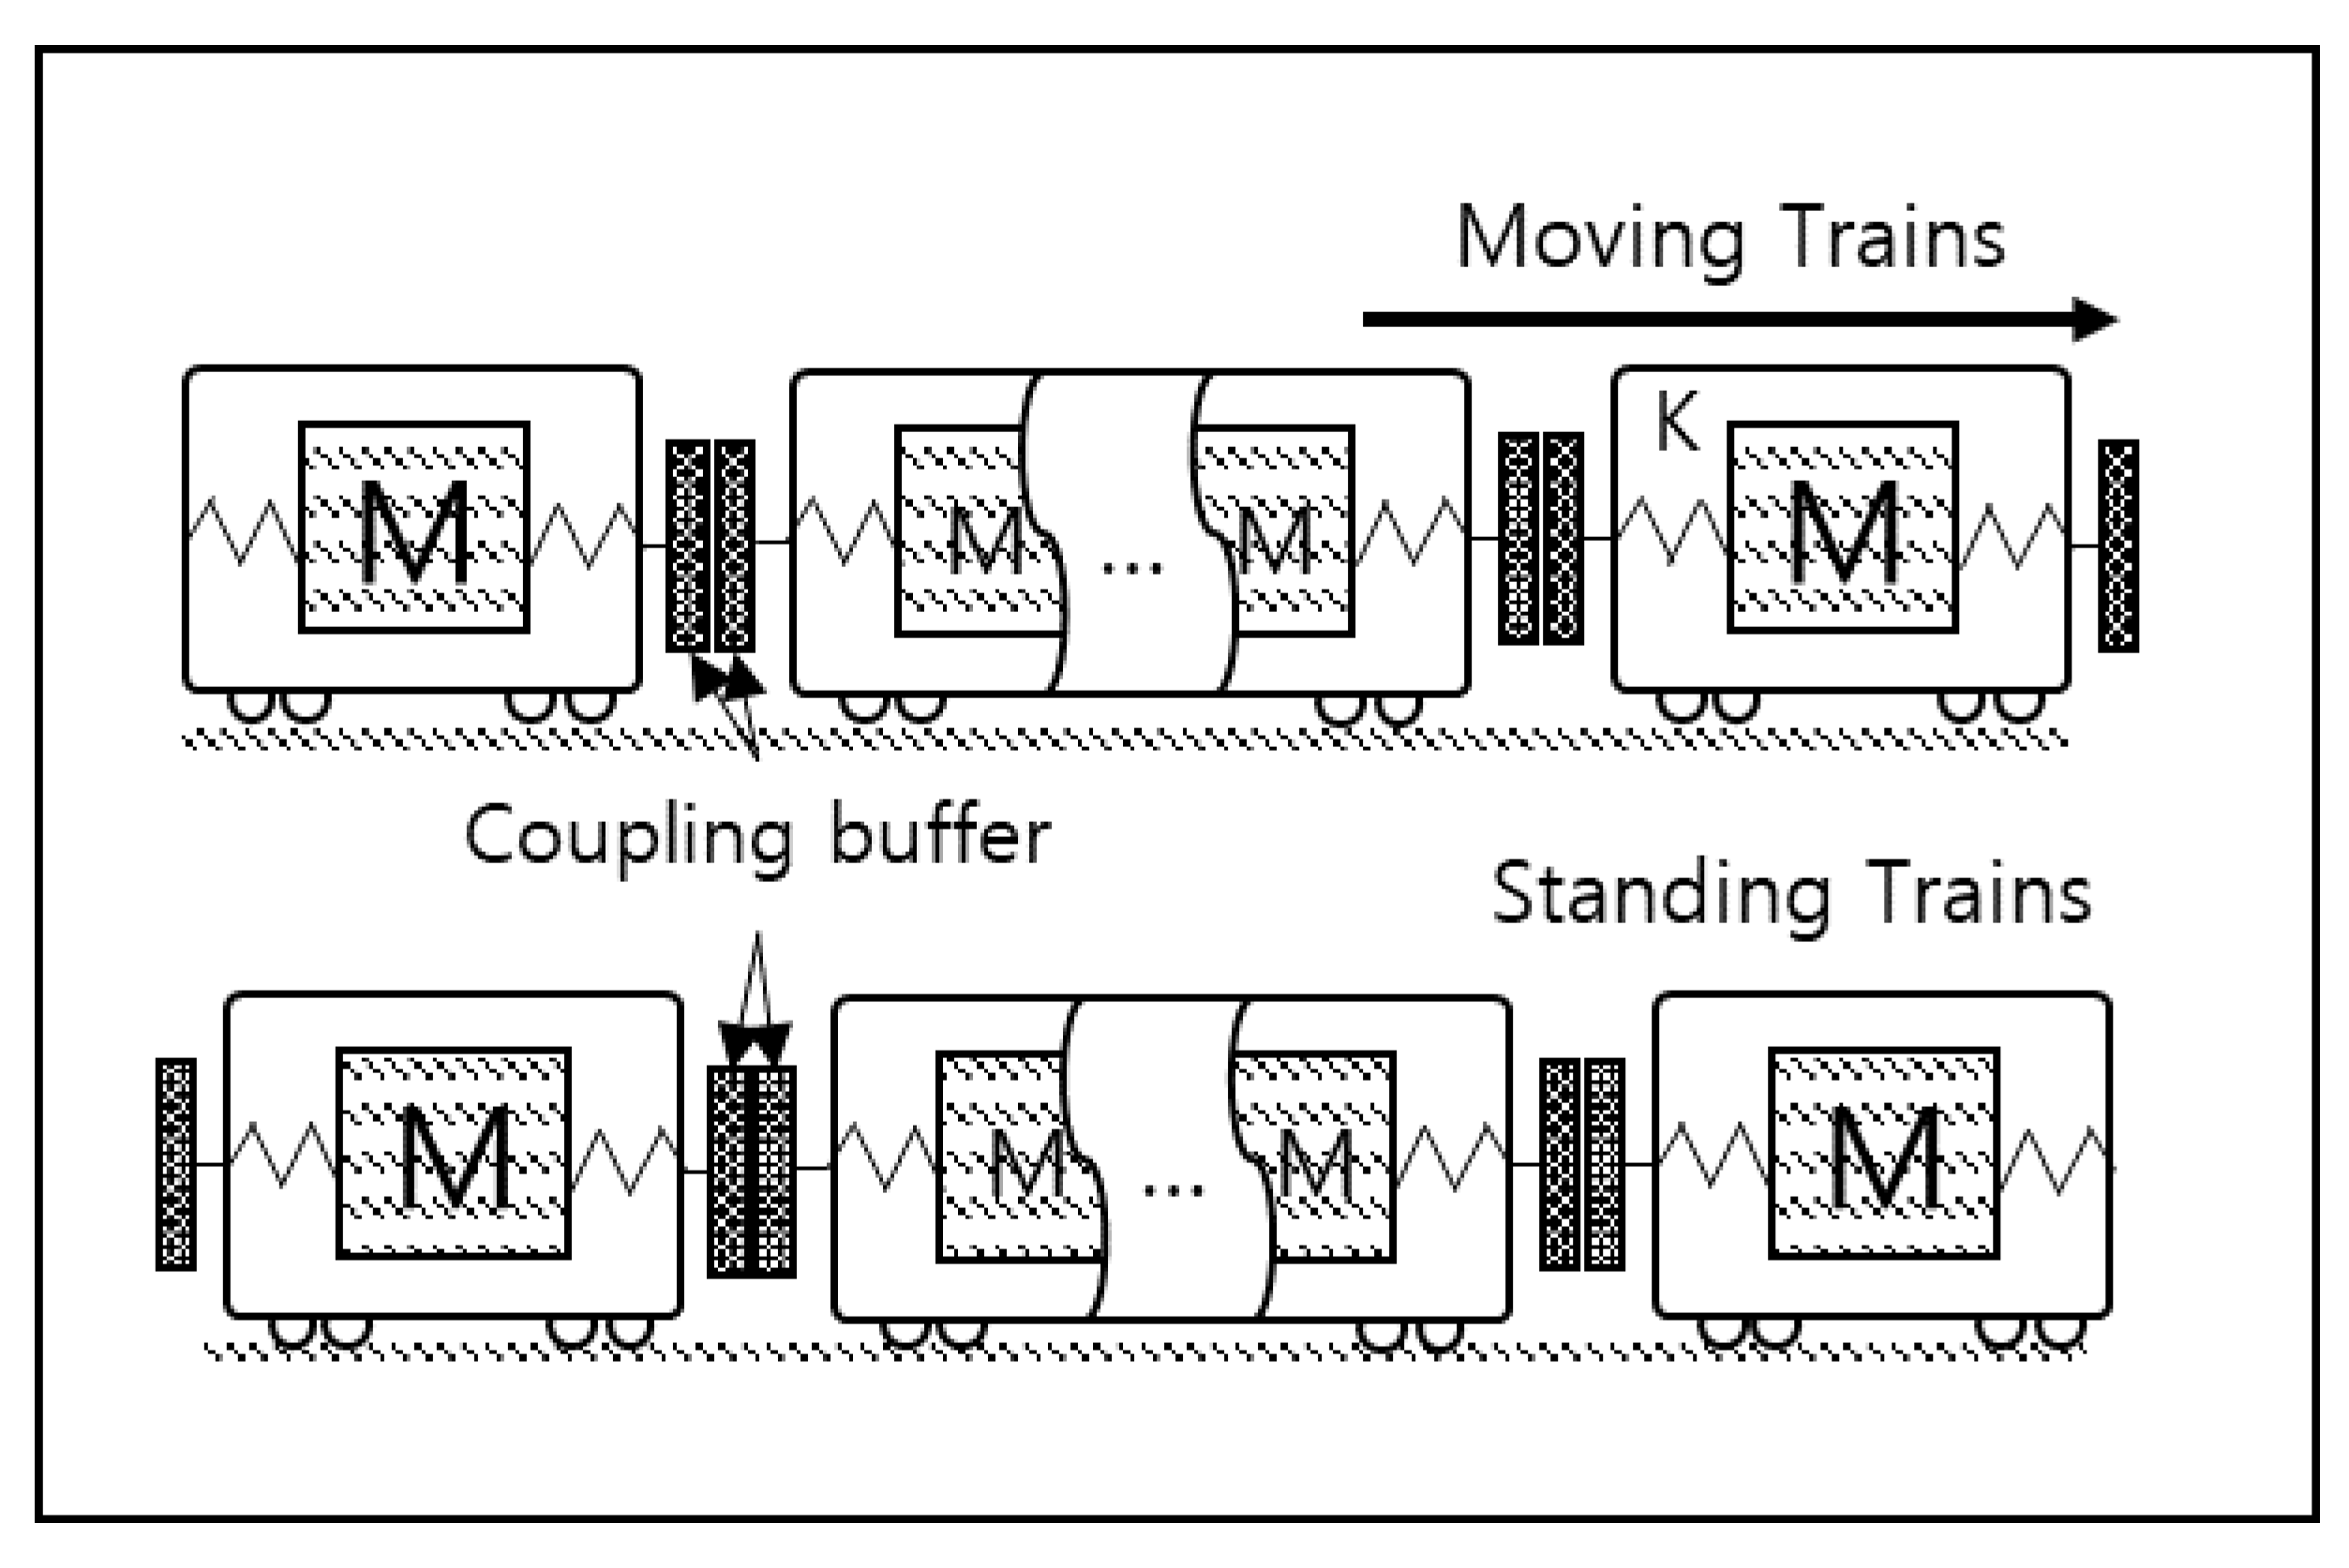
In terms of collision analysis, this study assumed a scenario where a train moving at a specific speed collided into a standing train. The railway vehicle model was composed of a model with mass and stiffness obtained from prior research [17]. Figure 15 shows a vehicle collision model, considering that deformation of the vehicle body will occur on the left and right sides of the vehicle during a collision. A friction model was applied in which the coefficient of friction changed according to the speed of the friction surface.
The basic equation of motion constituting the collision model was defined as follows
where is the railway vehicle or the buffer force transmitted to the connecting portion, and is the frictional force acting on the railway vehicle. In the case of , these were the force from the rubber buffer , the force from the hydraulic buffer , and the force from the deformation tube .
The response force acting on the rubber buffer is classified according to compression and tension; in general, the compressive force acts as a larger force than the tensile force, and there is a neutral state (hysteresis) that depends on the previous state in between. The displacement at which the compression and tension cycle ends and enters the neutral state is called . If the equivalent stiffness of the vehicle is , after that point, the response force in the neutral state until reaching the compressive force or tensile force again is defined as follows:
The response force acting on the hydraulic buffer sufficiently reflected the experimental results and was defined as a nonlinear function related to the compression displacement and velocity of the hydraulic buffer, and .
For the response force acting on the deformable tube, a rubber buffer model in which only compression proceeds was used.
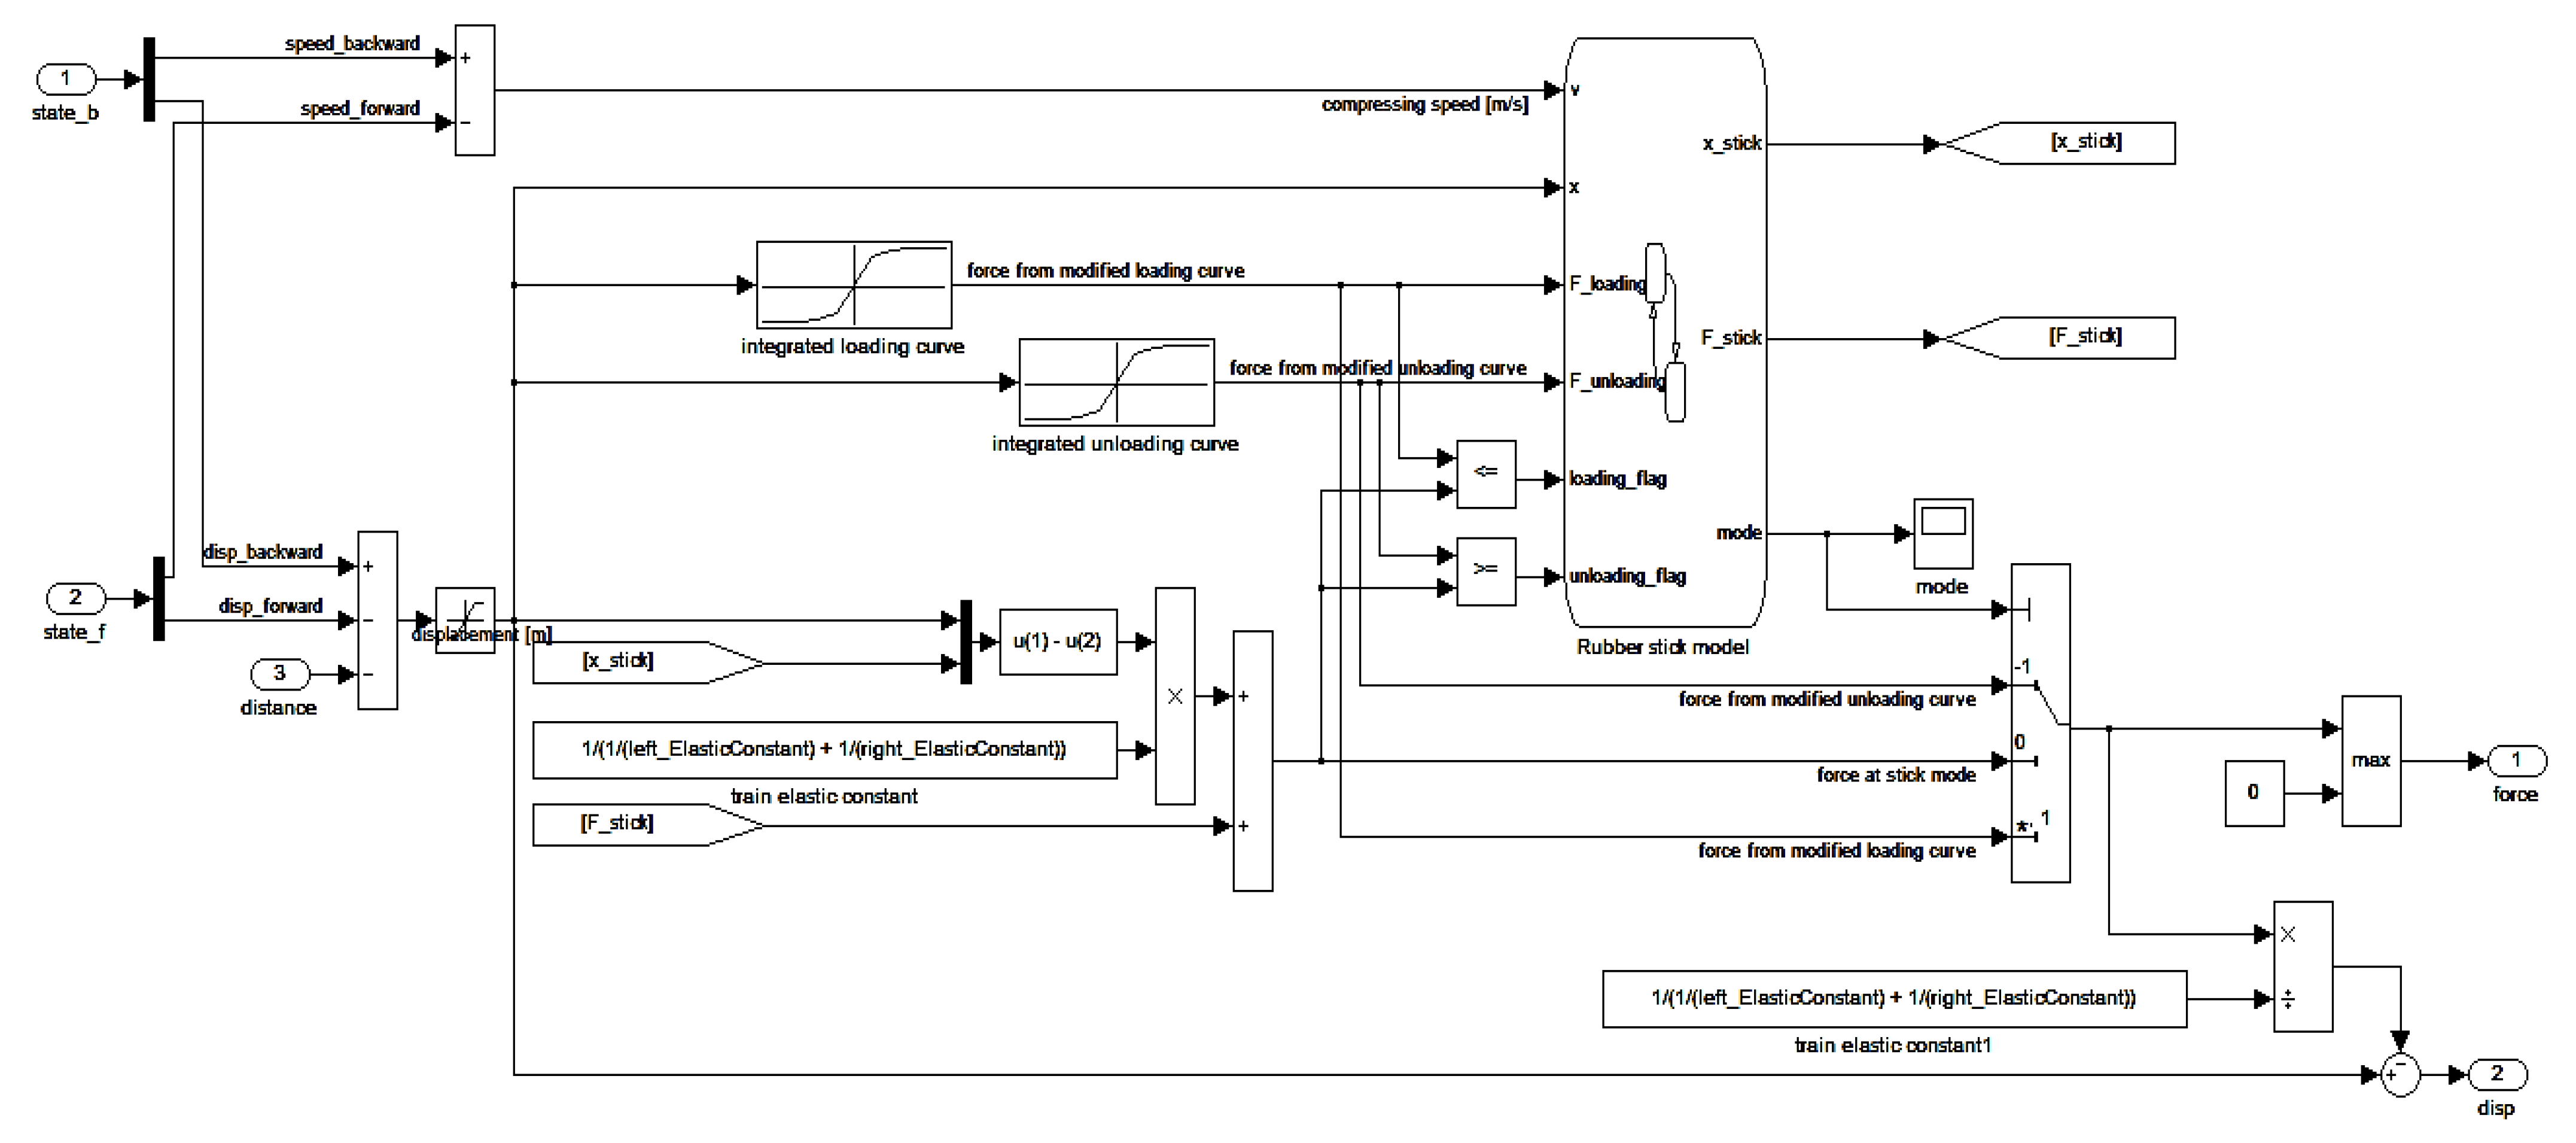
The equivalent force acting on the vehicle in the discontinuous section generated by the vehicle moving back and forth between compression and tension conditions must be continuously implemented. Physically, it is considered that the force caused by the vehicle’s stiffness occurs relatively quickly compared to that of the buffer. It is assumed that the change in force due to vehicle stiffness determines the amount of change in the response force of the rubber buffer when the buffer transitions from compression to tension and vice versa. Modeling was performed using Matlab/Simulink to use the performance curve extracted from the test, and Figure 16 is the modeling result of the rubber buffer.
The characteristic curves were extracted based on the collision test results for each buffer and were applied to the simulation in the form of a lookup table for simulation analysis.
Figure 17 shows the characteristic curve of the rubber buffer model by considering performance based on the rubber buffer test results. Up to the maximum permissible limit, the properties of a rubber buffer depend on compression and tension displacement regardless of collision speed. When the rubber buffer changes into tension state after being compressed, the force decreases rapidly from a rising line of compression to a decreasing line of tension while maintaining a constant state of deformation [18].
Figure 18 shows the characteristic curve of the hydraulic buffer model obtained from the test results by changing the collision velocity. The buffering characteristics of hydraulic buffer change according to the speed and displacement, so the performance curve is composed of a 3D diagram of displacement, velocity and force. Since the characteristic curve obtained through the tests shows properties over a limited range, the map has been expanded to derive a wider range of loads through interpolation to apply to the whole collision analysis.
Figure 19 shows the characteristic curve of the deformation tube model. In the characteristic curve, deformation does not appear until a specific force corresponding to the yield point, and deformation occurs when more force is applied, indicating a certain amount of buffering force.
3.2. Collision Simulation Program
A program that simulated the collision situation of trains was developed using a model of the railway vehicle and the coupling buffer system.
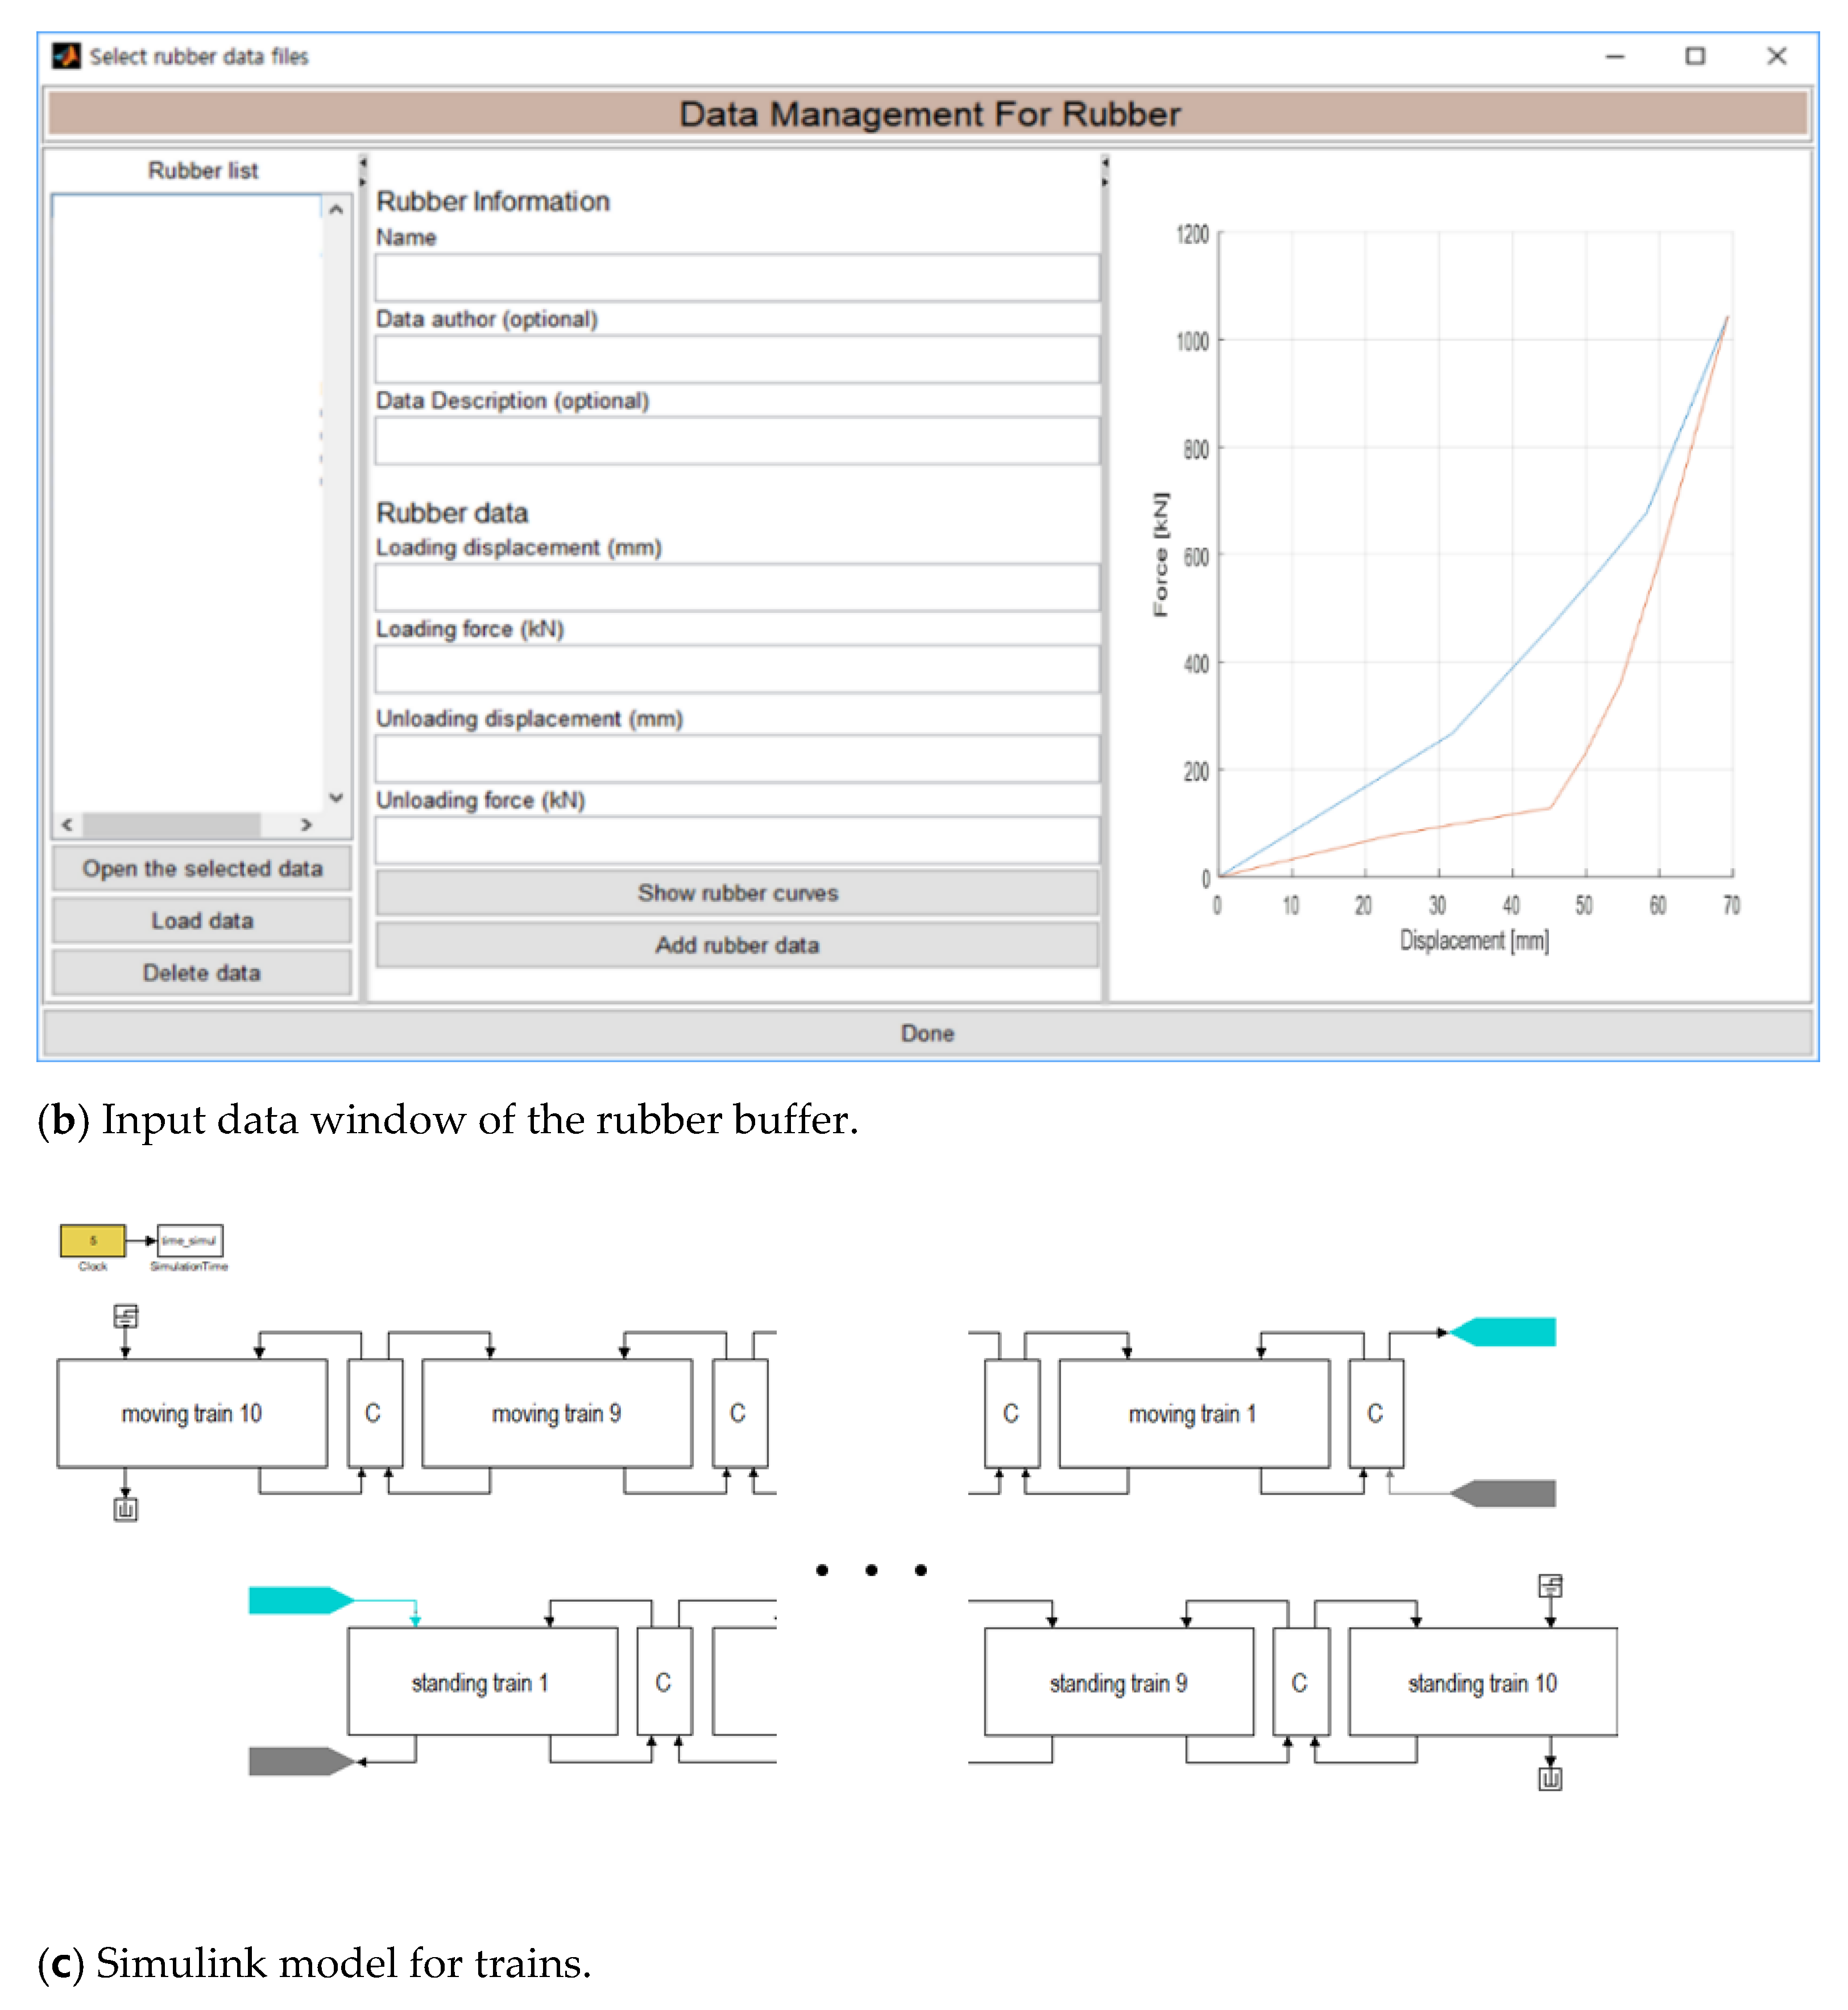
The developed program consisted of a process to input necessary parameters and data using Matlab/GUI, a process that solved a dynamic model and performed simulation using Matlab/Simulink, and post-processing that displayed the analysis results using Matlab/GUI.
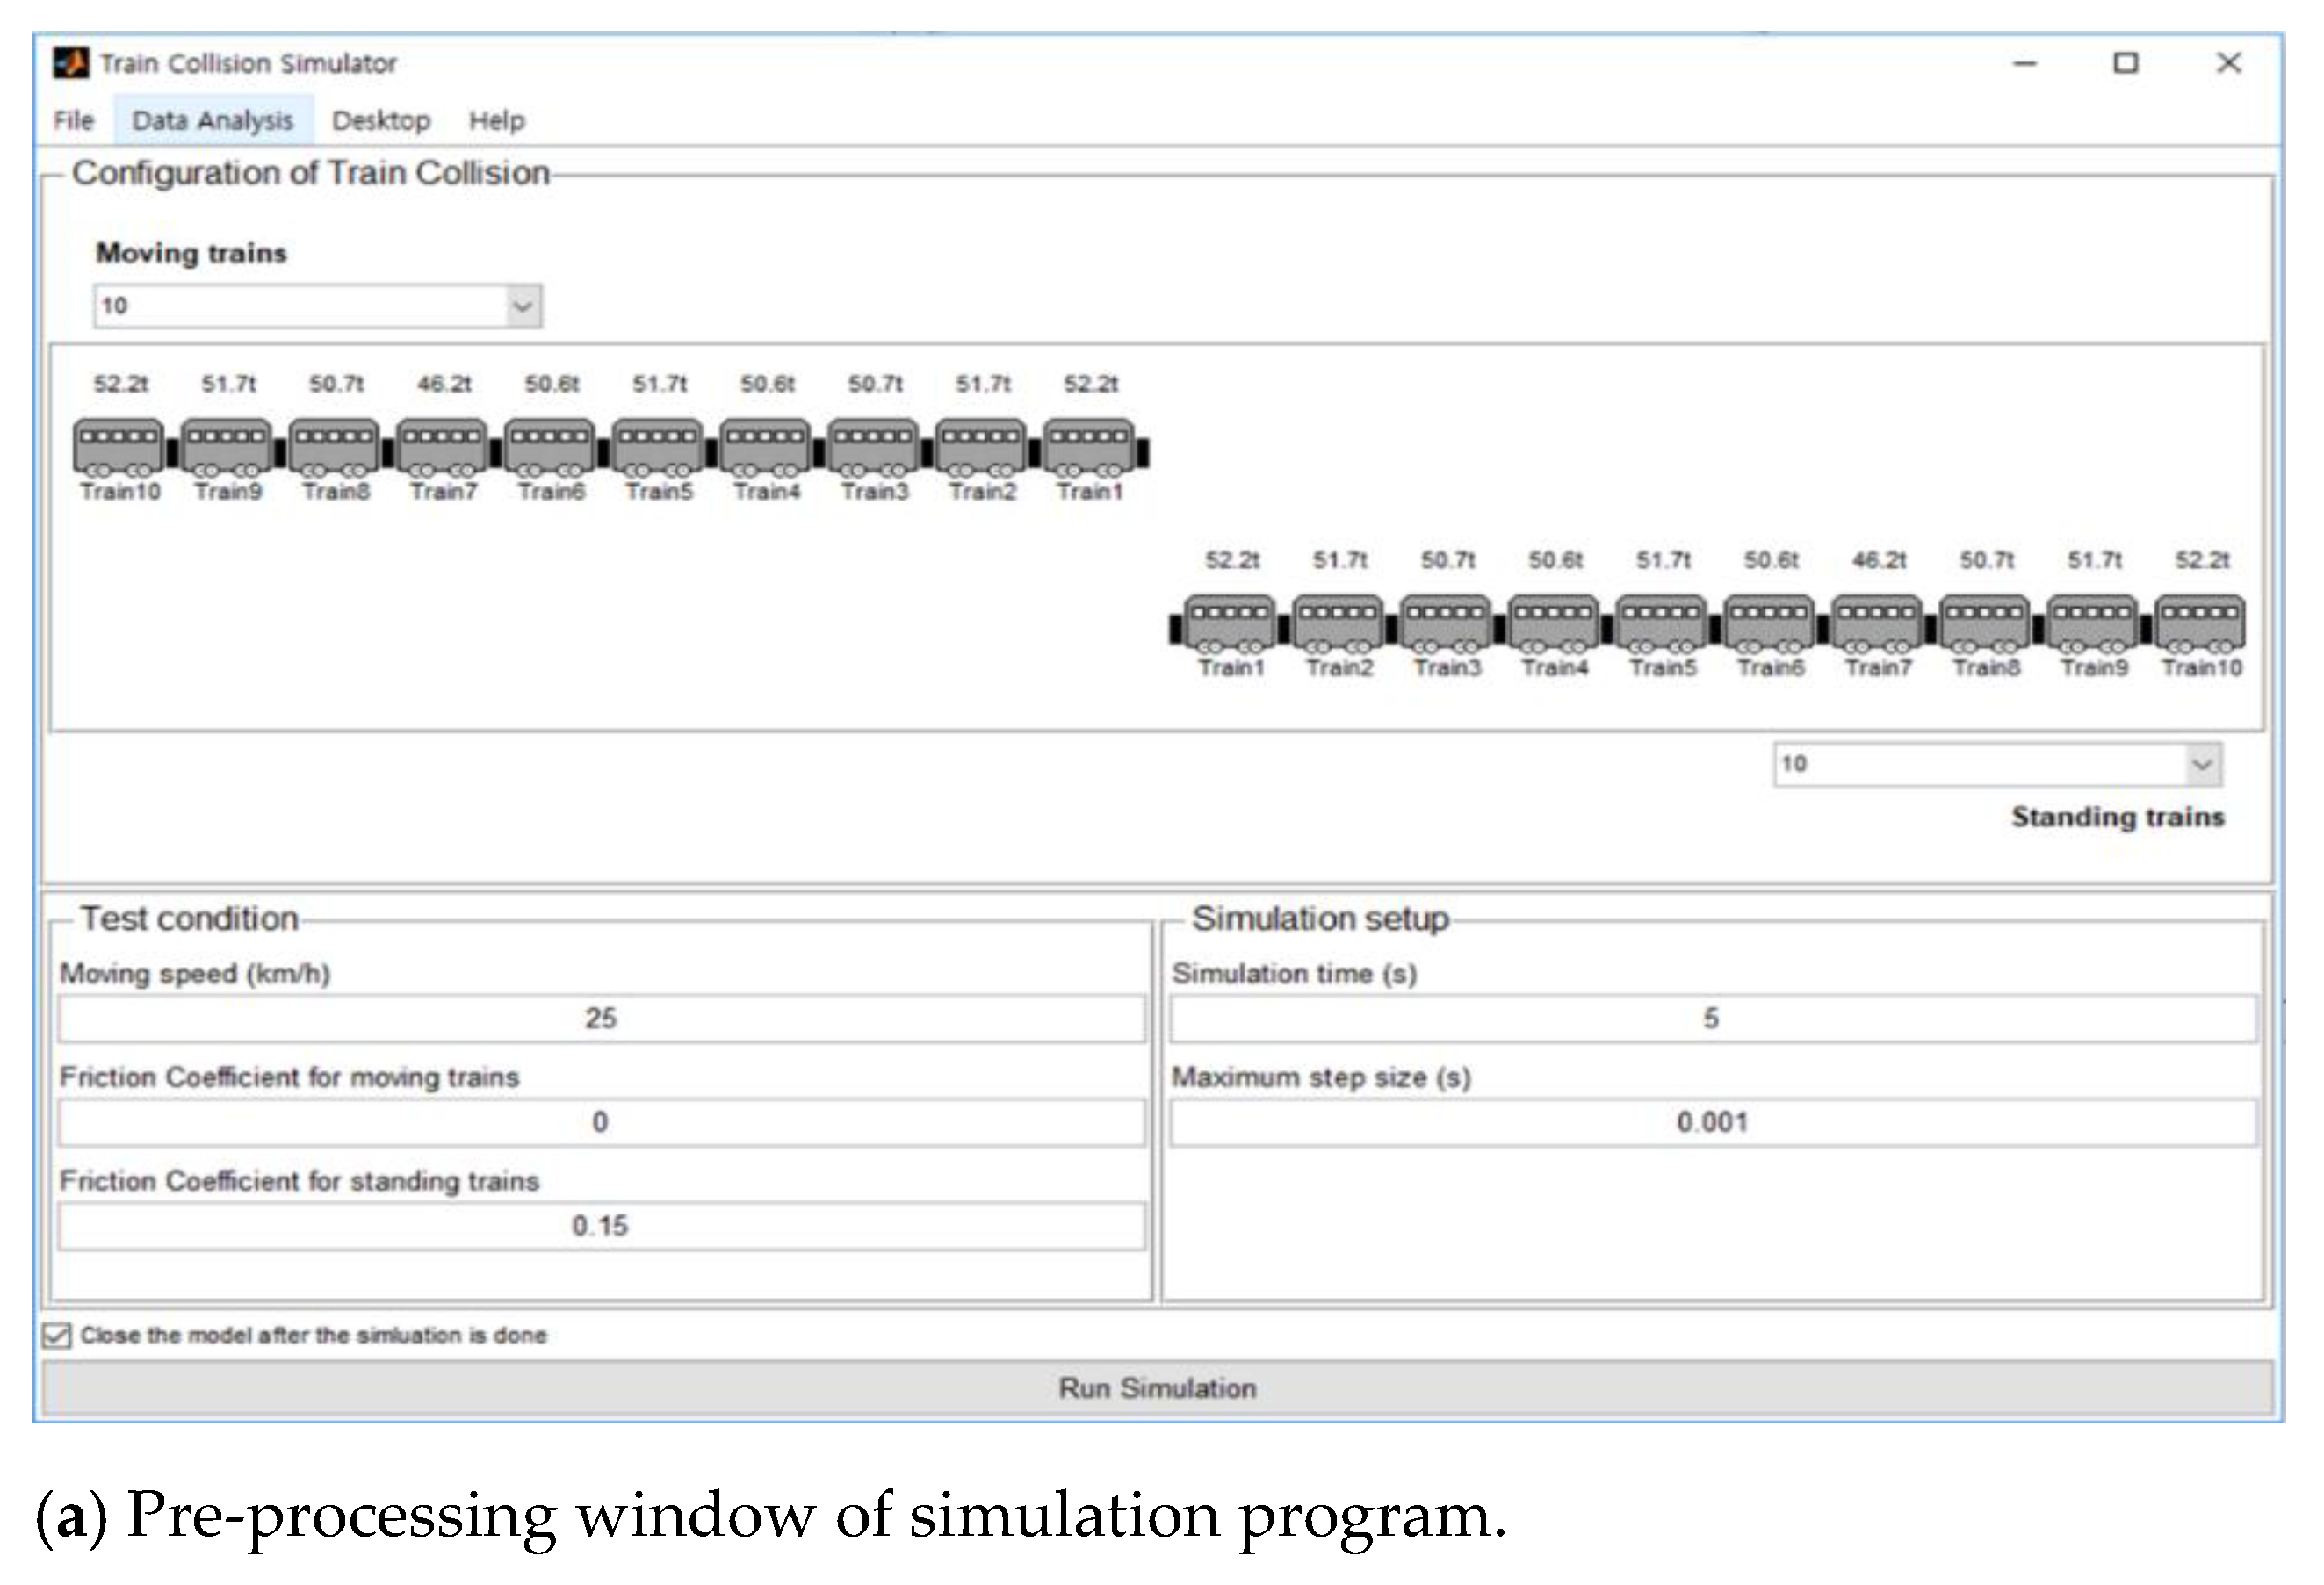
Figure 20a is a pre-processing window where parameters and data can be put into the simulator. Through this window, data such as from the rubber buffer, hydraulic buffer and deformation tube were input, and Figure 20b is the input data window of the rubber buffer. After inputting all parameters and running the program, a Simulink model as shown in Figure 20c was automatically generated to solve the dynamics model. The mass matrix was constructed according to the number of railway vehicles given in the input window, and the analysis was performed by solving the nonlinear equations of state that considered the dynamic behavior due to the coupling buffer and the stiffness of each vehicle. From the viewpoint of numerical analysis, the stiff system that applied the stiffness of the buffer and the vehicle at the same time could be analyzed under given conditions, so the commonly used fourth order Runge–Kutta method was selected as the solver. Because the dynamic behavior results of all elements generated during the simulation were stored, the results for train speed, coupler force–stroke, energy balance and calculated items could be output through a post-processing window.
This simulation program was developed to be able to run regardless of the number of trains and data could be analyzed in various collision environments.
Using the developed program, we performed a 25 km/h collision simulation of a 10-car train and analyzed the energy absorption performance of the coupler of railway vehicles and forces acting on each component during a heavy collision.
3.3. Simulation Condition
Collision simulation was performed in a collision scenario in which a 10-car train running at 25 km/h approaches a standing 10-car train. For the approaching train, we did not consider friction because the brake was released, and in the case of the train stopped by the brake, the friction coefficient between the wheels and the rail was 0.15.
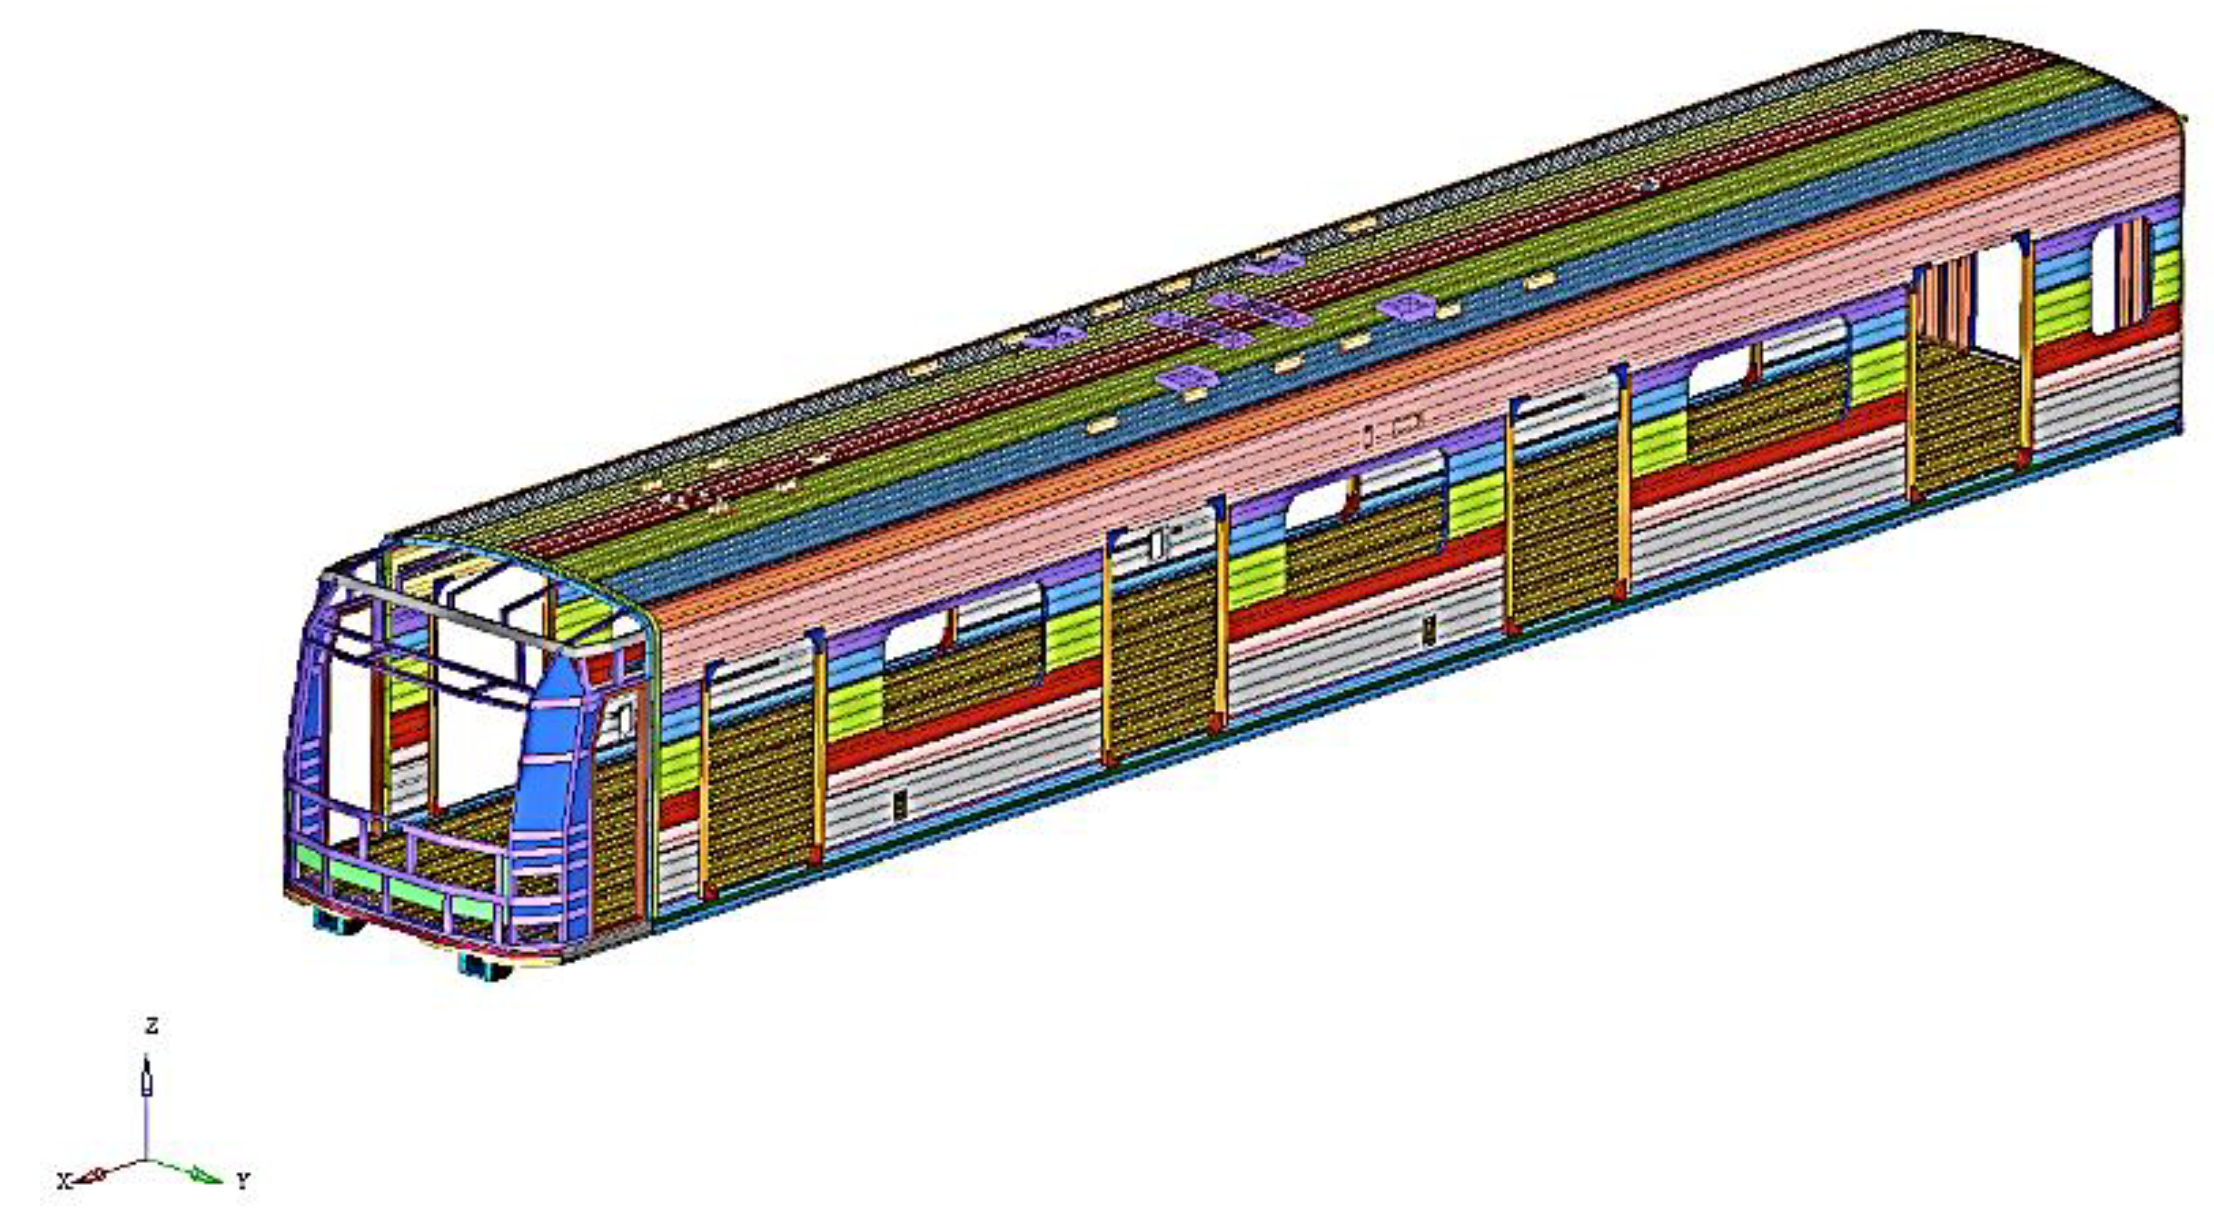
For the coupling buffer model, the characteristic curve of the rubber buffer shown in Figure 3, the hydraulic buffer shown in Figure 4 and the deformable tube shown in Figure 5 were used. The body collapse characteristic curve of the railway vehicle was used as a stiffness model of the railway vehicle body shown in Figure 21 [15]. The body collapse characteristic curve of a railway vehicle is a curve representing the deformation of the vehicle body when a load is applied from the front and rear of the vehicle modeled with 3D finite elements, as shown in Figure 22; the collapse of the vehicle body as shown in the figure occurs when a very large load is applied. However, when a collision occurs at a speed of 25 km/h the deformation is small except for in the frontal cab, so it has a linear characteristic [19,20].
3.4. Verification for Developed Program
It was a very difficult procedure to use the actual collision test results of trains for program verification due to various limitations. Therefore, the developed program was verified through comparison with the collision simulation results of S company, which were used in actual railway vehicle manufacturing. To do this, we performed a collision simulation with a 10-car train approaching a standing 10-car train at a collision speed of 15 km/h under the same input data.
Table 2 compares the energy balance and absorbed energy change of the whole system during collision, and Figure 8 compares the forces applied to the coupling buffer system of each vehicle in the results of Table 2. Differences in energy dissipation occurred in the S company simulation without considering the body deformation and the development program considering the body deformation. That is, the difference in the energy dissipation performance of the coupling buffer system occurred depending on whether the stiffness of the vehicle body was considered. However, the collision speed of 15 km/h showed a small difference compared to the total energy due to the small vehicle body deformation, and the two simulation results were found to be quite consistent. This shows that the energy dissipation phenomenon, which is most important in the collision program, was well matched, so the analysis process for the collision phenomenon between the two programs was well implemented.
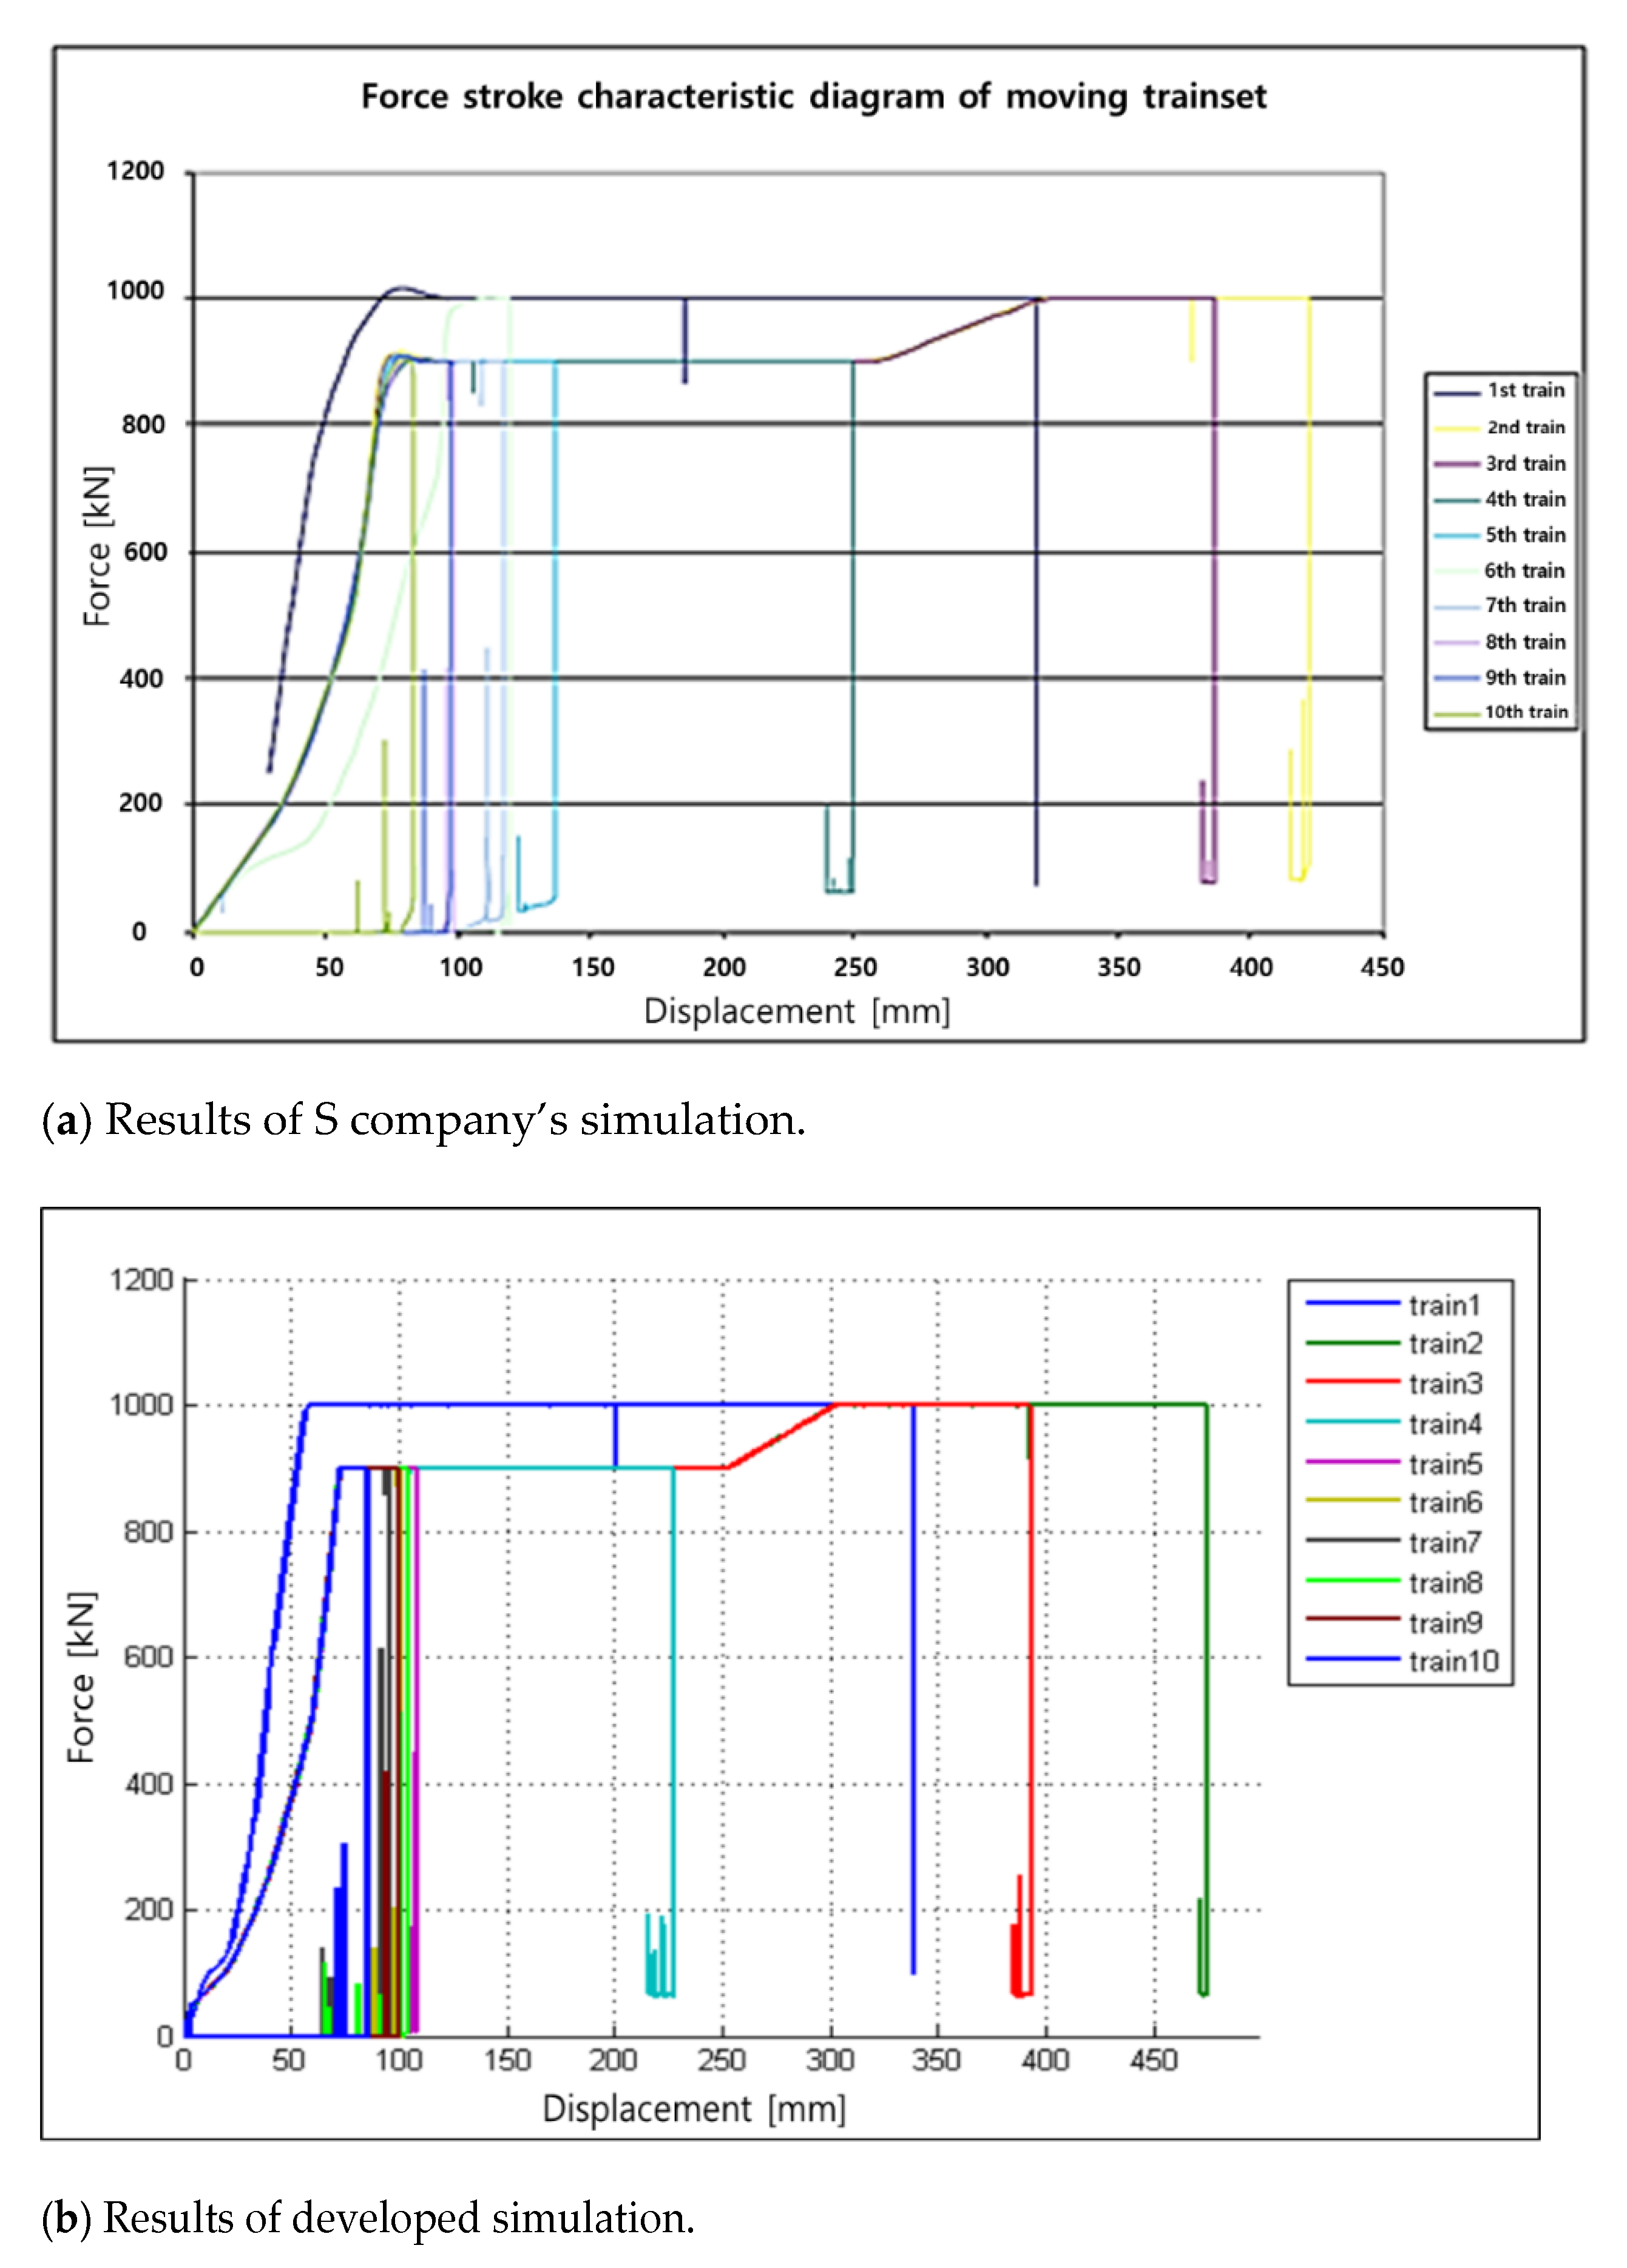
Looking at the results of force analysis of each coupling buffer system as shown in Figure 20, the maximum applied force in both analysis results was 1000 kN. In the analysis of S company, the maximum displacement due to the collision was 426 mm, and in the analysis of the developed program, the maximum displacement was 468 mm, as it caused that amount of deformation of the vehicle body.
Figure 23 is the analysis results. It show that the force acting on the coupling buffer system followed the characteristics of each buffer. In the S company simulation results, some behavior does not follow the characteristic curve, which is predicted so that the dynamic behavior is included in the system model.
3.5. Simulation Results and Discussion
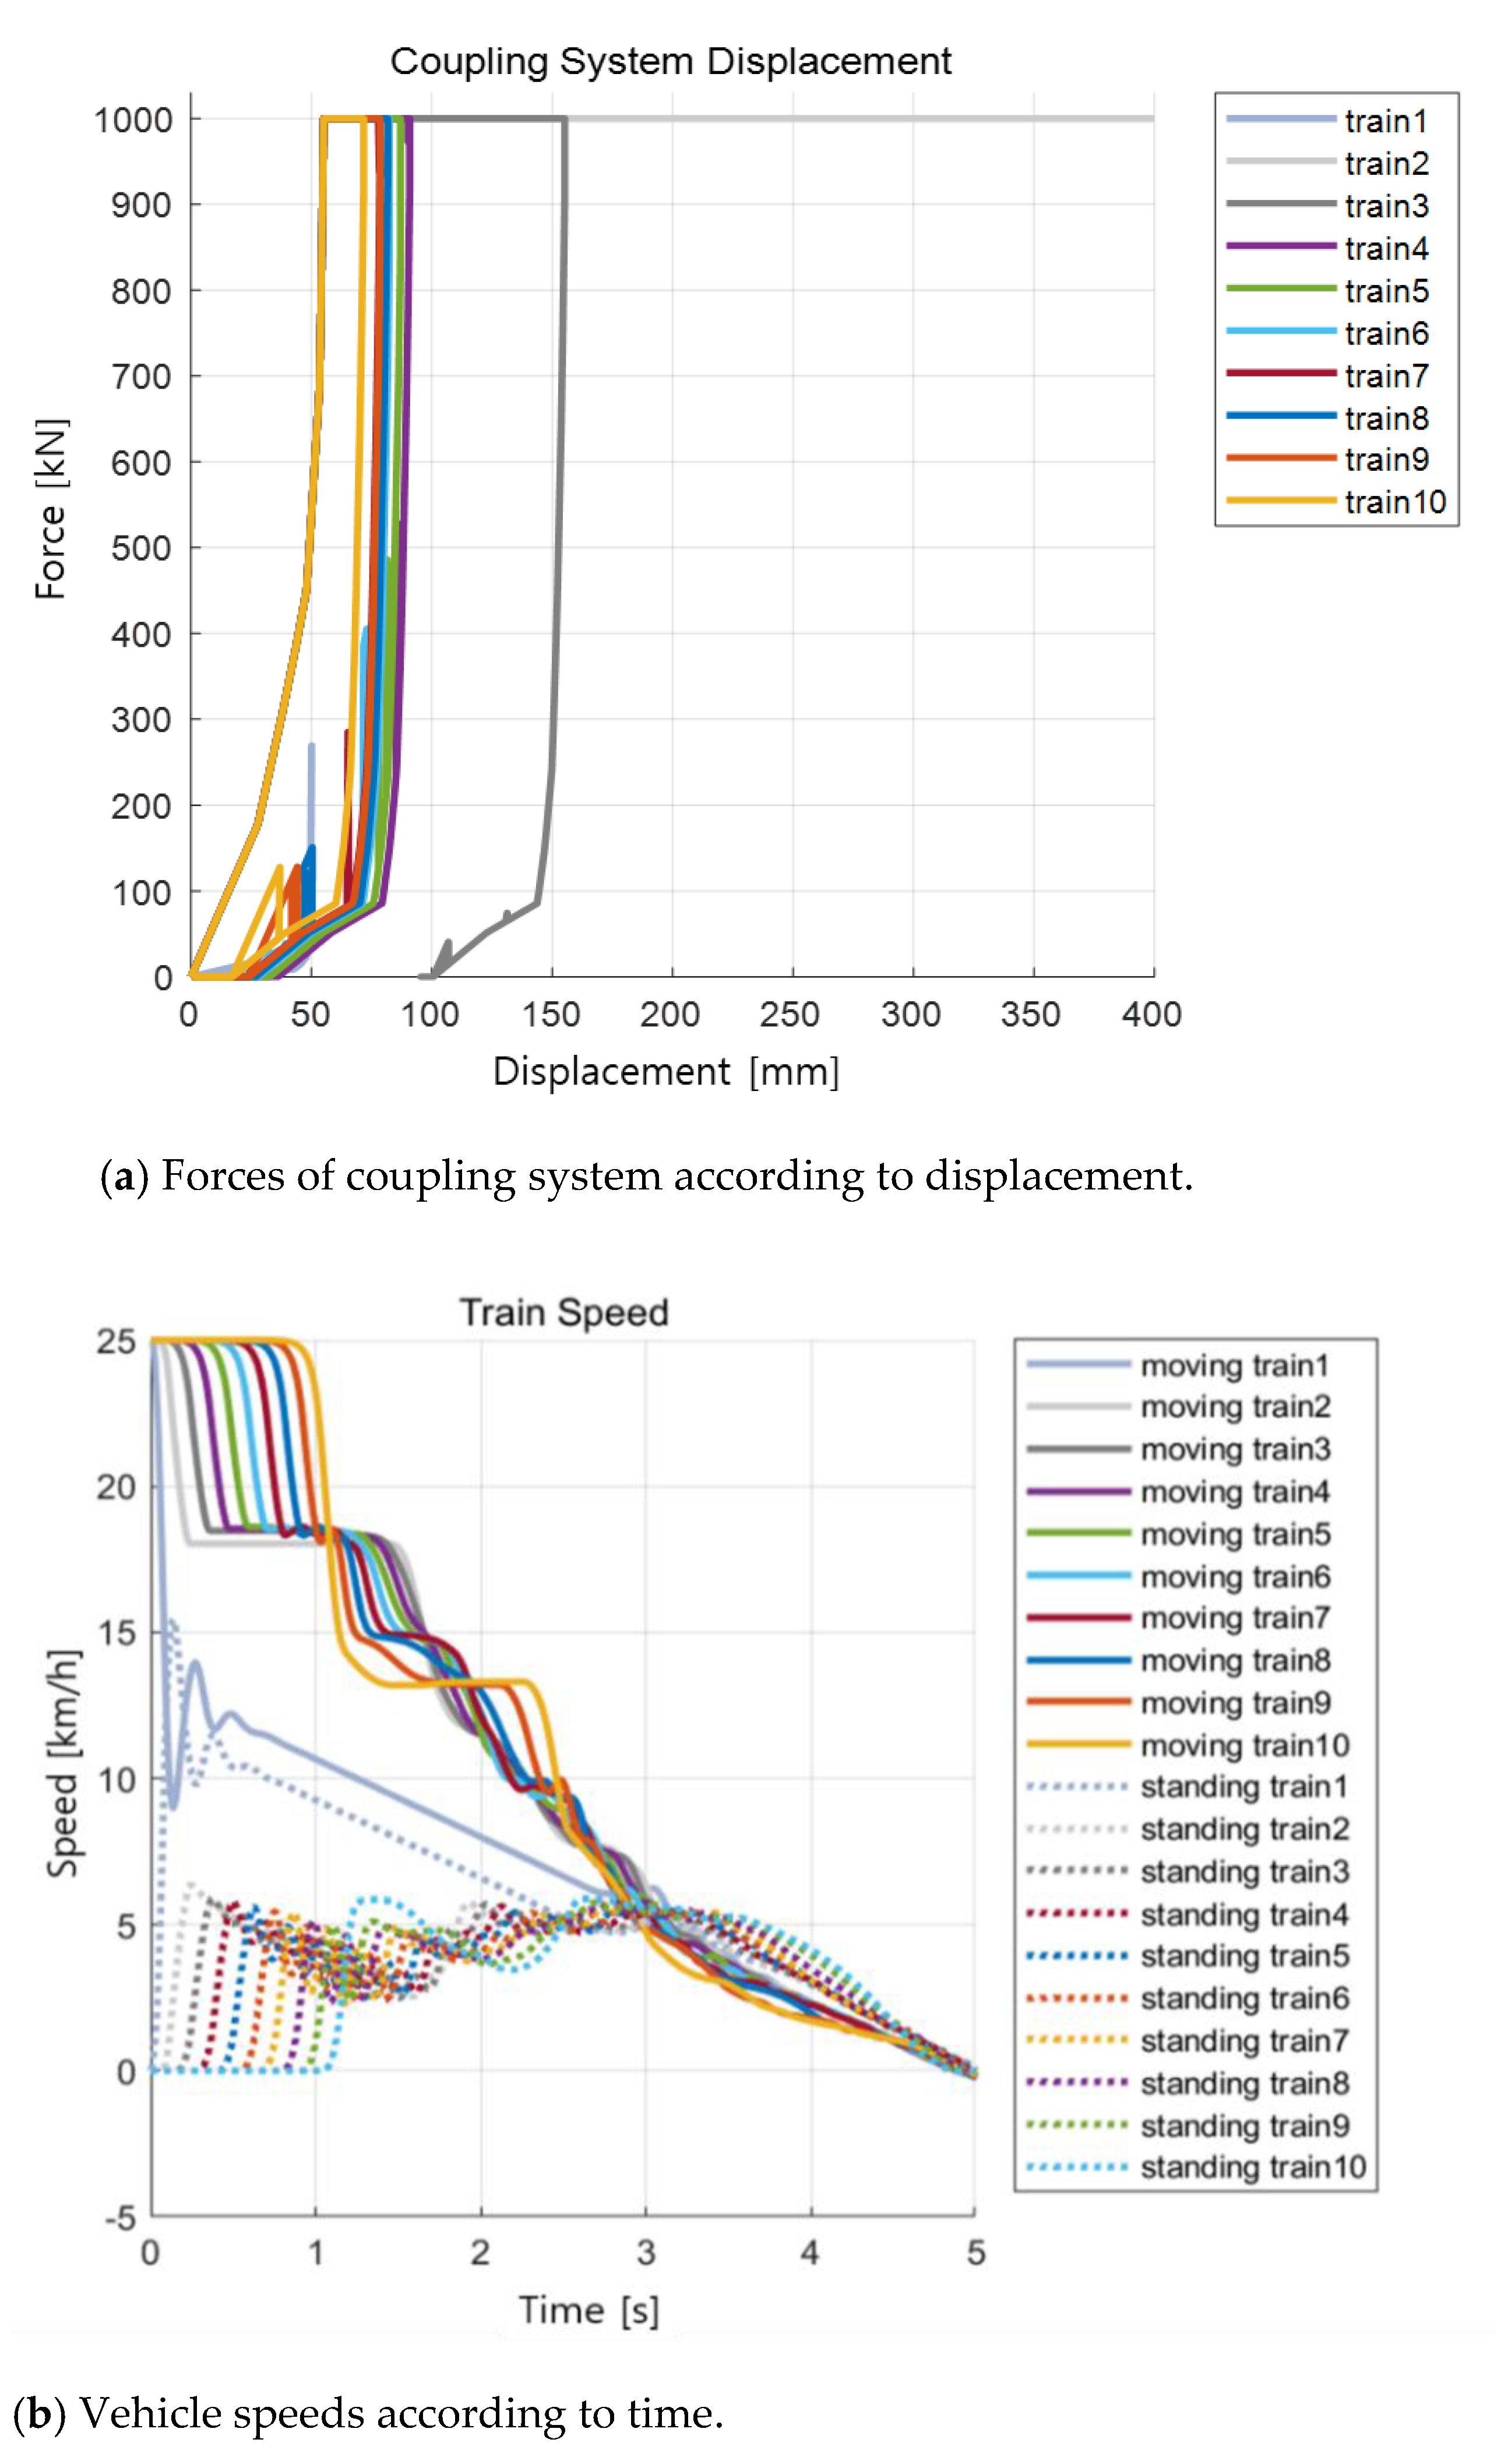
Using the developed simulator, we simulated a situation in which 10 trains collide with 10 stationary trains at a speed of 25 km/h, and Figure 24 shows the results of the collision simulation.
Looking at the results of the force acting on the coupling buffer system in Figure 24a, in the front coupler system, the rubber buffer was directly connected to the hydraulic shock absorber through rigid contact beyond the deformation limit of the rubber shock absorber. The hydraulic buffer had little displacement due to the rapid increase of the impact speed and the increase of the reaction force. In general, hydraulic buffers have the characteristic of maximizing the buffering effect in shunting speeds at around 10 km/h.
The intermediate coupler consisted of a rubber shock absorber and a deformable tube and absorbed sufficient impact energy through the capacity design of the expansion tube. In the case of a heavy collision, the impact force increased due to an increase in the collision speed concentrated on the vehicle where the collision was applied. Considering the impact force applied to the train in the event of a collision, it may be appropriate to apply a deformation tube having different characteristics depending on the vehicle location. In addition, a deformation tube with a deformation length of 400 mm was used, but the design limit was exceeded in the case of a secondary vehicle. Looking at the final energies in Table 3, they were not far beyond the design limit, but it is necessary to redesign the deformation tube through review of the analysis results.
Looking at Figure 24b, immediately after a collision, all vehicles vibrated under the influence of adjacent vehicles, and eventually all vehicles stopped.
The moving train vibrated with the collision reaction force and gradually decelerated, and the collision between each vehicle was propagated. In the standing train, the speed of the leading vehicle in which the collision occurred directly increased sharply, then vibrated, and the speed decreased and stopped. The propagation time of the collision phenomenon of the two trains was different, and the reason is that in the case of the standing train in the braking state, it is judged that the impact force was transmitted by overcoming the frictional force between the wheel and the rail and being pushed by the buffer displacement, so that it propagated later than the collision vehicle.
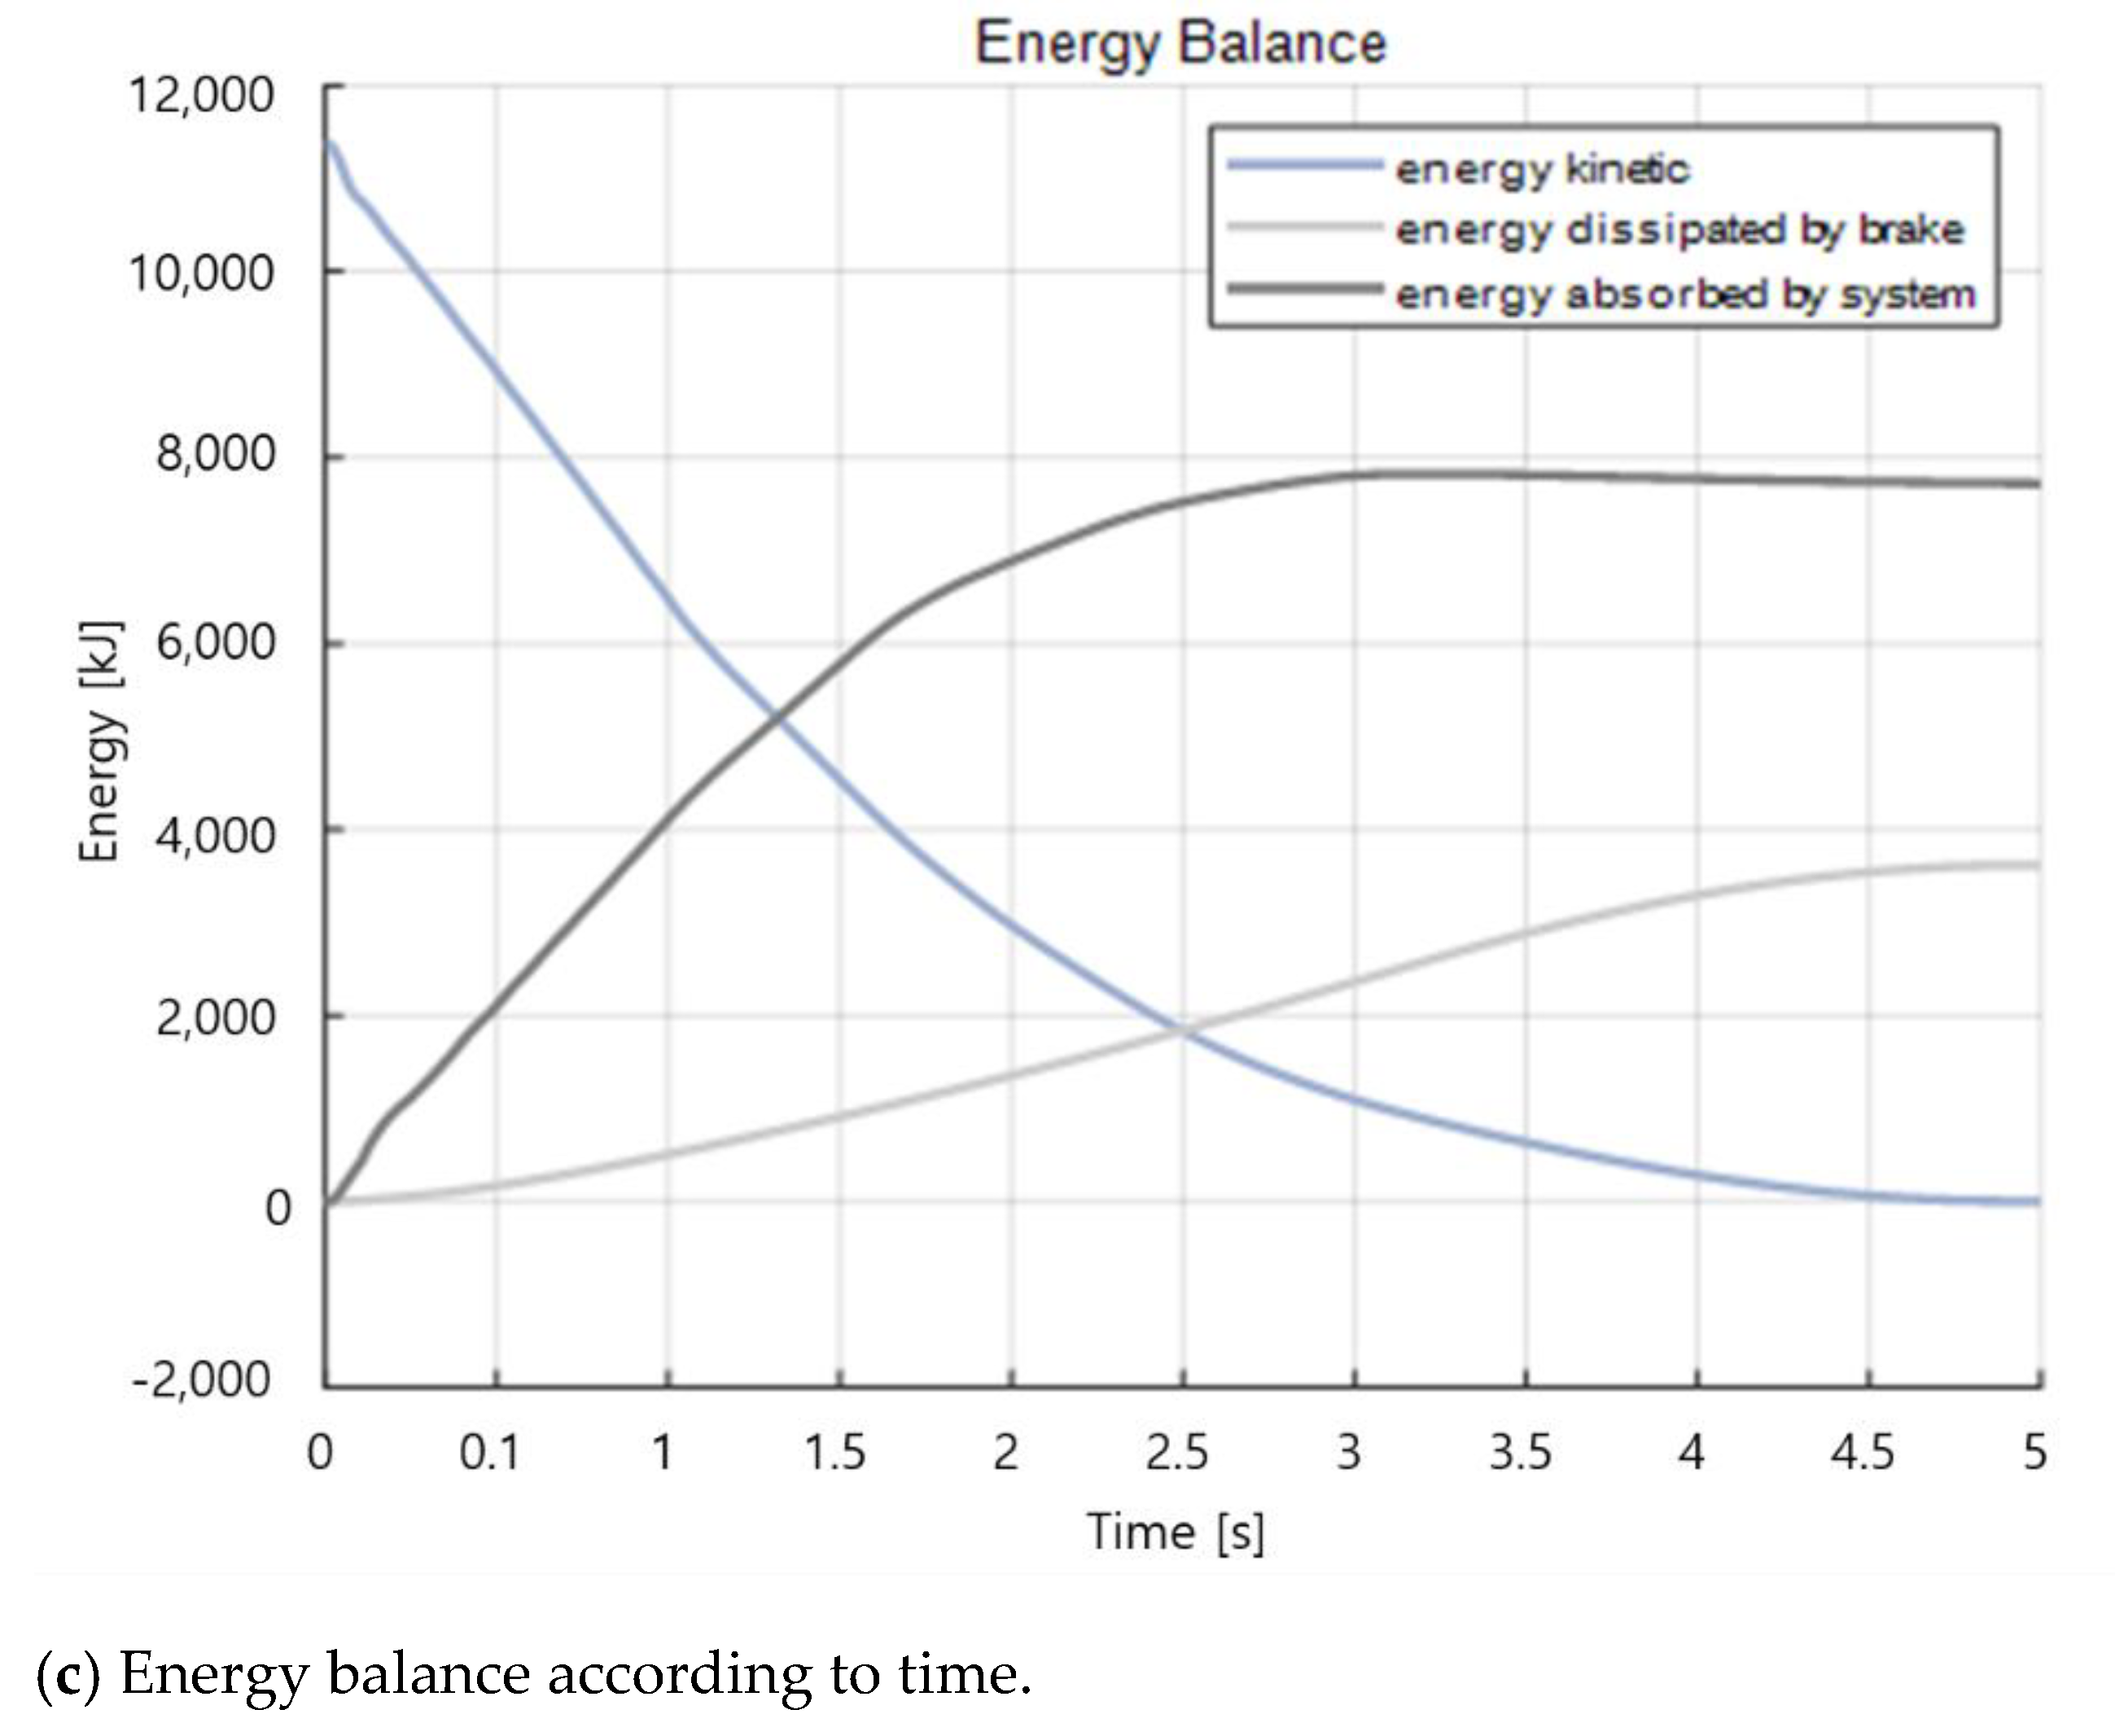
Looking at the energy balance result in Figure 24c and Table 3, the kinetic energy was large according to the collision speed, and when a collision occurred, energy loss occurred due to the buffering and braking. After a certain period, it can be confirmed that the buffer function was lost as the connector system no longer absorbed energy. Although it is small, the presence of the body’s absorbed energy indicated that the body had entered the plastic range. The final energy remaining indicated that the collision phenomenon was not completed during the simulation for 5 s, so if the motion continued, the energy lost by friction still existed.
4. Conclusions
In this study, a collision simulation program was developed by constructing a mathematical model based on experimental data from a buffer system used in a railway car connector. The buffering characteristics of a 10-car train colliding at 25 km/h were analyzed.
- Since it was difficult to perform a crash test on the assembled buffer, tests were performed for each component. Based on the results of these collision tests, a mathematical model was developed for each component constituting the coupling buffer system.
- A simulation program was developed to simulate a train collision situation including pre-processing and post-processing using mathematical models of vehicle and body models and buffer components. Because we compared the developed program with a program used by an actual company, the energy dissipation phenomenon was well matched, and the development program verified that the analysis process for the collision phenomenon was well implemented.
- Using the developed simulator, a situation where 10 trains collide with 10 fixed trains at a speed of 25 km/h was carried out. The results are summarized as follows.
- The rubber buffer was directly connected to the hydraulic shock absorber through solid contact, and the hydraulic buffer had little displacement due to the rapid increase of impact speed and the increase in reaction force.
- In the case of a heavy collision, the increased impact force was concentrated on the vehicle to which the collision was applied, therefore it may be appropriate to apply a deformation tube having different characteristics depending on the vehicle position.
- Immediately after a collision, it could be see that all vehicles vibrated under the influence of adjacent vehicles and eventually all vehicles came to a standstill. Due to friction, the propagation conditions of moving trains and standing trains appeared different.
- In the event of a collision, a large amount of kinetic energy was lost due to buffering and braking, and after a certain period, the connector system no longer absorbed energy and the buffer function was lost.
Author Contributions
Writing—original draft preparation, S.L.; writing—review and editing, Y.-h.J., Y.-i.P. and S.L.; visualization, S.L.; supervision, Y.-i.P.; investigation, Y.-h.J.; resources, Y.-h.J., Y.-i.P.; data curation, Y.-h.J., S.L.; methodology, Y.-i.P.; software, S.L.; validation, Y.-h.J., S.L. and Y.-i.P.; formal analysis, S.L. All authors have read and agreed to the published version of the manuscript.
Funding
This study was supported by the Research Program funded by the SeoulTech (Seoul National University of Science and Technology).
Institutional Review Board Statement
Not applicable.
Informed Consent Statement
Not applicable.
Data Availability Statement
Not applicable.
Conflicts of Interest
The authors declare no conflict of interest.
References
- Urban Rail Vehicle Technology Standards [KRT-VE-Part5-2017(R1)]. Available online: https://krts.krri.re.kr/pdffile/technology/2017/%EC%B2%A0%EB%8F%84%EC%B0%A8%EB%9F%89%20%EC%95%88%EC%A0%84%ED%92%88%EB%AA%A9%EA%B2%80%EC%82%AC%EA%B8%B0%EC%A4%80.pdf (accessed on 20 April 2021).
- Kim, N.; Park, Y. Collision tests and model development of a train coupling system using a high-capacity energy absorber. J. Rail Rapid Transit. 2018, 232, 2215–2227. [Google Scholar] [CrossRef]
- Jang, H. Analysis on the Cushion Characteristics of a Rolling Stock Coupler Adapted the Hydrostatic Buffer. Ph.D. Thesis, Seoul National University of Science and Technology, Seoul, Korea, 2011. [Google Scholar]
- Gao, G.J.; Tian, H.Q. Train’s crashworthiness design and collision analysis. Int. J. Crashworthiness 2010, 12, 21–28. [Google Scholar] [CrossRef]
- Kim, N.; Park, Y. Performance Tests of a High Capacity Buffer Coupling System using a Hydraulic Device. J. Korean Soc. Saf. 2016, 31, 33–40. [Google Scholar] [CrossRef] [Green Version]
- Koo, J.; Song, D. Collision analysis of the full rake TGV-K on crashworthiness. J. Korean Soc. Railw. 1998, 1, 1–9. [Google Scholar]
- Maeng, H.; Kim, J.; Park, Y. Collision Simulation for the Coupler System of Rolling Stock. J. Korean Soc. Manuf. Technol. Eng. 2013, 22, 566–572. [Google Scholar]
- Ogden, R.W. Large deformation isotropic elasticity—On the correlation of theory and experiment for incompressible rubberlike solids. Proc. R. Soc. London A Math. Phys. Sci. 1972, 326, 565–584. [Google Scholar] [CrossRef]
- Jang, H.M.; Kim, K.N.; Park, Y.I. Comparison of simulation models for train buffer couplings. Trans. KSAE 2010, 18, 107–114. [Google Scholar]
- Park, Y. Simulation Technology on the Cushion Characteristics of a Rolling Stock Coupler. Auto J. 2011, 33, 26–31. [Google Scholar]
- Jang, H.; Park, Y.; Goo, B.; Lee, J.; Park, H. Impact analysis of an electric train considering buffer characteristic. In Proceedings of the KSAE Conference, Gunsan, Korea, 14–16 October 2004; pp. 630–635. [Google Scholar]
- VOIT. Available online: https://voith.com/corp-en/connection-components-couplings/railway-couplers.html (accessed on 2 October 2020).
- Park, Y.; Jang, H.; Kim, K.; Kim, N. Analysis on the Cushion Characteristics of a Rolling Stock adapted the Dynamic model for Buffer couplers. In Proceedings of the KSAE Conference, Jeju, Korea, 19–21 May 2011; pp. 2432–2434. [Google Scholar]
- BS EN 15227. Railway Applications-Crashworthiness Requirement for Railway Vehicle Bodies. Available online: https://0-shop-bsigroup-com.brum.beds.ac.uk/ProductDetail/?pid=000000000030217909 (accessed on 30 April 2021).
- Kim, N.; Jang, H.M.; Kim, K.N.; Park, Y.I. Equivalent model of coupling system based on experimental results. In Proceedings of the KSAE Conference, Seoul, Korea, 22–24 April 2008; Volume 4, pp. 1061–1065. [Google Scholar]
- Craciun, C.; Mitu, A.M.; Cruceanu, C.; Sireteanu, T. Modeling the Buffers Hysteretic Behavior for Evaluation of Longitudinal Dynamic In-train Forces. In Proceedings of the SISOM 2012 and Session of the Commission of Acoustics, Bucharest, Romania, 30–31 October 2012. [Google Scholar]
- Kajita, Y.; Kitahara, T.; Nishimoto, Y.; Otsuka, H. Estimation of maximum impact force on natural rubber during collision of two steel bars. In Proceedings of the 1st European Conference on Earthquake Engineering and Seismology, Geneva, Switzerland, 3–8 September 2006; pp. 3–8. [Google Scholar]
- Guo, Z. Computational Modeling of Rubber-Like Materials under Monotonic and Cyclic Loading. Ph.D. Thesis, Delft University of Technology, Delft, The Netherlands, 2006. [Google Scholar]
- Freidenberg, A.; Lee, C.W.; Durant, B.; Nesterenko, V.F.; Stewart, L.K.; Hegemier, G.A. Characterization of the blast simulator elastomer material using a pseudo-elastic rubber model. Int. J. Impact Eng. 2013, 60, 58–66. [Google Scholar] [CrossRef]
- Kim, Y.H.; Kim, K.N.; Jang, H.M.; Park, Y.I. Modeling of coupling device for crash analysis of an electric vehicle. In Proceedings of the KSR Conference, Singapore, 30–31 October 2004; pp. 640–645. [Google Scholar]
Figure 1.
Collision scenario of a coupler system.

Figure 2.
Front and rear coupler [12].
Figure 2.
Front and rear coupler [12].

Figure 3.
Intermediate coupler (rubber buffer and deformation tube) [12].
Figure 3.
Intermediate coupler (rubber buffer and deformation tube) [12].

Figure 4.
Jointed rubber buffer (EFG3 type) [12].
Figure 4.
Jointed rubber buffer (EFG3 type) [12].

Figure 5.
Typical characteristic curve of a rubber buffer [12].
Figure 5.
Typical characteristic curve of a rubber buffer [12].

Figure 6.
Internal shape of a hydrostatic buffer [12].
Figure 6.
Internal shape of a hydrostatic buffer [12].

Figure 7.
Typical characteristic curve of a hydrostatic buffer [12].
Figure 7.
Typical characteristic curve of a hydrostatic buffer [12].

Figure 8.
Deformation tube.

Figure 9.
Typical characteristic curve of a deformation tube.

Figure 10.
Schematic configuration of the collision tests.

Figure 11.
Photo of collision test.

Figure 12.
Characteristic curve of rubber buffer in collision test.

Figure 13.
Characteristic curve of hydraulic buffer in collision test.

Figure 14.
Curve of the intermediate coupler in collision test.

Figure 15.
Collision system model.

Figure 16.
Hydraulic buffer model developed in Matlab/Simulink.

Figure 17.
Rubber buffer model.

Figure 18.
Hydraulic buffer model.

Figure 19.
Deformation tube model.

Figure 20.
Collision simulation program (example).


Figure 21.
Body collapse characteristic curve.

Figure 22.
3D design of the railway vehicle body.

Figure 23.
Comparison of reaction force curve.

Figure 24.
Simulation results (train speed: 25 km/h).


Table 1.
Collision test conditions.
| Buffer Type | Velocity [km/h] | Wight [ton] |
|---|---|---|
| Rubber buffer | 2.3–7.0 | 20.5 |
| Hydraulic buffer | 2.0–5.6 | 81.1 |
| Middle connector | 14.7 | 20.5 |
Table 2.
Comparison of energy balance during collision.
| Energy | S Company | Developed |
|---|---|---|
| Initial energy | 4411 [kJ] | 4411.1 [kJ] |
| Final energy | 36.0 [kJ] | 4.3 [kJ] |
| Absorbed energy buffer | 2412.0 [kJ] | 2443.5 [kJ] |
| Absorbed energy buffer (car body) | 0.0 [kJ] | 18.0 [kJ] |
| Energy dissipation | 1961.0 [kJ] | 1946.0 [kJ] |
| Energy balance mistake | 0.04 [%] | 0 [%] |
Table 3.
Result of energy balance.
| Energy | Results |
|---|---|
| Initial energy | 11,362.7 [kJ] |
| Final energy | 0.8 [kJ] |
| Absorbed energy buffer | 7742.2 [kJ] |
| Absorbed energy buffer (car body) | 3.2 [kJ] |
| Energy dissipation, brake | 3615.9 [kJ] |
Publisher’s Note: MDPI stays neutral with regard to jurisdictional claims in published maps and institutional affiliations. |
© 2021 by the authors. Licensee MDPI, Basel, Switzerland. This article is an open access article distributed under the terms and conditions of the Creative Commons Attribution (CC BY) license (https://creativecommons.org/licenses/by/4.0/).
Share and Cite
MDPI and ACS Style
Lim, S.; Ji, Y.-h.; Park, Y.-i. Simulation of Energy Absorption Performance of the Couplers in Urban Railway Vehicles during a Heavy Collision. Machines 2021, 9, 91. https://0-doi-org.brum.beds.ac.uk/10.3390/machines9050091
AMA Style
Lim S, Ji Y-h, Park Y-i. Simulation of Energy Absorption Performance of the Couplers in Urban Railway Vehicles during a Heavy Collision. Machines. 2021; 9(5):91. https://0-doi-org.brum.beds.ac.uk/10.3390/machines9050091
Chicago/Turabian StyleLim, Sunghyun, Yong-hyeon Ji, and Yeong-il Park. 2021. "Simulation of Energy Absorption Performance of the Couplers in Urban Railway Vehicles during a Heavy Collision" Machines 9, no. 5: 91. https://0-doi-org.brum.beds.ac.uk/10.3390/machines9050091
Note that from the first issue of 2016, this journal uses article numbers instead of page numbers. See further details here.