
A Novel Method for Harmonic Current Injection with Sensor Supported Adaptation on Permanent Magnet Synchronous Machines


Institute of Vehicle System Technology, Karlsruhe Institute of Technology, 76131 Karlsruhe, Germany
*
Author to whom correspondence should be addressed.
Machines 2021, 9(8), 139; https://0-doi-org.brum.beds.ac.uk/10.3390/machines9080139
Submission received: 27 May 2021
/
Revised: 9 June 2021
/
Accepted: 19 July 2021
/
Published: 22 July 2021
(This article belongs to the Section Machine Design and Theory)
Abstract
:To reduce torque oscillations in electric motors, harmonic current injection (HCI) has been used in industry for some time. For this purpose, higher harmonic currents calculated in advance are injected into the machine. Since the general conditions for the machine can change during its life cycle, this article presents a method that makes it possible to change the parameters of HCI during operation. For this purpose, sensor signals are used to detect the reaction of the electric motor to small variations of the HCI parameters. The knowledge gained in this way is used to make further suitable variations. FEM simulations were used to verify the effectiveness of the approach. The results show that the algorithm can independently optimize the HCI parameters during runtime and reduces the amplitude of the 6th harmonic in the torque by 87% for a permanent magnet synchronous machine.
1. Introduction
Driven by the political will to promote electromobility, more and more full electric vehicles have been registered in Germany over the past few years. In 2020, registrations increased by 306.8% compared to 2019 [1]. Globally, the situation is similar, with the number of new registrations of electric vehicles increasing year on year [2]. Likewise, the numbers of new registrations of hybrid electric vehicles increased. The electric drive is thus becoming more and more the center of focus.
In addition to mastering pure functionality, comfort is becoming an increasingly important consideration in vehicle development. With almost all manufacturers offering electric cars in the meantime, they are trying to gain a competitive edge by constantly improving the comfort of their vehicles. The narrow banded, high-frequency sound emissions of electric traction drives can be perceived as unpleasant both by passengers in the vehicle and by passers-by in the surrounding area [3,4,5].
Many different methods are described in the literature on how to reduce torque variations, which are a major source of high-frequency oscillations, for electrical machines. These include proper notch design [6,7], different arrangements of magnets [8,9], rotor skewing [10,11] and reduced switching frequencies for predictive torque control methods [12]. Harmonic Current Injection (HCI) is a method that does not require any design changes to the machine. The approaches described in the literature can be divided into two categories. On the one hand, there are approaches that try to eliminate the harmonics of the currents in the rotating, rotor-fixed system as well as possible. This should result in as little interaction as possible between the harmonics of the current in the stator and the harmonics of the back-EMF. However, this cannot reduce the machine-specific torque fluctuations [13,14,15]. On the other hand, there are methods, where higher-frequency harmonics are modulated onto the stator currents, which counteract the machine-specific harmonics. This allows, for example, the torque harmonics to be reduced, resulting in a smoother torque [16,17,18,19,20].
HCI is already used in industry and methods for designing the current harmonics to be injected are also described in the literature for almost all machine types. For example, there are special adaptations of the HCI for electrical machines that are operated with six phases instead of three [21]. Even though there are already approaches that try to change the parameters of the HCI during operation [22], most approaches are based on pre-calculated characteristic values of the injected currents, which remain the same over the lifetime of the machine [23,24,25,26,27]. With the increasing complexity of the models for the control of electrical machines, less and less time is available for determining the necessary amplitudes and phase angles of the HCI during operation. Therefore, there are meanwhile also variants of the HCI that store the calculated values of the currents in lookup tables, which are simply accessed later during operation to reduce computing time. In this case, no machine model has to run in parallel [28].
In contrast to stationary use on a factory floor, a vehicle’s drive system is exposed to constantly changing environmental conditions. A vehicle can be operated in the temperate climate zone of a large city one day and drive through the salty air of a coastal region into cold polar regions the next. Even within a climatically relatively stable environment, such as a large city, the temperature fluctuations between summer and winter can very easily reach 40 degrees Celsius. However, not only the environmental conditions have a direct influence on the vibration behavior of the electric drive system, but also the system itself changes over its lifetime.
Mechanical couplings can loosen over time [29], electrical contacts can corrode [30] and plastics can change their elasticity [31]. Even at the beginning of the operating time, unavoidable tolerances due to production and assembly can have an influence on the vibration behavior of each individual drive. Thus, results from HCI with pre-calculated quantities may worsen over the life cycle of the system. Moreover, even if some change in the system has been included in the calculations, these methods remain a compromise.
As a solution to this problem, a method is presented in this publication that makes it possible to make adjustments to the HCI parameters during operation of the machine and to adapt them to changing system and environmental conditions.
2. Fundamentals
2.1. Harmonic Current Injection for Permanent Magnet Synchronous Machines
Permanent magnet synchronous machines (PMSM) are rotating field machines. A symmetrical, usually three-phase system generates a rotating field of constant amplitude in the stator of the machine. The rotor field is pulled along by this stator field, which causes the rotor to move synchronously with the stator field. For further understanding of the PMSM, please refer to the literature. [32,33]. Considering the machine in the rotor fixed d-q coordinate system, it can be seen that after some simplifications the torque mainly depends directly on the d and q currents and flux. Thus, for example, if the 6th harmonic in the torque is to be reduced by an HCI, currents should be injected which oscillate at the same frequency as the 6th harmonic in the d-q system. In the stator-fixed a-b-c system, the 6th harmonic corresponds to the 5th and 7th harmonics [19].
There are other combinations from which a 6th harmonic of the current can be generated in the - system, but these contain even higher frequencies, which can lead to problems with the switching frequency of the inverter above certain speeds. For this reason, we will concentrate on the simplest combination in the following. Equation (1) shows a current system with the required 5th and 7th harmonics.
With the help of the Park transformation [34,35] this current system can be transformed into the rotor-fixed d-q system. The parameters of the HCI, consisting of the amplitudes and and phase angles and are preserved. Equation (2) shows the current system in d-q coordinates.
As can be seen in Equation (2), the new parameters in the d-q system consist of combinations of the parameters from the stator-fixed a-b-c system. To simplify the HCI, the amplitudes and can now be set as a function of the amplitude of the fundamental wave. This leaves only the phases and to be determined.
The necessary additional power of the current system for the elimination of the sixth harmonic in the torque is therefore represented by those sums in Equation (2) which belong to the sixth harmonic in the d-q system. If the electrical machine is operated in the limit range of the maximum load, it must be ensured that the additionally induced harmonic waves in the current in combination with the fundamental wave do not exceed the permitted current intensity in the machine.
2.1.1. Ratio of Amplitudes and to
Methods are described in the literature to determine the amplitude ratio between the harmonics and the fundamental frequency. For this purpose, the ratio between the corresponding harmonics in the back electromotive force (back-EMF) is used [19]. However, corresponding simulations could not provide satisfactory results for the PMSM with buried magnets in V-arrangement used here.
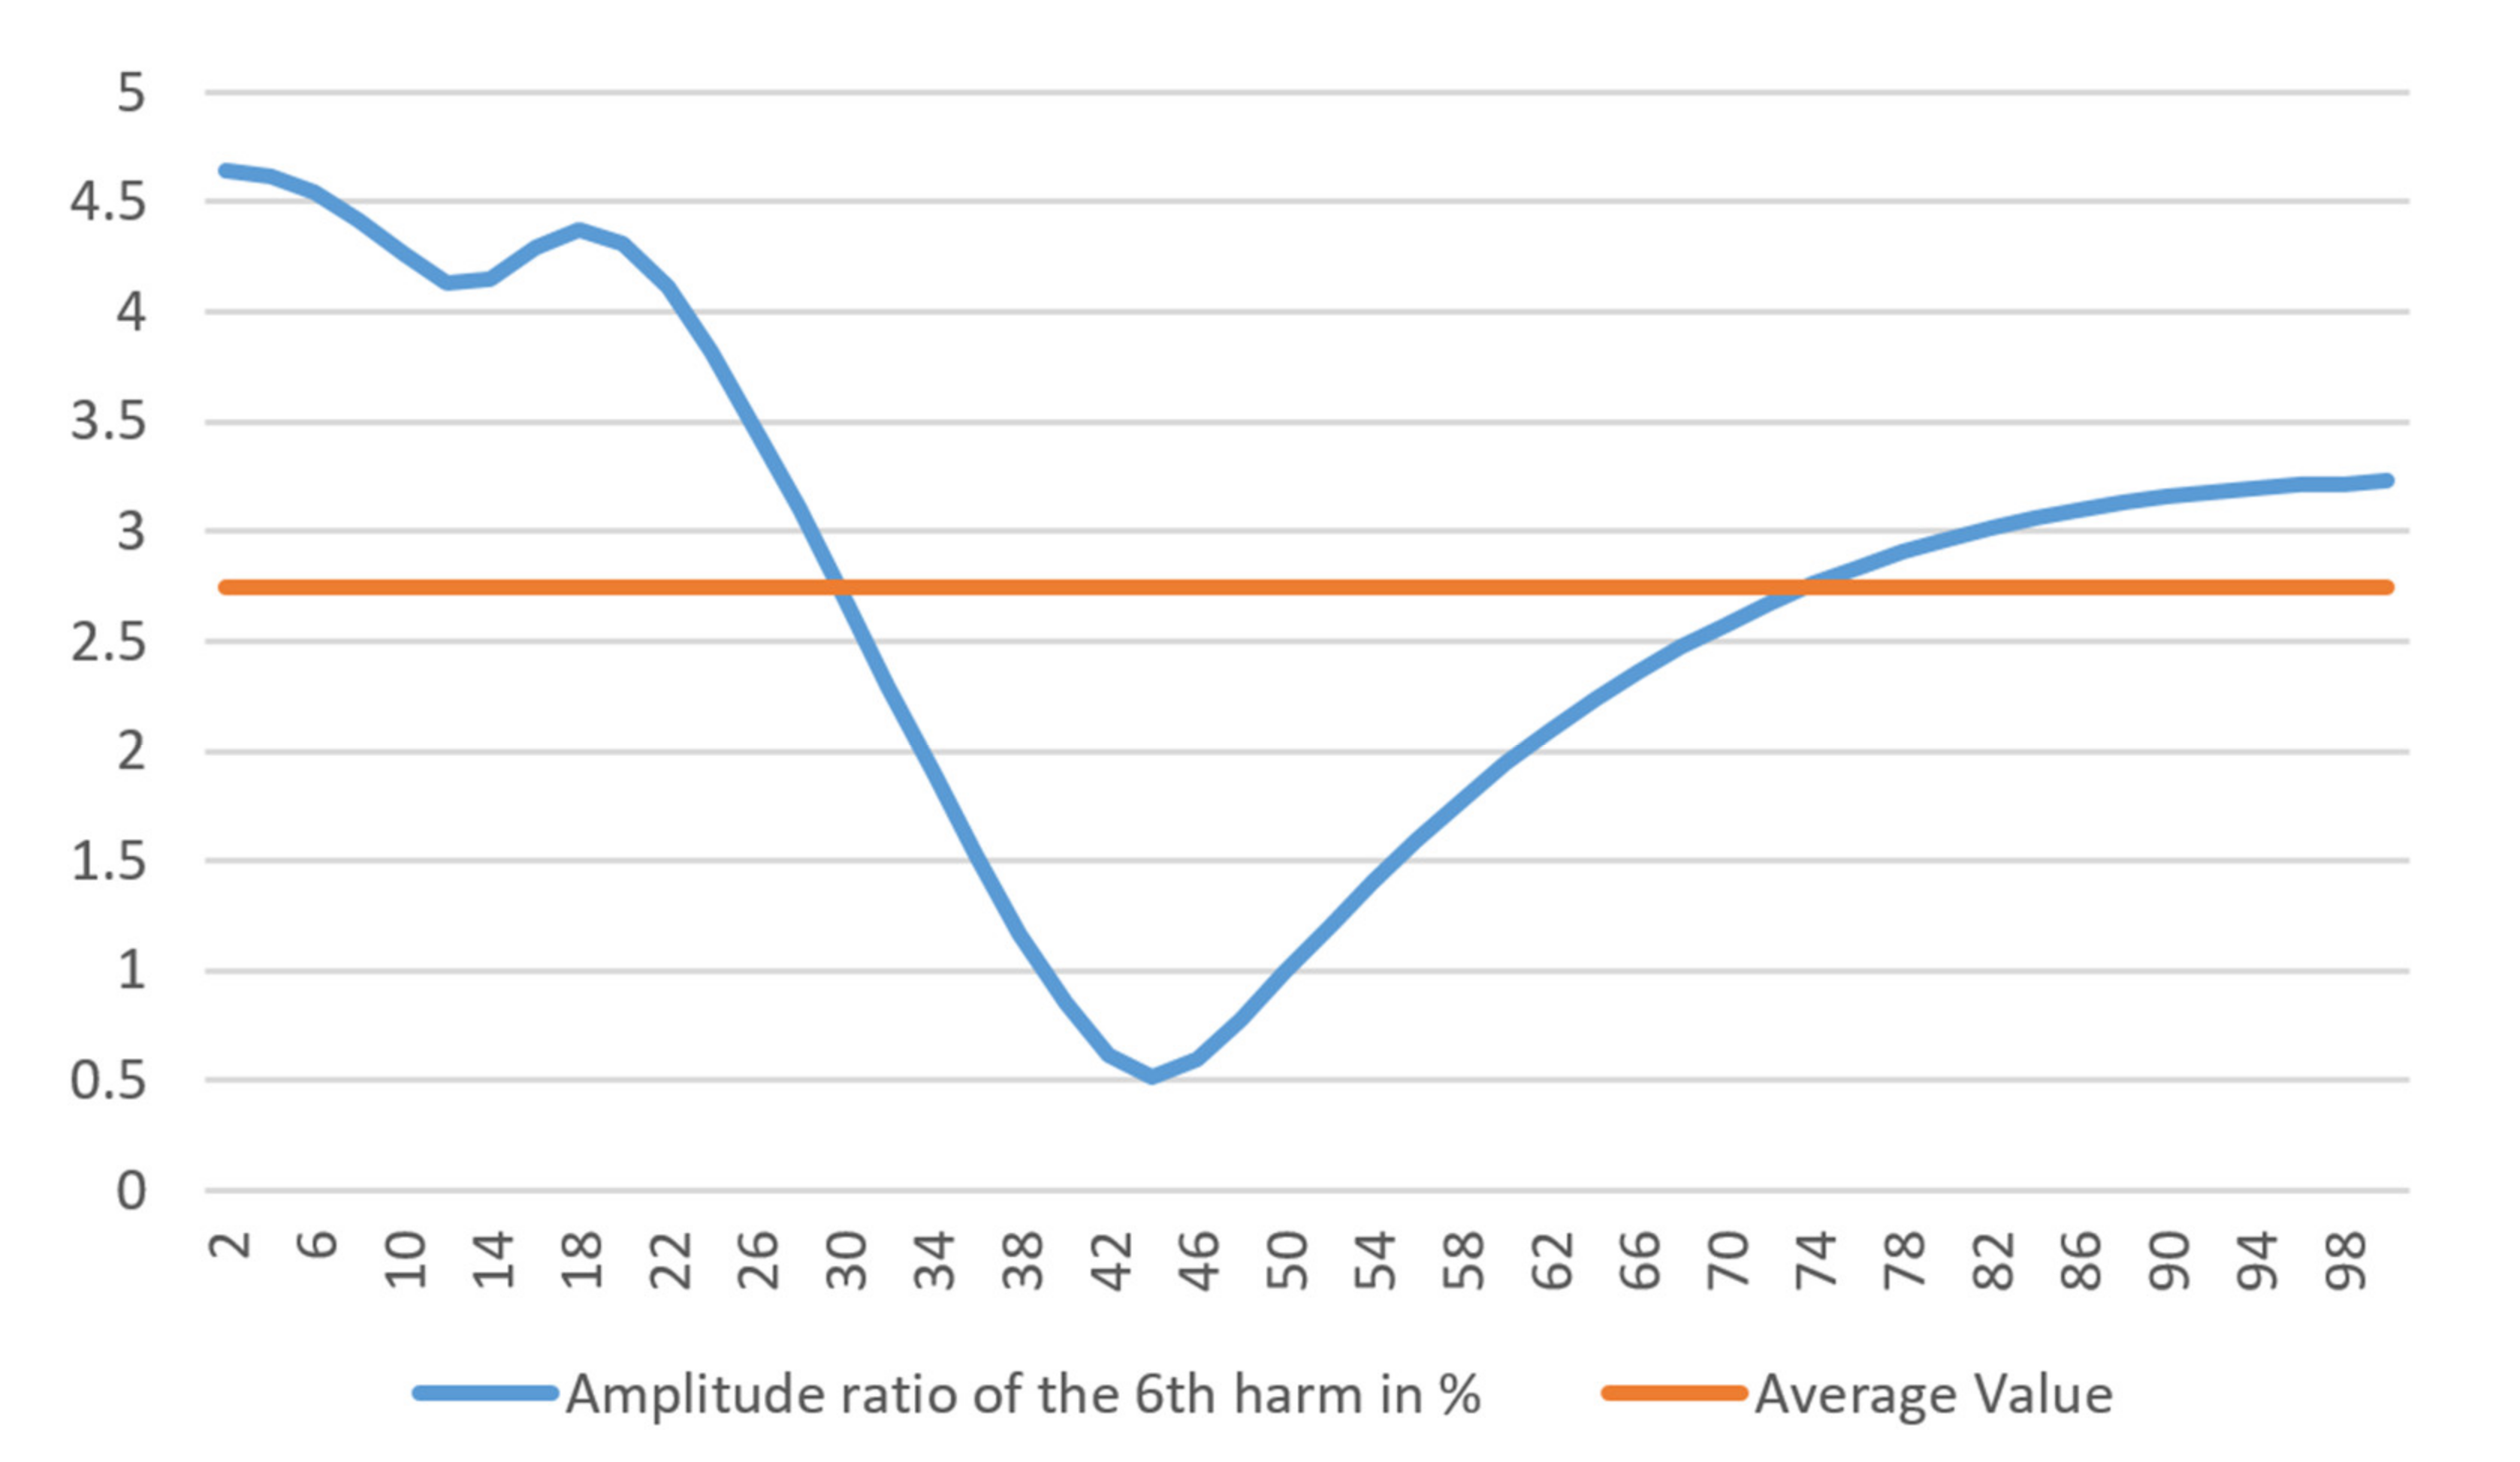
Instead, the ratio was determined via the amplitude of the 6th harmonic in the torque to the mean torque. For this purpose, FEM simulations of the machine were performed over the entire operating range and the ratio between the amplitude of the 6th harmonic in the torque and the mean torque was evaluated (compare Figure 1). The mean value of these ratios was used as an approximation to simplify the non-linear behavior and set the fixed ratio for the HCI.
2.1.2. Determination of the Phase Angles and
Similar to the ratio of the amplitudes, a method is described in the literature for defining the phase angles for the HCI based on the results of the analysis of the back EMF [19]. However, it was found that the described procedure does not produce satisfactory results for a PMSM with V buried magnets in V arrangement.
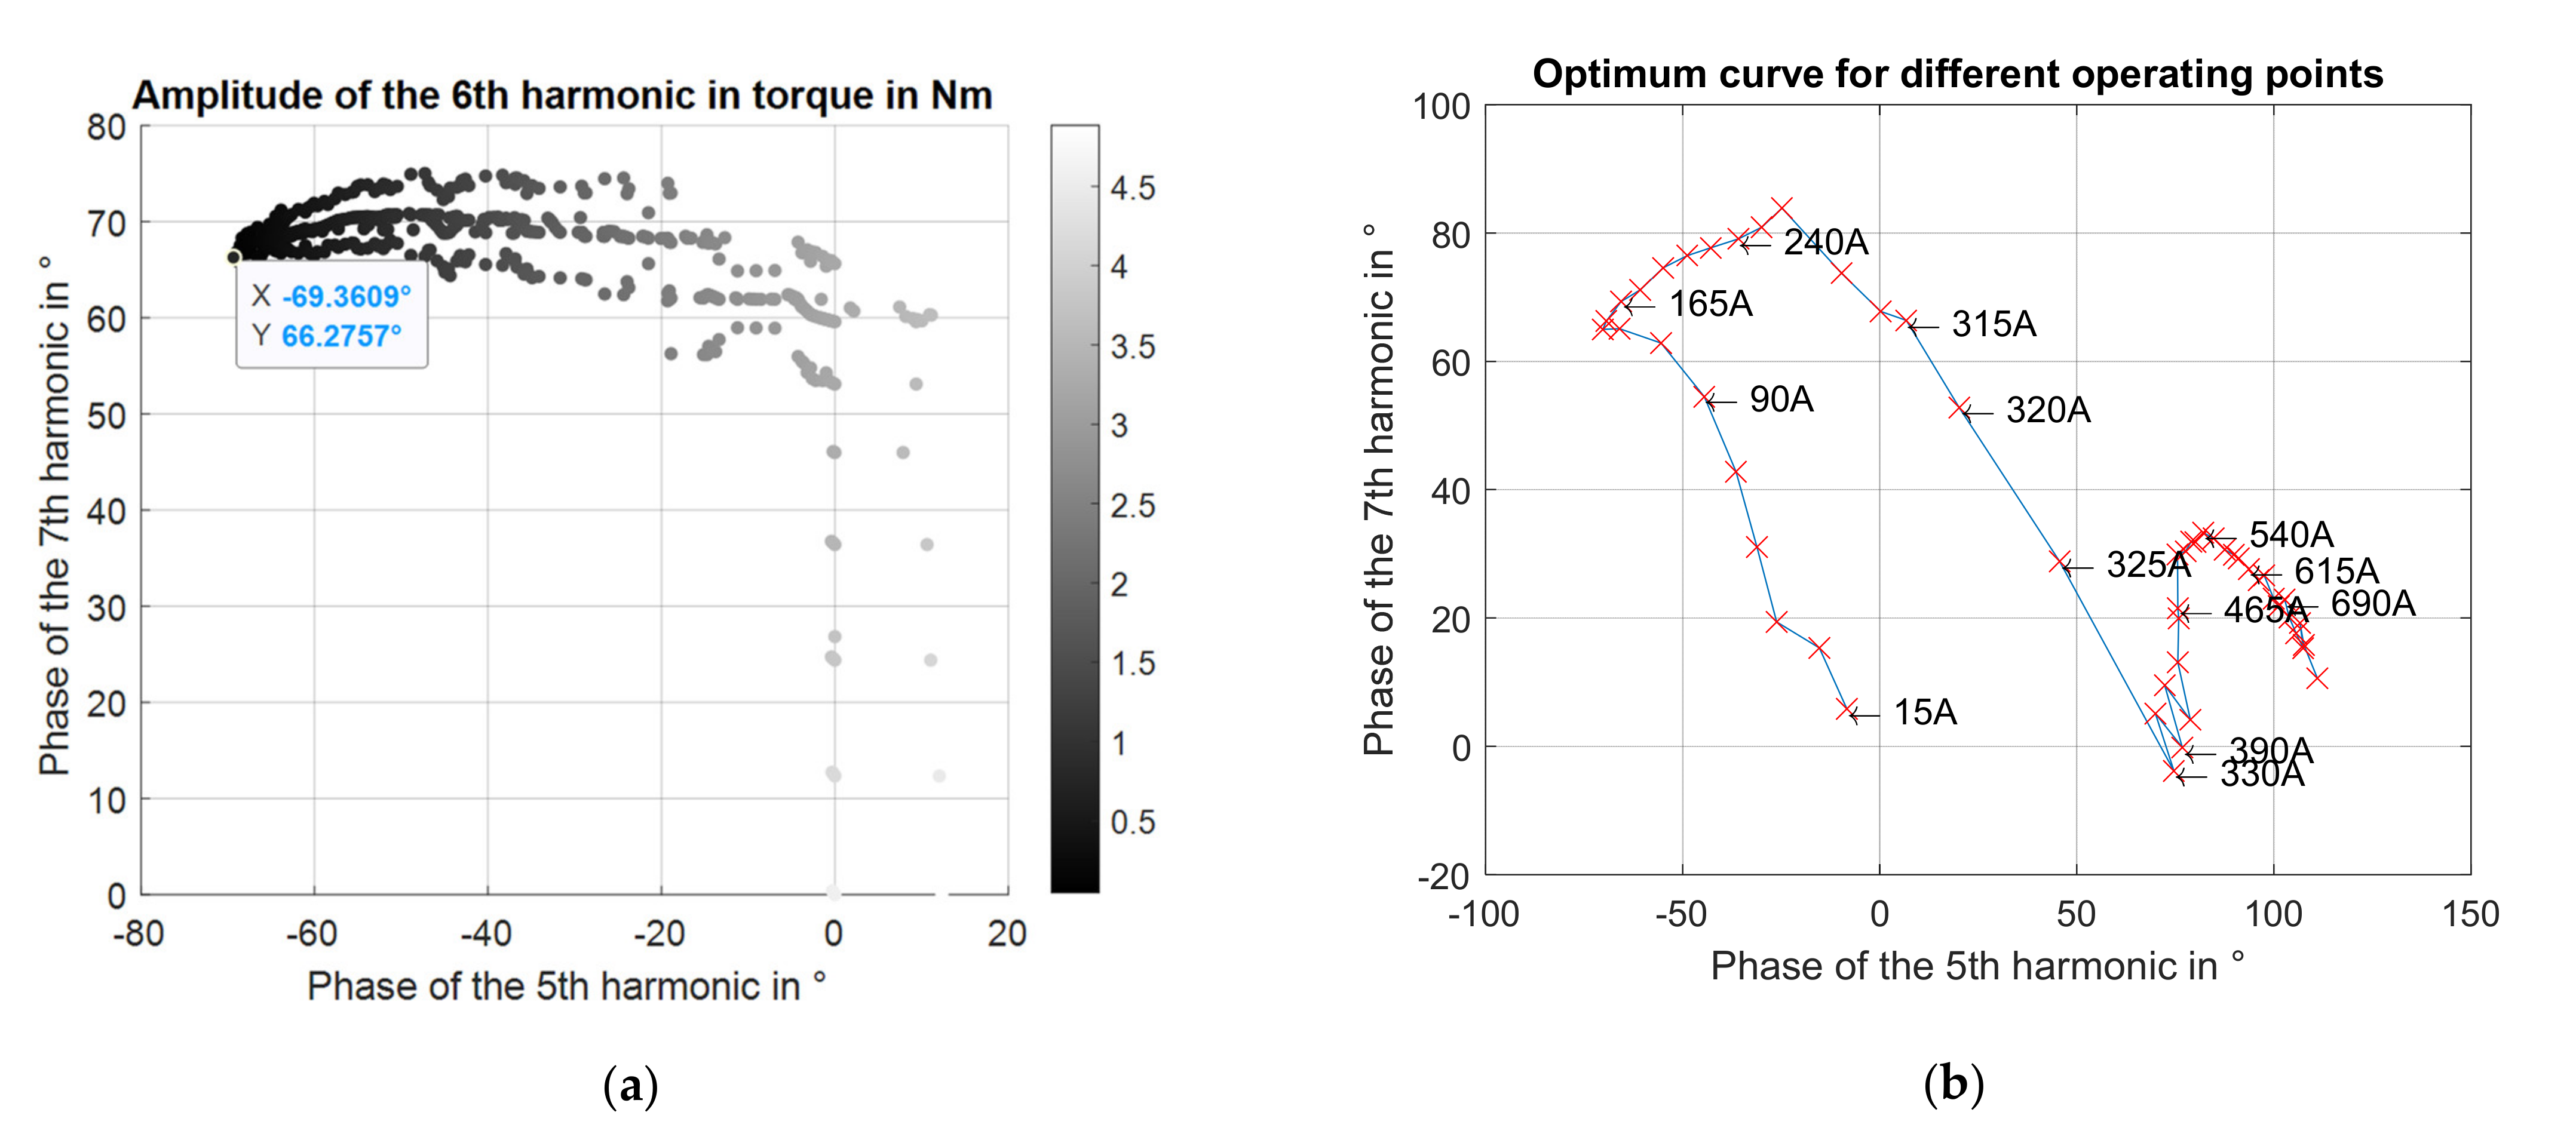
For this reason, the phase angles were determined simulatively for a certain grid of operating points. For this purpose, an FEM simulation was set up and the response of the electromagnetic torque to the injection of different phase angles at the fixed amplitude ratio presented in Section 2.1.1 was investigated. In order to limit the computational effort, a gradient-based optimization was performed, varying and until the 6th harmonic in the torque fell below an acceptable level or the variation step size reached the termination criterion.
Figure 2 shows on the left the course of the optimization for a single operating point and on the right the respective calculated, optimal phase combination for all operating points of a certain velocity plotted in a diagram. With the help of this trace, values can now be interpolated for currents that were not explicitly simulated.
2.2. Control Structure
The proposed control structure for an HCI that adapts to changing system characteristics during operation is built on a standard field-oriented control (FOC). An additional control package is docked onto the FOC control structure that determines the HCI currents. The currents should be injected in such a way that they do not affect the original FOC. This has the advantage of being able to switch off the additional module at any time without affecting the safety or functionality of the actual control of the electrical machine, which is an important feature especially in the automotive industry. Figure 3 shows the schematic structure of the control system.
The additional control module can be divided into three sections. Section one is responsible for receiving and processing a sensor signal, based on which an algorithm decides whether and in which direction the parameters of the HCI are varied. This signal can be acceleration or any other type of sensor signal from which it is possible to determine the torque ripple of the machine. Section two includes a lookup table that contains the output values for the HCI for different operating points and varies these values based on the sensor signal processed in section one. Section three synthesizes the target variables for control based on the values of the HCI. Figure 4 shows the block diagram of the additional control module.
2.2.1. Sensor Signal Processing
The idea behind the control is to measure the reaction of the machine to a slight variation of the HCI parameters. Depending on whether the torque variations have been reduced or not, the varied value is maintained or varied again. In the present case, the 6th harmonic in the torque is to be reduced. So the sensor signal must be processed in such a way that a statement can be made about the amplitude of the 6th harmonic in the torque.
In principle, there are various methods for this. During the simulations, the torque signal could be accessed directly. Of course, this is not possible for real operation. Acceleration sensors can be used here to detect the fluctuations. By placing them appropriately on the system, for example at the motor mounting points of the electric machine, the acceleration sensors can be used to measure the response of the torque fluctuations, providing a measure of their origin. The premise is therefore that the smaller the reaction, the smaller the excitation.
No matter from which source the information comes, the primary task remains to extract the amplitude of the 6th harmonic from a signal so that it can be compared with the previous value. It is obvious to use a Fourier transformation for this. However, this is very computationally intensive, because besides the 6th harmonic all other harmonics are calculated, which are not of interest here.
If the frequency of an oscillation within a general signal is known, its amplitude can also be calculated without performing a complete Fourier transformation. Since in PMSM with FOC the angle of rotation or the rotational speed is well known, the frequency of the 6th harmonic in the torque is also well known.
According to [36], an arbitrary periodic signal , such as is usually present in rotating machines without restriction of generality, can be put into the following form using Fourier series decomposition:
Transferring this signal with the help of the rotation matrix from Equation (4) into a rotating coordinate system, whose rotation speed corresponds to the searched frequency . There remains besides high-frequency oscillations a DC component, which corresponds to half of the amplitude components of the searched frequency.
By low-pass filtering this part can be separated from the oscillations and the original amplitude can be determined with the help of a simple magnitude calculation:
In this way, the amplitude of the 6th harmonic in the torque can be calculated and passed to the next section without the cost of a full Fourier transform.
2.2.2. Variation of the Initial Values
In the second section of the control structure, the parameters of the HCI are to be changed during operation. As described in Section 2.1.1, the amplitudes should be calculated by a fixed ratio for simplicity and only the phase angles of the currents will be varied, since the phase angle has a stronger influence on the change of the sixth harmonic in the torque [37]. The initial values were determined with the help of a gradient-based optimization. In the following, these initial values will now be changed to further reduce the oscillations of the 6th harmonic.
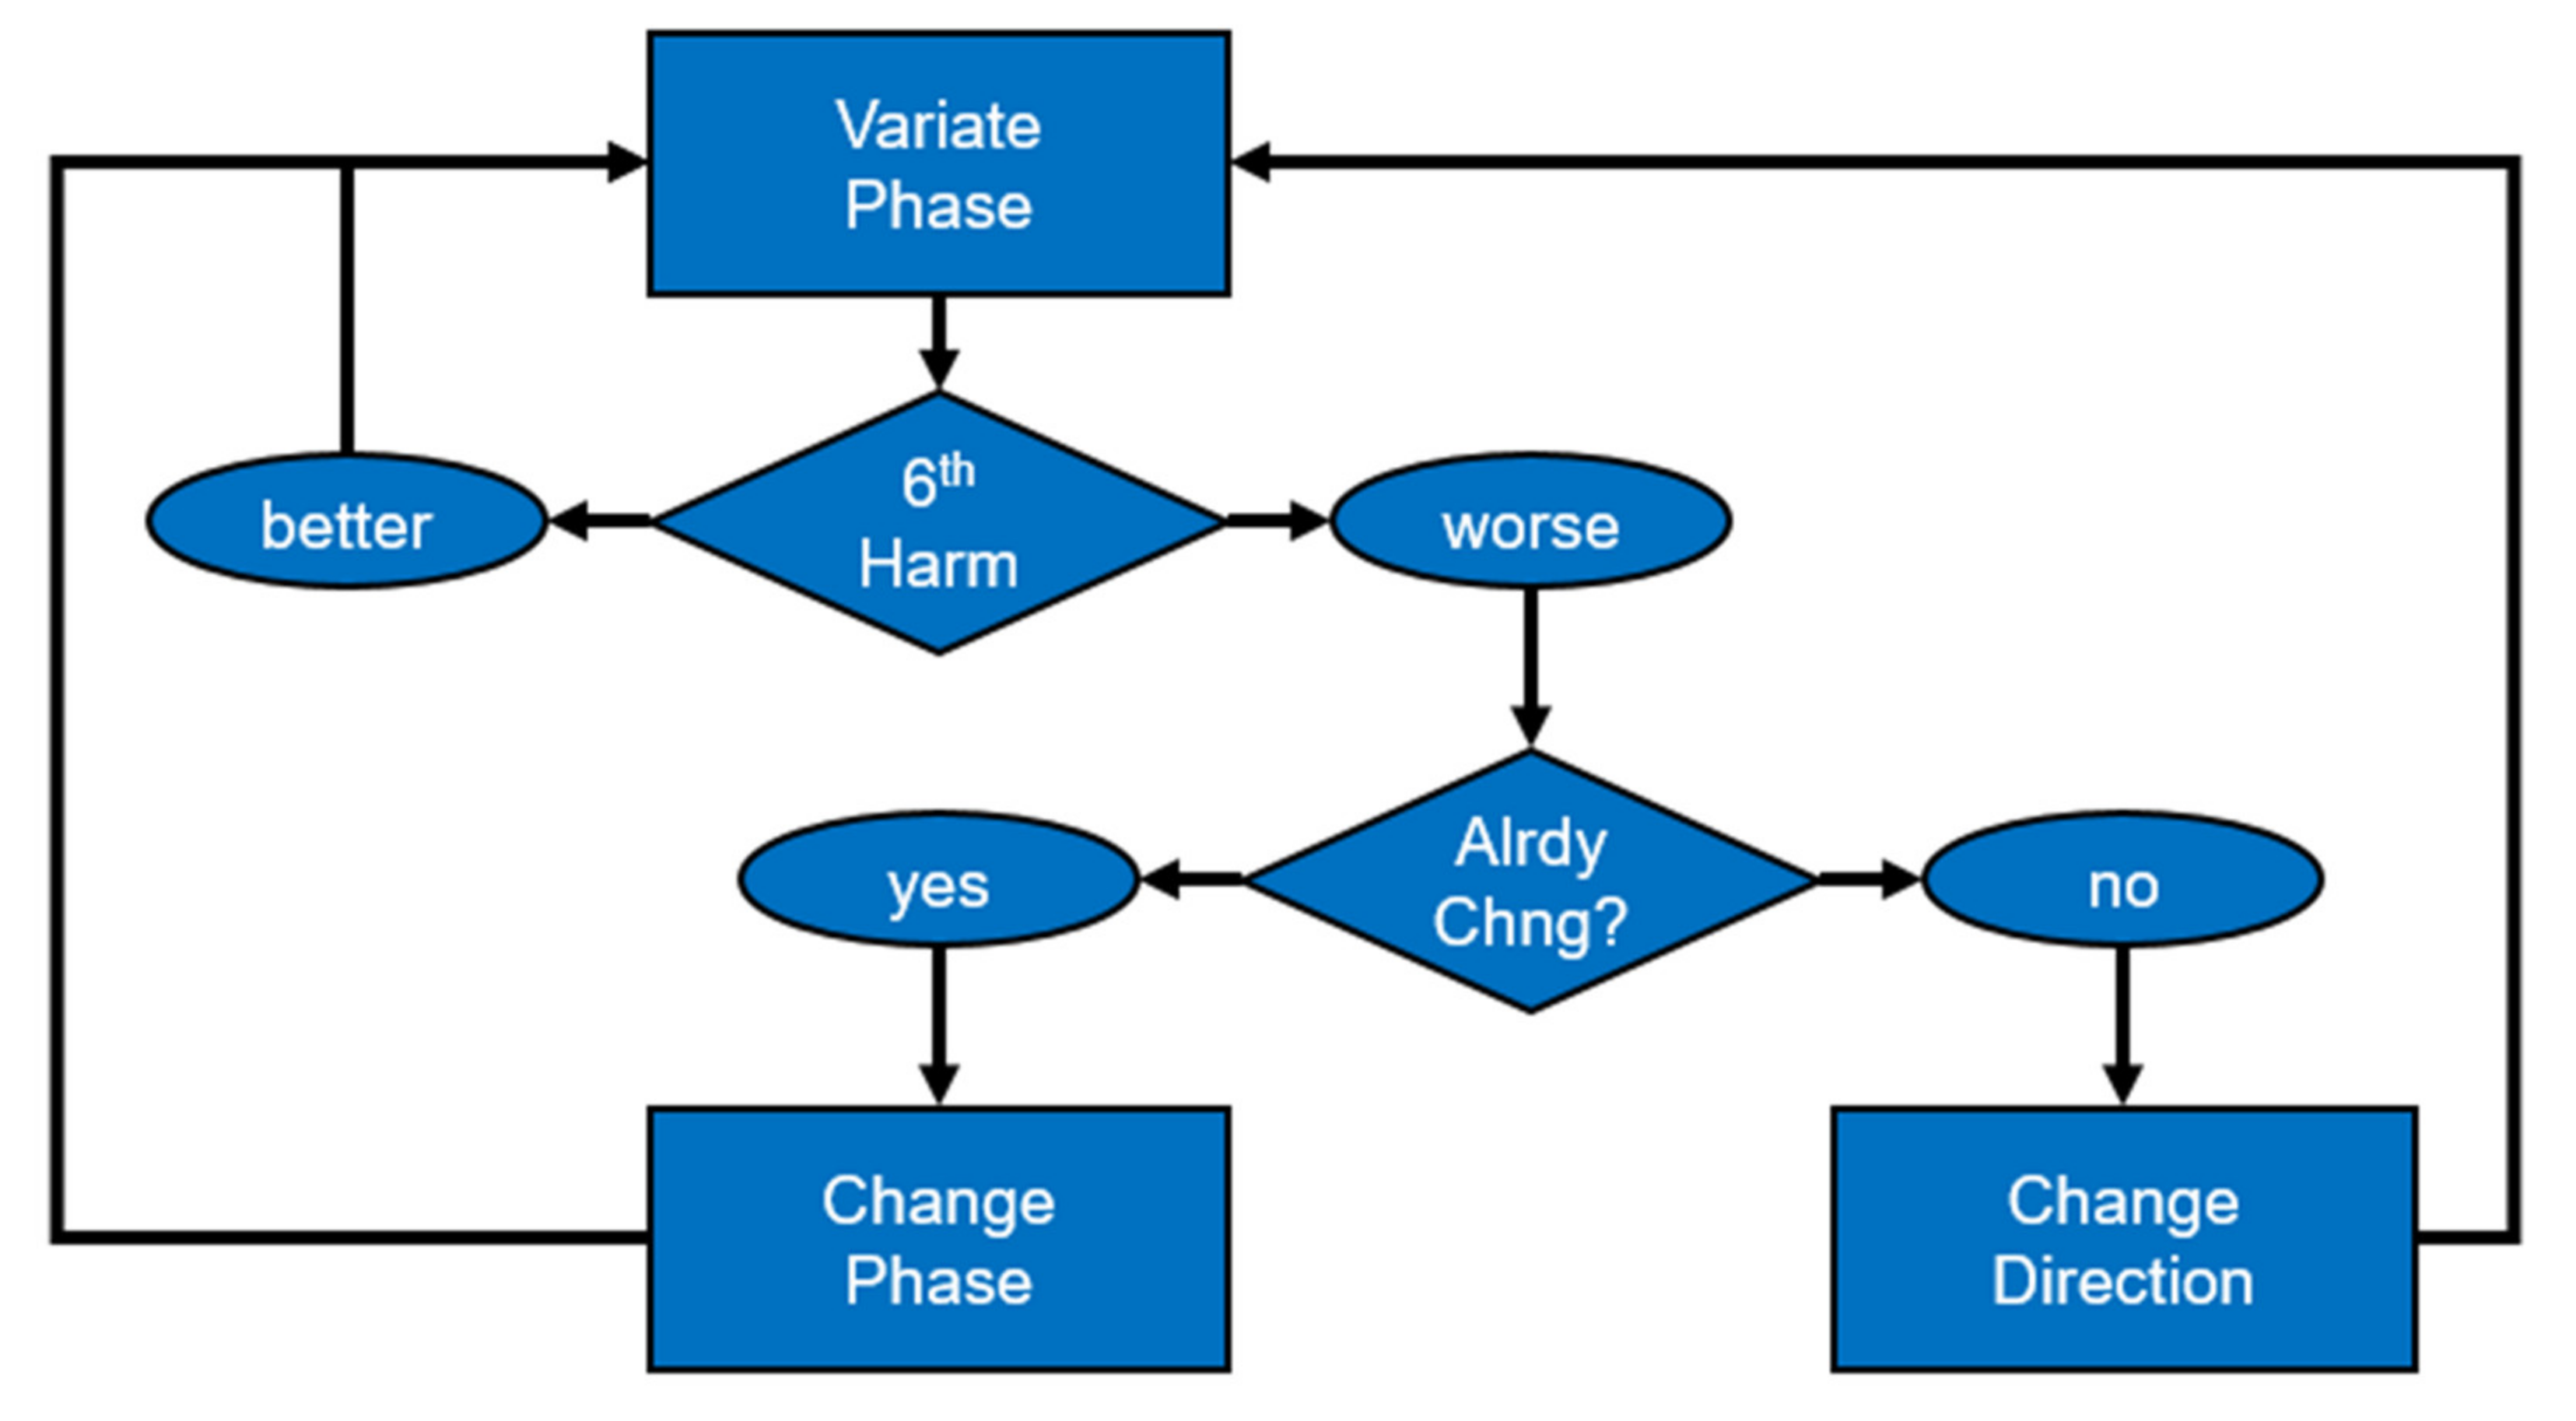
The phase of the 5th harmonic is slightly increased and held for a freely selectable time interval dt. In this time interval it is checked how the amplitude of the 6th harmonic in the torque changes. If the amplitude in the torque decreases, for the next time interval dt the phase of the 5th harmonic is further changed in the same direction (i.e., in this case further increased). If, on the other hand, the amplitude in the torque increases, the change in the phase is reversed and changed in the other direction for the next time interval dt (i.e., reduced in this case).
If the amplitude of the 6th harmonic in the torque increases even after the change of direction, it can be assumed that the original value for the 5th harmonic in the current represents an optimum. In this case, the phase of the 5th is held initially and the phase of the 7th harmonic is varied in the same way as the 5th was before. Figure 5 shows a flowchart of the algorithm.
The respective current values are stored in a lookup table so when the system is back at the corresponding operating point, the last optimal value can act as the start value for the next run.
2.2.3. Synthesis of the Target Values for the Control
In the third section of the control, the values from the lookup table are converted into corresponding currents. For this purpose, target values must first be generated for the control and the values for the 5th and 7th harmonics in the current must be extracted from the measured current signals. It is useful to use a similar method as for a FOC control. The currents are controlled in a rotating coordinate system, in which they are present as DC variables. However, since both the 5th and the 7th harmonic should be controlled, two rotating systems must be used and the result must then be superposed.
The and currents present in the FOC control, as well as the target values for the HCI from the lookup table, are first transferred to the coordinate systems rotating at six times the rotational speed by Equations (6) and (7).
A low-pass filtering of the measured currents eliminates all time-dependent components and offers the PI controllers the possibility to adapt the measured quantities to the target values via suitable voltages. A back transformation into the - system and subsequent superposition with the voltages from the FOC result in the desired currents in the machine.
3. Results
As there is unfortunately no suitable electrical machine and also no test bench available, the results cannot be verified experimentally. Instead to validate the approach described in section two, a co-simulation was used linking the three models in the Matlab/Simulink, Ansys maxwell and Ansys Twinbuider software packages. For a more detailed description of the structure of the co-simulation, please refer to the Supplementary Materials.
In this co-simulation, the housing vibrations are not simulated, therefore the calculated electromagnetic torque is used as input signal for the HCI variation.
The drawback of the co-simulation is the long runtime. The three simulation models must be calculated with identical step sizes so that the output data for each model is available at any time. This means that the model that requires the smallest step size specifies this for the other models.
Figure 6 shows in the upper diagram the curve of the 6th harmonic in the torque, according to the method presented in Section 2.2.1. Below, the curve of the varied phase angle for the 5th and the 7th harmonic in the current is shown.
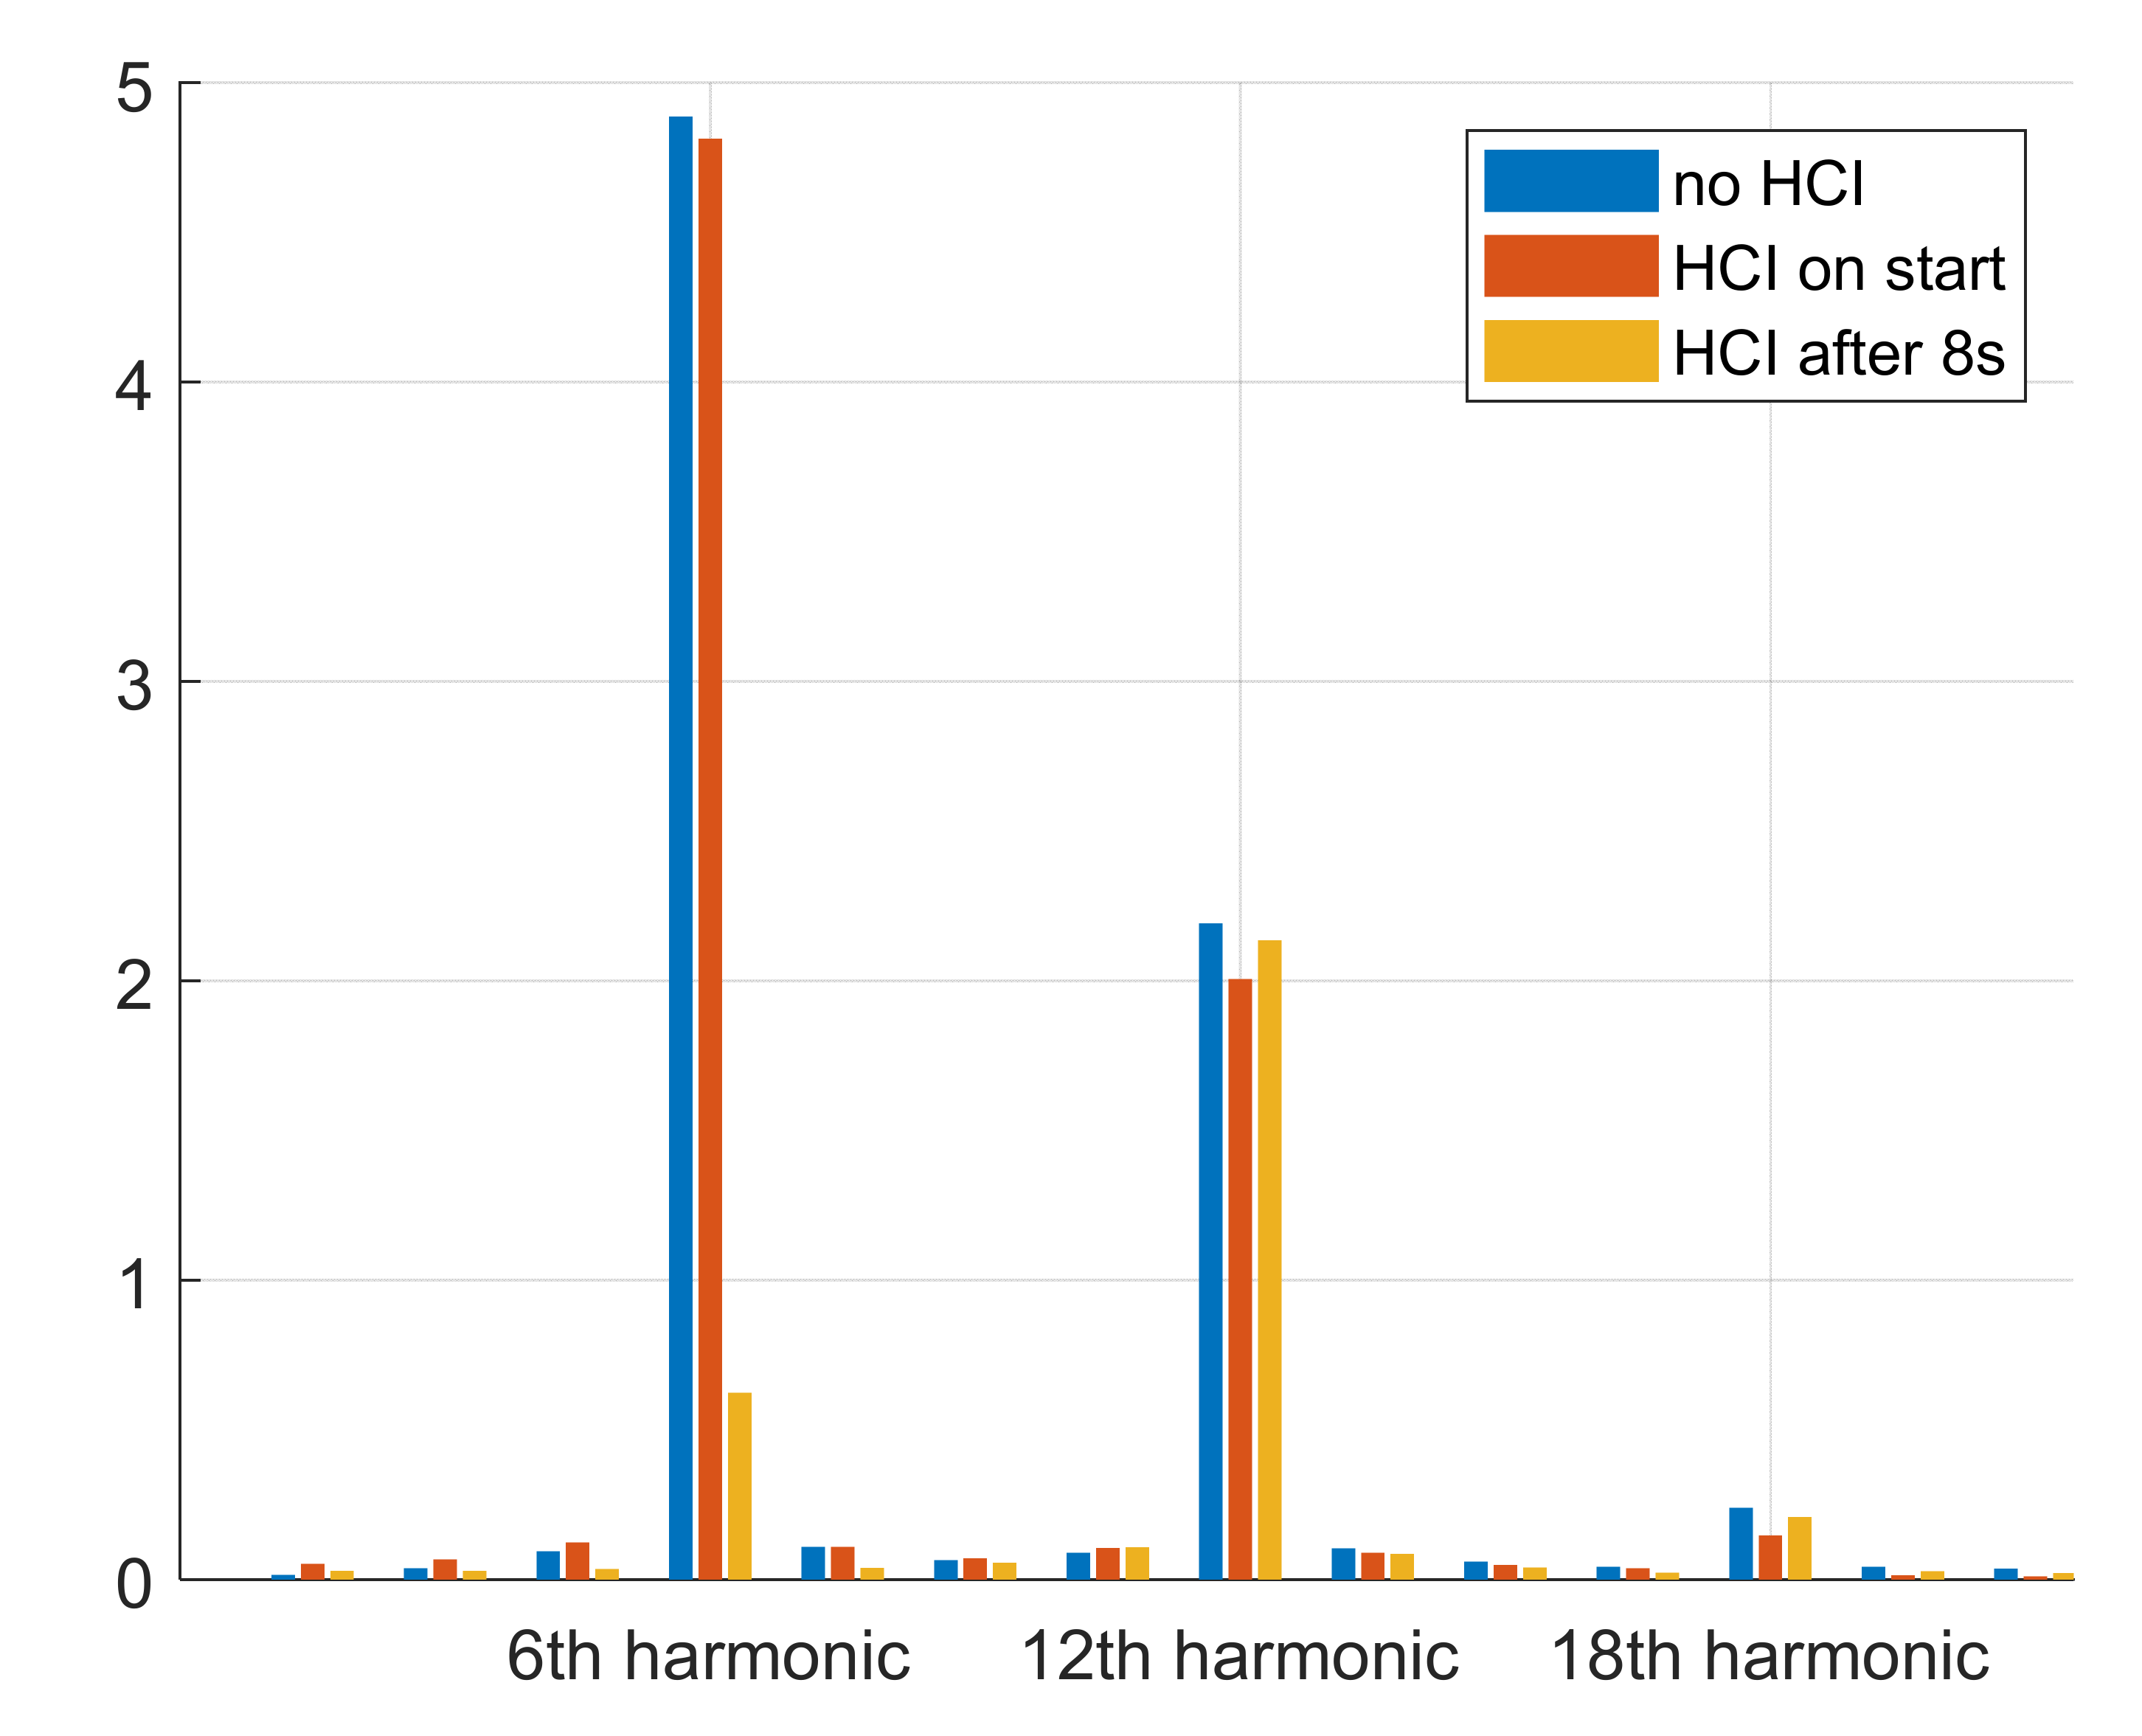
Figure 7 shows the frequency spectra of the torque for the cases of
- no HCI
- HCI on start of the variation
- HCI after 8 s
The constant torque bars have been hidden for readability. They are 145.84 Nm, 145.77 Nm and 145.70 Nm, i.e., they change by less than 0.1%.
In another simulation, a change in the general conditions was made to demonstrate the effect on the machine and the necessary parameters of the HCI. For this purpose, the strength of the permanent magnets was changed after 1.1 s, as well as the phase angle of the fundamental wave. Figure S1 in Supplementary Materials shows the 6th harmonic in the torque over the step of the general conditions.
In another simulation, the behavior of the approach was tested under transient conditions. The torque was increased linearly from 0% to 30% of the nominal torque in 10 s. Figure S2 in Supplementary Materials shows the torque fluctuations, the speed and the phase and amplitude of the fifth and seventh harmonic in the current.
After the investigation with a relatively fast change of the operating points, another investigation with a slower change was carried out. The results are shown in Figure S3 in Supplementary Materials. In this run-up, the torque was increased from 50% to 60% of the nominal torque in a period of 13 s.
4. Discussion
The results from the simulations presented in Section 3 show the advantages of the approach described in Section 2. First of all, it could be illustrated that the algorithm independently finds optimal parameters for the machine and thus finds a significant reduction of the amplitude of the 6th harmonic in the torque. For the PMSM with buried magnets in V-arrangement used in the simulation, the amplitude could be reduced by 87.3% compared to operation without injecting higher harmonic currents, which can be clearly seen in the frequency spectrum shown in Figure 7.
Since the algorithm is able to optimize its parameters during operation, it is not necessary to invest too much time in determining the values for the perfect HCI. At the present operating point, the algorithm had adjusted the parameters within 8 s of running time, reducing the amplitude of the 6th harmonic in the torque by 87.0%. As can be seen in Figure 7, the algorithm started at the same level of the 6th harmonic in the torque as would be the case without injection of harmonic currents. A closer look at Figure 6 shows that after a start-up time of about one second the algorithm starts to increase the 5th harmonic in the current step by step and thus the 6th harmonic in the torque decreases step by step. From second 3, a further increase does not bring any further improvement, so a check is first made to see whether the algorithm has run too far by changing the direction of the variation.
Then the algorithm changes the parameter to be varied and changes the phase angle of the 7th harmonic in the current. After this has also reached an optimum, the algorithm switches back to the 5th harmonic and varies it again. Through this alternation, the global optimum was approached systematically. The advantage of the presented method compared to other already known approaches has become clear: With the approach, it is possible to optimise the currents for an HCI without having to set up a complex model of the system or to have it calculated in parallel with the operation on a control unit. The approach approximates the optimum in trial and error mode and determines its procedure directly from the reaction of the machine.
Furthermore, the results from the additional simulation show clearly how the algorithm can make adjustments when the general condition is changed, thus reducing the amplitude of the 6th harmonic in the torque again. An HCI with fixed values or modells with fixed parameters, as it is often used in the literature is not able to do this. This illustrates the superiority of the approach presented in this paper for an adaptive HCI that can adjust the HCI parameters using sensor signals from the machine.
The results from the run-up, shown in Figure S2 in Supplementary Materials, allow three conclusions to be drawn. First, it shows that dividing the operating range into individual sections and accessing the respective parameters in the lookup table works. When the torque reaches a new section, the values of the phase shift jump to the respective stored value and the Harmonic Current Injection can be used immediately without delay or calculation. Figure S2 in Supplementary Materials also shows where the parameters already fit better or are already optimised by the algorithm, and where the torque fluctuation is still quite high (for example, between seconds 4.5 and 5.5).
Second, the method of extracting the sixth harmonic in the torque, which is described in Section 2.2.1, can cause a strong error at low speeds. When the machine starts up, large amplitudes can be seen in the torque that do not actually occur in the machine (see Figure S2 in Supplementary Materials 0–2 s). These are the result of a mathematical error.
Third, what can also be seen, is the inertia of the optimisation process in the transient state. The sections of the lookup table are run through so quickly during the run-up that the algorithm does not have a chance to work. Therefore, with a few exceptions, only the jumps at the section change are visible in the phase shifts and no fine adjustments within the section.
The simulation result shown in Figure S3 in Supplementary Materials is different, where the slower ramp-up gives the algorithm time to react to the changes. It can be seen how with each new section, the torque fluctuations increase at first because the parameters of the HCI do not fit completely. However, within a short time the algorithm adjusts the parameters and reduces the fluctuations. So if given enough time, the algorithm presented in Section 2 can reduce the torque fluctuations online even in transient processes.
In this publication, we have used a permanent magnet synchronous machine with buried magnets in the performance category of about 150 kW. However, the approach of adjusting HCI parameters by means of direct feedback from the electrical machine itself is neither limited to this machine type nor to this performance category. If a reaction of the machine can be detected and an HCI for the machine is possible, the approach can be used.
As an outlook for future work, the experimental proof of this method should be mentioned. In addition, the amplitude ratio in Section 2.1.1 was set to a fixed ratio in relation to the amplitude of the fundamental wave. In future work, an optimisation can be found here so that the amplitude ratio is either also varied or is determined by a lookup table for different states. Furthermore, it would be possible to include other boundary conditions in the algorithm in addition to the sensor data and thus extend the lookup table by corresponding dimensions. These could be, for example, the temperature or the humidity.
Supplementary Materials
The following are available online at https://0-www-mdpi-com.brum.beds.ac.uk/article/10.3390/machines9080139/s1, Figure S1: Amplitude of the 6th harmonic in the torque over the step of the general conditions, Figure S2: Top: Amplitude of the 6th harmonic in the torque. 2nd: Speed of the rotor. 3rd: Phase angle of the 5th and 7th harmonics in the current. Bottom: Amplitudes of the 5th and 7th harmonics in the current, Figure S3: Top: Amplitude of the 6th harmonic in the torque. 2nd: Speed of the rotor. 3rd: Phase angle of the 5th and 7th harmonics in the current. Bottom: Amplitudes of the 5th and 7th harmonics in the current.
Author Contributions
Conceptualization, M.V. and D.K.; methodology, M.V.; software, M.V. and D.K.; validation, M.V., D.K. and F.G.; formal analysis, M.V. and D.K.; investigation, M.V.; resources, F.G.; data curation, M.V.; writing—original draft preparation, M.V.; writing—review and editing, D.K. and F.G.; visualization, M.V.; supervision, F.G.; project administration, F.G.; funding acquisition, F.G. All authors have read and agreed to the published version of the manuscript.
Funding
This research received no external funding.
Data Availability Statement
The data are not publicly available due to legal restrictions.
Conflicts of Interest
The authors declare no conflict of interest.
References
- Kraftfahrt-Bundesamt—Monatliche Neuzulassungen. Available online: https://www.kba.de/DE/Statistik/Fahrzeuge/Neuzulassungen/MonatlicheNeuzulassungen/monatl_neuzulassungen_node.html (accessed on 13 April 2021).
- Elektroautos—Verkaufszahlen Weltweit 2020 | Statista. Available online: https://de.statista.com/statistik/daten/studie/406683/umfrage/anzahl-der-verkaeufe-von-elektroautos-weltweit-prognose/#statisticContainer (accessed on 13 April 2021).
- Swart, D.J. The Psychoacoustics of Electric Vehicle Signature Sound. Ph.D. Thesis, Faculty of Engineering at Stellenbosch University, Stellenbosch, South-Africa, 2018. [Google Scholar]
- Genuit, K.; Fiebig, A. Sound design of electric vehicles—Challenges and risks. In Proceedings of the INTER-NOISE and NOISE-CON Congress and Conference Proceedings, Melbourne, VIC, Australia, 16–19 November 2014. [Google Scholar]
- Swart, D.J.; Bekker, A.; Bienert, J. The comparison and analysis of standard production electric vehicle drive-train noise. Int. J. Veh. Noise Vib. 2016, 12, 260. [Google Scholar] [CrossRef]
- Petkovska, L.; Cvetkovski, G.; Lefley, P. Analysis of the stator topology impact on cogging torque for surface permanent magnet motor. COMPEL Int. J. Comput. Math. Electr. Electron. Eng. 2015, 34, 456–474. [Google Scholar] [CrossRef] [Green Version]
- Hwang, M.-H.; Lee, H.-S.; Cha, H.-R. Analysis of Torque Ripple and Cogging Torque Reduction in Electric Vehicle Traction Platform Applying Rotor Notched Design. Energies 2018, 11, 3053. [Google Scholar] [CrossRef] [Green Version]
- Takbash, A.; Ibrahim, M.; Pillay, P. Torque ripple reduction of a variable flux motor. In Proceedings of the 2016 IEEE Energy Conversion Congress and Exposition (ECCE), Milwaukee, WI, USA, 18–22 September 2016; pp. 1–7. [Google Scholar] [CrossRef]
- Huang, S.; Zhang, J.; Gao, J.; Huang, K. Optimization the Electromagnetic Torque Ripple of Permanent Magnet Synchronous Motor. In Proceedings of the 2010 International Conference on Electrical and Control Engineering, Wuhan, China, 25–27 June 2010; pp. 3969–3972. [Google Scholar] [CrossRef]
- Azar, Z.; Zhu, Z.Q.; Ombach, G. Influence of Electric Loading and Magnetic Saturation on Cogging Torque, Back-EMF and Torque Ripple of PM Machines. IEEE Trans. Magn. 2012, 48, 2650–2658. [Google Scholar] [CrossRef]
- Chu, W.Q.; Zhu, Z.Q. Reduction of On-Load Torque Ripples in Permanent Magnet Synchronous Machines by Improved Skewing. IEEE Trans. Magn. 2013, 49, 3822–3825. [Google Scholar] [CrossRef]
- Yongchang, Z.; Jianguo, Z.; Wei, X. Predictive torque control of permanent magnet synchronous motor drive with reduced switching frequency. In Proceedings of the 2010 International Conference on Electrical Machines and Systems, Incheon, Korea, 10–13 October 2010. [Google Scholar]
- Kao, W.-T.; Hwang, J.-C.; Liu, J.-E. Development of Three-Phase Permanent-Magnet Synchronous Motor Drive with Strategy to Suppress Harmonic Current. Energies 2021, 14, 1583. [Google Scholar] [CrossRef]
- Liang, Q.; Wei, F.; Li, Z.; Deng, Y.; Wang, Y. Torque Ripple Suppression of Permanent Magnet Synchronous Motor Based On Robust Current Injection. IOP Conf. Ser. Mater. Sci. Eng. 2020, 782, 32082. [Google Scholar] [CrossRef] [Green Version]
- Sumega, M.; Rafajdus, P.; Stulrajter, M. Current Harmonics Controller for Reduction of Acoustic Noise, Vibrations and Torque Ripple Caused by Cogging Torque in PM Motors under FOC Operation. Energies 2020, 13, 2534. [Google Scholar] [CrossRef]
- Yan, L.; Liao, Y.; Lin, H.; Sun, J. Torque ripple suppression of permanent magnet synchronous machines by minimal harmonic current injection. IET Power Electron. 2019, 12, 1368–1375. [Google Scholar] [CrossRef]
- Harries, M.; Hensgens, M.; de Doncker, R.W. Noise Reduction Via Harmonic Current Injection for Concentrated-Winding Permanent Magnet Synchronous Machines. In Proceedings of the 21st International Conference on Electrical Machines and Systems (ICEMS), Jeju, Korea, 7–10 October 2018; pp. 1157–1162. [Google Scholar] [CrossRef]
- Zheng, H.; Zhang, J.; Wang, X.; Zhong, Q. Research on Torque Ripple Reduction of Direct-drive Permanent Magnet Wind Power System. In Proceedings of the 39th Chinese Control Conference, Shenyang, China, 27–29 July 2020; pp. 5276–5281. [Google Scholar] [CrossRef]
- Chen, Z.; Li, Z.; Ma, H. A harmonic current injection method for electromagnetic torque ripple suppression in permanent-magnet synchronous machines. JAE 2017, 53, 327–336. [Google Scholar] [CrossRef]
- Feng, G.; Lai, C.; Kar, N.C. Practical Testing Solutions to Optimal Stator Harmonic Current Design for PMSM Torque Ripple Minimization Using Speed Harmonics. IEEE Trans. Power Electron. 2018, 33, 5181–5191. [Google Scholar] [CrossRef]
- Jędryczka, C.; Danielczyk, D.; Szeląg, W. Torque Ripple Minimization of the Permanent Magnet Synchronous Machine by Modulation of the Phase Currents. Sensors 2020, 20, 2406. [Google Scholar] [CrossRef] [PubMed] [Green Version]
- Gómez-Espinosa, A.; Hernández-Guzmán, V.M.; Bandala-Sánchez, M.; Jiménez-Hernández, H.; Rivas-Araiza, E.A.; Rodríguez-Reséndiz, J.; Herrera-Ruíz, G. A new adaptive self-tuning Fourier coefficients algorithm for periodic torque ripple minimization in permanent magnet synchronous motors (PMSM). Sensors 2013, 13, 3831–3847. [Google Scholar] [CrossRef] [PubMed]
- Ametani, A. Generalised method of harmonic reduction in a.c.-d.c. convertors by harmonic current injection. Proc. Inst. Electr. Eng. 1972, 119, 857. [Google Scholar] [CrossRef]
- Favre, E.; Cardoletti, L.; Jufer, M. Permanent-magnet synchronous motors: A comprehensive approach to cogging torque suppression. IEEE Trans. Ind. Applicat. 1993, 29, 1141–1149. [Google Scholar] [CrossRef]
- Hwang, J.-C.; Wei, H.-T. The Current Harmonics Elimination Control Strategy for Six-Leg Three-Phase Permanent Magnet Synchronous Motor Drives. IEEE Trans. Power Electron. 2014, 29, 3032–3040. [Google Scholar] [CrossRef]
- Yuan, L.; Chen, M.-L.; Shen, J.-Q.; Xiao, F. Current harmonics elimination control method for six-phase PM synchronous motor drives. ISA Trans. 2015, 59, 443–449. [Google Scholar] [CrossRef] [PubMed]
- Jia, H.; Cheng, M.; Hua, W.; Zhao, W.; Li, W. Torque Ripple Suppression in Flux-Switching PM Motor by Harmonic Current Injection Based on Voltage Space-Vector Modulation. IEEE Trans. Magn. 2010, 46, 1527–1530. [Google Scholar] [CrossRef]
- Pham, T.H.; Wendling, P. Current Harmonics Injection Table to Minimize Torque Ripples for Electric Powertrain Interior Permanent Magnet Motor Over Maximum Torque-Speed Curve. In Proceedings of the 2019 IEEE Transportation Electrification Conference and Expo (ITEC), Detroit, MI, USA, 19–21 June 2019; pp. 1–6. [Google Scholar] [CrossRef]
- Jiang, X.; Zhu, Y.; Hong, J.; Chen, X.; Zhang, Y. Investigation into the loosening mechanism of bolt in curvic coupling subjected to transverse loading. Eng. Fail. Anal. 2013, 32, 360–373. [Google Scholar] [CrossRef]
- Gyftakis, K.N.; Sumislawska, M.; Kavanagh, D.F.; Howey, D.A.; McCulloch, M. Dielectric Characteristics of Electric Vehicle Traction Motor Winding Insulation under Thermal Ageing. IEEE Trans. Ind. Applicat. 2015, 1. [Google Scholar] [CrossRef]
- Chou, H.-W.; Huang, J.-S.; Lin, S.-T. Effects of thermal aging on fatigue of carbon black–reinforced EPDM rubber. J. Appl. Polym. Sci. 2007, 103, 1244–1251. [Google Scholar] [CrossRef]
- Veltman, A.; Pulle, D.W.J.; de Doncker, R.W. Fundamentals of Electrical Drives, 2nd ed.; Springer International Publishing: Cham, Switzerland, 2016. [Google Scholar]
- Schröder, D. Elektrische Antriebe—Grundlagen, 5th ed.; Springer: Berlin/Heidelberg, Germany, 2013. [Google Scholar]
- Park, R.H. Two Reaction Theory of Synchronous Machines. Generalized Method of Analysis—Part 1. Trans. Am. Inst. Electr. Eng. 1929, 48, 716–727. [Google Scholar] [CrossRef]
- Park, R.H. Two Reaction Theory of Synchronous Machines—Part 2. Trans. Am. Inst. Electr. Eng. 1933, 52, 352–354. [Google Scholar] [CrossRef]
- Tolstov, G.P. Fourier Series; Dover Publications (Dover Books on Mathematics): Newburyport, MA, USA, 2012. [Google Scholar]
- Najmabadi, A.; Xu, W.; Degner, M. A Sensitivity Analysis on the Fifth and the Seventh Harmonic Current Injection for Sixth Order Torque Ripple Reduction. In Proceedings of the 2017 IEEE International Electric Machines and Drives Conference (IEMDC), Miami, FL, USA, 21–24 May 2017. [Google Scholar]
Figure 1.
Blue: Ratio of the amplitude of the 6th harmonic in the torque to the constant torque in percent in the armature range over the maximum load in percent. Orange: Average value over the full operating range.
Figure 1.
Blue: Ratio of the amplitude of the 6th harmonic in the torque to the constant torque in percent in the armature range over the maximum load in percent. Orange: Average value over the full operating range.

Figure 2.
(a) Course of the optimization of the phase angle for a single operating point (150 A of the fundamental wave ). The color gradient indicates the magnitude of the amplitude of the 6th harmonic in the torque in Nm. (b) Result of optimization for each operating point at a fixed velocity plotted in a single diagram. The numbers indicate the corresponding value of the fundamental wave of the current for individual points.

Figure 3.
Schematic layout of the control structure, represented by a simplified block diagram.

Figure 4.
Block diagram of the module attached to the field-oriented control to implement the HCI adapting in online mode.
Figure 4.
Block diagram of the module attached to the field-oriented control to implement the HCI adapting in online mode.

Figure 5.
Simplified flowchart of the algorithm for varying the phase angles of the HCI.

Figure 6.
(Top) Amplitude of the 6th harmonic in the torque. (Bottom) Phase angle of the 5th and 7th harmonics in the current.
Figure 6.
(Top) Amplitude of the 6th harmonic in the torque. (Bottom) Phase angle of the 5th and 7th harmonics in the current.

Figure 7.
Amplitude spectrum for the cases no HCI, HCI on start and HCI after 8s.

Publisher’s Note: MDPI stays neutral with regard to jurisdictional claims in published maps and institutional affiliations. |
© 2021 by the authors. Licensee MDPI, Basel, Switzerland. This article is an open access article distributed under the terms and conditions of the Creative Commons Attribution (CC BY) license (https://creativecommons.org/licenses/by/4.0/).
Share and Cite
MDPI and ACS Style
Vollat, M.; Krahe, D.; Gauterin, F. A Novel Method for Harmonic Current Injection with Sensor Supported Adaptation on Permanent Magnet Synchronous Machines. Machines 2021, 9, 139. https://0-doi-org.brum.beds.ac.uk/10.3390/machines9080139
AMA Style
Vollat M, Krahe D, Gauterin F. A Novel Method for Harmonic Current Injection with Sensor Supported Adaptation on Permanent Magnet Synchronous Machines. Machines. 2021; 9(8):139. https://0-doi-org.brum.beds.ac.uk/10.3390/machines9080139
Chicago/Turabian StyleVollat, Matthias, Dominik Krahe, and Frank Gauterin. 2021. "A Novel Method for Harmonic Current Injection with Sensor Supported Adaptation on Permanent Magnet Synchronous Machines" Machines 9, no. 8: 139. https://0-doi-org.brum.beds.ac.uk/10.3390/machines9080139
Note that from the first issue of 2016, this journal uses article numbers instead of page numbers. See further details here.