
The Clinical Influence after Implementation of Convolutional Neural Network-Based Software for Diabetic Retinopathy Detection in the Primary Care Setting

 ,
,
Abstract
:1. Introduction
2. Materials and Methods
2.1. Setting and Participants
2.2. Retinal Imaging
2.3. Reference Grading
2.4. The Deep Learning Algorithm
2.5. Clinical Workflow
2.6. Statistical Analysis
3. Results
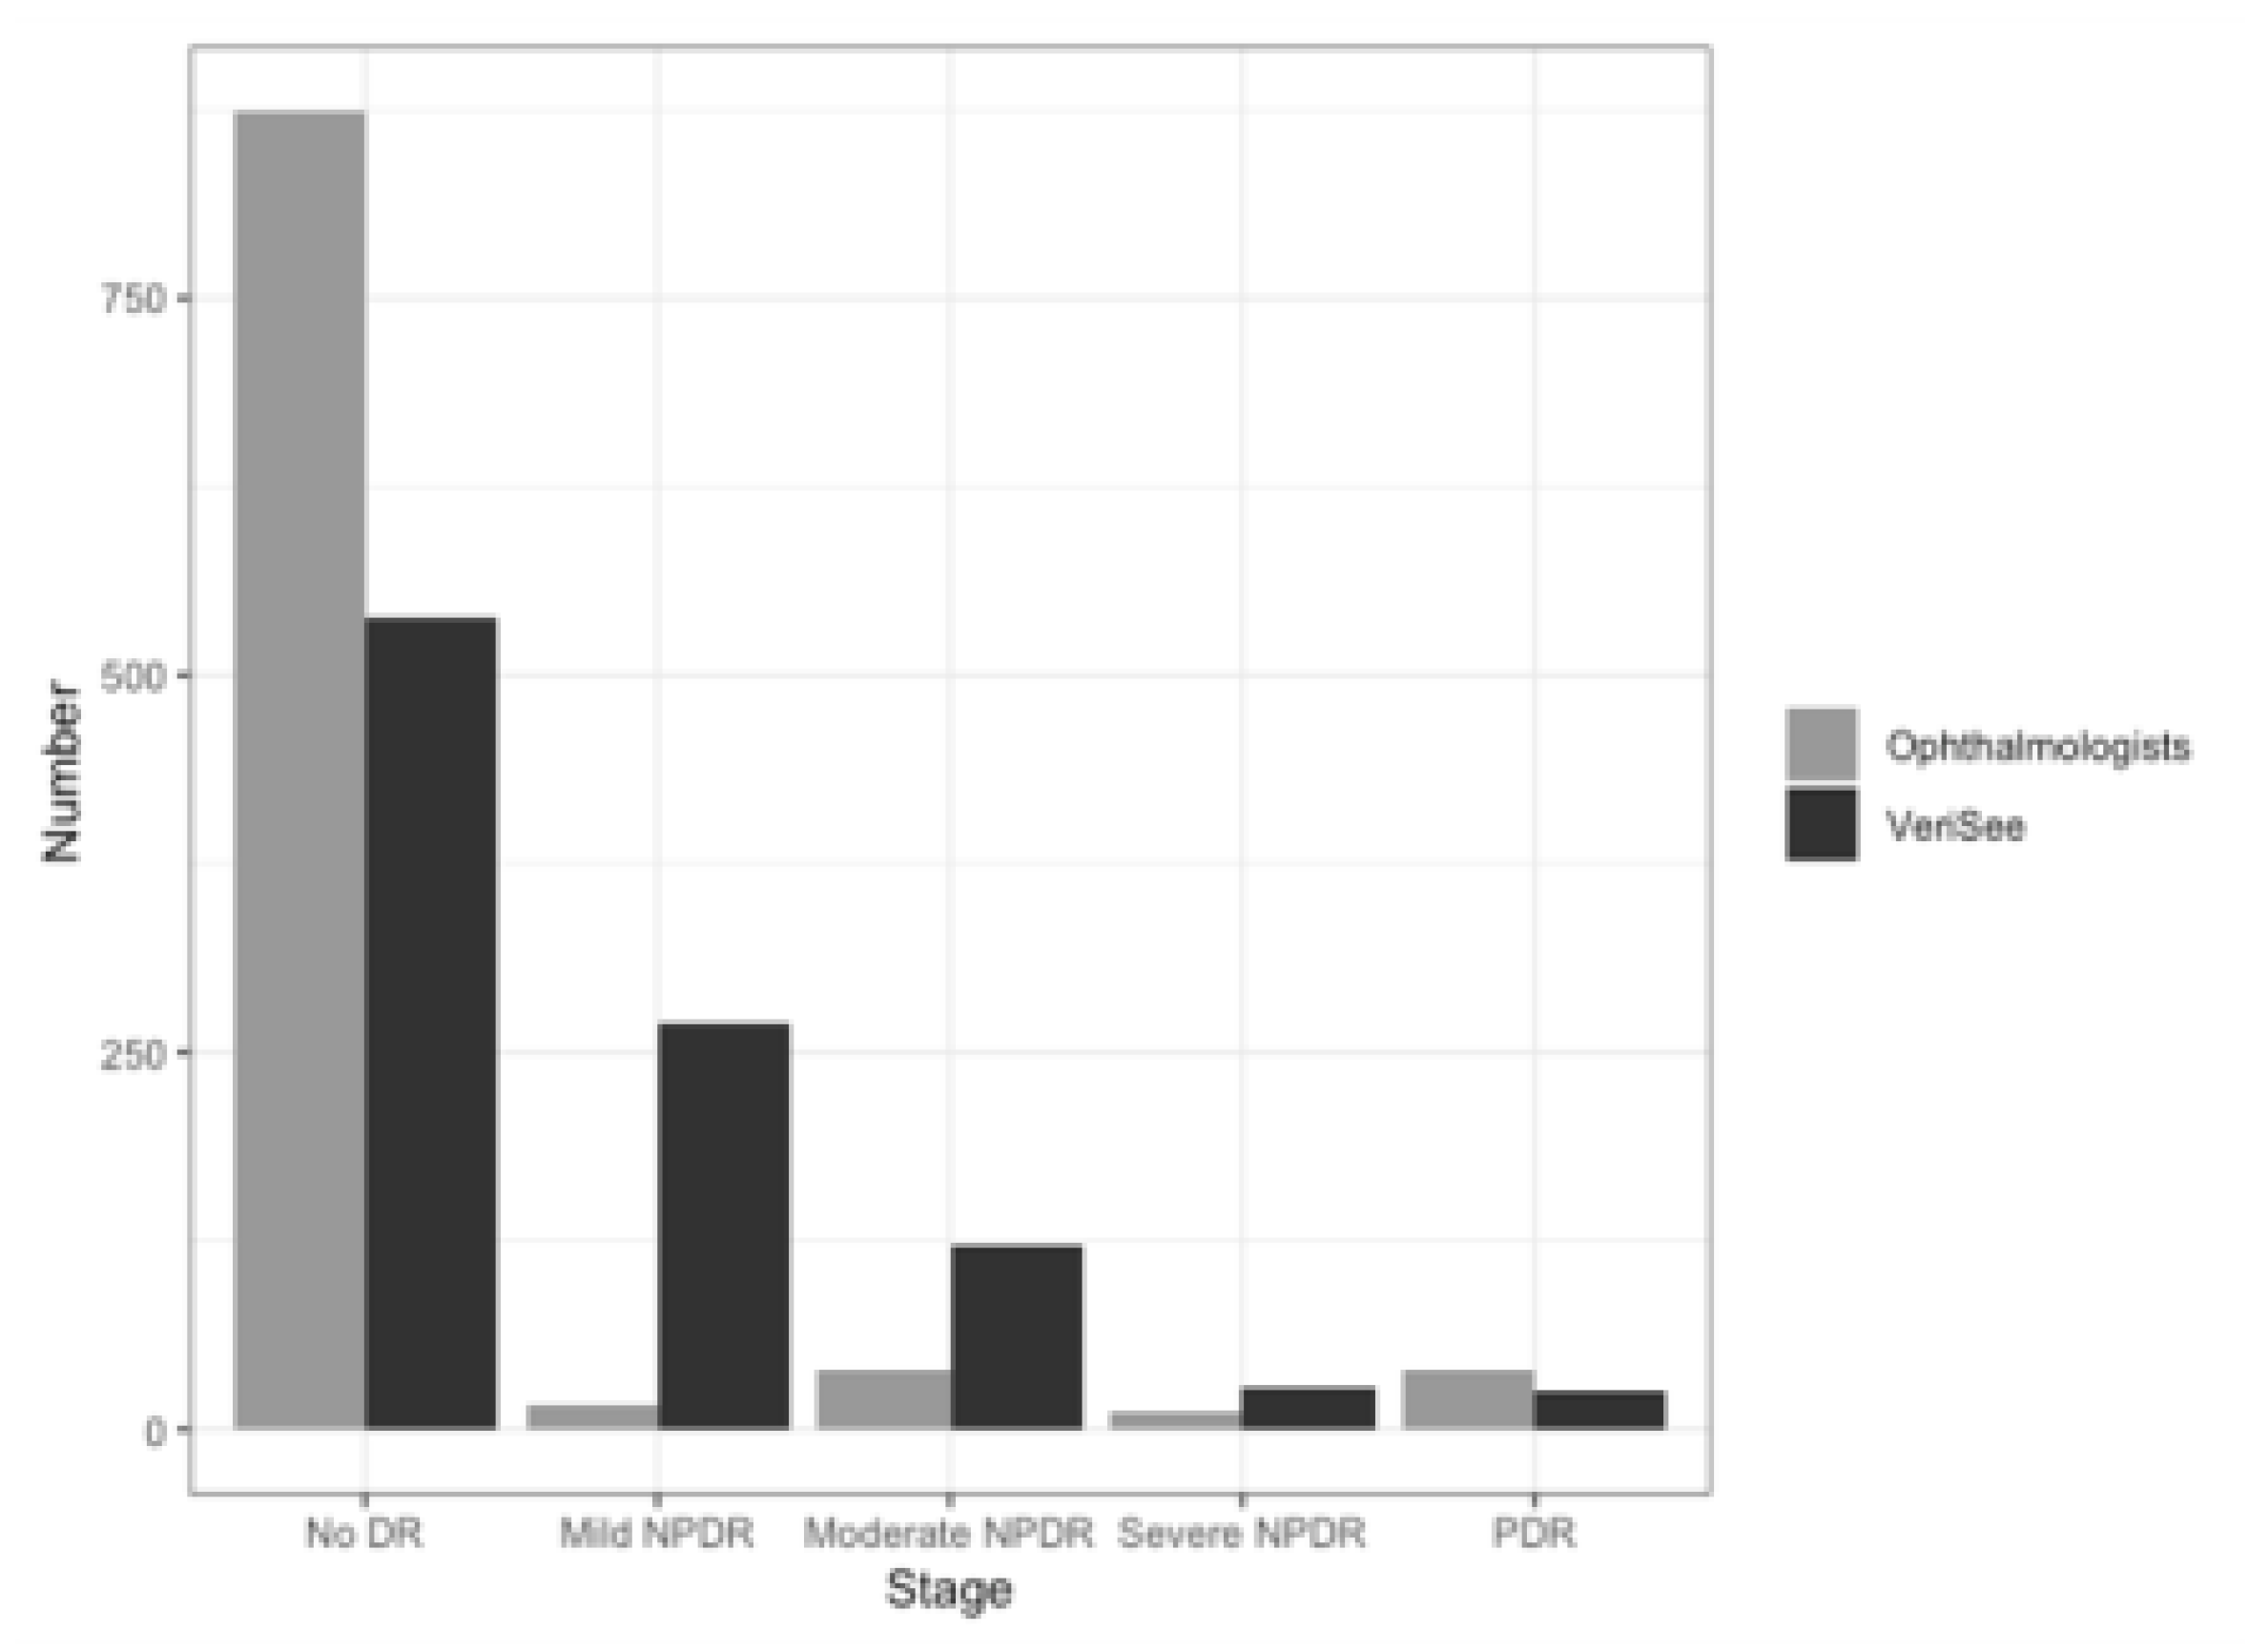
3.1. Patients and Images
3.2. Sensitivity, Specificity, and AUC of the Software at the Image Level
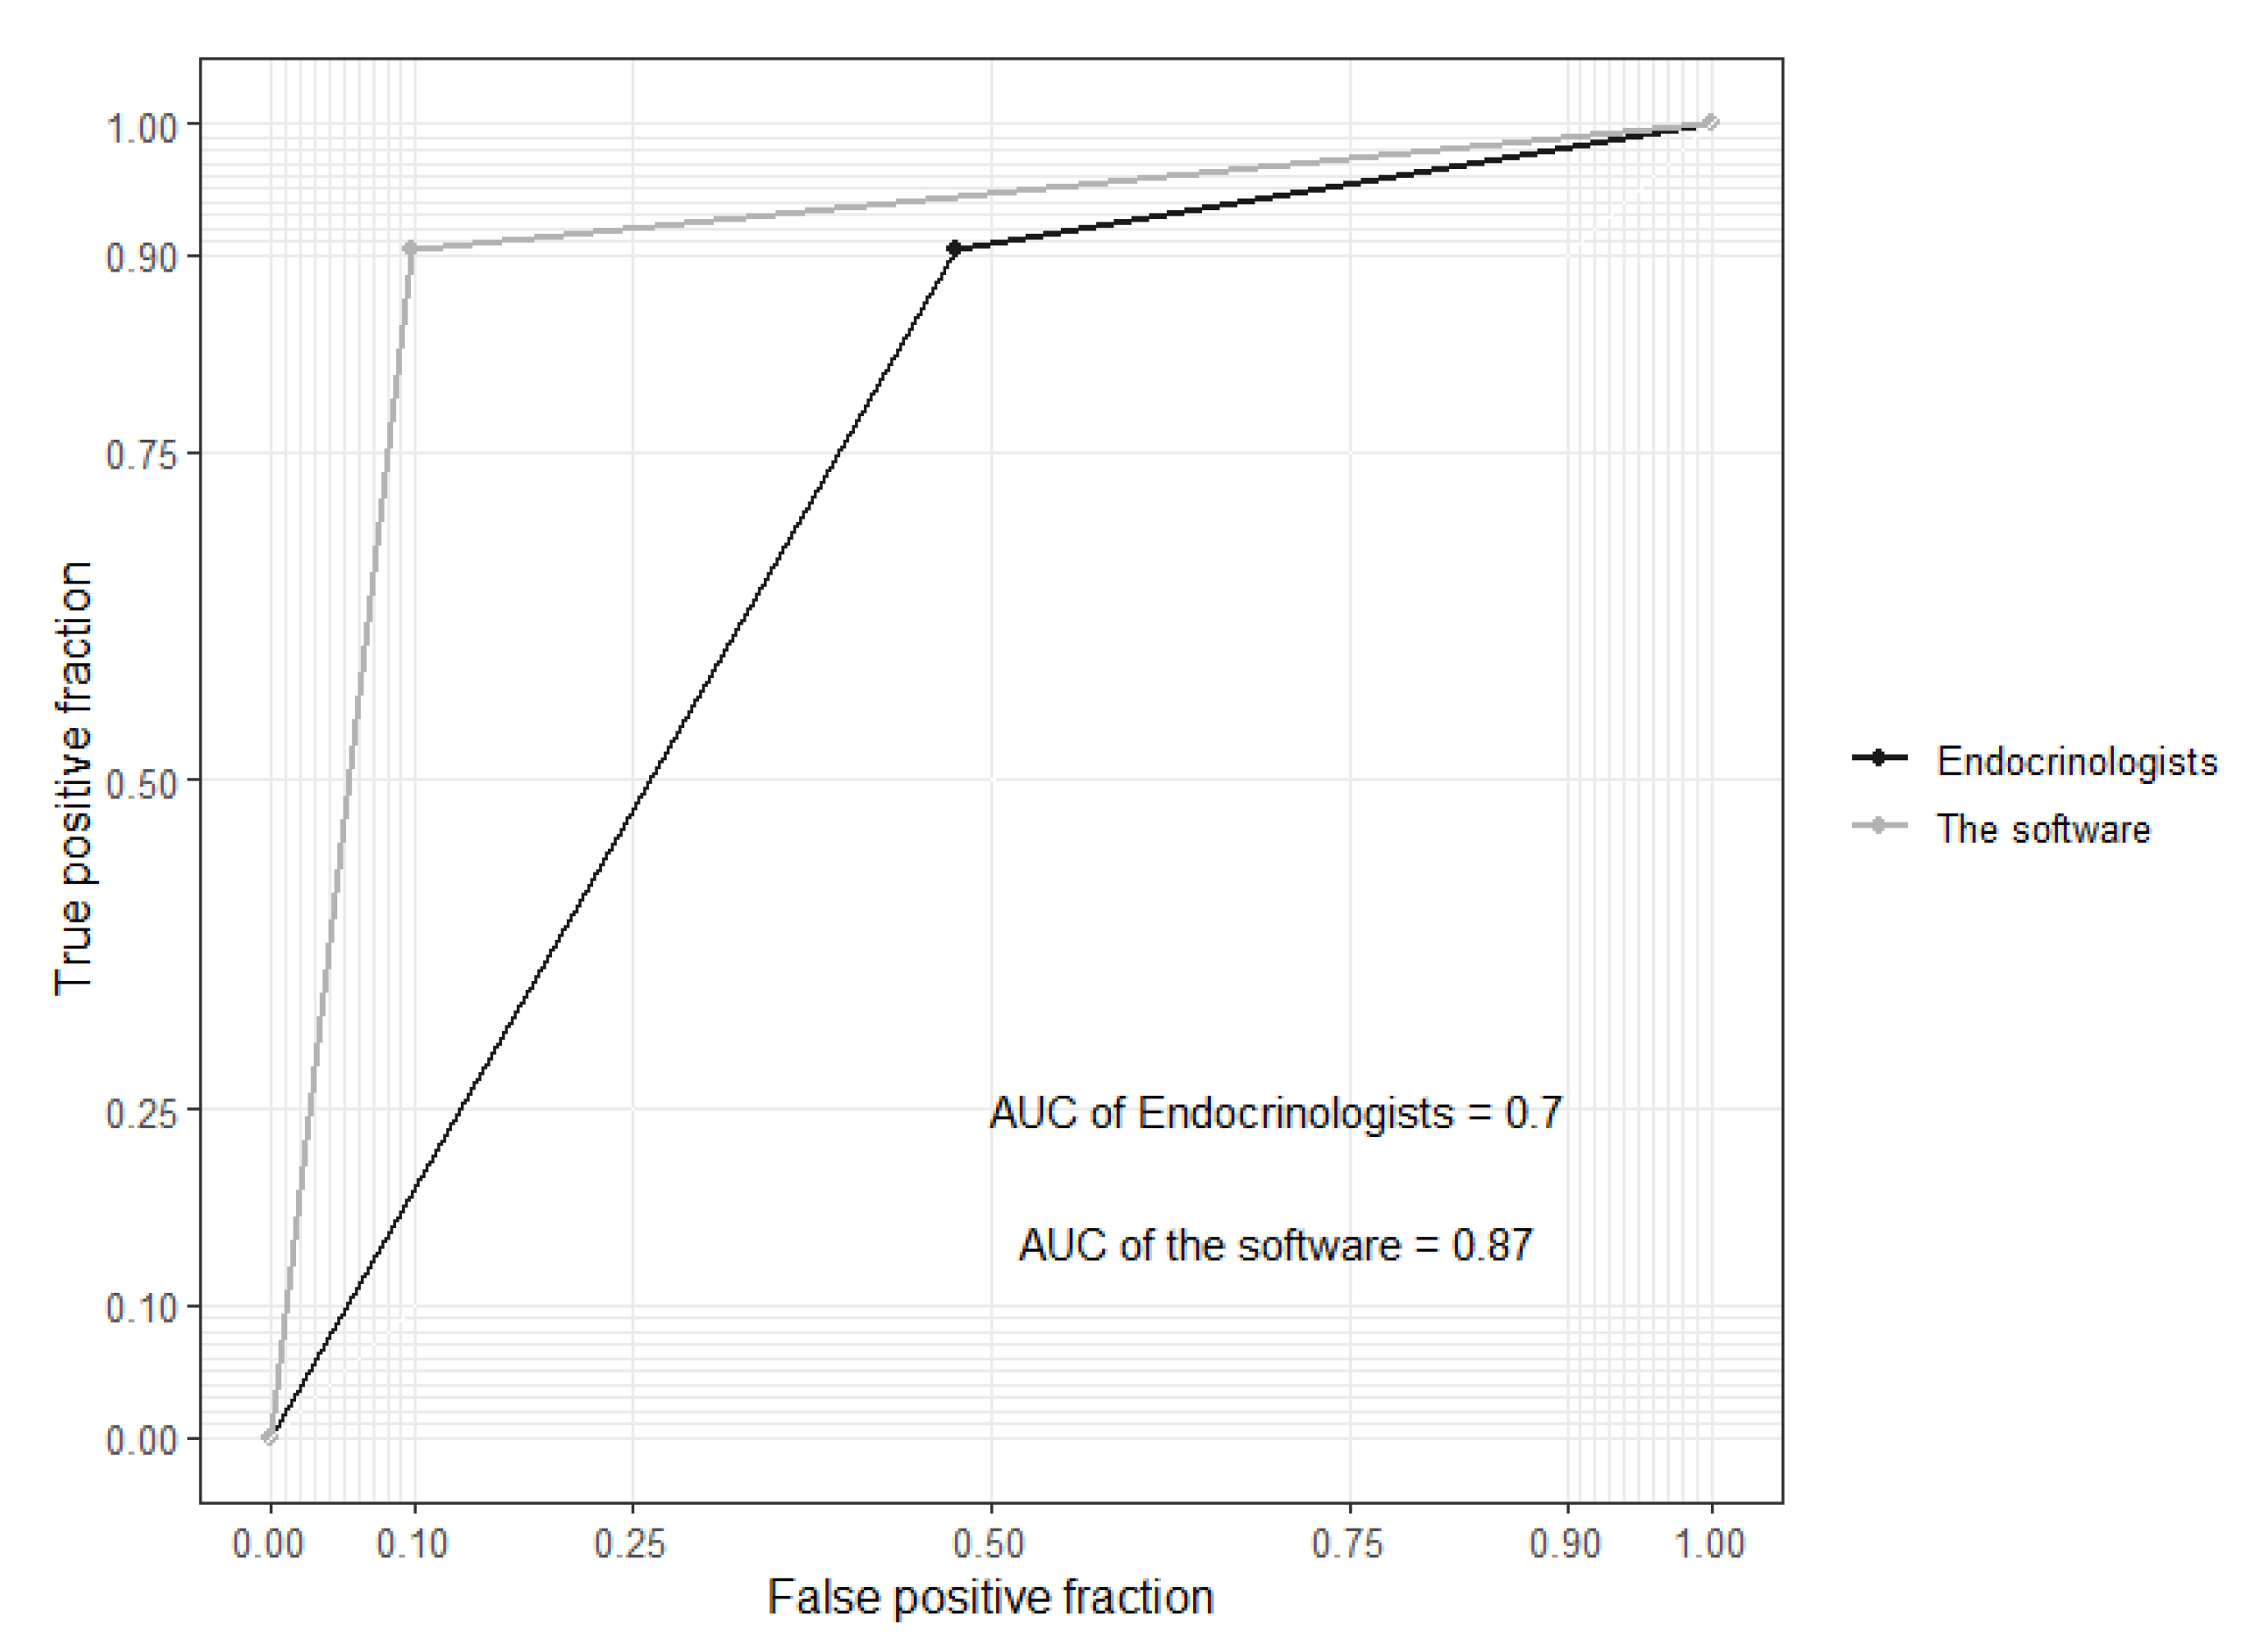
3.3. Sensitivity, Specificity, and AUC at the Patient Level
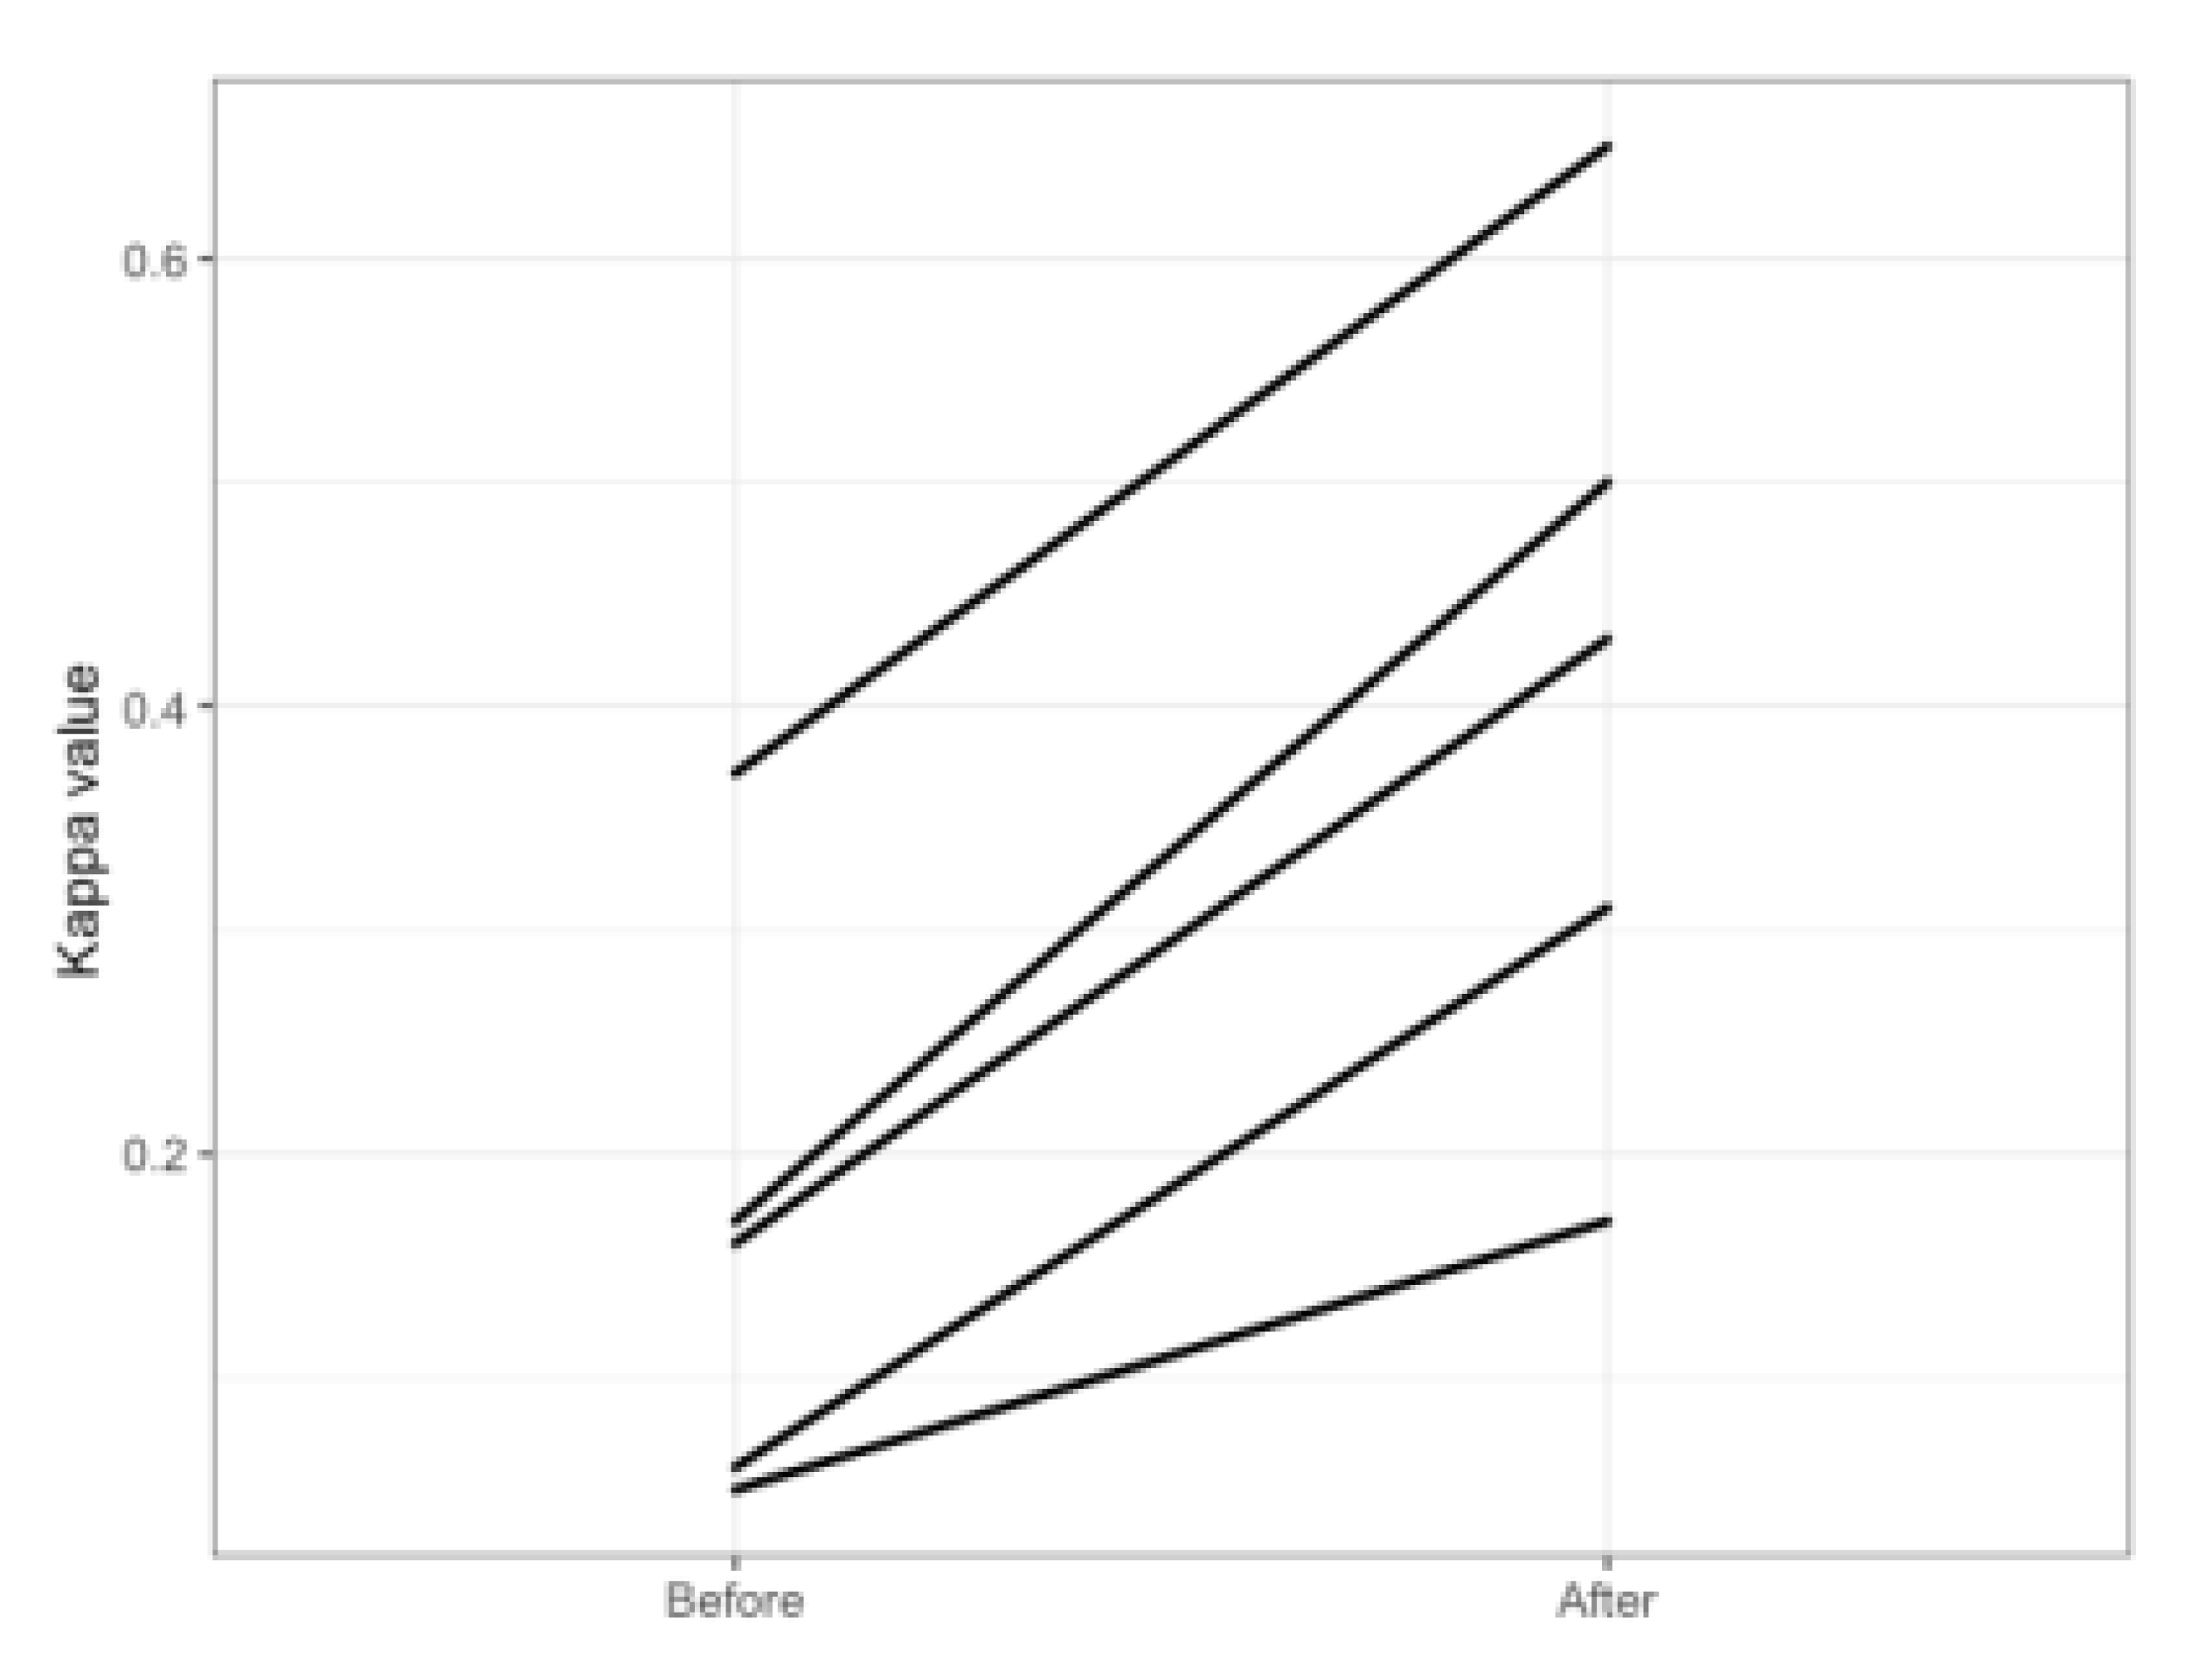
3.4. Comparison before and after Implementation of the Software
4. Discussion
5. Conclusions
Supplementary Materials
Author Contributions
Funding
Institutional Review Board Statement
Informed Consent Statement
Data Availability Statement
Acknowledgments
Conflicts of Interest
References
- Cheung, N.; Mitchell, P.; Wong, T.Y. Diabetic retinopathy. Lancet 2010, 376, 124–136. [Google Scholar] [CrossRef]
- Benoit, S.R.; Swenor, B.; Geiss, L.S.; Gregg, E.W.; Saaddine, J.B. Eye Care Utilization Among Insured People With Diabetes in the U.S., 2010–2014. Diabetes Care 2019, 42, 427–433. [Google Scholar] [CrossRef] [Green Version]
- Ruta, L.M.; Magliano, D.J.; LeMesurier, R.; Taylor, H.R.; Zimmet, P.Z.; Shaw, J.E. Prevalence of diabetic retinopathy in Type 2 diabetes in developing and developed countries. Diabet. Med. 2013, 30, 387–398. [Google Scholar] [CrossRef]
- Yau, J.W.; Rogers, S.L.; Kawasaki, R.; Lamoureux, E.L.; Kowalski, J.W.; Bek, T.; Chen, S.-J.; Dekker, J.M.; Fletcher, A.; Grauslund, J.; et al. Global Prevalence and Major Risk Factors of Diabetic Retinopathy. Diabetes Care 2012, 35, 556–564. [Google Scholar] [CrossRef] [Green Version]
- Lin, J.-C.; Shau, W.-Y.; Lai, M.-S. Sex- and Age-Specific Prevalence and Incidence Rates of Sight-Threatening Diabetic Retinopathy in Taiwan. JAMA Ophthalmol. 2014, 132, 922–928. [Google Scholar] [CrossRef] [PubMed] [Green Version]
- Wang, L.Z.; Cheung, C.Y.; Tapp, R.J.; Hamzah, H.; Tan, G.; Ting, D.; Lamoureux, E.; Wong, T.Y. Availability and variability in guidelines on diabetic retinopathy screening in Asian countries. Br. J. Ophthalmol. 2017, 101, 1352–1360. [Google Scholar] [CrossRef] [PubMed]
- Lin, K.-D.; Hsu, C.-C.; Ou, H.-Y.; Wang, C.-Y.; Chin, M.-C.; Shin, S.-J. Diabetes-related kidney, eye, and foot disease in Taiwan: An analysis of nationwide data from 2005 to 2014. J. Formos. Med. Assoc. 2019, 118 (Suppl. 2), S103–S110. [Google Scholar] [CrossRef] [PubMed]
- Wong, T.Y.; Sun, J.; Kawasaki, R.; Ruamviboonsuk, P.; Gupta, N.; Lansingh, V.C.; Maia, M.; Mathenge, W.; Moreker, S.; Muqit, M.M.; et al. Guidelines on Diabetic Eye Care: The International Council of Ophthalmology Recommendations for Screening, Follow-up, Referral, and Treatment Based on Resource Settings. Ophthalmology 2018, 125, 1608–1622. [Google Scholar] [CrossRef] [Green Version]
- American Diabetes, Association. 11. Microvascular Complications and Foot Care: Standards of Medical Care in Diabetes-2020. Diabetes Care 2020, 43, S135–S51. [Google Scholar] [CrossRef] [PubMed] [Green Version]
- Piyasena, M.M.P.N.; Murthy, G.V.S.; Yip, J.L.Y.; Gilbert, C.; Zuurmond, M.; Peto, T.; Gordon, I.; Hewage, S.; Kamalakannan, S. Systematic review on barriers and enablers for access to diabetic retinopathy screening services in different income settings. PLoS ONE 2019, 14, e0198979. [Google Scholar] [CrossRef]
- Gulshan, V.; Peng, L.; Coram, M.; Stumpe, M.C.; Wu, D.; Narayanaswamy, A.; Venugopalan, S.; Widner, K.; Madams, T.; Cuadros, J.; et al. Development and Validation of a Deep Learning Algorithm for Detection of Diabetic Retinopathy in Retinal Fundus Photographs. JAMA 2016, 316, 2402–2410. [Google Scholar] [CrossRef] [PubMed]
- Ting, D.S.W.; Cheung, C.Y.-L.; Lim, G.; Tan, G.S.W.; Quang, N.D.; Gan, A.; Hamzah, H.; Garcia-Franco, R.; Yeo, I.Y.S.; Lee, S.Y.; et al. Development and Validation of a Deep Learning System for Diabetic Retinopathy and Related Eye Diseases Using Retinal Images From Multiethnic Populations With Diabetes. JAMA 2017, 318, 2211–2223. [Google Scholar] [CrossRef]
- Li, Z.; Keel, S.; Liu, C.; He, Y.; Meng, W.; Scheetz, J.; Lee, P.Y.; Shaw, J.; Ting, D.; Wong, T.Y.; et al. An Automated Grading System for Detection of Vision-Threatening Referable Diabetic Retinopathy on the Basis of Color Fundus Photographs. Diabetes Care 2018, 41, 2509–2516. [Google Scholar] [CrossRef] [Green Version]
- Coiera, E. The fate of medicine in the time of AI. Lancet 2018, 392, 2331–2332. [Google Scholar] [CrossRef]
- Kelly, C.J.; Karthikesalingam, A.; Suleyman, M.; Corrado, G.; King, D. Key challenges for delivering clinical impact with artificial intelligence. BMC Med. 2019, 17, 195. [Google Scholar] [CrossRef] [Green Version]
- Abràmoff, M.D.; Lavin, P.T.; Birch, M.; Shah, N.; Folk, J.C. Pivotal trial of an autonomous AI-based diagnostic system for detection of diabetic retinopathy in primary care offices. NPJ Digit. Med. 2018, 1, 39. [Google Scholar] [CrossRef] [PubMed]
- Raumviboonsuk, P.; Krause, J.; Chotcomwongse, P.; Sayres, R.; Raman, R.; Widner, K.; Campana, B.J.; Phene, S.; Hemarat, K.; Tadarati, M.; et al. Deep learning versus human graders for classifying diabetic retinopathy severity in a nationwide screening program. NPJ Digit. Med. 2019, 2, 25. [Google Scholar] [CrossRef] [Green Version]
- Hsieh, Y.-T.; Chuang, L.-M.; Jiang, Y.-D.; Chang, T.-J.; Yang, C.-M.; Yang, C.-H.; Chan, L.-W.; Kao, T.-Y.; Chen, T.-C.; Lin, H.-C.; et al. Application of deep learning image assessment software VeriSeeTM for diabetic retinopathy screening. J. Formos. Med. Assoc. 2021, 120, 165–171. [Google Scholar] [CrossRef]
- Chen, Y.C.; Lee, C.T.; Lin, B.J.; Chang, Y.Y.; Shi, H.Y. Impact of pay-for-performance on mortality in diabetes patients in Taiwan: A population-based study. Medicine 2016, 95, e4197. [Google Scholar] [CrossRef]
- Szegedy, C.; Ioffe, S.; Vanhoucke, V.; Alemi, A. Inception-v4, inception-resnet and the impact of residual connections on learning. arXiv 2016, arXiv:1602.07261. [Google Scholar]
- Chen, M.-S.; Kao, C.-S.; Chang, C.-J.; Wu, T.-J.; Fu, C.-C.; Chen, C.-J.; Tai, T.-Y. Prevalence and Risk Factors of Diabetic Retinopathy Among Noninsulin-dependent Diabetic Subjects. Am. J. Ophthalmol. 1992, 114, 723–730. [Google Scholar] [CrossRef]
- Sheu, S.-J.; Liu, N.-C.; Ger, L.-P.; Ho, W.-L.; Lin, J.-Y.; Chen, S.-C.; Horng, Y.-H.; Lam, H.-C. High HbA1c level was the most important factor associated with prevalence of diabetic retinopathy in Taiwanese type II diabetic patients with a fixed duration. Graefe’s Arch. Clin. Exp. Ophthalmol. 2013, 251, 2087–2092. [Google Scholar] [CrossRef]
- Cohen, J. Weighted kappa: Nominal scale agreement provision for scaled disagreement or partial credit. Psychol. Bull. 1968, 70, 213–220. [Google Scholar] [CrossRef]
- Verbraak, F.D.; Abramoff, M.D.; Bausch, G.C.; Klaver, C.; Nijpels, G.; Schlingemann, R.O.; Van Der Heijden, A.A. Diagnostic Accuracy of a Device for the Automated Detection of Diabetic Retinopathy in a Primary Care Setting. Diabetes Care 2019, 42, 651–656. [Google Scholar] [CrossRef] [PubMed] [Green Version]
- Fier, R.H. Diagnosis of diabetic eye disease. JAMA 1982, 248, 2973. [Google Scholar] [CrossRef] [PubMed]
- Cunha, L.P.; Figueiredo, E.A.; Araújo, H.P.; Costa-Cunha, L.V.F.; Costa, C.F.; Neto, J.D.M.C.; Matos, A.M.F.; De Oliveira, M.M.; Bastos, M.G.; Monteiro, M.L.R. Non-Mydriatic Fundus Retinography in Screening for Diabetic Retinopathy: Agreement Between Family Physicians, General Ophthalmologists, and a Retinal Specialist. Front. Endocrinol. 2018, 9, 251. [Google Scholar] [CrossRef] [PubMed] [Green Version]
- Hutchinson, A.; McIntosh, A.; Peters, J.; O’Keeffe, C.; Khunti, K.; Baker, R.; Booth, A. Effectiveness of screening and monitoring tests for diabetic retinopathy—A systematic review. Diabet. Med. 2000, 17, 495–506. [Google Scholar] [CrossRef]
- Marks, J.B. Nonmydriatic fundus photography in screening for treatable diabetic retinopathy. J. Diabetes Complicat. 1992, 6, 247–253. [Google Scholar] [CrossRef]


| VeriSeeTM | |
|---|---|
| Number of patients | - |
| Number of images | 981 |
| Sensitivity (95% CI) | 0.91 (0.83–0.96) |
| Specificity (95% CI) | 0.90 (0.87–0.92) |
| AUC (95% CI) | 0.90 (0.87–0.93) |
| F1 score | 0.62 (0.58–0.65) |
| Balanced accuracy | 0.90 (0.87–0.91) |
| VeriSeeTM | Endocrinologists | |
|---|---|---|
| Number of patients | 468 | 468 |
| Sensitivity (95% CI) | 0.91 (0.81–0.97) | 0.91 (0.81–0.97) |
| Specificity (95% CI) | 0.84 (0.80–0.87) | 0.50 (0.45–0.55) |
| AUC (95% CI) | 0.87 (0.83–0.91) | 0.70 (0.66–0.74) |
| F1 score (95% CI) | 0.58 (0.54–0.63) | 0.33 (0.28–0.37) |
| Balanced accuracy (95% CI) | 0.87 (0.83–0.89) | 0.70 (0.65–0.74) |
| Before | After | |
|---|---|---|
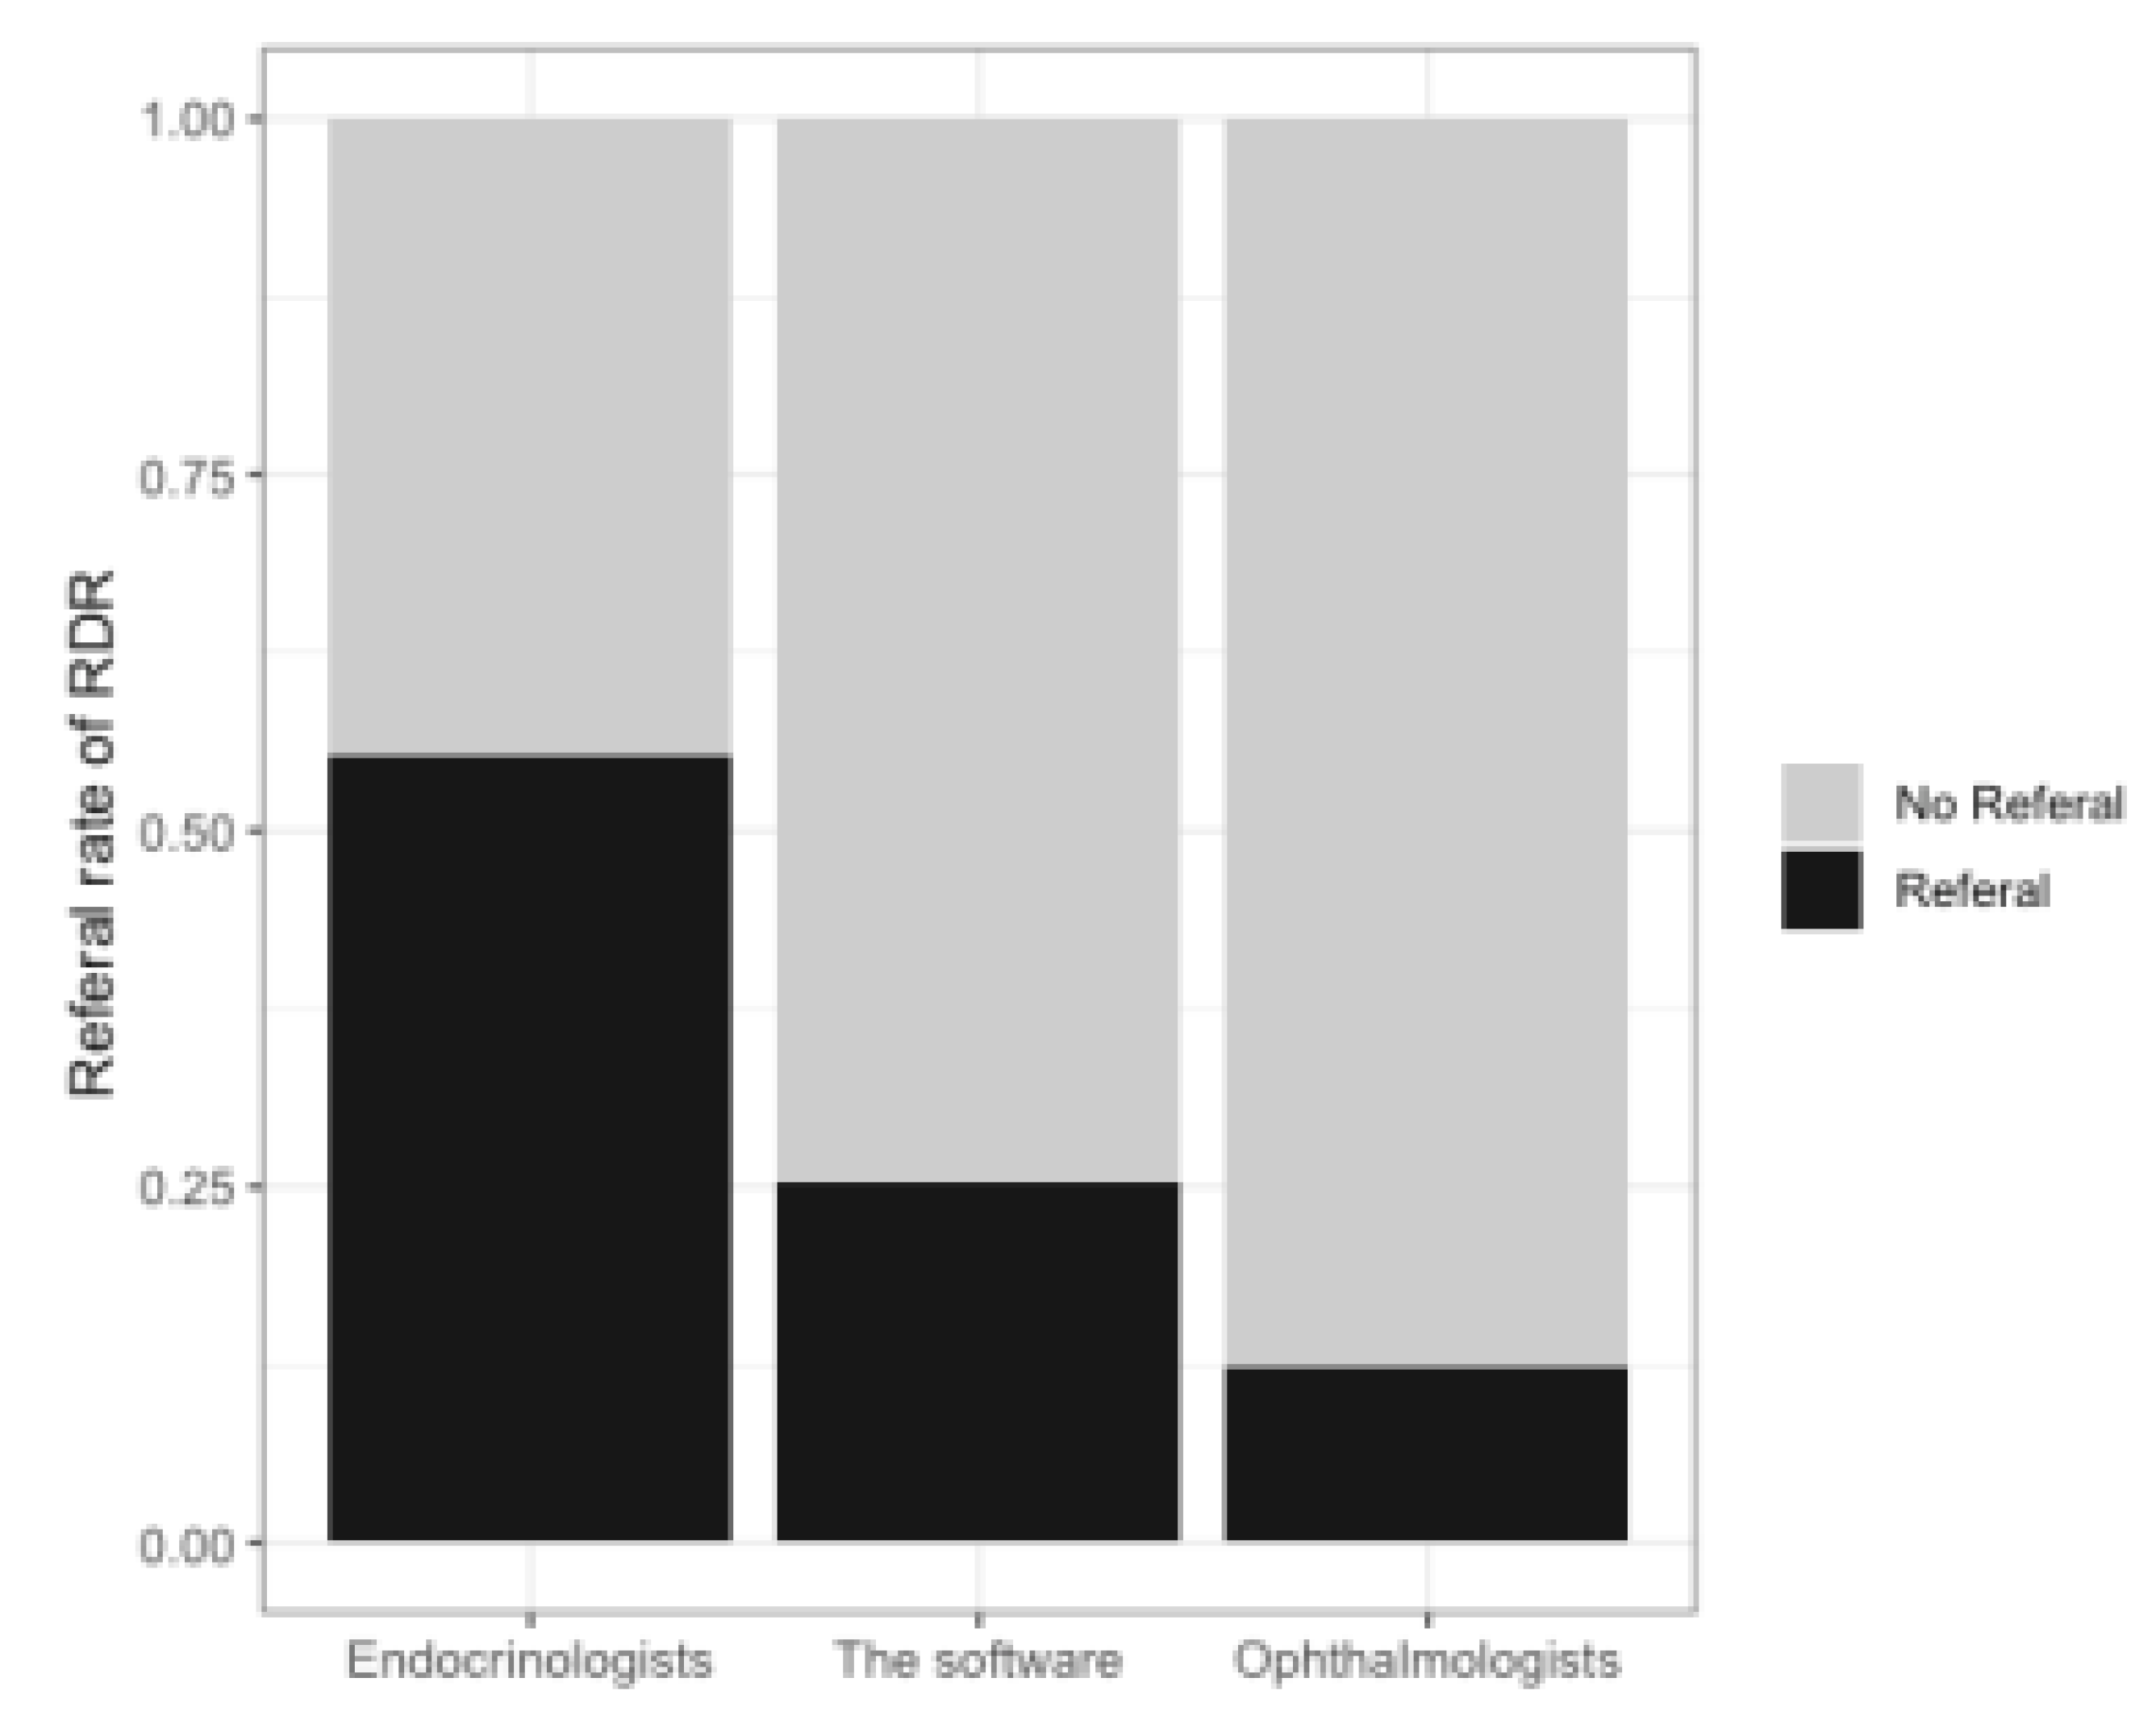
| Monthly RDR rate | 55.1% (258/468) | 42.9% (216/503) |
| Monthly rate of finishing grading on time * | 66.8% (478/716) | 77.6% (543/700) |
| Experience * (Years) | Accuracy † | Images ‡ | Kappa § | |||
|---|---|---|---|---|---|---|
| Before | After | Change | ||||
| 1 | 2 | 0.71 | 209 | 0.17 | 0.50 | 0.33 |
| 2 | 8 | 0.72 | 257 | 0.16 | 0.43 | 0.27 |
| 3 | 11 | 0.7 | 230 | 0.06 | 0.31 | 0.25 |
| 4 | 13 | 0.61 | 189 | 0.05 | 0.17 | 0.12 |
| 5 | 17 | 0.77 | 121 | 0.37 | 0.65 | 0.28 |
Publisher’s Note: MDPI stays neutral with regard to jurisdictional claims in published maps and institutional affiliations. |
© 2021 by the authors. Licensee MDPI, Basel, Switzerland. This article is an open access article distributed under the terms and conditions of the Creative Commons Attribution (CC BY) license (http://creativecommons.org/licenses/by/4.0/).
Share and Cite
Li, Y.-H.; Sheu, W.H.-H.; Chou, C.-C.; Lin, C.-H.; Cheng, Y.-S.; Wang, C.-Y.; Wu, C.L.; Lee, I.-T. The Clinical Influence after Implementation of Convolutional Neural Network-Based Software for Diabetic Retinopathy Detection in the Primary Care Setting. Life 2021, 11, 200. https://0-doi-org.brum.beds.ac.uk/10.3390/life11030200
Li Y-H, Sheu WH-H, Chou C-C, Lin C-H, Cheng Y-S, Wang C-Y, Wu CL, Lee I-T. The Clinical Influence after Implementation of Convolutional Neural Network-Based Software for Diabetic Retinopathy Detection in the Primary Care Setting. Life. 2021; 11(3):200. https://0-doi-org.brum.beds.ac.uk/10.3390/life11030200
Chicago/Turabian StyleLi, Yu-Hsuan, Wayne Huey-Herng Sheu, Chien-Chih Chou, Chun-Hsien Lin, Yuan-Shao Cheng, Chun-Yuan Wang, Chieh Liang Wu, and I.-Te Lee. 2021. "The Clinical Influence after Implementation of Convolutional Neural Network-Based Software for Diabetic Retinopathy Detection in the Primary Care Setting" Life 11, no. 3: 200. https://0-doi-org.brum.beds.ac.uk/10.3390/life11030200