
Perfusion Parameters in Near-Infrared Fluorescence Imaging with Indocyanine Green: A Systematic Review of the Literature

 ,
,
Abstract
:1. Introduction
2. Materials and Methods
2.1. Search Strategy
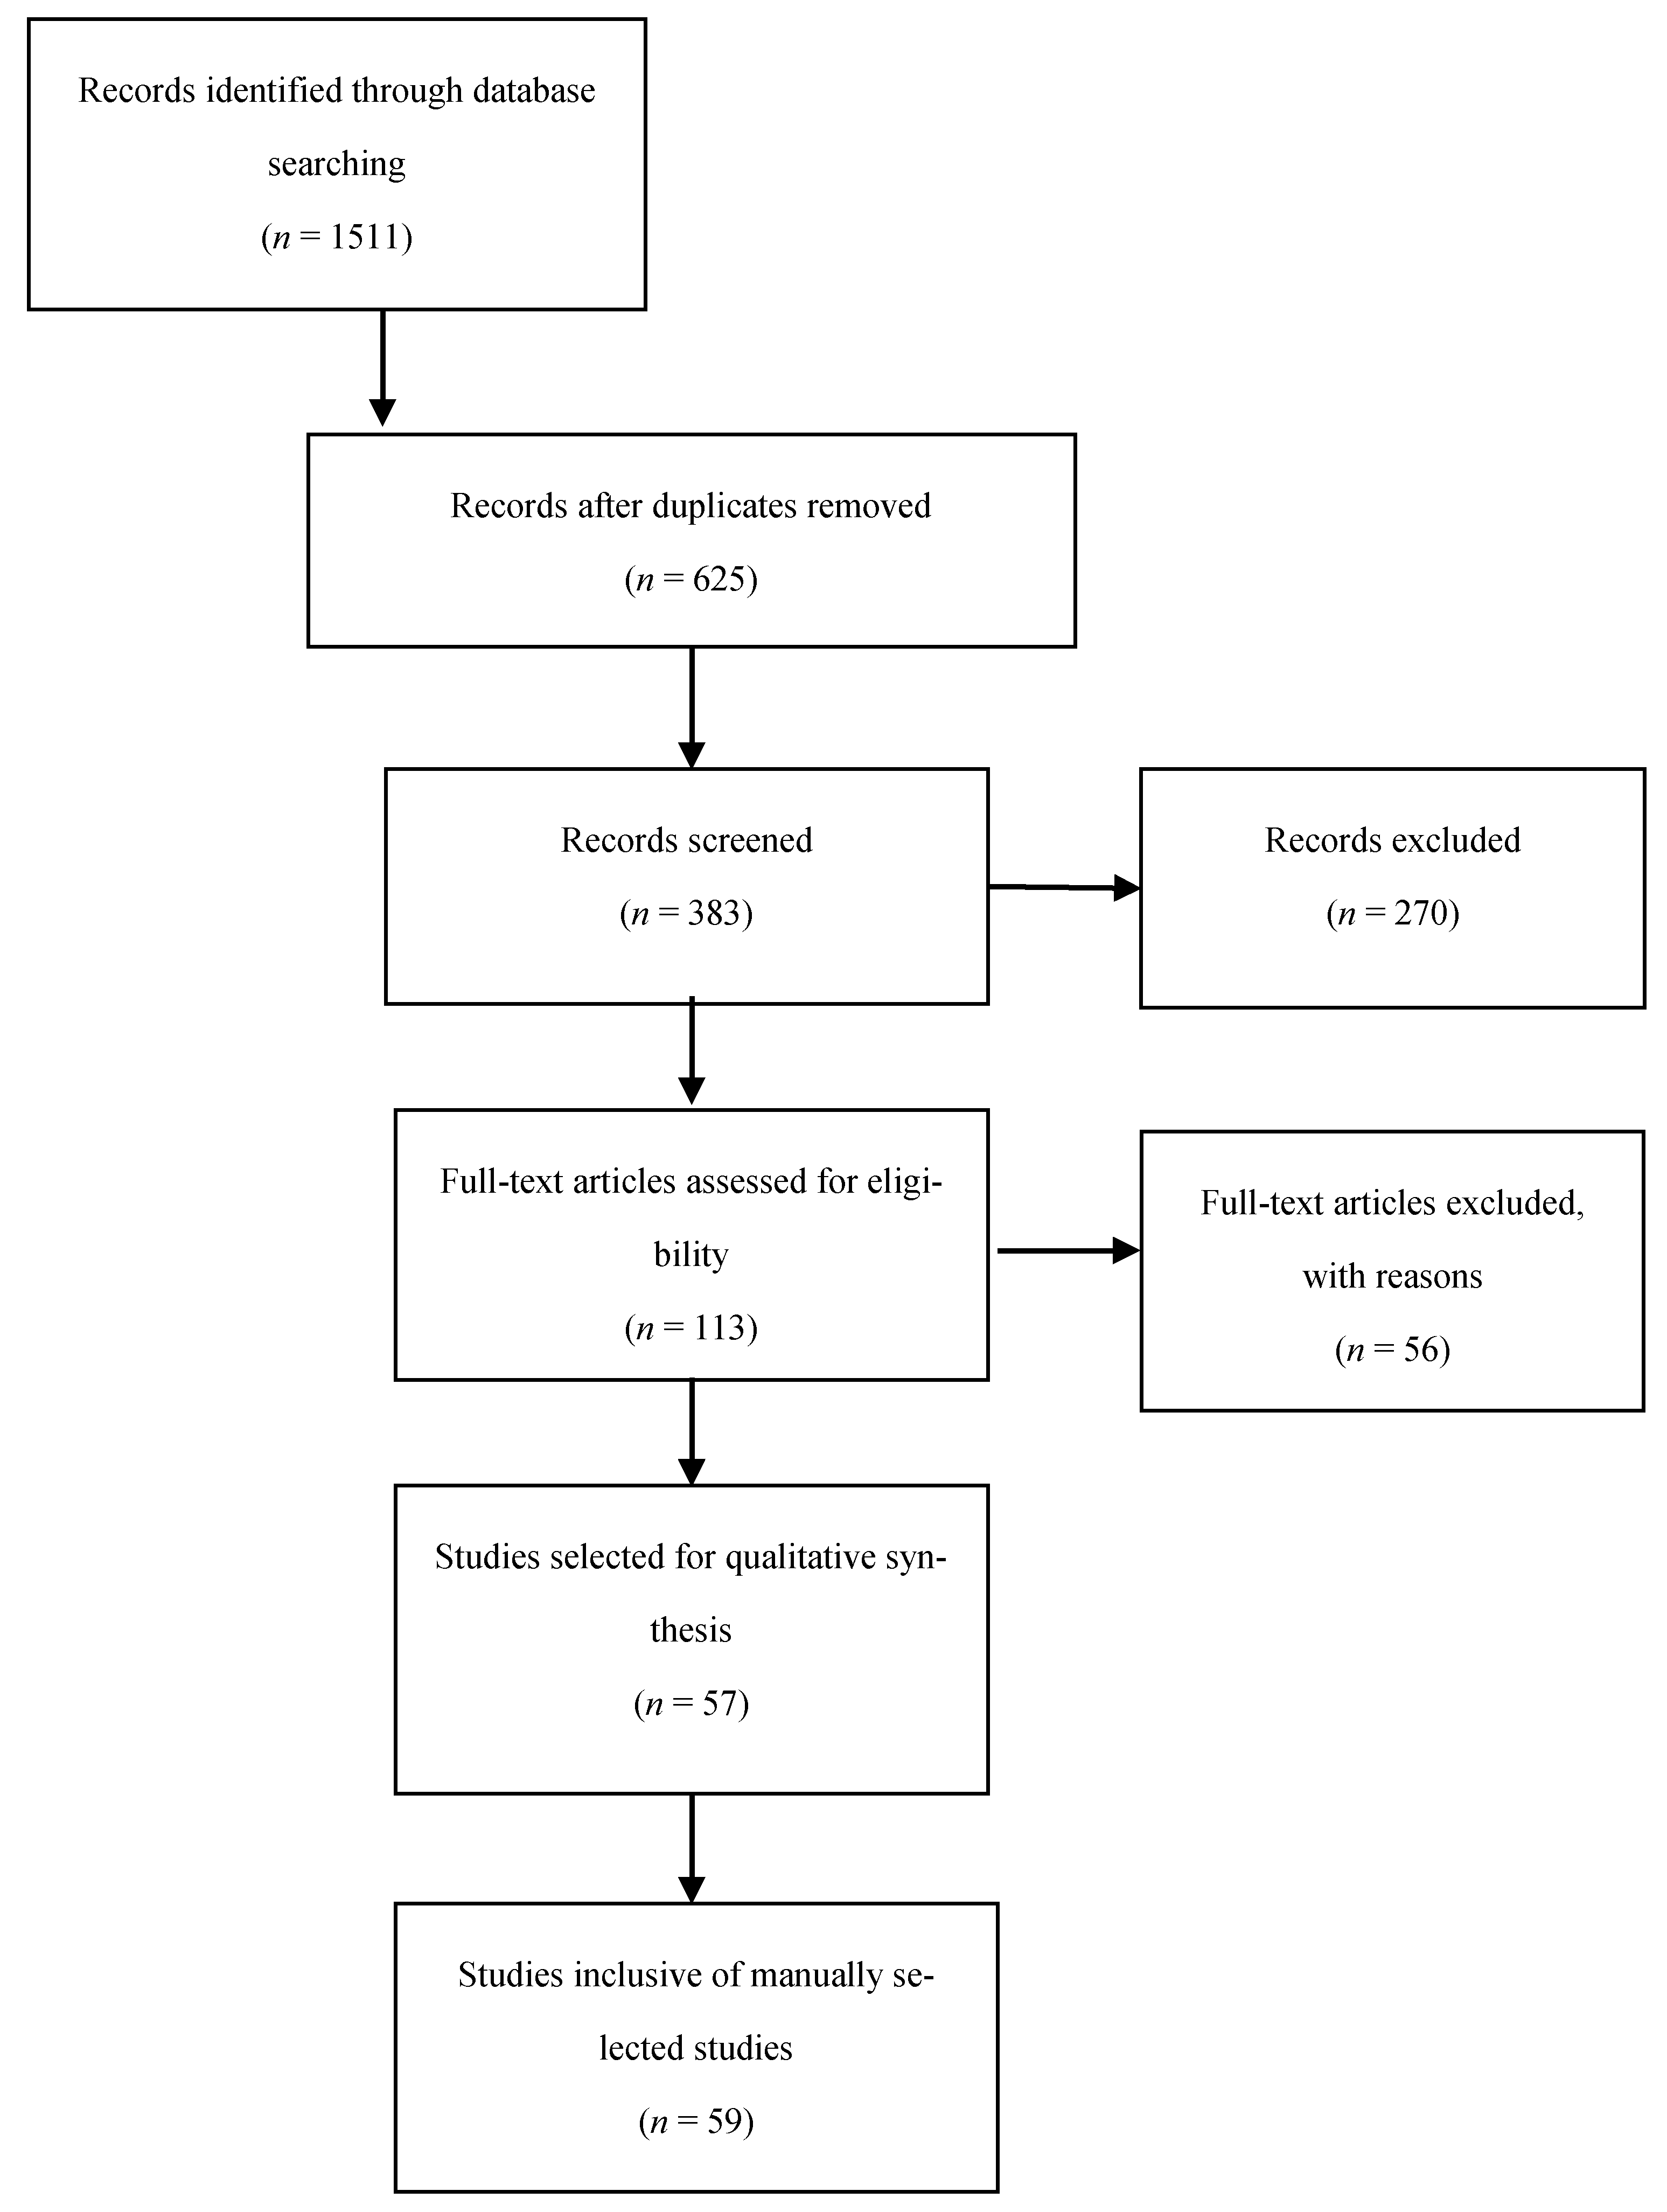
2.2. Article Selection
2.3. Quality Assessment
2.4. Data Extraction
3. Results
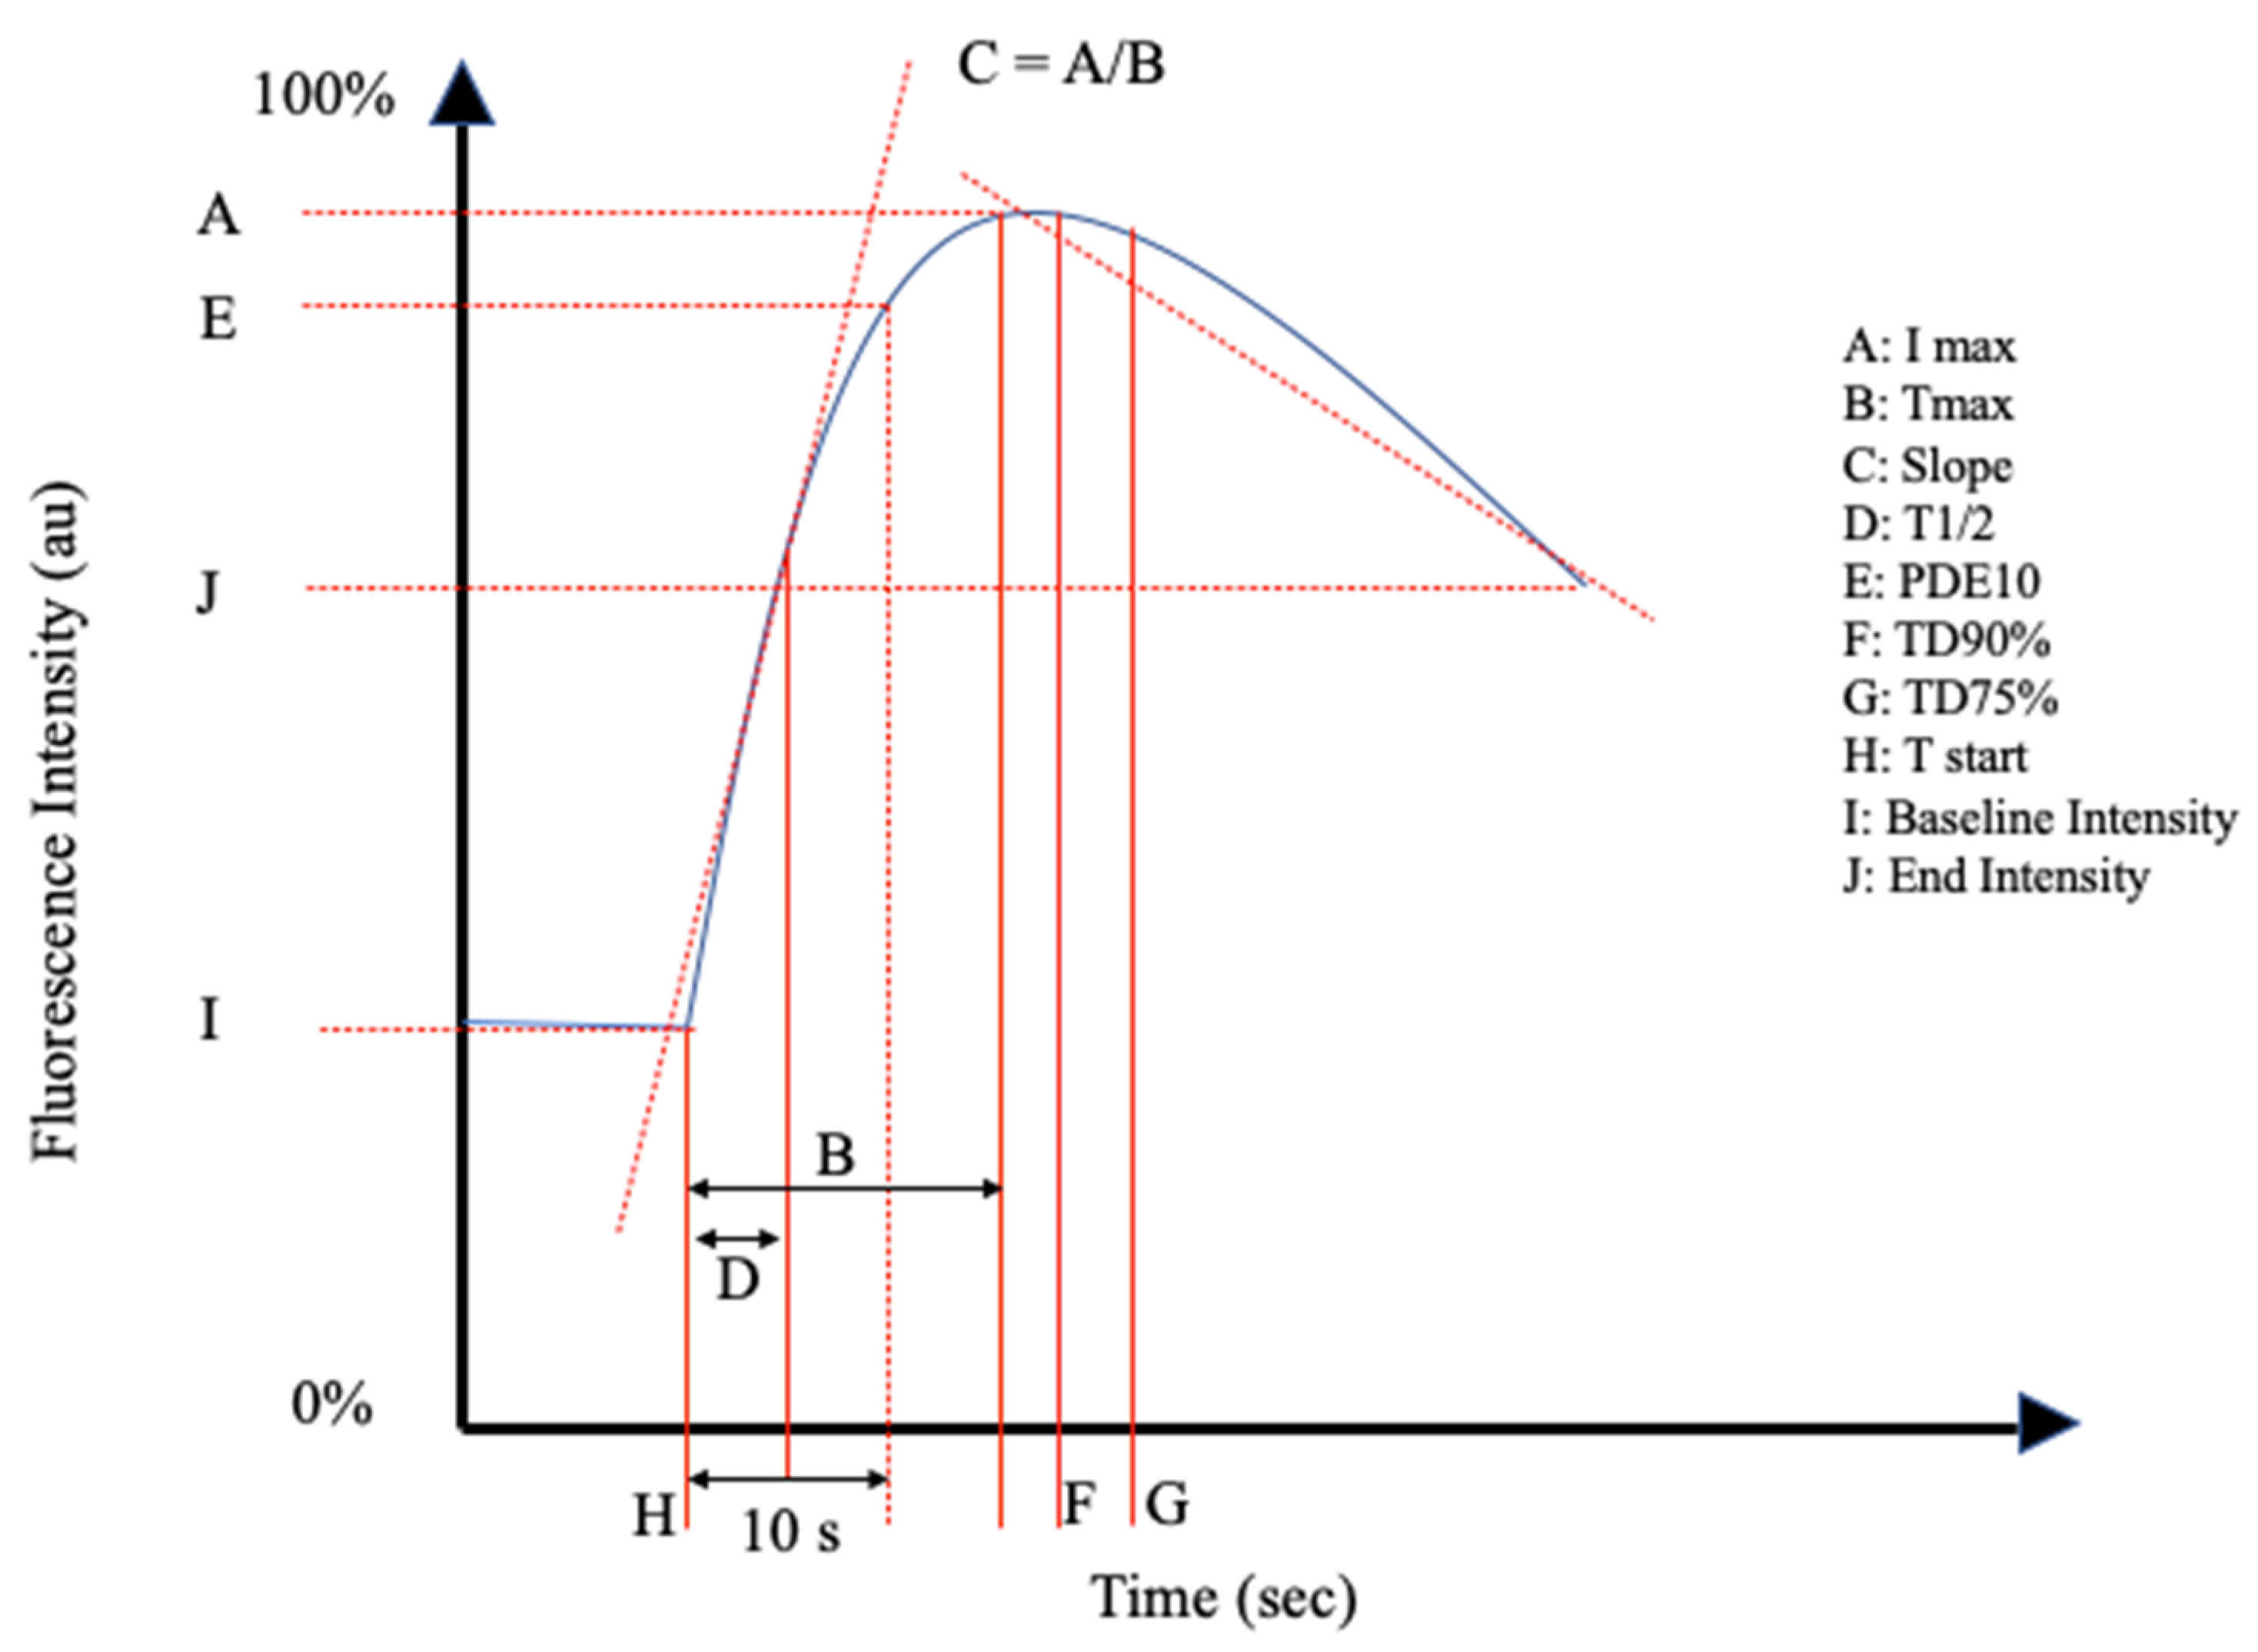
- (1)
- Absolute fluorescence intensity;
- (2)
- Time;
- (3)
- Changes in intensity over time.
3.1. Absolute Intensity Parameters
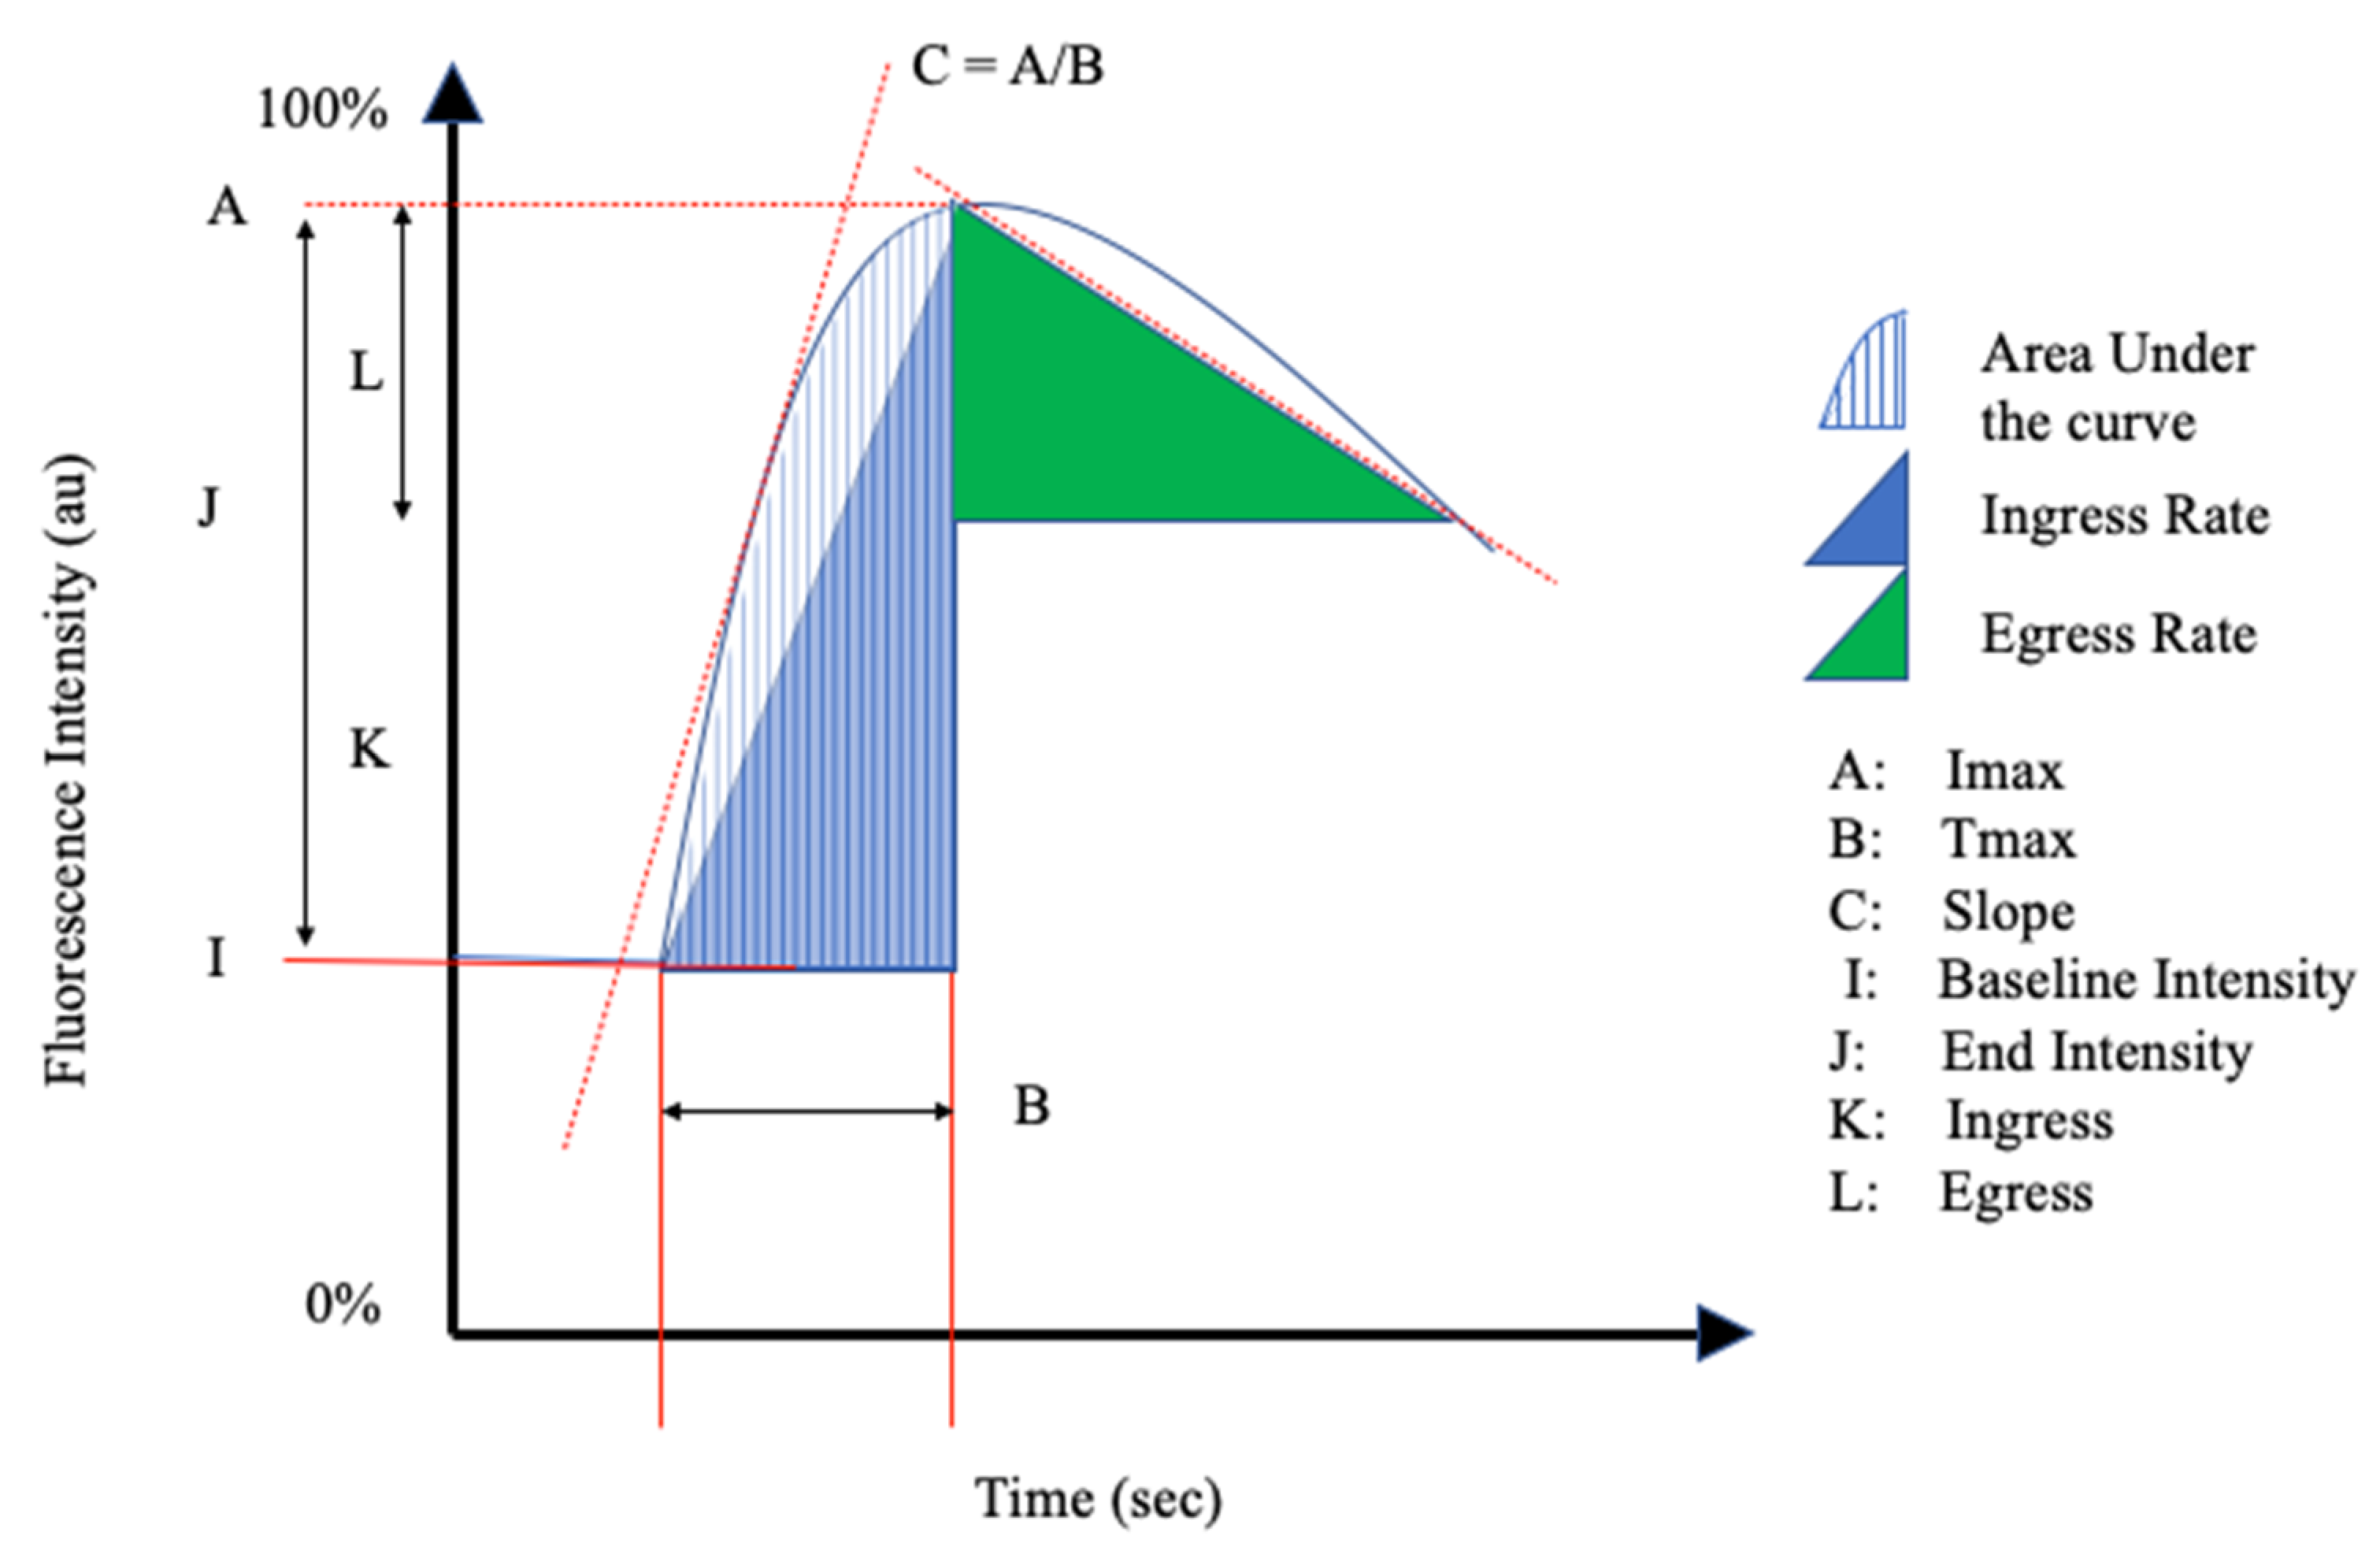
3.2. Inflow and Outflow Parameters
3.3. Relative Parameters
3.4. Gastro-Intestinal Surgery
3.5. Neurosurgery
3.6. Plastic Surgery
3.7. Breast Reconstructive Surgery
3.8. Microvascular Surgery
3.9. Vascular Surgery
3.10. Transplantation
3.11. Other
3.11.1. Diabetic Wound Healing
3.11.2. Total Thyroidectomy
3.11.3. Breast Imaging
4. Discussion
5. Conclusions
Supplementary Materials
Author Contributions
Funding
Institutional Review Board Statement
Informed Consent Statement
Data Availability Statement
Conflicts of Interest
Appendix A
References
- Cornelissen, A.J.M.; Van Mulken, T.J.M.; Graupner, C.; Qiu, S.S.; Keuter, X.H.A.; Van Der Hulst, R.R.W.J.; Schols, R.M. Near-infrared fluorescence image-guidance in plastic surgery: A systematic review. Eur. J. Plast. Surg. 2018, 41, 269–278. [Google Scholar] [CrossRef] [Green Version]
- Hoven, P.V.D.; Ooms, S.; van Manen, L.; van der Bogt, K.E.; van Schaik, J.; Hamming, J.F.; Vahrmeijer, A.L.; van der Vorst, J.R.; Mieog, J.S.D. A systematic review of the use of near-infrared fluorescence imaging in patients with peripheral artery disease. J. Vasc. Surg. 2019, 70, 286–297.e1. [Google Scholar] [CrossRef] [PubMed]
- Singh, S.K.; Desai, N.D.; Chikazawa, G.; Tsuneyoshi, H.; Vincent, J.; Zagorski, B.M.; Pen, V.; Moussa, F.; Cohen, G.N.; Christakis, G.T.; et al. The Graft Imaging to Improve Patency (GRIIP) clinical trial results. J. Thorac. Cardiovasc. Surg. 2010, 139, 294–301.e1. [Google Scholar] [CrossRef] [Green Version]
- Mangano, A.; Masrur, M.A.; Bustos, R.; Chen, L.L.; Fernandes, E.; Giulianotti, P.C. Near-Infrared Indocyanine Green-Enhanced Fluorescence and Minimally Invasive Colorectal Surgery: Review of the Literature. Surg. Technol. Int. 2018, 33, 77–83. [Google Scholar]
- Whiting, P.F.; Rutjes, A.W.; Westwood, M.E.; Mallett, S.; Deeks, J.J.; Reitsma, J.B.; Leeflang, M.M.; Sterne, J.A.; Bossuyt, P.M.M.; The QUADAS-2 Group. QUADAS-2: A Revised Tool for the Quality Assessment of Diagnostic Accuracy Studies. Ann. Intern. Med. 2011, 155, 529–536. [Google Scholar] [CrossRef] [PubMed]
- Abdelwahab, M.; Kandathil, C.K.; Most, S.P.; Spataro, E.A. Utility of Indocyanine Green Angiography to Identify Clinical Factors Associated With Perfusion of Paramedian Forehead Flaps During Nasal Reconstruction Surgery. JAMA Facial Plast. Surg. 2019, 21, 206–212. [Google Scholar] [CrossRef] [PubMed]
- Abdelwahab, M.; Spataro, E.A.; Kandathil, C.K.; Most, S.P. Neovascularization Perfusion of Melolabial Flaps Using Intraoperative Indocyanine Green Angiography. JAMA Facial Plast. Surg. 2019, 21, 230–236. [Google Scholar] [CrossRef] [PubMed] [Green Version]
- Braun, J.D.; Trinidad-Hernandez, M.; Perry, D.; Armstrong, D.G.; Mills, J.L. Early quantitative evaluation of indocyanine green angiography in patients with critical limb ischemia. J. Vasc. Surg. 2013, 57, 1213–1218. [Google Scholar] [CrossRef] [PubMed] [Green Version]
- Gerken, A.L.H.; Nowak, K.; Meyer, A.; Weiss, C.; Krüger, B.; Nawroth, N.; Karampinis, I.; Heller, K.; Apel, H.; Reissfelder, C.; et al. Quantitative Assessment of Intraoperative Laser Fluorescence Angiography with Indocyanine Green Predicts Early Graft Function after Kidney Transplantation. Ann. Surg. 2020, Publish Ah, 30. [Google Scholar] [CrossRef]
- Girard, N.; Delomenie, M.; Malhaire, C.; Sebbag, D.; Roulot, A.; Sabaila, A.; Couturaud, B.; Feron, J.-G.; Reyal, F. Innovative DIEP flap perfusion evaluation tool: Qualitative and quantitative analysis of indocyanine green-based fluorescence angiography with the SPY-Q proprietary software. PLoS ONE 2019, 14, e0217698. [Google Scholar] [CrossRef]
- Mironov, O.; Zener, R.; Eisenberg, N.; Tan, K.; Roche-Nagle, G. Real-Time Quantitative Measurements of Foot Perfusion in Patients With Critical Limb Ischemia. Vasc. Endovasc. Surg. 2019, 53, 310–315. [Google Scholar] [CrossRef] [PubMed]
- Regus, S.; Klingler, F.; Lang, W.; Meyer, A.; Almasi-Sperling, V.; May, M.; Wust, W.; Rother, U. Pilot study using intraopera-tive fluorescence angiography during arteriovenous hemodialysis access surgery. J. Vasc. Access 2019, 20, 175–183. [Google Scholar] [CrossRef] [PubMed]
- Rother, U.; Müller-Mohnssen, H.; Lang, W.; Ludolph, I.; Arkudas, A.; Horch, R.E.; Regus, S.; Meyer, A. Wound closure by means of free flap and arteriovenous loop: Development of flap autonomy in the long-term follow-up. Int. Wound J. 2020, 17, 107–116. [Google Scholar] [CrossRef] [Green Version]
- Rother, U.; Amann, K.; Adler, W.; Nawroth, N.; Karampinis, I.; Keese, M.; Manap, S.; Regus, S.; Meyer, A.; Porubsky, S.; et al. Quantitative assessment of microperfusion by indocyanine green angiography in kidney transplantation resembles chronic morphological changes in kidney specimens. Microcirculation 2019, 26, e12529. [Google Scholar] [CrossRef] [PubMed]
- Rother, U.; Lang, W.; Horch, R.E.; Ludolph, I.; Meyer, A.; Gefeller, O.; Regus, S. Pilot Assessment of the Angiosome Concept by Intra-operative Fluorescence Angiography After Tibial Bypass Surgery. Eur. J. Vasc. Endovasc. Surg. 2018, 55, 215–221. [Google Scholar] [CrossRef] [Green Version]
- Rother, U.; Lang, W.; Horch, R.E.; Ludolph, I.; Meyer, A.; Regus, S. Microcirculation Evaluated by Intraoperative Fluores-cence Angiography after Tibial Bypass Surgery. Ann. Vasc. Surg. 2017, 40, 190–197. [Google Scholar] [CrossRef] [PubMed]
- Yang, C.-E.; Chung, S.W.; Lee, D.W.; Lew, D.H.; Song, S.Y. Evaluation of the Relationship Between Flap Tension and Tissue Perfusion in Implant-Based Breast Reconstruction Using Laser-Assisted Indocyanine Green Angiography. Ann. Surg. Oncol. 2018, 25, 2235–2240. [Google Scholar] [CrossRef]
- Colvard, B.; Itoga, N.K.; Hitchner, E.; Sun, Q.; Long, B.; Lee, G.; Chandra, V.; Zhou, W. SPY technology as an adjunctive measure for lower extremity perfusion. J. Vasc. Surg. 2016, 64, 195–201. [Google Scholar] [CrossRef] [Green Version]
- Ritschl, L.M.; Georg, R.; Kolk, A.; Kesting, M.R.; Wolff, K.-D.; Mücke, T.; Fichter, A.M. Effect of Segment Length and Number of Osteotomy Sites on Cancellous Bone Perfusion in Free Fibula Flaps. J. Reconstr. Microsurg. 2019, 35, 108–116. [Google Scholar] [CrossRef]
- Kang, Y.; Lee, J.; Kwon, K.; Choi, C. Application of novel dynamic optical imaging for evaluation of peripheral tissue perfusion. Int. J. Cardiol. 2010, 145, e99–e101. [Google Scholar] [CrossRef]
- Hajhosseini, B.; Chiou, G.J.; Virk, S.S.; Chandra, V.; Moshrefi, S.; Meyer, S.; Kamperman, K.J.; Gurtner, G.C. Hyperbaric Oxygen Therapy in Management of Diabetic Foot Ulcers: Indocyanine Green Angiography May Be Used as a Biomarker to Analyze Perfusion and Predict Response to Treatment. Plast. Reconstr. Surg. 2021, 147, 209–214. [Google Scholar] [CrossRef] [PubMed]
- Han, M.D.; Miloro, M.; Markiewicz, M.R. Laser-Assisted Indocyanine Green Imaging for Assessment of Perioperative Maxillary Perfusion During Le Fort I Osteotomy: A Pilot Study. J. Oral Maxillofac. Surg. 2018, 76, 2630–2637. [Google Scholar] [CrossRef]
- Hitier, M.; Cracowski, J.-L.; Hamou, C.; Righini, C.; Bettega, G. Indocyanine green fluorescence angiography for free flap monitoring: A pilot study. J. Cranio-Maxillofac. Surg. 2016, 44, 1833–1841. [Google Scholar] [CrossRef]
- Lang, B.H.-H.; Wong, C.K.; Hung, H.T.; Wong, K.P.; Mak, K.L.; Au, K.B. Indocyanine green fluorescence angiography for quantitative evaluation of in situ parathyroid gland perfusion and function after total thyroidectomy. Surgery 2017, 161, 87–95. [Google Scholar] [CrossRef]
- Son, G.M.; Kwon, M.S.; Kim, Y.; Kim, J.; Kim, S.H.; Lee, J.W. Quantitative analysis of colon perfusion pattern using indocyanine green (ICG) angiography in laparoscopic colorectal surgery. Surg. Endosc. 2019, 33, 1640–1649. [Google Scholar] [CrossRef] [Green Version]
- Amagai, H.; Miyauchi, H.; Muto, Y.; Uesato, M.; Ohira, G.; Imanishi, S.; Maruyama, T.; Tochigi, T.; Okada, K.; Maruyama, M.; et al. Clinical utility of transanal indocyanine green near-infrared fluorescence imaging for evaluation of colorectal anastomotic perfusion. Surg. Endosc. 2020, 34, 5283–5293. [Google Scholar] [CrossRef] [PubMed]
- Goertz, L.; Hof, M.; Timmer, M.; Schulte, A.P.; Kabbasch, C.; Krischek, B.; Stavrinou, P.; Reiner, M.; Goldbrunner, R.; Brinker, G. Application of Intraoperative FLOW 800 Indocyanine Green Videoangiography Color-Coded Maps for Microsurgical Clipping of Intracranial Aneurysms. World Neurosurg. 2019, 131, e192–e200. [Google Scholar] [CrossRef]
- Hayami, S.; Matsuda, K.; Iwamoto, H.; Ueno, M.; Kawai, M.; Hirono, S.; Okada, K.; Miyazawa, M.; Tamura, K.; Mitani, Y.; et al. Visualization and quantification of anastomotic perfusion in colorectal surgery using near-infrared fluorescence. Tech. Coloproctology 2019, 23, 973–980. [Google Scholar] [CrossRef] [PubMed]
- Igari, K.; Kudo, T.; Toyofuku, T.; Jibiki, M.; Inoue, Y.; Kawano, T. Quantitative Evaluation of the Outcomes of Revascularization Procedures for Peripheral Arterial Disease Using Indocyanine Green Angiography. Eur. J. Vasc. Endovasc. Surg. 2013, 46, 460–465. [Google Scholar] [CrossRef] [Green Version]
- Igari, K.; Kudo, T.; Uchiyama, H.; Toyofuku, T.; Inoue, Y. Indocyanine Green Angiography for the Diagnosis of Peripheral Arterial Disease with Isolated Infrapopliteal Lesions. Ann. Vasc. Surg. 2014, 28, 1479–1484. [Google Scholar] [CrossRef]
- Ishige, F.; Nabeya, Y.; Hoshino, I.; Takayama, W.; Chiba, S.; Arimitsu, H.; Iwatate, Y.; Yanagibashi, H. Quantitative Assessment of the Blood Perfusion of the Gastric Conduit by Indocyanine Green Imaging. J. Surg. Res. 2019, 234, 303–310. [Google Scholar] [CrossRef]
- Kamiya, K.; Unno, N.; Miyazaki, S.; Sano, M.; Kikuchi, H.; Hiramatsu, Y.; Ohta, M.; Yamatodani, T.; Mineta, H.; Konno, H. Quantitative assessment of the free jejunal graft perfusion. J. Surg. Res. 2015, 194, 394–399. [Google Scholar] [CrossRef]
- Kamp, M.A.; Sarikaya-Seiwert, S.; Petridis, A.K.; Beez, T.; Cornelius, J.-F.; Steiger, H.-J.; Turowski, B.; Slotty, P.J. Intraoperative Indocyanine Green–Based Cortical Perfusion Assessment in Patients Suffering from Severe Traumatic Brain Injury. World Neurosurg. 2017, 101, 431–443. [Google Scholar] [CrossRef]
- Kamp, M.A.; Slotty, P.; Turowski, B.; Etminan, N.; Steiger, H.J.; Hanggi, D.; Stummer, W. Microscope-integrated quantitative analysis of intraoperative indocyanine green fluorescence angiography for blood flow assessment: First experience in 30 patients. Neurosurgery 2012, 70, 65–73; discussion 64–73. [Google Scholar] [CrossRef]
- Kobayashi, S.; Ishikawa, T.; Tanabe, J.; Moroi, J.; Suzuki, A. Quantitative cerebral perfusion assessment using microscope-integrated analysis of intraoperative indocyanine green fluorescence angiography versus positron emission tomography in superficial temporal artery to middle cerebral artery anastomosis. Surg. Neurol. Int. 2014, 5, 135. [Google Scholar] [CrossRef] [PubMed]
- Maxwell, A.K.; Deleyiannis, F.W.-B. Utility of Indocyanine Green Angiography in Arterial Selection during Free Flap Harvest in Patients with Severe Peripheral Vascular Disease. Plast. Reconstr. Surg. Glob. Open 2016, 4, e1097. [Google Scholar] [CrossRef] [PubMed]
- Miyazaki, H.; Igari, K.; Kudo, T.; Iwai, T.; Wada, Y.; Takahashi, Y.; Inoue, Y.; Asamura, S. Significance of the Lateral Thoracic Artery in Pectoralis Major Musculocutaneous Flap Reconstruction. Ann. Plast. Surg. 2017, 79, 498–504. [Google Scholar] [CrossRef] [PubMed]
- Nakamura, M.; Igari, K.; Toyofuku, T.; Kudo, T.; Inoue, Y.; Uetake, H. The evaluation of contralateral foot circulation after unilateral revascularization procedures using indocyanine green angiography. Sci. Rep. 2017, 7, 16171. [Google Scholar] [CrossRef] [PubMed] [Green Version]
- Nishizawa, M.; Igari, K.; Kudo, T.; Toyofuku, T.; Inoue, Y.; Uetake, H. A Comparison of the Regional Circulation in the Feet between Dialysis and Non-Dialysis Patients using Indocyanine Green Angiography. Scand. J. Surg. 2016, 106, 249–254. [Google Scholar] [CrossRef] [PubMed] [Green Version]
- Patel, H.M.; Bulsara, S.S.; Banerjee, S.; Sahu, T.; Sheorain, V.K.; Grover, T.; Parakh, R. Indocyanine Green Angiography to Prognosticate Healing of Foot Ulcer in Critical Limb Ischemia: A Novel Technique. Ann. Vasc. Surg. 2018, 51, 86–94. [Google Scholar] [CrossRef] [PubMed]
- Rennert, R.C.; Strickland, B.A.; Ravina, K.; Bakhsheshian, J.; Russin, J.J. Assessment of Hemodynamic Changes and Hyperperfusion Risk After Extracranial-to-Intracranial Bypass Surgery Using Intraoperative Indocyanine Green–Based Flow Analysis. World Neurosurg. 2018, 114, 352–360. [Google Scholar] [CrossRef]
- Schneider, P.; Piper, S.; Schmitz, C.H.; Schreiter, N.F.; Volkwein, N.; Lüdemann, L.; Malzahn, U.; Poellinger, A. Fast 3D Near-Infrared Breast Imaging Using Indocyanine Green for Detection and Characterization of Breast Lesions. RöFo Fortschr. Geb. Röntgenstrahlen Bildgeb. Verfahr. 2011, 183, 956–963. [Google Scholar] [CrossRef] [Green Version]
- Seinturier, C.; Blaise, S.; Tiffet, T.; Provencher, C.B.; Cracowski, J.L.; Pernod, G.; Carpentier, P. Fluorescence angiography compared to toe blood pressure in the evaluation of severe limb ischemia. Vasa 2020, 49, 230–234. [Google Scholar] [CrossRef] [PubMed]
- Settembre, N.; Kauhanen, P.; Albäck, A.; Spillerova, K.; Venermo, M. Quality Control of the Foot Revascularization Using Indocyanine Green Fluorescence Imaging. World J. Surg. 2017, 41, 1919–1926. [Google Scholar] [CrossRef] [Green Version]
- Shi, W.; Qiao, G.; Sun, Z.; Shang, A.; Wu, C.; Xu, B. Quantitative assessment of hemodynamic changes during spinal dural arteriovenous fistula surgery. J. Clin. Neurosci. 2015, 22, 1155–1159. [Google Scholar] [CrossRef]
- Okazaki, M.; Yano, T.; Miyashita, H.; Homma, T.; Tomita, M.; Tanaka, K. Quantitative Evaluation of Blood Perfusion to Nerves Included in the Anterolateral Thigh Flap using Indocyanine Green Fluorescence Angiography: A Different Contrast Pattern between the Vastus Lateralis Motor Nerve and Femoral Cutaneous Nerve. J. Reconstr. Microsurg. 2014, 31, 163–170. [Google Scholar] [CrossRef]
- Wada, T.; Kawada, K.; Takahashi, R.; Yoshitomi, M.; Hida, K.; Hasegawa, S.; Sakai, Y. ICG fluorescence imaging for quantitative evaluation of colonic perfusion in laparoscopic colorectal surgery. Surg. Endosc. 2017, 31, 4184–4193. [Google Scholar] [CrossRef]
- Ye, X.; Liu, X.-J.; Ma, L.; Liu, L.-T.; Wang, W.-L.; Wang, S.; Cao, Y.; Zhang, N.; Wang, R.; Zhao, J.-Z.; et al. Clinical values of intraoperative indocyanine green fluorescence video angiography with Flow 800 software in cerebrovascular surgery. Chin. Med. J. 2013, 126, 4232–4237. [Google Scholar] [PubMed]
- Zhang, X.; Ni, W.; Feng, R.; Li, Y.; Lei, Y.; Xia, D.; Gao, P.; Yang, S.; Gu, Y. Evaluation of Hemodynamic Change by Indocyanine Green-FLOW 800 Videoangiography Mapping: Prediction of Hyperperfusion Syndrome in Patients with Moyamoya Disease. Oxidative Med. Cell. Longev. 2020, 2020. [Google Scholar] [CrossRef] [PubMed]
- Zimmermann, A.; Roenneberg, C.; Reeps, C.; Wendorff, H.; Holzbach, T.; Eckstein, H.-H. The determination of tissue perfusion and collateralization in peripheral arterial disease with indocyanine green fluorescence angiography. Clin. Hemorheol. Microcirc. 2012, 50, 157–166. [Google Scholar] [CrossRef]
- Mothes, H.; Dinkelaker, T.; Donicke, T.; Friedel, R.; Hofmann, G.O.; Bach, O. Outcome Prediction in Microsurgery by Quantitative Evaluation of Perfusion Using ICG Fluorescence Angiography. J. Hand Surg. (European Vol.) 2009, 34, 238–246. [Google Scholar] [CrossRef] [PubMed]
- Betz, C.; Zhorzel, S.; Schachenmayr, H.; Stepp, H.; Havel, M.; Siedek, V.; Leunig, A.; Matthias, C.; Hopper, C.; Harréus, U. Endoscopic measurements of free-flap perfusion in the head and neck region using red-excited Indocyanine Green: Preliminary results. J. Plast. Reconstr. Aesthetic Surg. 2009, 62, 1602–1608. [Google Scholar] [CrossRef] [PubMed]
- Betz, C.S.; Zhorzel, S.; Schachenmayr, H.; Stepp, H.; Matthias, C.; Hopper, C.; Harréus, U. Endoscopic assessment of free flap perfusion in the upper aerodigestive tract using indocyanine green: A pilot study. J. Plast. Reconstr. Aesthetic Surg. 2013, 66, 667–674. [Google Scholar] [CrossRef] [PubMed]
- Aiba, T.; Uehara, K.; Ogura, A.; Tanaka, A.; Yonekawa, Y.; Hattori, N.; Nakayama, G.; Kodera, Y.; Ebata, T.; Nagino, M. The significance of the time to arterial perfusion in intraoperative ICG angiography during colorectal surgery. Surg. Endosc. 2021, 1–9. [Google Scholar] [CrossRef]
- Kang, Y.; Lee, J.; An, Y.; Jeon, J.; Choi, C. Segmental analysis of indocyanine green pharmacokinetics for the reliable diagnosis of functional vascular insufficiency. J. Biomed. Opt. 2011, 16, 030504. [Google Scholar] [CrossRef] [PubMed]
- D’Urso, A.; Agnus, V.; Barberio, M.; Seeliger, B.; Marchegiani, F.; Charles, A.-L.; Geny, B.; Marescaux, J.; Mutter, D.; Diana, M. Computer-assisted quantification and visualization of bowel perfusion using fluorescence-based enhanced reality in left-sided colonic resections. Surg. Endosc. 2020, 1–11. [Google Scholar] [CrossRef] [PubMed]
- Gorai, K.; Inoue, K.; Saegusa, N.; Shimamoto, R.; Takeishi, M.; Okazaki, M.; Nakagawa, M. Prediction of Skin Necrosis after Mastectomy for Breast Cancer Using Indocyanine Green Angiography Imaging. Plast. Reconstr. Surg. Glob. Open 2017, 5, e1321. [Google Scholar] [CrossRef]
- Prinz, V.; Hecht, N.; Kato, N.; Vajkoczy, P. FLOW 800 Allows Visualization of Hemodynamic Changes After Extracranial-to-Intracranial Bypass Surgery but Not Assessment of Quantitative Perfusion or Flow. Oper. Neurosurg. 2013, 10, 231–239. [Google Scholar] [CrossRef] [Green Version]
- Rennert, R.C.; Strickland, B.A.; Ravina, K.; Brandel, M.G.; Bakhsheshian, J.; Fredrickson, V.; Carey, J.; Russin, J.J. Assessment of ischemic risk following intracranial-to-intracranial and extracranial-to-intracranial bypass for complex aneurysms using intraoperative Indocyanine Green-based flow analysis. J. Clin. Neurosci. 2019, 67, 191–197. [Google Scholar] [CrossRef]
- Terasaki, H.; Inoue, Y.; Sugano, N.; Jibiki, M.; Kudo, T.; Lepäntalo, M.; Venermo, M. A Quantitative Method for Evaluating Local Perfusion Using Indocyanine Green Fluorescence Imaging. Ann. Vasc. Surg. 2013, 27, 1154–1161. [Google Scholar] [CrossRef]
- Holling, M.; Brokinkel, B.; Ewelt, C.; Fischer, B.R.; Stummer, W. Dynamic ICG Fluorescence Provides Better Intraoperative Understanding of Arteriovenous Fistulae. Oper. Neurosurg. 2013, 73, ons93–ons99. [Google Scholar] [CrossRef] [PubMed]
- Woitzik, J.; Peña-Tapia, P.G.; Schneider, U.C.; Vajkoczy, P.; Thomé, C. Cortical Perfusion Measurement by Indocyanine-Green Videoangiography in Patients Undergoing Hemicraniectomy for Malignant Stroke. Stroke 2006, 37, 1549–1551. [Google Scholar] [CrossRef] [PubMed]
- Uchino, H.; Kazumata, K.; Ito, M.; Nakayama, N.; Kuroda, S.; Houkin, K. Intraoperative assessment of cortical perfusion by indocyanine green videoangiography in surgical revascularization for moyamoya disease. Acta Neurochir. 2014, 156, 1753–1760. [Google Scholar] [CrossRef] [PubMed]
- Uchino, H.; Nakamura, T.; Houkin, K.; Murata, J.-I.; Saito, H.; Kuroda, S. Semiquantitative analysis of indocyanine green videoangiography for cortical perfusion assessment in superficial temporal artery to middle cerebral artery anastomosis. Acta Neurochir. 2013, 155, 599–605. [Google Scholar] [CrossRef]
- Venermo, M.; Settembre, N.; Albäck, A.; Vikatmaa, P.; Aho, P.-S.; Lepäntalo, M.; Inoue, Y.; Terasaki, H. Pilot Assessment of the Repeatability of Indocyanine Green Fluorescence Imaging and Correlation with Traditional Foot Perfusion Assessments. Eur. J. Vasc. Endovasc. Surg. 2016, 52, 527–533. [Google Scholar] [CrossRef] [Green Version]
- Lutken, C.D.; Achiam, M.P.; Svendsen, M.B.; Boni, L.; Nerup, N. Optimizing quantitative fluorescence angiography for vis-ceral perfusion assessment. Surg. Endosc. 2020, 34, 5223–5233. [Google Scholar] [CrossRef] [PubMed]
- Nerup, N.; Andersen, H.S.; Ambrus, R.; Strandby, R.B.; Svendsen, M.B.S.; Madsen, M.H.; Svendsen, L.B.; Achiam, M.P. Quantification of fluorescence angiography in a porcine model. Langenbeck’s Arch. Surg. 2016, 402, 655–662. [Google Scholar] [CrossRef]
- Rønn, J.H.; Nerup, N.; Strandby, R.B.; Svendsen, M.B.S.; Ambrus, R.; Svendsen, L.B.; Achiam, M.P. Laser speckle contrast imaging and quantitative fluorescence angiography for perfusion assessment. Langenbecks Arch. Chir. 2019, 404, 505–515. [Google Scholar] [CrossRef]
- Lütken, C.D.; Achiam, M.P.; Osterkamp, J.; Svendsen, M.B.; Nerup, N. Quantification of fluorescence angiography: Toward a reliable intraoperative assessment of tissue perfusion—A narrative review. Langenbecks Arch. Surg. 2020, 21, 21. [Google Scholar] [CrossRef]


| Parameter | Definition | Equivalent | References |
|---|---|---|---|
| Ingress | Absolute difference between baseline fluorescence and its maximum value | [6,7,8,9,10,11,12,13,14,15,16,17] | |
| Ingress Rate | Rate of increase of fluorescence signal from baseline to maximum value | Wash-in rate, fluorescence signal rise, blush rate | [8,9,10,11,12,13,14,15,16,17,18,19] |
| Ingress AUC | Area under the curve from baseline to maximum fluorescence intensity | WiAUC | [19] |
| Egress | Absolute difference between maximum intensity and the final intensity | Washout | [6,7,8,9,11,14,17,18,20] |
| Egress Rate | Rate of decrease of fluorescence signal from maximum value to the final intensity value | [8,9,11,14,17] | |
| Fluorescence intensity | Fluorescence intensity | [8,21,22,23,24,25] | |
| Imax | Maximum fluorescence intensity | Fmax, peak perfusion, FImax, MFI, cerebral blood volume | [6,7,24,25,26,27,28,29,30,31,32,33,34,35,36,37,38,39,40,41,42,43,44,45,46,47,48,49,50] |
| End Intensity | Fluorescence intensity at the end of the study | QEnd, residual FI | [8,33,51] |
| T start | Time to initial fluorescence signal | Tl (time local), latent time, T0, Te, TAP | [19,28,43,46,52,53,54,55] |
| Tmax | Time to maximum intensity | TTP (time to peak), blush time | [19,20,25,26,27,28,29,30,31,33,34,35,36,37,38,39,40,41,42,43,46,47,49,53,56,57] |
| Delta T | Time from initial fluorescent intensity to Imax | Tmax | [26,55] |
| T 1/2 | Time to half of the maximum fluorescence intensity | Tmax1/2, delay | [25,27,28,29,30,32,33,34,36,38,39,41,47,48,58,59,60] |
| TR | Time ratio (T1/2/Tmax) | [25] | |
| Rise Time | Time from (10–90%) OR (20–80%) of maximum fluorescence intensity OR time from 20–80% of maximum fluorescence intensity | [19,33,34,35,41,45,48,61] | |
| Td90% | Time from Fmax to 90% of the Fmax | [30,39] | |
| Td75% | Time from the Fmax to 75% of the Fmax | [30] | |
| IR 60 s | The rate of intensity measured 60 s after the Tmax to the Fmax (intensity at 60 s after Tmax/Fmax) | [30] | |
| Wash-in perfusion index | Ratio between the WiAUC to the rise time | [19] | |
| Slope | Fmax/Tmax | BFI (blood flow index), perfusion rate, Smax, cerebral blood flow, perfusion Index | [25,28,29,37,40,41,43,44,46,47,48,49,50,51,52,56,57] |
| BFI | Blood flow index (Fmax/RT) OR (F90-F10)/(T90-T10) | Slope | [23,33,34,35,41,45,48,58,59,62] |
| S 1/2 | Slope of the intensity increase from baseline to half the maximum intensity | [37] | |
| PDE10 | The fluorescence intensity increase at 10 s | SPY10 | [29,37,44,60] |
| ITT | Intrinsic transit time—the time needed for the fluorescent dye to circulate from arterial to venous anastomosis | Transit time | [23,27,41,45,48,61] |
| AUC | Area under the curve of intensity over time | Curve integral | [8] |
| Perfusion rate | Fraction of blood exchanged per min in vascular volume (%/min) | [20] | |
| Relative perfusion | Perfusion as a percentage of a reference region | [6,7,24,50,51,52,53,57] |
| Application | Reference | Patients | Study Characteristics | ||
|---|---|---|---|---|---|
| Camera | Software | ICG Dose | |||
| Gastro-intestinal | Aiba [54] | 110 | OPAL1 | Not spec | 0.1 mg/kg |
| Surgery | Amagai [26] | 69 | Karl Storz | ImageJ | 0.2 mg/kg |
| D’Urso [56] | 22 | D-Light P | FLER | 0.2 mg/kg | |
| Hayami [28] | 22 | D-Light P | Hamamatsu Photonics | 5 mg/2 mL | |
| Ishige [31] | 20 | Olympus | Hamamatsu Photonics | 1.25 mg | |
| Kamiya [32] | 26 | PDE Hamamatsu | Hamamatsu Photonics | 1 mL | |
| Son [25] | 86 | Image1 | Tracker 4.97 | 0.25 mg/kg | |
| Wada [47] | 112 | PDE Hamamatsu | Hamamatsu Photonics | 5 mg | |
| Neurosurgery | Goertz [27] | 54 | Carl Zeiss Co. | Flow 800 | 10 mg |
| Holling [61] | 5 | OPMI Pentero Microscope | Flow 800 | 5 mg | |
| Kamp [33] | 10 | OPMI Pentero Microscope | Flow 800 | 5 mg | |
| Kamp [34] | 30 | OPMI Pentero Microscope | Flow 800 | 5 mg | |
| Kobayashi [35] | 10 | OPMI Pentero Microscope | Flow 800 | 7.5 mg/3 mL | |
| Prinz [58] | 30 | OPMI Pentero Microscope | Flow 800 | 0.25 mg/kg | |
| Rennert [41] | 7 | OPMI Pentero Microscope | Flow 800 | 0.2 mg/kg | |
| Rennert [59] | 10 | OPMI Pentero Microscope Or Kinevo | Flow 800 | 0.2 mg/kg | |
| Shi [45] | 9 | OPMI Pentero Microscope | Flow 800 | 0.1 mg/kg | |
| Uchino [63] | 10 | OPMI Pentero Microscope | Flow 800 | 0.1 mg/kg | |
| Uchino [64] | 7 | OPMI Pentero Microscope | Flow 800 | 0.1 mg/kg | |
| Woitzik [62] | 6 | IC-View | IC Calc | 0.3 mg/kg | |
| Ye [48] | 87 | Carl Zeiss Co. | Flow 800 | 0.25 mg/kg | |
| Zhang [49] | 60 | Not spec | Flow 800 | Not spec | |
| Plastic Surgery | Abdelwahab [6] | 71 | SPY Elite Imaging System | SPY-Q | 5 mg/2 mL |
| Abdelwahab [7] | 10 | SPY Elite Imaging System | SPY-Q | 5 mg/2 mL | |
| Betz [52] | 11 | Karl Storz | IC Calc | 0.3 mg/kg | |
| Betz [53] | 25 | ICG Pulsion | IC Calc | 0.3 mg/kg | |
| Fichter [19] | 40 | Pulsion PDE | ImageJ | 0.3 mg/kg | |
| Girard [10] | 40 | SPY Elite Imaging System | SPY-Q | 5 mg | |
| Gorai [57] | 181 | PDE Hamamatsu | Hamamatsu Photonics | 25 mg/2 mL | |
| Han [22] | 32 | SPY Elite Imaging System | Not spec | 2.5 mg | |
| Hitier [23] | 20 | Fluobeam | Fluobeam | 0.25 mg/kg | |
| Maxwell [36] | 1 | SPY Elite Imaging System | Not spec | Not spec | |
| Miyazaki [37] | 8 | PDE Hamamatsu | Hamamatsu Photonics | 0.1 mg/kg | |
| Mothes [51] | 35 | IC-View | IC Calc | 0.5 mg/kg | |
| Rother [13] | 23 | SPY Elite Imaging System | SPY-Q | 0.1 mg/kg | |
| Tanaka [46] | 8 | PDE Hamamatsu | Hamamatsu Photonics | 0.1 mg/kg | |
| Yang [17] | 10 | SPY Elite Imaging System | SPY-Q | 3 mL | |
| Vascular | Braun [8] | 24 | SPY Elite Imaging System | Not spec | Not spec |
| Colvard [18] | 93 | SPY Elite Imaging System | SPY-Q | 2.5 mL | |
| Igari [29] | 21 | PDE Hamamtsu | Hamamatsu Photonics | 0.1 mg/kg | |
| Igari [30] | 23 | PDE Hamamtsu | Hamamatsu Photonics | 0.1 mg/kg | |
| Kang [55] | 2 | Vieworks | Visual C++ | 0.16 mg/kg | |
| Kang [20] | 2 | VIeworks | Not spec | 0.16 mg/kg | |
| Mironov [11] | 28 | SPY Elite Imaging System | SPY-Q | 5 mg/250 mL | |
| Nakamura [38] | 21 | PDE Hamamatsu | Hamamatsu Photonics | 0.1 mg/kg | |
| Nishizawa [39] | 62 | PDE Hamamatsu | Hamamatsu Photonics | 0.1 mg/kg | |
| Patel [40] | 47 | SPY Elite Imaging System | Not spec | 0.1 mg/kg | |
| Regus [12] | 47 | SPY Elite Imaging System | SPY-Q | 0.002 mg/kg | |
| Rother [15] | 40 | SPY Elite Imaging System | SPY-Q | 0.1 mg/kg | |
| Rother [16] | 33 | SPY Elite Imaging System | SPY-Q | 0.1 mg/kg | |
| Seinturier [43] | 34 | Fluobeam | Not spec | 0.05 mg/kg | |
| Settembre [44] | 101 | SPY Elite Imaging System | Not spec | 0.1 mg/kg | |
| Terasaki [60] | 34 | PDE Hamamatsu | Hamamatsu Photonics | 0.1 mg/kg | |
| Venermo [65] | 41 | PDE Hamamatsu | Hamamatsu Photonics | 0.1 mg/kg | |
| Zimmermann [50] | 30 | IC-View | IC-Calc | 0.5 mg/kg | |
| Transplantation | Rother [14] | 77 | SPY Elite Imaging System | SPY-Q | 0.02 mg/kg |
| Gerken [9] | 128 | SPY Elite Imaging System | SPY-Q | 0.02 mg/kg | |
| Thyroid Surgery | Lang [24] | 70 | SPY Elite Imaging System | Not spec | 2.5 mg |
| Diabetic Foot | Hajhosseini [21] | 21 | LUNA Fluorescence Microscope | SAS | 5 mg/mL |
| Breast lesions | Schneider [42] | 30 | NIRx Medical Technologies | NIRx NAVI | 2.5 mg |
| Advantages | Disadvantages | |
|---|---|---|
| Intensity-related parameters | Broad parameter selection | Influencing factors on intensity: - Patient-related: ICG concentration, cardiac output - System-related: camera distance, camera angle, environmental light |
| Time-related parameters | No influence of measured intensity Comparison possible between ROIs with different camera distance and angle | Narrow parameter selection |
| Relative parameters | Patient vasculature provides case–control data | Reference region may not be representative of optimal perfusion Influencing factors on intensity (see above) |
Publisher’s Note: MDPI stays neutral with regard to jurisdictional claims in published maps and institutional affiliations. |
© 2021 by the authors. Licensee MDPI, Basel, Switzerland. This article is an open access article distributed under the terms and conditions of the Creative Commons Attribution (CC BY) license (https://creativecommons.org/licenses/by/4.0/).
Share and Cite
Goncalves, L.N.; van den Hoven, P.; van Schaik, J.; Leeuwenburgh, L.; Hendricks, C.H.F.; Verduijn, P.S.; van der Bogt, K.E.A.; van Rijswijk, C.S.P.; Schepers, A.; Vahrmeijer, A.L.; et al. Perfusion Parameters in Near-Infrared Fluorescence Imaging with Indocyanine Green: A Systematic Review of the Literature. Life 2021, 11, 433. https://0-doi-org.brum.beds.ac.uk/10.3390/life11050433
Goncalves LN, van den Hoven P, van Schaik J, Leeuwenburgh L, Hendricks CHF, Verduijn PS, van der Bogt KEA, van Rijswijk CSP, Schepers A, Vahrmeijer AL, et al. Perfusion Parameters in Near-Infrared Fluorescence Imaging with Indocyanine Green: A Systematic Review of the Literature. Life. 2021; 11(5):433. https://0-doi-org.brum.beds.ac.uk/10.3390/life11050433
Chicago/Turabian StyleGoncalves, Lauren N., Pim van den Hoven, Jan van Schaik, Laura Leeuwenburgh, Cas H. F. Hendricks, Pieter S. Verduijn, Koen E. A. van der Bogt, Carla S. P. van Rijswijk, Abbey Schepers, Alexander L. Vahrmeijer, and et al. 2021. "Perfusion Parameters in Near-Infrared Fluorescence Imaging with Indocyanine Green: A Systematic Review of the Literature" Life 11, no. 5: 433. https://0-doi-org.brum.beds.ac.uk/10.3390/life11050433