
Association between Visceral and Bone Marrow Adipose Tissue and Bone Quality in Sedentary and Physically Active Ovariectomized Wistar Rats


Abstract
:1. Introduction
2. Materials and Methods
2.1. Experimental Design
2.2. Animals Sacrifice and Tissues Harvest
2.3. Estradiol and Bone Turnover Markers
2.4. Biomechanical Testing
2.5. Tissue Preparation for Light Microscopy
2.6. Static Histomorphometry
2.7. Marrow Adiposity
2.8. Dynamic Histomorphometry
2.9. Detection and Quantification of Osteocytes with Oxidative Damage
2.10. Detection and Quantification of Osteocyte Apoptosis
2.11. Statistical Analysis
3. Results
3.1. Effect of Ovariectomy on Body Weight, Adiposity and Bone Quality
3.2. Association between Visceral Adipose Tissue and Bone Quality Markers
3.3. Association between Bone Marrow Adipose Tissue and Bone Quality Markers
3.4. Effect of Daily Physical Activity on Body Weight, Adiposity and Bone Quality
4. Discussion
4.1. OVX Leads to Body Weight Gain, Visceral and Bone Marrow Adipose Tissue Increase
4.2. Association between Visceral and Bone Marrow Adiposity and Bone Quality
4.3. Effects of Physical Activity on Visceral and Bone Marrow Adiposity
5. Conclusions
Author Contributions
Funding
Institutional Review Board Statement
Informed Consent Statement
Acknowledgments
Conflicts of Interest
References
- NCD Risk Factor Collaboration. Worldwide trends in body-mass index, underweight, overweight, and obesity from 1975 to 2016: A pooled analysis of 2416 population-based measurement studies in 128.9 million children, adolescents, and adults. Lancet 2017, 390, 2627–2642. [Google Scholar] [CrossRef] [Green Version]
- Wang, Y.C.; McPherson, K.; Marsh, T.; Gortmaker, S.L.; Brown, M. Health and economic burden of the projected obesity trends in the USA and the UK. Lancet 2011, 378, 815–825. [Google Scholar] [CrossRef]
- Reid, I.R.; Ames, R.; Evans, M.C.; Sharpe, S.; Gamble, G.; France, J.T.; Lim, T.M.; Cundy, T.F. Determinants of total body and regional bone mineral density in normal postmenopausal women—A key role for fat mass. J. Clin. Endocrinol. Metab. 1992, 75, 45–51. [Google Scholar] [CrossRef] [PubMed]
- De Laet, C.; Kanis, J.K.; Oden, A.; Johanson, H.; Johnell, O.; Delmas, P.; Eisman, J.A.; Kroger, H.; Fujiwara, S.; Garnero, P.; et al. Body mass index as a predictor of fracture risk: A meta-analysis. Osteoporos. Int. 2005, 16, 1330–1338. [Google Scholar] [CrossRef] [PubMed]
- Gracia-Marco, L.; Ortega, F.B.; Jimenez-Pavon, D.; Rodriguez, G.; Castillo, M.J.; Vicente-Rodriguez, G.; Moreno, L.A. Adiposity and bone health in Spanish adolescents. The HELENA study. Osteoporos. Int. 2012, 23, 937–947. [Google Scholar] [CrossRef]
- Armamento-Villareal, R.; Sadler, C.; Napoli, N.; Shah, K.; Chode, S.; Sinacore, D.R.; Qualls, C.; Villareal, D.T. Weight loss in obese older adults increases serum sclerostin and impairs hip geometry but both are prevented by exercise training. J. Bone Miner. Res. 2012, 27, 1215–1221. [Google Scholar] [CrossRef]
- Shah, K.; Armamento-Villareal, R.; Parimi, N.; Chode, S.; Sinacore, D.R.; Hilton, T.N.; Napoli, N.; Qualls, C.; Villareal, D.T. Exercise training in obese older adults prevents increase in bone turnover and attenuates decrease in hip bone mineral density induced by weight loss despite decline in bone-active hormones. J. Bone Miner. Res. 2011, 26, 2851–2859. [Google Scholar] [CrossRef] [PubMed] [Green Version]
- Ma, H.; Turpeinen, T.; Silvennoinen, M.; Torvinen, S.; Rinnankoski-Tuikka, R.; Kainulainen, H.; Timonen, J.; Kujala, U.N.; Rahkila, P.; Suominen, H. Effects of diet-induced obesity and voluntary wheel running on the microstructure of the murine distal femur. Nutr. Metab. 2011, 8, 1. [Google Scholar] [CrossRef] [Green Version]
- Siiteri, P.K. Adipose tissue as a source of hormones. Am. J. Clin. Nutr. 1987, 45, 277–282. [Google Scholar] [CrossRef]
- Wardlaw, G.M. Putting body weight and osteoporosis into perspective. Am. J. Clin. Nutr. 1996, 63, 433S–436S. [Google Scholar] [CrossRef] [Green Version]
- Karsenty, G.; Oury, F. The central regulation of bone mass, the first link between bone remodeling and energy metabolism. J. Clin. Endocrinol. Metab. 2010, 95, 4795–4801. [Google Scholar] [CrossRef] [PubMed]
- Robinovitch, S.N.; McMahon, T.A.; Hayes, W.C. Force attenuation in trochanteric soft tissues during impact from a fall. J. Orthop. Res. 1995, 13, 956–962. [Google Scholar] [CrossRef] [PubMed]
- Johansson, H.; Kanis, J.A.; Oden, A.; McCloskey, E.; Chapurlat, R.D.; Christiansen, C.; Cummings, S.R.; Diez-Perez, A.; Eisman, J.A.; Fujiwara, S.; et al. A meta-analysis of the association of fracture risk and body mass index in women. J. Bone Miner. Res. 2014, 29, 223–233. [Google Scholar] [CrossRef] [PubMed]
- Prieto-Alhambra, D.; Premaor, M.O.; Fina Aviles, F.; Hermosilla, E.; Martinez-Laguna, D.; Carbonell-Abella, C.; Nogues, X.; Compston, J.E.; Diez-Perez, A. The association between fracture and obesity is site-dependent: A population-based study in postmenopausal women. J. Bone Miner. Res. 2012, 27, 294–300. [Google Scholar] [CrossRef] [PubMed]
- Sundh, D.; Rudang, R.; Zoulakis, M.; Nilsson, A.G.; Darelid, A.; Lorentzon, M. A High Amount of Local Adipose Tissue Is Associated with High Cortical Porosity and Low Bone Material Strength in Older Women. J. Bone Miner. Res. 2016, 31, 749–757. [Google Scholar] [CrossRef] [PubMed] [Green Version]
- Paik, J.M.; Rosen, H.N.; Katz, J.N.; Rosner, B.A.; Rimm, E.B.; Gordon, C.M.; Curhan, G.C. BMI, Waist Circumference, and Risk of Incident Vertebral Fracture in Women. Obesity 2019, 27, 1513–1519. [Google Scholar] [CrossRef]
- Sogaard, A.J.; Holvik, K.; Omsland, T.K.; Tell, G.S.; Dahl, C.; Schei, B.; Falch, J.A.; Eisman, J.A.; Meyer, H.E. Abdominal obesity increases the risk of hip fracture. A population-based study of 43,000 women and men aged 60–79 years followed for 8 years. Cohort of Norway. J. Intern. Med. 2015, 277, 306–317. [Google Scholar] [CrossRef] [Green Version]
- Rosen, C.J.; Bouxsein, M.L. Mechanisms of disease: Is osteoporosis the obesity of bone? Nat. Clin. Pract. Rheumatol. 2006, 2, 35–43. [Google Scholar] [CrossRef]
- Kawai, M.; Devlin, M.J.; Rosen, C.J. Fat targets for skeletal health. Nat. Rev. Rheumatol. 2009, 5, 365–372. [Google Scholar] [CrossRef] [Green Version]
- Rosen, C.J.; Klibanski, A. Bone, fat, and body composition: Evolving concepts in the pathogenesis of osteoporosis. Am. J. Med. 2009, 122, 409–414. [Google Scholar] [CrossRef]
- Bredella, M.A.; Fazeli, P.K.; Miller, K.K.; Misra, M.; Torriani, M.; Thomas, B.J.; Ghomi, R.H.; Rosen, C.J.; Klibanski, A. Increased bone marrow fat in anorexia nervosa. J. Clin. Endocrinol. Metab. 2009, 94, 2129–2136. [Google Scholar] [CrossRef] [PubMed]
- Verma, S.; Rajaratnam, J.H.; Denton, J.; Hoyland, J.A.; Byers, R.J. Adipocytic proportion of bone marrow is inversely related to bone formation in osteoporosis. J. Clin. Pathol. 2002, 55, 693–698. [Google Scholar] [CrossRef] [PubMed]
- Beresford, J.N.; Bennett, J.H.; Devlin, C.; Leboy, P.S.; Owen, M.E. Evidence for an inverse relationship between the differentiation of adipocytic and osteogenic cells in rat marrow stromal cell cultures. J. Cell Sci. 1992, 102, 341–351. [Google Scholar] [CrossRef] [PubMed]
- Di Iorgi, N.; Rosol, M.; Mittelman, S.D.; Gilsanz, V. Reciprocal relation between marrow adiposity and the amount of bone in the axial and appendicular skeleton of young adults. J. Clin. Endocrinol. Metab. 2008, 93, 2281–2286. [Google Scholar] [CrossRef] [Green Version]
- Schwartz, A.V.; Sigurdsson, S.; Hue, T.F.; Lang, T.F.; Harris, T.B.; Rosen, C.J.; Vittinghoff, E.; Siggeirsdottir, K.; Sigurdsson, G.; Oskarsdottir, D.; et al. Vertebral bone marrow fat associated with lower trabecular BMD and prevalent vertebral fracture in older adults. J. Clin. Endocrinol. Metab. 2013, 98, 2294–2300. [Google Scholar] [CrossRef]
- Yeung, D.K.; Griffith, J.F.; Antonio, G.E.; Lee, F.K.; Woo, J.; Leung, P.C. Osteoporosis is associated with increased marrow fat content and decreased marrow fat unsaturation: A proton MR spectroscopy study. J. Magn. Reason. Imaging 2005, 22, 279–285. [Google Scholar] [CrossRef]
- Cohen, A.; Dempster, D.W.; Stein, E.M.; Nickolas, T.L.; Zhou, H.; McMahon, D.J.; Muller, R.; Kohler, T.; Zwahlen, A.; Lappe, J.M.; et al. Increased marrow adiposity in premenopausal women with idiopathic osteoporosis. J. Clin. Endocrinol. Metab. 2012, 97, 2782–2791. [Google Scholar] [CrossRef]
- Moore, S.G.; Dawson, K.L. Red and yellow marrow in the femur: Age-related changes in appearance at MR imaging. Radiology 1990, 175, 219–223. [Google Scholar] [CrossRef]
- Al-Safi, Z.A.; Polotsky, A.J. Obesity and menopause. Best Pract. Res. Clin. Obstet. Gynaecol. 2015, 29, 548–553. [Google Scholar] [CrossRef]
- Li, G.; Compston, J.E.; Leslie, W.D.; Thabane, L.; Papaioannou, A.; Lau, A.; Wang, X.; Qin, C.; Chen, B.; Chen, M.; et al. Relationship Between Obesity and Risk of Major Osteoporotic Fracture in Postmenopausal Women: Taking Frailty into Consideration. J. Bone Miner. Res. 2020, 35, 2355–2362. [Google Scholar] [CrossRef]
- Nielson, C.M.; Marshall, L.M.; Adams, A.L.; LeBlanc, E.S.; Cawthon, P.M.; Ensrud, K.; Stefanick, M.L.; Barrett-Connor, E.; Orwoll, E.S. and Osteoporotic Fractures in Men Study Research Group. BMI and fracture risk in older men: The osteoporotic fractures in men study (MrOS). J. Bone Miner. Res. 2011, 26, 496–502. [Google Scholar] [CrossRef] [PubMed] [Green Version]
- Syed, F.A.; Oursler, M.J.; Hefferanm, T.E.; Peterson, J.M.; Riggs, B.L.; Khosla, S. Effects of estrogen therapy on bone marrow adipocytes in postmenopausal osteoporotic women. Osteoporos. Int. 2008, 19, 1323–1330. [Google Scholar] [CrossRef] [PubMed] [Green Version]
- Muruganandan, S.; Roman, A.A.; Sinal, C.J. Adipocyte differentiation of bone marrow-derived mesenchymal stem cells: Cross talk with the osteoblastogenic program. Cell. Mol. Life Sci. 2009, 66, 236–253. [Google Scholar] [CrossRef] [PubMed]
- Okazaki, R.; Inoue, D.; Shibata, M.; Saika, M.; Kido, S.; Ooka, H.; Tomiyama, H.; Sakamoto, Y.; Matsumoto, T. Estrogen promotes early osteoblast differentiation and inhibits adipocyte differentiation in mouse bone marrow stromal cell lines that express estrogen receptor (ER) alpha or beta. Endocrinology 2002, 143, 2349–2356. [Google Scholar] [CrossRef] [PubMed]
- Dang, Z.C.; van Bezooijen, R.L.; Karperien, M.; Papapoulos, S.E.; Lowik, C.W. Exposure of KS483 cells to estrogen enhances osteogenesis and inhibits adipogenesis. J. Bone Miner. Res. 2002, 17, 394–405. [Google Scholar] [CrossRef]
- Hardaway, A.L.; Herroon, M.K.; Rajagurubandara, E.; Podgorski, I. Marrow adipocyte-derived CXCL1 and CXCL2 contribute to osteolysis in metastatic prostate cancer. Clin. Exp. Metastasis 2015, 32, 353–368. [Google Scholar] [CrossRef]
- Iwaniec, U.T.; Turner, R.T. Failure to generate bone marrow adipocytes does not protect mice from ovariectomy-induced osteopenia. Bone 2013, 53, 145–153. [Google Scholar] [CrossRef] [Green Version]
- Fonseca, H.; Moreira-Goncalves, D.; Coriolano, H.J.; Duarte, J.A. Bone quality: The determinants of bone strength and fragility. Sports Med. 2014, 44, 37–53. [Google Scholar] [CrossRef]
- Marques, E.A.; Mota, J.; Carvalho, J. Exercise effects on bone mineral density in older adults: A meta-analysis of randomized controlled trials. Age 2012, 34, 1493–1515. [Google Scholar] [CrossRef] [PubMed] [Green Version]
- Styner, M.; Thompson, W.R.; Galior, K.; Uzer, G.; Wu, X.; Kadari, S.; Case, N.; Xie, Z.; Sen, B.; Romaine, A.; et al. Bone marrow fat accumulation accelerated by high fat diet is suppressed by exercise. Bone 2014, 64, 39–46. [Google Scholar] [CrossRef] [Green Version]
- Styner, M.; Pagnotti, G.M.; Galior, K.; Wu, X.; Thompson, W.R.; Uzer, G.; Sen, B.; Xie, Z.; Horowitz, M.C.; Styner, M.A.; et al. Exercise Regulation of Marrow Fat in the Setting of PPARgamma Agonist Treatment in Female C57BL/6 Mice. Endocrinology 2015, 156, 2753–2761. [Google Scholar] [CrossRef] [PubMed] [Green Version]
- Rosen, A.D. End-point determination in EDTA decalcification using ammonium oxalate. Stain Technol. 1981, 56, 48–49. [Google Scholar] [CrossRef] [PubMed]
- Fonseca, H.; Powers, S.K.; Goncalves, D.; Santos, A.; Mota, M.P.; Duarte, J.A. Physical inactivity is a major contributor to ovariectomy-induced sarcopenia. Int. J. Sports Med. 2012, 33, 268–278. [Google Scholar] [CrossRef] [PubMed]
- Fonseca, H.; Carvalho, A.; Esteves, J.; Esteves, V.I.; Moreira-Goncalves, D.; Duarte, J.A. Effects of doxorubicin administration on bone strength and quality in sedentary and physically active Wistar rats. Osteoporos. Int. 2016, 27, 3465–3475. [Google Scholar] [CrossRef] [PubMed]
- Jepsen, K.J.; Silva, M.J.; Vashishth, D.; Guo, X.E.; van der Meulen, M.C. Establishing biomechanical mechanisms in mouse models: Practical guidelines for systematically evaluating phenotypic changes in the diaphyses of long bones. J. Bone Miner. Res. 2015, 30, 951–966. [Google Scholar] [CrossRef] [PubMed]
- Turner, C.H.; Burr, D.B. Basic biomechanical measurements of bone: A tutorial. Bone 1993, 14, 595–608. [Google Scholar] [CrossRef]
- Fonseca, H.; Moreira-Goncalves, D.; Esteves, J.L.; Viriato, N.; Vaz, M.; Mota, M.P.; Duarte, J.A. Voluntary exercise has long-term in vivo protective effects on osteocyte viability and bone strength following ovariectomy. Calcif. Tissue Int. 2011, 88, 443–454. [Google Scholar] [CrossRef]
- Erben, R.G.; Glosmann, M. Histomorphometry in Rodents. Methods Mol. Biol. 2019, 1914, 411–435. [Google Scholar] [CrossRef]
- Parfitt, A.M.; Drezner, M.K.; Glorieux, F.H.; Kanis, J.A.; Malluche, H.; Meunier, P.J.; Ott, S.M.; Recker, R.R. Bone histomorphometry: Standardization of nomenclature, symbols, and units. Report of the ASBMR Histomorphometry Nomenclature Committee. J. Bone Miner. Res. 1987, 2, 595–610. [Google Scholar] [CrossRef]
- Dalle-Donne, I.; Rossi, R.; Giustarini, D.; Milzani, A.; Colombo, R. Protein carbonyl groups as biomarkers of oxidative stress. Clin. Chim. Acta 2003, 329, 23–38. [Google Scholar] [CrossRef]
- Tchernof, A.; Poehlman, E.T. Effects of the menopause transition on body fatness and body fat distribution. Obes. Res. 1998, 6, 246–254. [Google Scholar] [CrossRef] [PubMed] [Green Version]
- Tchernof, A.; Desmeules, A.; Richard, C.; Laberge, P.; Daris, M.; Mailloux, J.; Rheaume, C.; Dupont, P. Ovarian hormone status and abdominal visceral adipose tissue metabolism. J. Clin. Endocrinol. Metab. 2004, 89, 3425–3430. [Google Scholar] [CrossRef] [PubMed] [Green Version]
- Garaulet, M.; Perez-Llamas, F.; Baraza, J.C.; Garcia-Prieto, M.D.; Fardy, P.S.; Tebar, F.J.; Zamora, S. Body fat distribution in pre-and post-menopausal women: Metabolic and anthropometric variables. J. Nutr. Health Aging 2002, 6, 123–126. [Google Scholar] [PubMed]
- Babaei, P.; Mehdizadeh, R.; Ansar, M.M.; Damirchi, A. Effects of ovariectomy and estrogen replacement therapy on visceral adipose tissue and serum adiponectin levels in rats. Menopause Int. 2010, 16, 100–104. [Google Scholar] [CrossRef]
- Andersson, T.; Soderstrom, I.; Simonyte, K.; Olsson, T. Estrogen reduces 11beta-hydroxysteroid dehydrogenase type 1 in liver and visceral, but not subcutaneous, adipose tissue in rats. Obes. Silver Spring 2010, 18, 470–475. [Google Scholar] [CrossRef]
- Kalleinen, N.; Polo-Kantola, P.; Irjala, K.; Porkka-Heiskanen, T.; Vahlberg, T.; Virkki, A.; Polo, O. 24-hour serum levels of growth hormone, prolactin, and cortisol in pre- and postmenopausal women: The effect of combined estrogen and progestin treatment. J. Clin. Endocrinol. Metab. 2008, 93, 1655–1661. [Google Scholar] [CrossRef] [Green Version]
- Pallottini, V.; Bulzomi, P.; Galluzzo, P.; Martini, C.; Marino, M. Estrogen regulation of adipose tissue functions: Involvement of estrogen receptor isoforms. Infect. Disord. Drug Targets 2008, 8, 52–60. [Google Scholar] [CrossRef]
- De Bisschop, E.; Luypaert, R.; Louis, O.; Osteaux, M. Fat fraction of lumbar bone marrow using in vivo proton nuclear magnetic resonance spectroscopy. Bone 1993, 14, 133–136. [Google Scholar] [CrossRef]
- Elbaz, A.; Rivas, D.; Duque, G. Effect of estrogens on bone marrow adipogenesis and Sirt1 in aging C57BL/6J mice. Biogerontology 2009, 10, 747–755. [Google Scholar] [CrossRef]
- Limonard, E.J.; Veldhuis-Vlug, A.G.; van Dussen, L.; Runge, J.H.; Tanck, M.W.; Endert, E.; Heijboer, A.C.; Fliers, E.; Hollak, C.E.; Akkerman, E.M.; et al. Short-Term Effect of Estrogen on Human Bone Marrow Fat. J. Bone Miner. Res. 2015, 30, 2058–2066. [Google Scholar] [CrossRef]
- Kumar, A.; Ruan, M.; Clifton, K.; Syed, F.; Khosla, S.; Oursler, M.J. TGF-beta mediates suppression of adipogenesis by estradiol through connective tissue growth factor induction. Endocrinology 2012, 153, 254–263. [Google Scholar] [CrossRef] [PubMed] [Green Version]
- Rooney, A.M.; van der Meulen, M.C.H. Mouse models to evaluate the role of estrogen receptor alpha in skeletal maintenance and adaptation. Ann. N. Y. Acad. Sci. 2017, 1410, 85–92. [Google Scholar] [CrossRef] [PubMed]
- Fujita, K.; Roforth, M.M.; Demaray, S.; McGregor, U.; Kirmani, S.; McCready, L.K.; Peterson, J.M.; Drake, M.Y.; Monroe, D.G.; Khosla, S. Effects of estrogen on bone mRNA levels of sclerostin and other genes relevant to bone metabolism in postmenopausal women. J. Clin. Endocrinol. Metab. 2014, 99, E81–E88. [Google Scholar] [CrossRef] [PubMed]
- Fairfield, H.; Falank, C.; Harris, E.; Demambro, V.; McDonald, M.; Pettitt, J.A.; Mohanty, S.T.; Croucher, P.; Kramer, I.; Kneissel, M.; et al. The skeletal cell-derived molecule sclerostin drives bone marrow adipogenesis. J. Cell Physiol. 2018, 233, 1156–1167. [Google Scholar] [CrossRef]
- Du, D.; Zhou, Z.; Zhu, L.; Hu, X.; Lu, J.; Shi, C.; Chen, F.; Chen, A. TNF-alpha suppresses osteogenic differentiation of MSCs by accelerating P2Y2 receptor in estrogen-deficiency induced osteoporosis. Bone 2018, 117, 161–170. [Google Scholar] [CrossRef]
- Kaneki, H.; Guo, R.; Chen, D.; Yao, Z.; Schwarz, E.M.; Zhang, Y.E.; Boyce, B.F.; Xing, L. Tumor necrosis factor promotes Runx2 degradation through up-regulation of Smurf1 and Smurf2 in osteoblasts. J. Biol. Chem. 2006, 281, 4326–4333. [Google Scholar] [CrossRef] [Green Version]
- Li, J.; Liu, X.; Zuo, B.; Zhang, L. The Role of Bone Marrow Microenvironment in Governing the Balance between Osteoblastogenesis and Adipogenesis. Aging Dis. 2016, 7, 514–525. [Google Scholar] [CrossRef] [Green Version]
- Zhu, K.; Hunter, M.; James, A.; Lim, E.M.; Cooke, B.R.; Walsh, J.P. Relationship between visceral adipose tissue and bone mineral density in Australian baby boomers. Osteoporos. Int. 2020, 31, 2439–2448. [Google Scholar] [CrossRef]
- Dolinkova, M.; Dostalova, I.; Lacinova, Z.; Michalsky, D.; Haluzikova, D.; Mraz, M.; Kasalicky, M. and Haluzik. M. The endocrine profile of subcutaneous and visceral adipose tissue of obese patients. Mol. Cell. Endocrinol. 2008, 291, 63–70. [Google Scholar] [CrossRef] [Green Version]
- Pou, K.M.; Massaro, J.M.; Hoffmann, U.; Vasan, R.S.; Maurovich-Horvat, P.; Larson, M.G.; Keaney, J.F.; Meigs, J.B.; Lipinska, I.; Kathiresan, S.; et al. Visceral and subcutaneous adipose tissue volumes are cross-sectionally related to markers of inflammation and oxidative stress: The Framingham Heart Study. Circulation 2007, 116, 1234–1241. [Google Scholar] [CrossRef] [Green Version]
- Bredella, M.A.; Torriani, M.; Ghomi, R.H.; Thomas, B.J.; Brick, D.J.; Gerweck, A.V.; Harrington, L.M.; Breggia, A.; Rosen, C.J.; Miller, K.K. Determinants of bone mineral density in obese premenopausal women. Bone 2011, 48, 748–754. [Google Scholar] [CrossRef] [PubMed] [Green Version]
- Pittenger, M.F.; Mackay, A.M.; Beck, S.C.; Jaiswal, R.K.; Douglas, R.; Mosca, J.D.; Moorman, M.A.; Simonetti, D.W.; Craig, S.; Marshak, D.R. Multilineage potential of adult human mesenchymal stem cells. Science 1999, 284, 143–147. [Google Scholar] [CrossRef] [PubMed] [Green Version]
- Gimble, J.M.; Zvonic, S.; Floyd, Z.E.; Kassem, M.; Nuttall, M.E. Playing with bone and fat. J. Cell. Biochem. 2006, 98, 251–266. [Google Scholar] [CrossRef]
- Wang, D.; Haile, A.; Jones, L.C. Dexamethasone-induced lipolysis increases the adverse effect of adipocytes on osteoblasts using cells derived from human mesenchymal stem cells. Bone 2013, 53, 520–530. [Google Scholar] [CrossRef] [PubMed]
- Elbaz, A.; Wu, X.; Rivas, D.; Gimble, J.M.; Duque, G. Inhibition of fatty acid biosynthesis prevents adipocyte lipotoxicity on human osteoblasts in vitro. J. Cell. Mol. Med. 2010, 14, 982–991. [Google Scholar] [CrossRef]
- Beekman, K.M.; Zwaagstra, M.; Veldhuis-Vlug, A.G.; van Essen, H.W.; den Heijer, M.; Maas, M.; Kerckhofs, G.; Parac-Vogt, T.N.; Bisschop, P.H.; Bravenboer, N. Ovariectomy increases RANKL protein expression in bone marrow adipocytes of C3H/HeJ mice. Am. J. Physiol. Endocrinol. Metab. 2019, 317, E1050–E1054. [Google Scholar] [CrossRef] [PubMed]
- Yu, W.; Zhong, L.; Yao, L.; Wei, Y.; Gui, T.; Li, Z.; Kim, H.; Holdreith, N.; Jiang, X.; Tong, W.; et al. Bone marrow adipogenic lineage precursors promote osteoclastogenesis in bone remodeling and pathologic bone loss. J. Clin. Invest. 2021, 131. [Google Scholar] [CrossRef] [PubMed]
- Wan, Y.; Chong, L.W.; Evans, R.M. PPAR-gamma regulates osteoclastogenesis in mice. Nat. Med. 2007, 13, 1496–1503. [Google Scholar] [CrossRef]
- Yuzefovych, L.V.; Musiyenko, S.I.; Wilson, G.L.; Rachek, L.I. Mitochondrial DNA damage and dysfunction, and oxidative stress are associated with endoplasmic reticulum stress, protein degradation and apoptosis in high fat diet-induced insulin resistance mice. PLoS ONE 2013, 8, e54059. [Google Scholar] [CrossRef]
- Al Saedi, A.; Bermeo, S.; Plotkin, L.; Myers, D.E.; Duque, G. Mechanisms of palmitate-induced lipotoxicity in osteocytes. Bone 2019, 127, 353–359. [Google Scholar] [CrossRef]
- Duarte, F.O.; Gomes-Gatto, C.D.V.; Oishi, J.C.; Lino, A.D.S.; Stotzer, U.S.; Rodrigues, M.F.C.; Gatti da Silva, G.H.; Selistre-de-Araujo, H.S. Physical training improves visceral adipose tissue health by remodelling extracellular matrix in rats with estrogen absence: A gene expression analysis. Int. J. Exp. Pathol. 2017, 98, 203–213. [Google Scholar] [CrossRef] [PubMed]
- Styner, M.; Pagnotti, G.M.; McGrath, C.; Wu, X.; Sen, B.; Uzer, G.; Xie, Z.; Zong, X.; Styner, M.A.; Rubin, C.T.; et al. Exercise Decreases Marrow Adipose Tissue Through ss-Oxidation in Obese Running Mice. J. Bone Miner. Res. 2017, 32, 1692–1702. [Google Scholar] [CrossRef] [PubMed] [Green Version]
- Rogers, N.H.; Perfield, J.W.; Strissel, K.J.; Obin, M.S.; Greenberg, A.S. Reduced energy expenditure and increased inflammation are early events in the development of ovariectomy-induced obesity. Endocrinology 2009, 150, 2161–2168. [Google Scholar] [CrossRef] [PubMed]
- Shimomura, Y.; Shimizu, H.; Takahashi, M.; Sato, N.; Uehara, Y.; Fukatsu, A.; Negishi, M.; Kobayashi, I.; Kobayashi, S. The significance of decreased ambulatory activity during the generation by long-term observation of obesity in ovariectomized rats. Physiol. Behav. 1990, 47, 155–159. [Google Scholar] [CrossRef]
- Musatov, S.; Chen, W.; Pfaff, D.W.; Mobbs, C.V.; Yang, X.J.; Clegg, D.J.; Kaplitt, M.G.; Ogawa, S. Silencing of estrogen receptor alpha in the ventromedial nucleus of hypothalamus leads to metabolic syndrome. Proc. Natl. Acad. Sci. USA 2007, 104, 2501–2506. [Google Scholar] [CrossRef] [Green Version]


| OVX | SHAM | ||||||||||
|---|---|---|---|---|---|---|---|---|---|---|---|
| N | Mean | SD | N | Mean | SD | p | Mean dif. | 95% CI | Cohen d | ||
| Food intake (g/week) | 13 | 132.4 | 18.6 | 12 | 134.2 | 22.0 | 0.831 | −1.8 | −18.5 | 15.0 | −0.09 |
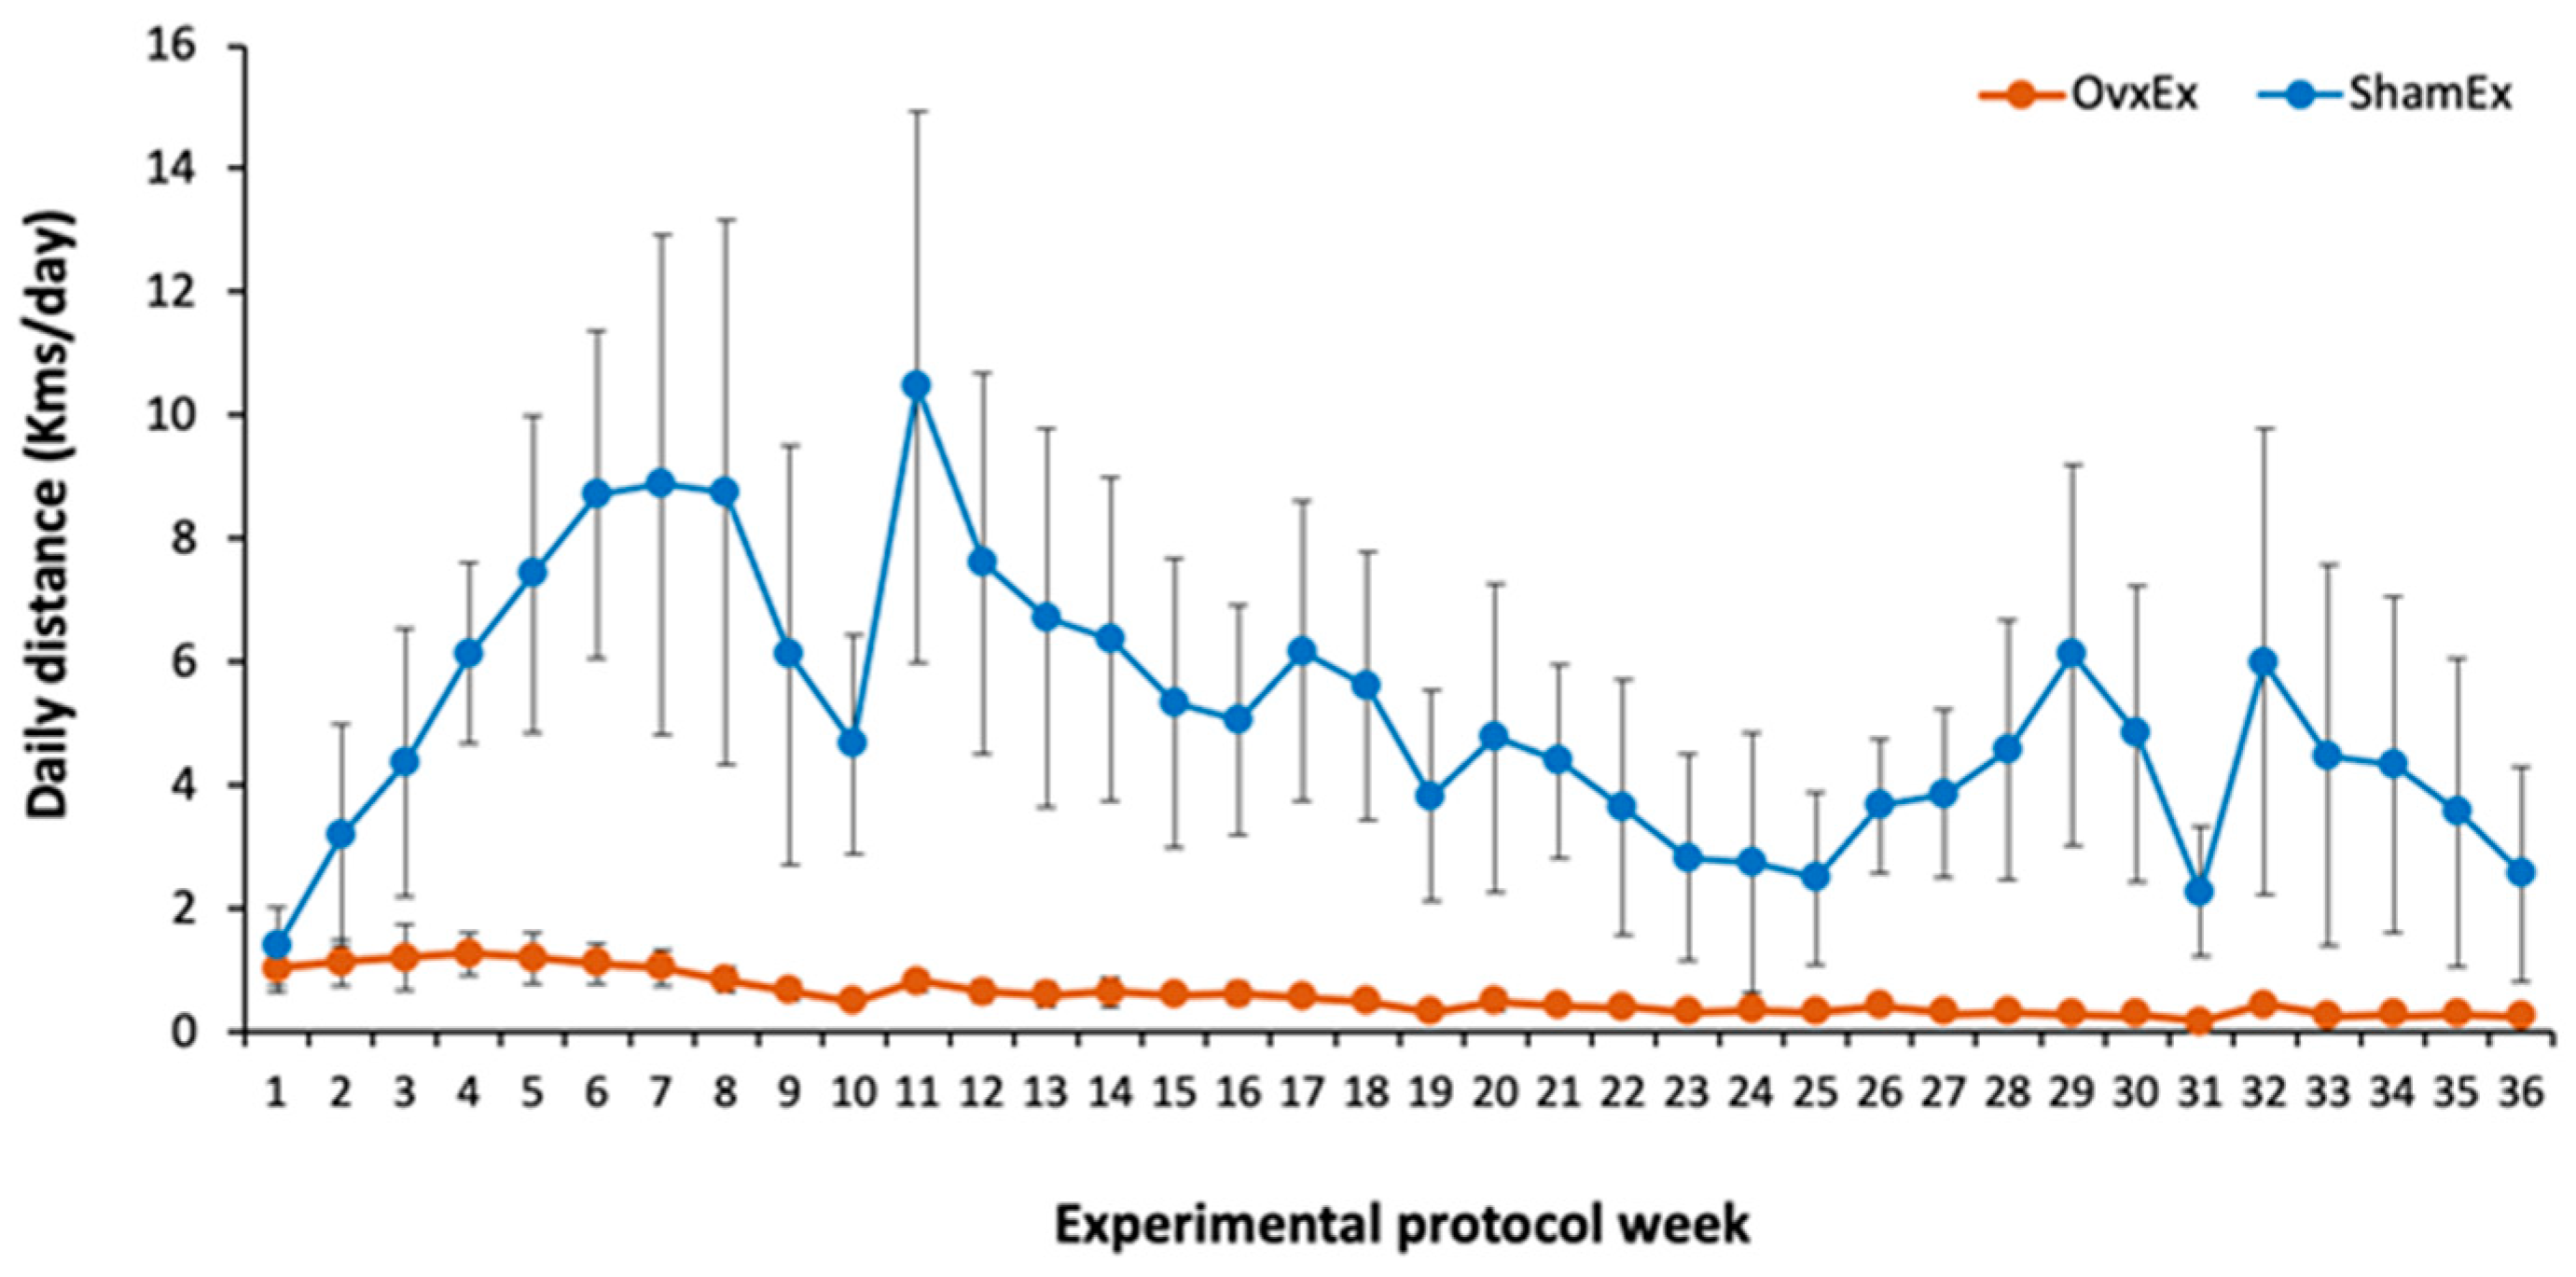
| Running wheel (Km/w) | 7 | 2.98 | 0.69 | 6 | 34.95 | 12.83 | <0.001 | −33.69 | −42.51 | −25.36 | −3.69 |
| Initial BW (g) | 13 | 263 | 23 | 12 | 256 | 20 | 0.378 | 7.7 | −10.0 | 25.4 | 0.36 |
| * BW at sacrifice (g) | 13 | 379.3 | 37.7 | 12 | 312.1 | 38.7 | <0.001 | 73.9 | 35.0 | 100.0 | 1.76 |
| BW gain (g) | 13 | 46.0 | 12.9 | 12 | 22.8 | 13.6 | <0.001 | 23.2 | 12.2 | 34.1 | 1.75 |
| Visceral fat (g) | 13 | 32.4 | 8.9 | 12 | 17.9 | 11.2 | 0.002 | 14.5 | 6.2 | 22.8 | 1.44 |
| * OC (ng.mL−1) | 10 | 76.33 | 29.20 | 10 | 56.78 | 20.23 | 0.143 | 15.78 | −6.06 | 41.04 | 0.78 |
| CTX-I (ng.mL−1) | 13 | 13.16 | 2.20 | 12 | 11.24 | 1.89 | 0.028 | 1.93 | 0.22 | 3.63 | 0.94 |
| * Ct.Ar (mm2) | 13 | 5.173 | 0.340 | 12 | 5.280 | 0.376 | 0.650 | −0.083 | −0.443 | 0.170 | −0.30 |
| Ct.Th (μm) | 13 | 591.3 | 46.3 | 12 | 641.3 | 37.7 | 0.007 | −50.0 | −85.1 | −14.8 | −1.18 |
| * Po.Ar/Ct.Ar (%) | 13 | 1.369 | 1.098 | 12 | 1.175 | 0.725 | 0.936 | 0.020 | −0.503 | 0.683 | 0.21 |
| * F.Ar/Ma.Ar (%) | 13 | 53.76 | 6.33 | 12 | 20.25 | 10.84 | <0.001 | 34.98 | 24.61 | 42.01 | 3.82 |
| BV/TV (%) | 13 | 8.69 | 4.18 | 12 | 25.48 | 6.89 | <0.001 | −16.79 | −21.46 | -12.12 | −2.98 |
| Tb.Th (μm) | 13 | 63.01 | 7.92 | 12 | 60.50 | 6.17 | 0.389 | 2.51 | −3.40 | 8.42 | 0.35 |
| *Tb.N (/mm2) | 13 | 1.344 | 0.515 | 12 | 4.154 | 0.846 | <0.001 | −2.88 | −3.43 | −2.30 | −4.05 |
| *Tb.Sp (μm) | 13 | 786.8 | 323.8 | 12 | 192.3 | 71.7 | <0.001 | 559.4 | 367.2 | 838.0 | 2.49 |
| N.Ot/B.Ar (/mm2) | 13 | 605 | 50 | 12 | 648 | 47 | 0.040 | −42 | −83 | −2 | −0.87 |
| N.Lc/B.Ar (/mm2) | 13 | 312 | 89 | 12 | 318 | 63 | 0.858 | −6 | −69 | 58 | −0.07 |
| * Oc.N/Lc.N | 13 | 2.209 | 1.140 | 12 | 2.143 | 0.608 | 0.574 | −0.115 | −0.570 | 0.410 | 0.07 |
| TUNEL N.Ot+/B.Ar (/mm2) | 12 | 261 | 176 | 12 | 294 | 105 | 0.587 | −33 | −155 | 90 | −0.22 |
| TUNEL N.Ot−/B.Ar (/mm2) | 12 | 404 | 140 | 12 | 411 | 83 | 0.886 | −7 | −104 | 91 | −0.06 |
| TUNEL N.Ot+/N.Ot total (%) | 12 | 38 | 20 | 12 | 41 | 13 | 0.676 | −3 | −18 | 12 | −0.17 |
| Carbonyl N.Ot+/B.Ar (/mm2) | 10 | 276 | 35 | 10 | 225 | 48 | 0.015 | 51 | 11 | 91 | 1.21 |
| Carbonyl N.Ot−/B.Ar (/mm2) | 11 | 333 | 75 | 11 | 453 | 96 | 0.004 | −121 | −198 | −44 | −1.40 |
| Carbonyl N.Ot+/N.Ot total (%) | 11 | 45 | 8 | 11 | 34 | 9 | 0.008 | 10 | 3 | 18 | 1.27 |
| MS/BS (%) | 6 | 43.1 | 11.5 | 8 | 51.9 | 12.1 | 0.198 | −8.8 | −22.8 | 5.2 | −0.74 |
| * MAR (μm.d−1) | 6 | 0.442 | 0.053 | 8 | 0.606 | 0.200 | 0.142 | −0.115 | −0.413 | 0.017 | −1.05 |
| * BFR (µm2/µm/d) | 6 | 1.097 | 0.390 | 8 | 1.167 | 0.254 | 0.491 | −0.143 | −0.420 | 0.284 | −0.22 |
| Young´s Modulus (MPa) | 13 | 15185 | 3040 | 12 | 16900 | 2602 | 0.145 | −1715 | −4066 | 636 | −0.60 |
| Maximal Stress (MPa) | 13 | 236.2 | 32.6 | 12 | 267.6 | 29.4 | 0.019 | −31.4 | −57.2 | −5.7 | −1.01 |
| Toughness to Yield (MPa) | 13 | 1.327 | 0.376 | 12 | 1.517 | 0.295 | 0.177 | −0.189 | −0.471 | 0.092 | −0.56 |
| Postyield toughness (MPa) | 13 | 2.041 | 0.532 | 12 | 2.094 | 0.955 | 0.863 | −0.053 | −0.686 | 0.580 | −0.07 |
| * Yield Strain (%) | 13 | 1.31 | 0.025 | 12 | 1.36 | 0.12 | 0.225 | −0.06 | −0.22 | 0.11 | −0.29 |
| * Yield Stress (MPa) | 13 | 185.1 | 32.8 | 12 | 209.8 | 34.6 | 0.123 | −18.5 | −50.8 | 3.9 | −0.73 |
| * Ultimate strain (%) | 13 | 2.27 | 0.39 | 12 | 2.24 | 0.35 | 1.000 | 0.03 | −0.28 | 0.34 | 0.09 |
| * Toughness (MJ) | 13 | 3.368 | 0.700 | 12 | 3.611 | 0.790 | 0.470 | −0.201 | −0.801 | 0.402 | −0.33 |
| Sedentary | Physically Active | ||||||||||
|---|---|---|---|---|---|---|---|---|---|---|---|
| N | Mean | SD | N | Mean | SD | p | Mean dif. | 95% CI | Cohen d | ||
| Food intake (g/week) | 12 | 116.1 | 8.6 | 13 | 149.2 | 12.3 | <0.001 | −33.1 | −41.9 | −24.2 | −3.09 |
| Initial BW (g) | 12 | 268.5 | 22.4 | 13 | 251.8 | 17.3 | 0.048 | 16.7 | 0.2 | 33.2 | 0.84 |
| * BW at sacrifice (g) | 12 | 343.6 | 40.2 | 13 | 350.2 | 60.3 | 0.852 | −6.6 | −49.4 | 36.3 | −0.13 |
| BW gain (g) | 12 | 28.4 | 12.5 | 13 | 40.8 | 19.8 | 0.075 | −12.5 | −26.3 | 1.4 | −0.75 |
| Visceral fat (g) | 12 | 28.1 | 7.9 | 13 | 23.0 | 15.2 | 0.299 | 5.1 | −4.9 | 15.2 | 0.42 |
| * OC (ng.mL−1) | 9 | 73.7 | 32.9 | 11 | 60.7 | 19.4 | 0.370 | 13.0 | −11.8 | 37.8 | 0.50 |
| CTX-I (ng.mL−1) | 12 | 12.92 | 2.72 | 13 | 11.61 | 1.54 | 0.161 | 1.31 | −0.58 | 3.19 | 0.60 |
| * Ct.Ar (mm2) | 12 | 5.173 | 0.385 | 13 | 5.272 | 0.332 | 0.538 | −0.099 | −0.395 | 0.198 | −0.28 |
| Ct.Th (μm) | 12 | 595.4 | 40.8 | 13 | 633.6 | 49.6 | 0.048 | −38.2 | −76.0 | −0.4 | −0.84 |
| * Po.Ar/Ct.Ar (%) | 12 | 1.90 | 0.99 | 13 | 0.70 | 0.26 | <0.001 | 1.20 | 0.56 | 1.84 | 1.69 |
| * F.Ar/Ma.Ar (%) | 12 | 40.3 | 15.8 | 13 | 35.2 | 22.1 | 0.810 | 5.1 | −10.8 | 20.9 | 0.26 |
| BV/TV (%) | 12 | 13.84 | 10.27 | 13 | 19.43 | 9.73 | 0.176 | −5.59 | −13.86 | 2.69 | −0.56 |
| Tb.Th (μm) | 12 | 58.17 | 6.60 | 13 | 65.16 | 5.96 | 0.011 | −7.00 | −12.19 | −1.80 | −1.12 |
| * Tb.N (/mm2) | 12 | 2.38 | 1.66 | 13 | 2.98 | 1.52 | 0.137 | −0.61 | −1.92 | 0.71 | −0.38 |
| * Tb.Sp (μm) | 12 | 640 | 470 | 13 | 374 | 232 | 0.110 | 266 | −53 | 585 | 0.73 |
| N.Ot/B.Ar (/mm2) | 12 | 598 | 50 | 13 | 651 | 42 | 0.009 | −53 | −90 | −15 | −1.15 |
| N.Lc/B.Ar (/mm2) | 12 | 370 | 40 | 13 | 264 | 65 | <0.001 | 106 | 61 | 150 | 1.95 |
| * Oc.N/Lc.N | 12 | 1.64 | 0.22 | 13 | 2.68 | 1.02 | <0.001 | −1.04 | −1.66 | −0.42 | −1.39 |
| TUNEL N.Ot+/B.Ar (/mm2) | 12 | 372 | 138 | 12 | 183 | 66 | <0.001 | 188 | 97 | 280 | 1.74 |
| TUNEL N.Ot-/B.Ar (/mm2) | 12 | 325 | 71 | 12 | 489 | 83 | <0.001 | −164 | −229 | −98 | −2.12 |
| TUNEL N.Ot+/N.Ot total (%) | 12 | 52.1 | 13.2 | 12 | 27.3 | 9.2 | <0.001 | 24.8 | 15.2 | 34.5 | 2.18 |
| Carbonil N.Ot+/B.Ar (/mm2) | 9 | 245 | 51 | 11 | 255 | 49 | 0.674 | −10 | −57 | 37 | −0.19 |
| Carbonil N.Ot-/B.Ar (/mm2) | 11 | 367 | 110 | 11 | 419 | 97 | 0.257 | −52 | −144 | 41 | −0.50 |
| Carbonil N.Ot+/N.Ot total (%) | 11 | 40.8 | 10.2 | 11 | 38.4 | 9.5 | 0.572 | 2.4 | −6.3 | 11.2 | 0.25 |
| MS/BS (%) | 6 | 48.5 | 13.0 | 8 | 47.8 | 12.6 | 0.925 | 0.7 | −14.4 | 15.7 | 0.05 |
| * MAR (μm.d−1) | 6 | 0.482 | 0.071 | 8 | 0.576 | 0.217 | 0.852 | −0.094 | −0.280 | 0.093 | −0.54 |
| * BFR (µm2/µm/d) | 6 | 1.022 | 0.147 | 8 | 1.223 | 0.374 | 0.414 | −0.201 | −0.555 | 0.154 | −0.67 |
| Young Modulus (MPa) | 12 | 15030 | 3205 | 13 | 16912 | 2392 | 0.108 | −1882 | −4209 | 445 | −0.67 |
| Maximal Stress (MPa) | 12 | 235.9 | 34.6 | 13 | 265.5 | 28.5 | 0.028 | −29.6 | −55.7 | −3.4 | −0.94 |
| Toughness to Yield (MPa) | 12 | 1.296 | 0.360 | 13 | 1.532 | 0.303 | 0.088 | −0.236 | −0.511 | 0.038 | −0.71 |
| Postyield toughness (MPa) | 12 | 2.127 | 0.900 | 13 | 2.011 | 0.609 | 0.708 | 0.116 | −0.515 | 0.747 | 0.15 |
| * Yield Strain (%) | 12 | 1.33 | 0.24 | 13 | 1.34 | 0.16 | 0.650 | −0.02 | −0.18 | 0.15 | −0.08 |
| * Yield Stress (MPa) | 12 | 182.3 | 35.6 | 13 | 210.4 | 30.3 | 0.168 | −28.1 | −55.4 | −0.9 | −0.85 |
| * Ultimate strain (%) | 12 | 2.33 | 0.43 | 13 | 2.19 | 0.30 | 0.470 | 0.13 | −0.17 | 0.44 | 0.37 |
| * Toughness (MPa) | 12 | 3.422 | 0.916 | 13 | 3.542 | 0.563 | 0.437 | −0.120 | −0.743 | 0.503 | −0.16 |
Publisher’s Note: MDPI stays neutral with regard to jurisdictional claims in published maps and institutional affiliations. |
© 2021 by the authors. Licensee MDPI, Basel, Switzerland. This article is an open access article distributed under the terms and conditions of the Creative Commons Attribution (CC BY) license (https://creativecommons.org/licenses/by/4.0/).
Share and Cite
Fonseca, H.; Bezerra, A.; Coelho, A.; Duarte, J.A. Association between Visceral and Bone Marrow Adipose Tissue and Bone Quality in Sedentary and Physically Active Ovariectomized Wistar Rats. Life 2021, 11, 478. https://0-doi-org.brum.beds.ac.uk/10.3390/life11060478
Fonseca H, Bezerra A, Coelho A, Duarte JA. Association between Visceral and Bone Marrow Adipose Tissue and Bone Quality in Sedentary and Physically Active Ovariectomized Wistar Rats. Life. 2021; 11(6):478. https://0-doi-org.brum.beds.ac.uk/10.3390/life11060478
Chicago/Turabian StyleFonseca, Hélder, Andrea Bezerra, Ana Coelho, and José Alberto Duarte. 2021. "Association between Visceral and Bone Marrow Adipose Tissue and Bone Quality in Sedentary and Physically Active Ovariectomized Wistar Rats" Life 11, no. 6: 478. https://0-doi-org.brum.beds.ac.uk/10.3390/life11060478