
Exploring and Identifying Prognostic Phenotypes of Patients with Heart Failure Guided by Explainable Machine Learning

 , , ,
, , ,
Abstract
:1. Introduction
2. Materials and Methods
2.1. Data Collection
2.2. Preprocessing and Statistical Analysis
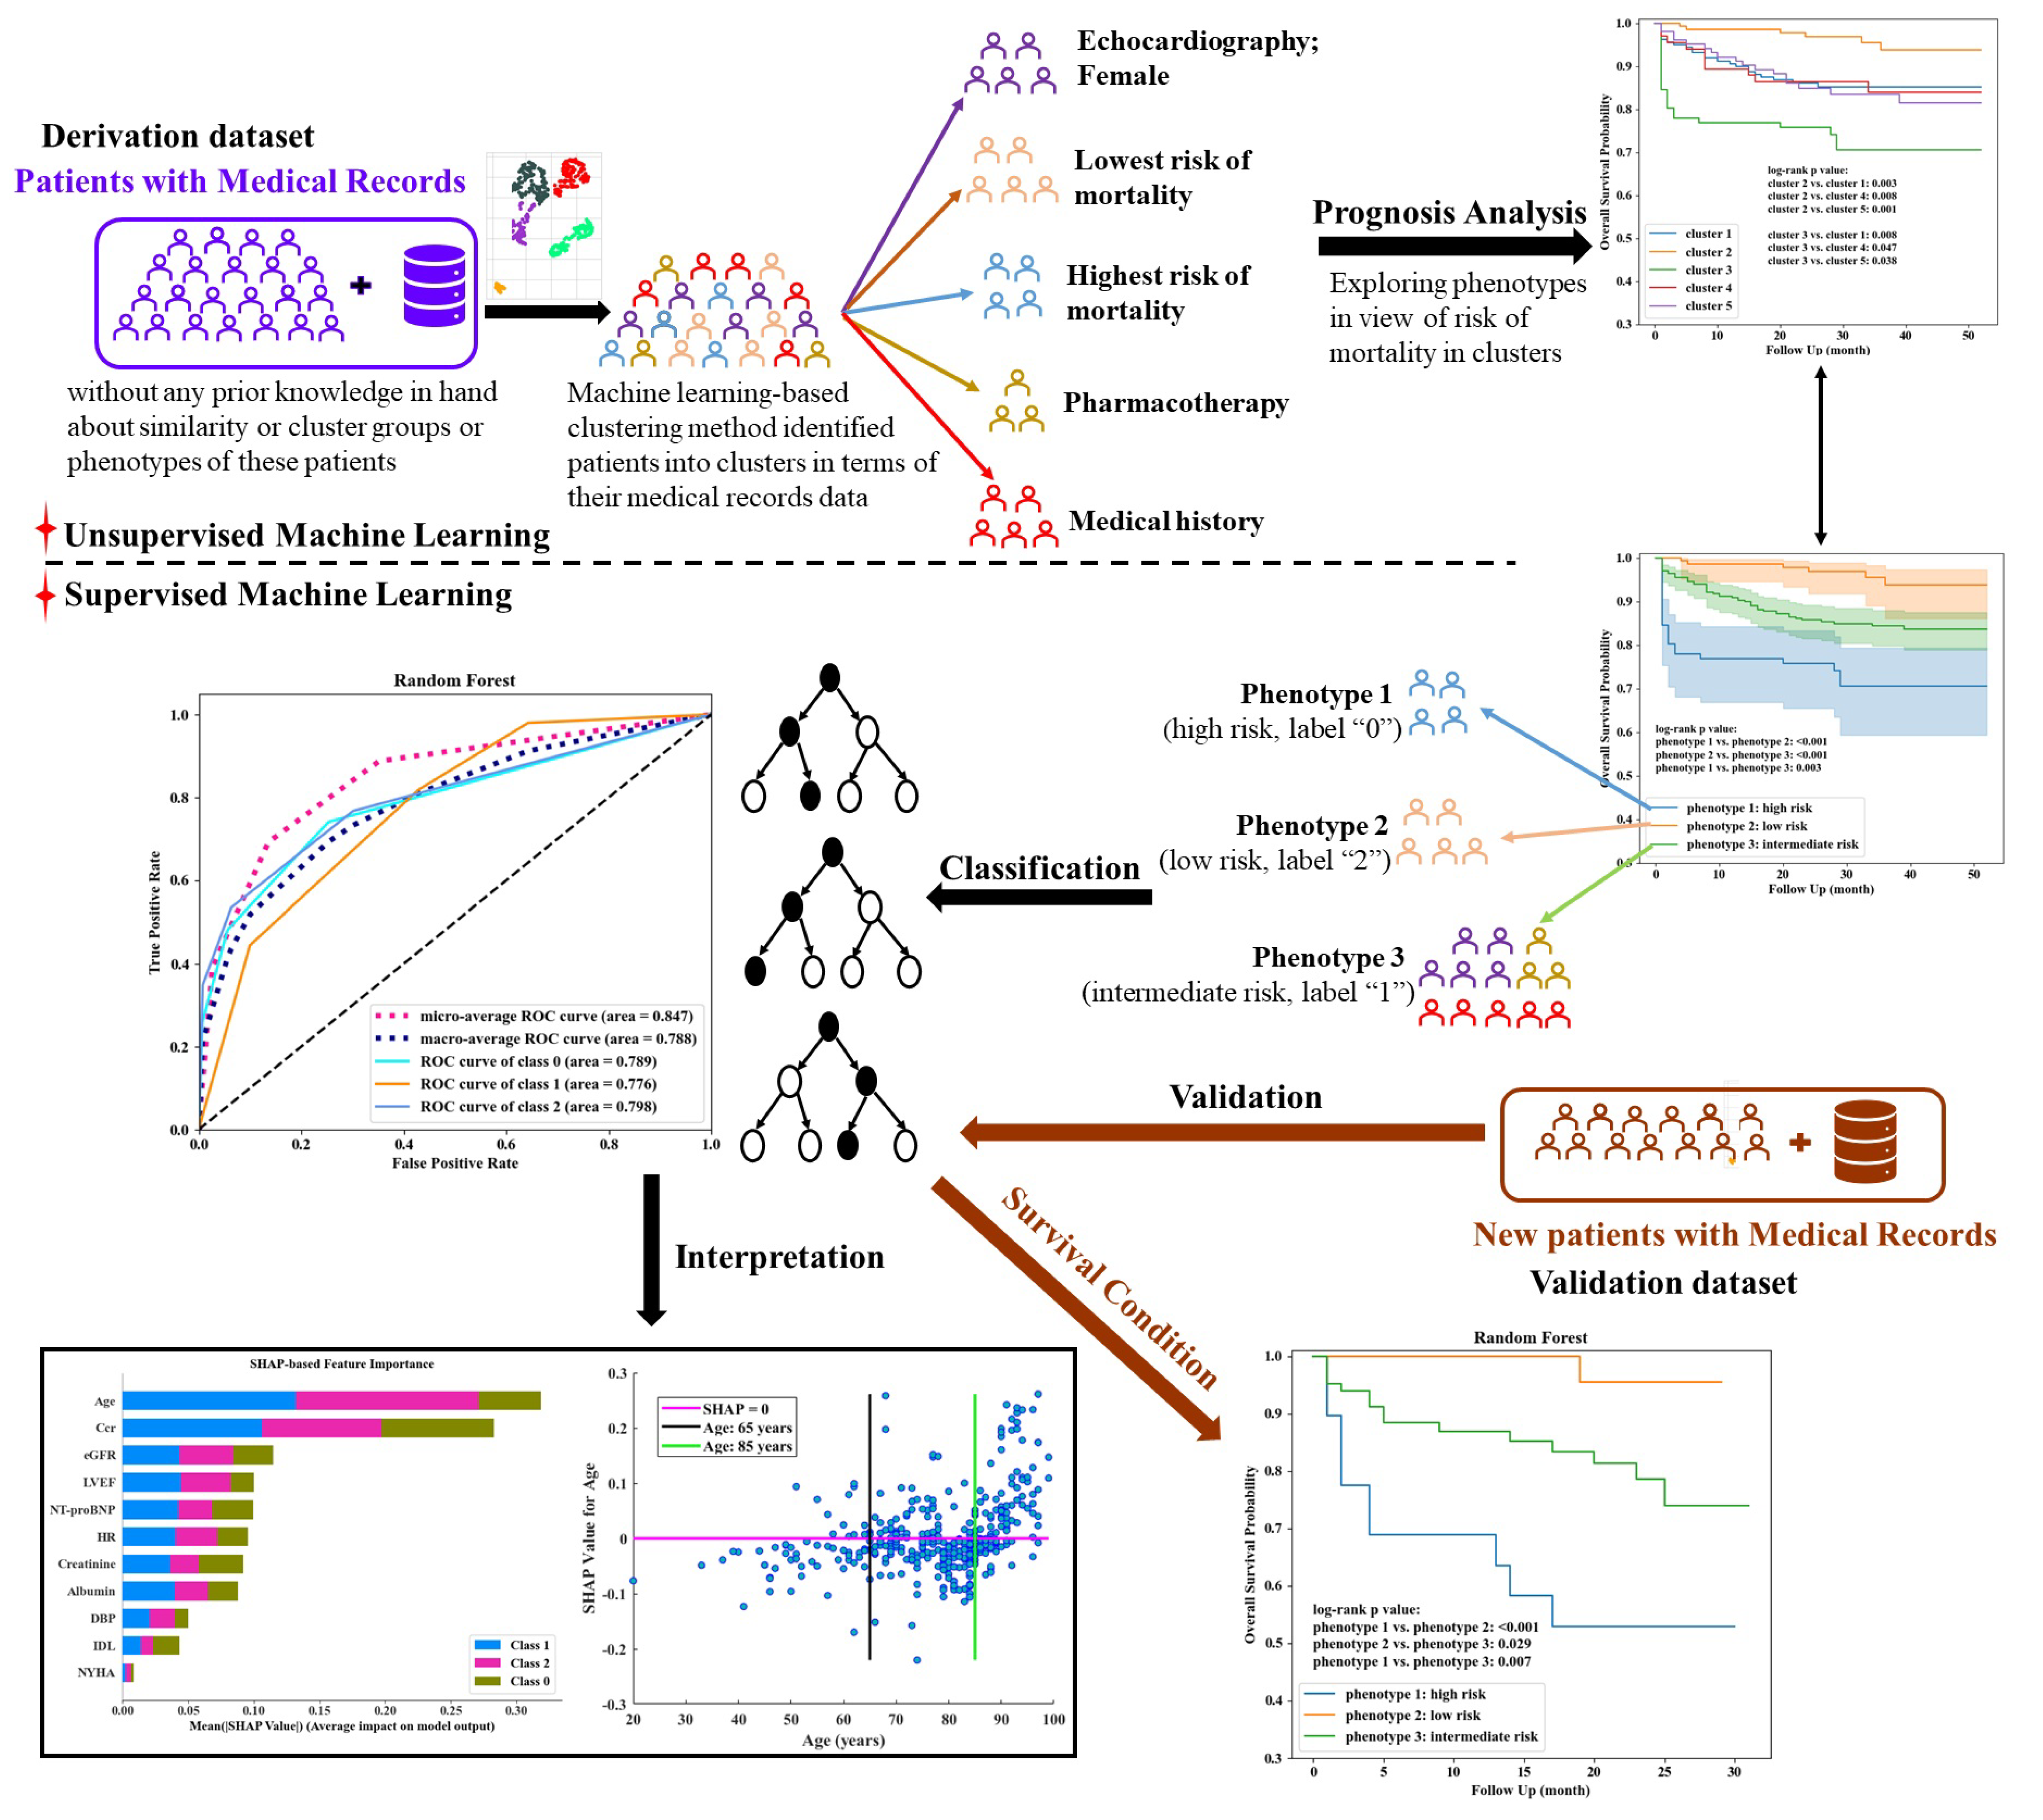
2.3. Phenotype Exploration and Classification
3. Results
3.1. Characteristics of Patients
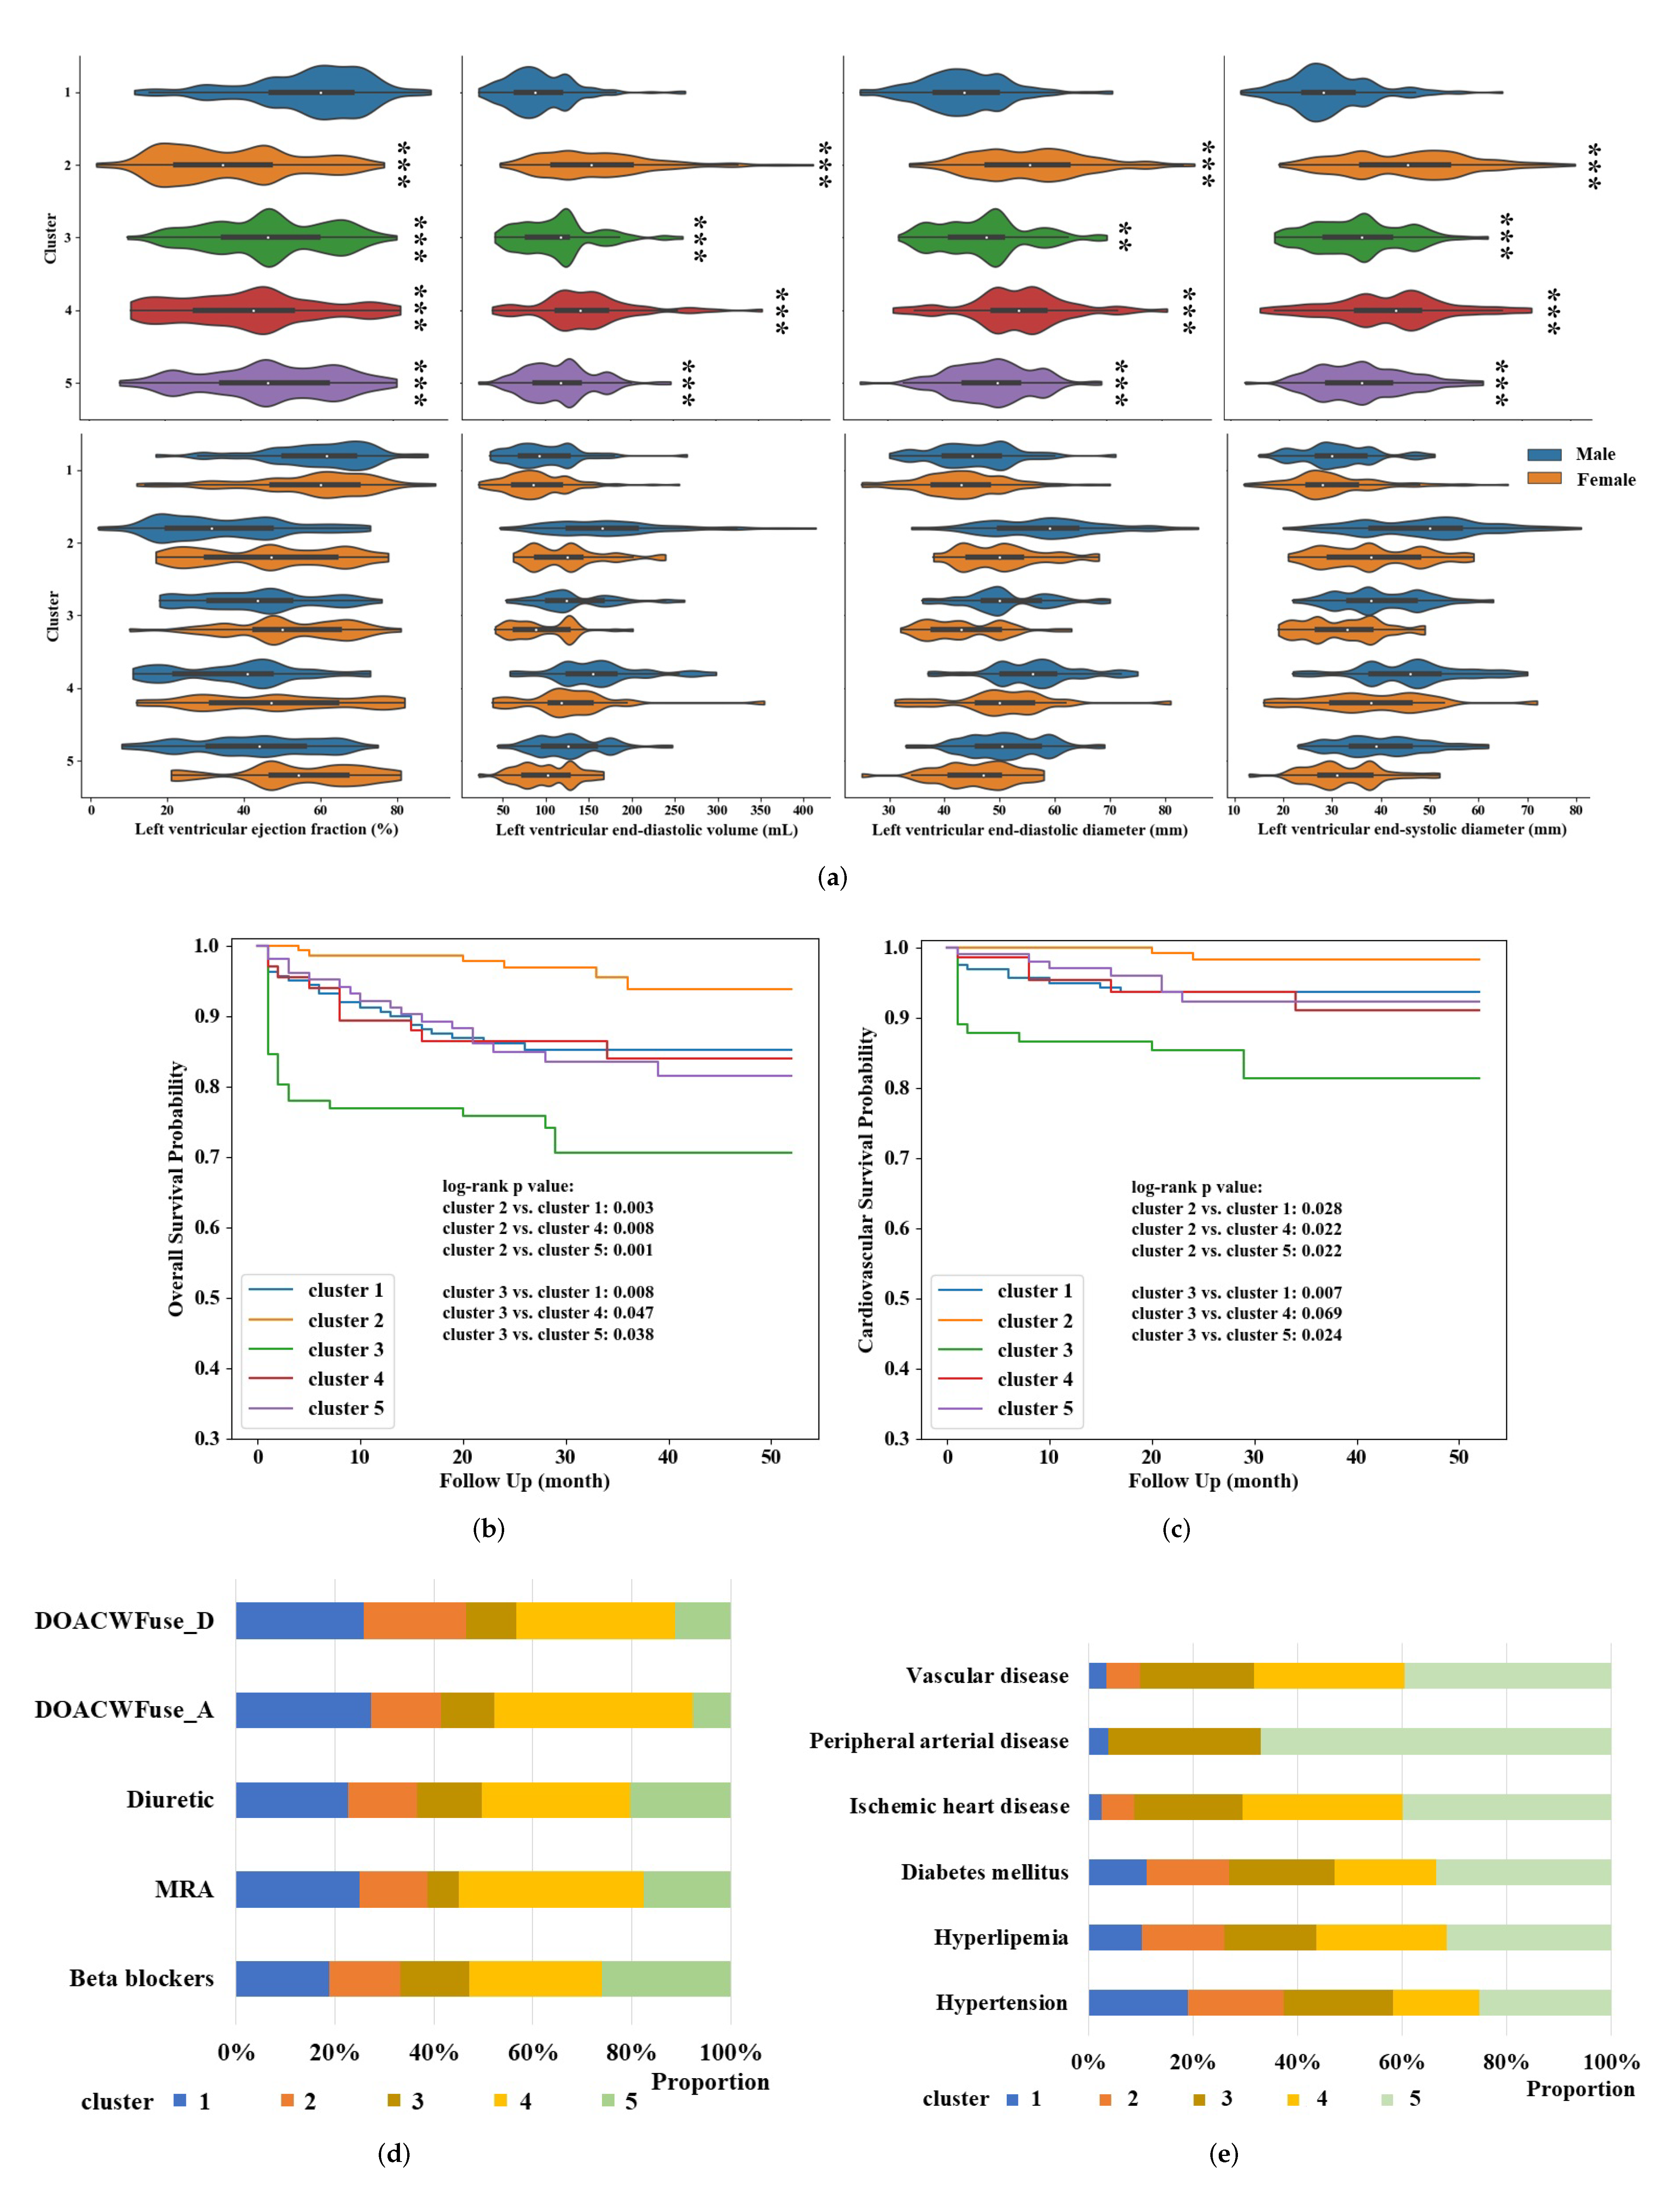
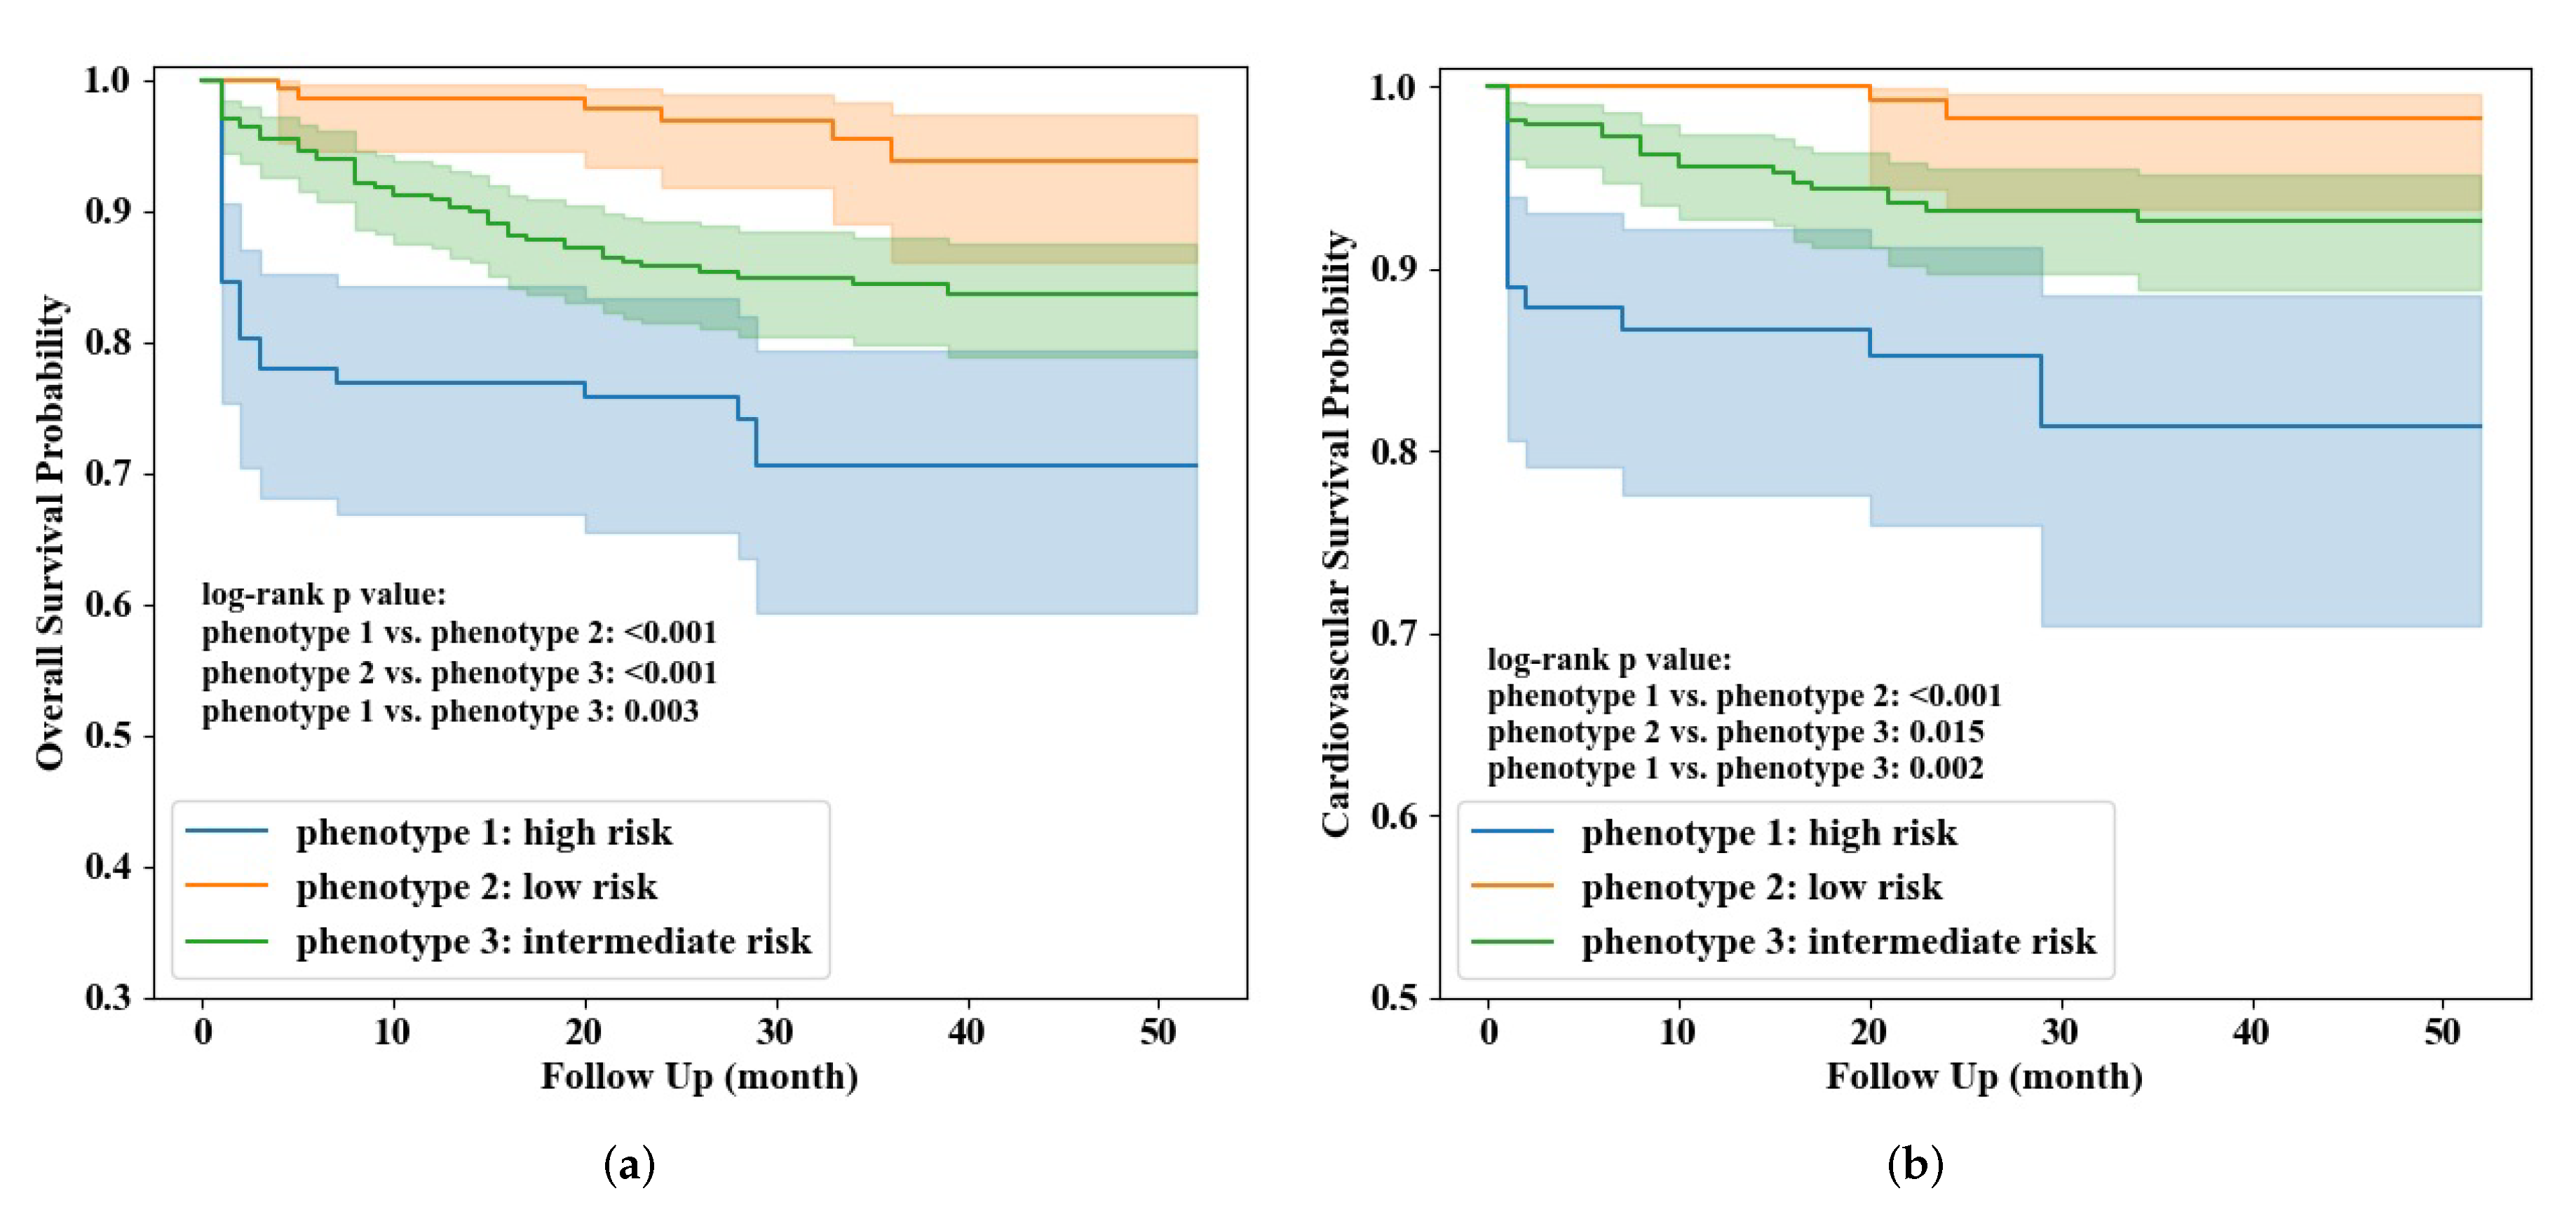
3.2. Phenotype Exploration and Identification
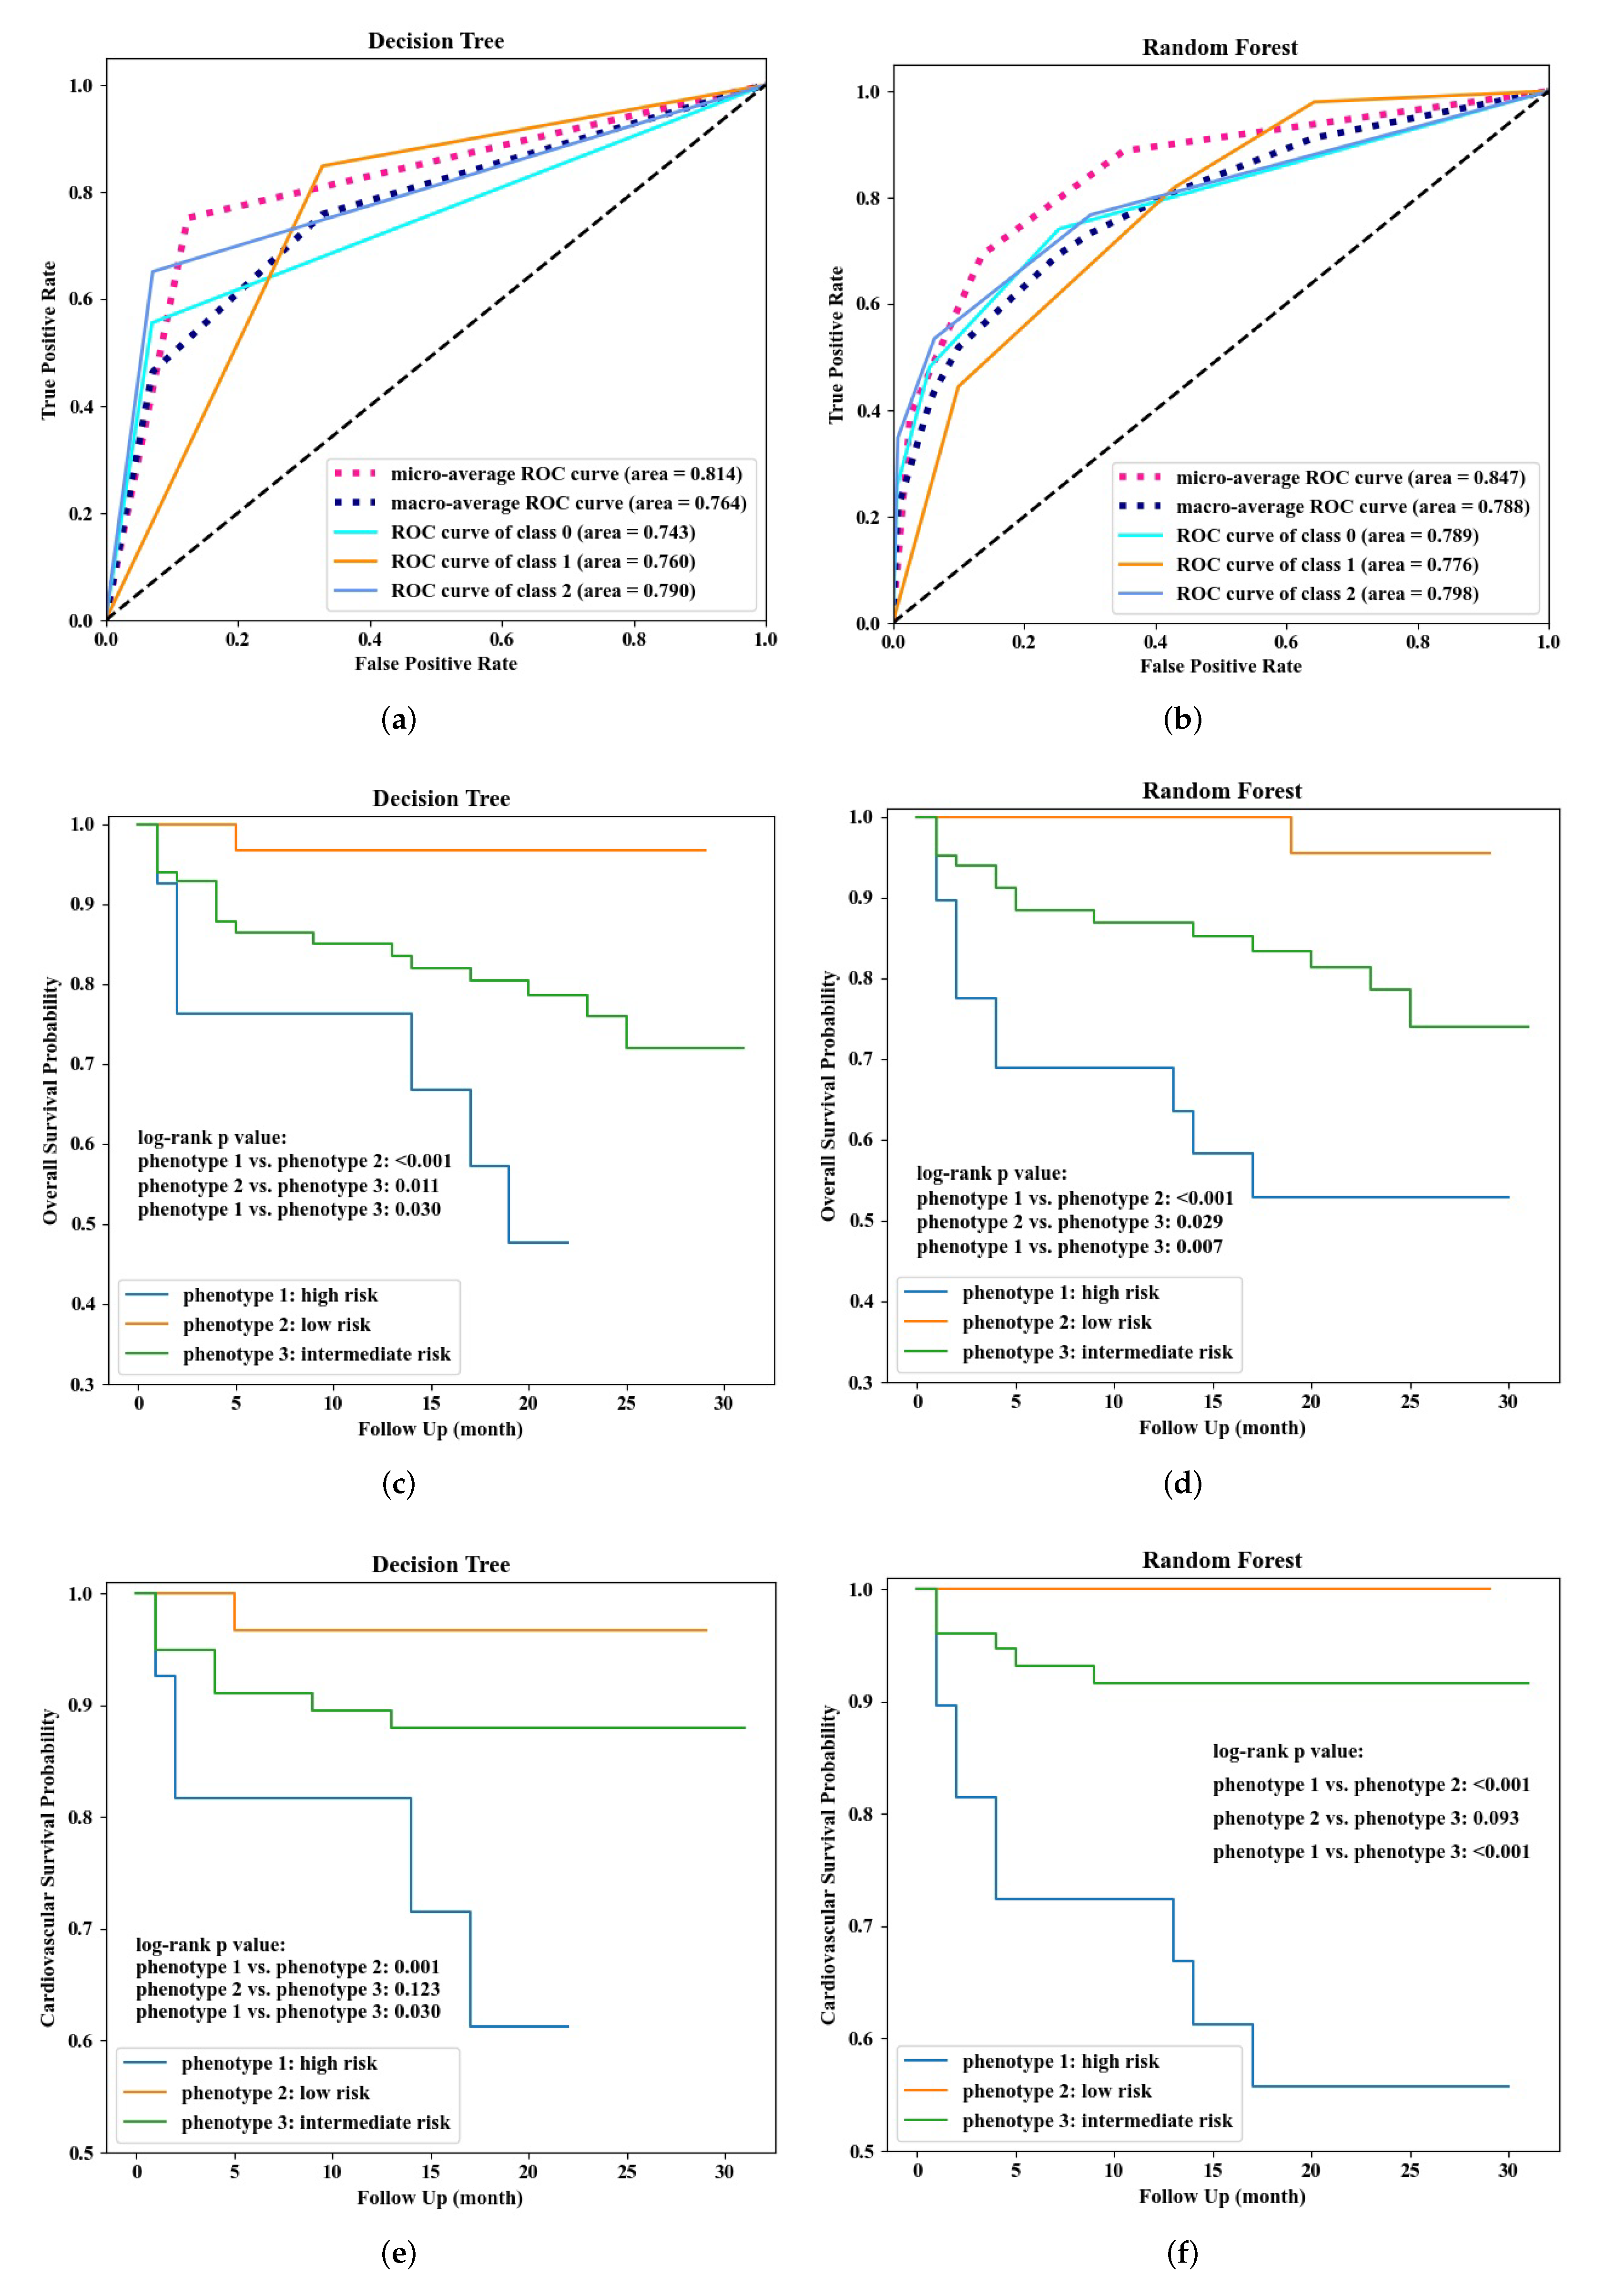
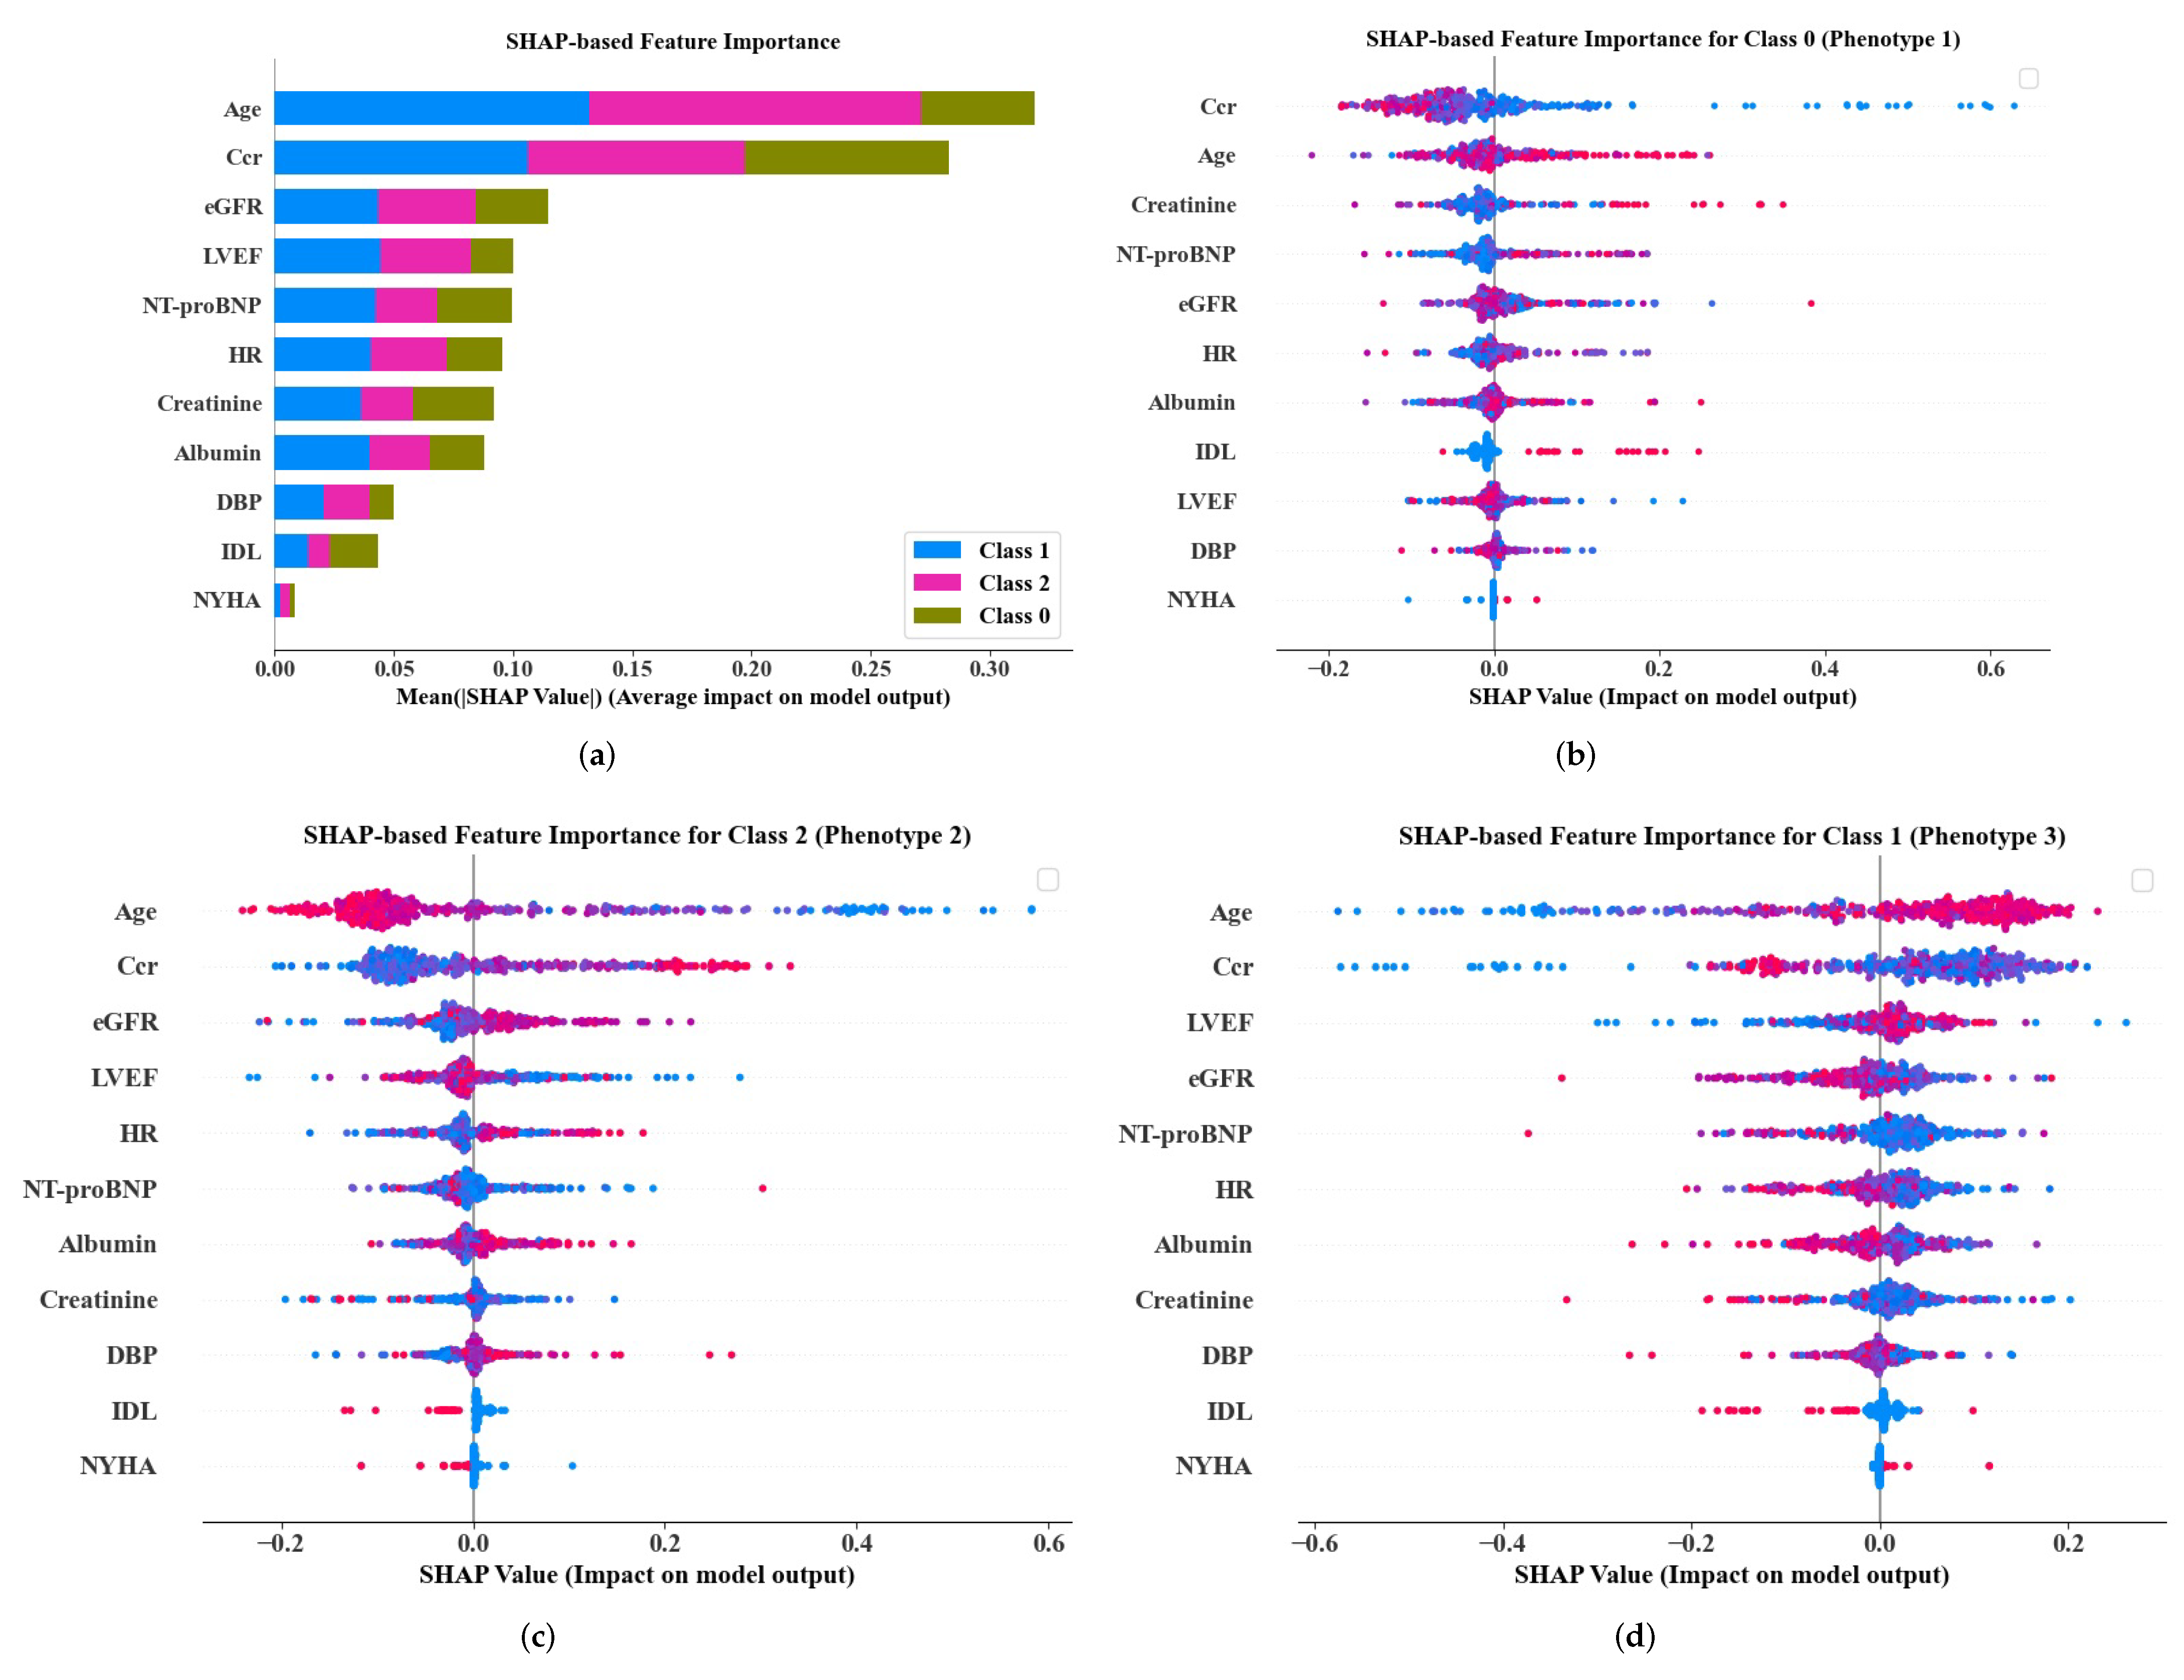
3.3. Phenotype Classification
4. Discussion
5. Conclusions
Supplementary Materials
Author Contributions
Funding
Institutional Review Board Statement
Informed Consent Statement
Data Availability Statement
Conflicts of Interest
Abbreviations
| ADL | activities of daily living |
| AUC | area under receiver operating characteristic curve |
| BMI | body mass index |
| Ccr | creatinine clearance rate |
| CI | confidence interval |
| CPH | Cox proportional hazards |
| DBP | diastolic blood pressure |
| DOACWFuse | direct oral anticoagulants or warfarin used |
| DPC | diagnosis procedure combination |
| eGFR | estimated glomerular filtration rate |
| HF | heart failure |
| HFpEF | heart failure with preserved ejection fraction |
| HFrEF | heart failure with reduced ejection fraction |
| HR | heart rate |
| IDL | independence in daily life for the elderly with cognitive impairment |
| IHD | ischemic heart disease |
| KM | Kaplan–Meier |
| LVEF | left ventricular ejection fraction |
| ML | machine learning |
| MRA | mineralocorticoid receptor antagonist |
| NT-proBNP | N-terminal pro B-type natriuretic peptide |
| NYHA | New York Heart Association |
| PAD | peripheral arterial disease |
| ROC | receiver operating characteristic curve |
| SHAP | Shapley additive explanations |
| TR | tricuspid regurgitation |
| VD | vascular disease |
References
- Bragazzi, N.L.; Zhong, W.; Shu, J.; Much, A.A.; Lotan, D.; Grupper, A.; Younis, A.; Dai, H. Burden of heart failure and underlying causes in 195 countries and territories from 1990 to 2017. Eur. J. Prev. Cardiol. 2021, 28, 1682–1690. [Google Scholar] [CrossRef] [PubMed]
- Groenewegen, A.; Rutten, F.H.; Mosterd, A.; Hoes, A.W. Epidemiology of heart failure. Eur. J. Heart. Fail. 2020, 22, 1342–1356. [Google Scholar] [CrossRef] [PubMed]
- Bleumink, G.S.; Knetsch, A.M.; Sturkenboom, M.C.J.M.; Straus, S.M.J.M.; Hofman, A.; Deckers, J.W.; Witteman, J.C.M.; Stricker, B.H.C. Quantifying the heart failure epidemic: Prevalence, incidence rate, lifetime risk and prognosis of heart failure The Rotterdam Study. Eur. Heart. J. 2004, 25, 1614–1619. [Google Scholar] [CrossRef] [PubMed] [Green Version]
- Konishi, M.; Ishida, J.; Springer, J.; Haehling, S.; Akashi, Y.; Shimokawa, H.; Anker, S. Heart failure epidemiology and novel treatments in Japan: Facts and numbers. ESC Heart Fail. 2016, 3, 145–151. [Google Scholar] [CrossRef] [Green Version]
- Statistics Bureau of Japan. Population Estimates by Age (Five-Year Groups) and Sex. Available online: http://www.stat.go.jp/english/data/jinsui/tsuki/index.html (accessed on 8 November 2021).
- Okura, Y.; Ramadan, M.M.; Ohno, Y.; Mitsuma, W.; Tanaka, K.; Ito, M.; Suzuki, K.; Tanabe, N.; Kodama, M.; Aizawa, Y. Impending epidemic: Future projection of heart failure in Japan to the year 2055. Circ. J. 2008, 72, 489–491. [Google Scholar] [CrossRef] [Green Version]
- Kanaoka, K.; Okayama, S.; Nakai, M.; Sumita, Y.; Nishimura, K.; Kawakami, R.; Okura, H.; Miyamoto, Y.; Yasuda, S.; Tsutsui, H.; et al. Hospitalization costs for patients with acute congestive heart failure in Japan. Circ. J. 2019, 83, 1025–1031. [Google Scholar] [CrossRef] [Green Version]
- Nagai, T.; Nakao, M.; Anzai, T. Risk stratification towards precision medicine in heart failure: Current progress and future perspectives. Circ. J. 2021, 85, 576–583. [Google Scholar] [CrossRef]
- Levy, W.C.; Mozaffarian, D.; Linker, D.T.; Sutradhar, S.C.; Anker, S.D.; Cropp, A.B.; Anand, I.; Maggioni, A.; Burton, P.; Sullivan, M.D.; et al. The Seattle Heart Failure Model: Prediction of survival in heart failure. Circulation 2006, 113, 1424–1433. [Google Scholar] [CrossRef]
- Miyagawa, S.; Pak, K.; Hikoso, S.; Ohtani, T.; Amiya, E.; Sakata, Y.; Ueda, S.; Takeuchi, M.; Komuro, I.; Sawa, Y. Japan Heart Failure Model: Derivation and accuracy of survival prediction in Japanese heart failure patients. Circ. J. 2019, 1, 29–34. [Google Scholar] [CrossRef] [Green Version]
- Awan, S.E.; Sohel, F.; Sanfilippo, F.M.; Bennamoun, M.; Dwivedi, G. Machine learning in heart failure: Ready for prime time. Curr. Opin. Cardiol. 2018, 33, 190–195. [Google Scholar] [CrossRef]
- Olsen, C.R.; Mentz, R.J.; Anstrom, K.J.; Page, D.; Patel, P.A. Clinical applications of machine learning in the diagnosis, classification, and prediction of heart failure. Am. Heart J. 2020, 229, 1–17. [Google Scholar] [CrossRef]
- Chicco, D.; Jurman, G. Machine learning can predict survival of patients with heart failure from serum creatinine and ejection fraction alone. BMC Med. Inform. Decis. Mak. 2020, 20, 1–16. [Google Scholar] [CrossRef]
- Segar, M.W.; Patel, K.V.; Ayers, C.; Basit, M.; Tang, W.H.W.; Willett, D.; Berry, J.; Grodin, J.L.; Pandey, A. Phenomapping of patients with heart failure with preserved ejection fraction using machine learning-based unsupervised cluster analysis. Eur. J. Heart Fail. 2020, 22, 148–158. [Google Scholar] [CrossRef]
- Bretos-Azcona, P.E.; Sánchez-Iriso, E.; Cabasés Hita, J.M. Tailoring integrated care services for high-risk patients with multiple chronic conditions: A risk stratification approach using cluster analysis. BMC Health Serv. Res. 2020, 20, 1–9. [Google Scholar] [CrossRef]
- Stevens, E.; Dixon, D.R.; Novack, M.N.; Granpeesheh, D.; Smith, T.; Linstead, E. Identification and analysis of behavioral phenotypes in autism spectrum disorder via unsupervised machine learning. Int. J. Med. Inform. 2019, 129, 29–36. [Google Scholar] [CrossRef]
- Inomata, T.; Nakamura, M.; Sung, J.; Midorikawa-Inomata, A.; Iwagami, M.; Fujio, K.; Akasaki, Y.; Okumura, Y.; Fujimoto, K.; Eguchi, A.; et al. Smartphone-based digital phenotyping for dry eye toward P4 medicine: A crowdsourced cross-sectional study. NPJ Digit. Med. 2021, 4, 1–13. [Google Scholar] [CrossRef]
- Zhou, X.; Nakamura, K.; Sahara, N.; Takagi, T.; Toyoda, Y.; Enomoto, Y.; Hara, H.; Noro, M.; Sugi, K.; Moroi, M.; et al. Deep learning-based recurrence prediction of atrial fibrillation after catheter ablation. Circ. J. 2022, 86, 299–308. [Google Scholar] [CrossRef]
- Zhong, H.; Wang, B.; Wang, D.; Liu, Z.; Xing, C.; Wu, Y.; Gao, Q.; Zhu, S.; Qu, H.; Jia, Z.; et al. The application of machine learning algorithms in predicting the length of stay following femoral neck fracture. Int. J. Med. Inform. 2021, 155, 104572. [Google Scholar] [CrossRef]
- Müllner, D. Modern hierarchical, agglomerative clustering algorithms. arXiv 2011, arXiv:1109.2378. [Google Scholar]
- Scikit-Learn 1.0.2. Hierarchical Clustering. Available online: https://scikit-learn.org/stable/modules/clustering.html#hierarchical-clustering (accessed on 2 October 2021).
- Cattell, R.B. The scree test for the number of factors. Multivar. Behav. Res. 1966, 1, 245–276. [Google Scholar] [CrossRef]
- Yuan, C.; Yang, H. Research on K-value selection method of K-means clustering algorithm. J 2019, 2, 226–235. [Google Scholar] [CrossRef] [Green Version]
- McInnes, L.; Healy, J.; Saul, N.; Großberger, L. UMAP: Uniform manifold approximation and projection. J. Open Source Softw. 2018, 3, 861. [Google Scholar] [CrossRef]
- Omar, A.M.S.; Ramirez, R.; Haddadin, F.; Sabharwal, B.; Khandaker, M.; Patel, Y.; Argulian, E. Unsupervised clustering for phenotypic stratification of clinical, demographic, and stress attributes of cardiac risk in patients with nonischemic exercise stress echocardiography. Echocardiography 2020, 37, 505–519. [Google Scholar] [CrossRef] [PubMed]
- Cho, J.S.; Shrestha, S.; Kagiyama, N.; Hu, L.; Ghaffar, Y.; Casaclang-Verzosa, G.; Zeb, I.; Sengupta, P.P. A network-based “phenomics” approach for discovering patient subtypes from high-throughput cardiac imaging data. JACC Cardiovasc. Imaging 2020, 13, 1655–1670. [Google Scholar] [CrossRef]
- Scikit-Learn 1.0.2. Available online: https://scikit-learn.org/stable/ (accessed on 2 October 2021).
- Hou, Y.; Zhou, Y.; Hussain, M.; Budd, G.T.; Tang, W.H.W.; Abraham, J.; Xu, B.; Shah, C.; Moudgil, R.; Popovic, Z.; et al. Cardiac risk stratification in cancer patients: A longitudinal patient–patient network analysis. PLoS Med. 2021, 18, e1003736. [Google Scholar] [CrossRef]
- Forte, J.C.; Yeshmagambetova, G.; van der Grinten, M.L.; Hiemstra, B.; Kaufmann, T.; Eck, R.J.; Keus, F.; Epema, A.H.; Wiering, M.A.; Horst, I.C.C. Identifying and characterizing high-risk clusters in a heterogeneous ICU population with deep embedded clustering. Sci. Rep. 2021, 11, 1–12. [Google Scholar]
- Komaru, Y.; Yoshida, T.; Hamasaki, Y.; Nangaku, M.; Doi, K. Hierarchical clustering analysis for predicting 1-year mortality after starting hemodialysis. Kidney Int. Rep. 2020, 5, 1188–1195. [Google Scholar] [CrossRef]
- Lundberg, S.M.; Lee, S.I. A unified approach to interpreting model predictions. Adv. Neural Inf. Process. Syst. 2017, 30, 4768–4777. [Google Scholar]
- Lundberg, S.M.; Erion, G.; Chen, H.; DeGrave, A.; Prutkin, J.M.; Nair, B.; Katz, R.; Himmelfarb, J.; Bansal, N.; Lee, S.I. Explainable AI for trees: From local explanations to global understanding. arXiv 2019, arXiv:1905.04610. [Google Scholar] [CrossRef]
- Ho, K.K.; Anderson, K.M.; Kannel, W.B.; Grossman, W.; Levy, D. Survival after the onset of congestive heart failure in Framingham Heart Study subjects. Circulation 1993, 88, 107–115. [Google Scholar] [CrossRef] [Green Version]
- Gustafsson, F.; Pedersen, C.T.; Seibaek, M.; Burchardt, H.; Køber, L. Effect of age on short and long-term mortality in patients admitted to hospital with congestive heart failure. Eur. Heart J. 2004, 25, 1711–1717. [Google Scholar] [CrossRef] [Green Version]
- Kenchaiah, S.; Pocock, S.J.; Wang, D.; Finn, P.V.; Zornoff, L.A.M.; Skali, H.; Pfeffer, M.A.; Yusuf, S.; Swedberg, K.; Michelson, E.L.; et al. Body mass index and prognosis in patients with chronic heart failure: Insights from the Candesartan in Heart failure: Assessment of Reduction in Mortality and morbidity (CHARM) program. Circulation 2007, 116, 627–636. [Google Scholar] [CrossRef] [Green Version]
- Brubaker, P.H.; Kitzman, D.W. Chronotropic incompetence: Causes, consequences, and management. Circulation 2011, 123, 1010–1020. [Google Scholar] [CrossRef] [Green Version]
- Zweerink, A.; van der Lingen, A.L.C.J.; Handoko, M.L.; Rossum, A.C.; Allaart, C.P. Chronotropic incompetence in chronic heart failure: A state-of-the-art review. Circ. Heart Fail. 2018, 11, e004969. [Google Scholar] [CrossRef]
- Dobre, D.; Zannad, F.; Keteyian, S.J.; Stevens, S.R.; Rossignol, P.; Kitzman, D.W.; Landzberg, J.; Howlett, J.; Kraus, W.E.; Ellis, S.J. Association between resting heart rate, chronotropic index, and long-term outcomes in patients with heart failure receiving β-blocker therapy: Data from the HF-ACTION trial. Eur. Heart J. 2013, 34, 2271–2280. [Google Scholar] [CrossRef] [Green Version]
- Bredy, C.; Ministeri, M.; Kempny, A.; Gonzalez, R.A.; Swan, L.; Uebing, A.; Diller, G.P.; Gatzoulis, M.A.; Dimopoulos, K. New York Heart Association (NYHA) classification in adults with congenital heart disease: Relation to objective measures of exercise and outcome. Eur. Heart J. 2018, 4, 51–58. [Google Scholar] [CrossRef]
- Perini, A.P.; Bartolini, S.; Pieragnoli, P.; Ricciardi, G.; Perrotta, L.; Valleggi, A.; Vergaro, G.; Michelotti, F.; Boggian, G.; Sassone, B.; et al. CHADS2 and CHAD2DS2-VASC scores to predict morbidity and mortality in heart failure patients candidates to cardiac resynchronization therapy. Europace 2014, 16, 71–80. [Google Scholar] [CrossRef] [Green Version]
- Melgaard, L.; Rasmussen, A.G.; Lane, D.A.; Rasmussen, L.H.; Larsen, T.B.; Lip, G.Y.H. Assessment of the CHAD2DS2-VASC score in predicting ischemic stroke, thromboembolism, and death in patients with heart failure with and without atrial fibrillation. JAMA 2015, 314, 1030–1038. [Google Scholar] [CrossRef] [Green Version]
- McAlister, F.M.; Ezekowitz, J.; Tonelli, M.; Armstrong, P.W. Renal insufficiency and heart failure: Prognostic and therapeutic implications from a prospective cohort study. Circulation 2004, 109, 1004–1009. [Google Scholar] [CrossRef] [Green Version]
- McCullough, P.A. Why is chronic kidney disease the “spoiler” for cardiovascular outcomes? J. Am. Coll. Cardiol. 2003, 41, 725–728. [Google Scholar] [CrossRef]
- Lam, C.S.P.; Gamble, G.D.; Ling, L.H.; Sim, D.; Leong, K.T.G.; Yeo, P.S.D.; Ong, H.Y.; Jaufeerally, F.; Ng, T.P.; Cameron, V.A.; et al. Mortality associated with heart failure with preserved vs. reduced ejection fraction in a prospective international multi-ethnic cohort study. Eur. Heart J. 2018, 39, 1770–1780. [Google Scholar] [CrossRef] [PubMed] [Green Version]
- Kontogeorgos, S.; Thunström, E.; Johansson, M.C.; Fu, M. Heart failure with preserved ejection fraction has a better long-term prognosis than heart failure with reduced ejection fraction in old patients in a 5-year follow-up retrospective study. Int. J. Cardiol. 2017, 232, 86–92. [Google Scholar] [CrossRef] [PubMed]
- Abebe, T.B.; Gebreyohannes, E.A.; Tefera, Y.G.; Abegaz, T.M. Patients with HFpEF and HFrEF have different clinical characteristics but similar prognosis: A retrospective cohort study. BMC Cardiovasc Disord. 2016, 16, 232. [Google Scholar] [CrossRef] [PubMed] [Green Version]
- Andersen, M.J.; Borlaug, B.A. Heart failure with preserved ejection fraction: Current understandings and challenges. Curr. Cardiol. Rep. 2014, 16, 501. [Google Scholar] [CrossRef]
- Lüscher, T.F. Heart failure with preserved ejection fraction: Unravelling an enigma. Eur. Heart J. 2018, 39, 2763–2766. [Google Scholar] [CrossRef]
- Shah, A.M.; Claggett, B.; Loehr, L.R.; Chang, P.P.; Matsushita, K.; Kitzman, D.; Konety, S.; Kucharska–Newton, A.; Sueta, C.A.; Mosley, T.H.; et al. Heart failure stages among older adults in the community: The atherosclerosis risk in communities study. Circulation 2017, 135, 224–240. [Google Scholar] [CrossRef]
- Kokubo, Y.; Watanabe, M.; Higashiyama, A.; Nakao, Y.M.; Kusano, K.; Miyamoto, Y. Development of a Basic Risk Score for Incident Atrial Fibrillation in a Japanese General Population―The Suita Study―. Circ. J. 2017, 81, 1580–1588. [Google Scholar] [CrossRef] [Green Version]
- Chao, T.F.; Chiang, C.E.; Chen, T.J.; Liao, J.N.; Tuan, T.C.; Chen, S.A. Clinical Risk Score for the Prediction of Incident Atrial Fibrillation: Derivation in 7 220 654 Taiwan Patients With 438 930 Incident Atrial Fibrillations During a 16-Year Follow-Up. J. Am. Heart Assoc. 2021, 10, e020194. [Google Scholar] [CrossRef]
- Sieweke, J.T.; Hagemus, J.; Biber, S.; Berliner, D.; Grosse, G.M.; Schallhorn, S.; Pfeffer, T.J.; Derda, A.A.; Neuser, J.; Bauersachs, J.; et al. Echocardiographic Parameters to Predict Atrial Fibrillation in Clinical Routine—The EAHsy-AF Risk Score. Front. Cardiovasc. Med. 2022, 9, 466. [Google Scholar] [CrossRef]
- McDonagh, T.A.; Metra, M.; Adamo, M.; Gardner, R.S.; Baumbach, A.; Böhm, M.; Burri, H.; Butler, J.; Čelutkienė, J.; Chioncel, O.; et al. 2021 ESC Guidelines for the diagnosis and treatment of acute and chronic heart failure: Developed by the Task Force for the diagnosis and treatment of acute and chronic heart failure of the European Society of Cardiology (ESC) With the special contribution of the Heart Failure Association (HFA) of the ESC. Eur. Heart J. 2021, 42, 3599–3762. [Google Scholar]


| Variables | Phenotype 1 (High Risk) | Phenotype 3 (Intermediate Risk) | ||
|---|---|---|---|---|
| Hazard Ratio | p Value | Hazard Ratio | p Value | |
| NYHA at discharge | 3.61 (2.19–5.94) | <0.001 | 2.31 (1.43-3.75) | <0.001 |
| Low ADL at discharge | 2.94 (1.32–6.58) | 0.009 | - 1 | |
| DOACWFuse at discharge | 0.11 (0.01–0.79) | 0.030 | - | |
| eGFR at discharge | 0.97 (0.95–0.99) | 0.009 | 0.97 (0.95–0.99) | 0.002 |
| Ccr at discharge | 0.97 (0.93–0.999) | 0.045 | 0.96 (0.93–0.98) | <0.001 |
| Creatinine at discharge | 1.15 (1.04–1.27) | 0.007 | 1.78 (1.37–2.30) | <0.001 |
| SBP at admission | 0.98 (0.97–0.998) | 0.029 | - | |
| SBP at discharge | 0.95 (0.93–0.96) | <0.001 | 0.98 (0.97–0.9998) | 0.047 |
| DBP at discharge | 0.95 (0.92–0.99) | 0.006 | - | |
| HR at discharge | 1.02 (1.002–1.05) | 0.035 | - | |
| TR | - | 1.29 (1.03–1.62) | 0.025 | |
| logNT-proBNP | - | 2.64 (1.45–4.79) | 0.001 | |
| Albumin | - | 0.55 (0.31–0.97) | 0.039 | |
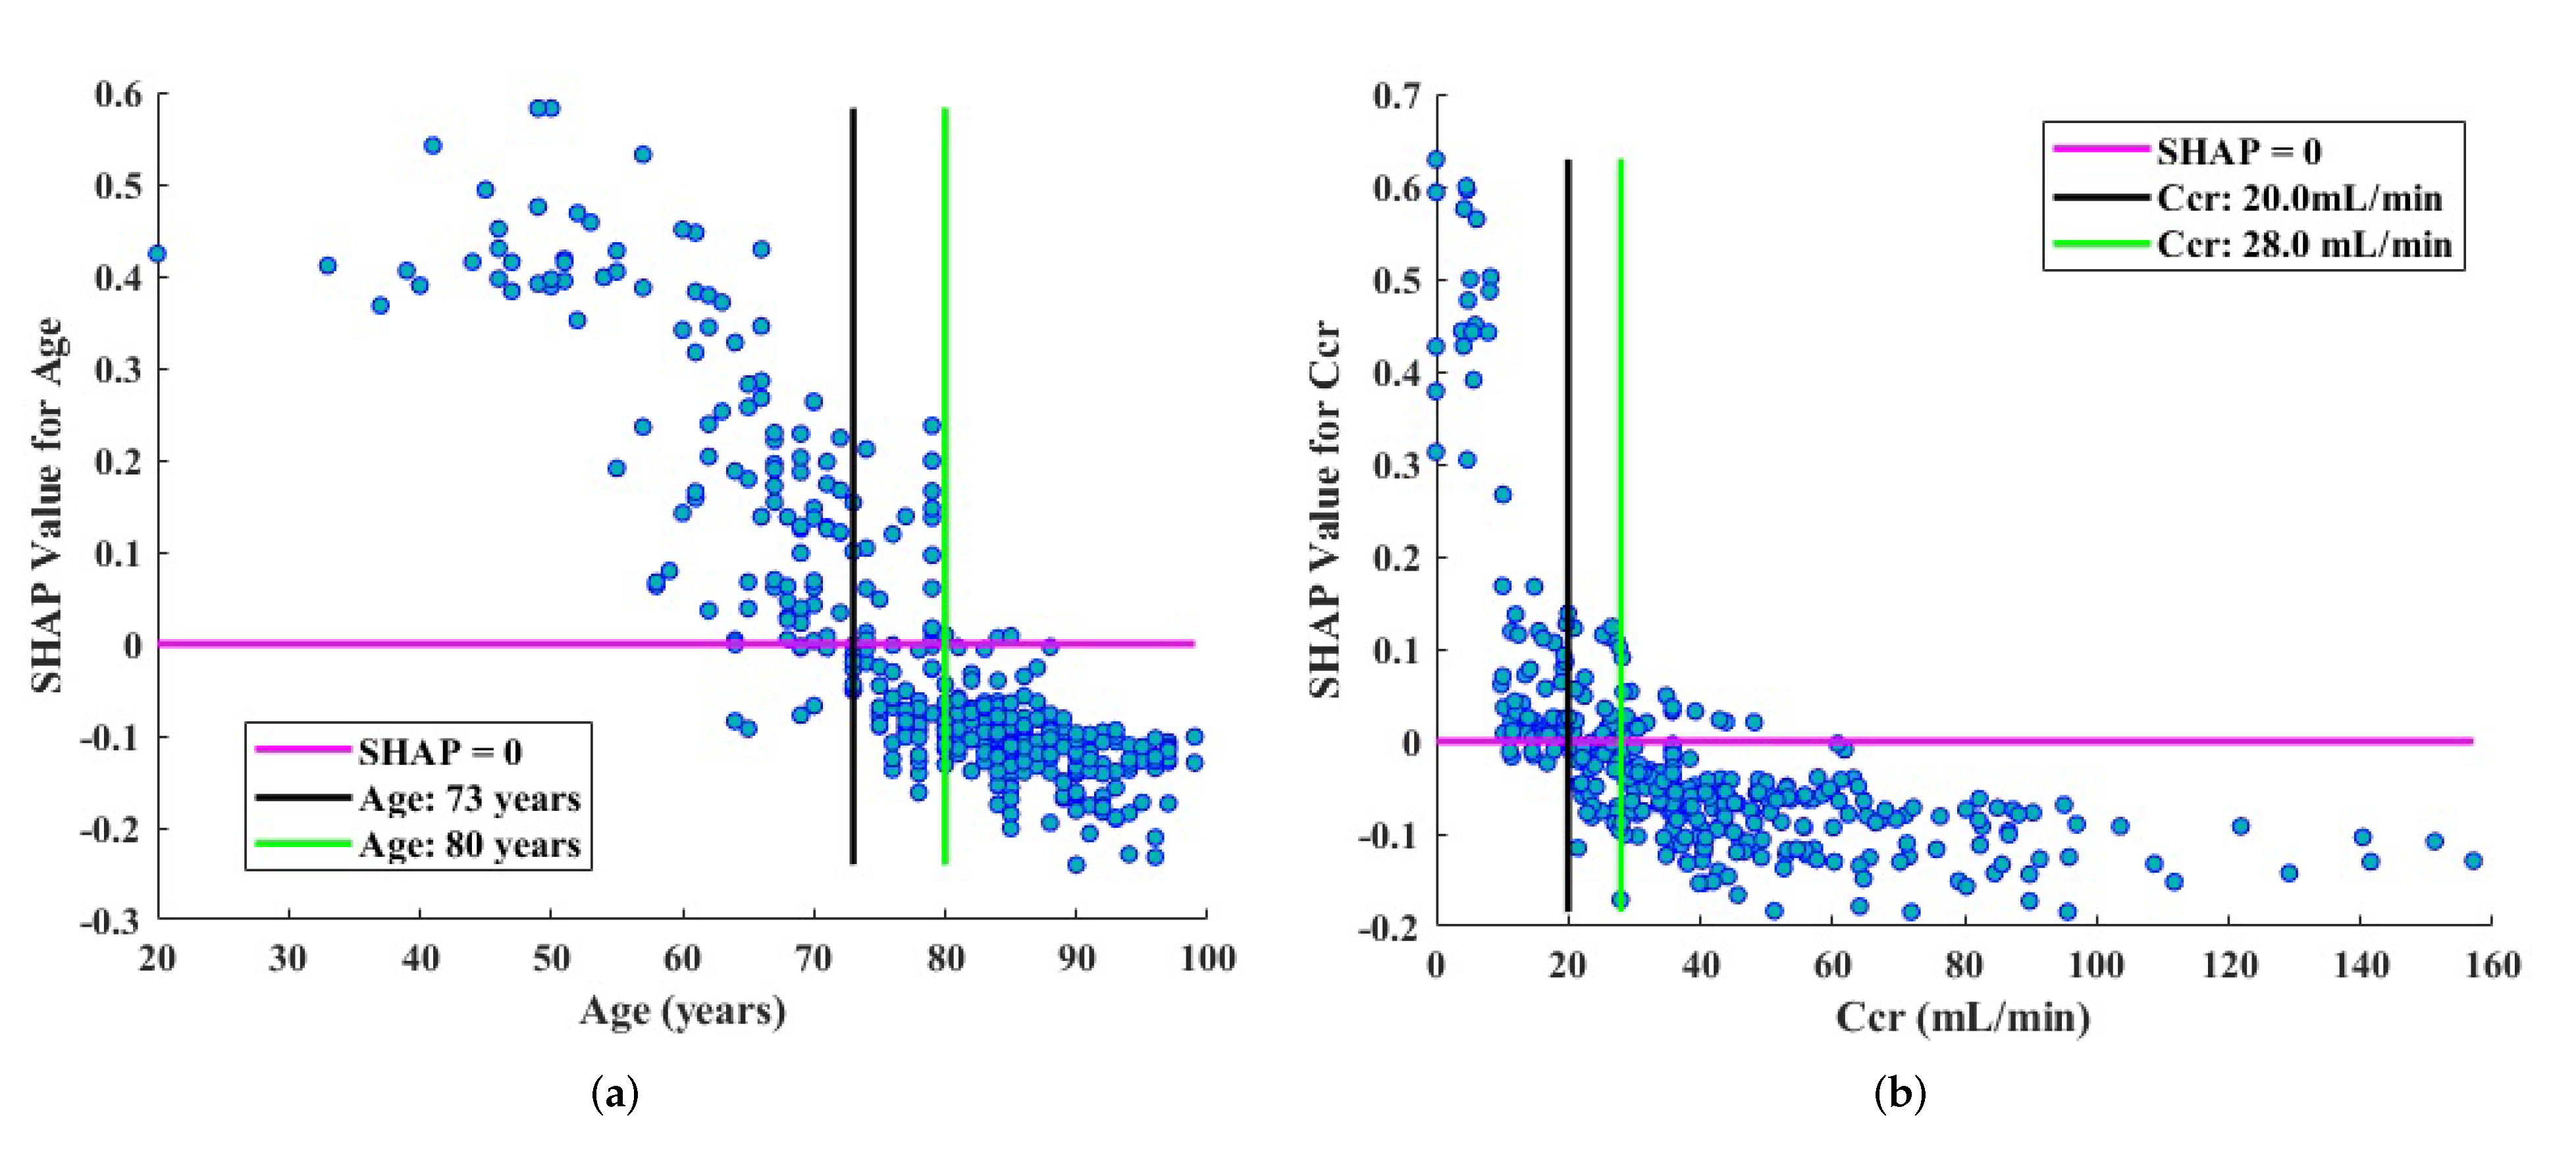
| Variables and Cutoff Values | Hazard Ratio | p Value |
|---|---|---|
| Age < 73 years | 0.28 (0.13–0.58) | <0.001 |
| Age > 80 years | 2.22 (1.40–3.55) | <0.001 |
| Ccr at discharge < 20 mL/min | 3.63 (2.34–5.63) | <0.001 |
| Ccr at discharge > 28 mL/min | 0.35 (0.22–0.55) | <0.001 |
Publisher’s Note: MDPI stays neutral with regard to jurisdictional claims in published maps and institutional affiliations. |
© 2022 by the authors. Licensee MDPI, Basel, Switzerland. This article is an open access article distributed under the terms and conditions of the Creative Commons Attribution (CC BY) license (https://creativecommons.org/licenses/by/4.0/).
Share and Cite
Zhou, X.; Nakamura, K.; Sahara, N.; Asami, M.; Toyoda, Y.; Enomoto, Y.; Hara, H.; Noro, M.; Sugi, K.; Moroi, M.; et al. Exploring and Identifying Prognostic Phenotypes of Patients with Heart Failure Guided by Explainable Machine Learning. Life 2022, 12, 776. https://0-doi-org.brum.beds.ac.uk/10.3390/life12060776
Zhou X, Nakamura K, Sahara N, Asami M, Toyoda Y, Enomoto Y, Hara H, Noro M, Sugi K, Moroi M, et al. Exploring and Identifying Prognostic Phenotypes of Patients with Heart Failure Guided by Explainable Machine Learning. Life. 2022; 12(6):776. https://0-doi-org.brum.beds.ac.uk/10.3390/life12060776
Chicago/Turabian StyleZhou, Xue, Keijiro Nakamura, Naohiko Sahara, Masako Asami, Yasutake Toyoda, Yoshinari Enomoto, Hidehiko Hara, Mahito Noro, Kaoru Sugi, Masao Moroi, and et al. 2022. "Exploring and Identifying Prognostic Phenotypes of Patients with Heart Failure Guided by Explainable Machine Learning" Life 12, no. 6: 776. https://0-doi-org.brum.beds.ac.uk/10.3390/life12060776