The Dwindling Microbiota of Aerobic Vaginitis, an Inflammatory State Enriched in Pathobionts with Limited TLR Stimulation

 ,
,  and
and 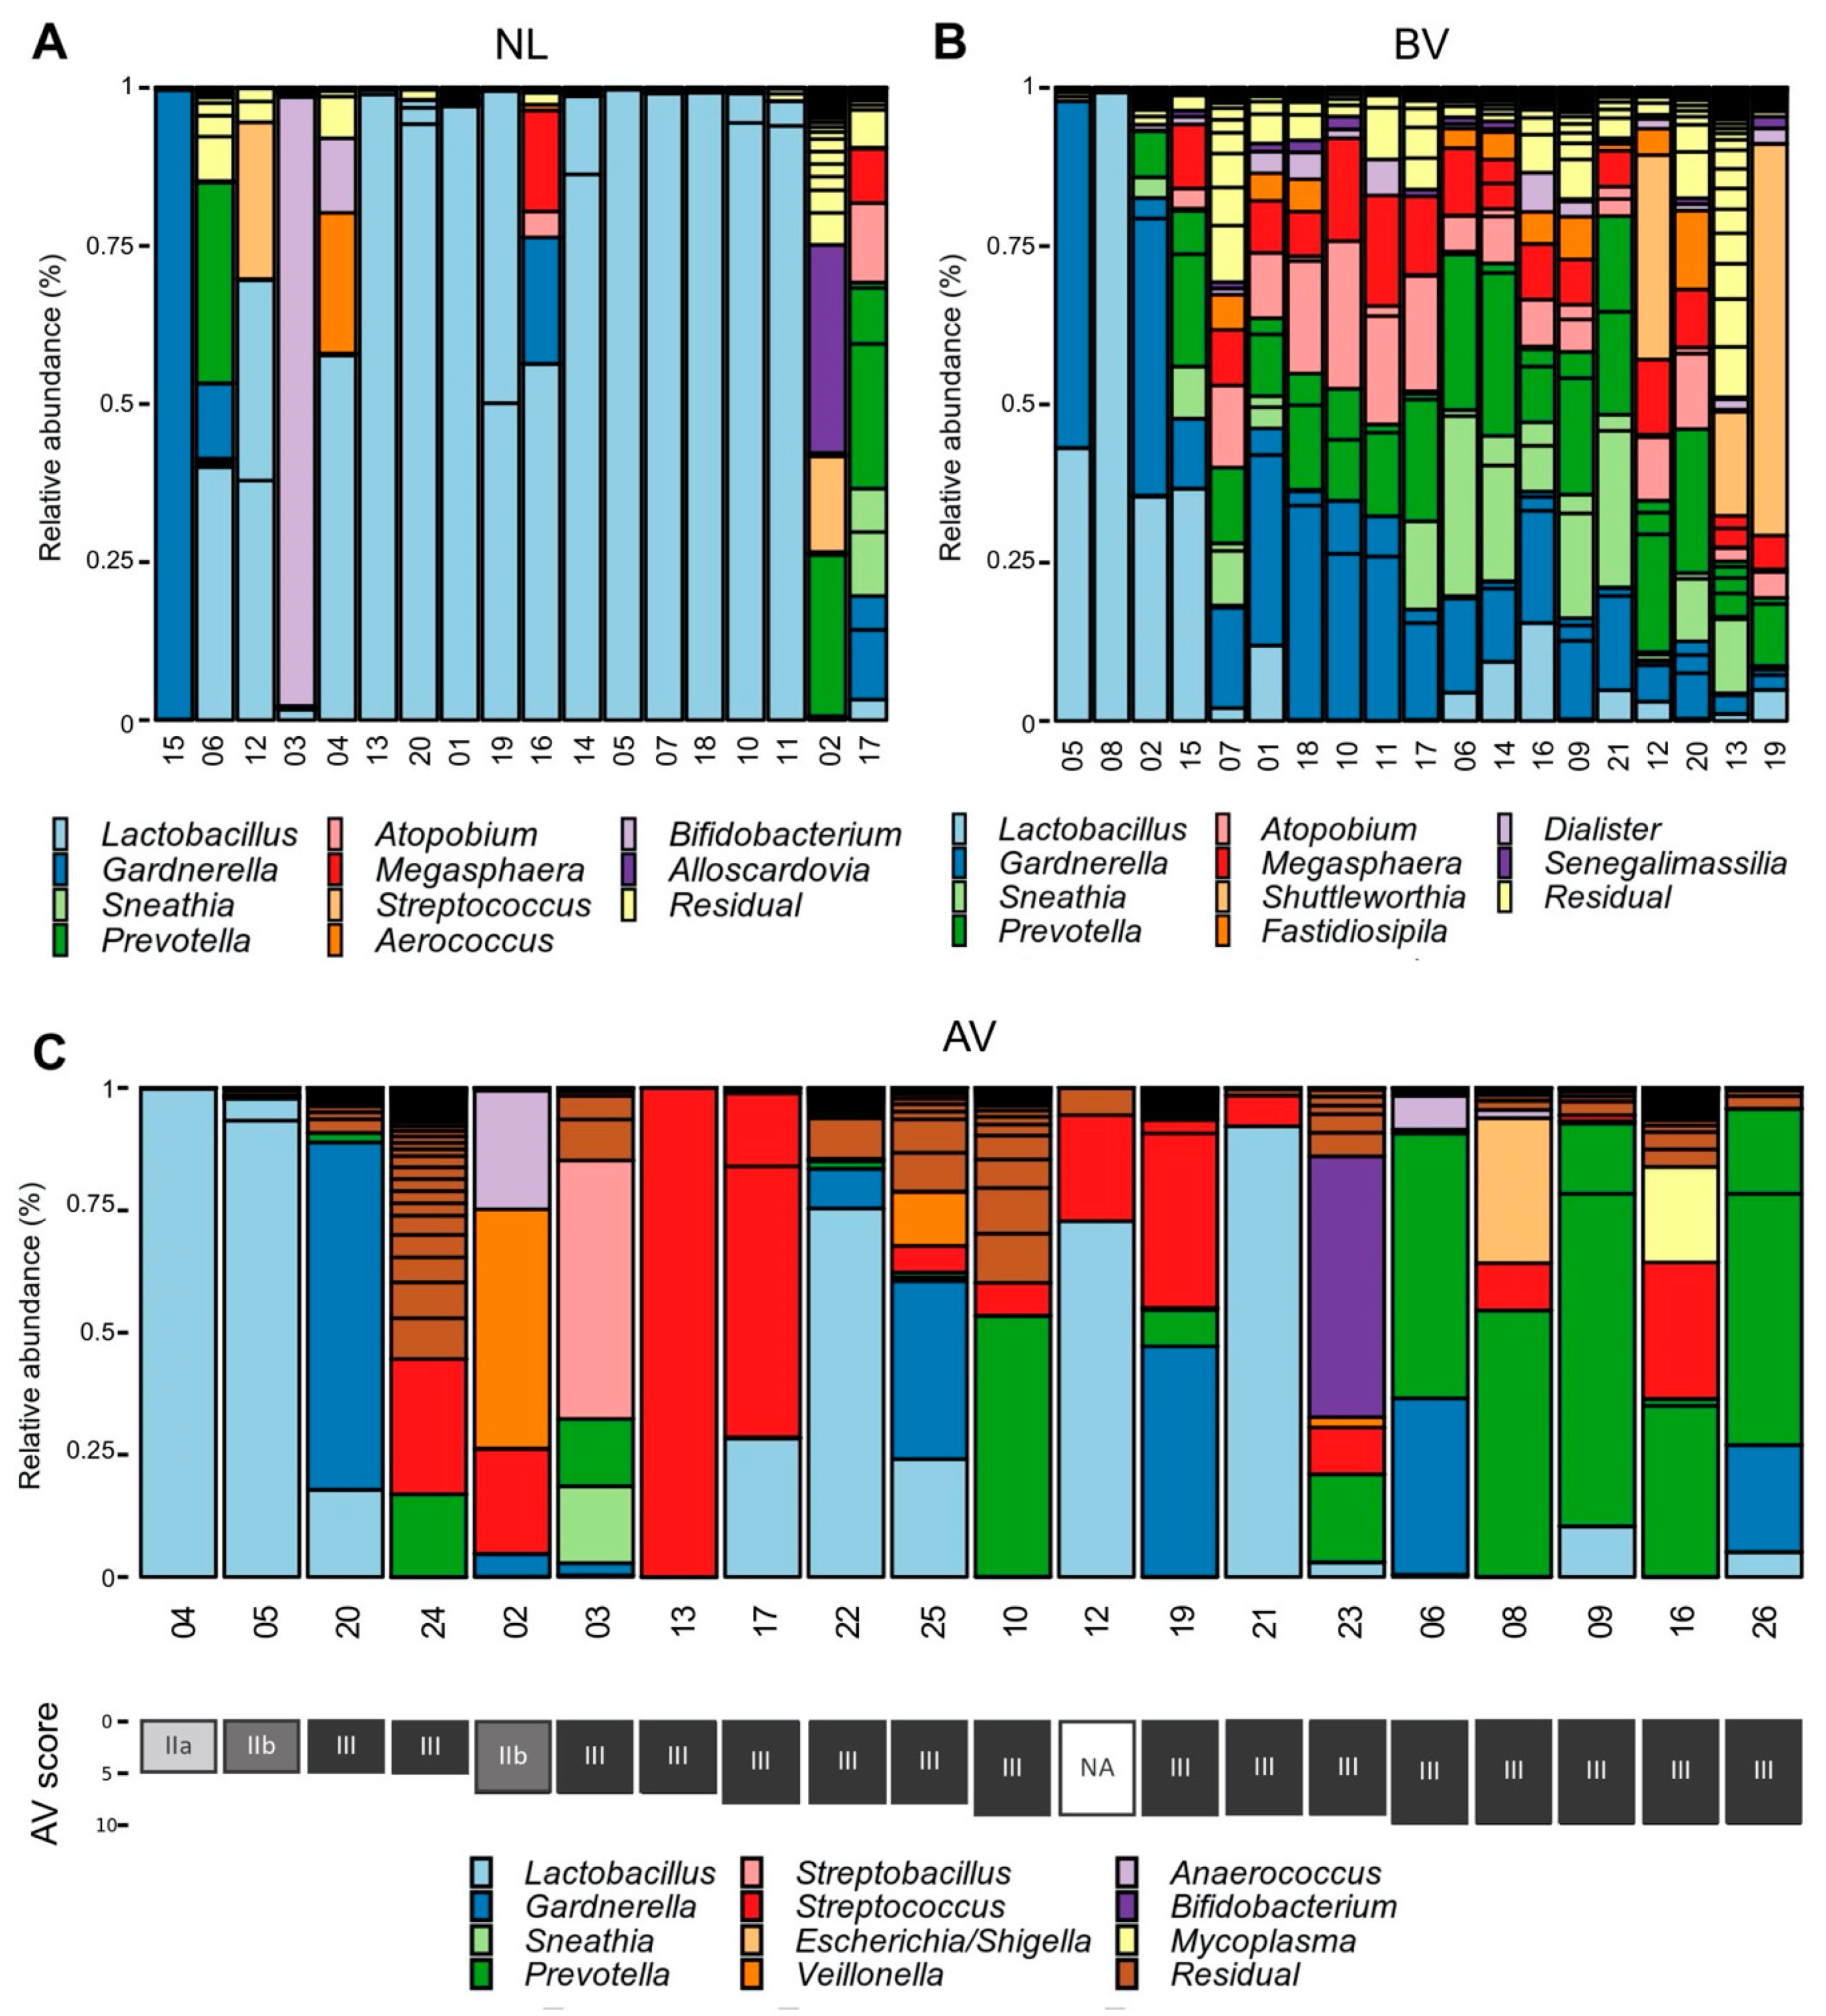
Abstract
:1. Introduction
2. Materials and Methods
2.1. Study Population and Ethical Approval
2.2. Sample Collection and Diagnosis
2.3. 16S rRNA Gene Sequencing with Miseq and qPCR
2.4. Bio-Informatics
2.5. qPCR
2.6. HEK-Blue™ hTLR4 and hTLR2/6 Experiment
2.7. Statistical Analysis
2.8. Availability of Data
3. Results
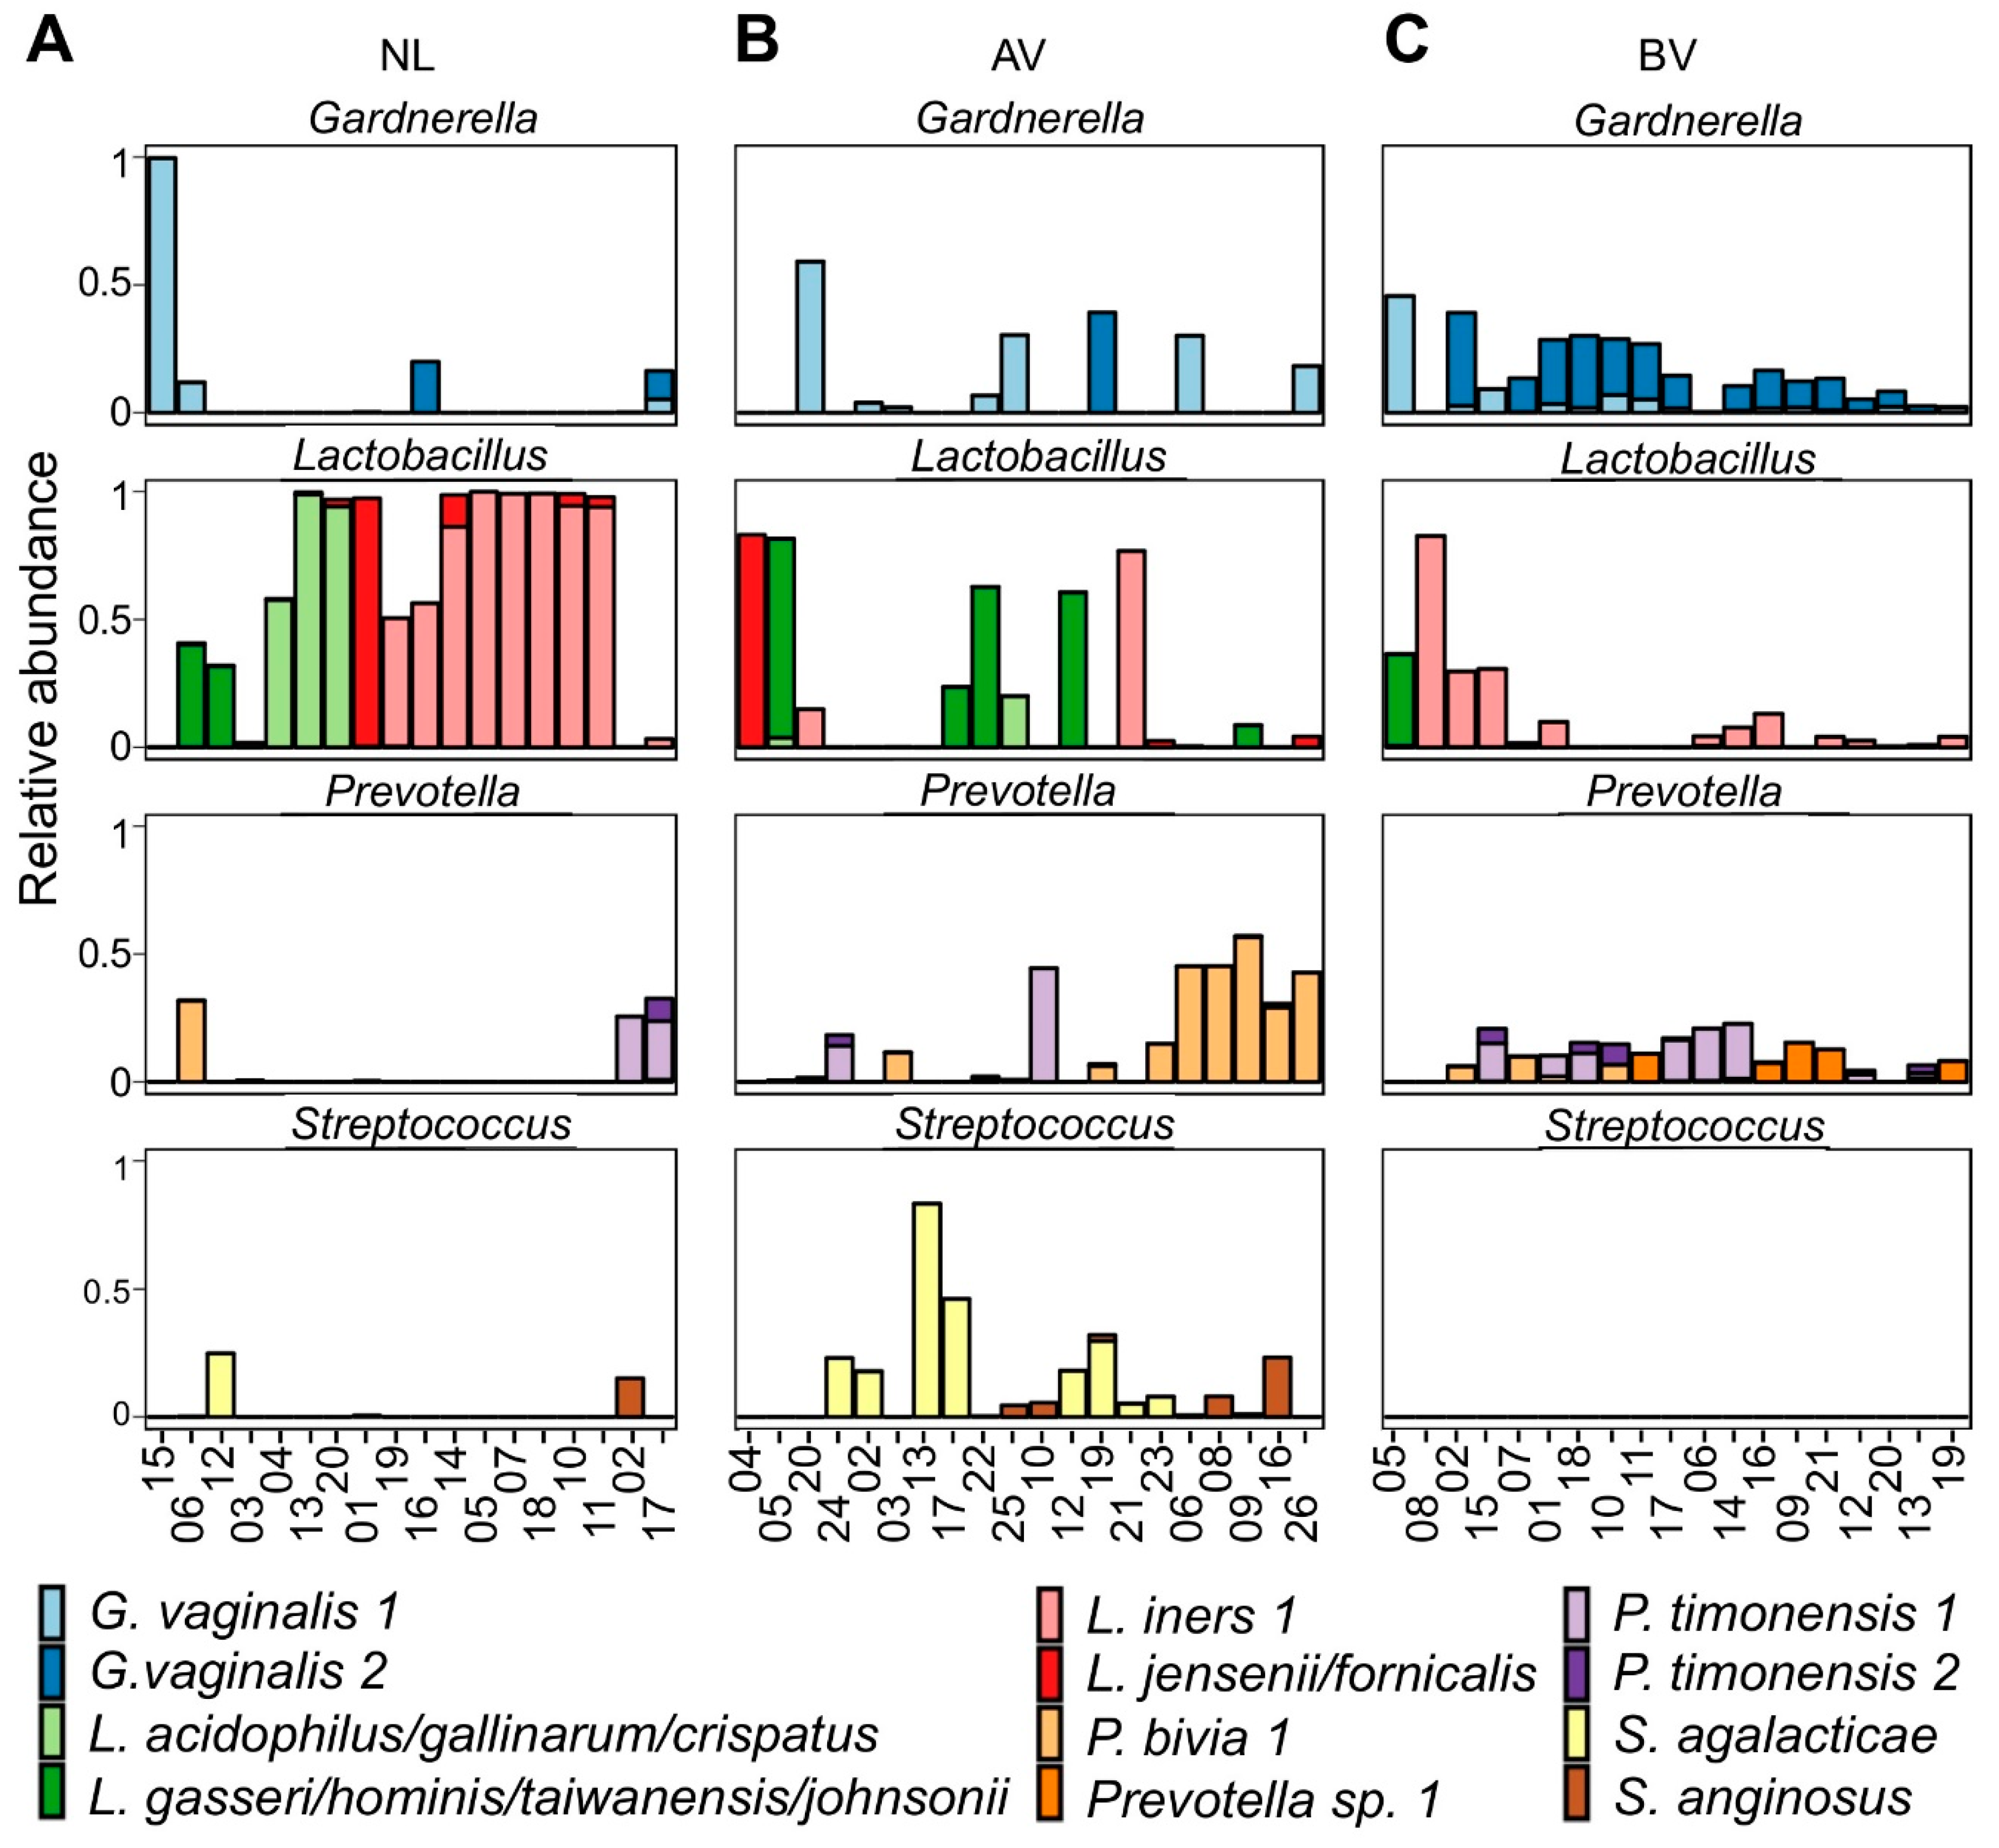
3.1. Taxonomic Profiles of AV Bacterial Communities
3.2. Bacterial Counts of the Entire Community and Specific Community Members
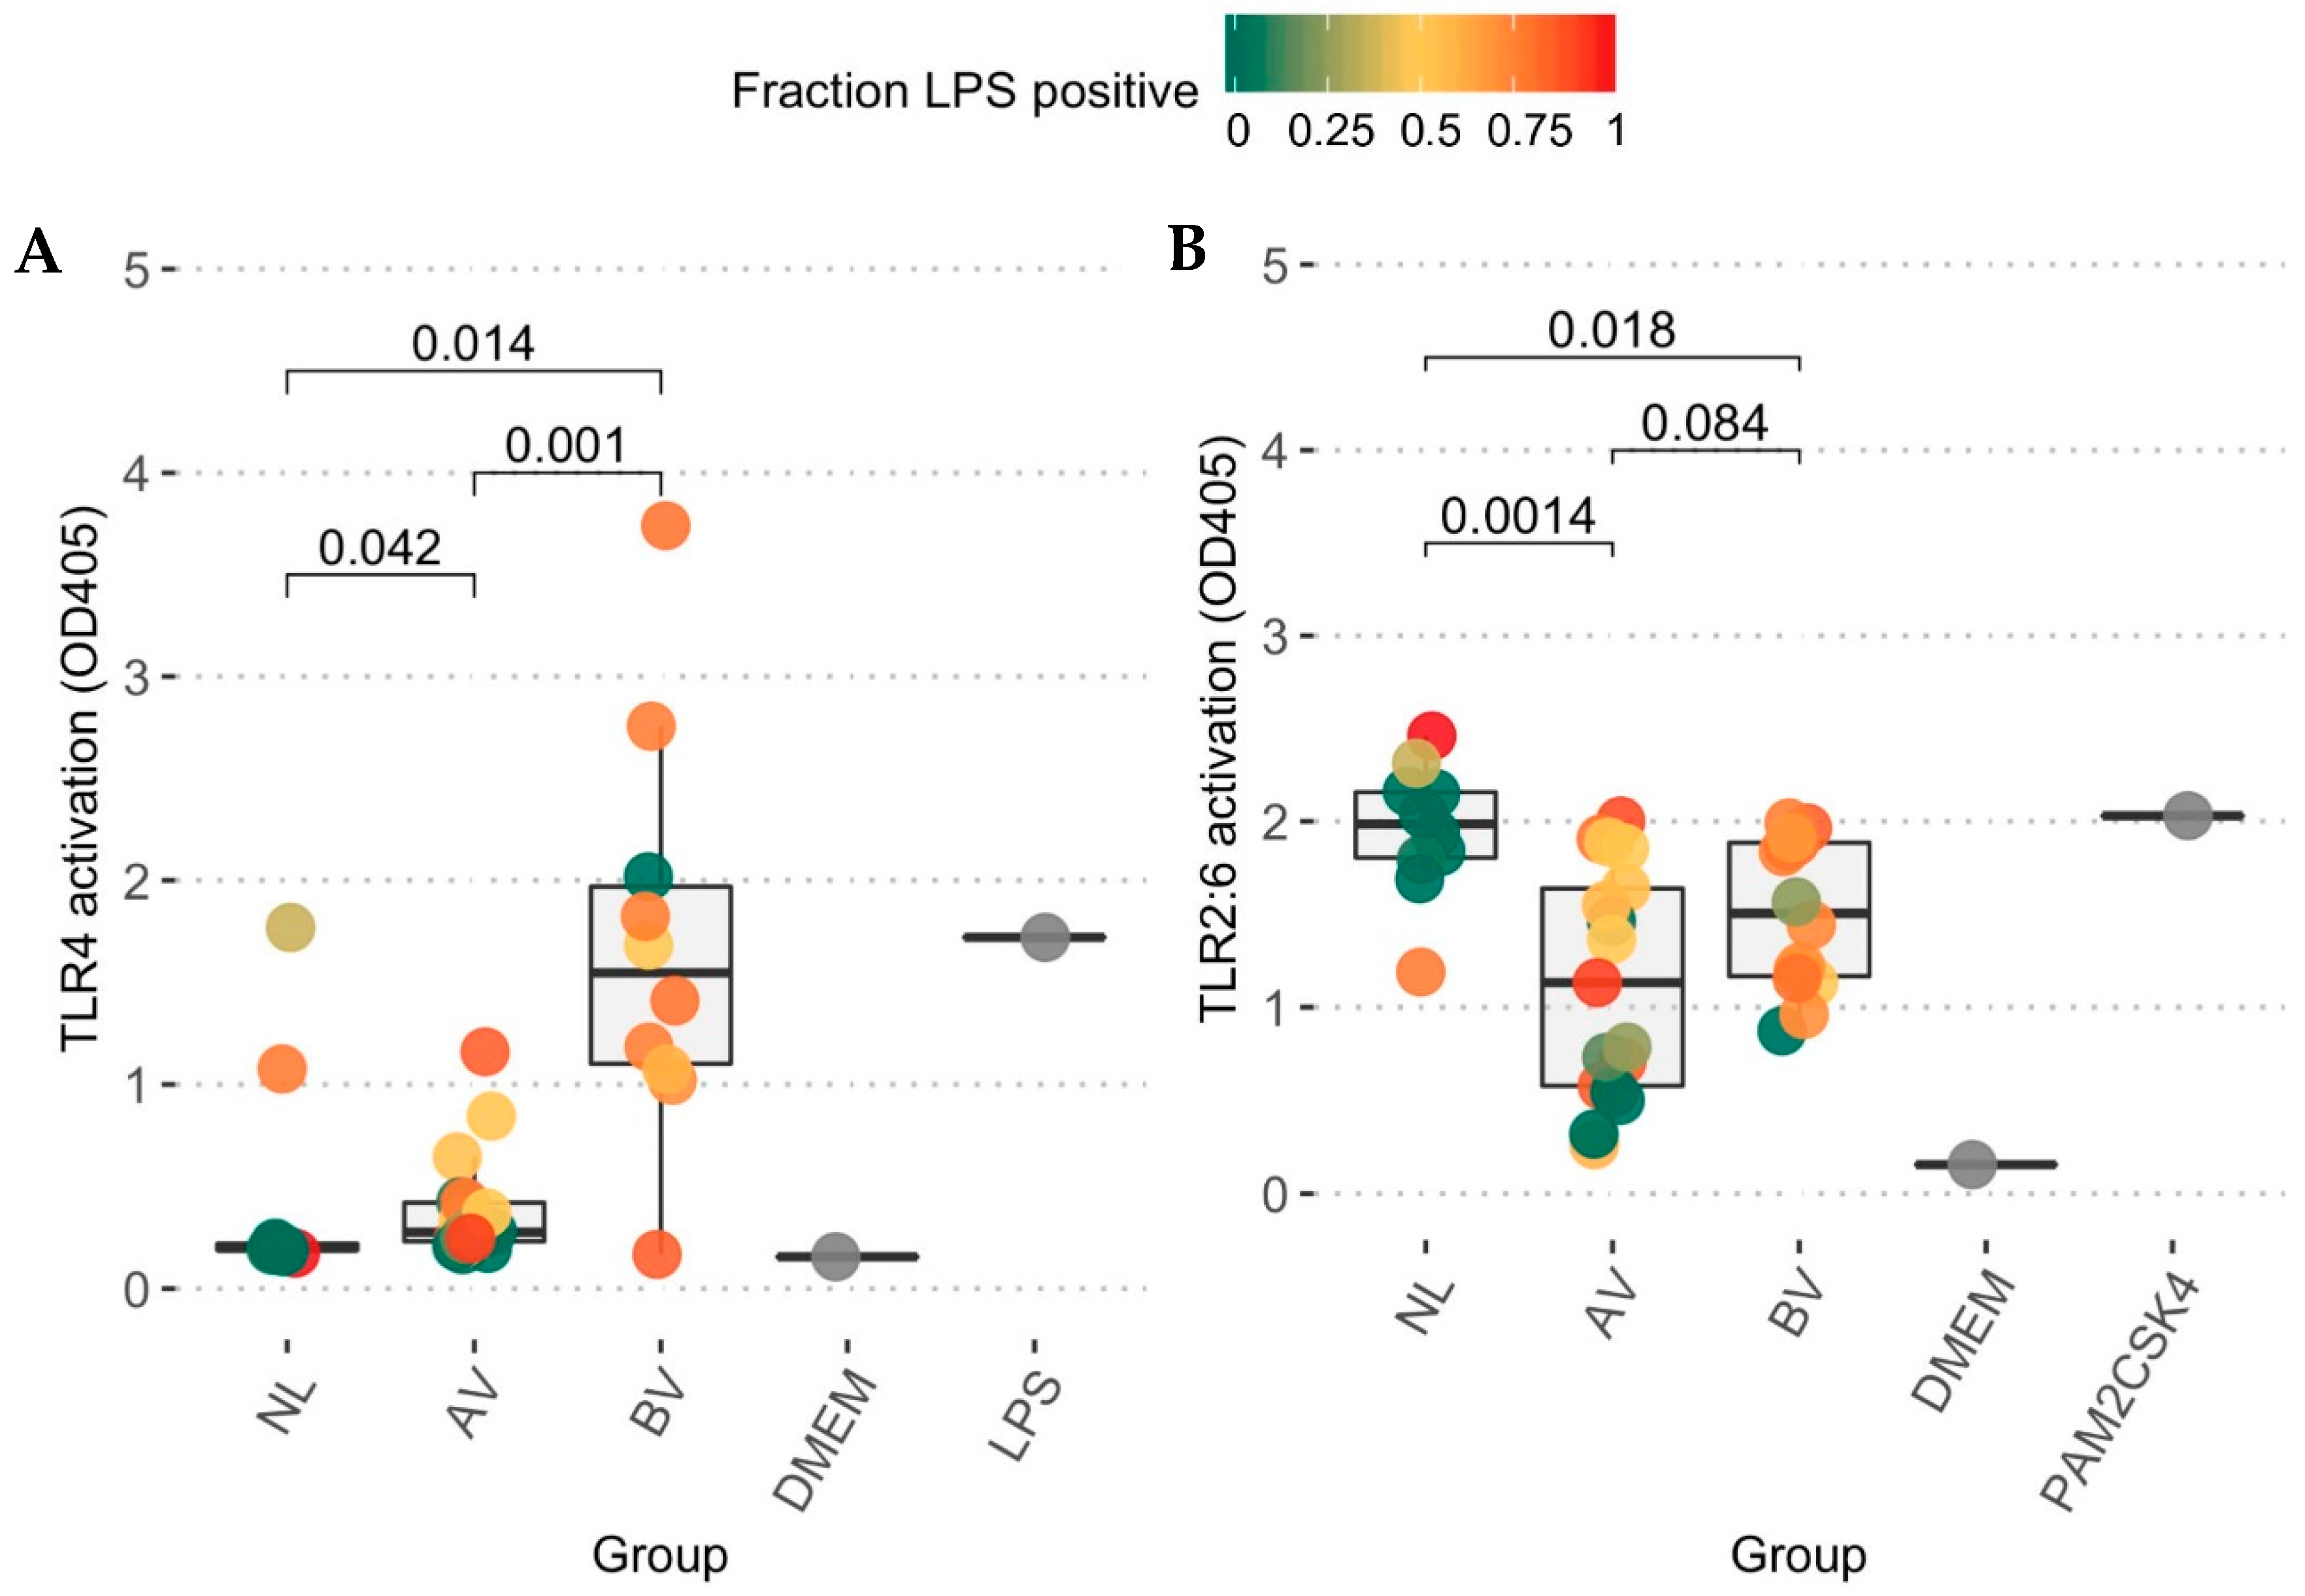
3.3. Toll-like Receptor Activation Capacity
4. Discussion
Supplementary Materials
Author Contributions
Funding
Acknowledgments
Conflicts of Interest
References
- Donders, G.G.G.; Vereecken, A.; Bosmans, E. Definition of a type of abnormal vaginal flora that is distinct from bacterial vaginosis: Aerobic vaginitis. BJOG 2002, 109, 34–43. [Google Scholar] [CrossRef] [PubMed]
- Petrova, M.I.; Lievens, E.; Malik, S.; Imholz, N.; Lebeer, S. Lactobacillus species as biomarkers and agents that can promote various aspects of vaginal health. Front. Physiol. 2015, 6, 1–18. [Google Scholar] [CrossRef] [PubMed] [Green Version]
- Marconi, C.; Donders, G.G.G.; Martin, L.F.; Ramos, B.R.A.; Duarte, M.T.C.; Parada, C.M.G.L.; Tristão, A.R.; Silva, M.G. Chlamydial infection in a high risk population: Association with vaginal flora patterns. Arch. Gynecol. Obs. 2012, 285, 1013–1018. [Google Scholar] [CrossRef] [PubMed]
- Donders, G.G.G.; Bellen, G.; Grinceviciene, S.; Ruban, K.; Vieira-Baptista, P. Aerobic vaginitis: No longer a stranger. Res. Microbiol. 2017, 168, 845–858. [Google Scholar] [CrossRef]
- Donders, G.G.G.; Vieira-Baptista, P. Bacterial vaginosis and inflammatory response showed association with severity of cervical neoplasia in HPV-positive women. Diagn. Cytopathol. 2017, 45, 472–473. [Google Scholar] [CrossRef] [PubMed]
- Vieira-Baptista, P.; Lima-Silva, J.; Pinto, C.; Saldanha, C.; Beires, J.; Martinez-de-Oliveira, J.; Donders, G. Bacterial vaginosis, aerobic vaginitis, vaginal inflammation and major Pap smear abnormalities. Eur. J. Clin. Microbiol. Infect. Dis. 2016, 35, 657–664. [Google Scholar] [CrossRef]
- Donders, G.G.G.; Bellen, G.; Ruban, K.S. Abnormal vaginal microbiota is associated with severity of localized provoked vulvodynia: Role of aerobic vaginitis and Candida in the pathogenesis of Vulvodynia. Eur. J. Microbiol. Infect. Dis. 2018, 37, 1679–1685. [Google Scholar] [CrossRef]
- Rezeberga, D.; Lazdane, G.; Kroica, J.; Sokolova, L.; Donders, G.G.G. Placental histological inflammation and reproductive tract infections in a low risk pregnant population in Latvia. Acta Obs. Gynecol. Scand. 2008, 87, 360–365. [Google Scholar] [CrossRef]
- Donders, G.G.; Van Calsteren, K.; Bellen, G.; Reybrouck, R.; Van Den Bosch, T.; Riphagen, I.; Van Lierde, S. Predictive value for preterm birth of abnormal vaginal flora, bacterial vaginosis and aerobic vaginitis during the first trimester of pregnancy. BJOG 2009, 116, 1315–1324. [Google Scholar] [CrossRef]
- Marconi, C.; Donders, G.G.G.; Bellen, G.; Brown, D.R.; Parada, C.M.G.L.; Silva, M.G. Sialidase activity in aerobic vaginitis is equal to levels during bacterial vaginosis. Eur. J. Obs. Gynecol. 2013, 167, 205–209. [Google Scholar] [CrossRef] [PubMed] [Green Version]
- Amsel, R.; Totten, P.A.; Spiegel, C.A.; Chen, K.C.S.K.; Eschenbach, D.; Holmes, K.K.K. Nonspecific vaginitis. Diagnostic criteria and microbial and epidemiologic associations. Am. J. Med. 1983, 74, 14–22. [Google Scholar] [CrossRef]
- Ravel, J.; Gajer, P.; Abdo, Z.; Schneider, G.M.; Koenig, S.S.K.; Mcculle, S.L.; Ault, K.; Peralta, L.; Forney, L.J.; Karlebach, S.; et al. Vaginal microbiome of reproductive-age women. Proc. Natl. Acad. Sci. USA 2011, 108, 4680–4687. [Google Scholar] [CrossRef] [Green Version]
- Lopes dos Santos Santiago, G.; Tency, I.; Verstraelen, H.; Verhelst, R.; Trog, M.; Temmerman, M.; Vancoillie, L.; Decat, E.; Cools, P.; Vaneechoutte, M. Longitudinal qPCR study of the dynamics of L. Crispatus, L. Iners, A. Vaginae, (Sialidase Positive) G. vaginalis, and P. bivia in the vagina. PLoS ONE 2012, 7, e45281. [Google Scholar] [CrossRef] [PubMed] [Green Version]
- Van De Wijgert, J.H.H.M.; Borgdorff, H.; Verhelst, R.; Crucitti, T.; Francis, S.; Verstraelen, H.; Jespers, V. The vaginal microbiota: What have we learned after a decade of molecular characterization? PLoS ONE 2014, 9, e105998. [Google Scholar] [CrossRef] [Green Version]
- Han, C.; Wu, W.; Fan, A.; Wang, Y.; Zhang, H.; Chu, Z.; Wang, C.; Xue, F. Diagnostic and therapeutic advancements for aerobic vaginitis. Arch. Gynecol. Obs. 2014, 291, 251–257. [Google Scholar] [CrossRef] [PubMed]
- Rumyantseva, T.A.; Bellen, G.; Savochkina, Y.A.; Guschin, A.E.; Donders, G.G.G. Diagnosis of aerobic vaginitis by quantitative real-time PCR. Arch. Gynecol. Obs. 2016, 294, 109–114. [Google Scholar] [CrossRef]
- Donders, G.G.G.; Marconi, C.; Bellen, G.; Donders, F.; Michiels, T. Effect of short training on vaginal fluid microscopy (wet mount) learning. J. Low. Genit. Tract Dis. 2015, 19, 165–169. [Google Scholar] [CrossRef]
- Callahan, B.J.; Mcmurdie, P.J.; Rosen, M.J.; Han, A.W.; Johnson, A.J.A.; Holmes, S.P. DADA2: High resolution sample inference from amplicon data. Nat. Methods 2016, 13, 581–583. [Google Scholar] [CrossRef] [Green Version]
- Li, J.; Lee, D.S.; Madrenas, J. Evolving bacterial envelopes and plasticity of TLR2-dependent responses: Basic research and translational opportunities. Front. Immunol. 2013, 4. [Google Scholar] [CrossRef] [Green Version]
- Ginsburg, I. Role of lipoteichoic acid in infection and inflammation. Lancet Infect. Dis. 2002, 2, 171–179. [Google Scholar] [CrossRef]
- Nasu, K.; Narahara, H. Pattern recognition via the toll-like receptor system in the human female genital tract. Mediat. Inflamm. 2010, 2010, 12. [Google Scholar] [CrossRef] [Green Version]
- Mancuso, G.; Midiri, A.; Beninati, C.; Biondo, C.; Galbo, R.; Akira, S.; Henneke, P.; Golenbock, D.; Teti, G. Dual role of TLR2 and myeloid differentiation factor 88 in a mouse model of invasive group B streptococcal disease. J. Immunol. 2004, 172, 6324–6329. [Google Scholar] [CrossRef] [PubMed] [Green Version]
- Claes, I.J.J.; Segers, M.E.; Verhoeven, T.L.A.; Dusselier, M.; Sels, B.F.; De Keersmaecker, S.C.J.; Vanderleyden, J.; Lebeer, S. Lipoteichoic acid is an important microbe-associated molecular pattern of Lactobacillus rhamnosus GG. Microb. Cell Fact. 2012, 11, 1. [Google Scholar] [CrossRef] [Green Version]
- Sugawara, S.; Yang, S.; Iki, K.; Hatakeyama, J.; Tamai, R.; Takeuchi, O.; Akashi, S.; Espevik, T.; Akira, S.; Takada, H. Monocytic cell activation by nonendotoxic glycoprotein from Prevotella intermedia ATCC 25611 is mediated by Toll-like receptor 2. Infect. Immun. 2001, 69, 4951–4957. [Google Scholar] [CrossRef] [PubMed] [Green Version]
- Larsen, J.M. The immune response to Prevotella bacteria in chronic inflammatory disease. Immunology 2017, 151, 363–374. [Google Scholar] [CrossRef] [PubMed] [Green Version]
- Kozich, J.J.; Westcott, S.L.; Baxter, N.T.; Highlander, S.K.; Schloss, P.D. Development of a dual-index sequencing strategy and curation pipeline for analyzing amplicon sequence data on the Miseq Illumina sequencing platform. Appl. Environ. Microbiol. 2013, 79, 5112–5120. [Google Scholar] [CrossRef] [Green Version]
- Quast, C.; Pruesse, E.; Yilmaz, P.; Gerken, J.; Schweer, T.; Yarza, P.; Peplies, J.; Glöckner, F.O. The SILVA ribosomal RNA gene database project: Improved data processing and web-based tools. Nucleic Acids Res. 2013, 41, 590–596. [Google Scholar] [CrossRef]
- Yoon, S.H.; Ha, S.M.; Kwon, S.; Lim, J.; Kim, Y.; Seo, H.; Chun, J. Introducing EzBioCloud: A taxonomically united database of 16S rRNA gene sequences and whole-genome assemblies. Int. J. Syst. Evol. Microbiol. 2017, 67, 1613–1617. [Google Scholar] [CrossRef]
- McMurdie, P.J.; Holmes, S. Phyloseq: An R package for reproducible interactive analysis and graphics of microbiome census data. PLoS ONE 2013, 8. [Google Scholar] [CrossRef] [Green Version]
- Mandal, S.; Van Treuren, W.; White, R.A.; Eggesbø, M.; Knight, R.; Peddada, S.D. Analysis of composition of microbiomes: A novel method for studying microbial composition. Microb. Ecol. Heal. Dis. 2015, 26, 1–7. [Google Scholar] [CrossRef] [Green Version]
- Benjamini, Y.; Yekutieli, D. The control of the false discovery rate in multiple testing under dependency. Ann. Stat. 2001, 29, 1165–1188. [Google Scholar] [CrossRef]
- Callahan, B.J.; DiGiulio, D.B.; Goltsman, D.S.A.; Sun, C.L.; Costello, E.K.; Jeganathan, P.; Biggio, J.R.; Wong, R.J.; Druzin, M.L.; Shaw, G.M.; et al. Replication and refinement of a vaginal microbial signature of preterm birth in two racially distinct cohorts of US women. Proc. Natl. Acad. Sci. USA 2017, 114, 9966–9971. [Google Scholar] [CrossRef] [Green Version]
- Bilardi, J.E.; Walker, S.; Temple-Smith, M.; McNair, R.; Mooney-Somers, J.; Bellhouse, C.; Fairley, C.K.; Chen, M.Y.; Bradshaw, C. The burden of bacterial vaginosis: Women’s experience of the physical, emotional, sexual and social impact of living with recurrent bacterial vaginosis. PLoS ONE 2013, 8, e74378. [Google Scholar] [CrossRef] [PubMed] [Green Version]
- Shabayek, S.; Spellerberg, B. Group B streptococcal colonization, molecular characteristics, and epidemiology. Front. Microbiol. 2018, 9. [Google Scholar] [CrossRef]
- Petrina, M.A.B.; Cosentino, L.A.; Rabe, L.K.; Hillier, S.L. Susceptibility of bacterial vaginosis (BV)-associated bacteria to secnidazole compared to metronidazole, tinidazole and clindamycin. Anaerobe 2017, 47, 115–119. [Google Scholar] [CrossRef] [PubMed]
- Jumas-Bilak, E.; Jean-Pierre, H.; Carlier, J.; Teyssier, C.; Bernard, K.; Gay, B.; Campos, J.; Morio, F.; Marchandin, H. Dialister micraerophilus sp. nov. and Dialister propionicifaciens sp. nov., isolated from human clinical samples. Int. J. Syst. Evol. Microbiol. 2005, 55, 2471–2478. [Google Scholar] [CrossRef] [Green Version]
- Onderdonk, A.B.; Delaney, M.L.; Fichorova, R.N.; Fichorova, N. The human microbiome during bacterial vaginosis. Clin. Microbiol. Rev. 2016, 29, 223–238. [Google Scholar] [CrossRef] [Green Version]
- Africa, C.W.J.; Nel, J.; Stemmet, M. Anaerobes and bacterial vaginosis in pregnancy: Virulence factors contributing to vaginal colonisation. Int. J. Environ. Res. Public Health 2014, 11, 6979–7000. [Google Scholar] [CrossRef] [PubMed]
- Krohn, M.A.; Hillier, S.L.; Lee, M.L.; Rabe, L.K.; Eschenbach, D.A. Vaginal Bacteroides species are associated with an increased rate of preterm delivery among women in preterm labor. J. Infect. Dis. 1991, 164, 88–93. [Google Scholar] [CrossRef] [PubMed]
- Oleen-Burkey, M.A.; Hillier, S.L. Pregnancy complications associated with bacterial vaginosis and their estimated costs. Infect. Dis. Obs. Gynecol. 1995, 3, 149–157. [Google Scholar] [CrossRef]
- Donders, G.G.G.; Bellen, G.; Rezeberga, D. Aerobic vaginitis in pregnancy. BJOG 2011, 118, 1163–1170. [Google Scholar] [CrossRef] [PubMed]
- Kolar, S.L.; Kyme, P.; Tseng, C.W.; Soliman, A.; Kaplan, A.; Liang, J.; Nizet, V.; Jiang, D.; Murali, R.; Arditi, M.; et al. Group B Streptococcus evades host immunity by degrading hyaluronan. Cell Host Microbe 2015, 18, 694–704. [Google Scholar] [CrossRef] [PubMed] [Green Version]
- Ramsey, M.M.; Freire, M.O.; Gabrilska, R.A.; Rumbaugh, K.P.; Lemon, K.P. Staphylococcus aureus shifts toward commensalism in response to Corynebacterium species. Front. Microbiol. 2016, 7, 1–15. [Google Scholar] [CrossRef] [Green Version]
- Tempera, G.; Bonfiglio, G.; Cammarata, E.; Corsello, S.; Cianci, A. Microbiological/clinical characteristics and validation of topical therapy with kanamycin in aerobic vaginitis: A pilot study. Int. J. Antimicrob. Agents 2004, 24, 85–88. [Google Scholar] [CrossRef] [PubMed]
- Lebeer, S.; Vanderleyden, J.; De Keersmaecker, S.C.J. Genes and molecules of lactobacilli supporting probiotic action. Microbiol. Mol. Biol. Rev. 2008, 72, 728–764. [Google Scholar] [CrossRef] [PubMed] [Green Version]


Publisher’s Note: MDPI stays neutral with regard to jurisdictional claims in published maps and institutional affiliations. |
© 2020 by the authors. Licensee MDPI, Basel, Switzerland. This article is an open access article distributed under the terms and conditions of the Creative Commons Attribution (CC BY) license (http://creativecommons.org/licenses/by/4.0/).
Share and Cite
Oerlemans, E.F.M.; Wuyts, S.; Bellen, G.; Wittouck, S.; De Boeck, I.; Ruban, K.; Allonsius, C.N.; van den Broek, M.F.L.; Donders, G.G.G.; Lebeer, S. The Dwindling Microbiota of Aerobic Vaginitis, an Inflammatory State Enriched in Pathobionts with Limited TLR Stimulation. Diagnostics 2020, 10, 879. https://0-doi-org.brum.beds.ac.uk/10.3390/diagnostics10110879
Oerlemans EFM, Wuyts S, Bellen G, Wittouck S, De Boeck I, Ruban K, Allonsius CN, van den Broek MFL, Donders GGG, Lebeer S. The Dwindling Microbiota of Aerobic Vaginitis, an Inflammatory State Enriched in Pathobionts with Limited TLR Stimulation. Diagnostics. 2020; 10(11):879. https://0-doi-org.brum.beds.ac.uk/10.3390/diagnostics10110879
Chicago/Turabian StyleOerlemans, Eline F. M., Sander Wuyts, Gert Bellen, Stijn Wittouck, Ilke De Boeck, Kateryna Ruban, Camille Nina Allonsius, Marianne F. L. van den Broek, Gilbert G. G. Donders, and Sarah Lebeer. 2020. "The Dwindling Microbiota of Aerobic Vaginitis, an Inflammatory State Enriched in Pathobionts with Limited TLR Stimulation" Diagnostics 10, no. 11: 879. https://0-doi-org.brum.beds.ac.uk/10.3390/diagnostics10110879