
Balancing Speed and Accuracy in Cardiac Magnetic Resonance Function Post-Processing: Comparing 2 Levels of Automation in 3 Vendors to Manual Assessment

 , , ,
, , , 
Abstract
:1. Introduction
2. Materials and Methods
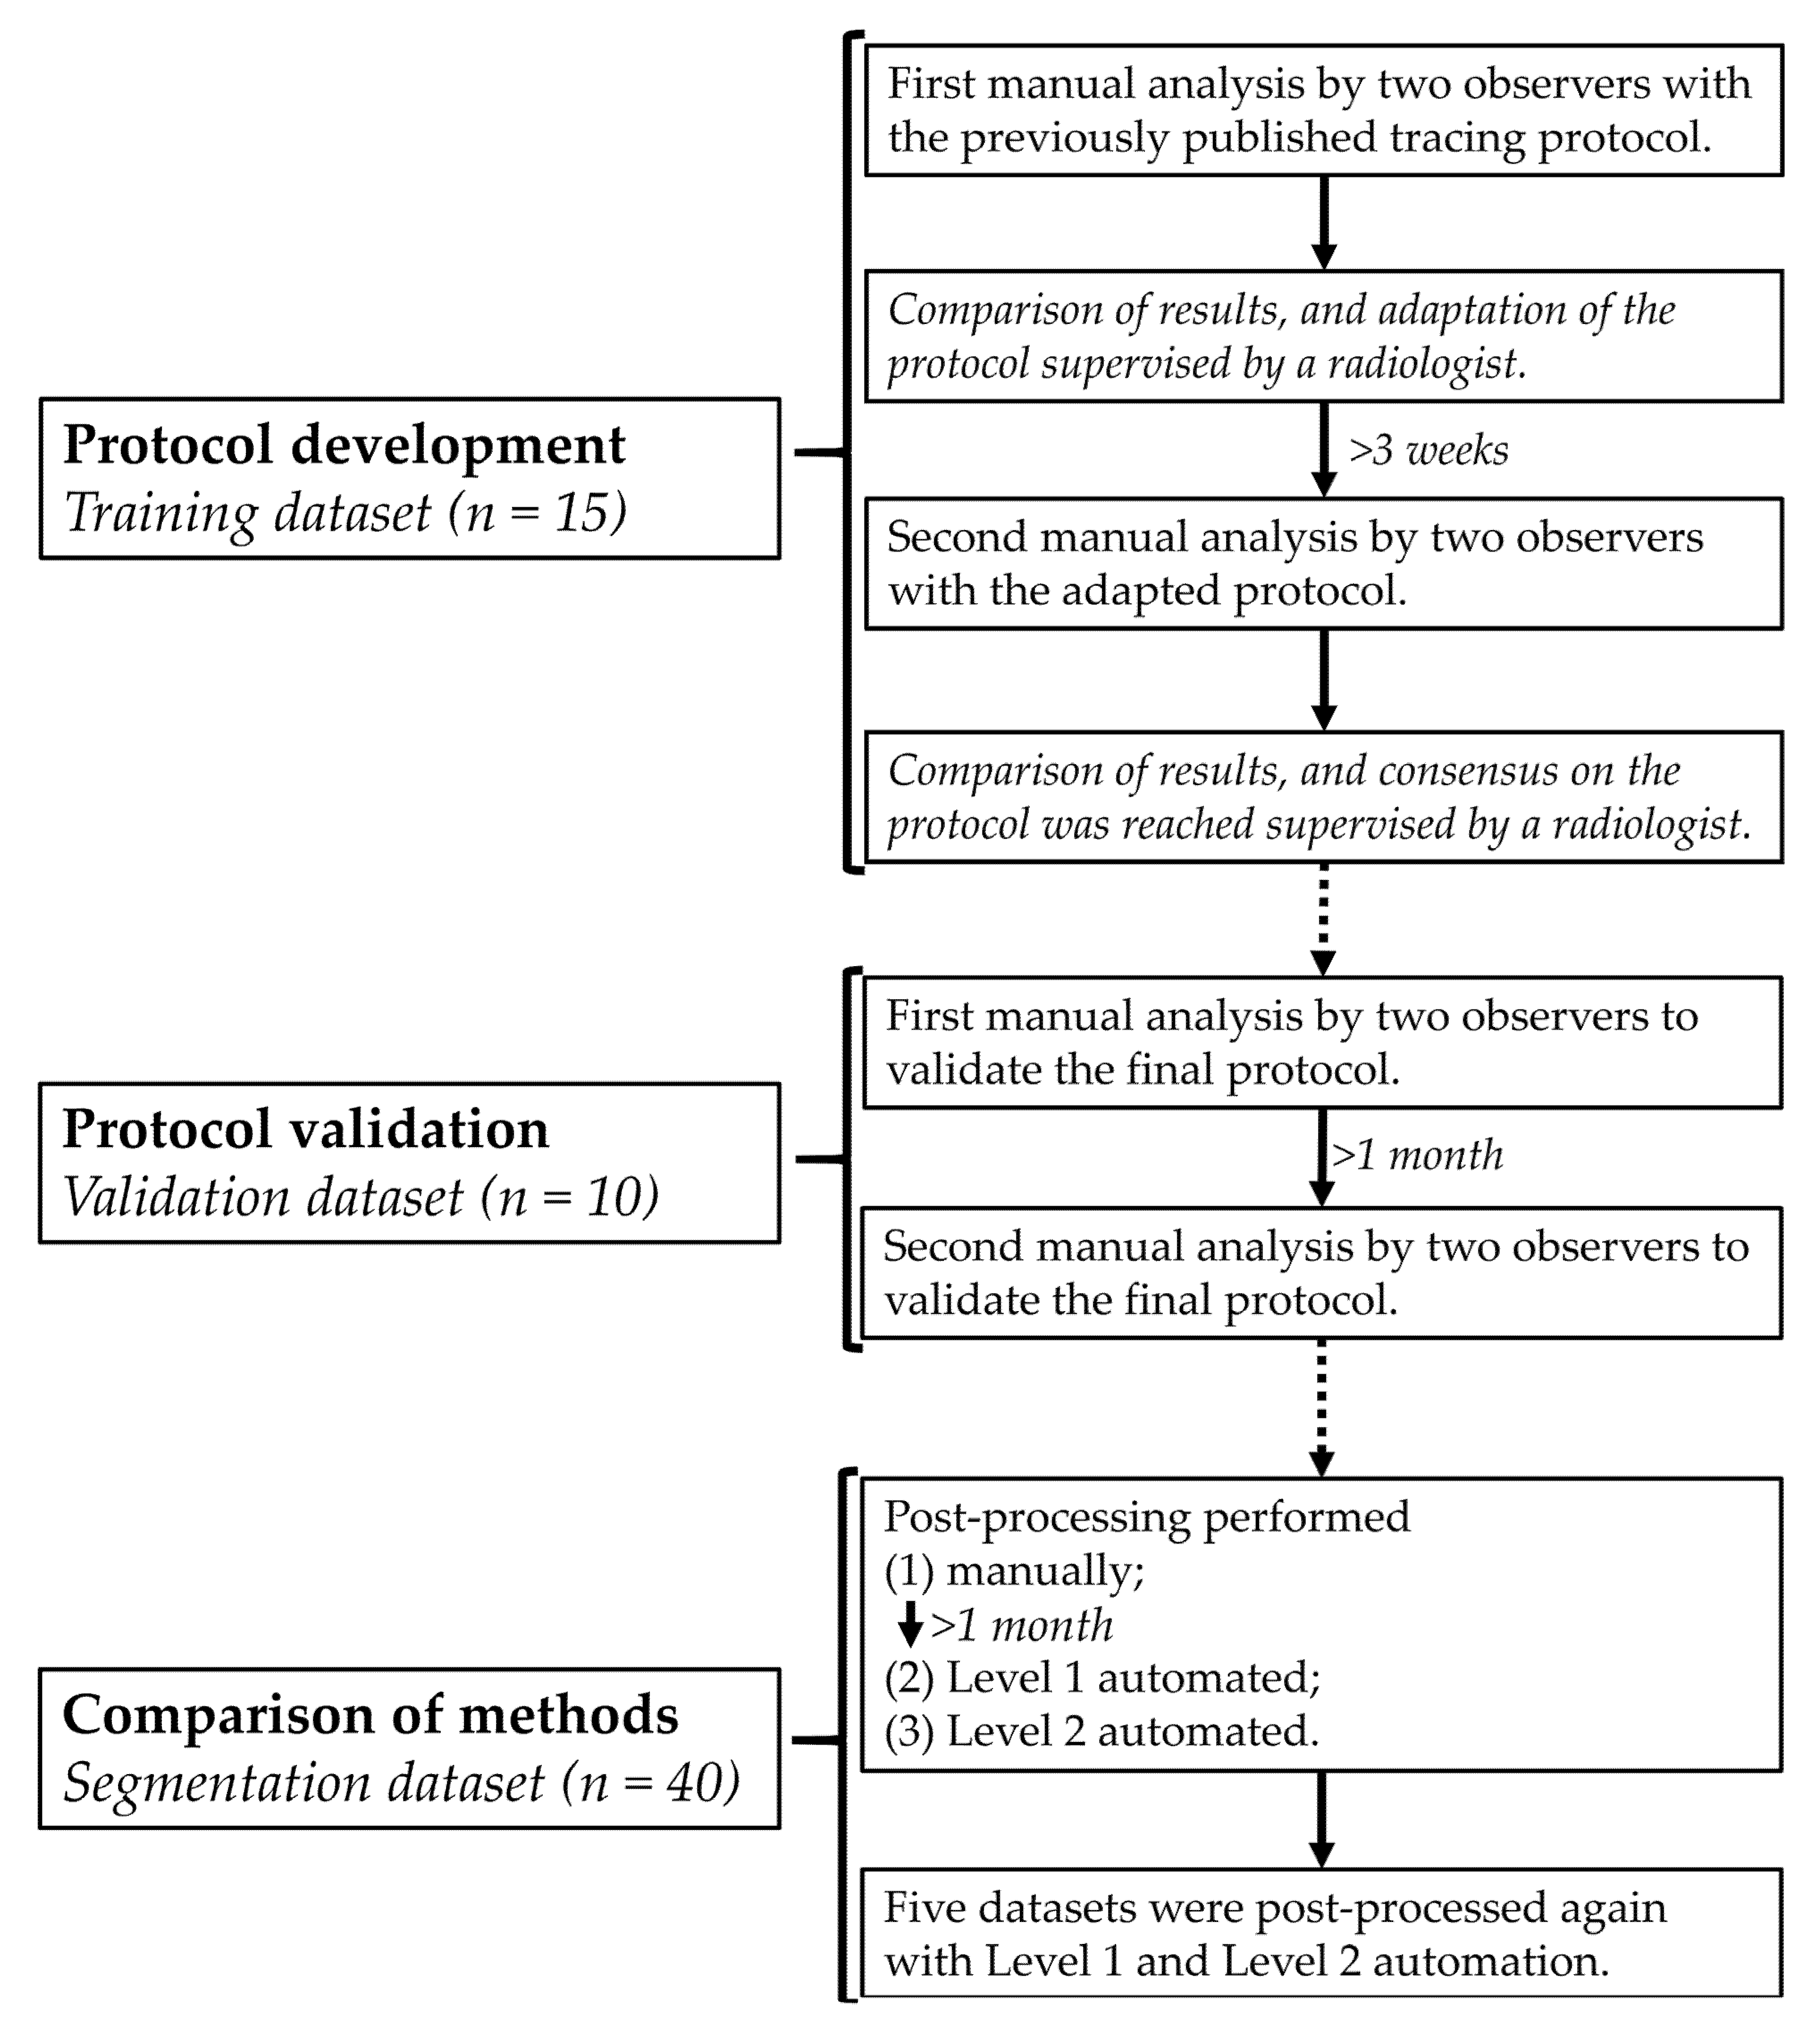
2.1. Study Population
2.2. CMR Imaging
2.3. Contour-Tracing Protocol
2.4. Post-Processing Methods
2.5. Statistical Analysis
3. Results
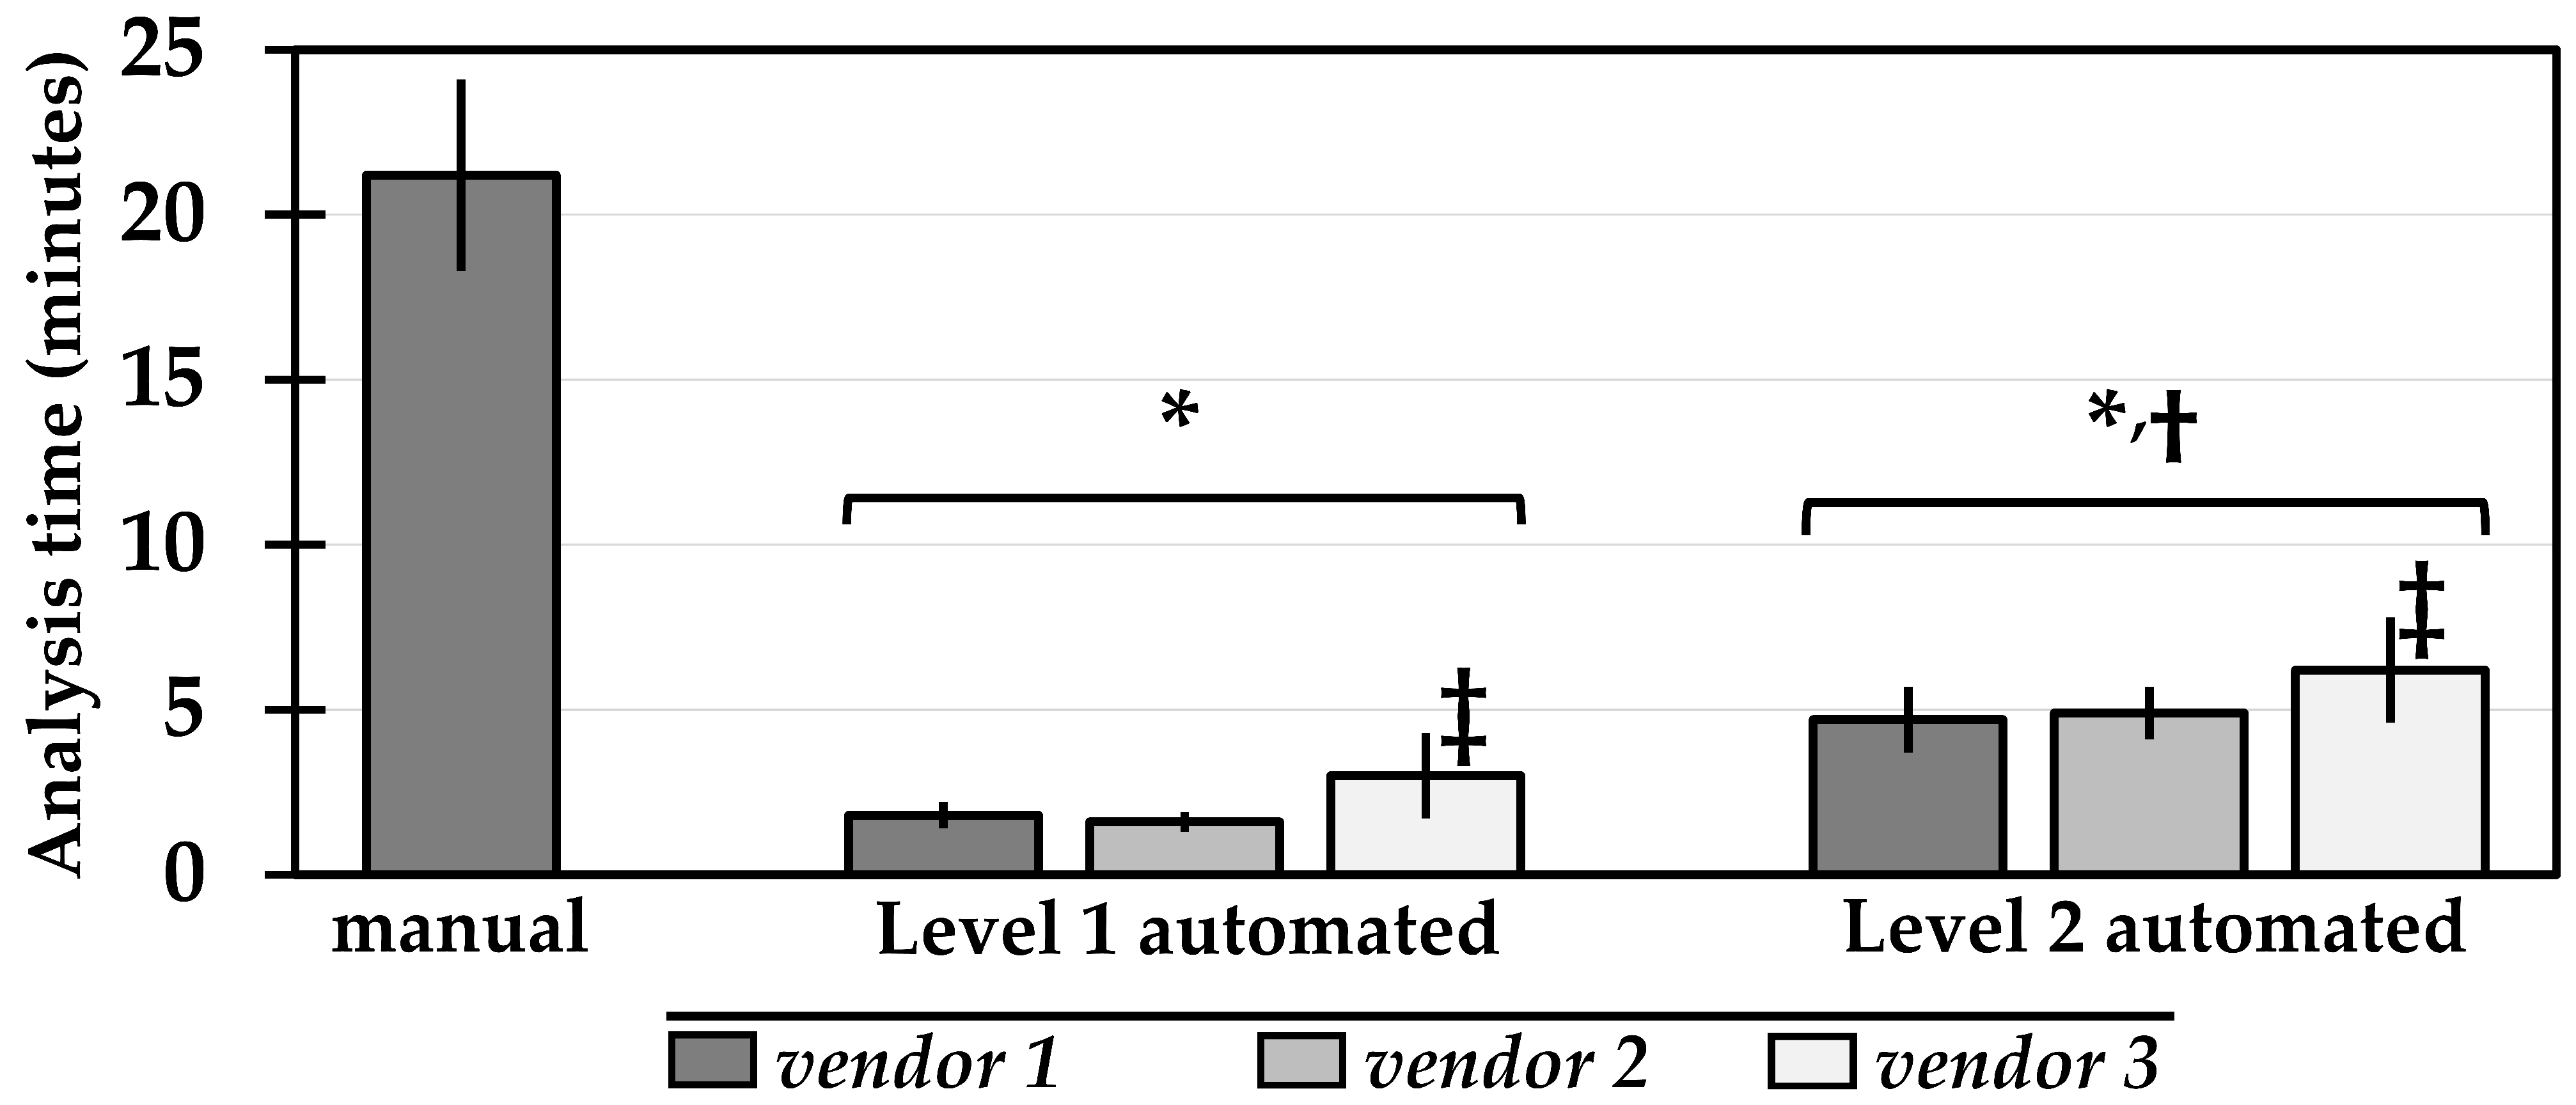
3.1. Analysis Time
3.2. Reproducibility
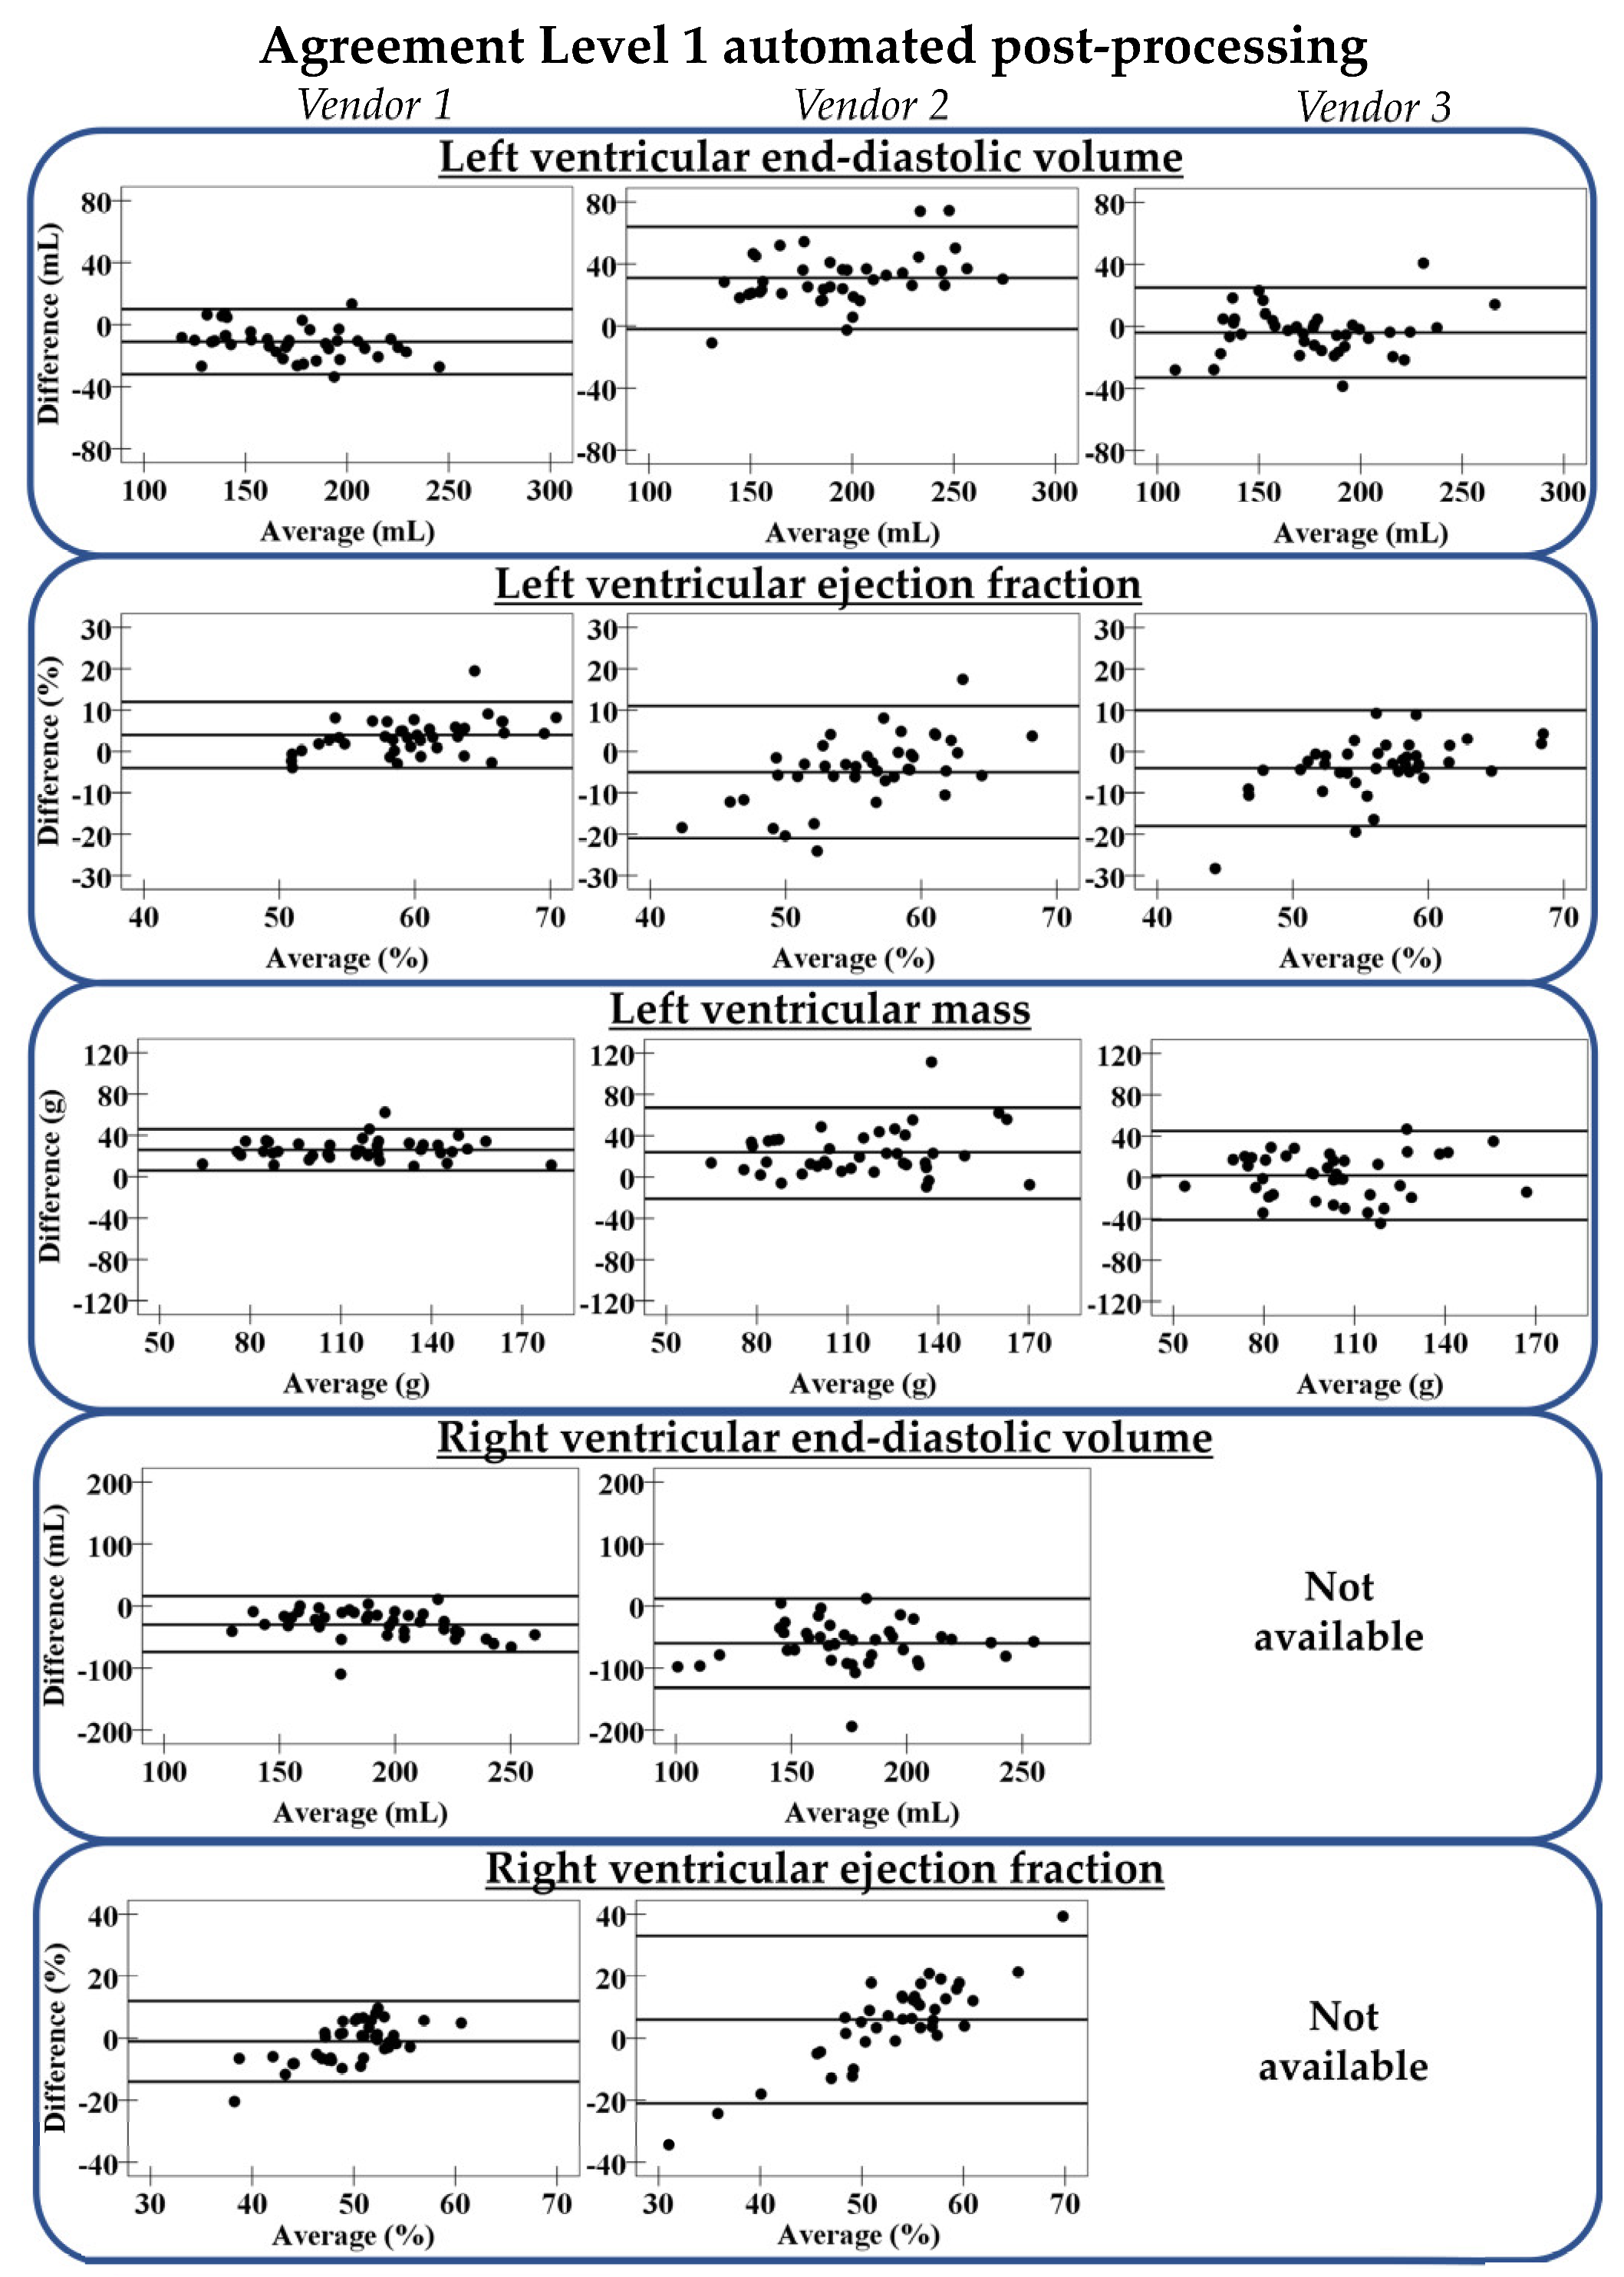
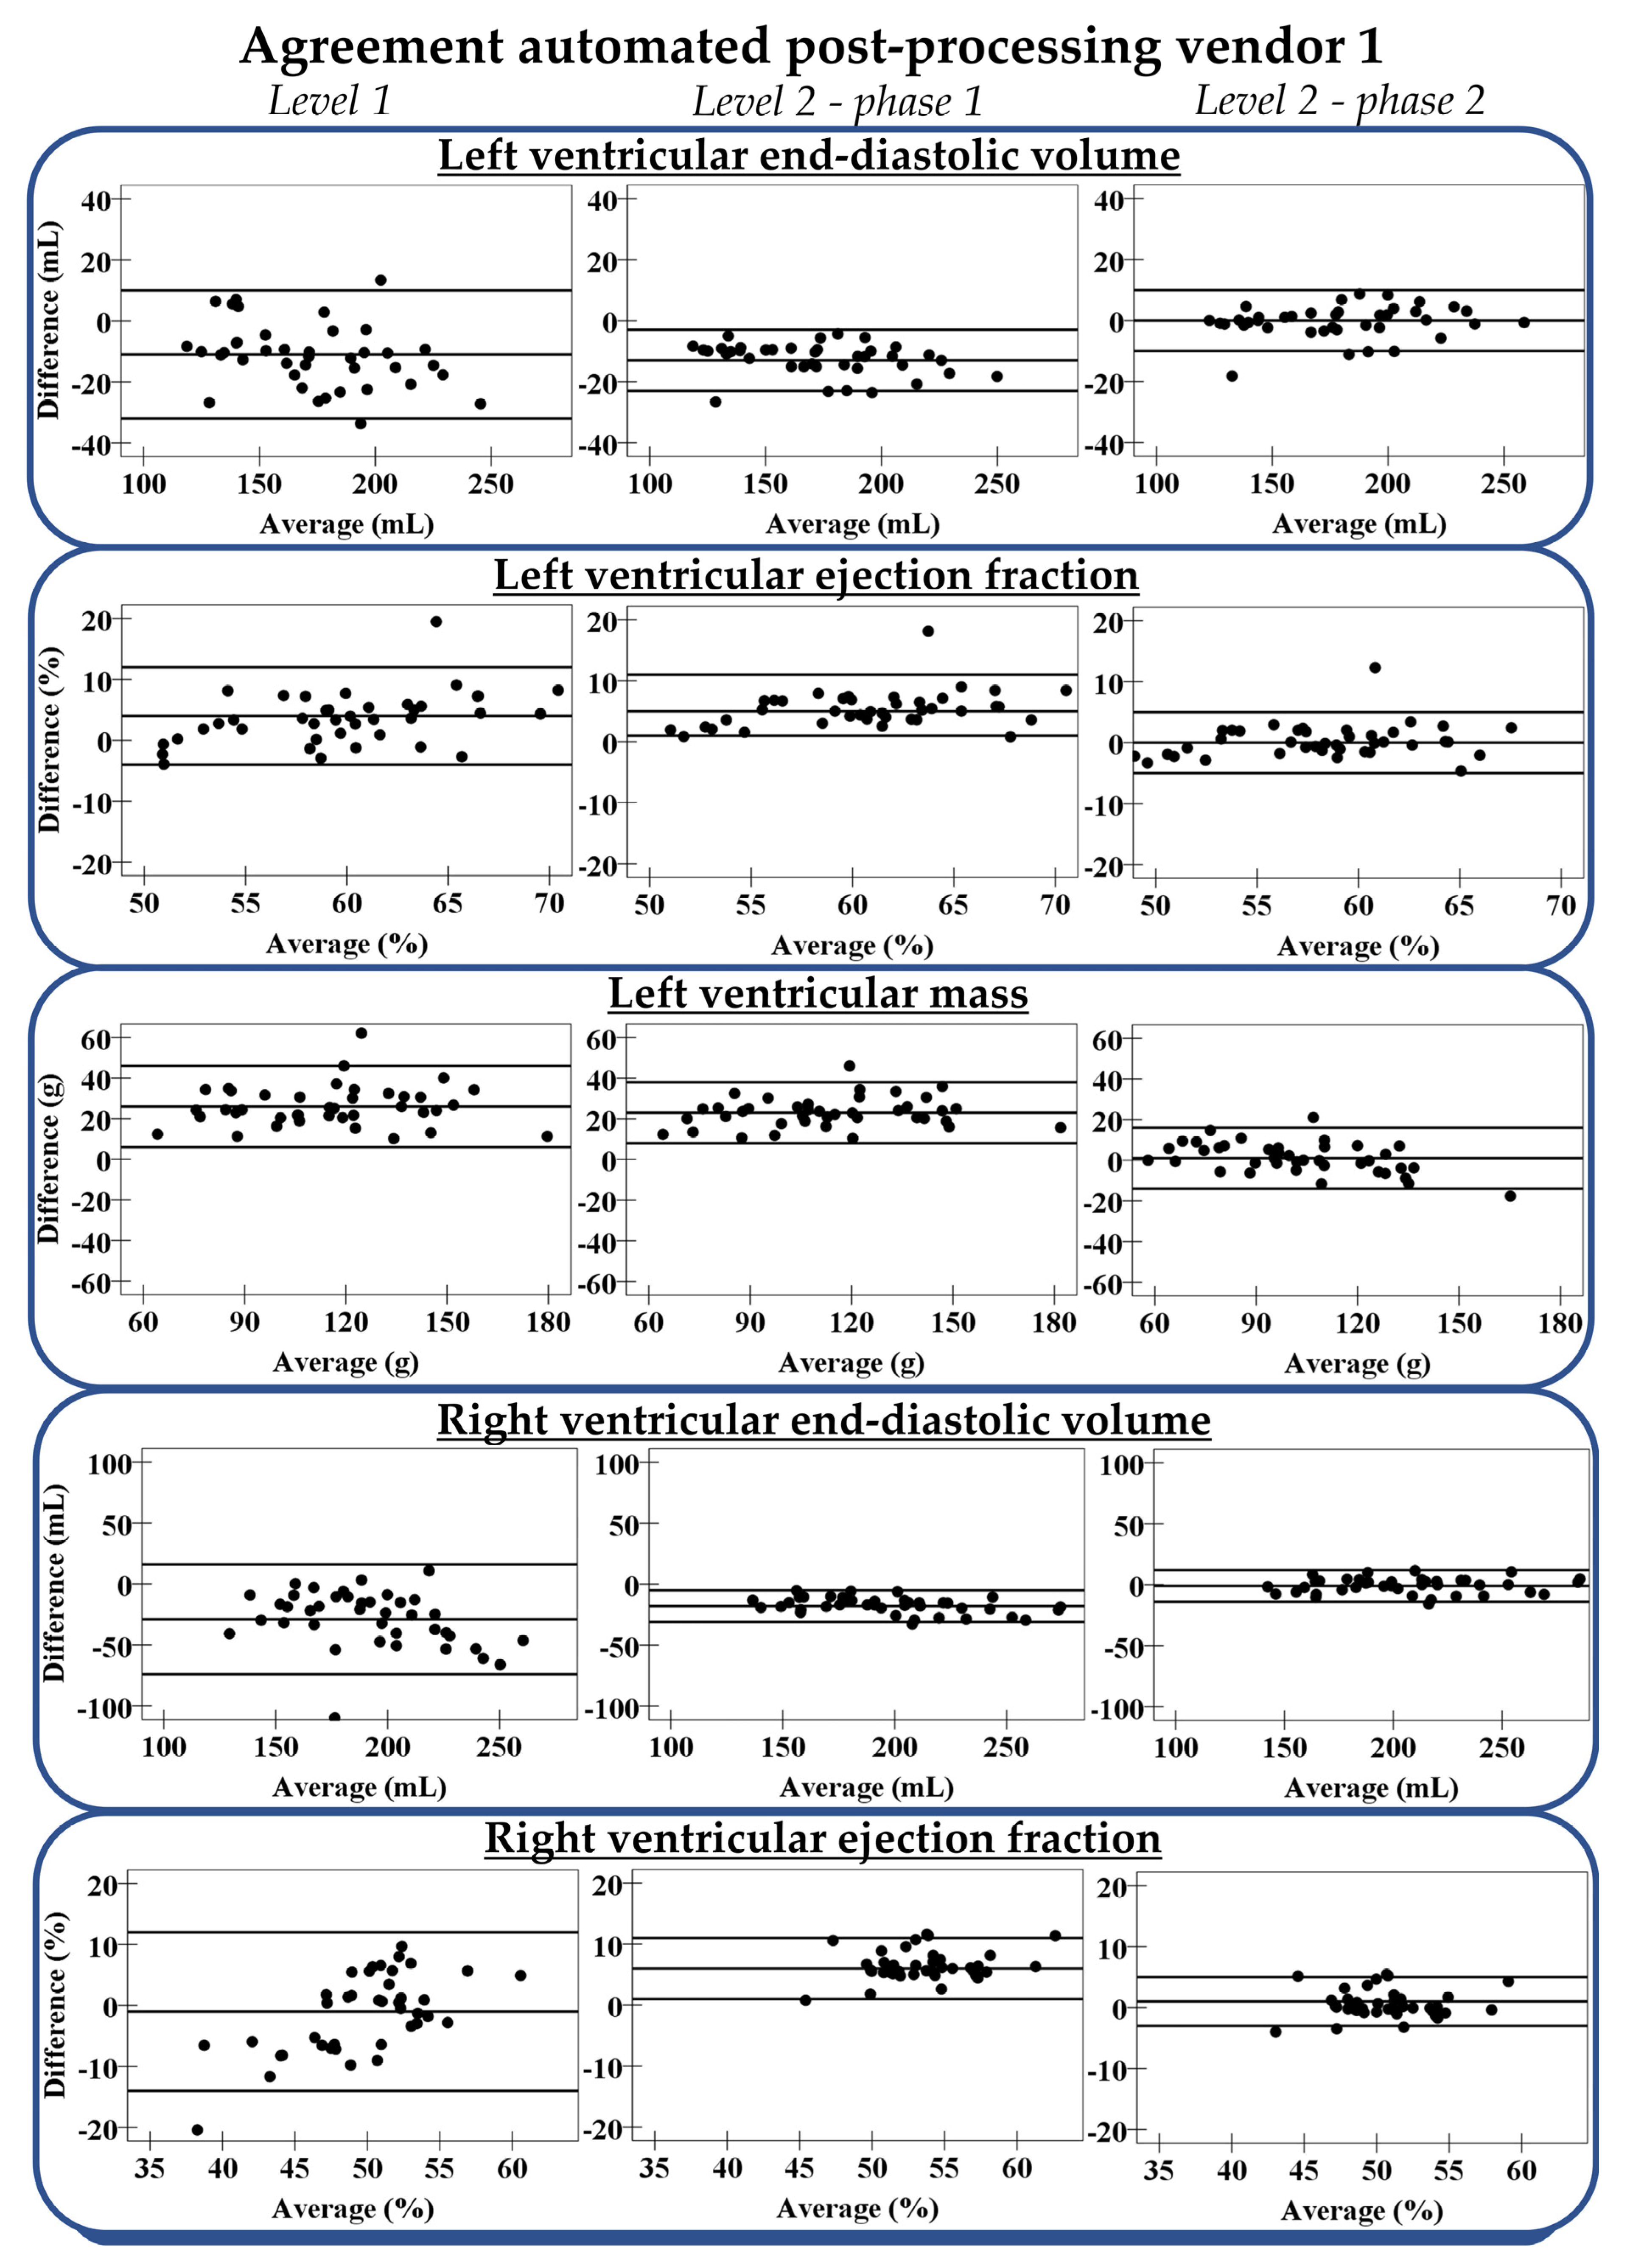
3.3. Accuracy
3.3.1. Level 1 Automation
3.3.2. Level 2 Automation
4. Discussion
5. Conclusions
Supplementary Materials
Author Contributions
Funding
Institutional Review Board Statement
Informed Consent Statement
Data Availability Statement
Conflicts of Interest
References
- Ponikowski, P.; Voors, A.A.; Anker, S.D.; Bueno, H.; Cleland, J.G.F.; Coats, A.J.S.; Falk, V.; González-Juanatey, J.R.; Harjola, V.P.; Jankowska, E.A.; et al. 2016 ESC Guidelines for the diagnosis and treatment of acute and chronic heart failure. Eur. Heart J. 2016, 37, 2129–2200. [Google Scholar] [CrossRef] [PubMed]
- Schulz-Menger, J.; Bluemke, D.A.; Bremerich, J.; Flamm, S.D.; Fogel, M.A.; Friedrich, M.G.; Kim, R.J.; von Knobelsdorff-Brenkenhoff, F.; Kramer, C.M.; Pennell, D.J.; et al. Standardized image interpretation and post-processing in cardiovascular magnetic resonance—2020 update. Society for Cardiovascular Magnetic Resonance (SCMR): Board of Trustees Task Force on Standardized Post-Processing. J. Cardiovasc. Magn. Reson. 2020, 22, 19. [Google Scholar] [CrossRef]
- Petitjean, C.; Dacher, J.N. A review of segmentation methods in short axis cardiac MR images. Med. Image Anal. 2011, 15, 169–184. [Google Scholar] [CrossRef] [Green Version]
- Siegersma, K.R.; Leiner, T.; Chew, D.P.; Appelman, Y.; Hofstra, L.; Verjans, J.W. Artificial intelligence in cardiovascular imaging: State of the art and implications for the imaging cardiologist. Neth. Hear. J. 2019, 27, 403–413. [Google Scholar] [CrossRef] [PubMed] [Green Version]
- Bai, W.; Sinclair, M.; Tarroni, G.; Oktay, O.; Rajchl, M.; Vaillant, G.; Lee, A.M.; Aung, N.; Lukaschuk, E.; Sanghvi, M.M.; et al. Automated cardiovascular magnetic resonance image analysis with fully convolutional networks. J. Cardiovasc. Magn. Reson. 2018, 20, 65. [Google Scholar] [CrossRef] [PubMed] [Green Version]
- Backhaus, S.J.; Staab, W.; Steinmetz, M.; Ritter, C.O.; Lotz, J.; Hasenfuß, G.; Schuster, A.; Kowallick, J.T. Fully automated quantification of biventricular volumes and function in cardiovascular magnetic resonance: Applicability to clinical routine settings. J. Cardiovasc. Magn. Reson. 2019, 21, 24. [Google Scholar] [CrossRef] [PubMed] [Green Version]
- Ruijsink, B.; Puyol-Antón, E.; Oksuz, I.; Sinclair, M.; Bai, W.; Schnabel, J.A.; Razavi, R.; King, A.P. Fully Automated, Quality-Controlled Cardiac Analysis From CMR: Validation and Large-Scale Application to Characterize Cardiac Function. JACC Cardiovasc. Imaging 2020, 13, 684–695. [Google Scholar] [CrossRef]
- Bartolomé, P.; Caballeros, M.; Quílez-Larragan, A.; Núñez-Córdoba, J.M.; Fernández González, Ó.; Ezponda, A.; Bastarrika, G. Accuracy and Time-Efficiency of an Automated Software Tool to Assess Left Ventricular Parameters in Cardiac Magnetic Resonance Imaging. J. Thorac. Imaging 2020, 35, 64–70. [Google Scholar] [CrossRef] [PubMed]
- Hautvast, G.L.T.F.; Salton, C.J.; Chuang, M.L.; Breeuwer, M.; O’Donnell, C.J.; Manning, W.J. Accurate Computer-Aided Quantification of Left Ventricular Parameters: Experience in 1555 CMR Studies from the Framingham Heart Study. Magn. Reson. Med. 2012, 67, 1478–1486. [Google Scholar] [CrossRef] [PubMed] [Green Version]
- Böttcher, B.; Beller, E.; Busse, A.; Cantré, D.; Yücel, S.; Öner, A.; Ince, H.; Weber, M.A.; Meinel, F.G. Fully automated quantification of left ventricular volumes and function in cardiac MRI: Clinical evaluation of a deep learning-based algorithm. Int. J. Cardiovasc. Imaging 2020, 36, 2239–2247. [Google Scholar] [CrossRef] [PubMed]
- Marcus, J.T.; Götte, M.J.W.; DeWaal, L.K.; Stam, M.R.; Van Der Geest, R.J.; Heethaar, R.M.; Van Rossum, A.C. The Influence of Through-Plane Motion on Left Ventricular Volumes Measured by Magnetic Resonance Imaging: Implications for Image Acquisition and Analysis. J. Cardiovasc. Magn. Reson. 1999, 1, 1–6. [Google Scholar] [CrossRef] [PubMed]
- Paknezhad, M.; Marchesseau, S.; Brown, M.S. Automatic basal slice detection for cardiac analysis. J. Med. Imaging 2016, 3, 34004. [Google Scholar] [CrossRef] [PubMed] [Green Version]
- Avendi, M.R.; Kheradvar, A.; Jafarkhani, H. A combined deep-learning and deformable-model approach to fully automatic segmentation of the left ventricle in cardiac MRI. Med. Image Anal. 2016, 30, 108–119. [Google Scholar] [CrossRef] [PubMed] [Green Version]
- Suinesiaputra, A.; Bluemke, D.A.; Cowan, B.R.; Friedrich, M.G.; Kramer, C.M.; Kwong, R.; Plein, S.; Schulz-Menger, J.; Westenberg, J.J.M.; Young, A.A.; et al. Quantification of LV function and mass by cardiovascular magnetic resonance: Multi-center variability and consensus contours. J. Cardiovasc. Magn. Reson. 2015, 17, 63. [Google Scholar] [CrossRef] [Green Version]
- Hedström, E.; Ishida, M.; Sepúlveda-Martínez, A.; Salehi, D.; Sperling, J.; Engblom, H.; Nagel, E. The effect of initial teaching on evaluation of left ventricular volumes by cardiovascular magnetic resonance imaging: Comparison between complete and intermediate beginners and experienced observers. BMC Med. Imaging 2017, 17, 33. [Google Scholar] [CrossRef] [Green Version]
- Bonnemains, L.; Mandry, D.; Marie, P.Y.; Micard, E.; Chen, B.; Vuissoz, P.A. Assessment of right ventricle volumes and function by cardiac MRI: Quantification of the regional and global interobserver variability. Magn. Reson. Med. 2012, 67, 1740–1746. [Google Scholar] [CrossRef]
- Kramer, C.M.; Barkhausen, J.; Bucciarelli-Ducci, C.; Flamm, S.D.; Kim, R.J.; Nagel, E. Standardized cardiovascular magnetic resonance (CMR) protocols 2020 update. J. Cardiovasc. Magn. Reson. 2020, 22, 17. [Google Scholar] [CrossRef]
- Prakken, N.H.; Velthuis, B.K.; Vonken, E.-J.J.; Mali, W.P.; Cramer, M.-J.J. Cardiac MRI: Standardized Right and Left Ventricular Quantification by Briefly Coaching Inexperienced Personnel. Open Magn. Reson. J. 2008, 1, 104–111. [Google Scholar] [CrossRef]
- Watson, P.F.; Petrie, A. Method agreement analysis: A review of correct methodology. Theriogenology 2010, 73, 1167–1179. [Google Scholar] [CrossRef] [Green Version]
- Koo, T.K.; Li, M.Y. A Guideline of Selecting and Reporting Intraclass Correlation Coefficients for Reliability Research. J. Chiropr. Med. 2016, 15, 155–163. [Google Scholar] [CrossRef] [Green Version]
- Hudsmith, L.E.; Petersen, S.E.; Francis, J.M.; Robson, M.D.; Neubauer, S. Normal human left and right ventricular and left atrial dimensions using steady state free precession magnetic resonance imaging. J. Cardiovasc. Magn. Reson. 2005, 7, 775–782. [Google Scholar] [CrossRef]
- Suinesiaputra, A.; Sanghvi, M.M.; Aung, N.; Paiva, J.M.; Zemrak, F.; Fung, K.; Lukaschuk, E.; Lee, A.M.; Carapella, V.; Kim, Y.J.; et al. Fully-automated left ventricular mass and volume MRI analysis in the UK Biobank population cohort: Evaluation of initial results. Int. J. Cardiovasc. Imaging 2018, 34, 281–291. [Google Scholar] [CrossRef] [Green Version]
- Petersen, S.E.; Aung, N.; Sanghvi, M.M.; Zemrak, F.; Fung, K.; Paiva, J.M.; Francis, J.M.; Khanji, M.Y.; Lukaschuk, E.; Lee, A.M.; et al. Reference ranges for cardiac structure and function using cardiovascular magnetic resonance (CMR) in Caucasians from the UK Biobank population cohort. J. Cardiovasc. Magn. Reson. 2017, 19, 18. [Google Scholar] [CrossRef] [PubMed] [Green Version]
- Alfakih, K.; Plein, S.; Thiele, H.; Jones, T.; Ridgway, J.P.; Sivananthan, M.U. Normal human left and right ventricular dimensions for MRI as assessed by turbo gradient echo and steady-state free precession imaging sequences. J. Magn. Reson. Imaging 2003, 17, 323–329. [Google Scholar] [CrossRef] [PubMed]
- Csecs, I.; Czimbalmos, C.; Suhai, F.I.; Mikle, R.; Mirzahosseini, A.; Dohy, Z.; Szűcs, A.; Kiss, A.R.; Simor, T.; Tóth, A.; et al. Left and right ventricular parameters corrected with threshold-based quantification method in a normal cohort analyzed by three independent observers with various training-degree. Int. J. Cardiovasc. Imaging 2018, 34, 1127–1133. [Google Scholar] [CrossRef] [PubMed] [Green Version]
- Queirós, S.; Barbosa, D.; Engvall, J.; Ebbers, T.; Nagel, E.; Sarvari, S.I.; Claus, P.; Fonseca, J.C.; Vilaça, J.L.; D’Hooge, J. Multi-centre validation of an automatic algorithm for fast 4D myocardial segmentation in cine CMR datasets. Eur. Heart J. Cardiovasc. Imaging 2016, 17, 1118–1127. [Google Scholar] [CrossRef] [Green Version]
- Bhuva, A.N.; Bai, W.; Lau, C.; Davies, R.H.; Ye, Y.; Bulluck, H.; McAlindon, E.; Culotta, V.; Swoboda, P.P.; Captur, G.; et al. A Multicenter, Scan-Rescan, Human and Machine Learning CMR Study to Test Generalizability and Precision in Imaging Biomarker Analysis. Circ. Cardiovasc. Imaging 2019, 12, e009214. [Google Scholar] [CrossRef] [Green Version]
- Zange, L.; Muehlberg, F.; Blaszczyk, E.; Schwenke, S.; Traber, J.; Funk, S.; Schulz-Menger, J. Quantification in cardiovascular magnetic resonance: Agreement of software from three different vendors on assessment of left ventricular function, 2D flow and parametric mapping. J. Cardiovasc. Magn. Reson. 2019, 21, 12. [Google Scholar] [CrossRef] [PubMed] [Green Version]


Publisher’s Note: MDPI stays neutral with regard to jurisdictional claims in published maps and institutional affiliations. |
© 2021 by the authors. Licensee MDPI, Basel, Switzerland. This article is an open access article distributed under the terms and conditions of the Creative Commons Attribution (CC BY) license (https://creativecommons.org/licenses/by/4.0/).
Share and Cite
Snel, G.J.H.; Poort, S.; Velthuis, B.K.; van Deursen, V.M.; Nguyen, C.T.; Sosnovik, D.; Dierckx, R.A.J.O.; Slart, R.H.J.A.; Borra, R.J.H.; Prakken, N.H.J. Balancing Speed and Accuracy in Cardiac Magnetic Resonance Function Post-Processing: Comparing 2 Levels of Automation in 3 Vendors to Manual Assessment. Diagnostics 2021, 11, 1758. https://0-doi-org.brum.beds.ac.uk/10.3390/diagnostics11101758
Snel GJH, Poort S, Velthuis BK, van Deursen VM, Nguyen CT, Sosnovik D, Dierckx RAJO, Slart RHJA, Borra RJH, Prakken NHJ. Balancing Speed and Accuracy in Cardiac Magnetic Resonance Function Post-Processing: Comparing 2 Levels of Automation in 3 Vendors to Manual Assessment. Diagnostics. 2021; 11(10):1758. https://0-doi-org.brum.beds.ac.uk/10.3390/diagnostics11101758
Chicago/Turabian StyleSnel, Gert J.H., Sharon Poort, Birgitta K. Velthuis, Vincent M. van Deursen, Christopher T. Nguyen, David Sosnovik, Rudi A.J.O. Dierckx, Riemer H.J.A. Slart, Ronald J.H. Borra, and Niek H.J. Prakken. 2021. "Balancing Speed and Accuracy in Cardiac Magnetic Resonance Function Post-Processing: Comparing 2 Levels of Automation in 3 Vendors to Manual Assessment" Diagnostics 11, no. 10: 1758. https://0-doi-org.brum.beds.ac.uk/10.3390/diagnostics11101758