
A Novel Algorithm Using Cell Population Data (VCS Parameters) as a Screening Discriminant between Alpha and Beta Thalassemia Traits

 , and
, and
Abstract
:1. Introduction
2. Materials and Methods
3. Results
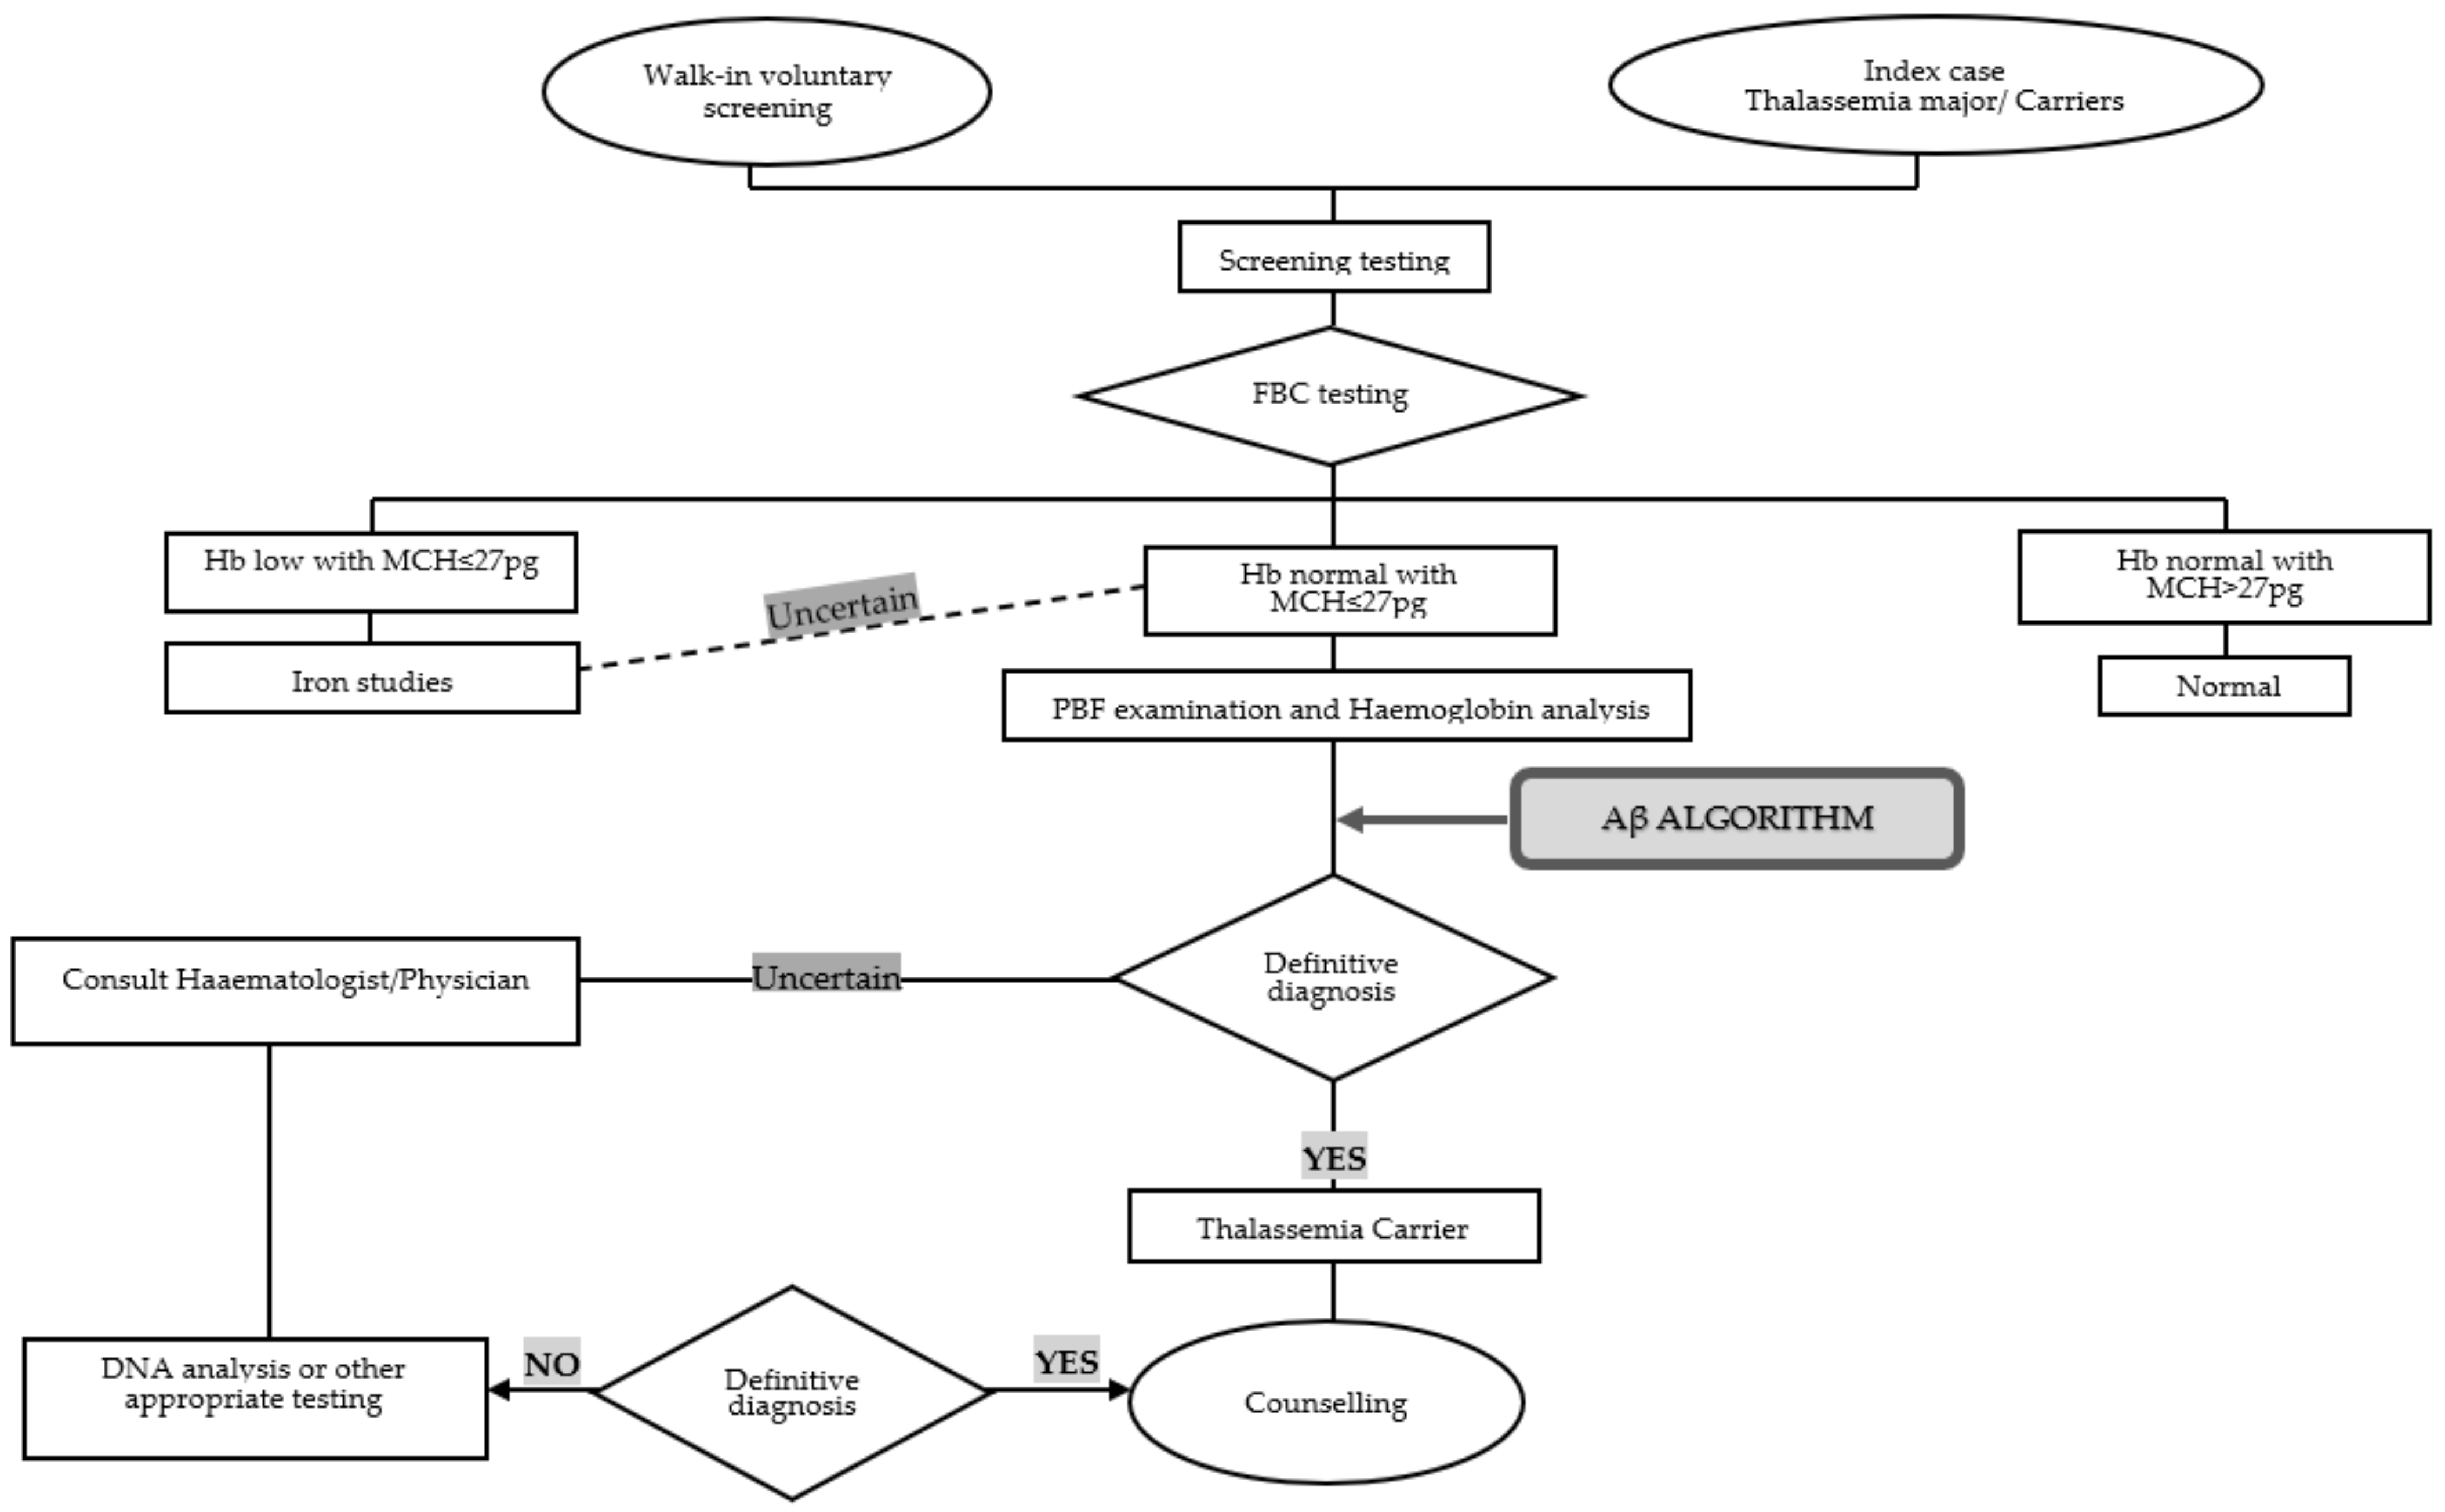
3.1. Development of (αβ Algorithm) Using a Primary Retrospective Cohort
3.2. αβ-Algorithm Validation Studies
3.2.1. In-House Validation
3.2.2. Interlaboratory Validation Cohort
4. Discussion
5. Conclusions
Supplementary Materials
Author Contributions
Funding
Institutional Review Board Statement
Informed Consent Statement
Data Availability Statement
Acknowledgments
Conflicts of Interest
References
- Joint WHO-TIF Committee. Management of haemoglobin disorders. In Proceedings of the Joint WHO-TIF Meet, Nicosia, Cyprus, 16–18 November 2008. [Google Scholar]
- Williams, T.N.; Weatherall, D.J. World Distribution, Population Genetics, and Health Burden of the Hemoglobinopathies. Cold Spring Harb. Perspect. Med. 2012, 2, a011692. [Google Scholar] [CrossRef] [PubMed] [Green Version]
- Azma, R.Z.; Ainoon, O.; Hafiza, A.; Azlin, I.; Noor Farisah, A.R.; Nor Hidayati, S.; Noor Hamidah, H. Molecular characteristic of alpha thalassaemia among patients diagnosed in UKM Medical Centre. Malays. J. Pathol. 2014, 36, 27–32. [Google Scholar] [PubMed]
- Ibrahim, H.; Hassan, A.; George, E.; Sim, G.A.; Othman, I.S.; Mudla, I.; Hassan, H. Clinical Practice Guidelines: Management of Transfusion Dependent Thalassaemia. Available online: http://www.moh.gov.my/penerbitan/CPG2017/8318.pdf (accessed on 10 September 2021).
- Wahab, I.A.; Naznin, M.; Nora, M.Z.; Suzanah, A.R.; Zulaiho, M.; Faszrul, A.R.A.; Kamaruzaman, W.S. Thalassaemia: A study on the perception of patients and family members. Med. J. Malays. 2011, 66, 326–334. [Google Scholar]
- Higgs, D.R. The molecular basis of α-thalassemia. Cold Spring Harb. Perspect. Med. 2013, 3, a011718. [Google Scholar] [CrossRef] [PubMed]
- Rosnah, B.; Rosline, H.; Zaidah, A.W.; Noor Haslina, M.N.; Marini, R.; Shafini, M.Y.; Nurul Ain, F.A. Detection of Common Deletional Alpha-Thalassemia Spectrum by Molecular Technique in Kelantan, Northeastern Malaysia. ISRN Hematol. 2012, 2012, 462969. [Google Scholar] [CrossRef] [PubMed] [Green Version]
- Galanello, R.; Origa, R. Beta-thalassemia. Orphanet J. Rare Dis. 2010, 5, 11. [Google Scholar] [CrossRef] [PubMed] [Green Version]
- George, E.; Ann, T.J.A.M. Genotype-phenotype diversity of beta-thalassemia in Malaysia: Treatment options and emerging therapies. Med. J. Malaysia 2010, 65, 256–260. [Google Scholar] [PubMed]
- Sabath, D.E. Molecular Diagnosis of Thalassemias and Hemoglobinopathies. Am. J. Clin. Pathol. 2017, 148, 6–15. [Google Scholar] [CrossRef]
- Pornprasert, S.; Saoboontan, S.; Wiengkum, T. Hemoglobin Constant Spring (Hb CS) Missed by HPLC in an Hb E Trait Pregnancy Resulting in Hb H-CS Disease in a Thai Girl: Utility of Capillary Electrophoresis. Indian J. Hematol. Blood Transfus. 2016, 32, 254–257. [Google Scholar] [CrossRef] [PubMed] [Green Version]
- Muncie, H.L.; Campbell, J. Alpha and beta thalassemia. Am. Fam. Physician 2009, 80, 339–344. [Google Scholar]
- Lopez, R.S.; Solenthaler, M.J.C. Unicel DxH Series Case Book; Beckman Coulter, Inc.: Brea, CA, USA, 2016. [Google Scholar]
- Ambayya, A.; Sasmita, A.O.; Zhang, Q.-Y.; Ting, A.S.; Meng, C.K.; Sathar, J.; Yegappan, S. Reference interval establishment of full blood count extended research parameters in the multi-ethnic population of Malaysia. Med. J. Malays. 2019, 74, 395. [Google Scholar]
- Lowry, L. VassarStats: Website for Statistical Computation. Available online: http://vassarstats.net/clin1.html (accessed on 16 September 2021).
- Ng, E.H.Y.; Leung, J.H.W.; Lau, Y.S.; Ma, E.S.K. Evaluation of the new red cell parameters on Beckman Coulter DxH800 in distinguishing iron deficiency anaemia from thalassaemia trait. Int. J. Lab. Hematol. 2015, 37, 199–207. [Google Scholar] [CrossRef]
- Hafeez Kandhro, A.; Shoombuatong, W.; Prachayasittikul, V.; Nuchnoi, P. New Bioinformatics-Based Discrimination Formulas for Differentiation of Thalassemia Traits From Iron Deficiency Anemia. Lab. Med. 2017, 48, 230–237. [Google Scholar] [CrossRef] [PubMed] [Green Version]
- Ambayya, A.; Su, A.T.; Osman, N.H.; Nik-Samsudin, N.R.; Khalid, K.; Chang, K.M.; Sathar, J.; Rajasuriar, J.S.; Yegappan, S. Haematological Reference Intervals in a Multiethnic Population. PLoS ONE 2014, 9, e91968. [Google Scholar] [CrossRef]
- Mentzer, W. Differentiation of iron deficiency from thalassæmia trait. Lancet 1973, 301, 882. [Google Scholar] [CrossRef]
- England, J.M.; Fraser, P. Differentiation of iron deficiency from thalassæmia trait by routine blood-count. Lancet 1973, 301, 449–452. [Google Scholar] [CrossRef]
- Shine, I.; Lal, S. A strategy to detect β-thalassæmia minor. Lancet 1977, 309, 692–694. [Google Scholar] [CrossRef]
- Ehsani, M.A.; Shahgholi, E.; Rahiminejad, M.S.; Seighali, F.; Rashidi, A. A new index for discrimination between iron deficiency anemia and beta-thalassemia minor: Results in 284 patients. Pak. J. Biol. Sci. 2009, 12, 473–475. [Google Scholar] [CrossRef] [PubMed] [Green Version]
- Srivastava, P.C.; Bevington, J.M. Iron deficiency and-or thalassaemia trait. Lancet 1973, 1, 832. [Google Scholar] [CrossRef]
- Sirdah, M.; Tarazi, I.; Al Najjar, E.; Al Haddad, R. Evaluation of the diagnostic reliability of different RBC indices and formulas in the differentiation of the beta-thalassaemia minor from iron deficiency in Palestinian population. Int. J. Lab. Hematol. 2008, 30, 324–330. [Google Scholar] [CrossRef]
- Green, R.; King, R. A new red cell discriminant incorporating volume dispersion for differentiating iron deficiency anemia from thalassemia minor. Blood Cells 1989, 15, 481–491. [Google Scholar]
- Ricerca, B.M.; Storti, S.; D’Onofrio, G.; Mancini, S.; Vittori, M.; Campisi, S.; Mango, G.; Bizzi, B. Differentiation of iron deficiency from thalassaemia trait: A new approach. Haematologica 1987, 72, 409–413. [Google Scholar] [PubMed]
- Laengsri, V.; Shoombuatong, W.; Adirojananon, W.; Nantasenamart, C.; Prachayasittikul, V.; Nuchnoi, P. ThalPred: A web-based prediction tool for discriminating thalassemia trait and iron deficiency anemia. BMC Med. Inform. Decis. Mak. 2019, 19, 1–14. [Google Scholar] [CrossRef] [Green Version]
- Roth, I.L.; Lachover, B.; Koren, G.; Levin, C.; Zalman, L.; Koren, A. Detection of β-thalassemia carriers by red cell parameters obtained from automatic counters using mathematical formulas. Mediterr. J. Hematol. Infect. Dis. 2018, 10, e2018008. [Google Scholar] [CrossRef] [PubMed] [Green Version]
- Mehdi, S.; Al Dahmash, B. A comparative study of hematological parameters of α and β thalassemias in a high prevalence zone: Saudi Arabia. Indian J. Hum. Genet. 2011, 17, 207. [Google Scholar] [CrossRef] [PubMed] [Green Version]
- Koh, D.X.R.; Raja Sabudin, R.Z.A.; Mohd Yusoff, M.; Hussin, N.H.; Ahmad, R.; Othman, A.; Ismail, E. Molecular Characterisation of α- and β-thalassaemia among Indigenous Senoi Orang Asli Communities in Peninsular Malaysia. Ann. Hum. Genet. 2017, 81, 205–212. [Google Scholar] [CrossRef]
- Azma, R.; Jalil, N.; Ma, M.-H.; Skk, J.; Sa, F.-H.; Nm, N.-N.; Am, F.-A.; Alauddin, H.; Ithnin, A.; Othman, A. A Comparative Study of Red Blood Cell Parameters of Alpha and Beta Thalassaemia Patients Diagnosed in a University Hospital in Cheras, Malaysia. ARC J. Hematol. 2018, 3, 23–27. [Google Scholar]
- Jung, Y.-J.; Kim, J.-H.; Park, Y.-J.; Kahng, J.; Lee, H.; Lee, K.-Y.; Kim, M.Y.; Han, K.; Lee, W. Evaluation of cell population data on the UniCel DxH 800 Coulter Cellular Analysis system as a screening for viral infection in children. Int. J. Lab. Hematol. 2012, 34, 283–289. [Google Scholar] [CrossRef] [PubMed]
- Jolobe, O.M.P. More on identification of iron deficiency when it coexists with chronic inflammation. J. Clin. Pathol. 2011, 64, 833. [Google Scholar] [CrossRef]
- Ristaldi, M.S.; Murru, S.; Loudianos, G.; Casula, L.; Porcu, S.; Pigheddu, D.; Fanni, B.; Sciarratta, G.V.; Agosti, S.; Parodi, M.I.; et al. The C–T substitution in the distal CACCC box of the β-globin gene promoter is a common cause of silent β thalassaemia in the Italian population. Br. J. Haematol. 1990, 74, 480–486. [Google Scholar] [CrossRef] [PubMed]
- Cao, A.; Galanello, R. Beta-thalassemia. Genet. Med. 2010, 12, 61–76. [Google Scholar] [CrossRef] [PubMed] [Green Version]
- Briggs, C.; Culp, N.; Davis, B.; D’Onofrio, G.; Zini, G.; Machin, S.J. ICSH guidelines for the evaluation of blood cell analysers including those used for differential leucocyte and reticulocyte counting. Int. J. Lab. Hematol. 2014, 36, 613–627. [Google Scholar] [CrossRef]
- Calam, R.R.; Bessman, J.D.; Smith, S.S.; Szamosi, D.I.; Warunek, D.J.; Wiseman, J.D. Procedures for the Handling and Processing of Blood Specimens. In Approved Guideline, 3rd ed.; NCCLS: Wayne, PA, USA, 2004; Volume 24, ISBN 1562385550. [Google Scholar]
- Chiruka, S.; Darbyshire, P. Management of thalassaemia. Paediatr. Child Health 2011, 21, 353–356. [Google Scholar] [CrossRef]
- Mohd Pauzy, L.H.; Esa, E.; Mahani Mokhri, N.; Yusoff, Y.M.; Jamaludin, N.A.; Zakaria, Z. Thalassemia Distribution Based on Screening Programs in the Population of the East Malaysian State of Sabah. J. Blood Disord. Transfus. 2018, 9, 1. [Google Scholar] [CrossRef]


| Groups | Statistics | HB (g/dL) | RBC (10 /mcL) | HCT (%) | MCV (fL) | MCH (pg) | MCHC (g/dL) | RDW (%) | TSfR (mg/L) | Ferritin (mcg/L) | HBA (%) | HBA2 (%) | HBF (%) |
|---|---|---|---|---|---|---|---|---|---|---|---|---|---|
| Alpha trait | N | 155 | 155 | 155 | 155 | 155 | 155 | 155 | 155 | 155 | 155 | 155 | 155 |
| Mean | 12.56 | 5.15 | 39.03 | 76.27 | 24.57 | 32.19 | 15.43 | 4.14 | 117.03 | 97.50 | 2.43 | 0.58 | |
| SD | 1.22 | 5.08 | 3.46 | 5.66 | 2.18 | 0.86 | 1.45 | 1.39 | 138.70 | 0.36 | 0.25 | 0.53 | |
| Med | 12.45 | 0.59 | 38.60 | 77.60 | 25.10 | 32.10 | 15.30 | 3.90 | 72.00 | 97.60 | 2.40 | 0.35 | |
| Min | 10.10 | 3.57 | 32.20 | 60.10 | 19.20 | 29.90 | 12.90 | 1.50 | 3.00 | 95.50 | 1.90 | 0.20 | |
| Max | 16.30 | 6.76 | 49.60 | 98.50 | 32.80 | 35.30 | 21.40 | 9.90 | 766.00 | 98.10 | 3.50 | 2.20 | |
| Range | 6.20 | 3.19 | 17.40 | 38.40 | 13.60 | 5.40 | 8.50 | 8.40 | 763.00 | 2.60 | 1.60 | 2.00 | |
| Beta trait | N | 48 | 48 | 48 | 48 | 48 | 48 | 48 | nd | nd | 48 | 48 | 48 |
| Mean | 11.64 | 5.43 | 36.69 | 68.00 | 21.57 | 31.73 | 17.31 | - | - | 93.83 | 5.23 | 1.13 | |
| SD | 0.87 | 0.55 | 2.60 | 6.24 | 2.17 | 0.73 | 2.01 | - | - | 0.96 | 0.49 | 0.76 | |
| Med | 11.80 | 5.39 | 36.80 | 65.40 | 20.70 | 32.00 | 16.55 | - | - | 93.70 | 5.40 | 1.00 | |
| Min | 10.20 | 4.51 | 32.00 | 61.50 | 18.30 | 29.60 | 14.80 | - | - | 91.70 | 4.40 | 0.30 | |
| Max | 13.20 | 6.45 | 40.90 | 82.10 | 26.30 | 32.90 | 24.30 | - | - | 95.40 | 6.00 | 3.50 | |
| Range | 3.00 | 1.94 | 8.90 | 20.60 | 8.00 | 3.30 | 9.50 | - | - | 3.70 | 1.60 | 3.20 | |
| Control group (healthy male) | N | 477 | 477 | 477 | 1394 a | 1394 a | 1394 a | 1394 a | 1394 a | 477 | 1394 a | 1394 a | 1394 a |
| Mean | 14.91 | 4.83 | 43.84 | 89.61 | 30.12 | 33.62 | 13.51 | 3.19 | 265.56 | 97.34 | 2.61 | 0.58 | |
| SD | 1.06 | 0.41 | 2.73 | 4.00 | 1.58 | 0.87 | 0.72 | 0.90 | 230.02 | 0.32 | 0.24 | 0.42 | |
| Med | 14.90 | 4.91 | 43.60 | 89.50 | 30.10 | 33.60 | 13.40 | 3.10 | 217 | 97.40 | 2.60 | 0.40 | |
| Min | 12.50 | 3.83 | 37.40 | 80.30 | 26.9 | 30.10 | 11.70 | 0.90 | 37 | 94.90 | 1.10 | 0.20 | |
| Max | 16.90 | 5.61 | 48.20 | 107.80 | 43.50 | 48.20 | 19.00 | 8.80 | 1138 | 98.90 | 3.50 | 2.50 | |
| Range | 4.40 | 1.78 | 10.80 | 27.50 | 17.90 | 18.10 | 7.30 | 7.90 | 1101 | 4.00 | 2.40 | 2.30 | |
| Control group (healthy female) | N | 917 | 917 | 917 | 1394 a | 1394 a | 1394 a | 1394 a | 1394 a | 917 | 1394 a | 1394 a | 1394 a |
| Mean | 13.00 | 4.24 | 38.54 | 89.61 | 30.12 | 33.62 | 13.51 | 3.19 | 106.89 | 97.34 | 2.61 | 0.58 | |
| SD | 0.81 | 0.32 | 2.61 | 4.00 | 1.58 | 0.87 | 0.72 | 0.90 | 114.04 | 0.32 | 0.24 | 0.42 | |
| Med | 12.90 | 4.23 | 38.50 | 89.50 | 30.10 | 33.60 | 13.40 | 3.10 | 74 | 97.40 | 2.60 | 0.40 | |
| Min | 11.60 | 2.97 | 26.80 | 80.30 | 26.9 | 30.10 | 11.70 | 0.90 | 14 | 94.90 | 1.10 | 0.20 | |
| Max | 14.90 | 5.15 | 44.40 | 107.80 | 43.50 | 48.20 | 19.00 | 8.80 | 669 | 98.90 | 3.50 | 2.50 | |
| Range | 4.60 | 2.18 | 17.60 | 27.50 | 17.90 | 18.10 | 7.30 | 7.90 | 655 | 4.00 | 2.40 | 2.30 |
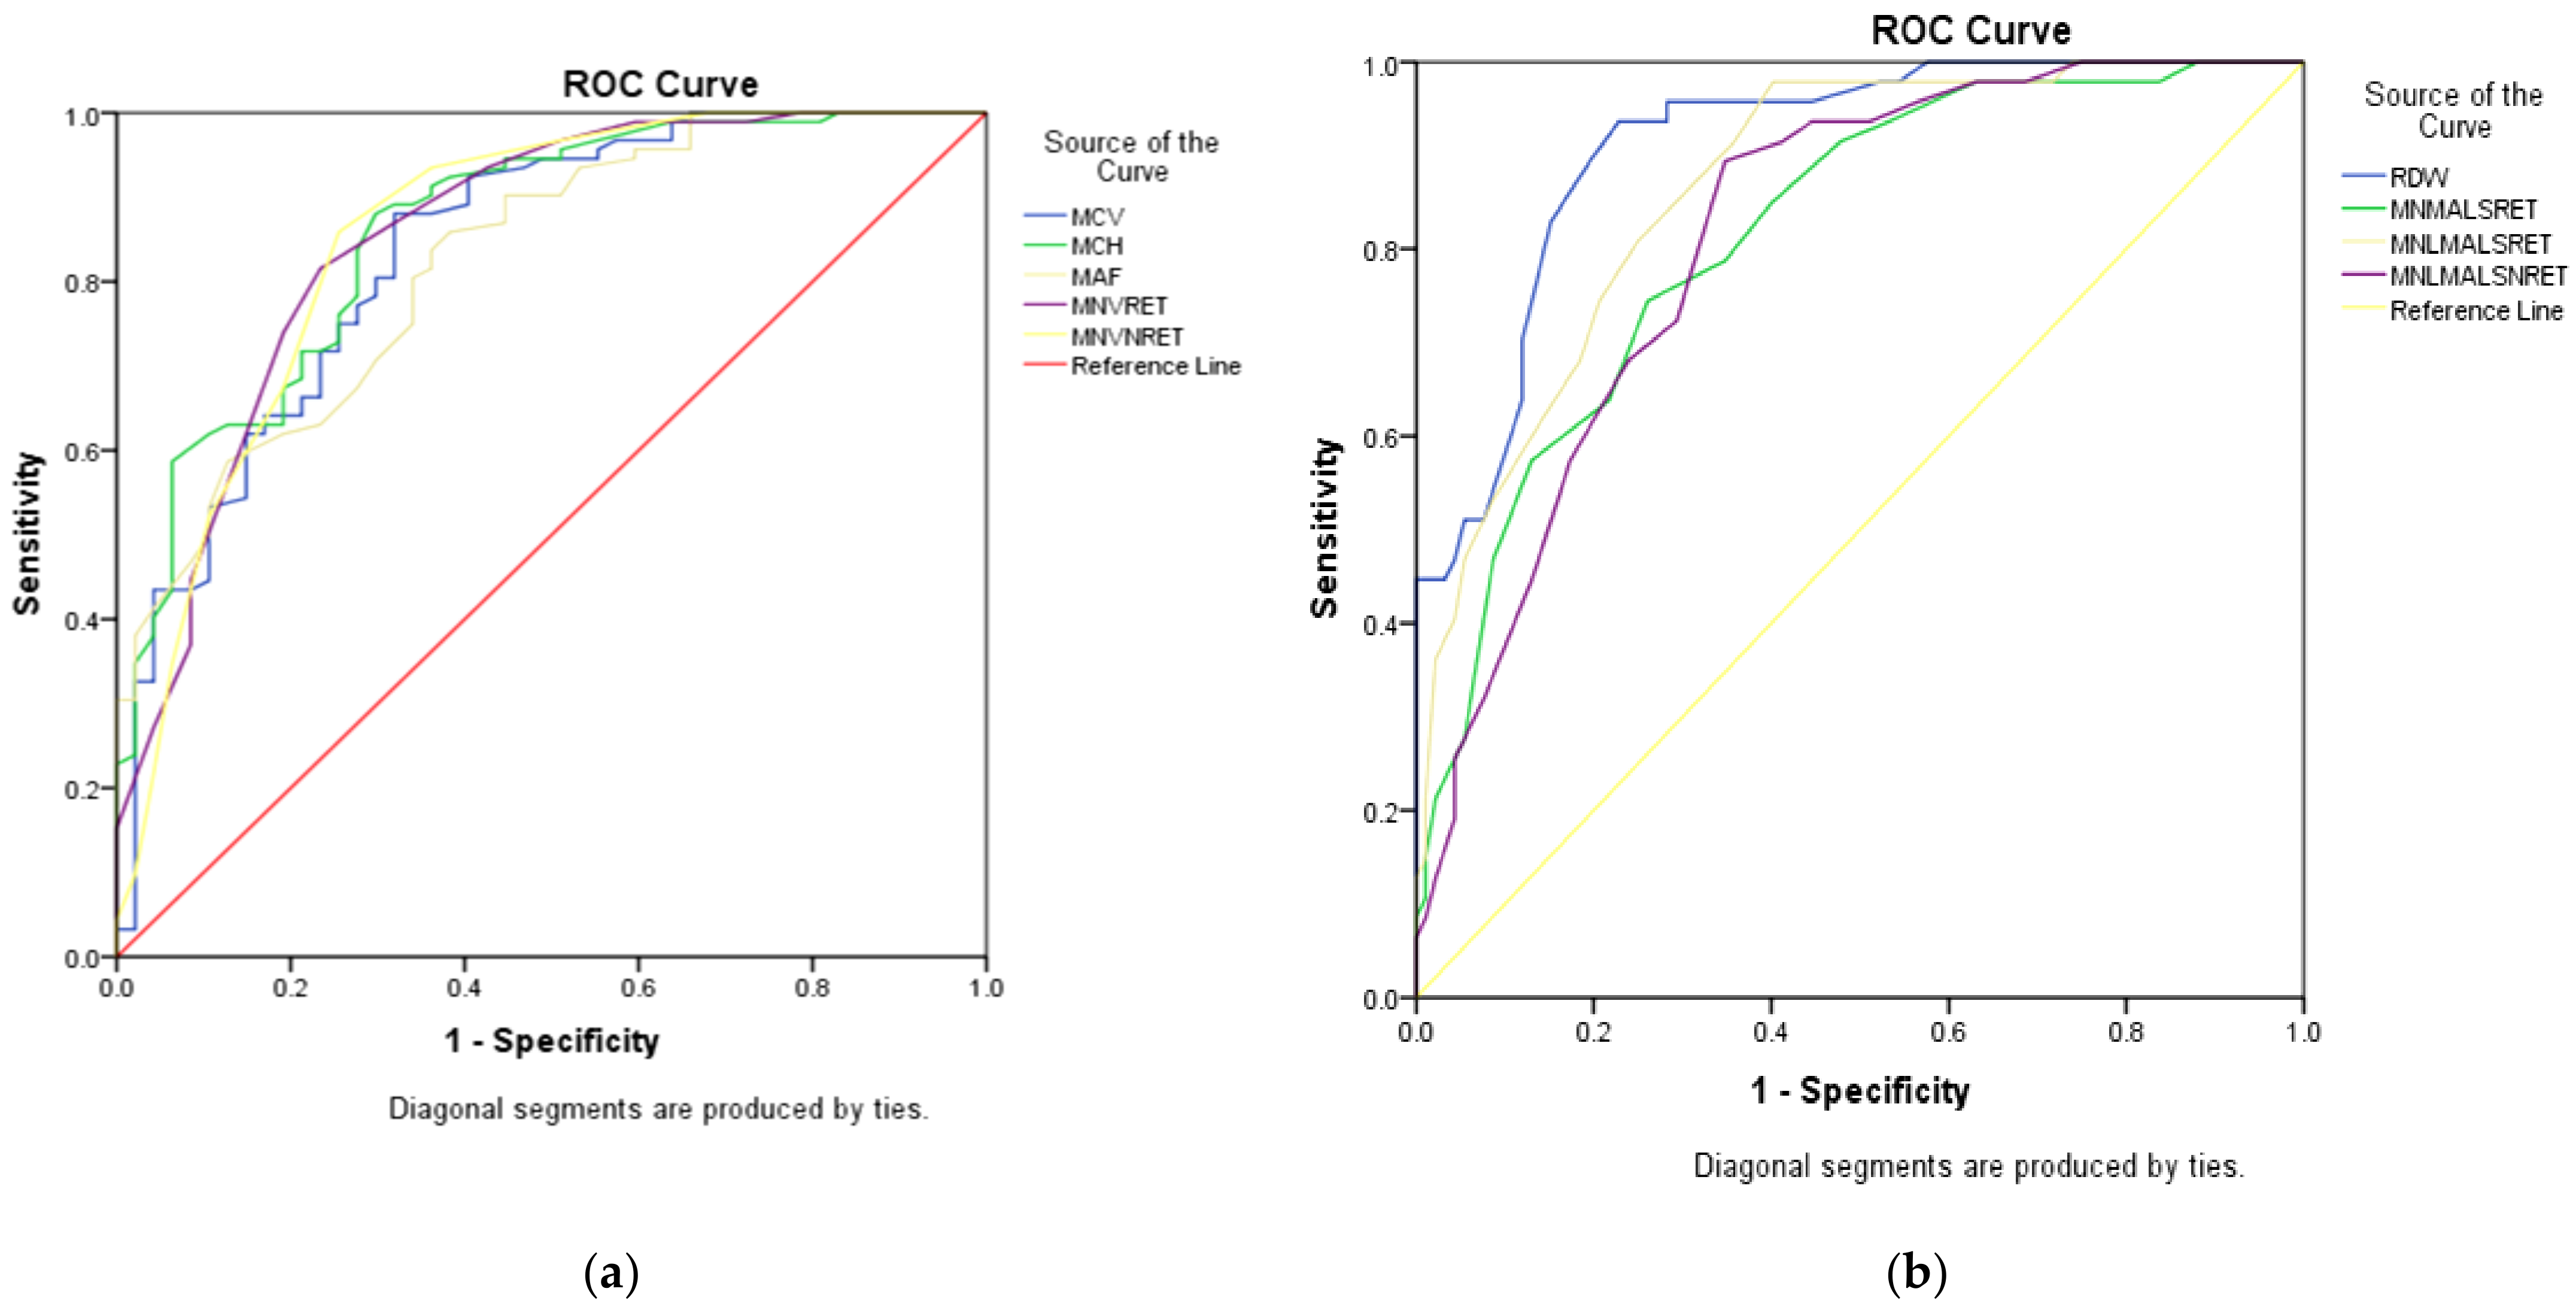
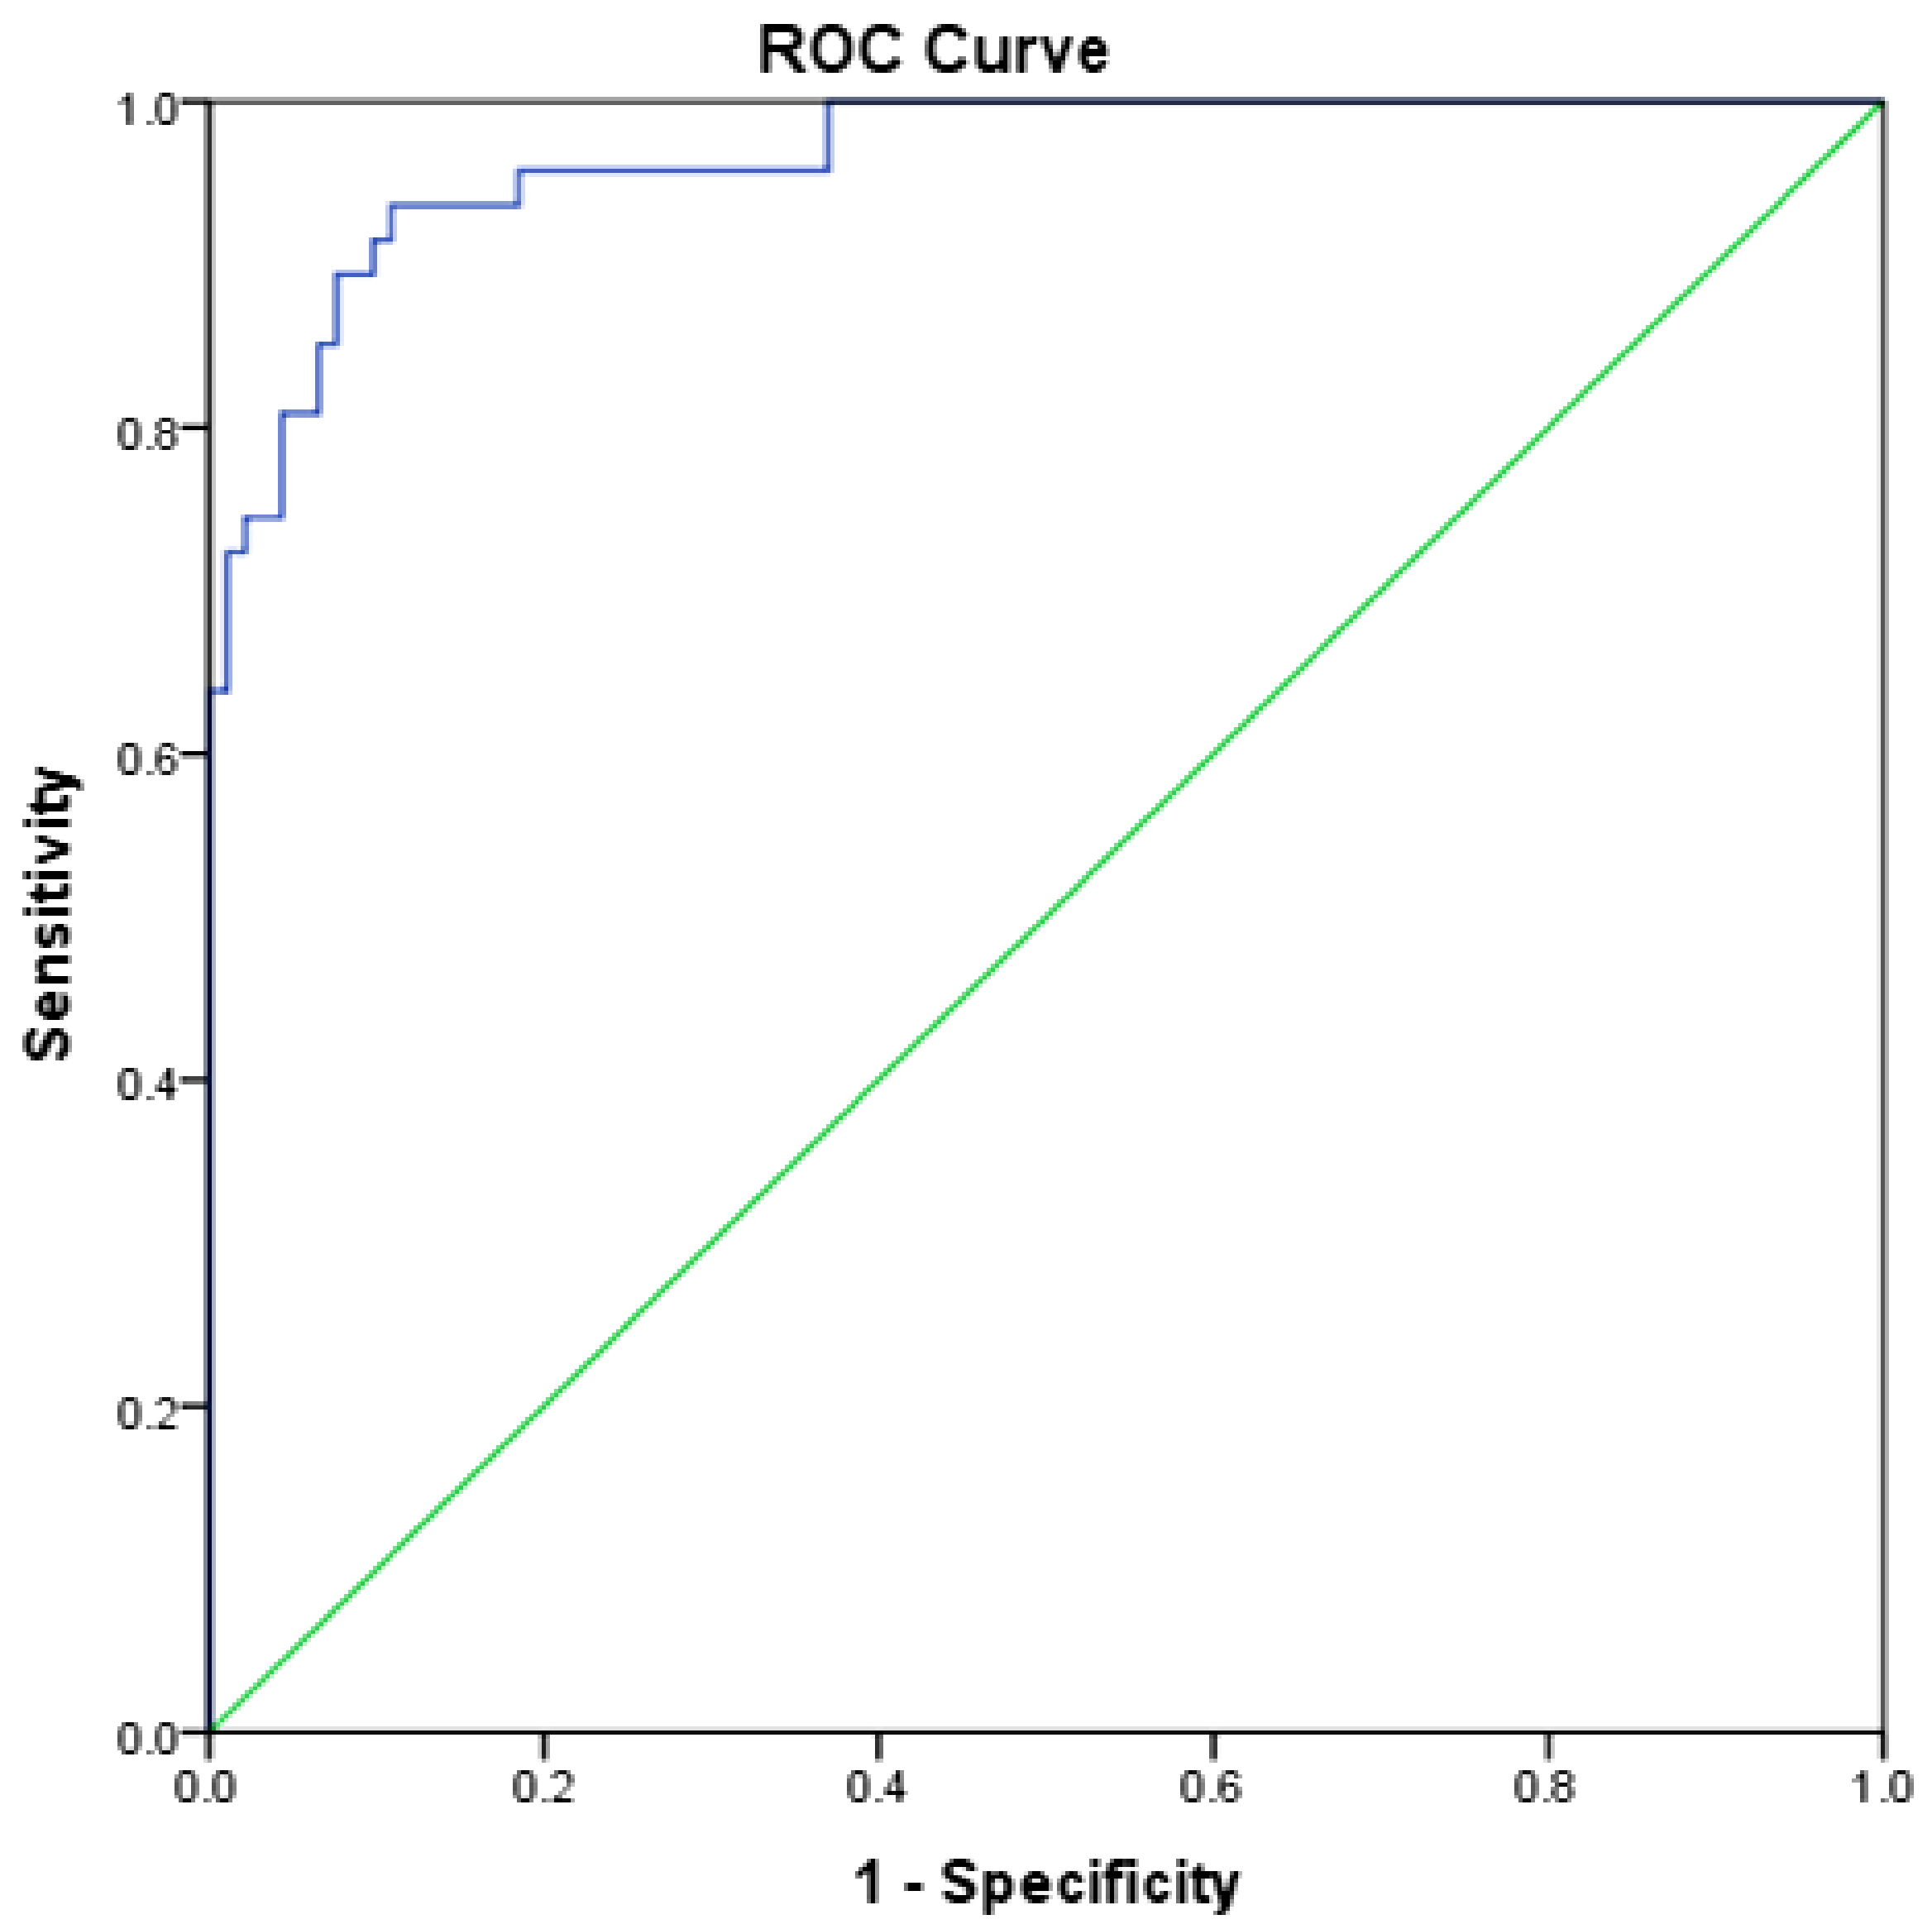
| Parameters | AUC | 95% CI | Cut-Off | Sens (%) | Spec (%) | |
|---|---|---|---|---|---|---|
| α-Thalassaemia | β-Thalassaemia | |||||
| αβ-algorithm | 0.966 | 0.939, 0.993 | <1742.50 | >1742.50 | 91.49 | 90.22 |
| RDW | 0.911 | 0.864, 0.958 | <15.85 | >15.85 | 82.98 | 84.78 |
| MN-LMALS-RET | 0.868 | 0.810, 0.927 | <109.50 | >109.50 | 80.85 | 75.00 |
| MCH | 0.861 | 0.796, 0.925 | >22.30 | <22.30 | 76.09 | 74.47 |
| MN-V-RET | 0.853 | 0.783, 0.923 | >47.50 | <47.50 | 81.52 | 76.59 |
| MN-V-NRET | 0.853 | 0.780, 0.926 | >35.50 | <35.50 | 85.87 | 74.47 |
| MCV | 0.836 | 0.764, 0.909 | >70.80 | <70.80 | 75 | 74.47 |
| MAF | 0.823 | 0.753, 0.894 | >8.95 | <8.95 | 70.65 | 70.21 |
| MN-MALS-RET | 0.816 | 0.744, 0.888 | <118.50 | >118.50 | 74.47 | 73.91 |
| MN-LMALS-NRET | 0.813 | 0.743, 0.883 | <43.50 | >43.50 | 72.34 | 70.65 |
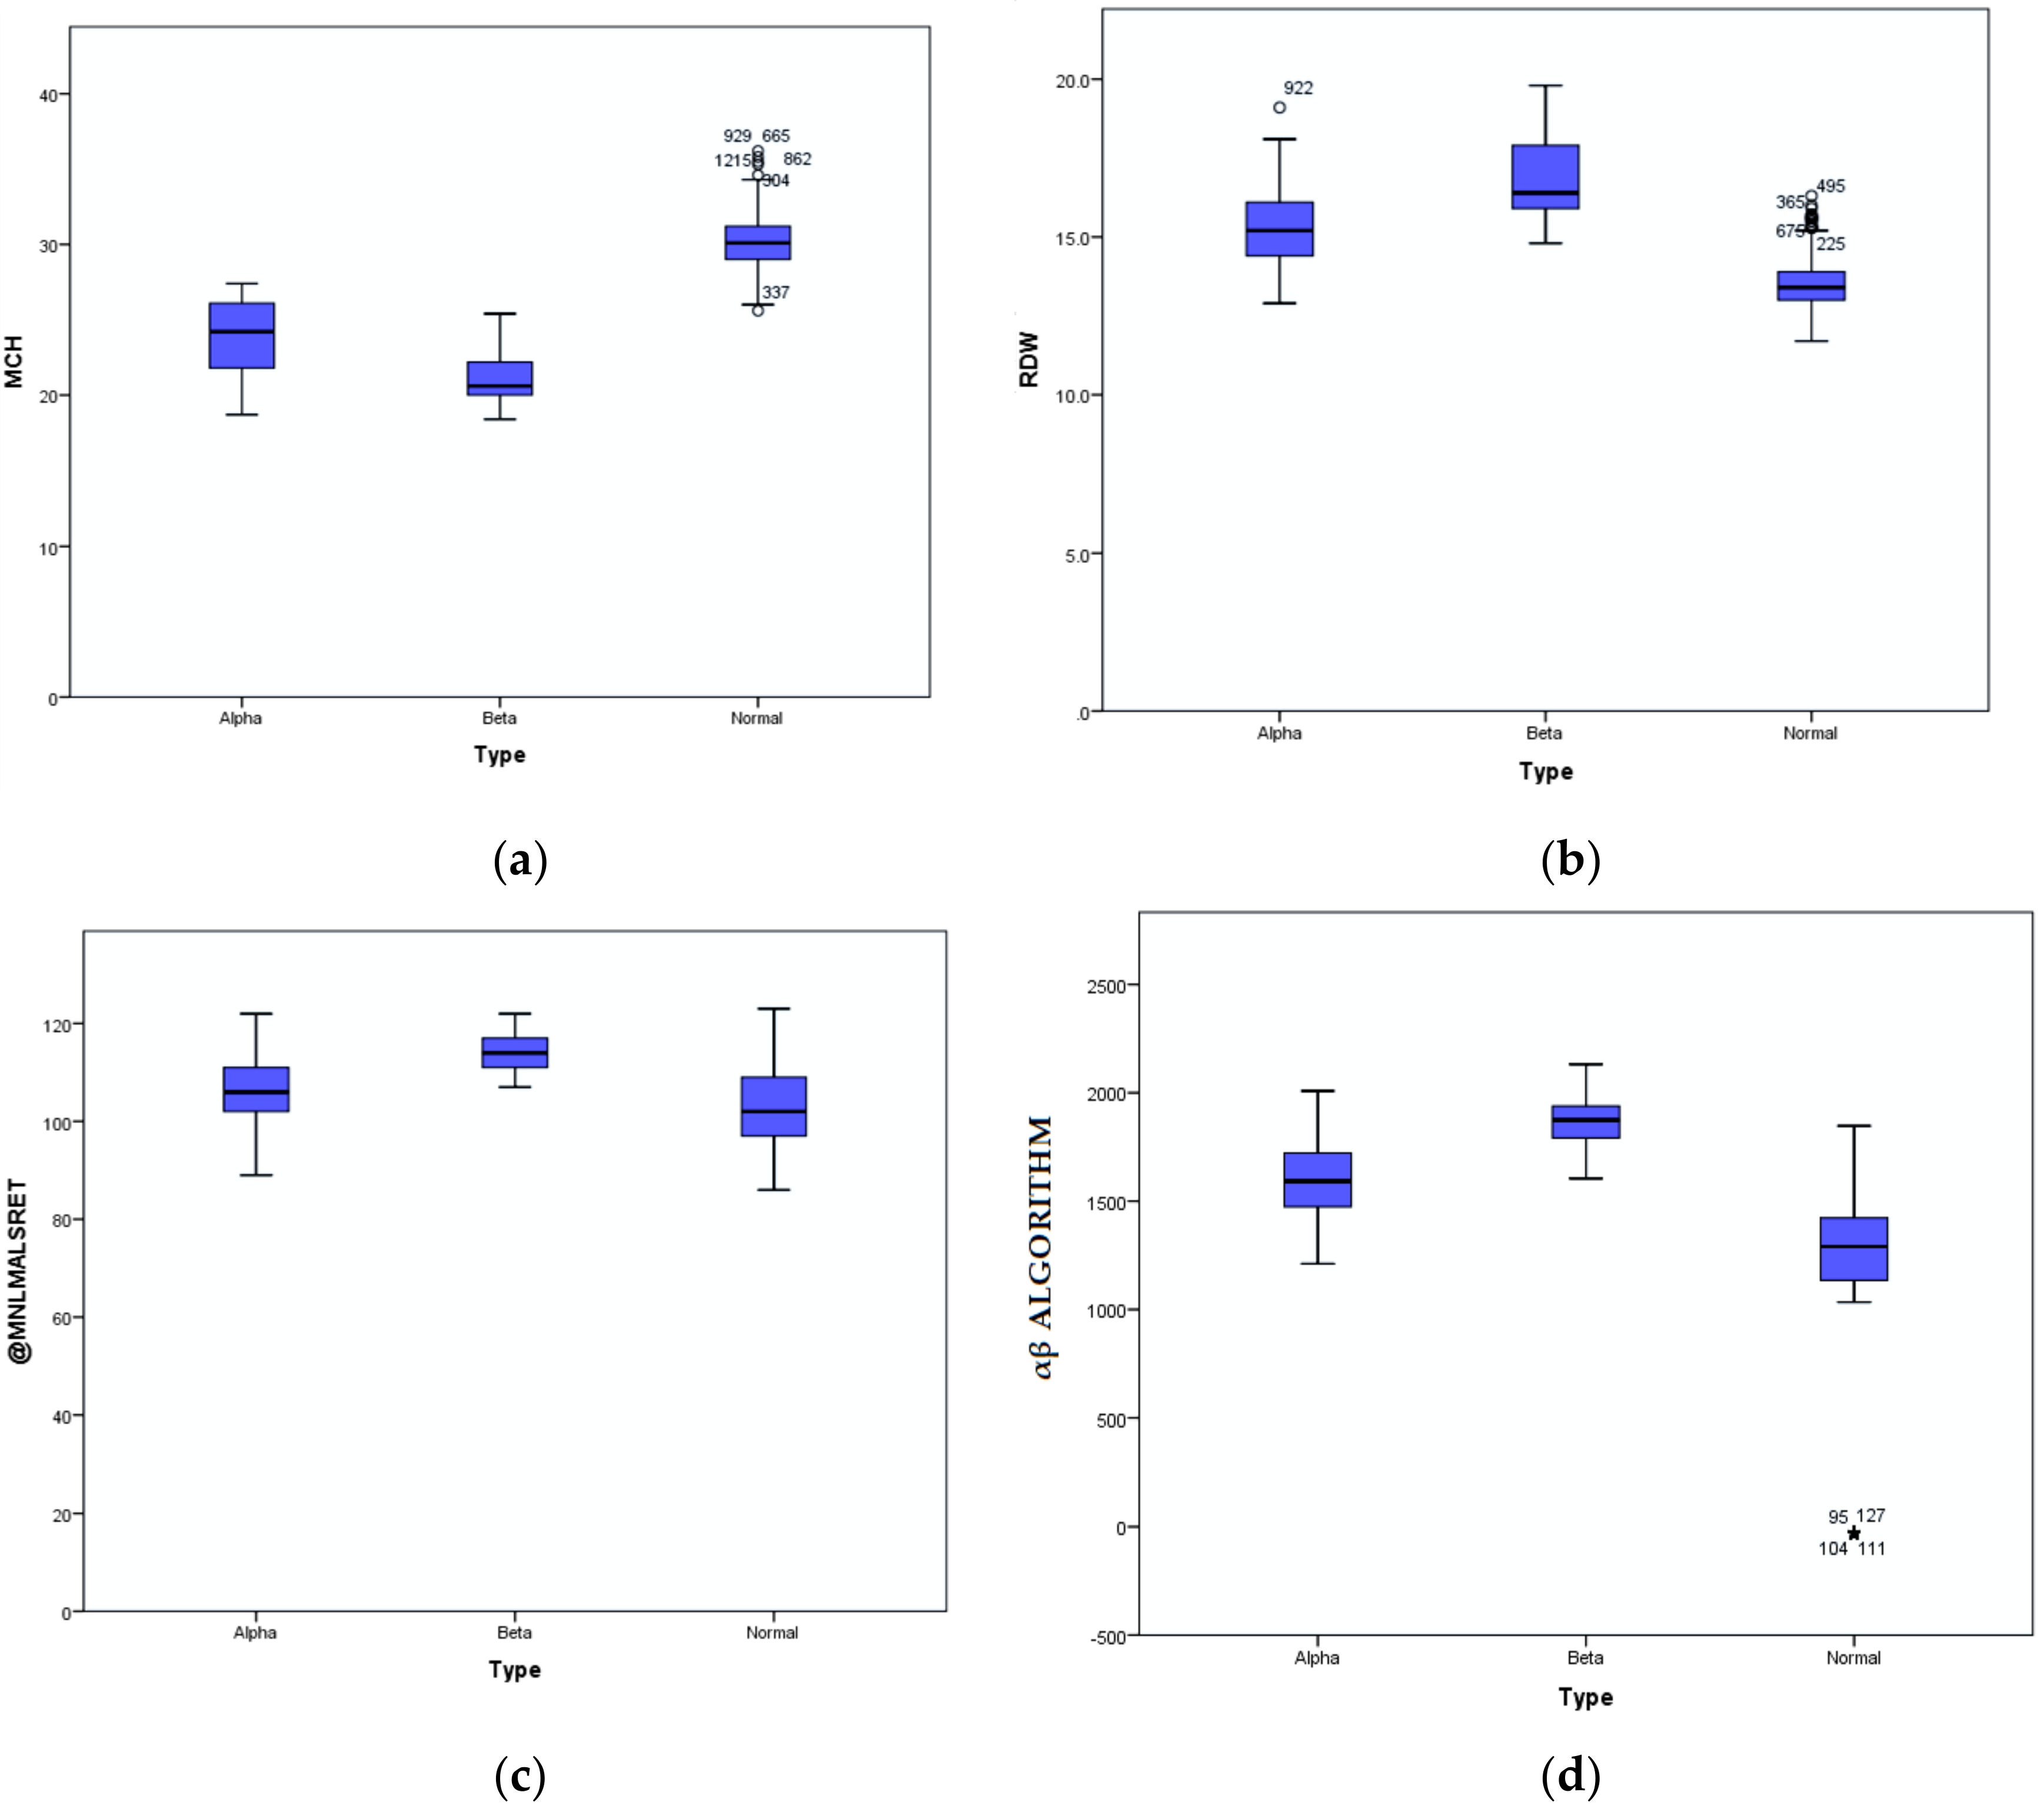
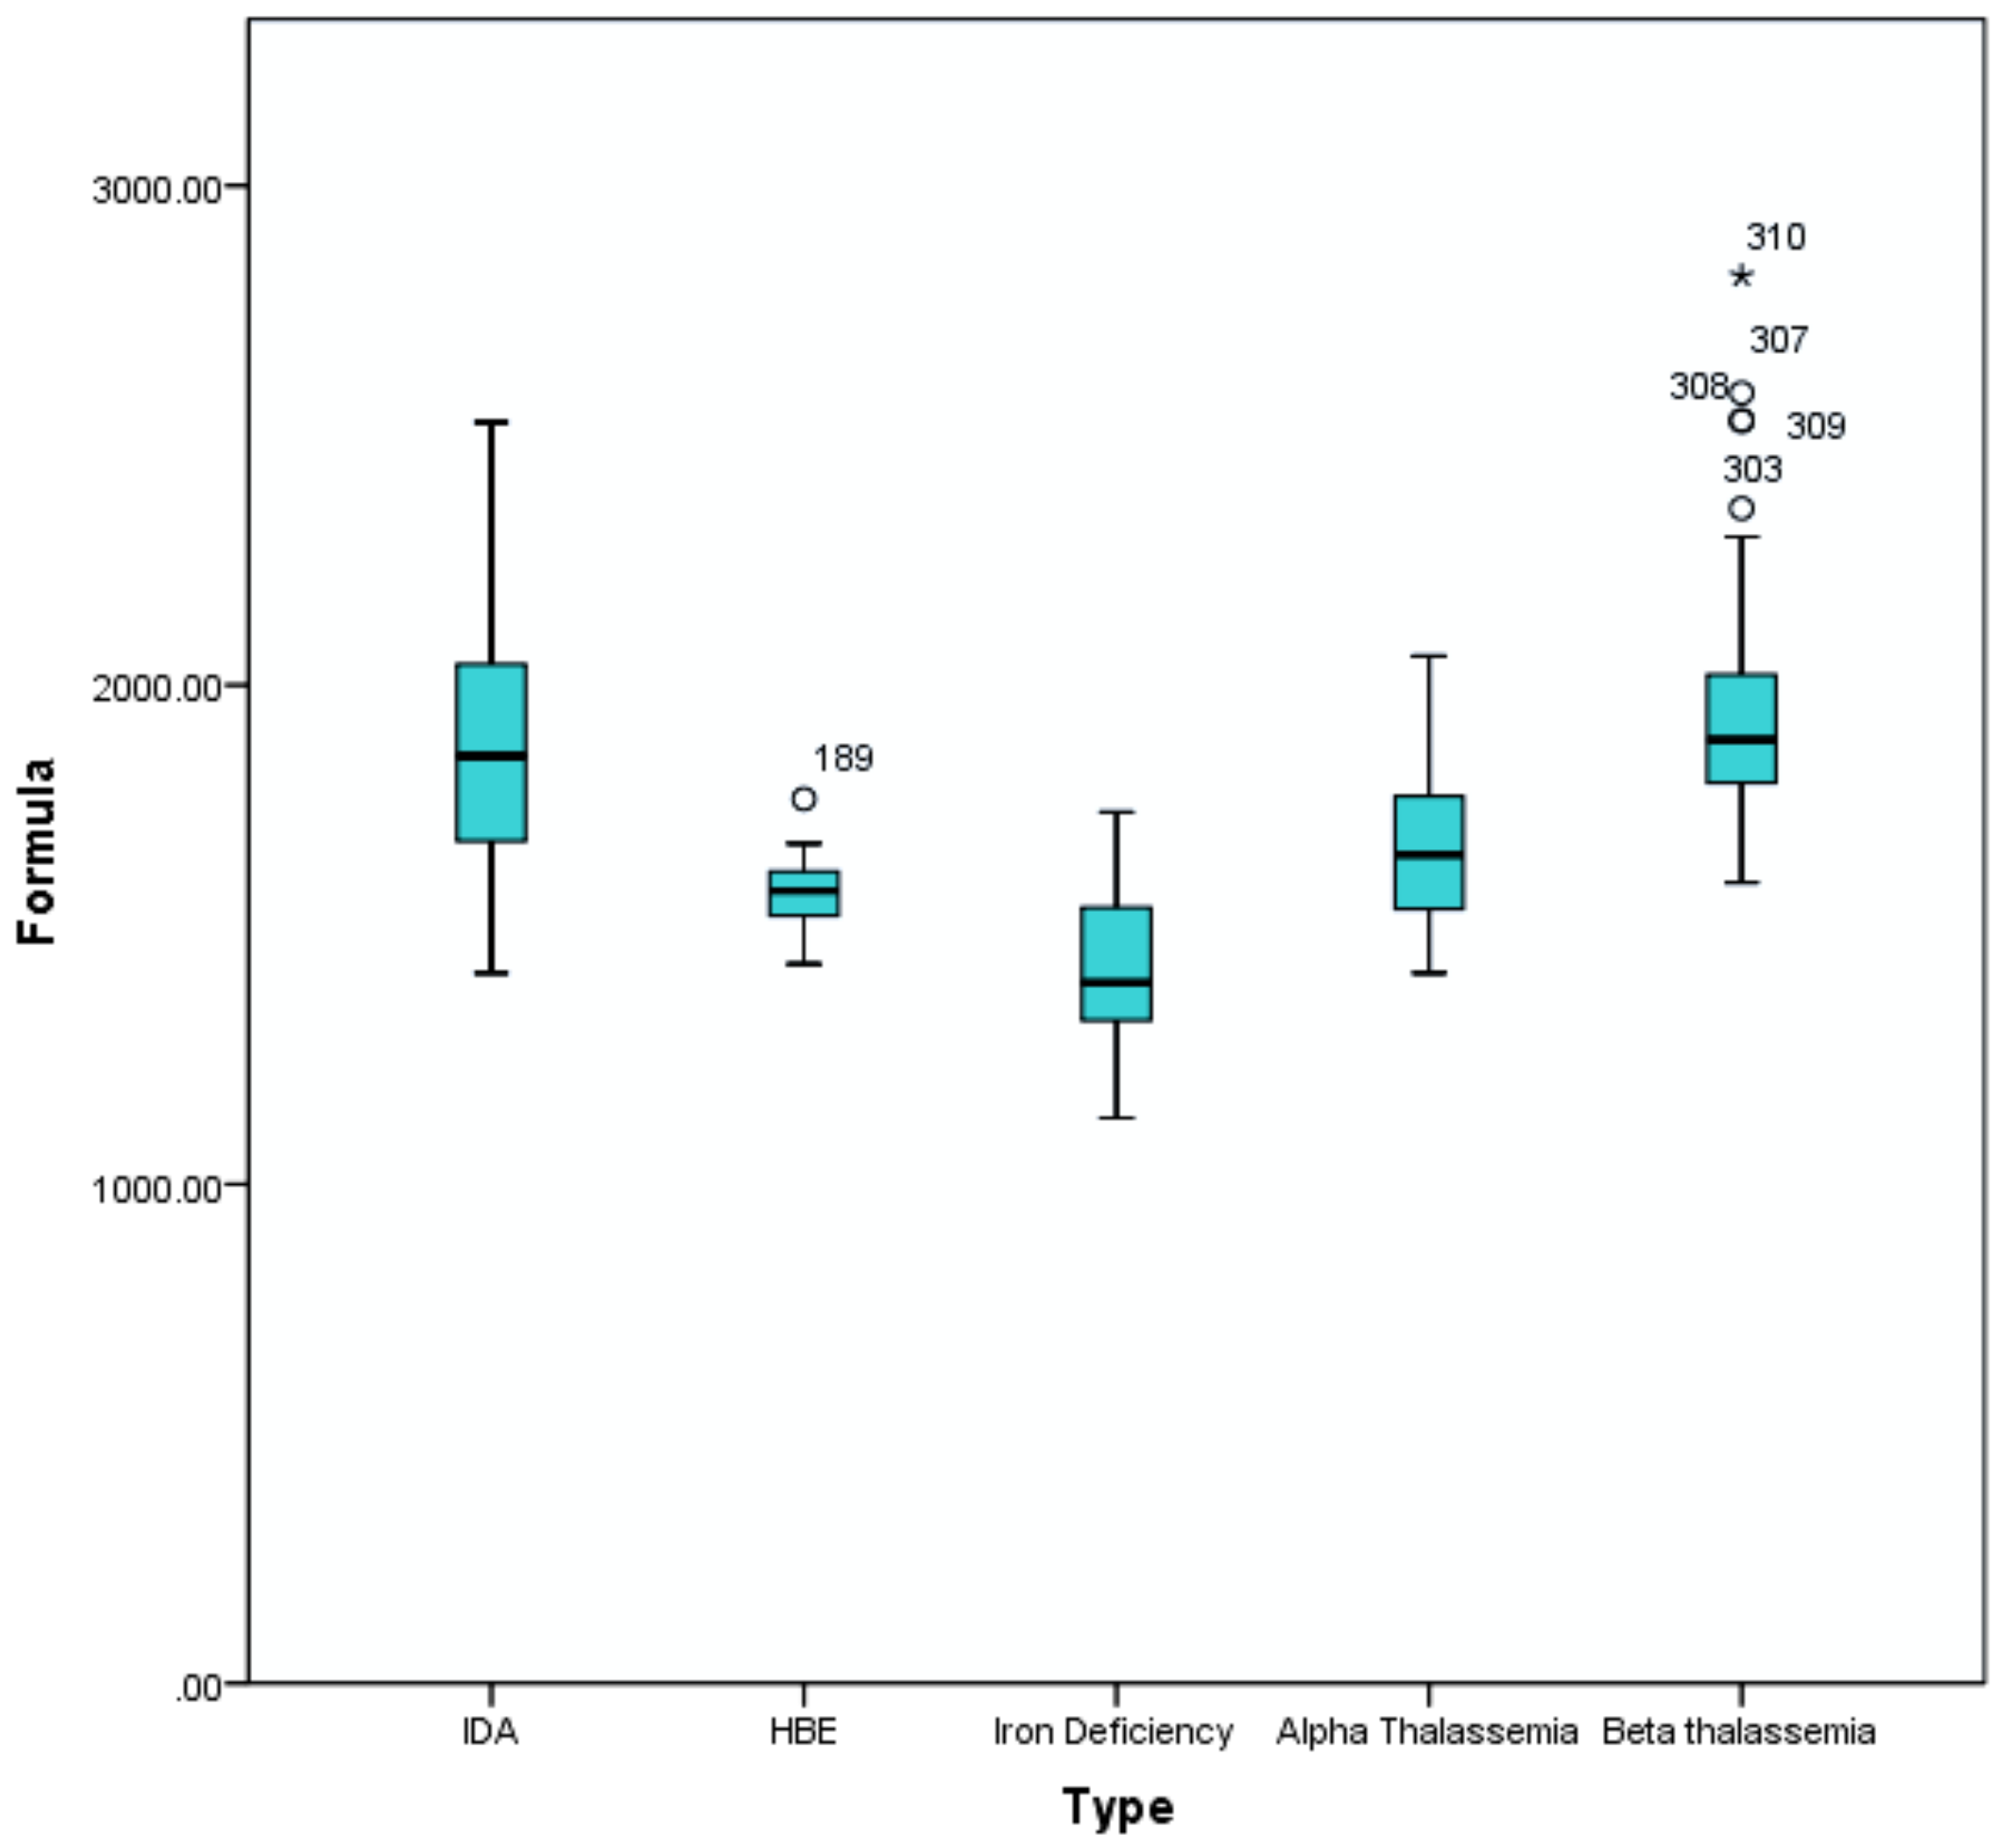
| Algorithm | Alpha Trait | Beta Trait | HbE Trait | IDA | ID |
|---|---|---|---|---|---|
| N | 119 | 48 | 15 | 84 | 44 |
| Mean | 1667.82 | 1960.19 | 1586.31 | 1874.90 | 1430.13 |
| Med | 1660.10 | 1890.40 | 1587.60 | 1857.90 | 1403.65 |
| SD | 148.21 | 248.65 | 80.58 | 245.80 | 153.62 |
| Max | 2058.20 | 2819.50 | 1771.80 | 2526.20 | 1745.80 |
| Min | 1422.70 | 1604.30 | 1441.20 | 1422.80 | 1132.90 |
| Variance | 21,966.37 | 61,829.15 | 6493.59 | 60,417.72 | 23,598.58 |
| Condition | ||||
|---|---|---|---|---|
| Algorithm | Prediction | Absent | Present | Total |
| (MNLMALSRET × RDW) − MCH | Positive | 4 | 26 | 30 |
| Negative | 63 | 2 | 65 | |
| Total | 67 | 28 | 95 | |
Publisher’s Note: MDPI stays neutral with regard to jurisdictional claims in published maps and institutional affiliations. |
© 2021 by the authors. Licensee MDPI, Basel, Switzerland. This article is an open access article distributed under the terms and conditions of the Creative Commons Attribution (CC BY) license (https://creativecommons.org/licenses/by/4.0/).
Share and Cite
Ambayya, A.; Sahibon, S.; Yang, T.W.; Zhang, Q.-Y.; Hassan, R.; Sathar, J. A Novel Algorithm Using Cell Population Data (VCS Parameters) as a Screening Discriminant between Alpha and Beta Thalassemia Traits. Diagnostics 2021, 11, 2163. https://0-doi-org.brum.beds.ac.uk/10.3390/diagnostics11112163
Ambayya A, Sahibon S, Yang TW, Zhang Q-Y, Hassan R, Sathar J. A Novel Algorithm Using Cell Population Data (VCS Parameters) as a Screening Discriminant between Alpha and Beta Thalassemia Traits. Diagnostics. 2021; 11(11):2163. https://0-doi-org.brum.beds.ac.uk/10.3390/diagnostics11112163
Chicago/Turabian StyleAmbayya, Angeli, Santina Sahibon, Thoo Wei Yang, Qian-Yun Zhang, Rosline Hassan, and Jameela Sathar. 2021. "A Novel Algorithm Using Cell Population Data (VCS Parameters) as a Screening Discriminant between Alpha and Beta Thalassemia Traits" Diagnostics 11, no. 11: 2163. https://0-doi-org.brum.beds.ac.uk/10.3390/diagnostics11112163