
MDCT-Based Finite Element Analyses: Are Measurements at the Lumbar Spine Associated with the Biomechanical Strength of Functional Spinal Units of Incidental Osteoporotic Fractures along the Thoracolumbar Spine?

 ,
,  , , , and
Abstract
:1. Introduction
2. Materials and Methods
2.1. Setup and Study Cohort
2.2. Computed Tomography Scanning
2.3. Calculation of Bone Mineral Density
2.4. Vertebral Body and Intervertebral Disc Segmentations
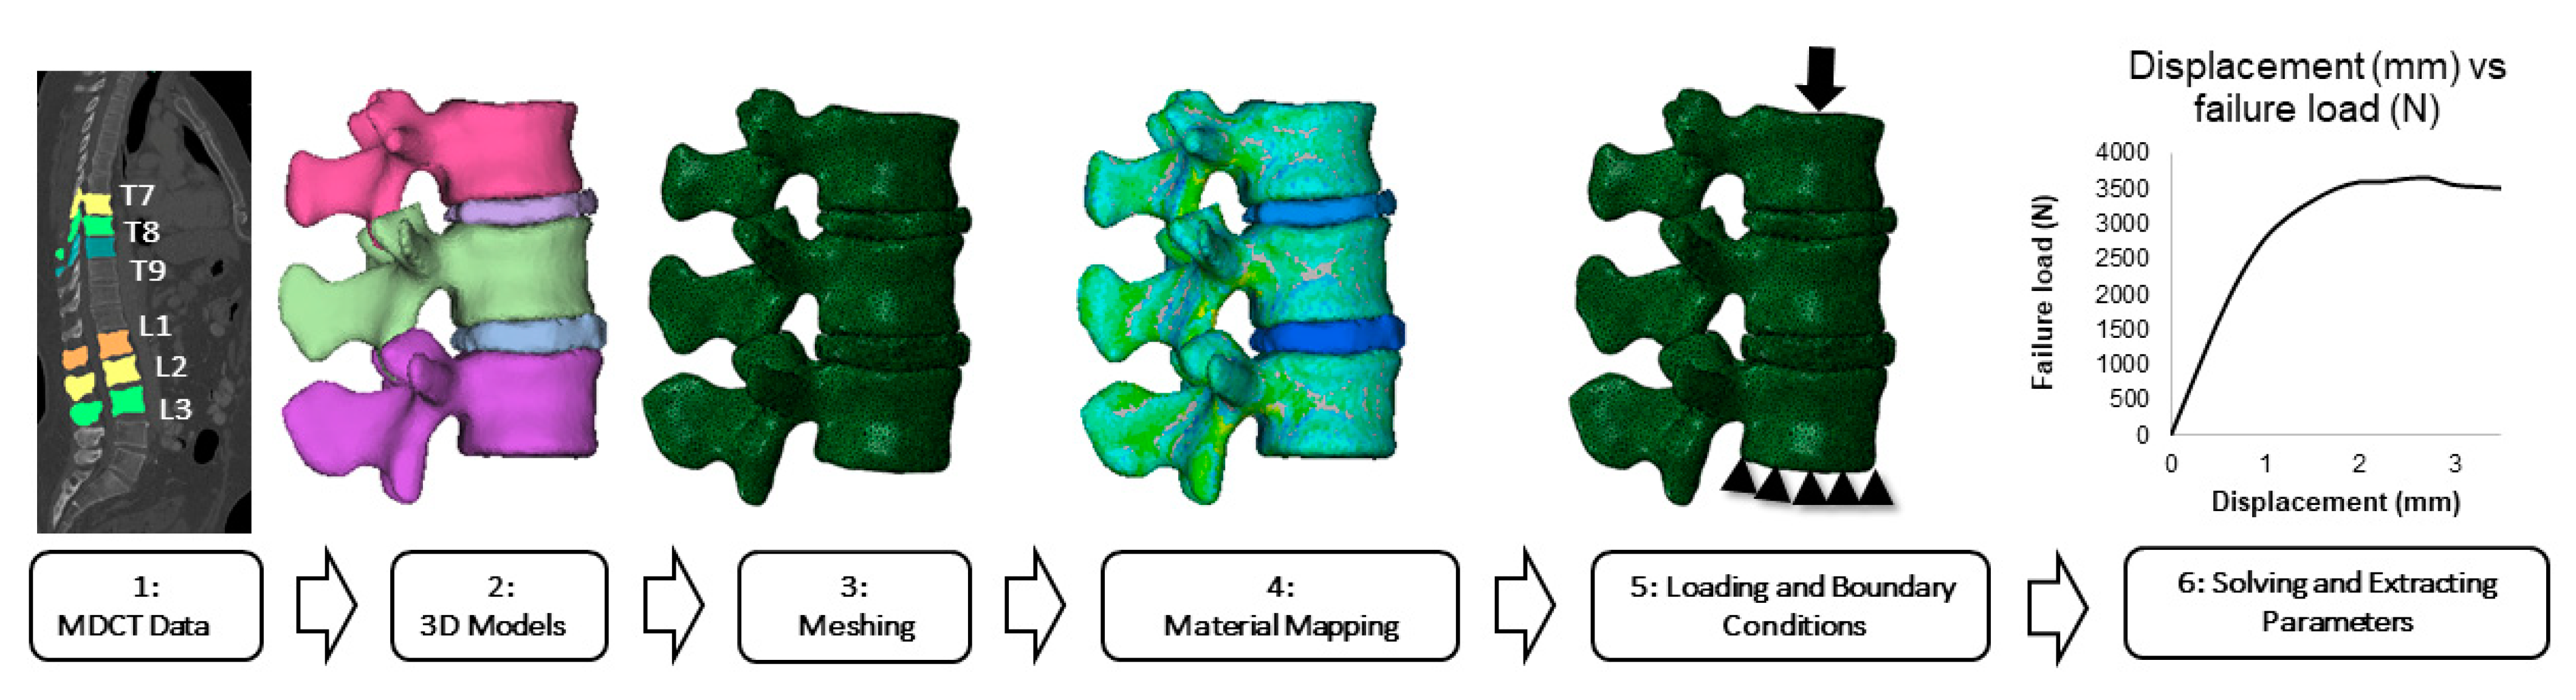
2.5. Finite Element Modeling and Analysis
2.6. Statistical Analysis
3. Results
4. Discussion
5. Conclusions
Author Contributions
Funding
Institutional Review Board Statement
Informed Consent Statement
Data Availability Statement
Conflicts of Interest
Abbreviations
| 3D | Three-dimensional |
| aBMD | Areal bone mineral density |
| CT | Computed tomography |
| DXA | Dual-energy X-ray absorptiometry |
| FEA | Finite element analysis |
| FEM | Finite element model |
| FSU | Functional spinal unit |
| HA | Hydroxyapatite |
| fHU | Hounsfield Units |
| IVD | Intervertebral disc |
| MDCT | Multi-detector computed tomography |
| PACS | Picture Archiving and Communication System |
| QCT | Quantitative computed tomography |
| ROI | Region of interest |
| SD | Standard deviation |
| vBMD | Volumetric bone mineral density |
| VF | Vertebral fracture |
References
- NIH Consensus Development Panel on Osteoporosis Prevention Diagnosis and Therapy. Osteoporosis prevention, diagnosis, and therapy. JAMA 2001, 285, 785–795. [Google Scholar] [CrossRef]
- Compston, J.E.; McClung, M.R.; Leslie, W.D. Osteoporosis. Lancet 2019, 393, 364–376. [Google Scholar] [CrossRef]
- Anonymous. Consensus development conference: Diagnosis, prophylaxis, and treatment of osteoporosis. Am. J. Med. 1993, 94, 646–650. [Google Scholar] [CrossRef]
- Hallberg, I.; Bachrach-Lindstrom, M.; Hammerby, S.; Toss, G.; Ek, A.C. Health-related quality of life after vertebral or hip fracture: A seven-year follow-up study. BMC Musculoskelet. Disord. 2009, 10, 135. [Google Scholar] [CrossRef] [PubMed] [Green Version]
- Tarride, J.E.; Burke, N.; Leslie, W.D.; Morin, S.N.; Adachi, J.D.; Papaioannou, A.; Bessette, L.; Brown, J.P.; Pericleous, L.; Muratov, S.; et al. Loss of health related quality of life following low-trauma fractures in the elderly. BMC Geriatr. 2016, 16, 84. [Google Scholar] [CrossRef] [Green Version]
- Bliuc, D.; Nguyen, N.D.; Milch, V.E.; Nguyen, T.V.; Eisman, J.A.; Center, J.R. Mortality risk associated with low-trauma osteoporotic fracture and subsequent fracture in men and women. JAMA 2009, 301, 513–521. [Google Scholar] [CrossRef] [PubMed] [Green Version]
- Bliuc, D.; Nguyen, N.D.; Nguyen, T.V.; Eisman, J.A.; Center, J.R. Compound risk of high mortality following osteoporotic fracture and refracture in elderly women and men. J. Bone Min. Res. 2013, 28, 2317–2324. [Google Scholar] [CrossRef]
- Center, J.R.; Nguyen, T.V.; Schneider, D.; Sambrook, P.N.; Eisman, J.A. Mortality after all major types of osteoporotic fracture in men and women: An observational study. Lancet 1999, 353, 878–882. [Google Scholar] [CrossRef]
- Kanis, J.A.; Johnell, O.; De Laet, C.; Johansson, H.; Oden, A.; Delmas, P.; Eisman, J.; Fujiwara, S.; Garnero, P.; Kroger, H.; et al. A meta-analysis of previous fracture and subsequent fracture risk. Bone 2004, 35, 375–382. [Google Scholar] [CrossRef] [PubMed]
- Kanis, J.A. Diagnosis of osteoporosis and assessment of fracture risk. Lancet 2002, 359, 1929–1936. [Google Scholar] [CrossRef]
- Kanis, J.A. Diagnosis of osteoporosis. Osteoporos. Int. 1997, 7 (Suppl. S3), S108–S116. [Google Scholar] [CrossRef]
- Ammann, P.; Rizzoli, R. Bone strength and its determinants. Osteoporos. Int. 2003, 14 (Suppl. S3), S13–S18. [Google Scholar] [CrossRef]
- Schuit, S.C.; van der Klift, M.; Weel, A.E.; de Laet, C.E.; Burger, H.; Seeman, E.; Hofman, A.; Uitterlinden, A.G.; van Leeuwen, J.P.; Pols, H.A. Fracture incidence and association with bone mineral density in elderly men and women: The Rotterdam Study. Bone 2004, 34, 195–202. [Google Scholar] [CrossRef]
- Engelke, K. Quantitative Computed Tomography-Current Status and New Developments. J. Clin. Densitom. 2017, 20, 309–321. [Google Scholar] [CrossRef]
- Loffler, M.T.; Sollmann, N.; Mei, K.; Valentinitsch, A.; Noel, P.B.; Kirschke, J.S.; Baum, T. X-ray-based quantitative osteoporosis imaging at the spine. Osteoporos. Int. 2019. [Google Scholar] [CrossRef] [PubMed]
- Brett, A.D.; Brown, J.K. Quantitative computed tomography and opportunistic bone density screening by dual use of computed tomography scans. J. Orthop. Transl. 2015, 3, 178–184. [Google Scholar] [CrossRef] [PubMed] [Green Version]
- Allaire, B.T.; Lu, D.; Johannesdottir, F.; Kopperdahl, D.; Keaveny, T.M.; Jarraya, M.; Guermazi, A.; Bredella, M.A.; Samelson, E.J.; Kiel, D.P.; et al. Prediction of incident vertebral fracture using CT-based finite element analysis. Osteoporos. Int. 2019, 30, 323–331. [Google Scholar] [CrossRef] [PubMed]
- Anitha, D.; Mei, K.; Dieckmeyer, M.; Kopp, F.K.; Sollmann, N.; Zimmer, C.; Kirschke, J.S.; Noel, P.B.; Baum, T.; Subburaj, K. MDCT-based Finite Element Analysis of Vertebral Fracture Risk: What Dose is Needed? Clin. Neuroradiol. 2018. [Google Scholar] [CrossRef]
- Anitha, D.; Subburaj, K.; Mei, K.; Kopp, F.K.; Foehr, P.; Noel, P.B.; Kirschke, J.S.; Baum, T. Effects of dose reduction on bone strength prediction using finite element analysis. Sci. Rep. 2016, 6, 38441. [Google Scholar] [CrossRef] [Green Version]
- Panagiotopoulou, O. Finite element analysis (FEA): Applying an engineering method to functional morphology in anthropology and human biology. Ann. Hum. Biol. 2009, 36, 609–623. [Google Scholar] [CrossRef]
- Engelke, K.; Libanati, C.; Fuerst, T.; Zysset, P.; Genant, H.K. Advanced CT based in vivo methods for the assessment of bone density, structure, and strength. Curr. Osteoporos. Rep. 2013, 11, 246–255. [Google Scholar] [CrossRef]
- Carpenter, R.D. Finite element analysis of the hip and spine based on quantitative computed tomography. Curr. Osteoporos. Rep. 2013, 11, 156–162. [Google Scholar] [CrossRef]
- Wang, X.; Sanyal, A.; Cawthon, P.M.; Palermo, L.; Jekir, M.; Christensen, J.; Ensrud, K.E.; Cummings, S.R.; Orwoll, E.; Black, D.M.; et al. Prediction of new clinical vertebral fractures in elderly men using finite element analysis of CT scans. J. Bone Min. Res. 2012, 27, 808–816. [Google Scholar] [CrossRef] [Green Version]
- Kopperdahl, D.L.; Aspelund, T.; Hoffmann, P.F.; Sigurdsson, S.; Siggeirsdottir, K.; Harris, T.B.; Gudnason, V.; Keaveny, T.M. Assessment of incident spine and hip fractures in women and men using finite element analysis of CT scans. J. Bone Min. Res. 2014, 29, 570–580. [Google Scholar] [CrossRef] [PubMed]
- Anitha, D.P.; Baum, T.; Kirschke, J.S.; Subburaj, K. Effect of the intervertebral disc on vertebral bone strength prediction: A finite-element study. Spine J. 2020, 20, 665–671. [Google Scholar] [CrossRef] [PubMed]
- Crawford, R.P.; Cann, C.E.; Keaveny, T.M. Finite element models predict in vitro vertebral body compressive strength better than quantitative computed tomography. Bone 2003, 33, 744–750. [Google Scholar] [CrossRef]
- Imai, K.; Ohnishi, I.; Bessho, M.; Nakamura, K. Nonlinear finite element model predicts vertebral bone strength and fracture site. Spine 2006, 31, 1789–1794. [Google Scholar] [CrossRef] [PubMed]
- Zysset, P.K.; Dall’ara, E.; Varga, P.; Pahr, D.H. Finite element analysis for prediction of bone strength. Bonekey Rep. 2013, 2, 386. [Google Scholar] [CrossRef] [PubMed] [Green Version]
- Johannesdottir, F.; Allaire, B.; Kopperdahl, D.L.; Keaveny, T.M.; Sigurdsson, S.; Bredella, M.A.; Anderson, D.E.; Samelson, E.J.; Kiel, D.P.; Gudnason, V.G.; et al. Bone density and strength from thoracic and lumbar CT scans both predict incident vertebral fractures independently of fracture location. Osteoporos. Int. 2020. [Google Scholar] [CrossRef]
- Anitha, D.; Baum, T.; Kirschke, J.S.; Subburaj, K. Risk of vertebral compression fractures in multiple myeloma patients: A finite-element study. Medicine 2017, 96, e5825. [Google Scholar] [CrossRef]
- Rayudu, N.M.; Dieckmeyer, M.; Löffler, M.T.; Noel, P.; Kirschke, J.S.; Baum, T.; Subburaj, K. Predicting Vertebral Bone Strength Using Finite Element Analysis for Opportunistic Osteoporosis Screening in Routine Multidetector Computed Tomography Scans—A Feasibility Study. Front. Endocrinol. 2020, 11. [Google Scholar] [CrossRef]
- Groenen, K.H.J.; Bitter, T.; van Veluwen, T.C.G.; van der Linden, Y.M.; Verdonschot, N.; Tanck, E.; Janssen, D. Case-specific non-linear finite element models to predict failure behavior in two functional spinal units. J. Orthop. Res. 2018, 36, 3208–3218. [Google Scholar] [CrossRef] [PubMed] [Green Version]
- Yeung, L.Y.; Rayudu, N.M.; Löffler, M.; Sekuboyina, A.; Burian, E.; Sollmann, N.; Dieckmeyer, M.; Greve, T.; Kirschke, J.S.; Subburaj, K.; et al. Prediction of Incidental Osteoporotic Fractures at Vertebral-Specific Level Using 3D Non-Linear Finite Element Parameters Derived from Routine Abdominal MDCT. Diagnostics 2021, 11, 208. [Google Scholar] [CrossRef]
- Genant, H.K.; Wu, C.Y.; van Kuijk, C.; Nevitt, M.C. Vertebral fracture assessment using a semiquantitative technique. J. Bone Min. Res. 1993, 8, 1137–1148. [Google Scholar] [CrossRef] [PubMed]
- Baum, T.; Muller, D.; Dobritz, M.; Wolf, P.; Rummeny, E.J.; Link, T.M.; Bauer, J.S. Converted lumbar BMD values derived from sagittal reformations of contrast-enhanced MDCT predict incidental osteoporotic vertebral fractures. Calcif. Tissue Int. 2012, 90, 481–487. [Google Scholar] [CrossRef] [PubMed]
- Baum, T.; Muller, D.; Dobritz, M.; Rummeny, E.J.; Link, T.M.; Bauer, J.S. BMD measurements of the spine derived from sagittal reformations of contrast-enhanced MDCT without dedicated software. Eur. J. Radiol. 2011, 80, e140–e145. [Google Scholar] [CrossRef] [PubMed]
- Sekuboyina, A.; Bayat, A.; Husseini, M.E.; Löffler, M.T.; Li, H.; Tetteh, G.; Kukačka, J.; Payer, C.; Štern, D.; Urschler, M.; et al. VerSe: A Vertebrae Labelling and Segmentation Benchmark for Multi-detector CT Images. arXiv 2020, arXiv:2001.09193. [Google Scholar]
- Löffler, M.T.; Sollmann, N.; Burian, E.; Bayat, A.; Aftahy, K.; Baum, T.; Meyer, B.; Ryang, Y.M.; Kirschke, J.S. Opportunistic Osteoporosis Screening Reveals Low Bone Density in Patients With Screw Loosening After Lumbar Semi-Rigid Instrumentation: A Case-Control Study. Front. Endocrinol. 2021, 11. [Google Scholar] [CrossRef]
- Rho, J.Y.; Hobatho, M.C.; Ashman, R.B. Relations of mechanical properties to density and CT numbers in human bone. Med. Eng. Phys. 1995, 17, 347–355. [Google Scholar] [CrossRef]
- Goulet, R.W.; Goldstein, S.A.; Ciarelli, M.J.; Kuhn, J.L.; Brown, M.B.; Feldkamp, L.A. The relationship between the structural and orthogonal compressive properties of trabecular bone. J. Biomech. 1994, 27. [Google Scholar] [CrossRef] [Green Version]
- Keller, T.S. Predicting the compressive mechanical behavior of bone. J. Biomech. 1994, 27, 1159–1168. [Google Scholar] [CrossRef]
- Keyak, J.H. Improved prediction of proximal femoral fracture load using nonlinear finite element models. Med. Eng. Phys. 2001, 23, 165–173. [Google Scholar] [CrossRef]
- Lee, C.H.; Landham, P.R.; Eastell, R.; Adams, M.A.; Dolan, P.; Yang, L. Development and validation of a subject-specific finite element model of the functional spinal unit to predict vertebral strength. Proc. Inst. Mech. Eng. Part H 2017, 231, 821–830. [Google Scholar] [CrossRef] [PubMed]
- Ayturk, U.M.; Puttlitz, C.M. Parametric convergence sensitivity and validation of a finite element model of the human lumbar spine. Comput. Methods Biomech. Biomed. Engin. 2011, 14, 695–705. [Google Scholar] [CrossRef] [PubMed]
- Ghouchani, A.; Ravari, M.; Mahmoudi, F. Finite Element Application in Prediction of Suitable Material Properties for an Arthroplastic Lumbar Disc. Int. J. Model. Optim. 2011, 1, 390–395. [Google Scholar] [CrossRef]
- Valentinitsch, A.; Trebeschi, S.; Alarcon, E.; Baum, T.; Kaesmacher, J.; Zimmer, C.; Lorenz, C.; Kirschke, J.S. Regional analysis of age-related local bone loss in the spine of a healthy population using 3D voxel-based modeling. Bone 2017, 103, 233–240. [Google Scholar] [CrossRef]
- Brenner, D.J.; Hall, E.J. Computed tomography—An increasing source of radiation exposure. N. Engl. J. Med. 2007, 357, 2277–2284. [Google Scholar] [CrossRef] [Green Version]
- Fazel, R.; Krumholz, H.M.; Wang, Y.; Ross, J.S.; Chen, J.; Ting, H.H.; Shah, N.D.; Nasir, K.; Einstein, A.J.; Nallamothu, B.K. Exposure to low-dose ionizing radiation from medical imaging procedures. N. Engl. J. Med. 2009, 361, 849–857. [Google Scholar] [CrossRef] [Green Version]
- Sanchez-Riera, L.; Wilson, N.; Kamalaraj, N.; Nolla, J.M.; Kok, C.; Li, Y.; Macara, M.; Norman, R.; Chen, J.S.; Smith, E.U.; et al. Osteoporosis and fragility fractures. Best Pr. Res. Clin. Rheumatol. 2010, 24, 793–810. [Google Scholar] [CrossRef] [PubMed]
- Evans, W.J.; Morley, J.E.; Argiles, J.; Bales, C.; Baracos, V.; Guttridge, D.; Jatoi, A.; Kalantar-Zadeh, K.; Lochs, H.; Mantovani, G.; et al. Cachexia: A new definition. Clin. Nutr. 2008, 27, 793–799. [Google Scholar] [CrossRef]
- Cruz-Jentoft, A.J.; Baeyens, J.P.; Bauer, J.M.; Boirie, Y.; Cederholm, T.; Landi, F.; Martin, F.C.; Michel, J.P.; Rolland, Y.; Schneider, S.M.; et al. Sarcopenia: European consensus on definition and diagnosis: Report of the European Working Group on Sarcopenia in Older People. Age Ageing 2010, 39, 412–423. [Google Scholar] [CrossRef] [PubMed] [Green Version]


| Property | Mapping Relations |
|---|---|
| Vertebral material properties | |
| Apparent density (ρapp in kg/m3) [39] | ρapp = 47 + 1.122 * HU |
| Ash density (ρash in kg/m3) [40] | ρash = 0.6 * ρapp |
| Elastic modulus (E in MPa) [39] | Ez = −349 + 5.82 * ρapp Ex = Ey = 0.333 Ez Z-axial direction of the vertebra |
| Shear modulus (G in MPa) [26] | Gxy = 0.121 Ez Gxz = Gyz = 0.157 Ez |
| Poisson ratio (V) [26] | Vxy = 0.381 Vxz = Vyz = 0.104 |
| Maximum principal stress limit (σ in MPa) [41] | σ = 137 * ρash 1.88, ρash < 0.317 σ = 114 * ρash 1.72, ρash > 0.317 |
| Plastic strain (εAB) [42] | εAB = −0.00315 + 0.0728 ρash |
| Minimum principal stress limit (σmin in MPa) [42] | σmin = 65.1 * ρash 1.93 |
| Intervertebral disc properties | |
| Annulus | |
| Elastic modulus (E in MPa) [43] | E = 500 |
| Poisson ratio (V) [43] | 0.3 |
| Nucleus | |
| Elastic modulus (E in MPa) [44] | E = 1 |
| Poisson ratio (V) [45] | 0.475 |
| Item | Mean ± SD | Range |
|---|---|---|
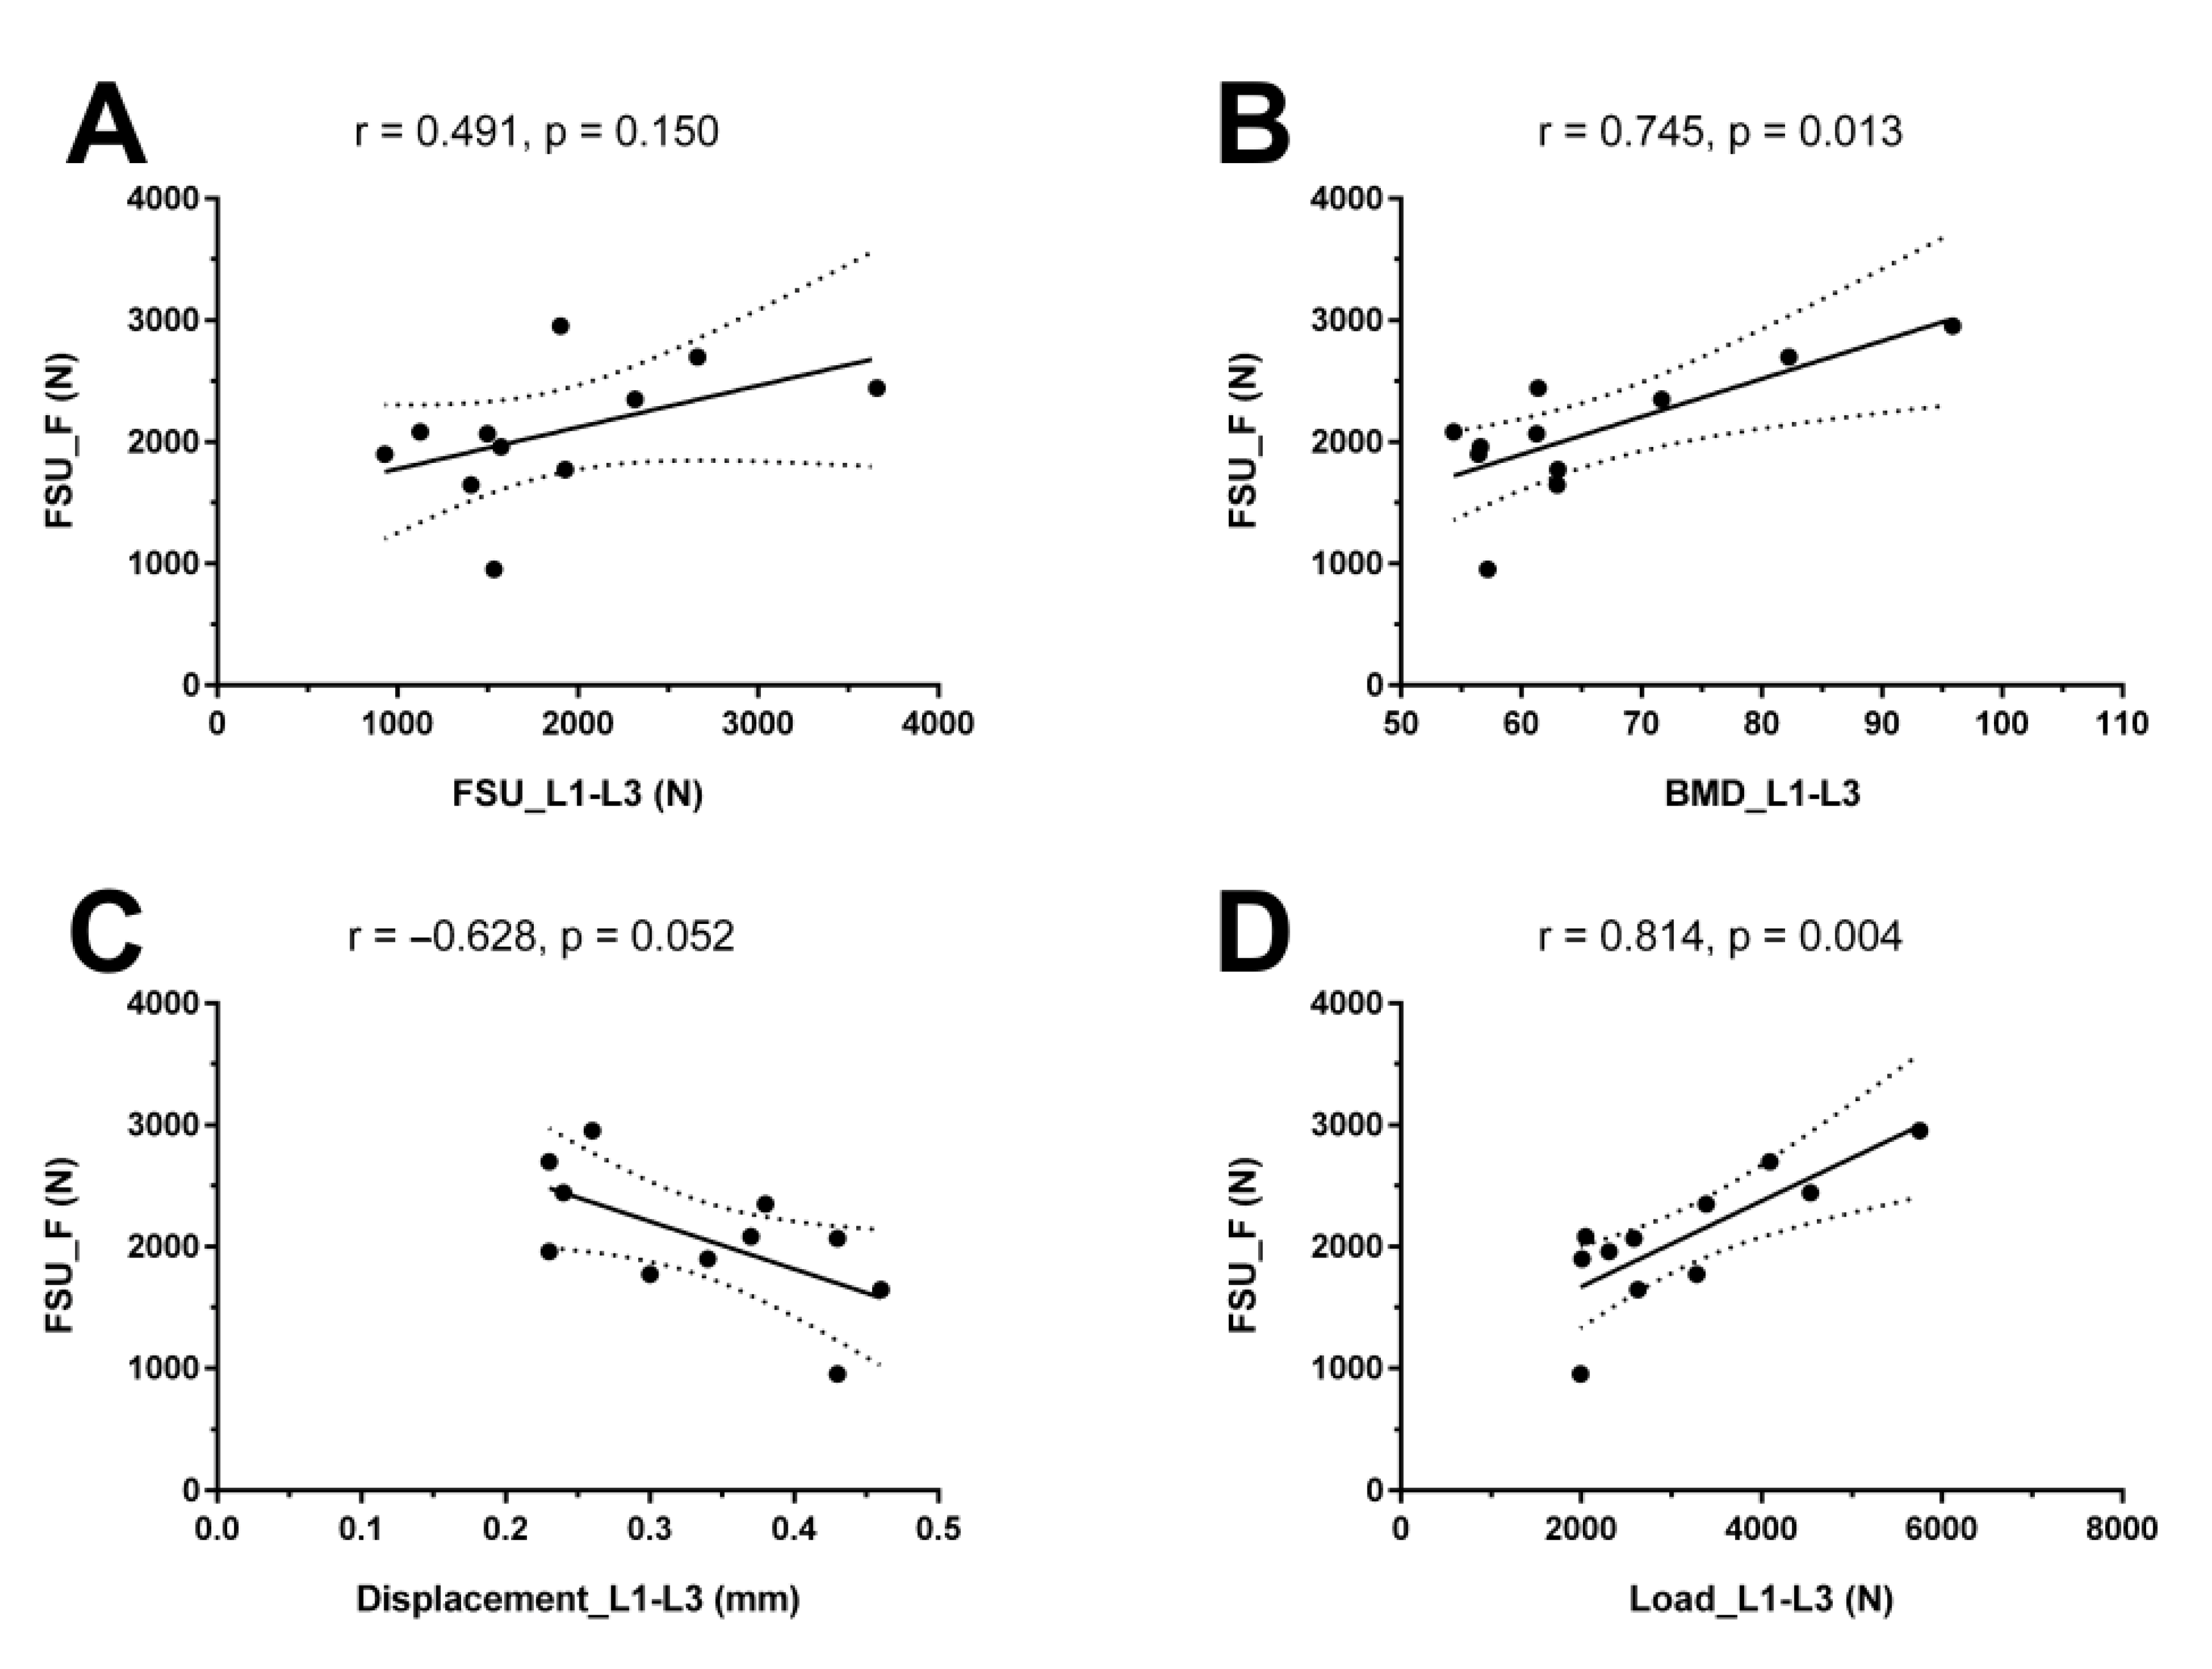
| FSU_F (N) | 2075.42 ± 518.11 | 952.35–2954.57 |
| FSU_L1–L3 (N) | 1867.30 ± 740.07 | 928.14–3657.75 |
| BMD_L1–L3 (mg/mL) | 65.75 ± 12.21 | 54.38–95.88 |
| Displacement_L1–L3 (mm) | 0.34 ± 0.08 | 0.23–0.46 |
| Load_L1–L3 (N) | 3147.24 ± 1161.40 | 1991.94–5752.74 |
Publisher’s Note: MDPI stays neutral with regard to jurisdictional claims in published maps and institutional affiliations. |
© 2021 by the authors. Licensee MDPI, Basel, Switzerland. This article is an open access article distributed under the terms and conditions of the Creative Commons Attribution (CC BY) license (http://creativecommons.org/licenses/by/4.0/).
Share and Cite
Sollmann, N.; Rayudu, N.M.; Yeung, L.Y.; Sekuboyina, A.; Burian, E.; Dieckmeyer, M.; Löffler, M.T.; Schwaiger, B.J.; Gersing, A.S.; Kirschke, J.S.; et al. MDCT-Based Finite Element Analyses: Are Measurements at the Lumbar Spine Associated with the Biomechanical Strength of Functional Spinal Units of Incidental Osteoporotic Fractures along the Thoracolumbar Spine? Diagnostics 2021, 11, 455. https://0-doi-org.brum.beds.ac.uk/10.3390/diagnostics11030455
Sollmann N, Rayudu NM, Yeung LY, Sekuboyina A, Burian E, Dieckmeyer M, Löffler MT, Schwaiger BJ, Gersing AS, Kirschke JS, et al. MDCT-Based Finite Element Analyses: Are Measurements at the Lumbar Spine Associated with the Biomechanical Strength of Functional Spinal Units of Incidental Osteoporotic Fractures along the Thoracolumbar Spine? Diagnostics. 2021; 11(3):455. https://0-doi-org.brum.beds.ac.uk/10.3390/diagnostics11030455
Chicago/Turabian StyleSollmann, Nico, Nithin Manohar Rayudu, Long Yu Yeung, Anjany Sekuboyina, Egon Burian, Michael Dieckmeyer, Maximilian T. Löffler, Benedikt J. Schwaiger, Alexandra S. Gersing, Jan S. Kirschke, and et al. 2021. "MDCT-Based Finite Element Analyses: Are Measurements at the Lumbar Spine Associated with the Biomechanical Strength of Functional Spinal Units of Incidental Osteoporotic Fractures along the Thoracolumbar Spine?" Diagnostics 11, no. 3: 455. https://0-doi-org.brum.beds.ac.uk/10.3390/diagnostics11030455