
Patients with Axial Spondyloarthritis Show an Altered Flexion/Relaxation Phenomenon

 ,
,  , , , ,
Abstract
:1. Introduction
2. Materials and Methods
2.1. Patients
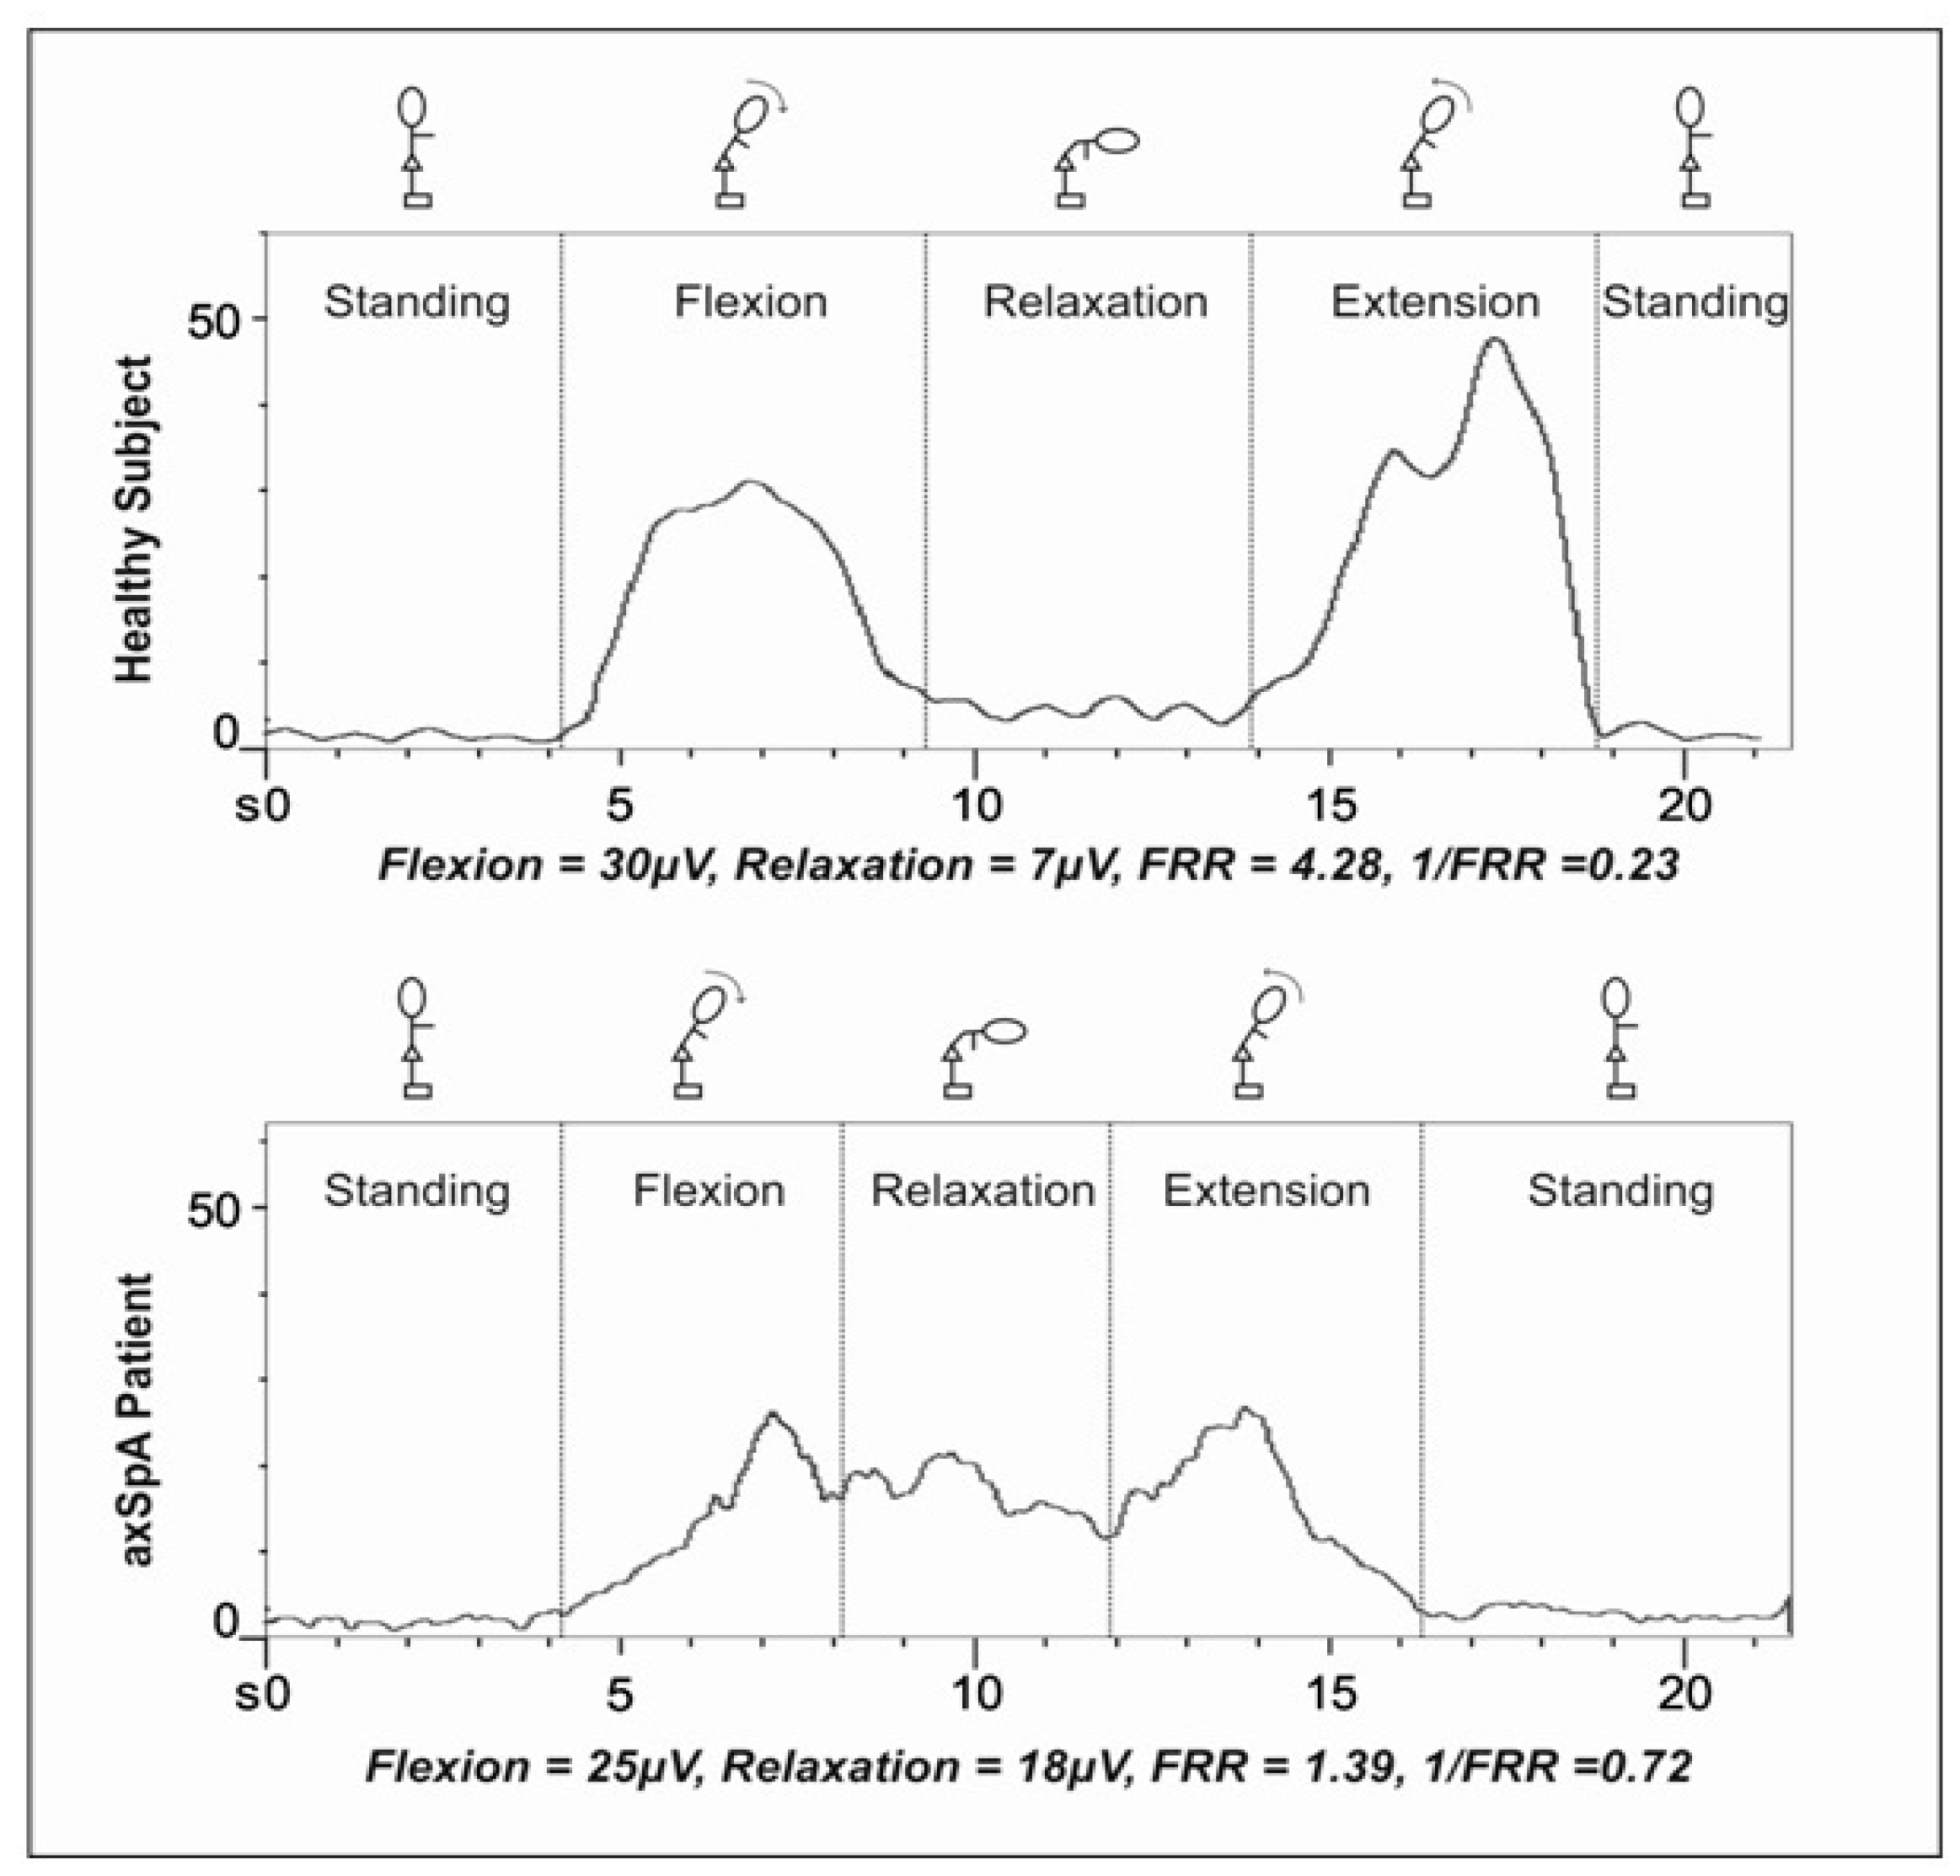
2.2. EMG Recordings
2.3. Data Reduction
2.4. Variables
2.5. Statistical Analysis
2.5.1. Reliability
2.5.2. Criterion Validity
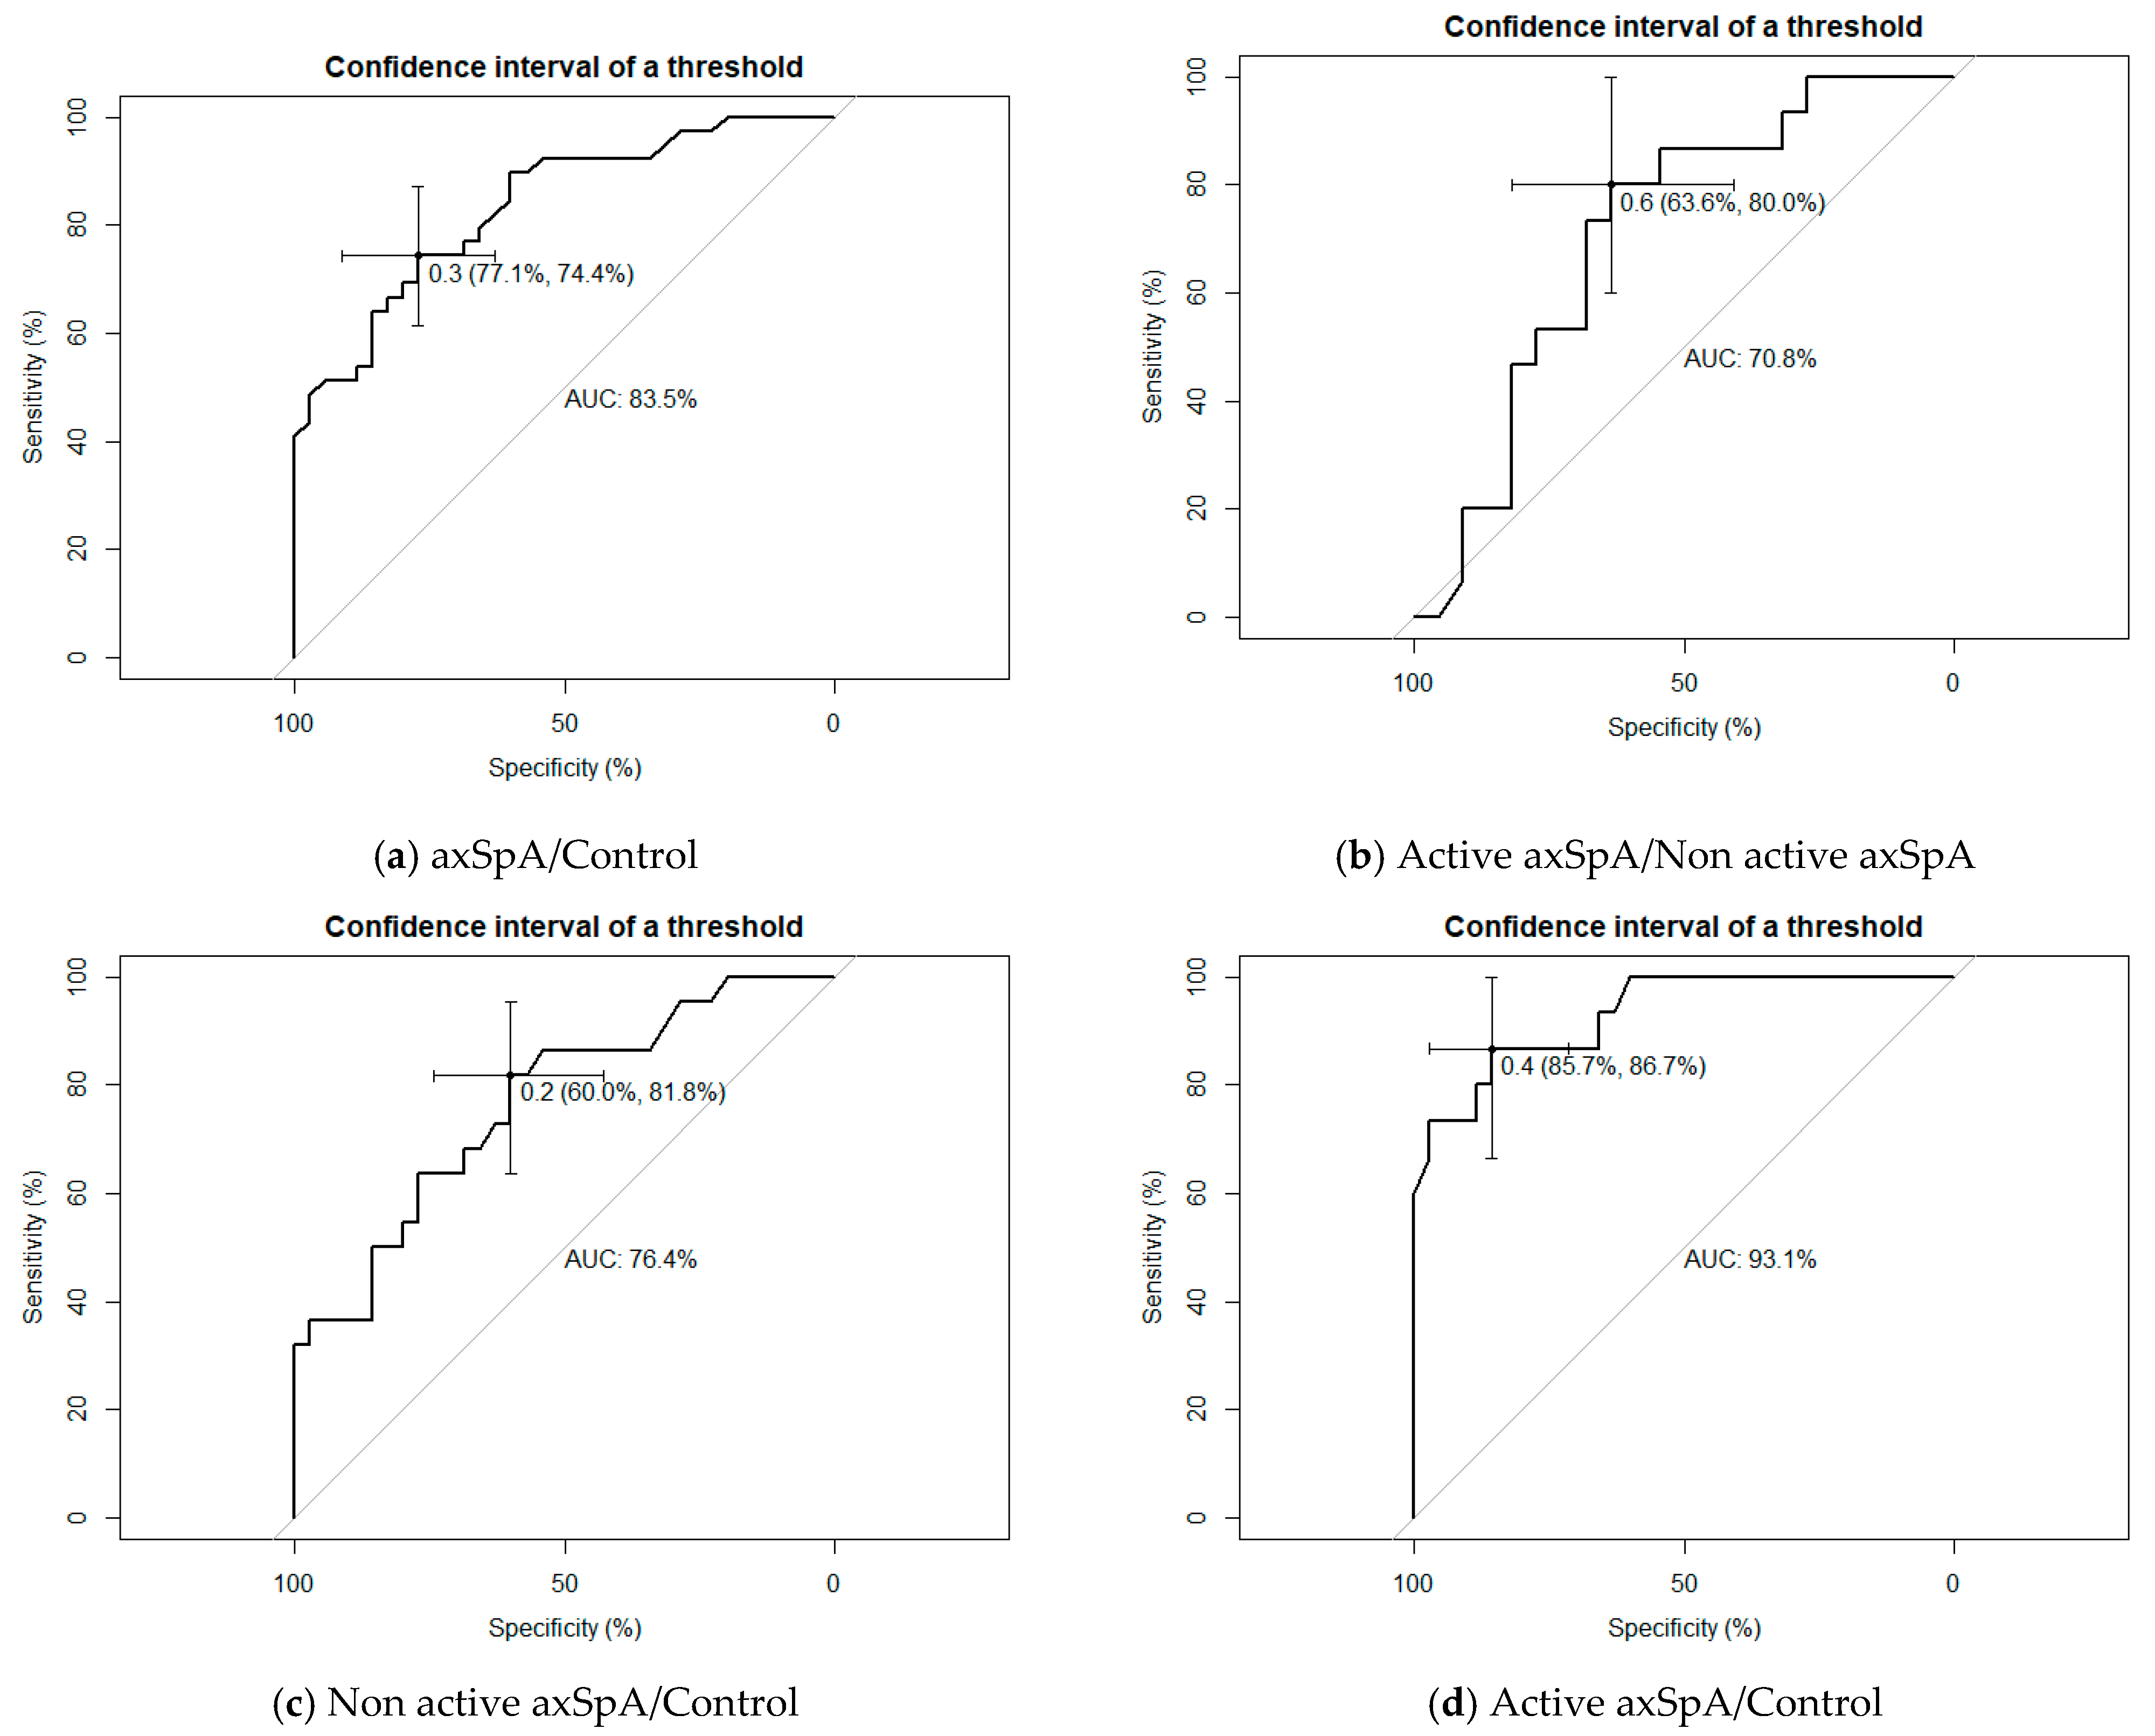
2.5.3. Discriminant Validity
3. Results
3.1. sEMG Measurements between axSpA and Controls
3.2. sEMG Measurements between Active axSpA and Non-Active axSpA
3.3. Reliability
3.4. Criterion Validity
3.5. Discriminant Validity
4. Discussion
5. Conclusions
Author Contributions
Funding
Institutional Review Board Statement
Informed Consent Statement
Data Availability Statement
Acknowledgments
Conflicts of Interest
References
- Sieper, J.; Rudwaleit, M.; Baraliakos, X.; Brandt, J.; Braun, J.; Burgos-Vargas, R.; Dougados, M.; Hermann, K.-G.; Landewé, R.; Maksymowych, W.; et al. The Assessment of SpondyloArthritis international Society (ASAS) handbook: A guide to assess spondyloarthritis. Ann. Rheum. Dis. 2009, 68 (Suppl. 2), ii1–ii44. [Google Scholar] [CrossRef]
- Sieper, J.; van der Heijde, D.; Landewé, R.; Brandt, J.; Burgos-Vagas, R.; Collantes-Estevez, E.; Dijkmans, B.; Dougados, M.; Khan, M.A.; Leirisalo-Repo, M.; et al. New criteria for inflammatory back pain in patients with chronic back pain: A real patient exercise by experts from the Assessment of SpondyloArthritis international Society (ASAS). Ann. Rheum. Dis. 2009, 68, 784–788. [Google Scholar] [CrossRef] [PubMed]
- McGonagle, D.; Stockwin, L.; Isaacs, J.; Emery, P. An enthesitis based model for the pathogenesis of spondyloarthropathy. additive effects of microbial adjuvant and biomechanical factors at disease sites. J. Rheumatol. 2001, 28, 2155–2159. [Google Scholar] [PubMed]
- Jacques, P.; Lambrecht, S.; Verheugen, E.; Pauwels, E.; Kollias, G.; Armaka, M.; Verhoye, M.; Van Der Linden, A.; Achten, R.; Lories, R.J.; et al. Proof of concept: Enthesitis and new bone formation in spondyloarthritis are driven by mechanical strain and stromal cells. Ann. Rheum. Dis. 2014, 73, 437–445. [Google Scholar] [CrossRef] [PubMed] [Green Version]
- Lories, R.J.U.; Derese, I.; Luyten, F.P. Modulation of bone morphogenetic protein signaling inhibits the onset and progression of ankylosing enthesitis. J. Clin. Investig. 2005, 115, 1571–1579. [Google Scholar] [CrossRef] [PubMed] [Green Version]
- Masi, A.T.; Sierakowski, S.; Kim, J.M. Jacques Forestier’s vanished bowstring sign in ankylosing spondylitis: A call to test its validity and possible relation to spinal myofascial hypertonicity. Clin. Exp. Rheumatol. 2005, 23, 760–766. [Google Scholar]
- Mannion, A.F. Fibre type characteristics and function of the human paraspinal muscles: Normal values and changes in association with low back pain. J. Electromyogr. Kinesiol. 1997, 9, 363–377. [Google Scholar] [CrossRef]
- Kim, M.; Yi, C.; Kwon, O.; Cho, S.; Cynn, H.; Kim, Y.; Hwang, S.H.; Choi, B.R.; Hong, J.A.; Jung, D.H. Comparison of lumbopelvic rhythm and flexion-relaxation response between 2 different low back pain subtypes. Spine 2013, 38, 1260–1267. [Google Scholar] [CrossRef]
- Masi, A.T. An added perspective on the 2009 SPARTAN and IGAS report: An innate axial myofascial hypertonicity. J. Rheumatol. 2011, 38, 2092–2094. [Google Scholar] [CrossRef] [Green Version]
- Dankaerts, W.; O’Sullivan, P.; Burnett, A.; Straker, L.; Davey, P.; Gupta, R. Discriminating healthy controls and two clinical subgroups of nonspecific chronic low back pain patients using trunk muscle activation and lumbosacral kinematics of postures and movements: A statistical classification model. Spine 2009, 34, 1610–1618. [Google Scholar] [CrossRef] [PubMed]
- Neblett, R.; Brede, E.; Mayer, T.G.; Gatchel, R.J. What is the best surface EMG measure of lumbar flexion-relaxation for distinguishing chronic low back pain patients from pain-free controls? Clin. J. Pain 2013, 29, 334–340. [Google Scholar] [CrossRef] [PubMed] [Green Version]
- Neblett, R.; Mayer, T.G.; Brede, E.; Gatchel, R.J. Correcting abnormal flexion-relaxation in chronic lumbar pain: Responsiveness to a new biofeedback training protocol. Clin. J. Pain 2010, 26, 403–409. [Google Scholar] [CrossRef] [Green Version]
- Geisser, M.E.; Ranavaya, M.; Haig, A.J.; Roth, R.S.; Zucker, R.; Ambroz, C.; Caruso, M. A Meta-Analytic Review of Surface Electromyography Among Persons with Low Back Pain and Normal, Healthy Controls. J. Pain 2005, 6, 711–726. [Google Scholar] [CrossRef] [PubMed]
- Watson, P.J.; Booker, C.K.; Main, C.J.; Chen, A.C.N. Surface electromyography in the identification of chronic low back pain patients: The development of the flexion relaxation ratio. Clin. Biomech. 1997, 12, 165–171. [Google Scholar] [CrossRef]
- Ambroz, C.; Scott, A.; Ambroz, A.; Talbott, E.O. Chronic low back pain assessment using surface electromyography. J. Occup. Environ. Med. 2000, 42, 660–669. [Google Scholar] [CrossRef] [PubMed]
- Neblett, R.; Mayer, T.G.; Brede, E.; Gatchel, R.J. The effect of prior lumbar surgeries on the flexion relaxation phenomenon and its responsiveness to rehabilitative treatment. Spine J. 2014, 14, 892–902. [Google Scholar] [CrossRef] [PubMed]
- Neblett, R. Surface Electromyographic (SEMG) Biofeedback for Chronic Low Back Pain. Healthcare 2016, 4, 27. [Google Scholar] [CrossRef] [PubMed] [Green Version]
- Neblett, R.; Mayer, T.G.; Gatchel, R.J.; Keeley, J.; Proctor, T.; Anagnostis, C. Quantifying the lumbar flexion-relaxation phenomenon: Theory, normative data, and clinical applications. Spine 2003, 28, 1435–1446. [Google Scholar] [CrossRef]
- Rudwaleit, M.; van der Heijde, D.; Landewé, R.; Listing, J.; Akkoc, N.; Brandt, J.; Braun, J.; Chou, C.T.; Collantes-Estevez, E.; Dougados, M.; et al. The development of assessment of spondyloarthritis international society classification criteria for axial spondyloarthritis (part II): Validation and final selection. Ann. Rheum. Dis. 2009, 68, 777–783. [Google Scholar] [CrossRef] [Green Version]
- Calin, A.; Garrett, S.; Whitelock, H.; Kennedy, L.G.; O’Hea, J.; Mallorie, P.; Jenkinson, T. A new approach to defining functional ability in ankylosing spondylitis: The development of the Bath Ankylosing Spondylitis Functional Index. J. Rheumatol. 1994, 21, 2281–2285. [Google Scholar]
- Garrett, S.; Jenkinson, T.; Kennedy, L.G.; Whitelock, H.; Gaisford, P.; Calin, A. A new approach to defining disease status in ankylosing spondylitis: The Bath Ankylosing Spondylitis Disease Activity Index. J. Rheumatol. 1994, 21, 2286–2291. [Google Scholar] [PubMed]
- van der Heijde, D.; Landewé, R.; Feldtkeller, E. Proposal of a linear definition of the Bath Ankylosing Spondylitis Metrology Index (BASMI) and comparison with the 2-step and 10-step definitions. Ann. Rheum. Dis. 2008, 67, 489–493. [Google Scholar] [CrossRef]
- Mokkink, L.B.; Terwee, C.B.; Patrick, D.L.; Alonso, J.; Stratford, P.W.; Knol, D.L.; Bouter, L.M.; de Vet, H.C. The COSMIN study reached international consensus on taxonomy, terminology, and definitions of measurement properties for health-related patient-reported outcomes. J. Clin. Epidemiol. 2010, 63, 737–745. [Google Scholar] [CrossRef] [Green Version]
- Geisser, M.E.; Haig, A.J.; Wallbom, A.S.; Wiggert, E.A. 400 Pain-related fear, lumbar flexion, and dynamic EMG among persons with chronic musculoskeletal low back pain. Clin. J. Pain 2004, 20, 61–69. [Google Scholar] [CrossRef]
- Boucher, J.A.; Preuss, R.; Henry, S.M.; Nugent, M.; Larivière, C. Trunk postural adjustments: Medium-term reliability and correlation with changes of clinical outcomes following an 8-week lumbar stabilization exercise program. J. Electromyogr. Kinesiol. 2018, 41, 66–76. [Google Scholar] [CrossRef]
- Russo, M.; Deckers, K.; Eldabe, S.; Kiesel, K.; Gilligan, C.; Vieceli, J.; Crosby, P. Muscle Control and Non-specific Chronic Low Back Pain. Neuromodulation 2018, 21, 1–9. [Google Scholar] [CrossRef] [Green Version]
- Granata, K.P.; Marras, W.S. Cost-benefit of muscle cocontraction in protecting against spinal instability. Spine 2000, 25, 1398–1404. [Google Scholar] [CrossRef]
- Ozturk, E.C.; Yagci, I. The structural, functional and electrophysiological assessment of paraspinal musculature of patients with ankylosing spondylitis and non-radiographic axial spondyloarthropathy. Rheumatol. Int. 2021. [Google Scholar] [CrossRef]
- Zhang, Y.; Xu, H.; Hu, X.; Zhang, C.; Chu, T.; Zhou, Y. Histopathological changes in supraspinous ligaments, ligamentum flava and paraspinal muscle tissues of patients with ankylosing spondylitis. Int. J. Rheum. Dis. 2016, 19, 420–429. [Google Scholar] [CrossRef] [PubMed]
- Pena-Amaro, J.; Luque, E.; Jimena, I.; Noguera, F.; Castilla, S.; Vaamonde, R. Abnormalities in tenectomized muscle fiber repair. Eur. J. Anat. 2019, 11, 37–45. [Google Scholar]
- Jamali, A.A.; Afshar, P.; Abrams, R.A.; Lieber, R.L. Skeletal muscle response to tenotomy. Muscle Nerve 2000, 23, 851–862. [Google Scholar] [CrossRef]
- Zügel, M.; Maganaris, C.N.; Wilke, J.; Jurkat-Rott, K.; Klingler, W.; Wearing, S.C.; Findley, T.; Barbe, M.F.; Steinacker, J.M.; Vleeming, A.; et al. Fascial tissue research in sports medicine: From molecules to tissue adaptation, injury and diagnostics: Consensus statement. Br. J. Sports Med. 2018, 52, 1497. [Google Scholar] [CrossRef] [PubMed] [Green Version]
- Csapo, R.; Gumpenberger, M.; Wessner, B. Skeletal Muscle Extracellular Matrix–What Do We Know About Its Composition, Regulation, and Physiological Roles? A Narrative Review. Front. Physiol. 2020, 11, 253. [Google Scholar] [CrossRef] [Green Version]
- Pullman, S.L.; Goodin, D.S.; Marquinez, A.I.; Tabbal, S.; Rubin, M. Clinical utility of surface EMG Report of the Therapeutics and Technology Assessment Subcommittee of the American Academy of Neurology. Neurology 2000, 55, 171–177. [Google Scholar] [CrossRef] [PubMed] [Green Version]
- Zwarts, M.J.; Stegeman, D.F. Multichannel surface EMG: Basic aspects and clinical utility. Muscle Nerve 2003, 28, 1–17. [Google Scholar] [CrossRef]
- Mohseni Bandpei, M.A.; Rahmani, N.; Majdoleslam, B.; Abdollahi, I.; Ali, S.S.; Ahmad, A. Reliability of surface electromyography in the assessment of paraspinal muscle fatigue: An updated systematic review. J. Manip. Physiol. Ther. 2014, 37, 510–521. [Google Scholar] [CrossRef]


| Demographic Data | axSpA Group n = 39 | Control Group n = 35 | p |
|---|---|---|---|
| Age (±SD) years | 46 (8.06) | 42 (11.89) | 0.115 |
| Sex (%) men | 29 (74.4%) | 27 (77.1%) | 0.780 |
| women | 10 (25.6%) | 8 (22.9%) | |
| Weight (±SD) kg | 80.4 (17.2) | 78.9 (16.1) | 0.702 |
| Height (±SD) m | 1.7 (0.6) | 1.7 (0.8) | 0.197 |
| BMI (SD) | 27.6 (5.8) | 26.1 (3.8) | 0.211 |
| axSpA n = 39 | Control n = 35 | p (1) | Active axSpA n = 22 | Non Active axSpA n = 17 | p (2) | p (3) | ICC | |
|---|---|---|---|---|---|---|---|---|
| FRR | 2.40 (1.89) | 7.13 (6.64) | *** | 1.51 (1.05) | 3.11 (2.11) | ** | ** | 0.682 |
| 1/FRR | 0.66 (0.39) | 0.25 (0.19) | *** | 0.82 (0.31) | 0.57 (0.42) | ** | ** | 0.938 |
| Flx/Ext | 0.60 (0.32) | 0.59 (0.39) | N.S. | 0.67 (0.30) | 0.57 (0.34) | N.S. | N.S. | 0.560 |
| Standing | 9.35 (4.92) | 9.57 (4.20) | N.S. | 6.59 (2.18) | 10.47 (5.19) | ** | N.S. | 0.840 |
| Flexion | 20.38 (11.62) | 36.50 (20.09) | *** | 16.96 (10.86) | 21.20 (11.37) | N.S. | *** | 0.817 |
| Relaxation | 13.08 (11.69) | 6.87 (4.02) | ** | 14.60 (11.59) | 10.54 (10.94) | N.S. | N.S. | 0.631 |
| Extension | 39.07 (23.45) | 66.09 (25.53) | *** | 23.48 (12.40) | 46.49 (23.28) | *** | ** | 0.927 |
| Age | Lat. Flex. | Schober | Cerv. Rot. | BASDAI | BASFI | BASMI | |
|---|---|---|---|---|---|---|---|
| FRR | −0.19 | 0.60 *** | 0.53 *** | 0.26 | −0.39 * | −0.44 ** | −0.59 *** |
| 1/FRR | 0.27 | −0.71 *** | −0.55 *** | −0.27 | 0.38 * | 0.52 *** | 0.65 *** |
| Flx/Ext | 0.05 | −0.40 * | −0.45 ** | 0 | 0.19 | 0.12 | 0.39 * |
| Standing | 0.02 | 0.16 | −0.1 | 0.17 | −0.35 * | −0.23 | −0.15 |
| Flexion | −0.01 | 0.24 | −0.08 | 0.18 | −0.26 | −0.28 | −0.18 |
| Relaxation | 0.18 | −0.24 | −0.40 * | −0.1 | 0.14 | 0.15 | 0.29 |
| Extension | −0.1 | 0.60 *** | 0.31 | 0.43 ** | −0.50 ** | −0.47 ** | −0.60 *** |
Publisher’s Note: MDPI stays neutral with regard to jurisdictional claims in published maps and institutional affiliations. |
© 2021 by the authors. Licensee MDPI, Basel, Switzerland. This article is an open access article distributed under the terms and conditions of the Creative Commons Attribution (CC BY) license (https://creativecommons.org/licenses/by/4.0/).
Share and Cite
Aranda-Valera, I.C.; Garrido-Castro, J.L.; Martínez-Galisteo, A.; Peña-Amaro, J.; González-Navas, C.; Cuesta-Vargas, A.; Jiménez-Reina, L.; Collantes-Estévez, E.; López-Medina, C. Patients with Axial Spondyloarthritis Show an Altered Flexion/Relaxation Phenomenon. Diagnostics 2021, 11, 810. https://0-doi-org.brum.beds.ac.uk/10.3390/diagnostics11050810
Aranda-Valera IC, Garrido-Castro JL, Martínez-Galisteo A, Peña-Amaro J, González-Navas C, Cuesta-Vargas A, Jiménez-Reina L, Collantes-Estévez E, López-Medina C. Patients with Axial Spondyloarthritis Show an Altered Flexion/Relaxation Phenomenon. Diagnostics. 2021; 11(5):810. https://0-doi-org.brum.beds.ac.uk/10.3390/diagnostics11050810
Chicago/Turabian StyleAranda-Valera, I. Concepción, Juan Luis Garrido-Castro, Alfonso Martínez-Galisteo, José Peña-Amaro, Cristina González-Navas, Antonio Cuesta-Vargas, Luis Jiménez-Reina, Eduardo Collantes-Estévez, and Clementina López-Medina. 2021. "Patients with Axial Spondyloarthritis Show an Altered Flexion/Relaxation Phenomenon" Diagnostics 11, no. 5: 810. https://0-doi-org.brum.beds.ac.uk/10.3390/diagnostics11050810