
Generation of Synthetic Chest X-ray Images and Detection of COVID-19: A Deep Learning Based Approach


Abstract
:1. Introduction
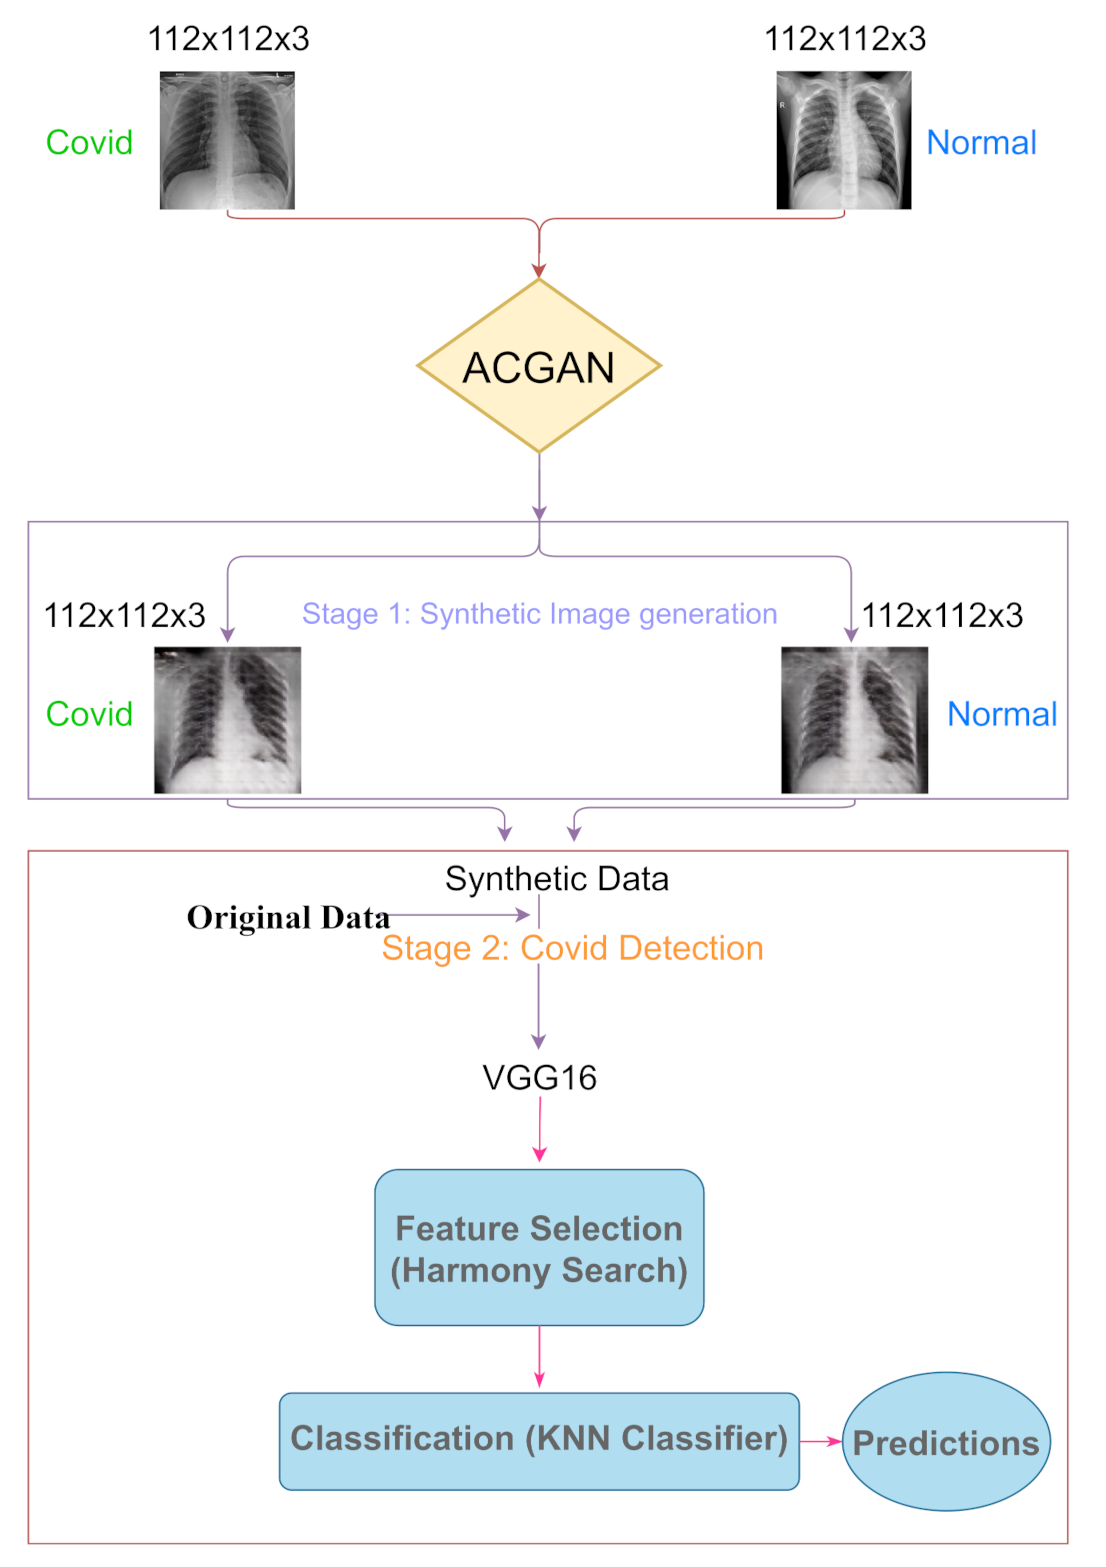
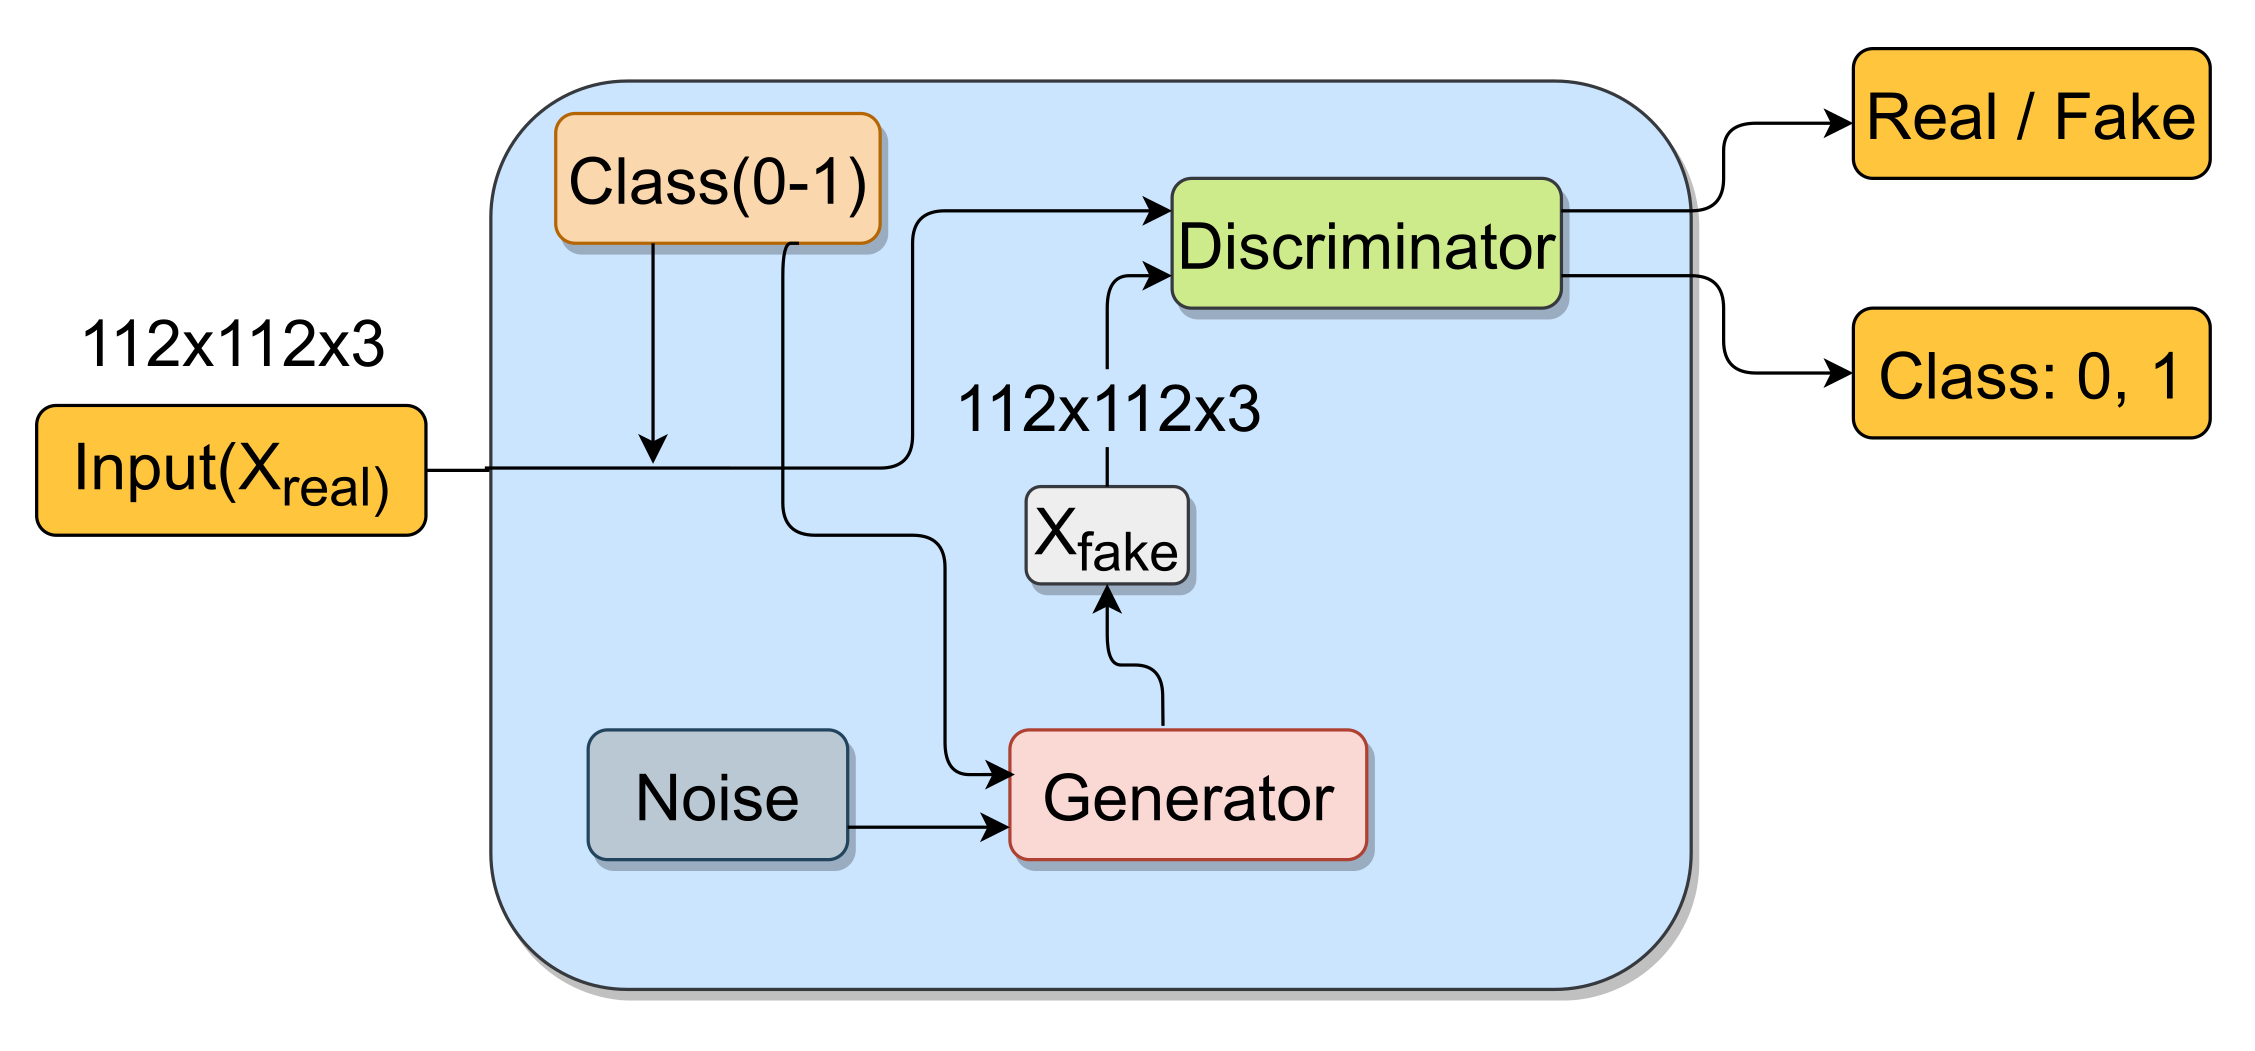
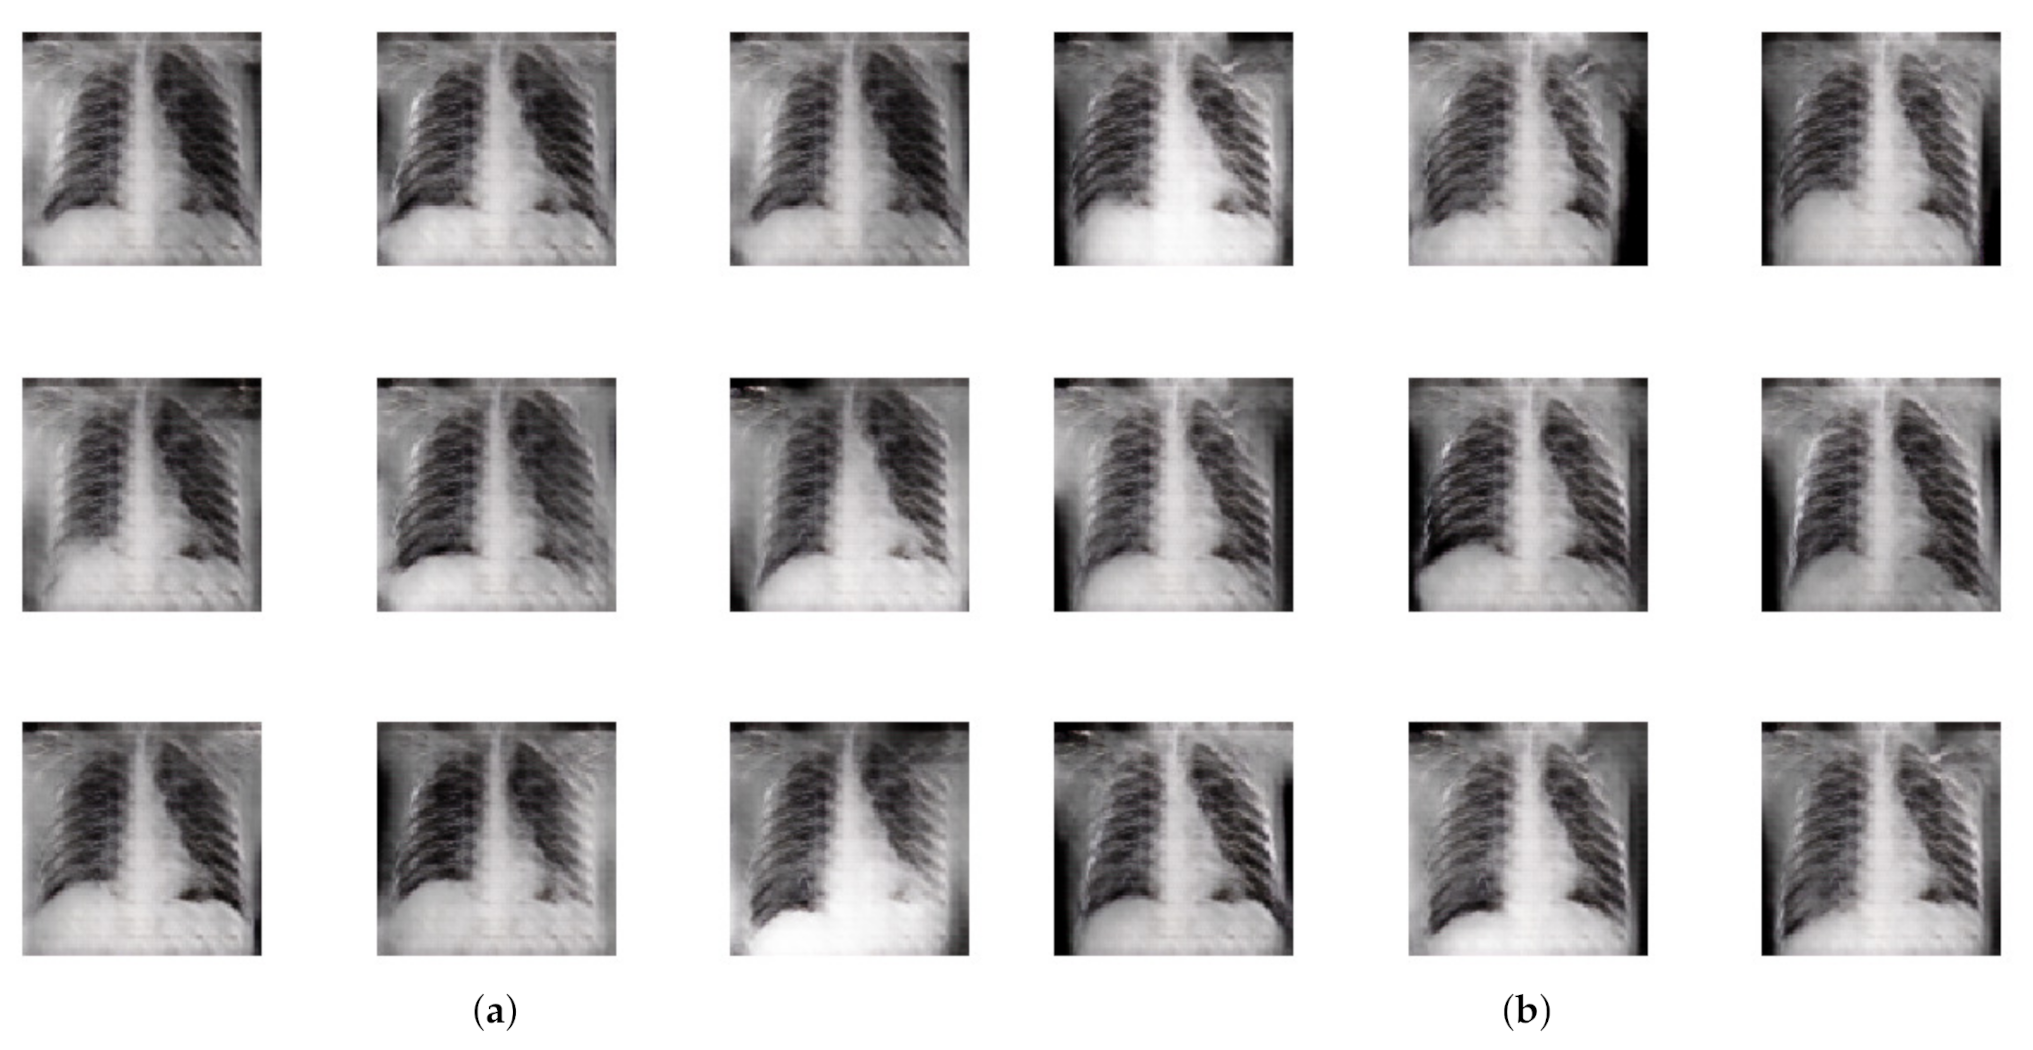
- An ACGAN based approach is applied to generate synthetic CXRs of normal and COVID-19 affected patients.
- Label smoothing is applied in the ACGAN.
- Some recent CNN based classifiers are trained on the synthetic images for detecting COVID-19 in the CXR.
- Feature selection is performed on the CNN extracted feature vector using the HS algorithm for reducing the dimension of the feature vector.
2. Related Work
3. Materials and Methods
3.1. Synthetic Image Generation
3.1.1. Generator
3.1.2. Discriminator
3.1.3. Training
3.1.4. Label Smoothing
3.2. COVID-19 Detection
3.2.1. VGG
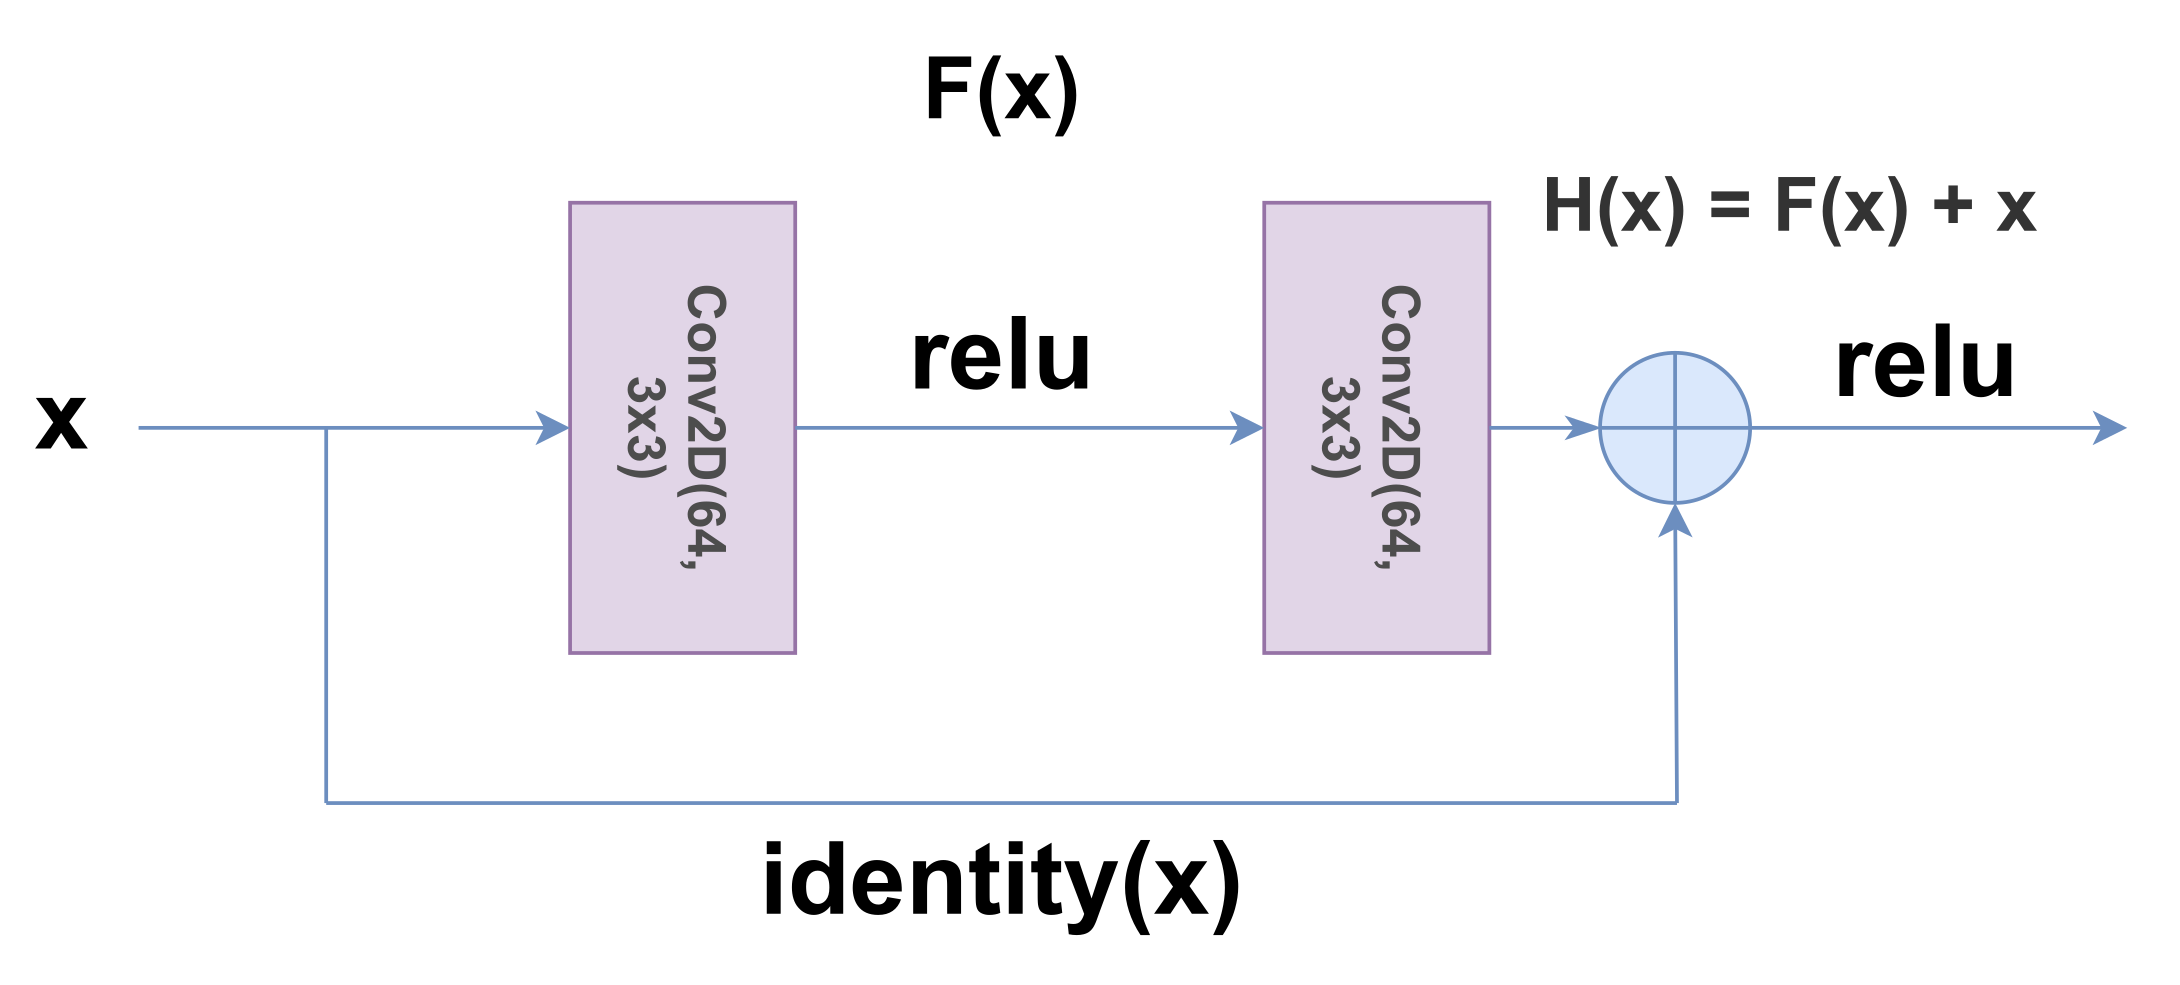
3.2.2. ResNet
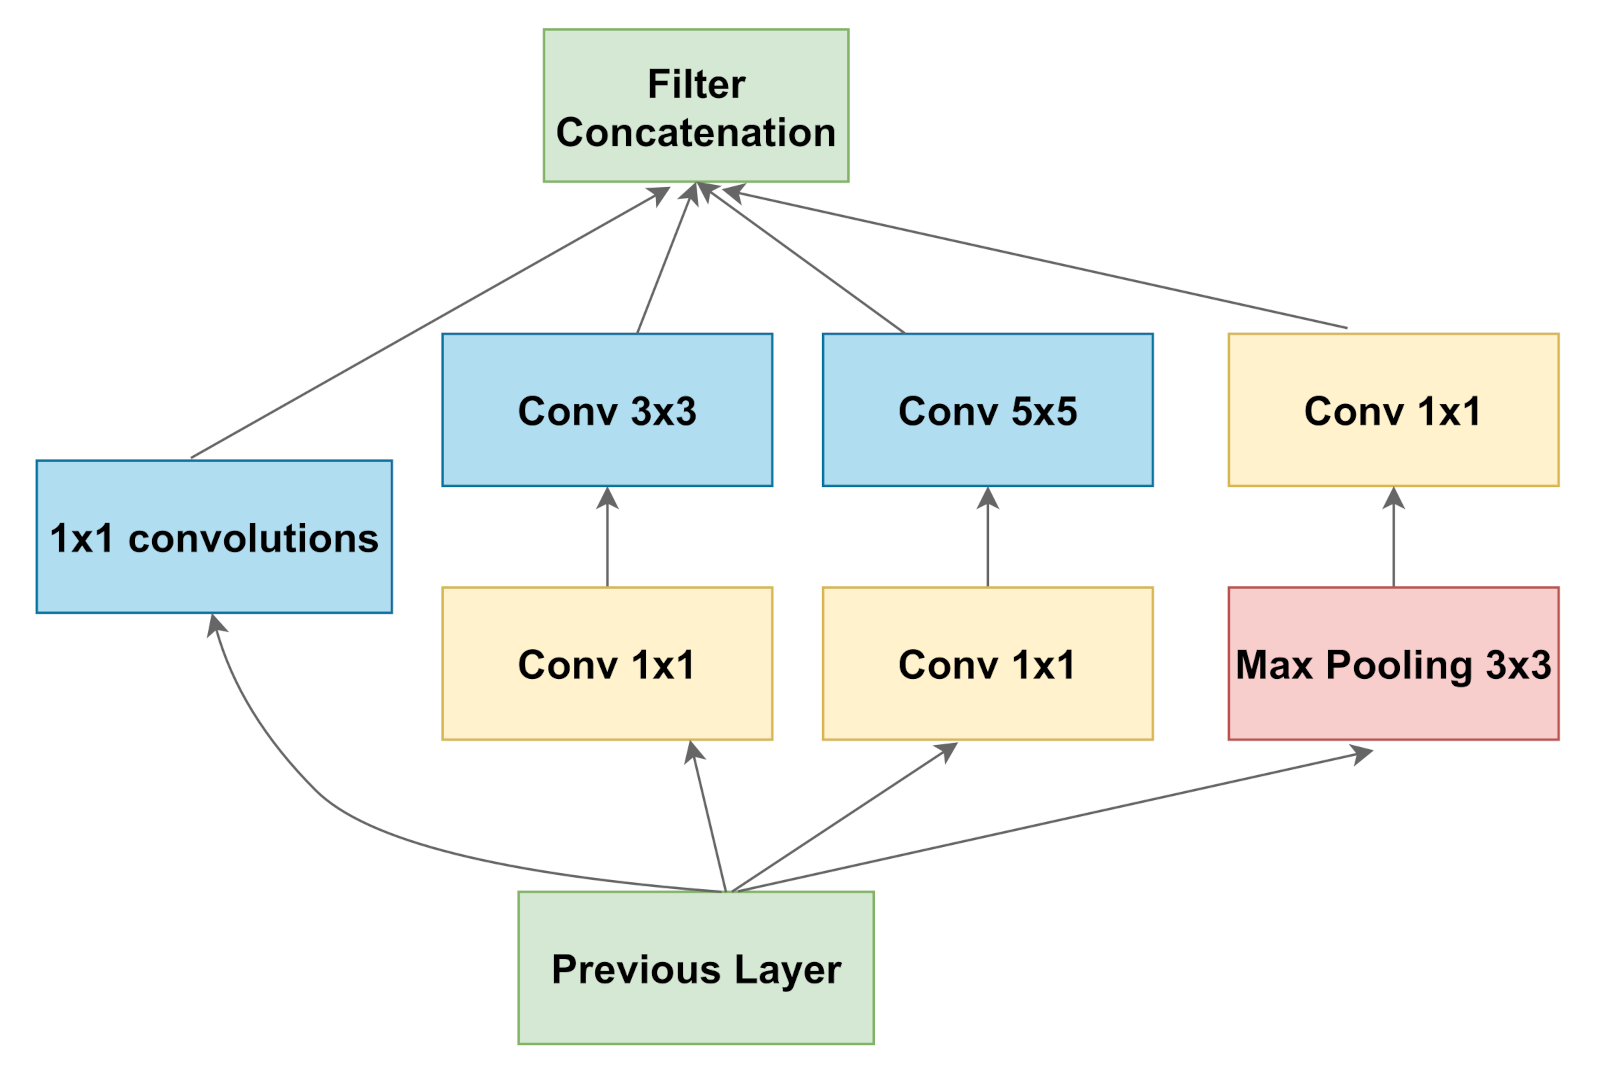
3.2.3. Inception
3.2.4. Xception
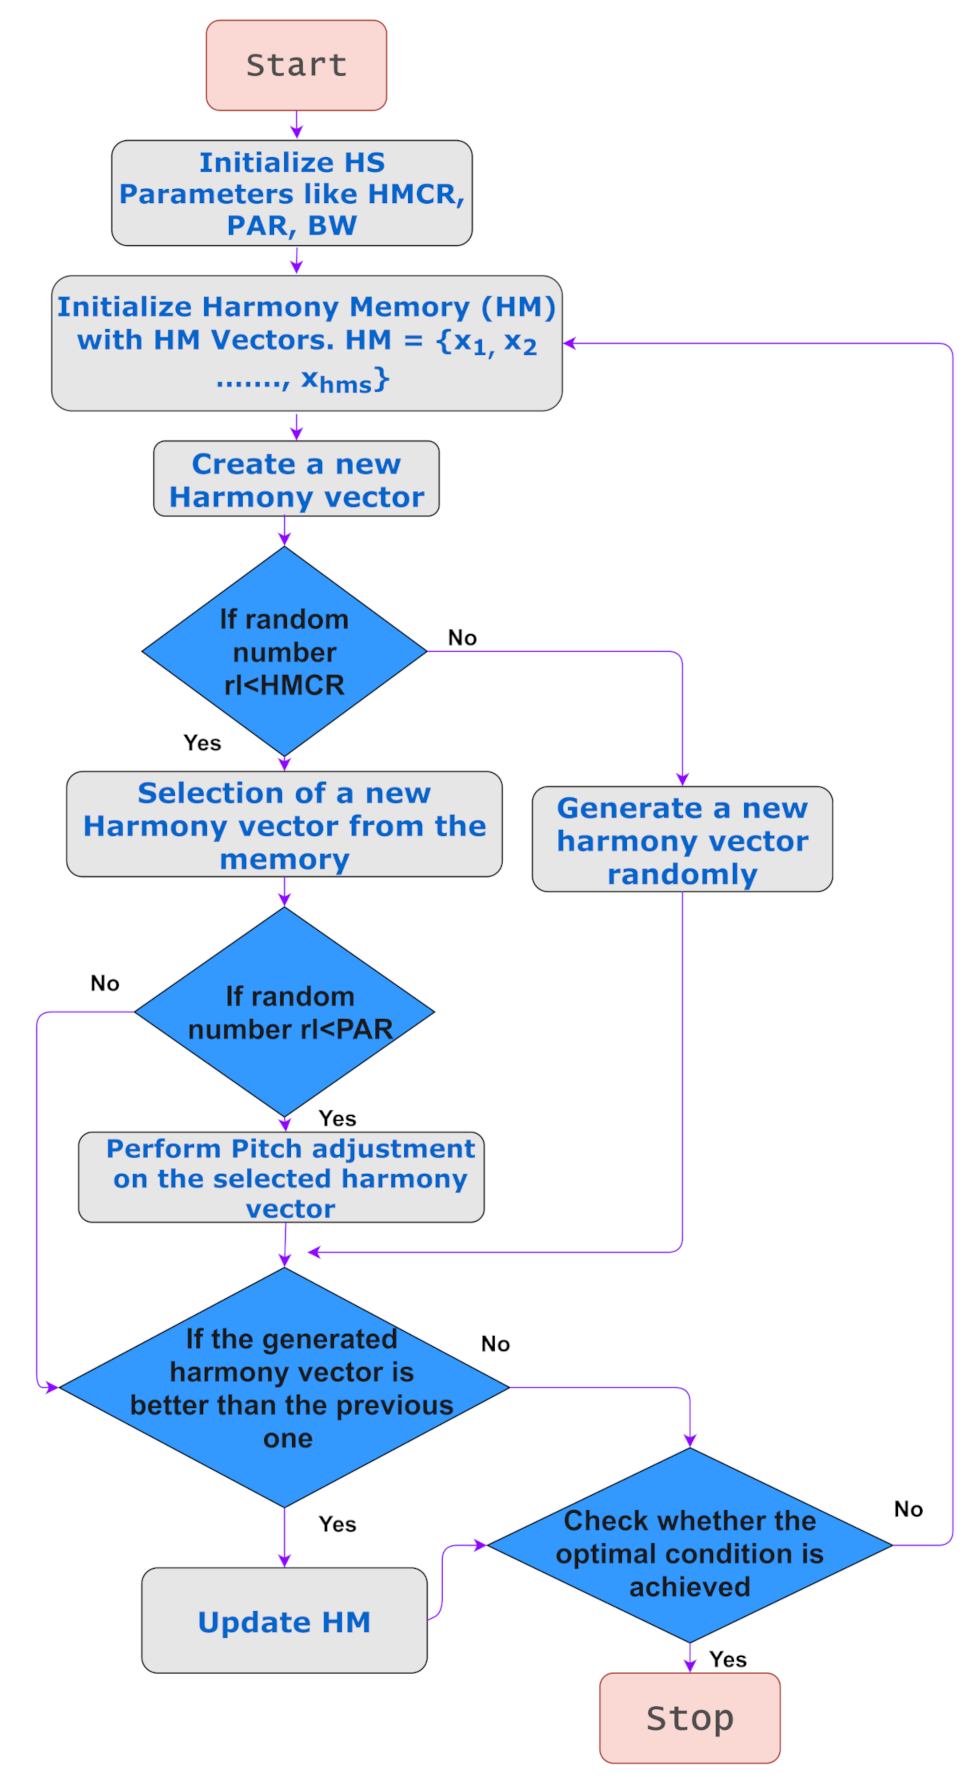
3.3. Feature Selection
- Initialize an HM.
- Devise a new harmony from the HM.
- If the new harmony has a better fitness than the worst harmony, then replace the worst with the current harmony.
- If the stopping criterion is met, then stop; else, continue from step 2.
3.4. Dataset Used
4. Results
5. Discussion
6. Conclusions
Author Contributions
Funding
Institutional Review Board Statement
Informed Consent Statement
Data Availability Statement
Acknowledgments
Conflicts of Interest
References
- Nicholls, S.M.; Poplawski, R.; Bull, M.J.; Underwood, A.; Chapman, M.; Abu-Dahab, K.; Taylor, B.; Jackson, B.; Rey, S.; Amato, R.; et al. MAJORA: Continuous integration supporting decentralised sequencing for SARS-CoV-2 genomic surveillance. bioRxiv 2020. [Google Scholar] [CrossRef]
- Chen, N.; Zhou, M.; Dong, X.; Qu, J.; Gong, F.; Han, Y.; Qiu, Y.; Wang, J.; Liu, Y.; Wei, Y.; et al. Epidemiological and clinical characteristics of 99 cases of 2019 novel coronavirus pneumonia in Wuhan, China: A descriptive study. Lancet 2020, 395, 507–513. [Google Scholar] [CrossRef] [Green Version]
- Wong, A.; Lin, Z.; Wang, L.; Chung, A.; Shen, B.; Abbasi, A.; Hoshmand-Kochi, M.; Duong, T. Towards computer-aided severity assessment via deep neural networks for geographic and opacity extent scoring of SARS-CoV-2 chest X-rays. Sci. Rep. 2021, 11, 1–8. [Google Scholar] [CrossRef]
- Toussie, D.; Voutsinas, N.; Finkelstein, M.; Cedillo, M.A.; Manna, S.; Maron, S.Z.; Jacobi, A.; Chung, M.; Bernheim, A.; Eber, C.; et al. Clinical and chest radiography features determine patient outcomes in young and middle-aged adults with COVID-19. Radiology 2020, 297, E197–E206. [Google Scholar] [CrossRef] [PubMed]
- Shen, B.; Hoshmand-Kochi, M.; Abbasi, A.; Glass, S.; Jiang, Z.; Singer, A.; Thode, H.; Li, H.; Hou, W.; Duong, T. Initial chest radiograph scores inform COVID-19 status, intensive care unit admission and need for mechanical ventilation. Clin. Radiol. 2021, 76, 473.e1–473.e7. [Google Scholar] [CrossRef] [PubMed]
- Li, M.D.; Arun, N.T.; Gidwani, M.; Chang, K.; Deng, F.; Little, B.P.; Mendoza, D.P.; Lang, M.; Lee, S.I.; O’Shea, A.; et al. Automated assessment and tracking of COVID-19 pulmonary disease severity on chest radiographs using convolutional siamese neural networks. Radiol. Artif. Intell. 2020, 2, e200079. [Google Scholar] [CrossRef] [PubMed]
- Zhu, J.; Shen, B.; Abbasi, A.; Hoshmand-Kochi, M.; Li, H.; Duong, T.Q. Deep transfer learning artificial intelligence accurately stages COVID-19 lung disease severity on portable chest radiographs. PLoS ONE 2020, 15, e0236621. [Google Scholar] [CrossRef] [PubMed]
- Akram, T.; Attique, M.; Gul, S.; Shahzad, A.; Altaf, M.; Naqvi, S.S.R.; Damaševičius, R.; Maskeliūnas, R. A novel framework for rapid diagnosis of COVID-19 on computed tomography scans. Pattern Anal. Appl. 2021, 1–14. [Google Scholar] [CrossRef]
- Jaiswal, A.; Gianchandani, N.; Singh, D.; Kumar, V.; Kaur, M. Classification of the COVID-19 infected patients using DenseNet201 based deep transfer learning. J. Biomol. Struct. Dyn. 2020, 1–8. [Google Scholar] [CrossRef]
- Sahlol, A.T.; Yousri, D.; Ewees, A.A.; Al-Qaness, M.A.; Damasevicius, R.; Abd Elaziz, M. COVID-19 image classification using deep features and fractional-order marine predators algorithm. Sci. Rep. 2020, 10, 1–15. [Google Scholar] [CrossRef]
- Apostolopoulos, I.D.; Mpesiana, T.A. Covid-19: Automatic detection from X-ray images utilizing transfer learning with convolutional neural networks. Phys. Eng. Sci. Med. 2020, 43, 635–640. [Google Scholar] [CrossRef] [Green Version]
- Kikkisetti, S.; Zhu, J.; Shen, B.; Li, H.; Duong, T.Q. Deep-learning convolutional neural networks with transfer learning accurately classify COVID-19 lung infection on portable chest radiographs. PeerJ 2020, 8, e10309. [Google Scholar] [CrossRef]
- Ozturk, T.; Talo, M.; Yildirim, E.A.; Baloglu, U.B.; Yildirim, O.; Acharya, U.R. Automated detection of COVID-19 cases using deep neural networks with X-ray images. Comput. Biol. Med. 2020, 121, 103792. [Google Scholar] [CrossRef]
- Saha, P.; Mukherjee, D.; Singh, P.K.; Ahmadian, A.; Ferrara, M.; Sarkar, R. GraphCovidNet: A graph neural network based model for detecting COVID-19 from CT scans and X-rays of chest. Sci. Rep. 2021, 11, 1–16. [Google Scholar] [CrossRef]
- Das, S.; Roy, S.D.; Malakar, S.; Velásquez, J.D.; Sarkar, R. Bi-Level Prediction Model for Screening COVID-19 Patients Using Chest X-Ray Images. Big Data Res. 2021, 25, 100233. [Google Scholar] [CrossRef]
- Waheed, A.; Goyal, M.; Gupta, D.; Khanna, A.; Al-Turjman, F.; Pinheiro, P.R. CovidGAN: Data Augmentation Using Auxiliary Classifier GAN for Improved Covid-19 Detection. IEEE Access 2020, 8, 91916–91923. [Google Scholar] [CrossRef]
- Loey, M.; Manogaran, G.; Khalifa, N. A deep transfer learning model with classical data augmentation and CGAN to detect COVID-19 from chest CT radiography digital images. Neural Comput. Appl. 2020. [Google Scholar] [CrossRef]
- Rajaraman, S.; Antani, S. Weakly labeled data augmentation for deep learning: A study on covid-19 detection in chest X-rays. Diagnostics 2020, 10, 358. [Google Scholar] [CrossRef]
- Goodfellow, I.; Pouget-Abadie, J.; Mirza, M.; Xu, B.; Warde-Farley, D.; Ozair, S.; Courville, A.; Bengio, Y. Generative adversarial nets. In Advances in Neural Information Processing Systems; Ghahramani, Z., Welling, M., Cortes, C., Lawrence, N., Weinberger, K.Q., Eds.; Curran Associates, Inc.: Red Hook, NY, USA, 2014; Volume 27, pp. 2672–2680. [Google Scholar]
- Müller, R.; Kornblith, S.; Hinton, G.E. When does label smoothing help? In Advances in Neural Information Processing Systems; Wallach, H., Larochelle, H., Beygelzimer, A., d’Alché-Buc, F., Fox, E., Garnett, R., Eds.; Curran Associates, Inc.: Red Hook, NY, USA, 2019; Volume 32, pp. 4694–4703. [Google Scholar]
- Simonyan, K.; Zisserman, A. Very deep convolutional networks for large-scale image recognition. arXiv 2014, arXiv:1409.1556. [Google Scholar]
- He, K.; Zhang, X.; Ren, S.; Sun, J. Deep residual learning for image recognition. In Proceedings of the IEEE Conference on Computer Vision and Pattern Recognition, Las Vegas, NV, USA, 27–30 June 2016; pp. 770–778. [Google Scholar]
- Chollet, F. Xception: Deep learning with depthwise separable convolutions. In Proceedings of the IEEE Conference on Computer Vision and Pattern Recognition, Honolulu, HI, USA, 21–26 July 2017; pp. 1251–1258. [Google Scholar]
- Szegedy, C.; Vanhoucke, V.; Ioffe, S.; Shlens, J.; Wojna, Z. Rethinking the inception architecture for computer vision. In Proceedings of the IEEE Conference on Computer Vision and Pattern Recognition, Las Vegas, NV, USA, 27–30 June 2016; pp. 2818–2826. [Google Scholar]
- Geem, Z.W.; Kim, J.H.; Loganathan, G.V. A new heuristic optimization algorithm: Harmony search. Simulation 2001, 76, 60–68. [Google Scholar] [CrossRef]
- Haripriya, P.; Porkodi, R. Parallel deep convolutional neural network for content based medical image retrieval. J. Ambient. Intell. Humaniz. Comput. 2020, 12, 1–15. [Google Scholar] [CrossRef]
- Odena, A.; Olah, C.; Shlens, J. Conditional Image Synthesis with Auxiliary Classifier GANs. In Proceedings of the 34th International Conference on Machine Learning ICML’17, Sydney, Australia, 6–11 August 2017; Volume 70, pp. 2642–2651. [Google Scholar]
- Chan, M.H.; Noor, M.H.M. A unified generative model using generative adversarial network for activity recognition. J. Ambient. Intell. Humaniz. Comput. 2020, 1–10. [Google Scholar] [CrossRef]
- Sun, X.; Xu, J.; Ma, Y.; Zhao, T.; Ou, S.; Peng, L. Blind image separation based on attentional generative adversarial network. J. Ambient. Intell. Humaniz. Comput. 2020, 1–8. [Google Scholar] [CrossRef]
- Armanious, K.; Jiang, C.; Fischer, M.; Küstner, T.; Hepp, T.; Nikolaou, K.; Gatidis, S.; Yang, B. MedGAN: Medical image translation using GANs. Comput. Med. Imaging Graph. 2020, 79, 101684. [Google Scholar] [CrossRef] [PubMed]
- Wolterink, J.M.; Leiner, T.; Viergever, M.A.; Išgum, I. Generative Adversarial Networks for Noise Reduction in Low-Dose CT. IEEE Trans. Med. Imaging 2017, 36, 2536–2545. [Google Scholar] [CrossRef] [PubMed]
- Han, C.; Rundo, L.; Araki, R.; Nagano, Y.; Furukawa, Y.; Mauri, G.; Nakayama, H.; Hayashi, H. Combining noise-to-image and image-to-image GANs: Brain MR image augmentation for tumor detection. IEEE Access 2019, 7, 156966–156977. [Google Scholar] [CrossRef]
- Dirvanauskas, D.; Maskeliūnas, R.; Raudonis, V.; Damaševičius, R.; Scherer, R. Hemigen: Human embryo image generator based on generative adversarial networks. Sensors 2019, 19, 3578. [Google Scholar] [CrossRef] [PubMed] [Green Version]
- Isola, P.; Zhu, J.Y.; Zhou, T.; Efros, A.A. Image-to-image translation with conditional adversarial networks. In Proceedings of the IEEE Conference on Computer Vision and Pattern Recognition, Honolulu, HI, USA, 21–26 July 2017; pp. 1125–1134. [Google Scholar]
- Ledig, C.; Theis, L.; Huszár, F.; Caballero, J.; Cunningham, A.; Acosta, A.; Aitken, A.; Tejani, A.; Totz, J.; Wang, Z.; et al. Photo-realistic single image super-resolution using a generative adversarial network. In Proceedings of the IEEE Conference on Computer Vision and Pattern Recognition, Honolulu, HI, USA, 21–26 July 2017; pp. 4681–4690. [Google Scholar]
- Basu, A.; Mondal, R.; Bhowmik, S.; Sarkar, R. U-Net versus Pix2Pix: A comparative study on degraded document image binarization. J. Electron. Imaging 2020, 29, 063019. [Google Scholar] [CrossRef]
- De, R.; Chakraborty, A.; Sarkar, R. Document Image Binarization Using Dual Discriminator Generative Adversarial Networks. IEEE Signal Process. Lett. 2020, 27, 1090–1094. [Google Scholar] [CrossRef]
- Kundu, S.; Paul, S.; Bera, S.K.; Abraham, A.; Sarkar, R. Text-line extraction from handwritten document images using GAN. Expert Syst. Appl. 2020, 140, 112916. [Google Scholar] [CrossRef]
- Mondal, R.; Bhowmik, S.; Sarkar, R. tsegGAN: A Generative Adversarial Network for Segmenting Touching Nontext Components From Text Ones in Handwriting. IEEE Trans. Instrum. Meas. 2020, 70, 1–10. [Google Scholar] [CrossRef]
- Goel, T.; Murugan, R.; Mirjalili, S.; Chakrabartty, D.K. OptCoNet: An optimized convolutional neural network for an automatic diagnosis of COVID-19. Appl. Intell. 2020, 51, 1–16. [Google Scholar] [CrossRef]
- Rajaraman, S.; Siegelman, J.; Alderson, P.O.; Folio, L.S.; Folio, L.R.; Antani, S.K. Iteratively Pruned Deep Learning Ensembles for COVID-19 Detection in Chest X-rays. IEEE Access 2020, 8, 115041–115050. [Google Scholar] [CrossRef]
- Gianchandani, N.; Jaiswal, A.; Singh, D.; Kumar, V.; Kaur, M. Rapid COVID-19 diagnosis using ensemble deep transfer learning models from chest radiographic images. J. Ambient. Intell. Humaniz. Comput. 2020, 1–13. [Google Scholar] [CrossRef]
- Murugan, R.; Goel, T. E-DiCoNet: Extreme learning machine based classifier for diagnosis of COVID-19 using deep convolutional network. J. Ambient. Intell. Humaniz. Comput. 2021, 1–12. [Google Scholar] [CrossRef]
- Garain, A.; Basu, A.; Giampaolo, F.; Velasquez, J.D.; Sarkar, R. Detection of COVID-19 from CT scan images: A spiking neural network based approach. Neural Comput. Appl. 2021. [Google Scholar] [CrossRef]
- Sen, S.; Saha, S.; Chatterjee, S.; Mirjalili, S.; Sarkar, R. A bi-stage feature selection approach for COVID-19 prediction using chest CT images. Appl. Intell. 2021. [Google Scholar] [CrossRef]
- Saha, S.; Ghosh, M.; Ghosh, S.; Sen, S.; Singh, P.K.; Geem, Z.W.; Sarkar, R. Feature selection for facial emotion recognition using cosine similarity based harmony search algorithm. Appl. Sci. 2020, 10, 2816. [Google Scholar] [CrossRef] [Green Version]
- Sarkar, S.S.; Sheikh, K.H.; Mahanty, A.; Mali, K.; Ghosh, A.; Sarkar, R. A Harmony Search-Based Wrapper-Filter Feature Selection Approach for Microstructural Image Classification. Integr. Mater. Manuf. Innov. 2021, 10, 1–19. [Google Scholar] [CrossRef]
- Bhattacharyya, T.; Chatterjee, B.; Singh, P.K.; Yoon, J.H.; Geem, Z.W.; Sarkar, R. Mayfly in harmony: A new hybrid meta-heuristic feature selection algorithm. IEEE Access 2020, 8, 195929–195945. [Google Scholar] [CrossRef]
- Sheikh, K.H.; Ahmed, S.; Mukhopadhyay, K.; Singh, P.K.; Yoon, J.H.; Geem, Z.W.; Sarkar, R. EHHM: Electrical harmony based hybrid meta-heuristic for feature selection. IEEE Access 2020, 8, 158125–158141. [Google Scholar] [CrossRef]
- Kingma, D.P.; Ba, J. Adam: A method for stochastic optimization. arXiv 2014, arXiv:1412.6980. [Google Scholar]
- Li, W.; Dasarathy, G.; Berisha, V. Regularization via Structural Label Smoothing. In Proceedings of the Twenty Third International Conference on Artificial Intelligence and Statistics, online, 26–28 August 2020; Volume 108, pp. 1453–1463. [Google Scholar]
- Mahdavi, M.; Fesanghary, M.; Damangir, E. An improved harmony search algorithm for solving optimization problems. Appl. Math. Comput. 2007, 188, 1567–1579. [Google Scholar] [CrossRef]
- Bae, J.; Kim, M.; Lim, J.; Geem, Z. Feature Selection for Colon Cancer Detection Using K-Means Clustering and Modified Harmony Search Algorithm. Mathematics 2021, 9, 570. [Google Scholar] [CrossRef]
- Ahmed, S.; Ghosh, K.K.; Singh, P.K.; Geem, Z.W.; Sarkar, R. Hybrid of harmony search algorithm and ring theory based evolutionary algorithm for feature selection. IEEE Access 2020, 8, 102629–102645. [Google Scholar] [CrossRef]
- Cohen, J.P.; Morrison, P.; Dao, L.; Roth, K.; Duong, T.Q.; Ghassemi, M. COVID-19 Image Data Collection: Prospective Predictions Are the Future. arXiv 2020, arXiv:2006.11988. [Google Scholar]
- Khanesar, M.A.; Teshnehlab, M.; Shoorehdeli, M.A. A novel binary particle swarm optimization. In Proceedings of the IEEE 2007 Mediterranean Conference on Control & Automation, Athens, Greece, 27–29 June 2007; pp. 1–6. [Google Scholar]
- Zervoudakis, K.; Tsafarakis, S. A mayfly optimization algorithm. Comput. Ind. Eng. 2020, 145, 106559. [Google Scholar] [CrossRef]
- Faramarzi, A.; Heidarinejad, M.; Stephens, B.; Mirjalili, S. Equilibrium optimizer: A novel optimization algorithm. Knowl. Based Syst. 2020, 191, 105190. [Google Scholar] [CrossRef]
- Mirjalili, S.; Mirjalili, S.M.; Lewis, A. Grey wolf optimizer. Adv. Eng. Softw. 2014, 69, 46–61. [Google Scholar] [CrossRef] [Green Version]
- Rashedi, E.; Nezamabadi-Pour, H.; Saryazdi, S. GSA: A gravitational search algorithm. Inf. Sci. 2009, 179, 2232–2248. [Google Scholar] [CrossRef]
- Mirjalili, S. SCA: A sine cosine algorithm for solving optimization problems. Knowl. Based Syst. 2016, 96, 120–133. [Google Scholar] [CrossRef]
- Salimans, T.; Goodfellow, I.; Zaremba, W.; Cheung, V.; Radford, A.; Chen, X. Improved Techniques for Training GANs. In Proceedings of the 30th International Conference on Neural Information Processing Systems, NIPS’16. Barcelona, Spain, 5–10 December 2016; Curran Associates Inc.: Red Hook, NY, USA, 2016; pp. 2234–2242. [Google Scholar]
- Heusel, M.; Ramsauer, H.; Unterthiner, T.; Nessler, B.; Hochreiter, S. GANs Trained by a Two Time-Scale Update Rule Converge to a Local Nash Equilibrium. In Proceedings of the 31st International Conference on Neural Information Processing Systems, NIPS’17. Long Beach, CA, USA, 4–7 December 2017; Curran Associates Inc.: Red Hook, NY, USA, 2017; pp. 6629–6640. [Google Scholar]
- Irfan, M.; Iftikhar, M.A.; Yasin, S.; Draz, U.; Ali, T.; Hussain, S.; Bukhari, S.; Alwadie, A.S.; Rahman, S.; Glowacz, A.; et al. Role of Hybrid Deep Neural Networks (HDNNs), Computed Tomography, and Chest X-rays for the Detection of COVID-19. Int. J. Environ. Res. Public Health 2021, 18, 3056. [Google Scholar] [CrossRef] [PubMed]
- Szaleniec, J.; Szaleniec, M.; Stręk, P.; Boroń, A.; Jabłońska, K.; Gawlik, J.; Składzień, J. Outcome prediction in endoscopic surgery for chronic rhinosinusitis—A multidimensional model. Adv. Med. Sci. 2014, 59, 13–18. [Google Scholar] [CrossRef] [PubMed]


| Dataset | COVID-19 | Normal |
|---|---|---|
| covid-chestxray-dataset [55] | 1147 | 0 |
| COVID-chestxray-dataset Initiative a | 55 | 0 |
| Actualmed COVID-19 Chest X-ray Dataset Initiative b | 247 | 0 |
| COVID-19 Radiography Database c | 1200 | 1341 |
| Dataset | Model | Accuracy (%) | Precision (%) | Recall (%) | F1-Score (%) | AUC (%) |
|---|---|---|---|---|---|---|
| Original Data + Synthetic Data | VGG16 | 99.54 ± 0.40 | 99.54 ± 0.40 | 99.54 ± 0.40 | 99.54 ± 0.40 | 99.92 ± 0.17 |
| VGG19 | 99.53 ± 0.34 | 99.53 ± 0.34 | 99.53 ± 0.34 | 99.53 ± 0.34 | 99.94 ± 0.08 | |
| ResNet50 | 99.48 ± 0.43 | 99.48 ± 0.43 | 99.48 ± 0.43 | 99.48 ± 0.43 | 99.85 ± 0.19 | |
| Xception | 96.91 ± 1.04 | 96.91 ± 1.04 | 96.91 ± 1.04 | 96.91 ± 1.04 | 99.48 ± 0.26 | |
| InceptionV3 | 99.17 ± 0.39 | 99.17 ± 0.39 | 99.17 ± 0.39 | 99.17 ± 0.39 | 99.80 ± 0.21 | |
| VGG16 + HS | 100.00 ± 0.00 | 100.00 ± 0.00 | 100.00 ± 0.00 | 100.00 ± 0.00 | 100.00 ± 0.00 | |
| Original Data | VGG16 | 99.36 ± 0.29 | 99.36 ± 0.29 | 99.36 ± 0.29 | 99.36 ± 0.29 | 99.65 ± 0.48 |
| VGG19 | 99.38 ± 0.37 | 99.38 ± 0.37 | 99.38 ± 0.37 | 99.38 ± 0.37 | 99.82 ± 0.35 | |
| ResNet50 | 99.29 ± 0.52 | 99.29 ± 0.52 | 99.29 ± 0.52 | 99.29 ± 0.52 | 99.71 ± 0.31 | |
| Xception | 95.41 ± 1.08 | 95.41 ± 1.08 | 95.41 ± 1.08 | 95.41 ± 1.08 | 99.10 ± 0.80 | |
| InceptionV3 | 97.37 ± 1.07 | 97.37 ± 1.07 | 97.37 ± 1.07 | 97.37 ± 1.07 | 99.13 ± 0.46 |
| Feature Selection Algorithm | Accuracy (%) | No. of Features | Reduction (%) |
|---|---|---|---|
| PSO [56] | 97.36 | 43 | 66.4 |
| GA | 97.36 | 46 | 64.1 |
| MA [57] | 97.36 | 62 | 51.6 |
| EO [58] | 97.36 | 51 | 60.2 |
| GWO [59] | 97.36 | 46 | 64.1 |
| GSA [60] | 100.00 | 65 | 49.2 |
| SCA [61] | 92.10 | 38 | 70.3 |
| HS [25] | 100.00 | 48 | 62.5 |
| Inception Score | Fretchet Inception Distance |
|---|---|
| 2.508 ± 0.125 | 50.67 ± 8.127 |
| Model | Accuracy (%) | F1 Score (%) | AUC (%) |
|---|---|---|---|
| VGG16 | 94.77 | 93.20 | 99.39 |
| VGG19 | 93.91 | 92.70 | 99.29 |
| ResNet50 | 96.97 | 96.88 | 99.68 |
| Xception | 91.08 | 92.41 | 99.27 |
| InceptionV3 | 92.64 | 92.85 | 99.56 |
| VGG16 + HS | 100.00 | 100.00 | 100.00 |
Publisher’s Note: MDPI stays neutral with regard to jurisdictional claims in published maps and institutional affiliations. |
© 2021 by the authors. Licensee MDPI, Basel, Switzerland. This article is an open access article distributed under the terms and conditions of the Creative Commons Attribution (CC BY) license (https://creativecommons.org/licenses/by/4.0/).
Share and Cite
Karbhari, Y.; Basu, A.; Geem, Z.W.; Han, G.-T.; Sarkar, R. Generation of Synthetic Chest X-ray Images and Detection of COVID-19: A Deep Learning Based Approach. Diagnostics 2021, 11, 895. https://0-doi-org.brum.beds.ac.uk/10.3390/diagnostics11050895
Karbhari Y, Basu A, Geem ZW, Han G-T, Sarkar R. Generation of Synthetic Chest X-ray Images and Detection of COVID-19: A Deep Learning Based Approach. Diagnostics. 2021; 11(5):895. https://0-doi-org.brum.beds.ac.uk/10.3390/diagnostics11050895
Chicago/Turabian StyleKarbhari, Yash, Arpan Basu, Zong Woo Geem, Gi-Tae Han, and Ram Sarkar. 2021. "Generation of Synthetic Chest X-ray Images and Detection of COVID-19: A Deep Learning Based Approach" Diagnostics 11, no. 5: 895. https://0-doi-org.brum.beds.ac.uk/10.3390/diagnostics11050895