
Hemodynamic Monitoring in Sepsis—A Conceptual Framework of Macro- and Microcirculatory Alterations


Abstract
:1. Introduction
2. Macrocirculation
2.1. Resuscitation Endpoints
2.1.1. Blood Pressure
2.1.2. Flow
2.1.3. Tissue Perfusion
2.2. Macrocirculation—Monitoring Toolkit
2.3. Hemodynamic Principles
2.3.1. Fluid Responsiveness
2.3.2. Fluid Tolerance
2.3.3. Ventricular–Arterial Coupling
2.3.4. Volume State Assessment
3. Hemodynamic Monitoring of the Microcirculation
3.1. The Case for Microcirculatory Assessment
3.2. Microcirculation—Monitoring Toolkit
4. Perspective
5. Conclusions
Author Contributions
Funding
Institutional Review Board Statement
Informed Consent Statement
Data Availability Statement
Acknowledgments
Conflicts of Interest
Appendix A

| Cardiac Pathology | Tools |
|---|---|
| Echocardiography
|
| |
| |
| |
| |
| |
| |
| |
| |
| |
| Echocardiography (CO), arterial line (MAP) and central venous line (CVP) |
| Hemodynamic Principles Cardiovascular Performance and Functional Reserve | Tools |
| Echocardiography
|
| Ultrasound
|
| Echocardiography (SV, LVEF, PET, TET) and arterial line (SAP, DAP) |
| Echocardiography (CO), arterial line (MAP) and central venous line (CVP) |
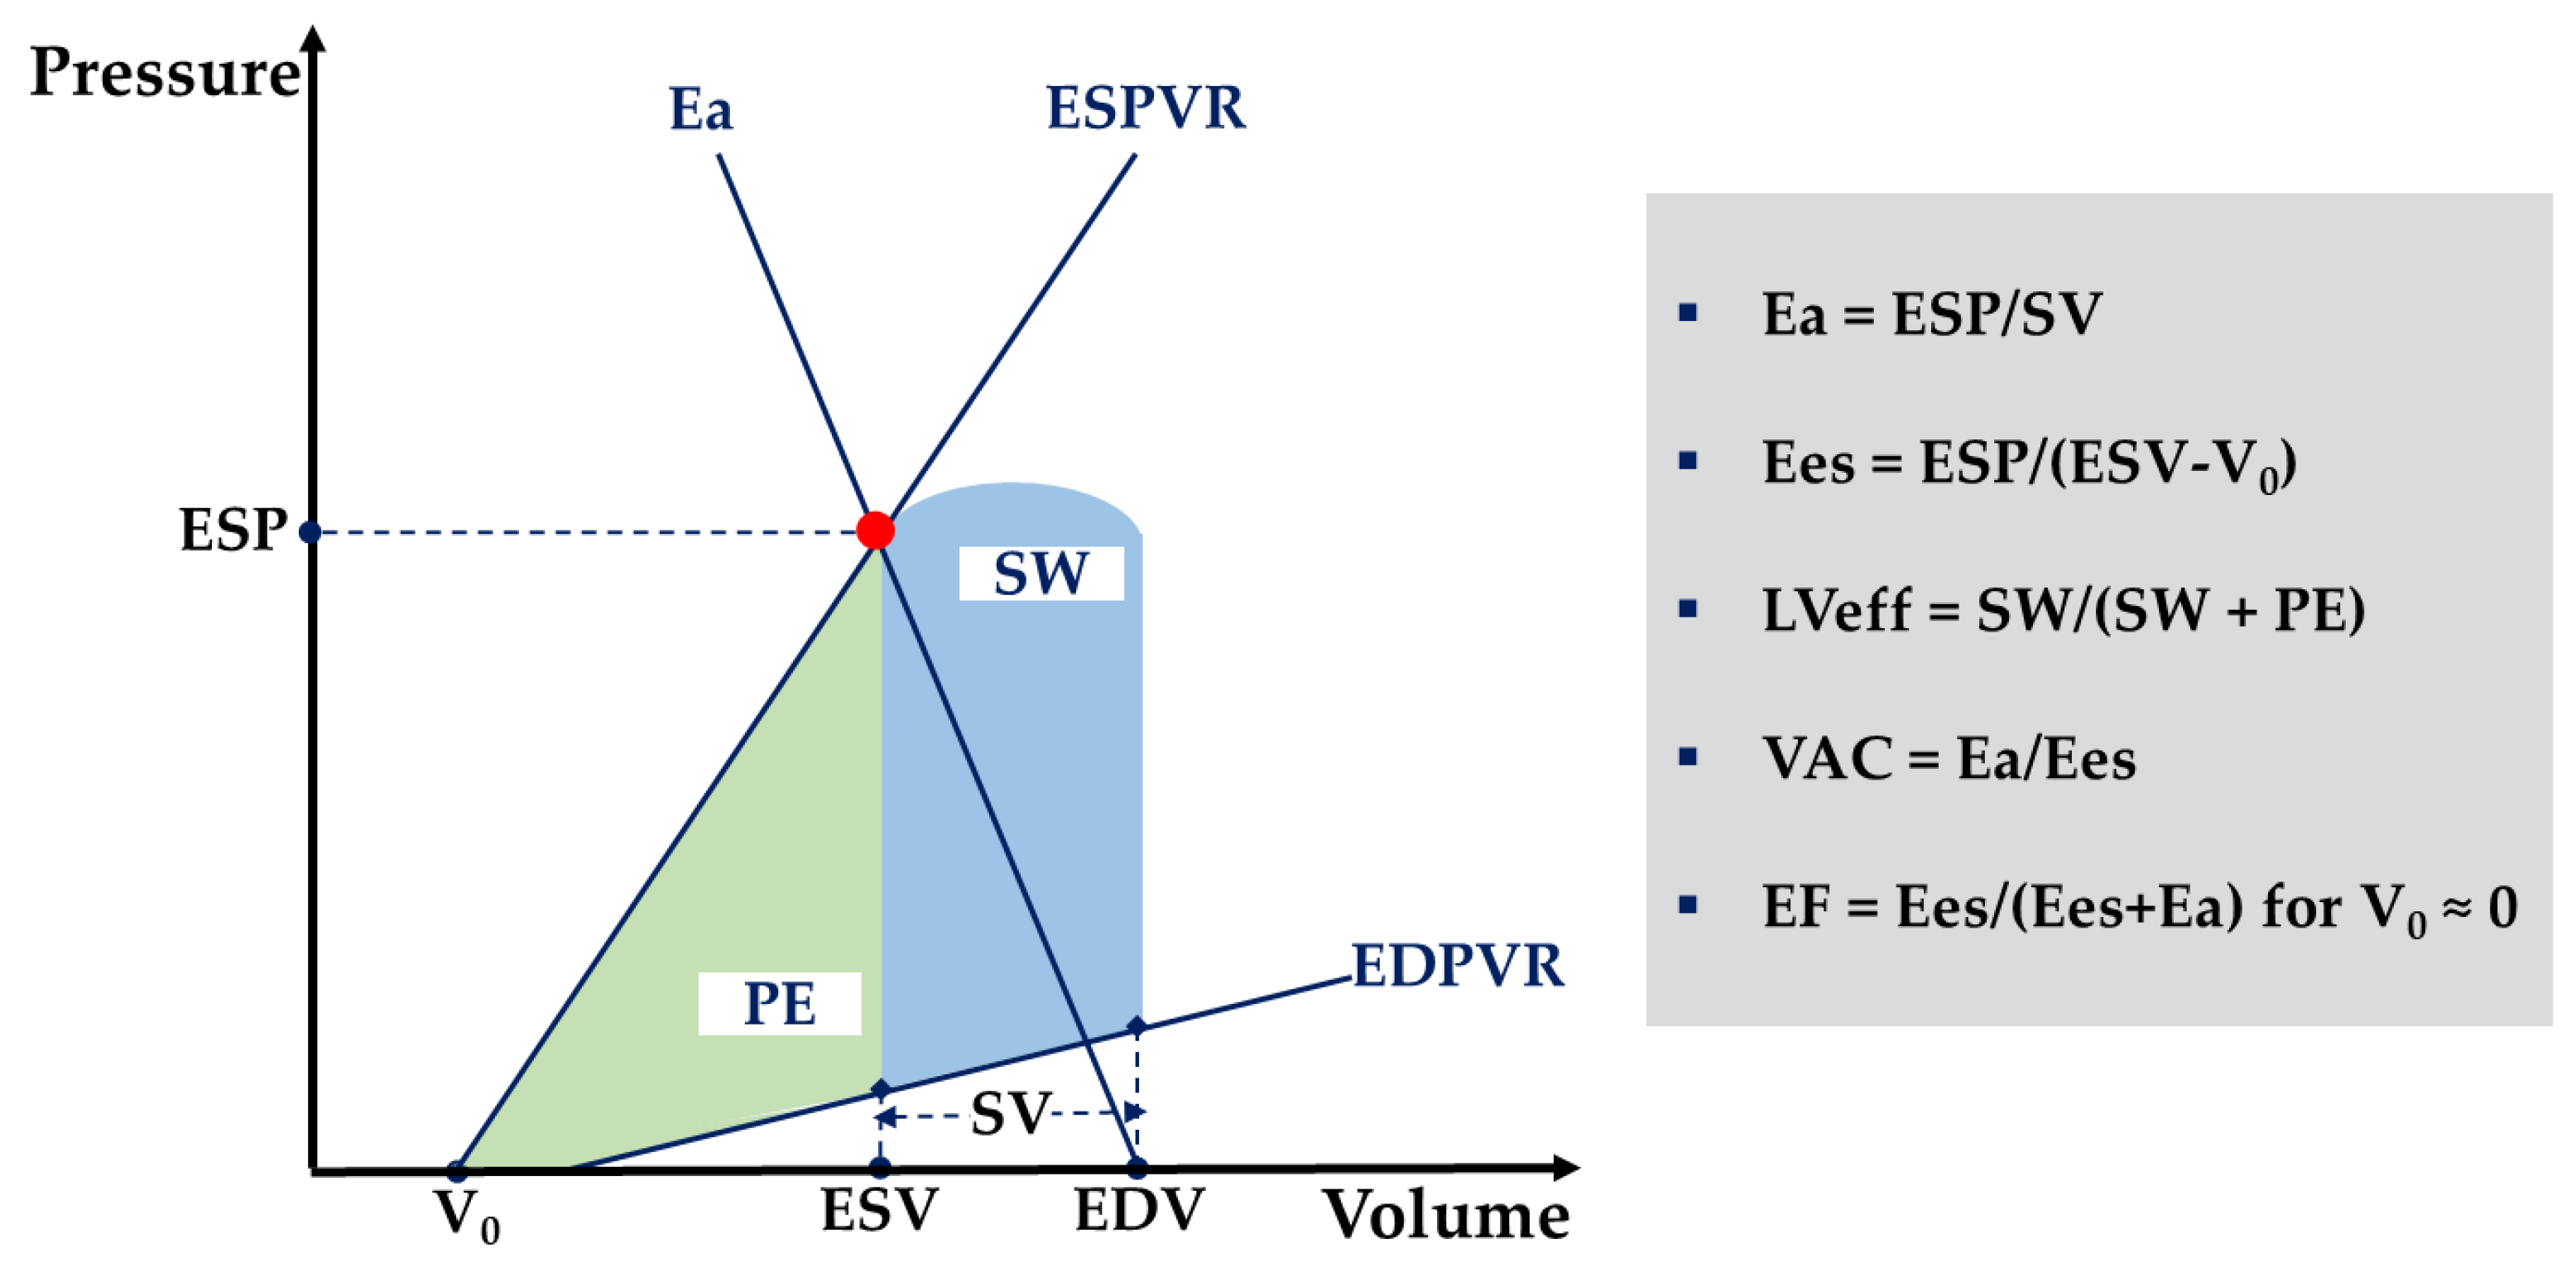
| VA Ratio | VA Components | Proposed Therapy |
|---|---|---|
| < 1 | Ea < 2 and Ees > 2 | Vasopressor |
| Ea < 2 and Ees < 2 | Inotrope | |
| > 1 | Ea > 2 and Ees < 2 | Inodilator |
| Ea >> 2 and Ees ≈ 2 | Vasodilator |
References
- Rhodes, A.; Evans, L.; Alhazanni, W.; Levy, M.; Antonelli, M.; Ferrer, R.; Kumar, A.; Sevransky, J.; Sprung, C.L.; Nunnally, M.E.; et al. Surviving Sepsis Campaign: International Guidelines for Management of Sepsis and Septic Shock: 2016. Crit. Care Med. 2017, 45, 486–552. [Google Scholar] [CrossRef] [PubMed]
- Singer, M.; Deutschman, C.S.; Seymour, C.C.; Shankar-Hari, M.; Annane, D.; Bauer, M.; Bellomo, R.; Bernard, G.R.; Chiche, J.-D.; Coopersmith, C.C.; et al. The Third International Consensus Definitions for Sepsis and Septic Shock (Sepsis-3). JAMA 2016, 315, 801–810. [Google Scholar] [CrossRef] [PubMed]
- Hendy, A.; Bubenek-Turconi, Ş.-I. The Diagnosis and Hemodynamic Monitoring of Circulatory Shock: Current and Future Trends. J. Crit. Care Med. 2016, 2, 115–123. [Google Scholar] [CrossRef] [Green Version]
- De Backer, D.; Hollenberg, S.; Boerma, C.; Goedhart, P.; Büchele, G.; Ospina-Tascon, G.; Dobbe, I.; Ince, C. How to evaluate the microcirculation: Report of a round table conference. Crit. Care 2007, 11, R101. [Google Scholar] [CrossRef] [Green Version]
- Johansson, P.; Stensballe, J.; Ostrowski, S. Shock induced endotheliopathy (SHINE) in acute critical illness—A unifying pathophysiologic mechanism. Crit. Care 2017, 21, 25. [Google Scholar] [CrossRef] [PubMed] [Green Version]
- Vieillard-Baron, A.; Prigent, A.; Repessé, X.; Goudelin, M.; Prat, G.; Evrard, B.; Charron, C.; Vignon, P.; Geri, G. Right ventricular failure in septic shock: Characterization, incidence and impact on fluid responsiveness. Crit. Care 2020, 24, 630. [Google Scholar] [CrossRef] [PubMed]
- Landesberg, G.; Gilon, D.; Meroz, Y.; Georgieva, M.; Levin, P.D.; Goodman, S.; Avidan, A.; Beeri, R.; Weissman, C.; Jaffe, A.S.; et al. Diastolic dysfunction and mortality in severe sepsis and septic shock. Eur. Heart J. 2011, 33, 895–903. [Google Scholar] [CrossRef] [PubMed]
- Bertini, P.; Guarracino, F. Septic Shock and the Heart. Curr. Anesthesiol. Rep. 2019, 9, 165–173. [Google Scholar] [CrossRef]
- Magder, S. Starling resistor versus compliance. Which explains the zero-flow pressure of a dynamic arterial pressure-flow relation? Circ. Res. 1990, 67, 209–220. [Google Scholar] [CrossRef] [PubMed] [Green Version]
- Du, W.; Liu, D.; Long, Y.; Wang, X. The β-Blocker Esmolol Restores the Vascular Waterfall Phenomenon after Acute Endotoxemia. Crit. Care Med. 2017, 45, e1247–e1253. [Google Scholar] [CrossRef]
- Maas, J.J.; de Wilde, R.B.; Aarts, L.P.; Pinsky, M.R.; Jansen, J.R. Determination of Vascular Waterfall Phenomenon by Bedside Measurement of Mean Systemic Filling Pressure and Critical Closing Pressure in the Intensive Care Unit. Anesth. Analg. 2012, 114, 803–810. [Google Scholar] [CrossRef] [Green Version]
- Ince, C. Hemodynamic coherence and the rationale for monitoring the microcirculation. Crit. Care 2015, 19, S8. [Google Scholar] [CrossRef] [Green Version]
- Saugel, B.B.; Vincent, J.-L.; Wagner, J.J. Personalized hemodynamic management. Curr. Opin. Crit. Care 2017, 23, 334–341. [Google Scholar] [CrossRef]
- Kattan, E.; Castro, R.; Vera, M.; Hernández, G. Optimal target in septic shock resuscitation. Ann. Transl. Med. 2020, 8, 789. [Google Scholar] [CrossRef] [PubMed]
- De Santis, P.; de Fazio, C.; Franchi, F.; Bond, O.; Vincent, J.-L.; Creteur, J.; Taccone, F.; Scolletta, S. Incoherence between Systemic Hemodynamic and Microcirculatory Response to Fluid Challenge in Critically Ill Patients. J. Clin. Med. 2021, 10, 507. [Google Scholar] [CrossRef]
- Asfar, P.; Meziani, F.; Hamel, J.-F.; Grelon, F.; Mégarbane, B.; Anguel, N.; Mira, J.-P.; Dequin, P.-F.; Gergaud, S.; Weiss, N.; et al. High versus Low Blood-Pressure Target in Patients with Septic Shock. N. Engl. J. Med. 2014, 370, 1583–1593. [Google Scholar] [CrossRef] [PubMed] [Green Version]
- Lamontagne, F.; Meade, M.O.; Hébert, P.C.; Asfar, P.; Lauzier, F.; Seely, A.J.; Day, A.G.; Mehta, S.; Muscedere, J.; Bagshaw, S.M.; et al. Higher versus lower blood pressure targets for vasopressor therapy in shock: A multicentre pilot randomized controlled trial. Intensive Care Med. 2016, 42, 542–550. [Google Scholar] [CrossRef]
- Maheshwari, K.; Nathanson, B.H.; Munson, S.; Khangulov, V.; Stevens, M.; Badani, H.; Khanna, A.K.; Sessler, D.I. The relationship between ICU hypotension and in-hospital mortality and morbidity in septic patients. Intensive Care Med. 2018, 44, 857–867. [Google Scholar] [CrossRef] [Green Version]
- Lamontagne, F.; Day, A.G.; Meade, M.O.; Cook, D.J.; Guyatt, G.H.; Hylands, M.; Radermacher, P.; Chrétien, J.-M.; Beaudoin, N.; Hébert, P.; et al. Pooled analysis of higher versus lower blood pressure targets for vasopressor therapy septic and vasodilatory shock. Intensive Care Med. 2017, 44, 12–21. [Google Scholar] [CrossRef] [PubMed]
- Lamontagne, F.; Richards-Belle, A.; Thomas, K.; Harrison, D.A.; Sadique, Z.; Grieve, R.D.; Camsooksai, J.; Darnell, R.; Gordon, A.C.; Henry, D.; et al. Effect of Reduced Exposure to Vasopressors on 90-Day Mortality in Older Critically Ill Patients with Vasodilatory Hypotension: A Randomized Clinical Trial. JAMA 2020, 323, 938–949. [Google Scholar] [CrossRef]
- Damman, K.; van Deursen, V.M.; Navis, G.; Voors, A.A.; van Veldhuisen, D.J.; Hillege, H.L. Increased Central Venous Pressure Is Associated with Impaired Renal Function and Mortality in a Broad Spectrum of Patients with Cardiovascular Disease. J. Am. Coll. Cardiol. 2009, 53, 582–588. [Google Scholar] [CrossRef] [PubMed] [Green Version]
- Legrand, M.; Dupuis, C.; Simon, C.; Gayat, E.; Mateo, J.; Lukaszewicz, A.-C.; Payen, D. Association between systemic hemodynamics and septic acute kidney injury in critically ill patients: A retrospective observational study. Crit. Care 2013, 17, R278. [Google Scholar] [CrossRef] [PubMed] [Green Version]
- Wong, B.T.; Chan, M.J.; Glassford, N.J.; Mårtensson, J.; Bion, V.; Chai, S.Y.; Oughton, C.; Tsuji, I.Y.; Candal, C.L.; Bellomo, R. Mean arterial pressure and mean perfusion pressure deficit in septic acute kidney injury. J. Crit. Care 2015, 30, 975–981. [Google Scholar] [CrossRef]
- Ostermann, M.; Hall, A.; Crichton, S. Low mean perfusion pressure is a risk factor for progression of acute kidney injury in critically ill patients—A retrospective analysis. BMC Nephrol. 2017, 18, 151. [Google Scholar] [CrossRef] [PubMed] [Green Version]
- Hernández, G.; Cavalcanti, A.B.; Ospina-Tascón, G.; Zampieri, F.G.; Dubin, A.; Hurtado, F.J.; Friedman, G.; Castro, R.; Alegría, L.; Cecconi, M.; et al. Early goal-directed therapy using a physiological holistic view: The ANDROMEDA-SHOCK—A randomized controlled trial. Ann. Intensive Care 2018, 8, 52. [Google Scholar] [CrossRef]
- McNeilly, R.G. Sepsis, venous return, and teleology. Med. Hypotheses 2014, 83, 545–548. [Google Scholar] [CrossRef]
- Sennoun, N.; Montemont, C.; Gibot, S.; Lacolley, P.; Levy, B. Comparative effects of early versus delayed use of norepinephrine in resuscitated endotoxic shock. Crit. Care Med. 2007, 35, 1736–1740. [Google Scholar] [CrossRef] [PubMed]
- Ospina-Tascón, G.A.; Hernandez, G.; Alvarez, I.; Calderón-Tapia, L.E.; Manzano-Nunez, R.; Sánchez-Ortiz, A.I.; Quiñones, E.; Yucuma, J.E.R.; Aldana, J.L.; Teboul, J.-L.; et al. Effects of very early start of norepinephrine in patients with septic shock: A propensity score-based analysis. Crit. Care 2020, 24, 52. [Google Scholar] [CrossRef] [Green Version]
- Permpikul, C.; Tongyoo, S.; Viarasilpa, T.; Trainarongsakul, T.; Chakorn, T.; Udompanturak, S. Early Use of Norepinephrine in Septic Shock Resuscitation (CENSER). A Randomized Trial. Am. J. Respir. Crit. Care Med. 2019, 199, 1097–1105. [Google Scholar] [CrossRef]
- Scheeren, T.W.L.; Bakker, J.; de Backer, D.; Annane, D.; Asfar, P.; Boerma, E.C.; Cecconi, M.; Dubin, A.; Dünser, M.W.; Duranteau, J.; et al. Current use of vasopressors in septic shock. Ann. Intensive Care 2019, 9, 20. [Google Scholar] [CrossRef] [Green Version]
- Ospina-Tascón, G.A.; Teboul, J.-L.; Hernandez, G.; Alvarez, I.; Sánchez-Ortiz, A.I.; Calderón-Tapia, L.E.; Manzano-Nunez, R.; Quiñones, E.; Madriñan-Navia, H.J.; Ruiz, J.E.; et al. Diastolic shock index and clinical outcomes in patients with septic shock. Ann. Intensive Care 2020, 10, 41. [Google Scholar] [CrossRef] [Green Version]
- Lamia, B.; Teboul, J.-L.; Monnet, X.; Osman, D.; Maizel, J.; Richard, C.; Chemla, D. Contribution of arterial stiffness and stroke volume to peripheral pulse pressure in ICU patients: An arterial tonometry study. Intensive Care Med. 2007, 33, 1931–1937. [Google Scholar] [CrossRef] [PubMed]
- De Backer, D.; Foulon, P. Minimizing catecholamines and optimizing perfusion. Crit. Care 2019, 23, 149. [Google Scholar] [CrossRef] [PubMed] [Green Version]
- Monnet, X.; Teboul, J.-L. Cardiac output monitoring: Throw it out… or keep it? Crit. Care 2018, 22, 35. [Google Scholar] [CrossRef] [PubMed] [Green Version]
- Richard, C.; Warszawski, J.; Anguel, N.; Deye, N.; Combes, A.; Barnoud, D.; Boulain, T.; Lefort, Y.; Fartoukh, M.; Baud, F.; et al. Early Use of the Pulmonary Artery Catheter and Outcomes in Patients with Shock and Acute Respiratory Distress Syndrome: A Randomized Controlled Trial. JAMA 2003, 290, 2713–2720. [Google Scholar] [CrossRef]
- Morris, C.G.; Pearse, R.M. Pro-Con Debate: We should not Measure Cardiac output in Critical Care. J. Intensive Care Soc. 2009, 10, 8–12. [Google Scholar] [CrossRef]
- Magder, S. Right Atrial Pressure in the Critically Ill: How to Measure, What Is the Value, What Are the Limitations? Chest 2017, 151, 908–916. [Google Scholar] [CrossRef]
- Legrand, M.; Soussi, S.; Dépret, F. Cardiac output and CVP monitoring… to guide fluid removal. Crit. Care 2018, 22, 89. [Google Scholar] [CrossRef] [Green Version]
- Jones, A.E.; Brown, M.D.; Trzeciak, S.; Shapiro, N.I.; Garrett, J.S.; Heffner, A.; Kline, J.A. The effect of a quantitative resuscitation strategy on mortality in patients with sepsis: A meta-analysis. Crit. Care Med. 2008, 36, 2734–2739. [Google Scholar] [CrossRef] [Green Version]
- Rivers, E.; Nguyen, B.; Havstad, S.; Ressler, J.; Muzzin, A.; Knoblich, B.; Peterson, E.; Tomlanovich, M. Early Goal-Directed Therapy in the Treatment of Severe Sepsis and Septic Shock. N. Engl. J. Med. 2001, 345, 1368–1377. [Google Scholar] [CrossRef] [Green Version]
- Mouncey, P.; Osborn, T.M.; Power, G.S.; Harrison, D.; Sadique, Z.; Grieve, R.; Jahan, R.; Harvey, S.; Bell, D.; Bion, J.; et al. Trial of Early, Goal-Directed Resuscitation for Septic Shock. N. Engl. J. Med. 2015, 372, 1301–1311. [Google Scholar] [CrossRef] [Green Version]
- The ARISE Investigators and the ANZICS Clinical Trials Group. Goal-Directed Resuscitation for Patients with Early Septic Shock. N. Engl. J. Med. 2014, 371, 1496–1506. [Google Scholar] [CrossRef] [PubMed] [Green Version]
- ProCESS Investigators; Yealy, D.M.; Kellum, J.A.; Huang, D.T.; Barnato, A.E.; Weissfeld, L.A.; Pike, F.; Terndrup, T.; Wang, H.E.; Hou, P.C. A Randomized Trial of Protocol-Based Care for Early Septic Shock. N. Engl. J. Med. 2014, 370, 1683–1693. [Google Scholar]
- Osborn, T.M. Severe Sepsis and Septic Shock Trials (ProCESS, ARISE, ProMISe). Crit. Care Clin. 2017, 33, 323–344. [Google Scholar] [CrossRef]
- Fink, M.P. Cytopathic hypoxia. Mitochondrial dysfunction as mechanism contributing to organ dysfunction in sepsis. Crit. Care Clin. 2001, 17, 219–237. [Google Scholar] [CrossRef]
- Vincent, J.-L.; Bakker, J. Blood lactate levels in sepsis: In 8 questions. Curr. Opin. Crit. Care 2021, 27, 298–302. [Google Scholar] [CrossRef] [PubMed]
- Ryoo, S.M.; Lee, J.; Lee, Y.-S.; Lee, J.H.; Lim, K.S.; Huh, J.W.; Hong, S.-B.; Lim, C.-M.; Koh, Y.; Kim, W.Y. Lactate Level Versus Lactate Clearance for Predicting Mortality in Patients with Septic Shock Defined by Sepsis-3. Crit. Care Med. 2018, 46, e489–e495. [Google Scholar] [CrossRef]
- Van Beest, P.A.; Lont, M.C.; Holman, N.D.; Loef, B.; Kuiper, M.A.; Boerma, E.C. Central venous-arterial pCO2 difference as a tool in resuscitation of septic patients. Intensive Care Med. 2013, 39, 1034–1039. [Google Scholar] [CrossRef]
- Gavelli, F.; Teboul, J.-L.; Monnet, X. How can CO(2)-derived indices guide resuscitation in critically ill patients? J. Thorac. Dis. 2019, 11, S1528–S1537. [Google Scholar] [CrossRef]
- Johnson, B.A.; Weil, M.H. Redefining ischemia due to circulatory failure as dual defects of oxygen deficits and of carbon dioxide excesses. Crit. Care Med. 1991, 19, 1432–1438. [Google Scholar] [CrossRef]
- Ospina-Tascón, G.A.; Hernández, G.; Cecconi, M. Understanding the venous-arterial CO(2) to arterial-venous O(2) content difference ratio. Intensive Care Med. 2016, 42, 1801–1804. [Google Scholar] [CrossRef]
- Ospina-Tascón, G.A.; Umana, M.; Bermudez, W.F.; Bautista-Rincon, D.F.; Valencia, J.D.; Madrinan, H.J.; Hernandez, G.; Bruhn, A.; Arango-Davila, C.; de Backer, D. Can venous-to-arterial carbon dioxide differences reflect microcirculatory alterations in patients with septic shock? Intensive Care Med. 2016, 42, 211–221. [Google Scholar] [CrossRef] [PubMed]
- Scheeren, T.W.; Wicke, J.N.; Teboul, J.-L. Understanding the carbon dioxide gaps. Curr. Opin. Crit. Care 2018, 24, 181–189. [Google Scholar] [CrossRef] [PubMed]
- De Backer, D. Detailing the cardiovascular profile in shock patients. Crit. Care 2017, 21, 35–41. [Google Scholar] [CrossRef] [PubMed]
- Bronshteyn, Y.S.; Anderson, T.A.; Badakhsh, O.; Boublik, J.; Brady, M.B.W.; Charnin, J.E.; Deriy, L.B.; Hardman, H.D.; Haskins, S.C.; Hollon, M.; et al. Diagnostic Point-of-Care Ultrasound: Recommendations from an Expert Panel. J. Cardiothorac. Vasc. Anesth. 2021. [Google Scholar] [CrossRef]
- Denault, A.Y.; Casas, C.; Puentes, W.; Eljaiek, R.; Iglesias, I. Head to toe ultrasound: Current opinion on its role in hemodynamic instability, hypoxemia, oligoanuria and the patient with altered neurological status. Colomb. J. Anesthesiol. 2017, 45, 317–326. [Google Scholar]
- Geri, G.; Vignon, P.; Aubry, A.; Fedou, A.-L.; Charron, C.; Silva, S.; Repessé, X.; Vieillard-Baron, A. Cardiovascular clusters in septic shock combining clinical and echocardiographic parameters: A post hoc analysis. Intensive Care Med. 2019, 45, 657–667. [Google Scholar] [CrossRef]
- Corradi, F.; Via, G.; Tavazzi, G. What’s new in ultrasound-based assessment of organ perfusion in the critically ill: Expanding the bedside clinical monitoring window for hypoperfusion in shock. Intensive Care Med. 2019, 46, 775–779. [Google Scholar] [CrossRef]
- Cecconi, M.; de Backer, D.; Antonelli, M.; Beale, R.; Bakker, J.; Hofer, C.K.; Jaeschke, R.; Mebazaa, A.; Pinsky, M.R.; Teboul, J.-L.; et al. Consensus on circulatory shock and hemodynamic monitoring. Task force of the European Society of Intensive Care Medicine. Intensive Care Med. 2014, 40, 1795–1815. [Google Scholar] [CrossRef]
- Miller, A.; Peck, M.; Clark, T.; Conway, H.; Olusanya, S.; Fletcher, N.; Coleman, N.; Parulekar, P.; Aron, J.; Kirk-Bayley, J.; et al. FUSIC HD. Comprehensive haemodynamic assessment with ultrasound. J. Intensive Care Soc. 2021. [Google Scholar] [CrossRef]
- Souza, R.; Amato, M.B.P.; DeMarzo, S.E.; Deheinzelin, D.; Barbas, C.S.V.; Schettino, G.P.P.; Carvalho, C. Pulmonary capillary pressure in pulmonary hypertension. Crit. Care 2005, 9, R132–R138. [Google Scholar] [CrossRef] [PubMed] [Green Version]
- Vignon, P. Continuous cardiac output assessment or serial echocardiography during septic shock resuscitation? Ann. Transl. Med. 2020, 8, 797. [Google Scholar] [CrossRef] [PubMed]
- Marik, P.; Bellomo, R. A rational approach to fluid therapy in sepsis. Br. J. Anaesth. 2016, 116, 339–349. [Google Scholar] [CrossRef] [PubMed] [Green Version]
- Bubenek-Turconi, Ş.I.; Văleanu, L.; Popescu, M.; Panaitescu, E.; Tomescu, D.; Cacoveanu, M.C.; Perel, A. Continuous Noninvasive Hemoglobin Monitoring Reflects the Development of Acute Hemodilution After Consecutive Fluid Challenges. Anesth. Analg. 2020, 130, 696–703. [Google Scholar] [CrossRef]
- Monnet, X.; Cipriani, F.; Camous, L.; Sentenac, P.; Dres, M.; Krastinova, E.; Anguel, N.; Richard, C.; Teboul, J.-L. The passive leg raising test to guide fluid removal in critically ill patients. Ann. Intensive Care 2016, 6, 46. [Google Scholar] [CrossRef] [Green Version]
- Chazot, G.; Bitker, L.; Mezidi, M.; Chebib, N.; Chabert, P.; Chauvelot, L.; Folliet, L.; David, G.; Provoost, J.; Yonis, H.; et al. Prevalence and risk factors of hemodynamic instability associated with preload-dependence during continuous renal replacement therapy in a prospective observational cohort of critically ill patients. Ann. Intensive Care 2021, 11, 95. [Google Scholar] [CrossRef]
- Mahjoub, Y.; Lejeune, V.; Muller, L.; Perbet, S.; Zieleskiewicz, L.; Bart, F.; Veber, B.; Paugam-Burtz, C.; Jaber, S.; Ayham, A.; et al. Evaluation of pulse pressure variation validity criteria in critically ill patients: A prospective observational multicentre point-prevalence study. Br. J. Anaesth. 2013, 112, 681–685. [Google Scholar] [CrossRef] [Green Version]
- Monnet, X.; Teboul, J.-L. Passive leg raising: Five rules, not a drop of fluid! Crit. Care 2015, 19, 18. [Google Scholar] [CrossRef] [Green Version]
- Messina, A.; Dell’Anna, A.; Baggiani, M.; Torrini, F.; Maresca, G.M.; Bennett, V.; Saderi, L.; Sotgiu, G.; Antonelli, M.; Cecconi, M. Functional hemodynamic tests: A systematic review and a metanalysis on the reliability of the end-expiratory occlusion test and of the mini-fluid challenge in predicting fluid responsiveness. Crit. Care 2019, 23, 264. [Google Scholar] [CrossRef] [Green Version]
- Wodack, K.H.; Poppe, A.M.; Tomkotter, L.; Bachmann, K.A.; Strobel, C.M.; Bonk, S.; Havel, J.; Heckel, K.; Gocht, A.; Saugel, B.; et al. Individualized early goal-directed therapy in systemic inflammation: Is full utilization of preload reserve the optimal strategy? Crit. Care Med. 2014, 42, e741–e751. [Google Scholar] [CrossRef]
- Behem, C.R.; Graessler, M.F.; Friedheim, T.; Kluttig, R.; Pinnschmidt, H.O.; Duprée, A.; Debus, E.S.; Reuter, D.A.; Wipper, S.H.; Trepte, C.J.C. The use of pulse pressure variation for predicting impairment of microcirculatory blood flow. Sci. Rep. 2021, 11, 9215. [Google Scholar] [CrossRef]
- Cannesson, M.; Le Manach, Y.; Hofer, C.K.; Goarin, J.P.; Lehot, J.-J.; Vallet, B.; Tavernier, B. Assessing the Diagnostic Accuracy of Pulse Pressure Variations for the Prediction of Fluid Responsiveness: A “Gray Zone” Approach. Anesthesiology 2011, 115, 231–241. [Google Scholar] [CrossRef] [PubMed] [Green Version]
- Vieillard-Baron, A.; Chergui, K.; Rabiller, A.; Peyrouset, O.; Page, B.; Beauchet, A.; Jardin, F. Superior vena caval collapsibility as a gauge of volume status in ventilated septic patients. Intensive Care Med. 2004, 30, 1734–1739. [Google Scholar] [CrossRef]
- Bubenek-Turconi, Ş.-I.; Hendy, A.; Baila, S.; Dragan, A.; Chioncel, O.; Valeanu, L.; Morosanu, B.; Iliescu, V.-A. The value of a superior vena cava collapsibility index measured with a miniaturized transoesophageal monoplane continuous echocardiography probe to predict fluid responsiveness compared to stroke volume variations in open major vascular surgery: A prospective cohort study. J. Clin. Monit. Comput. 2020, 34, 491–499. [Google Scholar]
- Marik, P.E.; Lemson, J. Fluid responsiveness: An evolution of our understanding. Br. J. Anaesth. 2014, 112, 617–620. [Google Scholar] [CrossRef] [PubMed] [Green Version]
- Price, S.; Platz, E.; Cullen, L.; Tavazzi, G.; Christ, M.; Cowie, M.; Maisel, A.S.; Masip, J.; Miro, O.; McMurray, J.J.; et al. Echocardiography and lung ultrasonography for the assessment and management of acute heart failure. Nat. Rev. Cardiol. 2017, 14, 427–440. [Google Scholar] [CrossRef] [PubMed]
- Beaubien-Souligny, W.; Rola, P.; Haycock, K.; Bouchard, J.; Lamarche, Y.; Spiegel, R.; Denault, A.Y. Quantifying systemic congestion with Point-Of-Care ultrasound: Development of the venous excess ultrasound grading system. Ultrasound J. 2020, 12, 16. [Google Scholar] [CrossRef] [PubMed] [Green Version]
- Legrand, M.; de Backer, D.; Dépret, F.; Ait-Oufella, H. Recruiting the microcirculation in septic shock. Ann. Intensive Care 2019, 9, 102. [Google Scholar] [CrossRef] [Green Version]
- Dilken, O.; Ergin, B.; Ince, C. Assessment of sublingual microcirculation in critically ill patients: Consensus and debate. Ann. Transl. Med. 2020, 8, 793. [Google Scholar] [CrossRef]
- Hayashida, K.; Sunagawa, K.; Noma, M.; Sugimachi, M.; Ando, H.; Nakamura, M. Mechanical matching of the left ventricle with the arterial system in exercising dogs. Circ. Res. 1992, 71, 481–489. [Google Scholar] [CrossRef] [Green Version]
- Chen, C.-H.; Fetics, B.; Nevo, E.; Rochitte, C.E.; Chiou, K.-R.; Ding, P.-A.; Kawaguchi, M.; Kass, D.A. Noninvasive single-beat determination of left ventricular end-systolic elastance in humans. J. Am. Coll. Cardiol. 2001, 38, 2028–2034. [Google Scholar] [CrossRef] [Green Version]
- Guarracino, F.; Ferro, B.; Morelli, A.; Bertini, P.; Baldassarri, R.; Pinsky, M.R. Ventriculoarterial decoupling in human septic shock. Crit. Care 2014, 18, R80. [Google Scholar] [CrossRef] [PubMed] [Green Version]
- Guarracino, F.; Bertini, P.; Pinsky, M.R. Cardiovascular determinants of resuscitation from sepsis and septic shock. Crit. Care 2019, 23, 118. [Google Scholar] [CrossRef] [Green Version]
- Guarracino, F.; Bertini, P.; Pinsky, M.R. Management of cardiovascular insufficiency in ICU: The BEAT approach. Minerva Anestesiol. 2021, 87, 476–480. [Google Scholar] [CrossRef]
- iElastance on the App Store. Available online: https://apps.apple.com/ca/app/ielastance/id556528864 (accessed on 27 August 2021).
- Pinsky, M.R. Functional Hemodynamic Monitoring. Intensive Care Med. 2002, 28, 386–388. [Google Scholar] [CrossRef] [PubMed] [Green Version]
- Pinsky, M.R. Protocolized Cardiovascular Management Based on Ventricular-arterial Coupling BT. In Functional Hemodynamic Monitoring; Pinsky, M.R., Payen, D., Eds.; Springer: Berlin/Heidelberg, Germany, 2005; pp. 381–395. [Google Scholar]
- García, M.I.M.; González, P.G.; Romero, M.G.; Gil Cano, A.; Rhodes, A.; Grounds, R.M.; Cecconi, M. Effects of arterial load variations on dynamic arterial elastance: An experimental study. Br. J. Anaesth. 2017, 118, 938–946. [Google Scholar] [CrossRef] [Green Version]
- García, M.I.M.; Jian, Z.; Hatib, F.; Settels, J.J.; Cecconi, M.; Pinsky, M.R. Dynamic Arterial Elastance as a Ventriculo-Arterial Coupling Index: An Experimental Animal Study. Front. Physiol. 2020, 11, 284. [Google Scholar] [CrossRef]
- Garcia, M.I.M.; Gil Cano, A.; Romero, M.G. Dynamic arterial elastance to predict arterial pressure response to volume loading in preload-dependent patients. Crit. Care 2011, 15, R15. [Google Scholar] [CrossRef] [PubMed] [Green Version]
- García, M.I.M.; Romero, M.G.; Gil Cano, A.; Aya, H.D.; Rhodes, A.; Grounds, R.M.; Cecconi, M. Dynamic arterial elastance as a predictor of arterial pressure response to fluid administration: A validation study. Crit. Care 2014, 18, 626. [Google Scholar] [CrossRef] [PubMed] [Green Version]
- Guinot, P.-G.; Bernard, E.; Levrard, M.; Dupont, H.; Lorne, E. Dynamic arterial elastance predicts mean arterial pressure decrease associated with decreasing norepinephrine dosage in septic shock. Crit. Care 2015, 19, 14. [Google Scholar] [CrossRef] [Green Version]
- Nguyen, M.; Abou-Arab, O.; Bar, S.; Dupont, H.; Bouhemad, B.; Guinot, P.-G. Echocardiographic measure of dynamic arterial elastance predict pressure response during norepinephrine weaning: An observational study. Sci. Rep. 2021, 11, 2853. [Google Scholar] [CrossRef]
- Cecconi, M.; García, M.I.M.; Romero, M.G.; Mellinghoff, J.; Caliandro, F.; Grounds, R.M.; Rhodes, A. The Use of Pulse Pressure Variation and Stroke Volume Variation in Spontaneously Breathing Patients to Assess Dynamic Arterial Elastance and to Predict Arterial Pressure Response to Fluid Administration. Anesth. Analg. 2015, 120, 76–84. [Google Scholar] [CrossRef] [Green Version]
- Bar, S.; Nguyen, M.; Abou-Arab, O.; Dupont, H.; Bouhemad, B.; Guinot, P.-G. Dynamic Arterial Elastance is Associated with the Vascular Waterfall in Patients Treated with Norepinephrine: An Observational Study. Front. Physiol. 2021, 12, 514. [Google Scholar] [CrossRef]
- Funk, D.J.; Jacobsohn, E.; Kumar, A. The role of venous return in critical illness and shock-part I: Physiology. Crit. Care Med. 2013, 41, 255–262. [Google Scholar] [CrossRef] [Green Version]
- Maas, J.J.; Pinsky, M.R.; Geerts, B.F.; de Wilde, R.; Jansen, J.R. Estimation of mean systemic filling pressure in postoperative cardiac surgery patients with three methods. Intensive Care Med. 2012, 38, 1452–1460. [Google Scholar] [CrossRef] [Green Version]
- Moller, P.W.; Sondergaard, S.; Jakob, S.M.; Takala, J.; Berger, D. Effect of volume status on the estimation of mean systemic filling pressure. J. Appl. Physiol. 2019, 126, 1503–1513. [Google Scholar] [CrossRef]
- Cooke, K.; Sharvill, R.; Sondergaard, S.; Aneman, A. Volume responsiveness assessed by passive leg raising and a fluid challenge: A critical review focused on mean systemic filling pressure. Anaesthesia 2017, 73, 313–322. [Google Scholar] [CrossRef] [Green Version]
- Teboul, J.-L. Mean systemic pressure: We can now estimate it, but for what? Intensive Care Med. 2013, 39, 1487–1488. [Google Scholar] [CrossRef] [PubMed] [Green Version]
- Parkin, G.; Wright, C.; Bellomo, R.; Boyce, N. Use of a mean systemic filling pressure analogue during the closed-loop control of fluid replacement in continuous hemodiafiltration. J. Crit. Care 1994, 9, 124–133. [Google Scholar] [CrossRef]
- Sondergaard, S.; Wall, P.; Cocks, K.; Parkin, W.G.; Leaning, M.S. High concordance between expert anaesthetists’ actions and advice of decision support system in achieving oxygen delivery targets in high-risk surgery patients. Br. J. Anaesth. 2012, 108, 966–972. [Google Scholar] [CrossRef] [PubMed] [Green Version]
- Guven, G.; Hilty, M.P.; Ince, C. Microcirculation: Physiology, Pathophysiology, and Clinical Application. Blood Purif. 2019, 49, 143–150. [Google Scholar] [CrossRef]
- Ospina-Tascón, G.A.; Neves, A.P.; Occhipinti, G.; Donadello, K.; Büchele, G.L.; Simion, D.; Chierego, M.-L.; Silva, T.O.; Fonseca, A.; Vincent, J.-L.; et al. Effects of fluids on microvascular perfusion in patients with severe sepsis. Intensive Care Med. 2010, 36, 949–955. [Google Scholar] [CrossRef]
- Pottecher, J.; Deruddre, S.; Teboul, J.-L.; Georger, J.-F.; LaPlace, C.; Benhamou, D.; Vicaut, E.; Duranteau, J. Both passive leg raising and intravascular volume expansion improve sublingual microcirculatory perfusion in severe sepsis and septic shock patients. Intensive Care Med. 2010, 36, 1867–1874. [Google Scholar] [CrossRef]
- Cabrales, P.; Martini, J.; Intaglietta, M.; Tsai, A.G. Blood viscosity maintains microvascular conditions during normovolemic anemia independent of blood oxygen-carrying capacity. Am. J. Physiol. Circ. Physiol. 2006, 291, H581–H590. [Google Scholar] [CrossRef] [Green Version]
- Sakr, Y.; Chierego, M.; Piagnerelli, M.; Verdant, C.; Dubois, M.-J.; Koch, M.; Creteur, J.; Gullo, A.; Vincent, J.-L.; de Backer, D. Microvascular response to red blood cell transfusion in patients with severe sepsis. Crit. Care Med. 2007, 35, 1639–1644. [Google Scholar] [CrossRef]
- Tsai, A.G.; Acero, C.; Nance, P.R.; Cabrales, P.; Frangos, J.A.; Buerk, D.G.; Intaglietta, M. Elevated plasma viscosity in extreme hemodilution increases perivascular nitric oxide concentration and microvascular perfusion. Am. J. Physiol. Circ. Physiol. 2005, 288, H1730–H1739. [Google Scholar] [CrossRef] [PubMed]
- Cabrales, P.; Tsai, A.G.; Intaglietta, M. Increased plasma viscosity prolongs microhemodynamic conditions during small volume resuscitation from hemorrhagic shock. Resuscitation 2008, 77, 379–386. [Google Scholar] [CrossRef] [Green Version]
- He, H.; Liu, D.; Ince, C. Colloids and the Microcirculation. Anesth. Analg. 2018, 126, 1747–1754. [Google Scholar] [CrossRef]
- Potter, E.; Hodgson, L.; Creagh-Brown, B.; Forni, L.G. Manipulating the Microcirculation in Sepsis—The Impact of Vasoactive Medications on Microcirculatory Blood Flow: A Systematic Review. Shock 2019, 52, 5–12. [Google Scholar] [CrossRef]
- Ince, C.; Boerma, E.C.; Cecconi, M.; de Backer, D.; Shapiro, N.I.; Duranteau, J.; Pinsky, M.R.; Artigas, A.; Teboul, J.-L.; Reiss, I.K.M.; et al. Second consensus on the assessment of sublingual microcirculation in critically ill patients: Results from a task force of the European Society of Intensive Care Medicine. Intensive Care Med. 2018, 44, 281–299. [Google Scholar] [CrossRef] [Green Version]
- Gruartmoner, G.; Mesquida, J.; Ince, C. Microcirculatory monitoring in septic patients: Where do we stand? Med. Intensiva 2017, 41, 44–52. [Google Scholar] [CrossRef] [PubMed]
- Hilty, M.P.; Guerci, P.; Ince, Y.; Toraman, F.; Ince, C. MicroTools enables automated quantification of capillary density and red blood cell velocity in handheld vital microscopy. Commun. Biol. 2019, 2, 217. [Google Scholar] [CrossRef]
- Hilty, M.P.; Ince, C. Automated quantification of tissue red blood cell perfusion as a new resuscitation target. Curr. Opin. Crit. Care 2020, 26, 273–280. [Google Scholar] [CrossRef] [PubMed]
- Hashimoto, R.; Kurata, T.; Sekine, M.; Nakano, K.; Ohnishi, T.; Haneishi, H. Two-wavelength oximetry of tissue microcirculation based on sidestream dark-field imaging. J. Biomed. Opt. 2018, 24, 031013. [Google Scholar] [CrossRef]
- Yu, M.; Morita, S.Y.; Daniel, S.R.; Chapital, A.; Waxman, K.; Severino, R. Transcutaneous pressure of oxygen: A noninvasive and early detector of peripheral shock and outcome. Shock 2006, 26, 450–456. [Google Scholar] [CrossRef]
- Gómez, H.; Mesquida, J.; Simon, P.; Kim, H.K.; Puyana, J.C.; Ince, C.; Pinsky, M.R. Characterization of tissue oxygen saturation and the vascular occlusion test: Influence of measurement sites, probe sizes and deflation thresholds. Crit. Care 2009, 13, S3. [Google Scholar] [CrossRef] [Green Version]
- Donati, A.; Damiani, E.; Domizi, R.; Scorcella, C.; Carsetti, A.; Tondi, S.; Monaldi, V.; Adrario, E.; Romano, R.; Pelaia, P.; et al. Near-infrared spectroscopy for assessing tissue oxygenation and microvascular reactivity in critically ill patients: A prospective observational study. Crit. Care 2016, 20, 311. [Google Scholar] [CrossRef] [Green Version]
- Shapiro, N.I.; Arnold, R.; Sherwin, R.; O’Connor, J.; Najarro, G.; Singh, S.; Lundy, D.; Nelson, T.; Trzeciak, S.W.; Jones, A.E.; et al. The association of near-infrared spectroscopy-derived tissue oxygenation measurements with sepsis syndromes, organ dysfunction and mortality in emergency department patients with sepsis. Crit. Care 2011, 15, R223. [Google Scholar] [CrossRef] [Green Version]
- Macdonald, S.; Kinnear, F.B.; Arendts, G.; Ho, K.M.; Fatovich, D. Near-infrared spectroscopy to predict organ failure and outcome in sepsis: The Assessing Risk in Sepsis using a Tissue Oxygen Saturation (ARISTOS) study. Eur. J. Emerg. Med. 2019, 26, 174–179. [Google Scholar] [CrossRef]
- Varis, E.; Pettilä, V.; Wilkman, E. Near-Infrared Spectroscopy in Adult Circulatory Shock: A Systematic Review. J. Intensive Care Med. 2020, 35, 943–962. [Google Scholar] [CrossRef]
- De Moura, E.B.; Ferreira Amorim, F.; da Cruz Santana, A.N.; Kanhouche, G.; de Souza Godoy, L.G.; de Jesus Almeida, L.; Almeida Rodrigues, T.; da Silveira, C.D.G.; de Oliveira Maia, M. Skin mottling score as a predictor of 28-day mortality in patients with septic shock. Intensive Care Med. 2016, 42, 479–480. [Google Scholar] [CrossRef]
- Jouffroy, R.; Saade, A.; Tourtier, J.P.; Gueye, P.; Bloch-Laine, E.; Ecollan, P.; Carli, P.; Vivien, B. Skin mottling score and capillary refill time to assess mortality of septic shock since pre-hospital setting. Am. J. Emerg. Med. 2019, 37, 664–671. [Google Scholar] [CrossRef]
- Hernández, G.; Ospina Tascon, G.A.; Damiani, L.P.; Estenssoro, E.; Dubin, A.; Hurtado, J.; Friedman, G.; Castro, R.; Alegria, L.; Teboul, J.-L.; et al. Effect of a Resuscitation Strategy Targeting Peripheral Perfusion Status vs Serum Lactate Levels on 28-Day Mortality Among Patients with Septic Shock: The ANDROMEDA-SHOCK Randomized Clinical Trial. JAMA 2019, 321, 654–664. [Google Scholar] [CrossRef]
- Zampieri, F.G.; Damiani, L.P.; Bakker, J.; Ospina-Tascon, G.A.; Castro, R.; Cavalcanti, A.B.; Hernandez, G. Effects of a Resuscitation Strategy Targeting Peripheral Perfusion Status versus Serum Lactate Levels among Patients with Septic Shock. A Bayesian Reanalysis of the ANDROMEDA-SHOCK Trial. Am. J. Respir. Crit. Care Med. 2020, 201, 423–429. [Google Scholar] [CrossRef]
- Mesquida, J. Evaluating tissue oxygenation at the bedside: Global, regional, or both? J. Clin. Monit. 2015, 29, 431–433. [Google Scholar] [CrossRef]
- Dünser, M.W.; Takala, J.; Brunauer, A.; Bakker, J. Re-thinking resuscitation: Leaving blood pressure cosmetics behind and moving forward to permissive hypotension and a tissue perfusion-based approach. Crit. Care 2013, 17, 326–327. [Google Scholar] [CrossRef] [Green Version]


Publisher’s Note: MDPI stays neutral with regard to jurisdictional claims in published maps and institutional affiliations. |
© 2021 by the authors. Licensee MDPI, Basel, Switzerland. This article is an open access article distributed under the terms and conditions of the Creative Commons Attribution (CC BY) license (https://creativecommons.org/licenses/by/4.0/).
Share and Cite
Valeanu, L.; Bubenek-Turconi, S.-I.; Ginghina, C.; Balan, C. Hemodynamic Monitoring in Sepsis—A Conceptual Framework of Macro- and Microcirculatory Alterations. Diagnostics 2021, 11, 1559. https://0-doi-org.brum.beds.ac.uk/10.3390/diagnostics11091559
Valeanu L, Bubenek-Turconi S-I, Ginghina C, Balan C. Hemodynamic Monitoring in Sepsis—A Conceptual Framework of Macro- and Microcirculatory Alterations. Diagnostics. 2021; 11(9):1559. https://0-doi-org.brum.beds.ac.uk/10.3390/diagnostics11091559
Chicago/Turabian StyleValeanu, Liana, Serban-Ion Bubenek-Turconi, Carmen Ginghina, and Cosmin Balan. 2021. "Hemodynamic Monitoring in Sepsis—A Conceptual Framework of Macro- and Microcirculatory Alterations" Diagnostics 11, no. 9: 1559. https://0-doi-org.brum.beds.ac.uk/10.3390/diagnostics11091559