
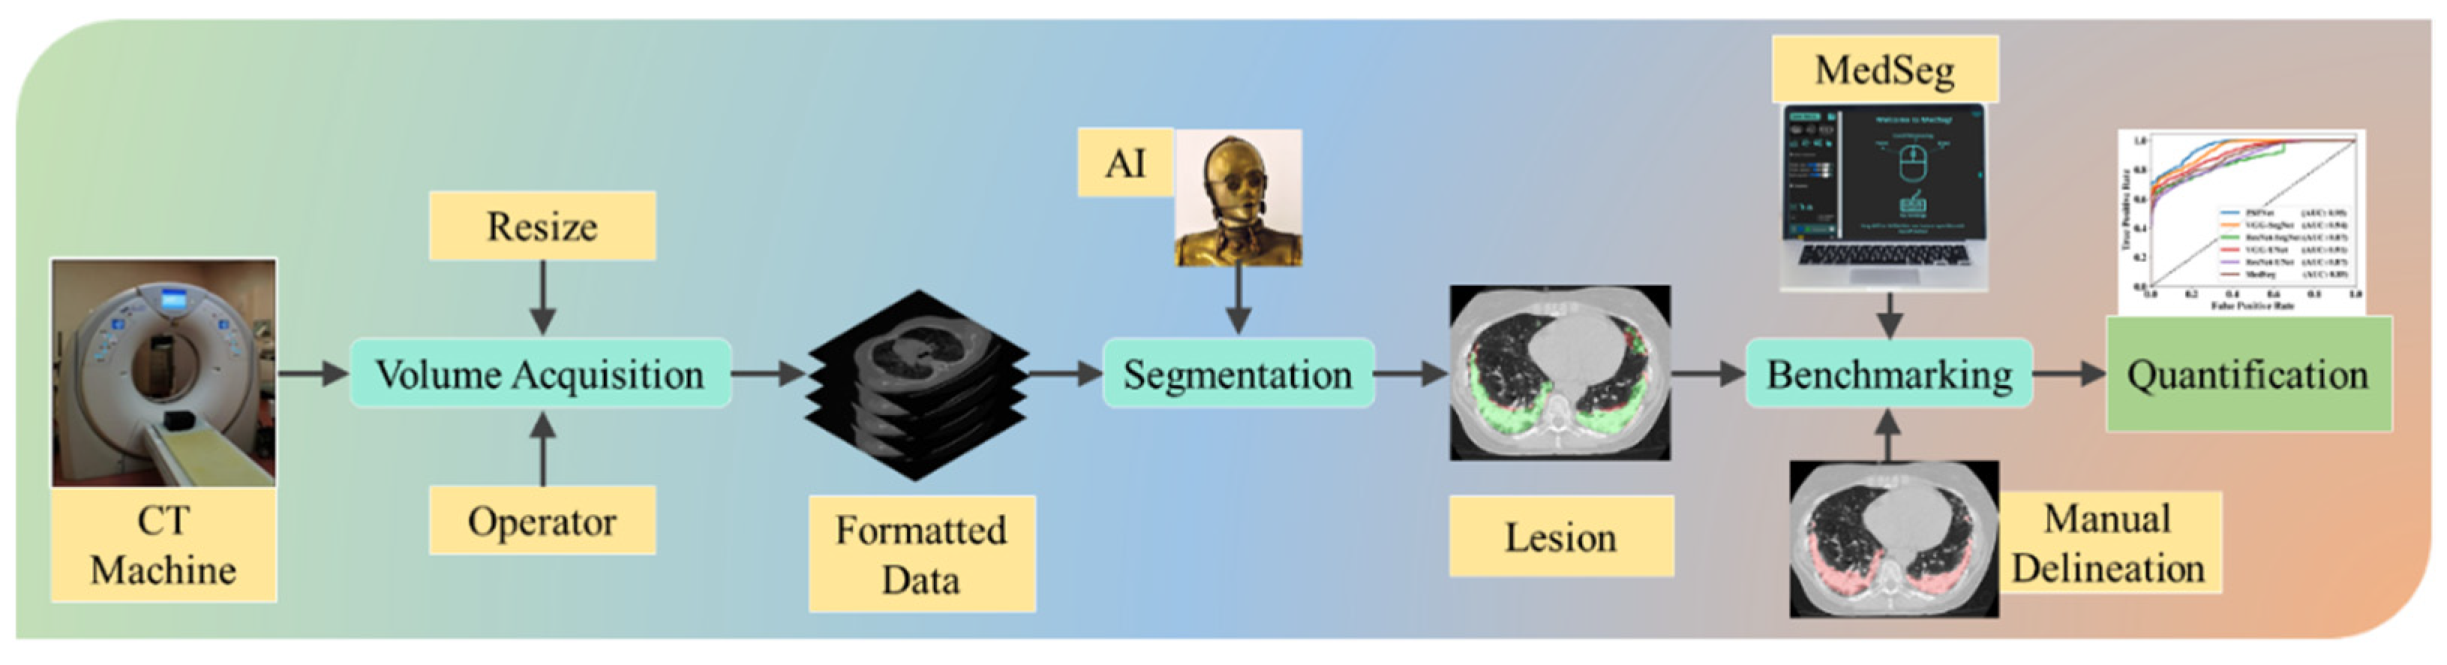
COVLIAS 1.0Lesion vs. MedSeg: An Artificial Intelligence Framework for Automated Lesion Segmentation in COVID-19 Lung Computed Tomography Scans


 , , , ,
  , , , , , , ,
  , , and
Abstract
:1. Introduction
2. Methods
2.1. Demographics and Baseline Characteristics
2.2. Image Acquisition and Data Preparation
2.3. The Deep Learning Models
2.3.1. PSPNet—Solo DL Model
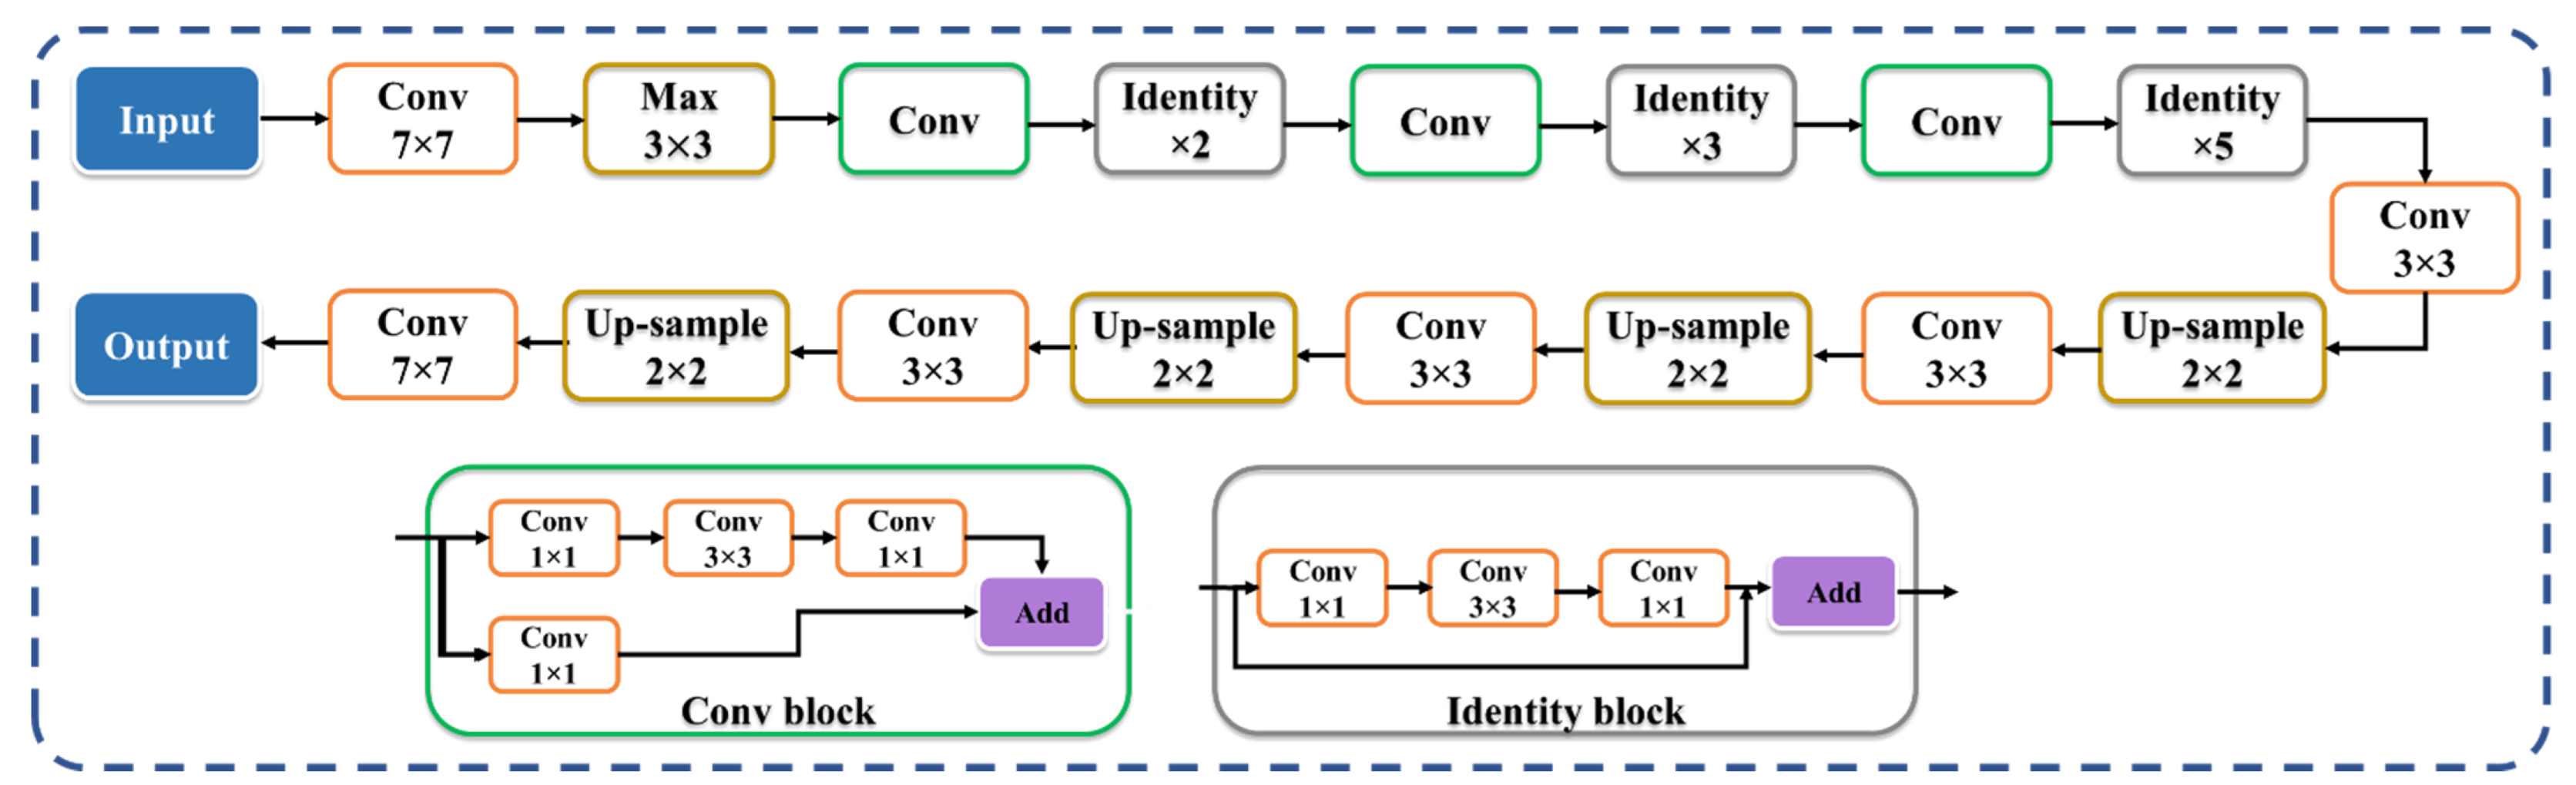
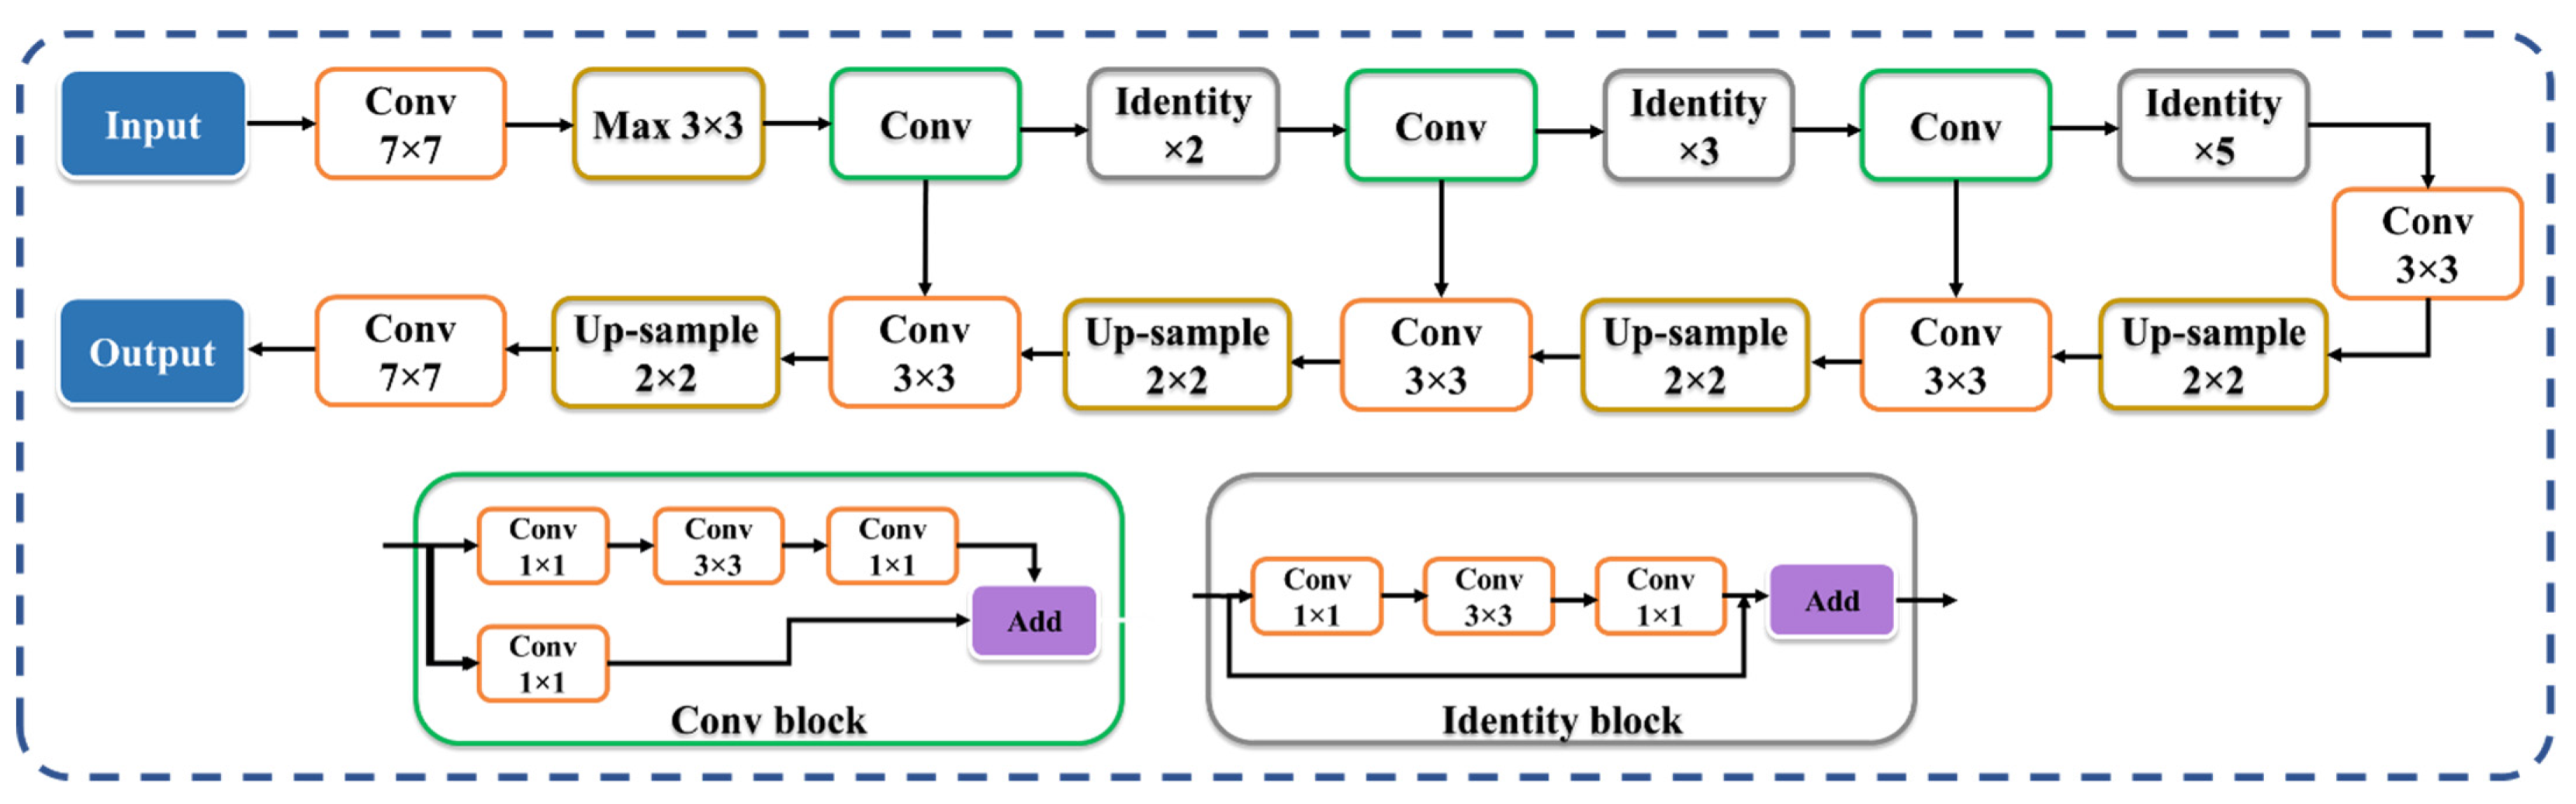
2.3.2. Two SegNet-Based HDL Model Designs—VGG-SegNet and ResNet-SegNet
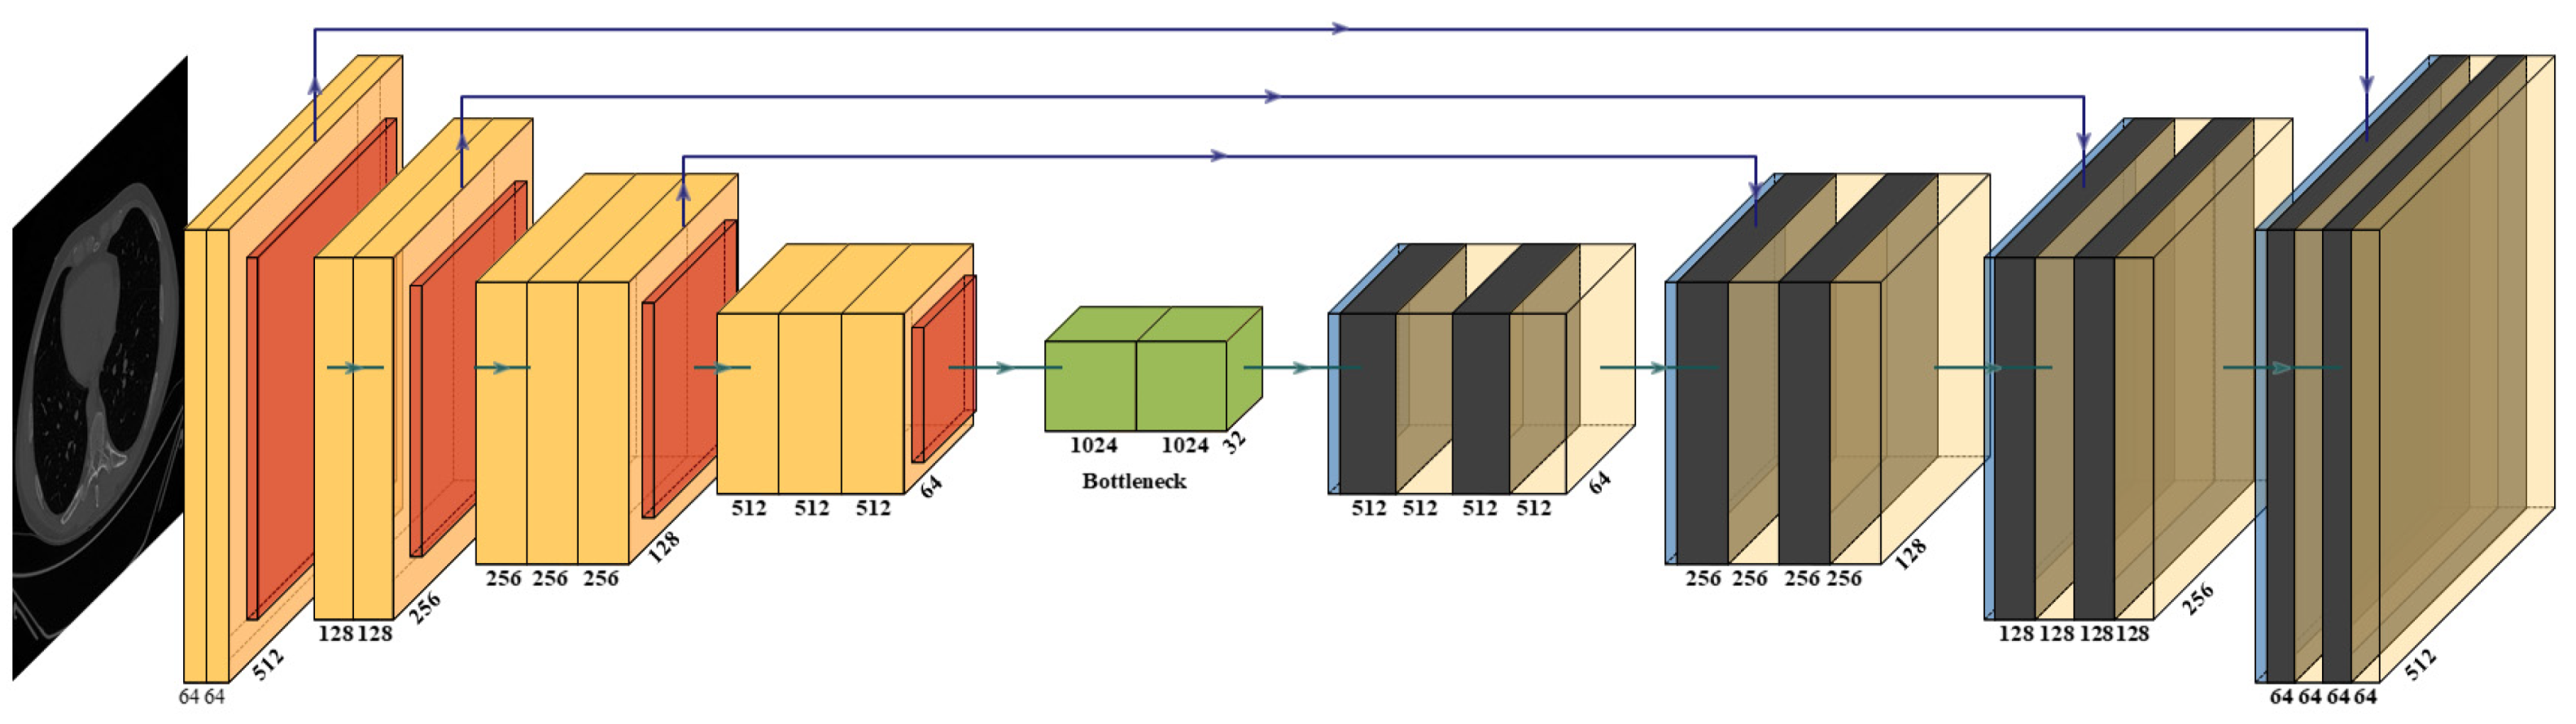
2.3.3. Two UNet-Based HDL Model Designs: VGG-UNet and ResNet-UNet
2.4. Loss Function for SDL and HDL Models
2.5. Experimental Protocol
3. Results and Performance Evaluation
3.1. Results
3.2. Performance Evaluation
3.3. Statistical Validation
4. Discussion
4.1. Short Note on Lesion Annotation
4.2. Explanation and Effectiveness of the AI-Based COVLIAS System
4.3. Benchmarking
4.4. Strengths, Weaknesses, and Extension
5. Conclusions
Author Contributions
Funding
Institutional Review Board Statement
Informed Consent Statement
Conflicts of Interest
Appendix A


References
- WHO Coronavirus (COVID-19) Dashboard. Available online: https://covid19.who.int/ (accessed on 24 January 2022).
- Saba, L.; Gerosa, C.; Fanni, D.; Marongiu, F.; La Nasa, G.; Caocci, G.; Barcellona, D.; Balestrieri, A.; Coghe, F.; Orru, G.; et al. Molecular pathways triggered by COVID-19 in different organs: ACE2 receptor-expressing cells under attack? A review. Eur. Rev. Med. Pharmacol. Sci. 2020, 24, 12609–12622. [Google Scholar] [CrossRef] [PubMed]
- Cau, R.; Bassareo, P.P.; Mannelli, L.; Suri, J.S.; Saba, L. Imaging in COVID-19-related myocardial injury. Int. J. Cardiovasc. Imaging 2021, 37, 1349–1360. [Google Scholar] [CrossRef] [PubMed]
- Viswanathan, V.; Puvvula, A.; Jamthikar, A.D.; Saba, L.; Johri, A.M.; Kotsis, V.; Khanna, N.N.; Dhanjil, S.K.; Majhail, M.; Misra, D.P. Bidirectional link between diabetes mellitus and coronavirus disease 2019 leading to cardiovascular disease: A narrative review. World J. Diabetes 2021, 12, 215. [Google Scholar] [CrossRef] [PubMed]
- Cau, R.; Pacielli, A.; Fatemeh, H.; Vaudano, P.; Arru, C.; Crivelli, P.; Stranieri, G.; Suri, J.S.; Mannelli, L.; Conti, M.; et al. Complications in COVID-19 patients: Characteristics of pulmonary embolism. Clin. Imaging 2021, 77, 244–249. [Google Scholar] [CrossRef]
- Fanni, D.; Saba, L.; Demontis, R.; Gerosa, C.; Chighine, A.; Nioi, M.; Suri, J.S.; Ravarino, A.; Cau, F.; Barcellona, D.; et al. Vaccine-induced severe thrombotic thrombocytopenia following COVID-19 vaccination: A report of an autoptic case and review of the literature. Eur. Rev. Med. Pharmacol. Sci. 2021, 25, 5063–5069. [Google Scholar] [CrossRef]
- Gibson, U.E.; Heid, C.A.; Williams, P.M. A novel method for real time quantitative RT-PCR. Genome Res. 1996, 6, 995–1001. [Google Scholar] [CrossRef] [Green Version]
- Bustin, S.; Benes, V.; Nolan, T.; Pfaffl, M. Quantitative real-time RT-PCR–A perspective. J. Mol. Endocrinol. 2005, 34, 597–601. [Google Scholar] [CrossRef] [Green Version]
- Fang, Y.; Zhang, H.; Xie, J.; Lin, M.; Ying, L.; Pang, P.; Ji, W. Sensitivity of Chest CT for COVID-19: Comparison to RT-PCR. Radiology 2020, 296, E115–E117. [Google Scholar] [CrossRef]
- Leighton, T.G. What is ultrasound? Prog. Biophys. Mol. Biol. 2007, 93, 3–83. [Google Scholar] [CrossRef]
- Jacobi, A.; Chung, M.; Bernheim, A.; Eber, C. Portable chest X-ray in coronavirus disease-19 (COVID-19): A pictorial review. Clin. Imaging 2020, 64, 35–42. [Google Scholar] [CrossRef]
- Sluimer, I.; Schilham, A.; Prokop, M.; Van Ginneken, B. Computer analysis of computed tomography scans of the lung: A survey. IEEE Trans. Med. Imaging 2006, 25, 385–405. [Google Scholar] [CrossRef] [PubMed]
- Giannitto, C.; Sposta, F.M.; Repici, A.; Vatteroni, G.; Casiraghi, E.; Casari, E.; Ferraroli, G.M.; Fugazza, A.; Sandri, M.T.; Chiti, A.; et al. Chest CT in patients with a moderate or high pretest probability of COVID-19 and negative swab. Radiol. Med. 2020, 125, 1260–1270. [Google Scholar] [CrossRef] [PubMed]
- Cau, R.; Falaschi, Z.; Pasche, A.; Danna, P.; Arioli, R.; Arru, C.D.; Zagaria, D.; Tricca, S.; Suri, J.S.; Karla, M.K.; et al. Computed tomography findings of COVID-19 pneumonia in Intensive Care Unit-patients. J. Public Health Res. 2021, 10. [Google Scholar] [CrossRef]
- Saba, L.; Suri, J.S. Multi-Detector CT Imaging: Principles, Head, Neck, and Vascular Systems; CRC Press: Boca Raton, FL, USA, 2013; Volume 1. [Google Scholar]
- Dangis, A.; Gieraerts, C.; De Bruecker, Y.; Janssen, L.; Valgaeren, H.; Obbels, D.; Gillis, M.; Van Ranst, M.; Frans, J.; Demeyere, A.; et al. Accuracy and Reproducibility of Low-Dose Submillisievert Chest CT for the Diagnosis of COVID-19. Radiol. Cardiothorac. Imaging 2020, 2, e200196. [Google Scholar] [CrossRef] [PubMed] [Green Version]
- Majidi, H.; Niksolat, F. Chest CT in patients suspected of COVID-19 infection: A reliable alternative for RT-PCR. Am. J. Emerg. Med. 2020, 38, 2730–2732. [Google Scholar] [CrossRef] [PubMed]
- Chung, M.; Bernheim, A.; Mei, X.; Zhang, N.; Huang, M.; Zeng, X.; Cui, J.; Xu, W.; Yang, Y.; Fayad, Z.A.; et al. CT Imaging Features of 2019 Novel Coronavirus (2019-nCoV). Radiology 2020, 295, 202–207. [Google Scholar] [CrossRef] [Green Version]
- Wu, X.; Hui, H.; Niu, M.; Li, L.; Wang, L.; He, B.; Yang, X.; Li, L.; Li, H.; Tian, J. Deep learning-based multi-view fusion model for screening 2019 novel coronavirus pneumonia: A multicentre study. Eur. J. Radiol. 2020, 128, 109041. [Google Scholar] [CrossRef]
- Pathak, Y.; Shukla, P.K.; Tiwari, A.; Stalin, S.; Singh, S. Deep transfer learning based classification model for COVID-19 disease. Irbm 2020, 43, 87–92. [Google Scholar] [CrossRef]
- Salehi, S.; Abedi, A.; Balakrishnan, S.; Gholamrezanezhad, A. Coronavirus Disease 2019 (COVID-19): A Systematic Review of Imaging Findings in 919 Patients. AJR Am. J. Roentgenol. 2020, 215, 87–93. [Google Scholar] [CrossRef]
- Cozzi, D.; Cavigli, E.; Moroni, C.; Smorchkova, O.; Zantonelli, G.; Pradella, S.; Miele, V. Ground-glass opacity (GGO): A review of the differential diagnosis in the era of COVID-19. Jpn. J. Radiol. 2021, 39, 721–732. [Google Scholar] [CrossRef]
- Xie, X.; Zhong, Z.; Zhao, W.; Zheng, C.; Wang, F.; Liu, J. Chest CT for Typical Coronavirus Disease 2019 (COVID-19) Pneumonia: Relationship to Negative RT-PCR Testing. Radiology 2020, 296, E41–E45. [Google Scholar] [CrossRef] [PubMed] [Green Version]
- Gozes, O.; Frid-Adar, M.; Greenspan, H.; Browning, P.D.; Zhang, H.; Ji, W.; Bernheim, A.; Siegel, E. Rapid ai development cycle for the coronavirus (COVID-19) pandemic: Initial results for automated detection & patient monitoring using deep learning ct image analysis. arXiv 2020, arXiv:2003.05037. [Google Scholar]
- Shalbaf, A.; Vafaeezadeh, M. Automated detection of COVID-19 using ensemble of transfer learning with deep convolutional neural network based on CT scans. Int. J. Comput. Assist. Radiol. Surg. 2021, 16, 115–123. [Google Scholar]
- Yang, X.; He, X.; Zhao, J.; Zhang, Y.; Zhang, S.; Xie, P. COVID-CT-dataset: A CT scan dataset about COVID-19. arXiv 2020, arXiv:2003.13865, 490. [Google Scholar]
- Alqudah, A.M.; Qazan, S.; Alquran, H.; Qasmieh, I.A.; Alqudah, A. COVID-2019 detection using x-ray images and artificial intelligence hybrid systems. Poitiers 2020, 2, 1. [Google Scholar] [CrossRef]
- Aslan, M.F.; Unlersen, M.F.; Sabanci, K.; Durdu, A. CNN-based transfer learning–BiLSTM network: A novel approach for COVID-19 infection detection. Appl. Soft Comput. 2021, 98, 106912. [Google Scholar] [CrossRef]
- Wu, Y.-H.; Gao, S.-H.; Mei, J.; Xu, J.; Fan, D.-P.; Zhang, R.-G.; Cheng, M.-M. Jcs: An explainable COVID-19 diagnosis system by joint classification and segmentation. IEEE Trans. Image Process. 2021, 30, 3113–3126. [Google Scholar] [CrossRef]
- Xu, X.; Jiang, X.; Ma, C.; Du, P.; Li, X.; Lv, S.; Yu, L.; Ni, Q.; Chen, Y.; Su, J. A deep learning system to screen novel coronavirus disease 2019 pneumonia. Engineering 2020, 6, 1122–1129. [Google Scholar] [CrossRef]
- Winston, P.H. Artificial Intelligence; Addison-Wesley Longman Publishing Co., Inc.: Boston, MA, USA, 1992. [Google Scholar]
- Hamet, P.; Tremblay, J. Artificial intelligence in medicine. Metabolism 2017, 69, S36–S40. [Google Scholar] [CrossRef]
- Ramesh, A.; Kambhampati, C.; Monson, J.R.; Drew, P. Artificial intelligence in medicine. Ann. R. Coll. Surg. Engl. 2004, 86, 334. [Google Scholar] [CrossRef] [Green Version]
- Acharya, R.U.; Faust, O.; Alvin, A.P.; Sree, S.V.; Molinari, F.; Saba, L.; Nicolaides, A.; Suri, J.S. Symptomatic vs. asymptomatic plaque classification in carotid ultrasound. J. Med. Syst. 2012, 36, 1861–1871. [Google Scholar] [CrossRef] [PubMed]
- Acharya, U.; Vinitha Sree, S.; Mookiah, M.; Yantri, R.; Molinari, F.; Zieleźnik, W.; Małyszek-Tumidajewicz, J.; Stępień, B.; Bardales, R.; Witkowska, A. Diagnosis of Hashimoto’s thyroiditis in ultrasound using tissue characterization and pixel classification. Proc. Inst. Mech. Eng. Part H J. Eng. Med. 2013, 227, 788–798. [Google Scholar] [CrossRef] [PubMed]
- Acharya, U.R.; Faust, O.; S., V.S.; Alvin, A.P.; Krishnamurthi, G.; Seabra, J.C.; Sanches, J.; Suri, J.S. Understanding symptomatology of atherosclerotic plaque by image-based tissue characterization. Comput. Methods Programs Biomed. 2013, 110, 66–75. [Google Scholar] [CrossRef] [PubMed]
- Acharya, U.R.; Faust, O.; Sree, S.V.; Alvin, A.P.C.; Krishnamurthi, G.; Sanches, J.; Suri, J.S. Atheromatic™: Symptomatic vs. asymptomatic classification of carotid ultrasound plaque using a combination of HOS, DWT & texture. In Proceedings of the 2011 Annual International Conference of the IEEE Engineering in Medicine and Biology Society, Boston, MA, USA, 30 August–3 September 2011; pp. 4489–4492. [Google Scholar]
- Acharya, U.R.; Mookiah, M.R.; Vinitha Sree, S.; Afonso, D.; Sanches, J.; Shafique, S.; Nicolaides, A.; Pedro, L.M.; Fernandes, E.F.J.; Suri, J.S. Atherosclerotic plaque tissue characterization in 2D ultrasound longitudinal carotid scans for automated classification: A paradigm for stroke risk assessment. Med. Biol. Eng. Comput. 2013, 51, 513–523. [Google Scholar] [CrossRef]
- Acharya, U.R.; Saba, L.; Molinari, F.; Guerriero, S.; Suri, J.S. Ovarian tumor characterization and classification: A class of GyneScan™ systems. In Proceedings of the 2012 Annual International Conference of the IEEE Engineering in Medicine and Biology Society, San Diego, CA, USA, 28 August–1 September 2012; pp. 4446–4449. [Google Scholar]
- Biswas, M.; Kuppili, V.; Edla, D.R.; Suri, H.S.; Saba, L.; Marinhoe, R.T.; Sanches, J.M.; Suri, J.S. Symtosis: A liver ultrasound tissue characterization and risk stratification in optimized deep learning paradigm. Comput. Methods Programs Biomed. 2018, 155, 165–177. [Google Scholar] [CrossRef]
- Molinari, F.; Liboni, W.; Pavanelli, E.; Giustetto, P.; Badalamenti, S.; Suri, J.S. Accurate and automatic carotid plaque characterization in contrast enhanced 2-D ultrasound images. In Proceedings of the 2007 29th Annual International Conference of the IEEE Engineering in Medicine and Biology Society, Lyon, France, 22–26 August 2007; pp. 335–338. [Google Scholar]
- Pareek, G.; Acharya, U.R.; Sree, S.V.; Swapna, G.; Yantri, R.; Martis, R.J.; Saba, L.; Krishnamurthi, G.; Mallarini, G.; El-Baz, A. Prostate tissue characterization/classification in 144 patient population using wavelet and higher order spectra features from transrectal ultrasound images. Technol. Cancer Res. Treat. 2013, 12, 545–557. [Google Scholar] [CrossRef]
- Saba, L.; Sanagala, S.S.; Gupta, S.K.; Koppula, V.K.; Johri, A.M.; Khanna, N.N.; Mavrogeni, S.; Laird, J.R.; Pareek, G.; Miner, M.; et al. Multimodality carotid plaque tissue characterization and classification in the artificial intelligence paradigm: A narrative review for stroke application. Ann. Transl. Med. 2021, 9, 1206. [Google Scholar] [CrossRef]
- Agarwal, M.; Saba, L.; Gupta, S.K.; Johri, A.M.; Khanna, N.N.; Mavrogeni, S.; Laird, J.R.; Pareek, G.; Miner, M.; Sfikakis, P.P. Wilson disease tissue classification and characterization using seven artificial intelligence models embedded with 3D optimization paradigm on a weak training brain magnetic resonance imaging datasets: A supercomputer application. Med. Biol. Eng. Comput. 2021, 59, 511–533. [Google Scholar] [CrossRef]
- Saba, L.; Biswas, M.; Suri, H.S.; Viskovic, K.; Laird, J.R.; Cuadrado-Godia, E.; Nicolaides, A.; Khanna, N.N.; Viswanathan, V.; Suri, J.S. Ultrasound-based carotid stenosis measurement and risk stratification in diabetic cohort: A deep learning paradigm. Cardiovasc. Diagn. Ther. 2019, 9, 439–461. [Google Scholar] [CrossRef]
- Biswas, M.; Kuppili, V.; Saba, L.; Edla, D.R.; Suri, H.S.; Sharma, A.; Cuadrado-Godia, E.; Laird, J.R.; Nicolaides, A.; Suri, J.S. Deep learning fully convolution network for lumen characterization in diabetic patients using carotid ultrasound: A tool for stroke risk. Med. Biol. Eng. Comput. 2019, 57, 543–564. [Google Scholar] [CrossRef]
- Hesamian, M.H.; Jia, W.; He, X.; Kennedy, P. Deep learning techniques for medical image segmentation: Achievements and challenges. J. Digit. Imaging 2019, 32, 582–596. [Google Scholar] [CrossRef] [PubMed] [Green Version]
- Ker, J.; Wang, L.; Rao, J.; Lim, T. Deep learning applications in medical image analysis. IEEE Access 2017, 6, 9375–9389. [Google Scholar] [CrossRef]
- Razzak, M.I.; Naz, S.; Zaib, A. Deep learning for medical image processing: Overview, challenges and the future. In Classification in BioApps; Springer: Berlin/Heidelberg, Germany, 2018; pp. 323–350. [Google Scholar]
- Litjens, G.; Kooi, T.; Bejnordi, B.E.; Setio, A.A.A.; Ciompi, F.; Ghafoorian, M.; Van Der Laak, J.A.; Van Ginneken, B.; Sánchez, C.I. A survey on deep learning in medical image analysis. Med. Image Anal. 2017, 42, 60–88. [Google Scholar] [CrossRef] [PubMed] [Green Version]
- Shen, D.; Wu, G.; Suk, H.-I. Deep learning in medical image analysis. Annu. Rev. Biomed. Eng. 2017, 19, 221–248. [Google Scholar] [CrossRef] [Green Version]
- Zhou, T.; Ruan, S.; Canu, S. A review: Deep learning for medical image segmentation using multi-modality fusion. Array 2019, 3, 100004. [Google Scholar] [CrossRef]
- Fourcade, A.; Khonsari, R. Deep learning in medical image analysis: A third eye for doctors. J. Stomatol. Oral Maxillofac. Surg. 2019, 120, 279–288. [Google Scholar] [CrossRef]
- Suri, J.S.; Agarwal, S.; Gupta, S.; Puvvula, A.; Viskovic, K.; Suri, N.; Alizad, A.; El-Baz, A.; Saba, L.; Fatemi, M.; et al. Systematic Review of Artificial Intelligence in Acute Respiratory Distress Syndrome for COVID-19 Lung Patients: A Biomedical Imaging Perspective. IEEE J. Biomed. Health Inform. 2021, 25, 4128–4139. [Google Scholar] [CrossRef]
- Jain, P.K.; Sharma, N.; Giannopoulos, A.A.; Saba, L.; Nicolaides, A.; Suri, J.S. Hybrid deep learning segmentation models for atherosclerotic plaque in internal carotid artery B-mode ultrasound. Comput. Biol. Med. 2021, 136, 104721. [Google Scholar] [CrossRef]
- Jena, B.; Saxena, S.; Nayak, G.K.; Saba, L.; Sharma, N.; Suri, J.S. Artificial intelligence-based hybrid deep learning models for image classification: The first narrative review. Comput. Biol. Med. 2021, 137, 104803. [Google Scholar] [CrossRef]
- Suri, J.S. Imaging Based Symptomatic Classification and Cardiovascular Stroke Risk Score Estimation. U.S. Patent 2011/0257545 A1, 21 October 2011. [Google Scholar]
- Suri, J.S.; Agarwal, S.; Elavarthi, P.; Pathak, R.; Ketireddy, V.; Columbu, M.; Saba, L.; Gupta, S.K.; Faa, G.; Singh, I.M.; et al. Inter-Variability Study of COVLIAS 1.0: Hybrid Deep Learning Models for COVID-19 Lung Segmentation in Computed Tomography. Diagnostics 2021, 11, 2025. [Google Scholar] [CrossRef]
- Suri, J.S.; Agarwal, S.; Pathak, R.; Ketireddy, V.; Columbu, M.; Saba, L.; Gupta, S.K.; Faa, G.; Singh, I.M.; Turk, M. COVLIAS 1.0: Lung Segmentation in COVID-19 Computed Tomography Scans Using Hybrid Deep Learning Artificial Intelligence Models. Diagnostics 2021, 11, 1405. [Google Scholar] [CrossRef] [PubMed]
- Saba, L.; Agarwal, M.; Patrick, A.; Puvvula, A.; Gupta, S.K.; Carriero, A.; Laird, J.R.; Kitas, G.D.; Johri, A.M.; Balestrieri, A.; et al. Six artificial intelligence paradigms for tissue characterisation and classification of non-COVID-19 pneumonia against COVID-19 pneumonia in computed tomography lungs. Int. J. Comput. Assist. Radiol. Surg. 2021, 16, 423–434. [Google Scholar] [CrossRef] [PubMed]
- Saba, L.; Agarwal, M.; Sanagala, S.S.; Gupta, S.K.; Sinha, G.; Johri, A.; Khanna, N.; Mavrogeni, S.; Laird, J.; Pareek, G. Brain MRI-based Wilson disease tissue classification: An optimised deep transfer learning approach. Electron. Lett. 2020, 56, 1395–1398. [Google Scholar] [CrossRef]
- Simonyan, K.; Zisserman, A. Very deep convolutional networks for large-scale image recognition. arXiv 2014, arXiv:1409.1556. [Google Scholar]
- He, K.; Zhang, X.; Ren, S.; Sun, J. Deep residual learning for image recognition. In Proceedings of the IEEE Conference on Computer Vision and Pattern Recognition, Las Vegas, NV, USA, 27–30 June 2016; pp. 770–778. [Google Scholar]
- Zhao, H.; Shi, J.; Qi, X.; Wang, X.; Jia, J. Pyramid scene parsing network. In Proceedings of the IEEE Conference on Computer Vision and Pattern Recognition, Honolulu, HI, USA, 21–26 July 2017; pp. 2881–2890. [Google Scholar]
- Jeong, C.; Yang, H.S.; Moon, K. Horizon detection in maritime images using scene parsing network. Electron. Lett. 2018, 54, 760–762. [Google Scholar] [CrossRef]
- Zhang, Z.; Gao, S.; Huang, Z. An automatic glioma segmentation system using a multilevel attention pyramid scene parsing network. Curr. Med. Imaging 2021, 17, 751–761. [Google Scholar] [CrossRef]
- Badrinarayanan, V.; Kendall, A.; Cipolla, R. SegNet: A Deep Convolutional Encoder-Decoder Architecture for Image Segmentation. IEEE Trans. Pattern Anal. Mach. Intell. 2017, 39, 2481–2495. [Google Scholar] [CrossRef]
- Mazaheri, G.; Mithun, N.C.; Bappy, J.H.; Roy-Chowdhury, A.K. A Skip Connection Architecture for Localization of Image Manipulations. In Proceedings of the CVPR Workshops, Long Beach, CA, USA, 16–20 June 2019; pp. 119–129. [Google Scholar]
- Liu, F.; Ren, X.; Zhang, Z.; Sun, X.; Zou, Y. Rethinking skip connection with layer normalization. In Proceedings of the 28th International Conference on Computational Linguistics, Barcelona, Spain, 8–13 December 2020; pp. 3586–3598. [Google Scholar]
- Mateen, M.; Wen, J.; Song, S.; Huang, Z. Fundus image classification using VGG-19 architecture with PCA and SVD. Symmetry 2018, 11, 1. [Google Scholar] [CrossRef] [Green Version]
- Wen, L.; Li, X.; Li, X.; Gao, L. A new transfer learning based on VGG-19 network for fault diagnosis. In Proceedings of the 2019 IEEE 23rd International Conference on Computer Supported Cooperative Work in Design (CSCWD), Porto, Portugal, 6–8 May 2019; pp. 205–209. [Google Scholar]
- Xiao, J.; Wang, J.; Cao, S.; Li, B. Application of a novel and improved VGG-19 network in the detection of workers wearing masks. In Proceedings of the Journal of Physics: Conference Series, Sanya, China, 20–22 February 2020; p. 012041. [Google Scholar]
- Chaddad, A.; Hassan, L.; Desrosiers, C. Deep CNN models for predicting COVID-19 in CT and X-ray images. J. Med. Imaging 2021, 8, 014502. [Google Scholar] [CrossRef]
- Karasawa, H.; Liu, C.-L.; Ohwada, H. Deep 3d convolutional neural network architectures for alzheimer’s disease diagnosis. In Proceedings of the Asian Conference on Intelligent Information and Database Systems, Dong Hoi City, Vietnam, 19–21 March 2018; pp. 287–296. [Google Scholar]
- Ronneberger, O.; Fischer, P.; Brox, T. U-net: Convolutional networks for biomedical image segmentation. In Proceedings of the International Conference on Medical Image Computing and Computer-Assisted Intervention, Munich, Germany, 5–9 October 2015; pp. 234–241. [Google Scholar]
- Shore, J.; Johnson, R. Properties of cross-entropy minimization. IEEE Trans. Inf. Theory 1981, 27, 472–482. [Google Scholar] [CrossRef] [Green Version]
- De Boer, P.-T.; Kroese, D.P.; Mannor, S.; Rubinstein, R.Y. A tutorial on the cross-entropy method. Ann. Oper. Res. 2005, 134, 19–67. [Google Scholar] [CrossRef]
- Jamin, A.; Humeau-Heurtier, A. (Multiscale) cross-entropy methods: A review. Entropy 2019, 22, 45. [Google Scholar] [CrossRef] [PubMed] [Green Version]
- Chu, Z.; Wang, L.; Zhou, X.; Shi, Y.; Cheng, Y.; Laiginhas, R.; Zhou, H.; Shen, M.; Zhang, Q.; de Sisternes, L. Automatic geographic atrophy segmentation using optical attenuation in OCT scans with deep learning. Biomed. Opt. Express 2022, 13, 1328–1343. [Google Scholar] [CrossRef] [PubMed]
- Basar, S.; Waheed, A.; Ali, M.; Zahid, S.; Zareei, M.; Biswal, R.R. An Efficient Defocus Blur Segmentation Scheme Based on Hybrid LTP and PCNN. Sensors 2022, 22, 2724. [Google Scholar] [CrossRef]
- Eelbode, T.; Bertels, J.; Berman, M.; Vandermeulen, D.; Maes, F.; Bisschops, R.; Blaschko, M.B. Optimization for medical image segmentation: Theory and practice when evaluating with dice score or jaccard index. IEEE Trans. Med. Imaging 2020, 39, 3679–3690. [Google Scholar] [CrossRef]
- Dewitte, K.; Fierens, C.; Stockl, D.; Thienpont, L.M. Application of the Bland–Altman plot for interpretation of method-comparison studies: A critical investigation of its practice. Clin. Chem. 2002, 48, 799–801. [Google Scholar] [CrossRef]
- Giavarina, D. Understanding bland altman analysis. Biochem. Med. 2015, 25, 141–151. [Google Scholar] [CrossRef] [Green Version]
- Hanley, J.A. Receiver operating characteristic (ROC) methodology: The state of the art. Crit. Rev. Diagn. Imaging 1989, 29, 307–335. [Google Scholar]
- Zweig, M.H.; Campbell, G. Receiver-operating characteristic (ROC) plots: A fundamental evaluation tool in clinical medicine. Clin. Chem. 1993, 39, 561–577. [Google Scholar] [CrossRef]
- Streiner, D.L.; Cairney, J. What’s under the ROC? An introduction to receiver operating characteristics curves. Can. J. Psychiatry 2007, 52, 121–128. [Google Scholar] [CrossRef] [Green Version]
- Xu, M.; Fralick, D.; Zheng, J.Z.; Wang, B.; Tu, X.M.; Feng, C. The differences and similarities between two-sample t-test and paired t-test. Shanghai Arch. Psychiatry 2017, 29, 184. [Google Scholar] [PubMed]
- Hsu, H.; Lachenbruch, P.A. Paired t test. In Wiley Statsref: Statistics Reference Online; Wiley Online Library: Hoboken, NJ, USA, 2014. [Google Scholar]
- Nachar, N. The Mann-Whitney U: A test for assessing whether two independent samples come from the same distribution. Tutor. Quant. Methods Psychol. 2008, 4, 13–20. [Google Scholar] [CrossRef]
- McKnight, P.E.; Najab, J. Mann-Whitney U Test. In The Corsini Encyclopedia of Psychology; Wiley: Hoboken, NJ, USA, 2010. [Google Scholar]
- Birnbaum, Z. On a use of the Mann-Whitney statistic. In Proceedings of the Third Berkeley Symposium on Mathematical Statistics and Probability, 1956; University of California: La Jolla, CA, USA, 1956; pp. 13–17. [Google Scholar]
- Cuzick, J. A Wilcoxon-type test for trend. Stat. Med. 1985, 4, 87–90. [Google Scholar] [CrossRef]
- Schoonjans, F.; Zalata, A.; Depuydt, C.; Comhaire, F. MedCalc: A new computer program for medical statistics. Comput. Methods Programs Biomed. 1995, 48, 257–262. [Google Scholar] [CrossRef]
- MedCalc. MedCalc Statistical Software. 2016. Available online: https://www.scirp.org/(S(lz5mqp453ed%20snp55rrgjct55))/reference/referencespapers.aspx?referenceid=2690486 (accessed on 24 January 2022).
- Riffenburgh, R.H.; Gillen, D.L. Contents. In Statistics in Medicine, 4th ed.; Academic Press: Cambridge, MA, USA, 2020; pp. ix–xvi. [Google Scholar]
- Saba, L.; Than, J.C.; Noor, N.M.; Rijal, O.M.; Kassim, R.M.; Yunus, A.; Ng, C.R.; Suri, J.S. Inter-observer variability analysis of automatic lung delineation in normal and disease patients. J. Med. Syst. 2016, 40, 142. [Google Scholar] [CrossRef] [PubMed]
- Zhang, L.; Tanno, R.; Xu, M.-C.; Jin, C.; Jacob, J.; Cicarrelli, O.; Barkhof, F.; Alexander, D. Disentangling human error from ground truth in segmentation of medical images. Adv. Neural Inf. Process. Syst. 2020, 33, 15750–15762. [Google Scholar]
- Foncubierta Rodríguez, A.; Müller, H. Ground truth generation in medical imaging: A crowdsourcing-based iterative approach. In Proceedings of the ACM Multimedia 2012 Workshop on Crowdsourcing for Multimedia, Online, 29 October 2012; pp. 9–14. [Google Scholar]
- Ng, M.-Y.; Lee, E.Y.; Yang, J.; Yang, F.; Li, X.; Wang, H.; Lui, M.M.-S.; Lo, C.S.-Y.; Leung, B.; Khong, P.-L. Imaging profile of the COVID-19 infection: Radiologic findings and literature review. Radiol. Cardiothorac. Imaging 2020, 2, e200034. [Google Scholar] [CrossRef] [Green Version]
- Johnson, K.D.; Harris, C.; Cain, J.K.; Hummer, C.; Goyal, H.; Perisetti, A. Pulmonary and extra-pulmonary clinical manifestations of COVID-19. Front. Med. 2020, 7, 526. [Google Scholar] [CrossRef]
- Mottaghi, A.; Roham, M.; Makiani, M.J.; Ranjbar, M.; Laali, A.; Rahimian, N.R. Verifying Extra-Pulmonary Manifestation of COVID-19 in Firoozgar Hospital 2020: An Observational Study. 2021. Available online: https://www.researchgate.net/publication/348593779_Verifying_Extra-Pulmonary_Manifestation_of_COVID-19_in_Firoozgar_Hospital_2020_An_Observational_Study (accessed on 24 January 2022).
- Bansal, M. Cardiovascular disease and COVID-19. Diabetes Metab. Syndr. Clin. Res. Rev. 2020, 14, 247–250. [Google Scholar] [CrossRef]
- Linschoten, M.; Peters, S.; van Smeden, M.; Jewbali, L.S.; Schaap, J.; Siebelink, H.-M.; Smits, P.C.; Tieleman, R.G.; van der Harst, P.; van Gilst, W.H. Cardiac complications in patients hospitalised with COVID-19. Eur. Heart J. Acute Cardiovasc. Care 2020, 9, 817–823. [Google Scholar] [CrossRef]
- Yohannes, A.M. COPD patients in a COVID-19 society: Depression and anxiety. Expert Rev. Respir. Med. 2021, 15, 5–7. [Google Scholar] [CrossRef] [PubMed]
- Team, C.C.-R.; Team, C.C.-R.; Team, C.C.-R.; Chow, N.; Fleming-Dutra, K.; Gierke, R.; Hall, A.; Hughes, M.; Pilishvili, T.; Ritchey, M. Preliminary estimates of the prevalence of selected underlying health conditions among patients with coronavirus disease 2019—United States, 12 February–28 March 2020. Morb. Mortal. Wkly. Rep. 2020, 69, 382–386. [Google Scholar]
- Gunraj, H.; Wang, L.; Wong, A. COVIDNet-CT: A Tailored Deep Convolutional Neural Network Design for Detection of COVID-19 Cases From Chest CT Images. Front. Med. 2020, 7, 608525. [Google Scholar] [CrossRef]
- Iyer, T.J.; Joseph Raj, A.N.; Ghildiyal, S.; Nersisson, R. Performance analysis of lightweight CNN models to segment infectious lung tissues of COVID-19 cases from tomographic images. PeerJ Comput. Sci. 2021, 7, e368. [Google Scholar] [CrossRef] [PubMed]
- Ranjbarzadeh, R.; Jafarzadeh Ghoushchi, S.; Bendechache, M.; Amirabadi, A.; Ab Rahman, M.N.; Baseri Saadi, S.; Aghamohammadi, A.; Kooshki Forooshani, M. Lung Infection Segmentation for COVID-19 Pneumonia Based on a Cascade Convolutional Network from CT Images. BioMed Res. Int. 2021, 2021, 5544742. [Google Scholar] [CrossRef]
- Ding, W.; Abdel-Basset, M.; Hawash, H.; Elkomy, O.M. MT-nCov-Net: A Multitask Deep-Learning Framework for Efficient Diagnosis of COVID-19 Using Tomography Scans. IEEE Trans. Cybern. 2021. [Google Scholar] [CrossRef]
- Hou, S.M.; Jia, C.L.; Hou, M.J.; Fernandes, S.L.; Guo, J.C. A Study on Weak Edge Detection of COVID-19′s CT Images Based on Histogram Equalization and Improved Canny Algorithm. Comput. Math Methods Med. 2021, 2021, 5208940. [Google Scholar] [CrossRef]
- Kumar Singh, V.; Abdel-Nasser, M.; Pandey, N.; Puig, D. LungINFseg: Segmenting COVID-19 Infected Regions in Lung CT Images Based on a Receptive-Field-Aware Deep Learning Framework. Diagnostics 2021, 11, 158. [Google Scholar] [CrossRef]
- Lizzi, F.; Agosti, A.; Brero, F.; Cabini, R.F.; Fantacci, M.E.; Figini, S.; Lascialfari, A.; Laruina, F.; Oliva, P.; Piffer, S. Quantification of pulmonary involvement in COVID-19 pneumonia by means of a cascade oftwo U-nets: Training and assessment on multipledatasets using different annotation criteria. arXiv 2021, arXiv:02566. [Google Scholar]
- Qi, S.; Xu, C.; Li, C.; Tian, B.; Xia, S.; Ren, J.; Yang, L.; Wang, H.; Yu, H. DR-MIL: Deep represented multiple instance learning distinguishes COVID-19 from community-acquired pneumonia in CT images. Comput. Methods Programs Biomed. 2021, 211, 106406. [Google Scholar] [CrossRef]
- Paluru, N.; Dayal, A.; Jenssen, H.B.; Sakinis, T.; Cenkeramaddi, L.R.; Prakash, J.; Yalavarthy, P.K.; Systems, L. Anam-Net: Anamorphic depth embedding-based lightweight CNN for segmentation of anomalies in COVID-19 chest CT images. IEEE Trans. Neural Netw. Learn. Syst. 2021, 32, 932–946. [Google Scholar] [CrossRef] [PubMed]
- Zhang, P.; Zhong, Y.; Deng, Y.; Tang, X.; Li, X. CoSinGAN: Learning COVID-19 Infection Segmentation from a Single Radiological Image. Diagnostics 2020, 10, 901. [Google Scholar] [CrossRef] [PubMed]
- Budak, U.; Cibuk, M.; Comert, Z.; Sengur, A. Efficient COVID-19 Segmentation from CT Slices Exploiting Semantic Segmentation with Integrated Attention Mechanism. J. Digit. Imaging 2021, 34, 263–272. [Google Scholar] [CrossRef] [PubMed]
- Amyar, A.; Modzelewski, R.; Li, H.; Ruan, S. Multi-task deep learning based CT imaging analysis for COVID-19 pneumonia: Classification and segmentation. Comput. Biol. Med. 2020, 126, 104037. [Google Scholar] [CrossRef]
- Cai, W.; Liu, T.; Xue, X.; Luo, G.; Wang, X.; Shen, Y.; Fang, Q.; Sheng, J.; Chen, F.; Liang, T. CT Quantification and Machine-learning Models for Assessment of Disease Severity and Prognosis of COVID-19 Patients. Acad. Radiol. 2020, 27, 1665–1678. [Google Scholar] [CrossRef]
- Ma, J.; Wang, Y.; An, X.; Ge, C.; Yu, Z.; Chen, J.; Zhu, Q.; Dong, G.; He, J.; He, Z.; et al. Toward data-efficient learning: A benchmark for COVID-19 CT lung and infection segmentation. Med. Phys. 2021, 48, 1197–1210. [Google Scholar] [CrossRef]
- Kuchana, M.; Srivastava, A.; Das, R.; Mathew, J.; Mishra, A.; Kiran Khatter Multimedia Tools and Applications. AI aiding in diagnosing, tracking recovery of COVID-19 using deep learning on Chest CT scans. Multimed. Tools Appl. 2021, 80, 9161–9175. [Google Scholar] [CrossRef]
- Gao, S.-H.; Cheng, M.-M.; Zhao, K.; Zhang, X.-Y.; Yang, M.-H.; Torr, P. Res2net: A new multi-scale backbone architecture. IEEE Trans. Pattern Anal. Mach. Intell. 2019, 43, 652–662. [Google Scholar] [CrossRef] [Green Version]
- Ding, L.; Goshtasby, A. On the Canny edge detector. Pattern Recognit. 2001, 34, 721–725. [Google Scholar] [CrossRef]
- McIlhagga, W. The Canny edge detector revisited. Int. J. Comput. Vis. 2011, 91, 251–261. [Google Scholar] [CrossRef] [Green Version]
- Chollet, F. Xception: Deep learning with depthwise separable convolutions. In Proceedings of the IEEE Conference on Computer Vision and Pattern Recognition, Honolulu, HI, USA, 21–26 July 2017; pp. 1251–1258. [Google Scholar]
- Noh, H.; Hong, S.; Han, B. Learning deconvolution network for semantic segmentation. In Proceedings of the IEEE International Conference on Computer Vision, Santiago, Chile, 7–13 December 2015; pp. 1520–1528. [Google Scholar]
- Fan, D.-P.; Zhou, T.; Ji, G.-P.; Zhou, Y.; Chen, G.; Fu, H.; Shen, J.; Shao, L. Inf-net: Automatic COVID-19 lung infection segmentation from ct images. IEEE Trans. Med. Imaging 2020, 39, 2626–2637. [Google Scholar] [CrossRef] [PubMed]
- Müller, D.; Kramer, F. MIScnn: A framework for medical image segmentation with convolutional neural networks and deep learning. BMC Med. Imaging 2021, 21, 12. [Google Scholar] [CrossRef] [PubMed]
- Müller, D.; Rey, I.S.; Kramer, F. Automated chest ct image segmentation of COVID-19 lung infection based on 3d u-net. arXiv 2020, arXiv:2007.04774. [Google Scholar]
- Arunachalam, A.; Ravi, V.; Acharya, V.; Pham, T.D. Toward data-model-agnostic autonomous machine-generated data labeling and annotation platform: COVID-19 autoannotation use case. IEEE Trans. Eng. Manag. 2021, 1–12. [Google Scholar] [CrossRef]
- Schneider, U.; Pedroni, E.; Lomax, A. The calibration of CT Hounsfield units for radiotherapy treatment planning. Phys. Med. Biol. 1996, 41, 111. [Google Scholar] [CrossRef] [PubMed]
- Zurl, B.; Tiefling, R.; Winkler, P.; Kindl, P.; Kapp, K. Hounsfield units variations. Strahlenther. Onkol. 2014, 190, 88–93. [Google Scholar] [CrossRef]
- DenOtter, T.D.; Schubert, J. Hounsfield Unit; StatPearls Publishing: Treasure Island, FL, USA, 2019. [Google Scholar]
- Harten, A. Multiresolution representation of data: A general framework. SIAM J. Numer. Anal. 1996, 33, 1205–1256. [Google Scholar] [CrossRef]
- Rosenfeld, A. Multiresolution Image Processing and Analysis; Springer Science & Business Media: Berlin/Heidelberg, Germany, 2013; Volume 12. [Google Scholar]
- Molinari, F.; Pattichis, C.S.; Zeng, G.; Saba, L.; Acharya, U.R.; Sanfilippo, R.; Nicolaides, A.; Suri, J.S. Completely automated multiresolution edge snapper—A new technique for an accurate carotid ultrasound IMT measurement: Clinical validation and benchmarking on a multi-institutional database. IEEE Trans. Image Process. 2011, 21, 1211–1222. [Google Scholar] [CrossRef]
- El-Baz, A.; Gimel’farb, G.; Suri, J.S. Stochastic Modeling for Medical Image Analysis, 1st ed.; CRC Press: Boca Raton, FL, USA, 2015. [Google Scholar]
- El-Baz, A.; Suri, J.S. Big Data in Multimodal Medical Imaging; CRC Press: Boca Raton, FL, USA, 2019. [Google Scholar]
- Saba, L.; Banchhor, S.K.; Araki, T.; Viskovic, K.; Londhe, N.D.; Laird, J.R.; Suri, H.S.; Suri, J.S. Intra- and inter-operator reproducibility of automated cloud-based carotid lumen diameter ultrasound measurement. Indian Heart J. 2018, 70, 649–664. [Google Scholar] [CrossRef]
- Than, J.C.; Saba, L.; Noor, N.M.; Rijal, O.M.; Kassim, R.M.; Yunus, A.; Suri, H.S.; Porcu, M.; Suri, J.S. Lung disease stratification using amalgamation of Riesz and Gabor transforms in machine learning framework. Comput. Biol. Med. 2017, 89, 197–211. [Google Scholar] [CrossRef]
- Zhang, S.; Suri, J.S.; Salvado, O.; Chen, Y.; Wacker, F.K.; Wilson, D.L.; Duerk, J.L.; Lewin, J.S. Inter-and Intra-Observer Variability Assessment of in Vivo Carotid Plaque Burden Quantification Using Multi-Contrast Dark Blood MR Images. Stud. Health Technol. Inform. 2005, 113, 384–393. [Google Scholar] [PubMed]
- El-Baz, A.; Gimelfarb, G.; Falk, R.; El-Ghar, M.A.; Suri, J. Appearance analysis for the early assessment of detected lung nodules. Lung Imaging Comput. Aided Diagn. 2011, 17, 395–404. [Google Scholar]
- Noor, N.M.; Than, J.C.; Rijal, O.M.; Kassim, R.M.; Yunus, A.; Zeki, A.A.; Anzidei, M.; Saba, L.; Suri, J.S. Automatic lung segmentation using control feedback system: Morphology and texture paradigm. J. Med. Syst. 2015, 39, 1–18. [Google Scholar] [CrossRef] [PubMed]
- Sanagala, S.S.; Nicolaides, A.; Gupta, S.K.; Koppula, V.K.; Saba, L.; Agarwal, S.; Johri, A.M.; Kalra, M.S.; Suri, J.S. Ten Fast Transfer Learning Models for Carotid Ultrasound Plaque Tissue Characterization in Augmentation Framework Embedded with Heatmaps for Stroke Risk Stratification. Diagnostics 2021, 11, 2109. [Google Scholar] [CrossRef]
- Molinari, F.; Meiburger, K.M.; Saba, L.; Acharya, U.R.; Ledda, G.; Zeng, G.; Ho, S.Y.S.; Ahuja, A.T.; Ho, S.C.; Nicolaides, A. Ultrasound IMT measurement on a multi-ethnic and multi-institutional database: Our review and experience using four fully automated and one semi-automated methods. Comput. Methods Programs Biomed. 2012, 108, 946–960. [Google Scholar] [CrossRef] [PubMed] [Green Version]
- Shu, X.; Yang, J.; Yan, R.; Song, Y. Expansion-Squeeze-Excitation Fusion Network for Elderly Activity Recognition. IEEE Trans. Circuits Syst. Video Technol. 2022, 1. [Google Scholar] [CrossRef]
- Shu, X.; Zhang, L.; Qi, G.-J.; Liu, W.; Tang, J. Spatiotemporal co-attention recurrent neural networks for human-skeleton motion prediction. IEEE Trans. Pattern Anal. Mach. Intell. 2021, 44, 3300–3315. [Google Scholar] [CrossRef]
- Shu, X.; Qi, G.-J.; Tang, J.; Wang, J. Weakly-shared deep transfer networks for heterogeneous-domain knowledge propagation. In Proceedings of the 23rd ACM International Conference on Multimedia, Online, 13 October 2015; pp. 35–44. [Google Scholar]
- Sudre, C.H.; Li, W.; Vercauteren, T.; Ourselin, S.; Jorge Cardoso, M. Generalised dice overlap as a deep learning loss function for highly unbalanced segmentations. In Deep Learning in Medical Image Analysis and Multimodal Learning for Clinical Decision Support; Springer: Berlin/Heidelberg, Germany, 2017; pp. 240–248. [Google Scholar]
- Xu, J.; Zhang, Z.; Friedman, T.; Liang, Y.; Broeck, G. A semantic loss function for deep learning with symbolic knowledge. In Proceedings of the International Conference on Machine Learning, Macau, China, 26–28 February 2018; pp. 5502–5511. [Google Scholar]
- Chen, L.; Qu, H.; Zhao, J.; Chen, B.; Principe, J.C. Efficient and robust deep learning with correntropy-induced loss function. Neural Comput. Appl. 2016, 27, 1019–1031. [Google Scholar] [CrossRef]
- Salehi, S.S.M.; Erdogmus, D.; Gholipour, A. Tversky loss function for image segmentation using 3D fully convolutional deep networks. In Machine Learning in Medical Imaging; Springer: Cham, Switzerland, 2017; pp. 379–387. [Google Scholar]
- de La Torre, J.; Puig, D.; Valls, A. Weighted kappa loss function for multi-class classification of ordinal data in deep learning. Pattern Recognit. Lett. 2018, 105, 144–154. [Google Scholar] [CrossRef]
- Jain, P.K.; Sharma, N.; Saba, L.; Paraskevas, K.I.; Kalra, M.K.; Johri, A.; Nicolaides, A.N.; Suri, J.S. Automated deep learning-based paradigm for high-risk plaque detection in B-mode common carotid ultrasound scans: An asymptomatic Japanese cohort study. Int. Angiol. A J. Int. Union Angiol. 2022, 41, 9–23. [Google Scholar] [CrossRef]
- Jamthikar, A.; Gupta, D.; Saba, L.; Khanna, N.N.; Araki, T.; Viskovic, K.; Mavrogeni, S.; Laird, J.R.; Pareek, G.; Miner, M. Cardiovascular/stroke risk predictive calculators: A comparison between statistical and machine learning models. Cardiovasc. Diagn. Ther. 2020, 10, 919. [Google Scholar] [CrossRef] [PubMed]
- Tandel, G.S.; Balestrieri, A.; Jujaray, T.; Khanna, N.N.; Saba, L.; Suri, J.S. Multiclass magnetic resonance imaging brain tumor classification using artificial intelligence paradigm. Comput. Biol. Med. 2020, 122, 103804. [Google Scholar] [CrossRef] [PubMed]


| MD 1 | MD 2 | |||||||
|---|---|---|---|---|---|---|---|---|
| Dice | % Diff * | Jaccard | % Diff * | Dice | % Diff * | Jaccard | % Diff * | |
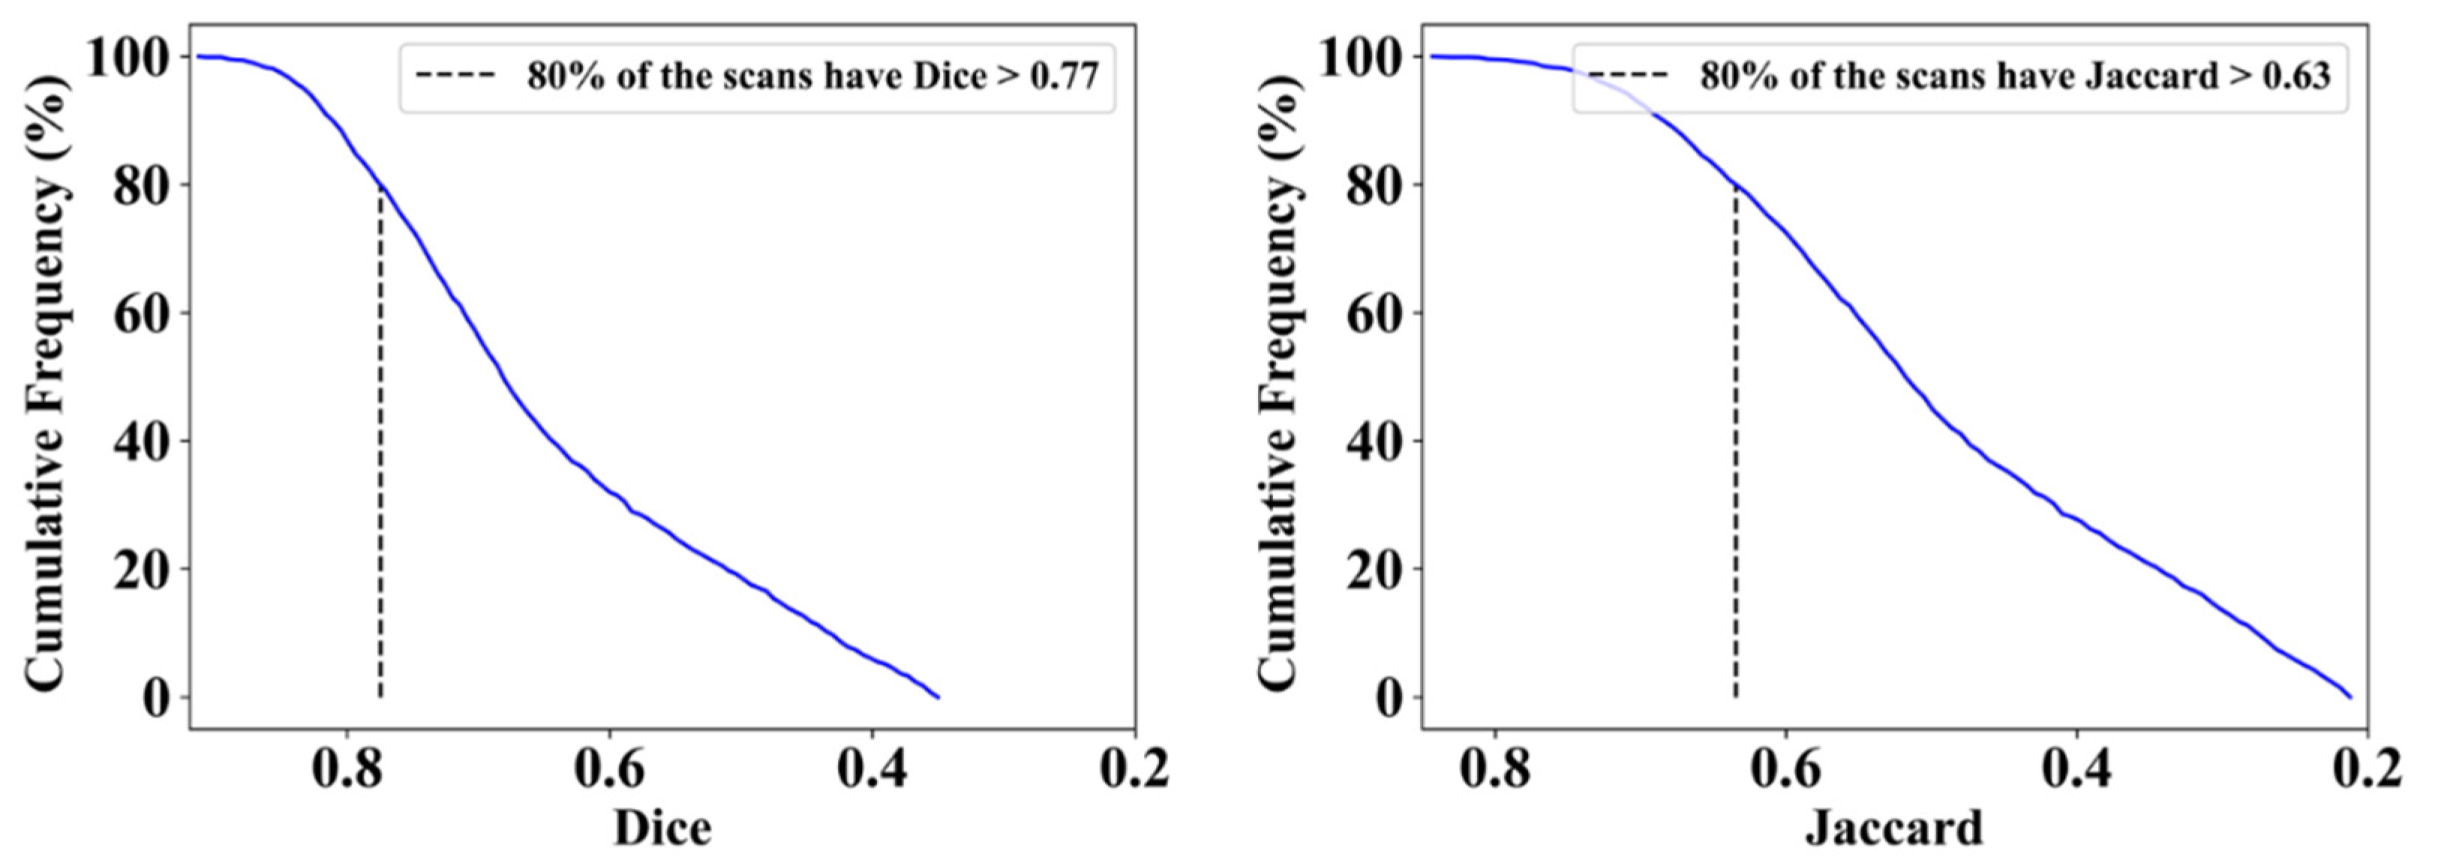
| ResNet-SegNet | 0.77 | 1% | 0.63 | 2% | 0.74 | 4% | 0.60 | 5% |
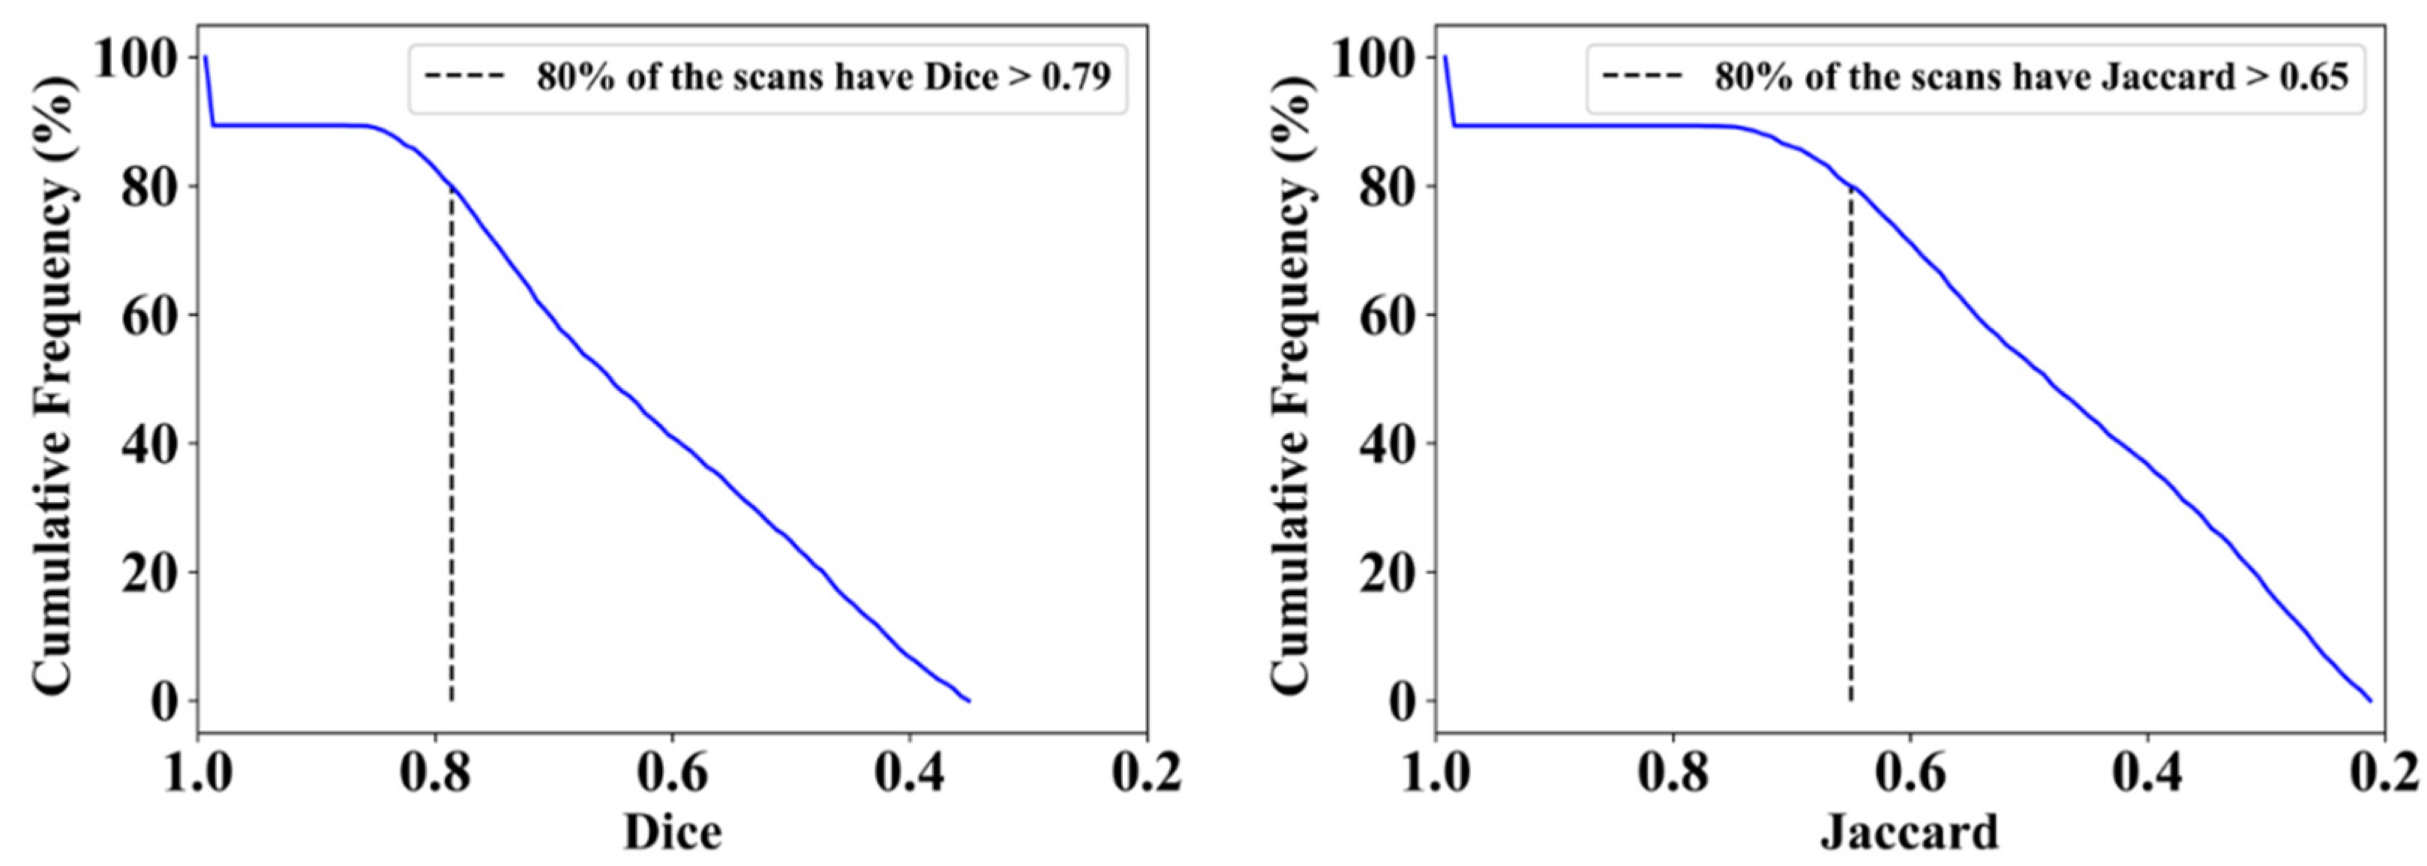
| PSPNet | 0.79 | 4% | 0.65 | 5% | 0.77 | 0% | 0.64 | 2% |
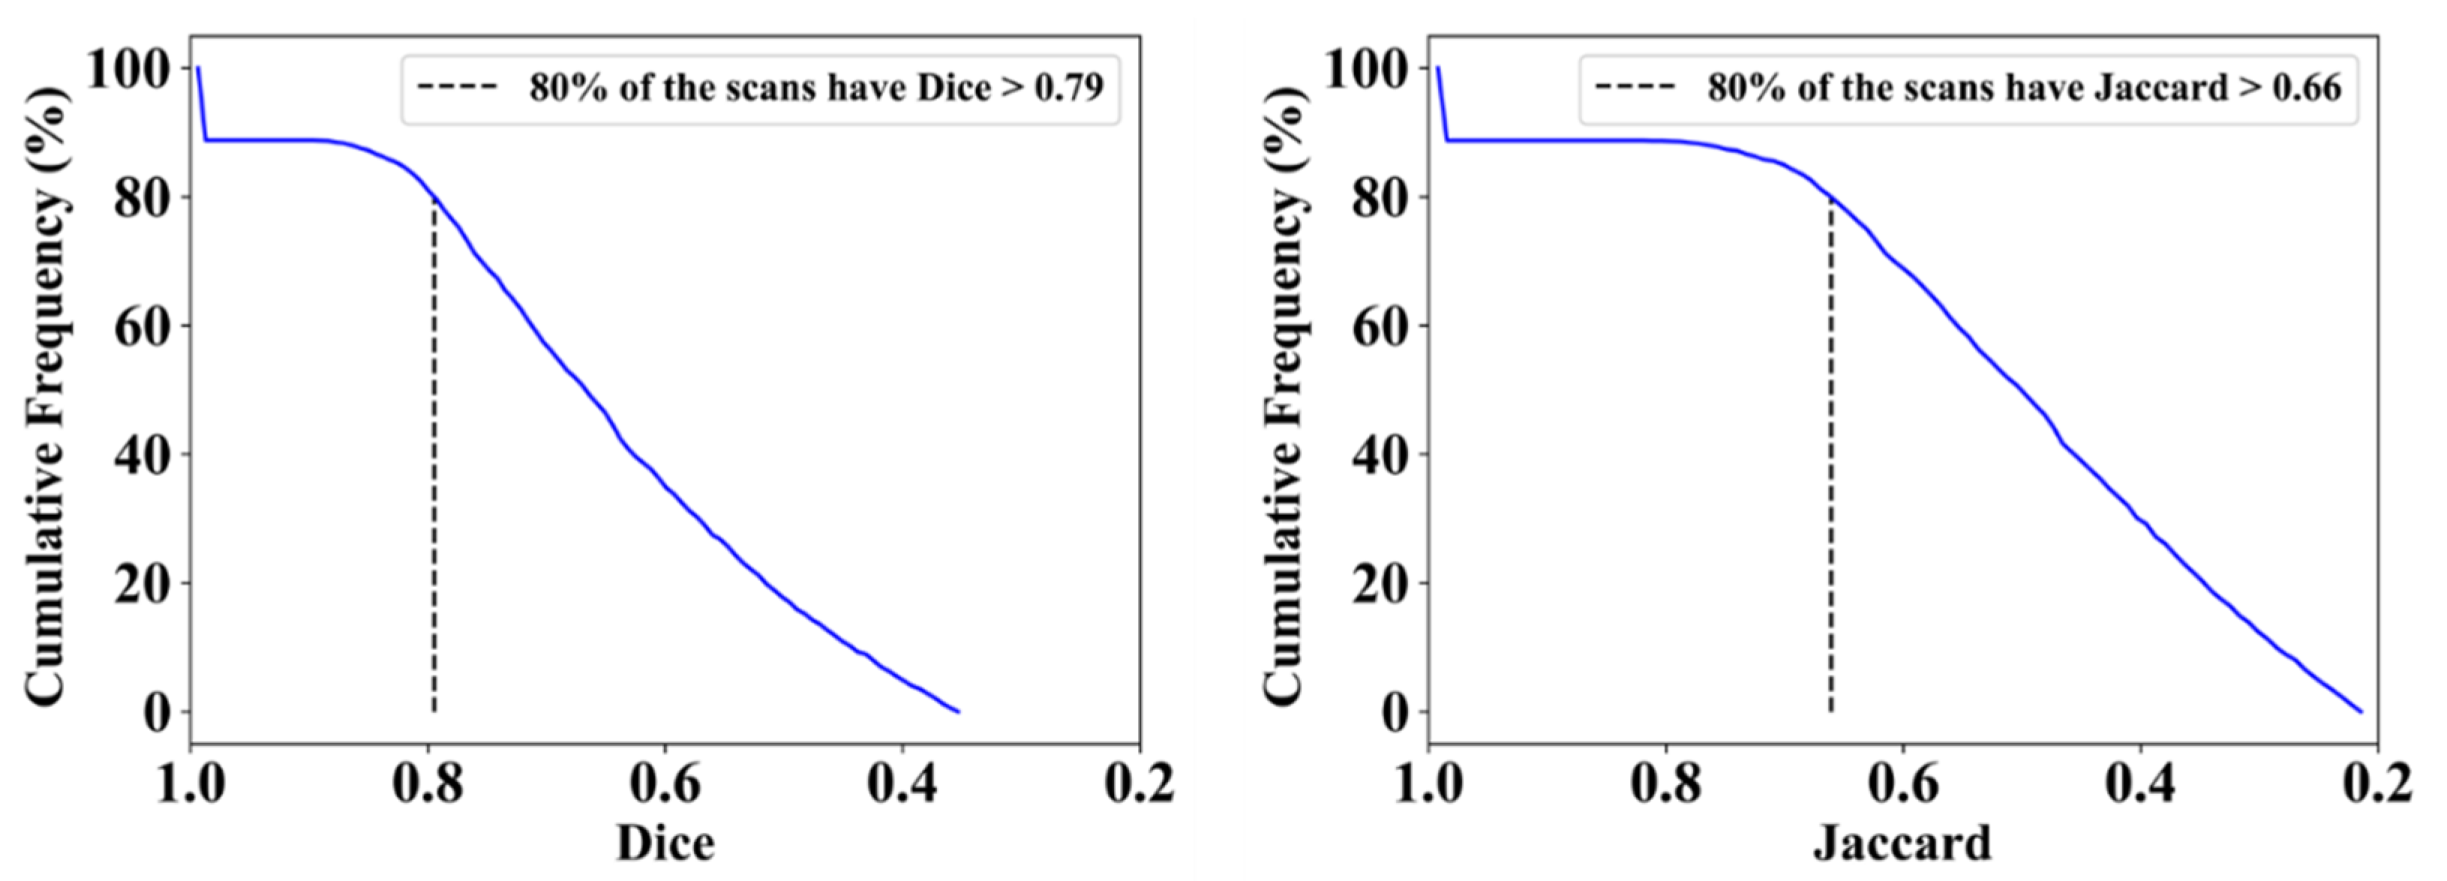
| VGG-SegNet | 0.79 | 4% | 0.66 | 6% | 0.80 | 4% | 0.68 | 8% |
| VGG-UNet | 0.80 | 5% | 0.67 | 8% | 0.78 | 1% | 0.65 | 3% |
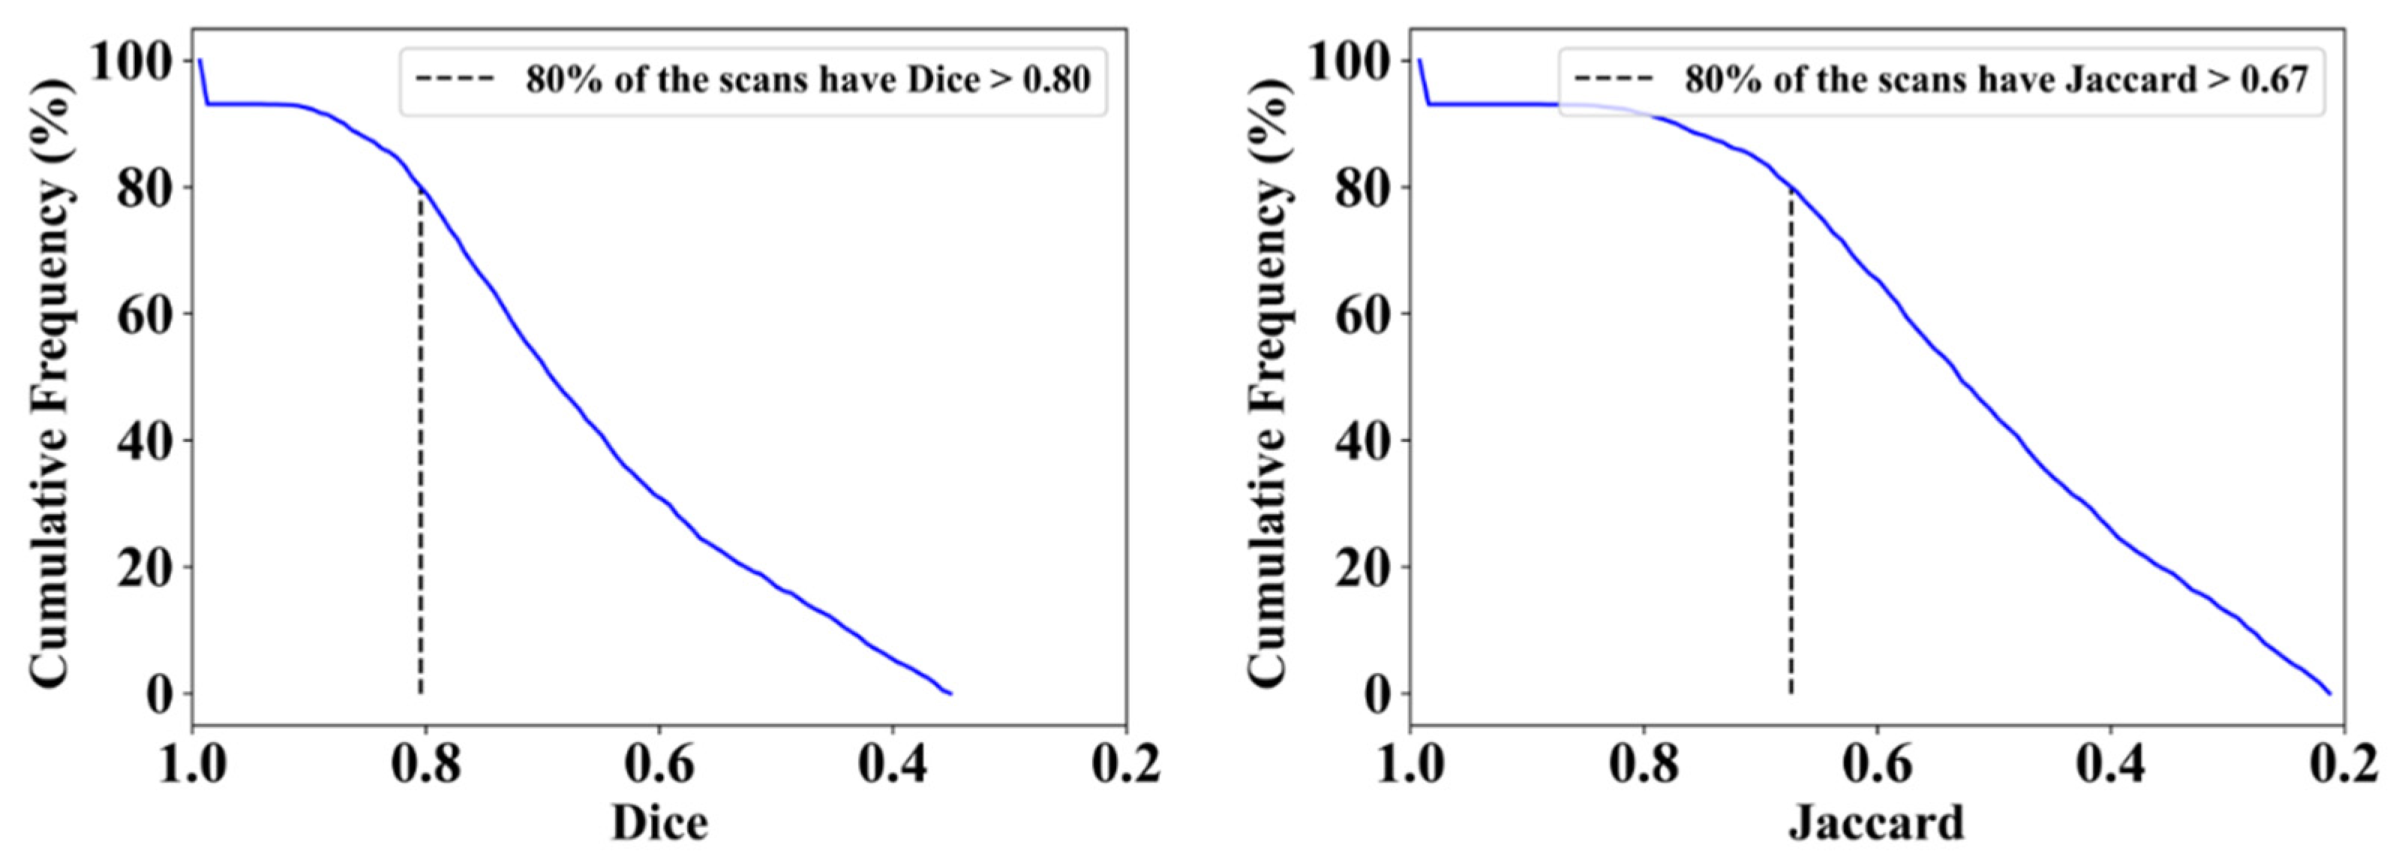
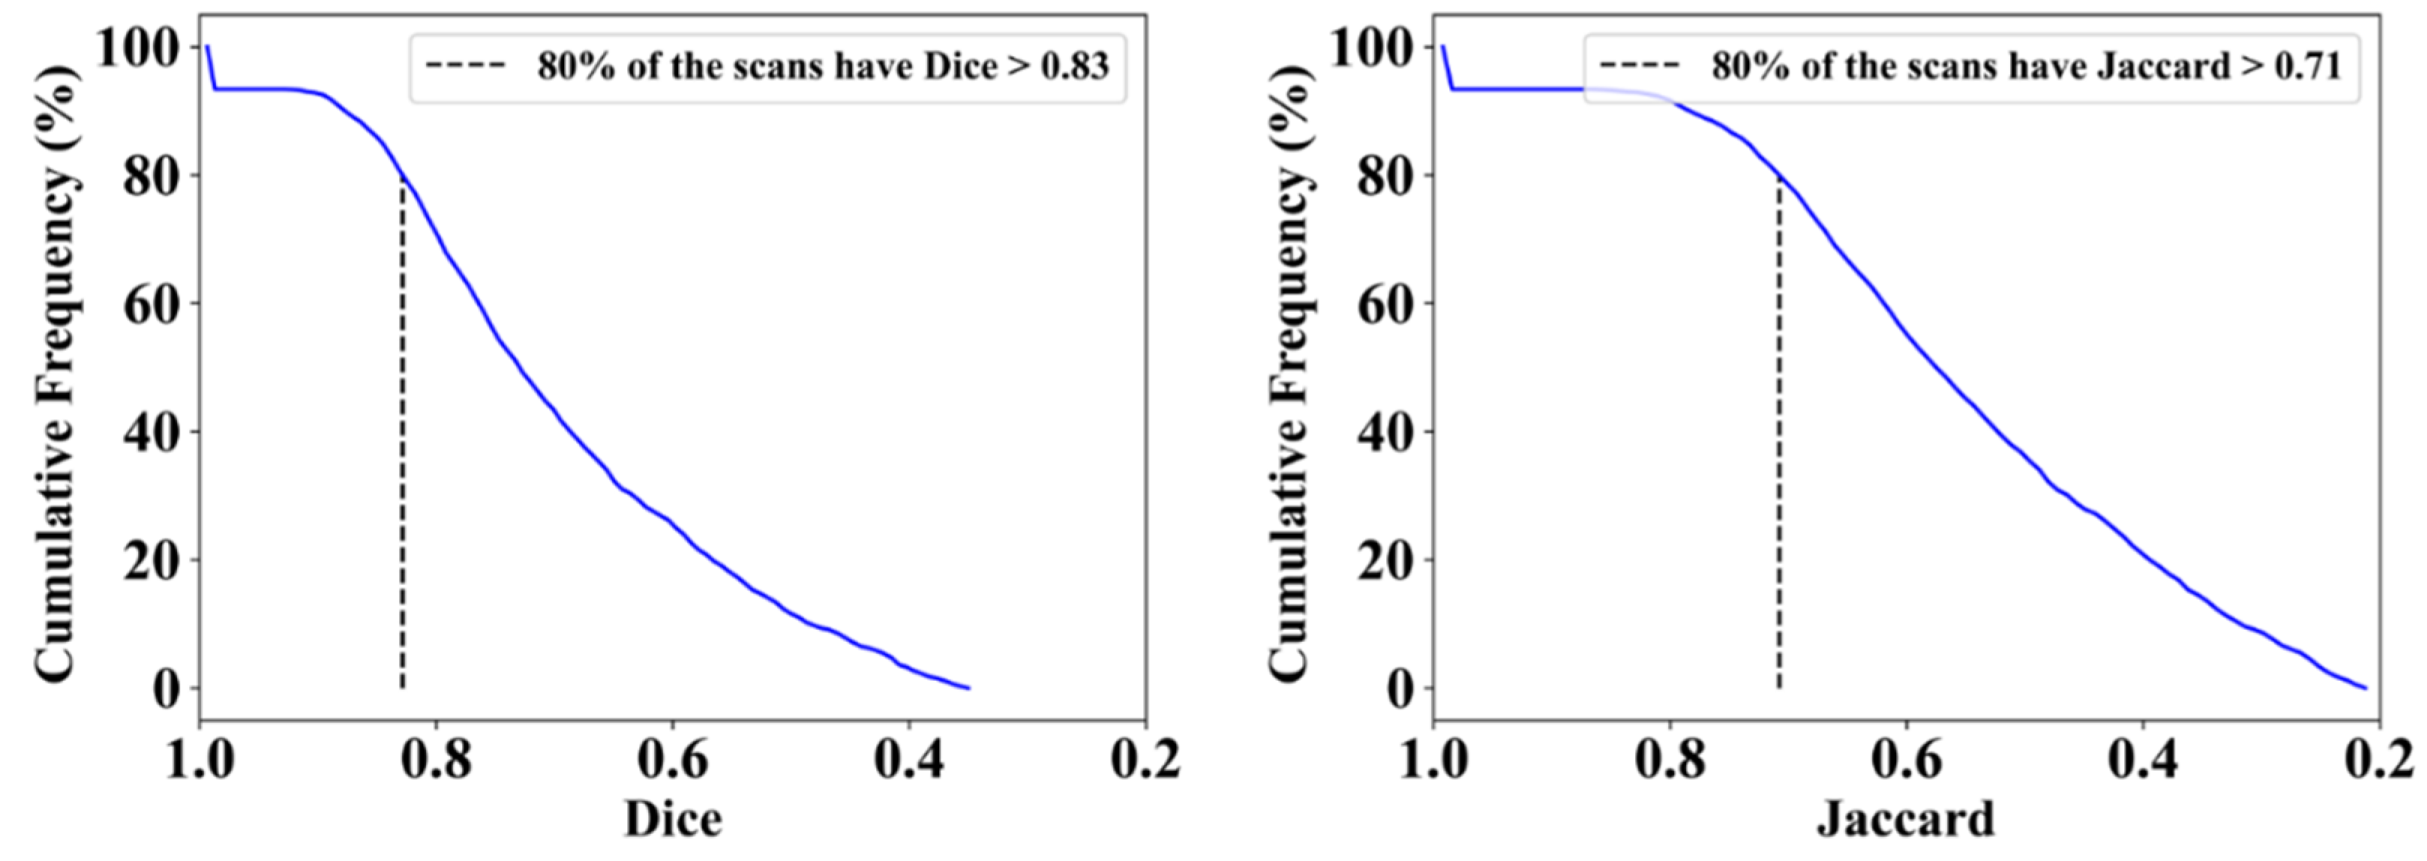
| ResNet-UNet | 0.83 | 9% | 0.71 | 15% | 0.80 | 4% | 0.68 | 8% |
| Mean of AI | 0.80 | 5% | 0.66 | 7% | 0.78 | 3% | 0.65 | 5% |
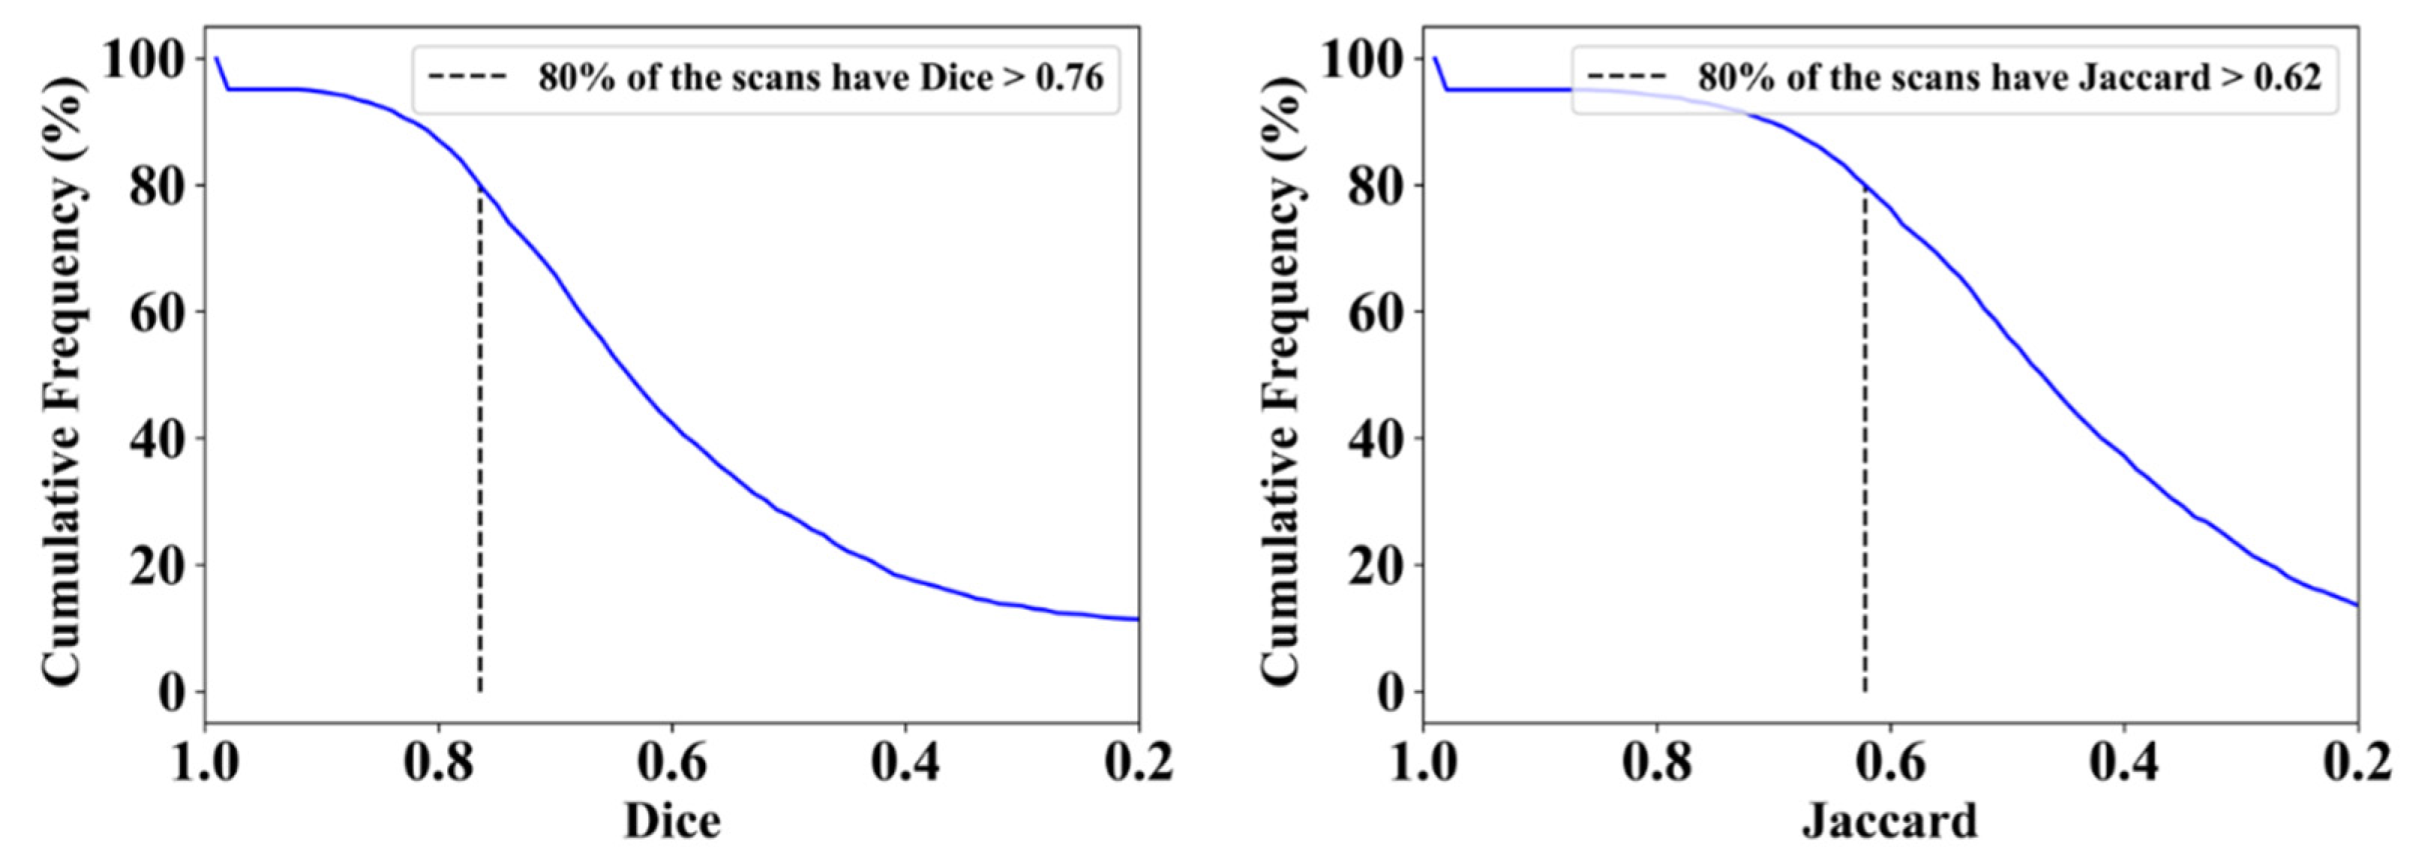
| MedSeg | 0.76 | - | 0.62 | - | 0.77 | - | 0.63 | - |
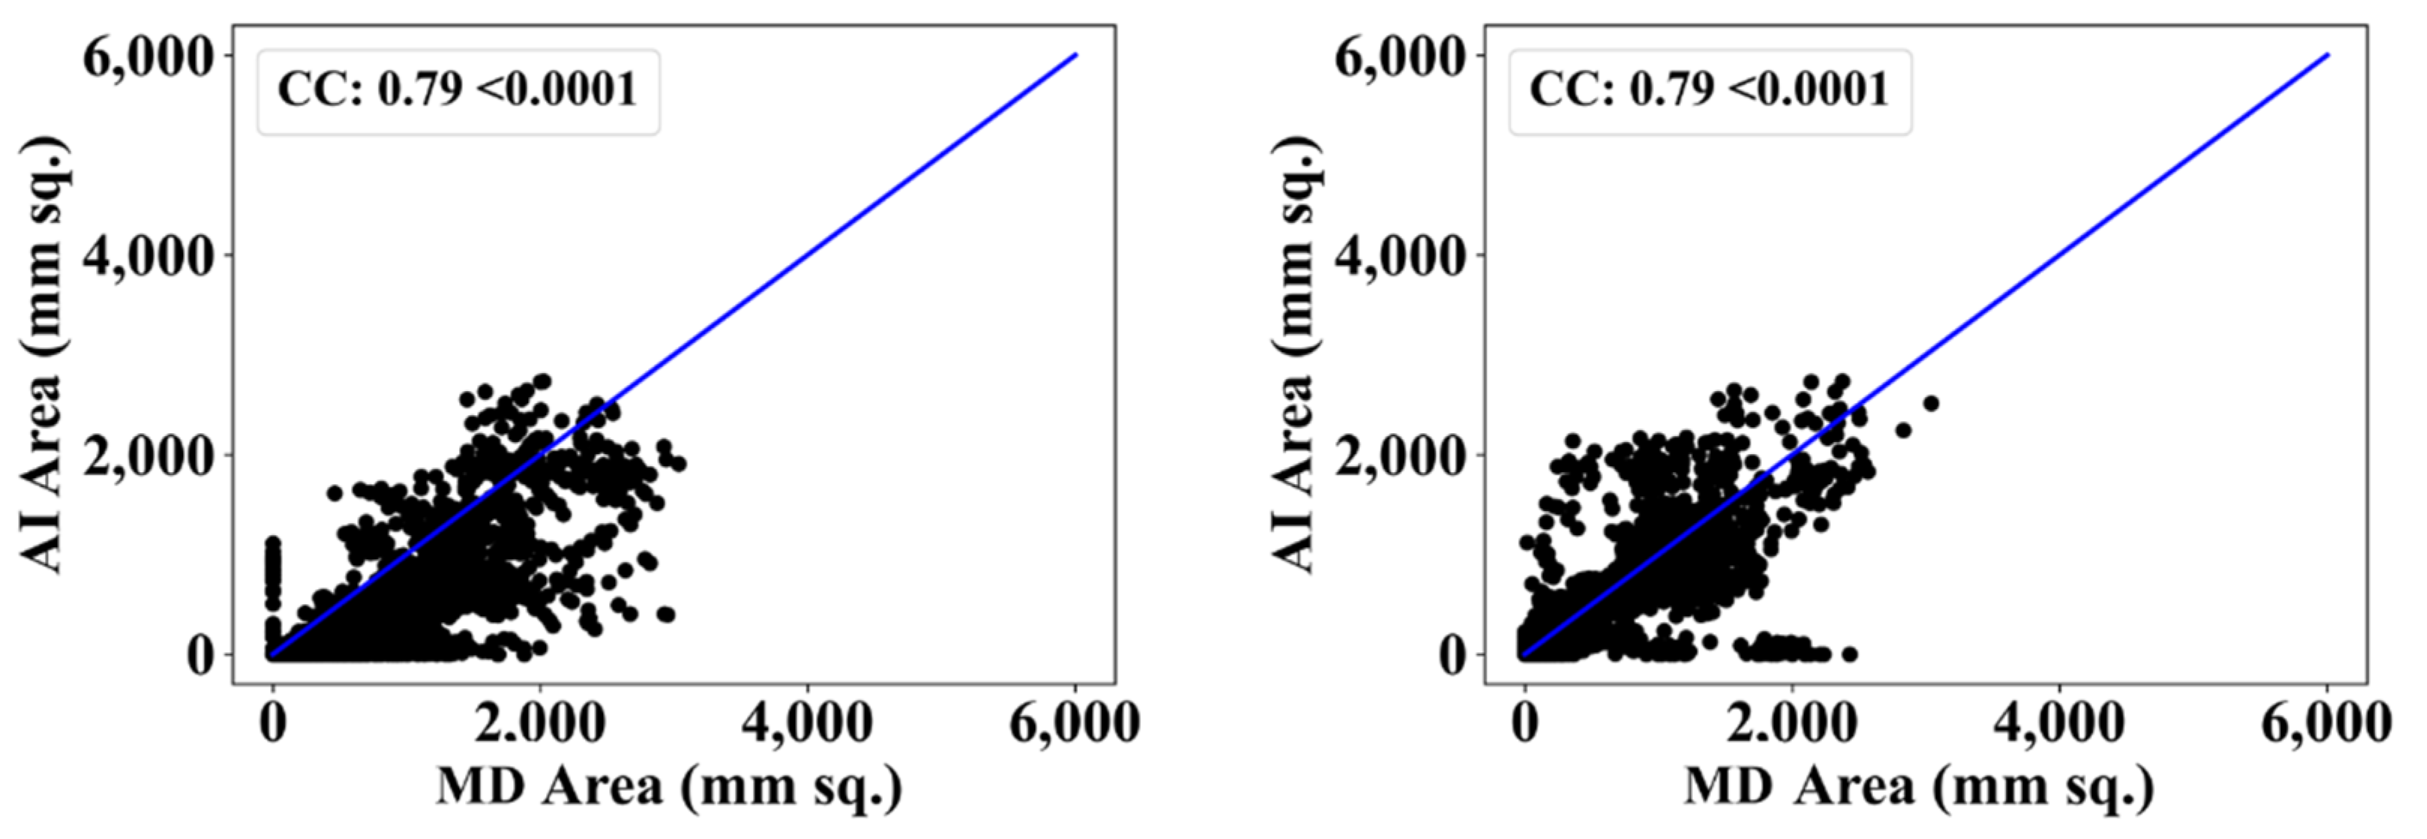
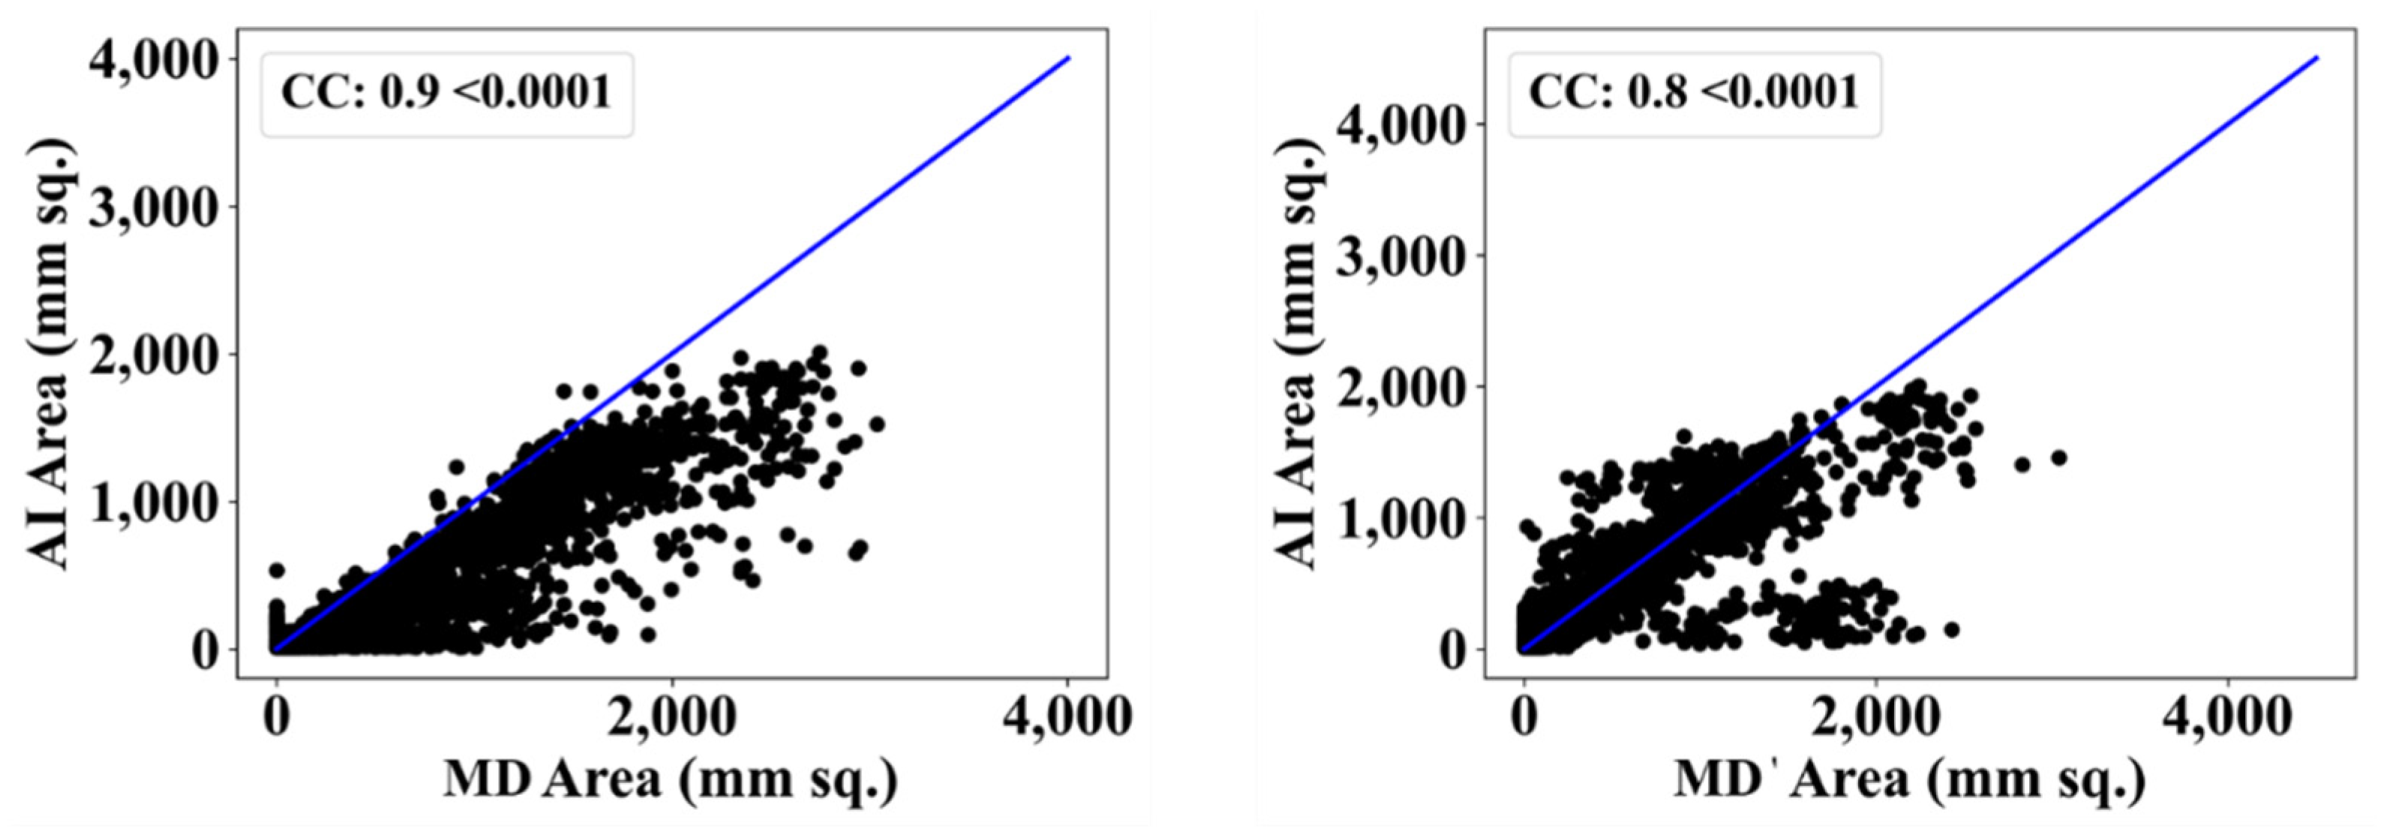
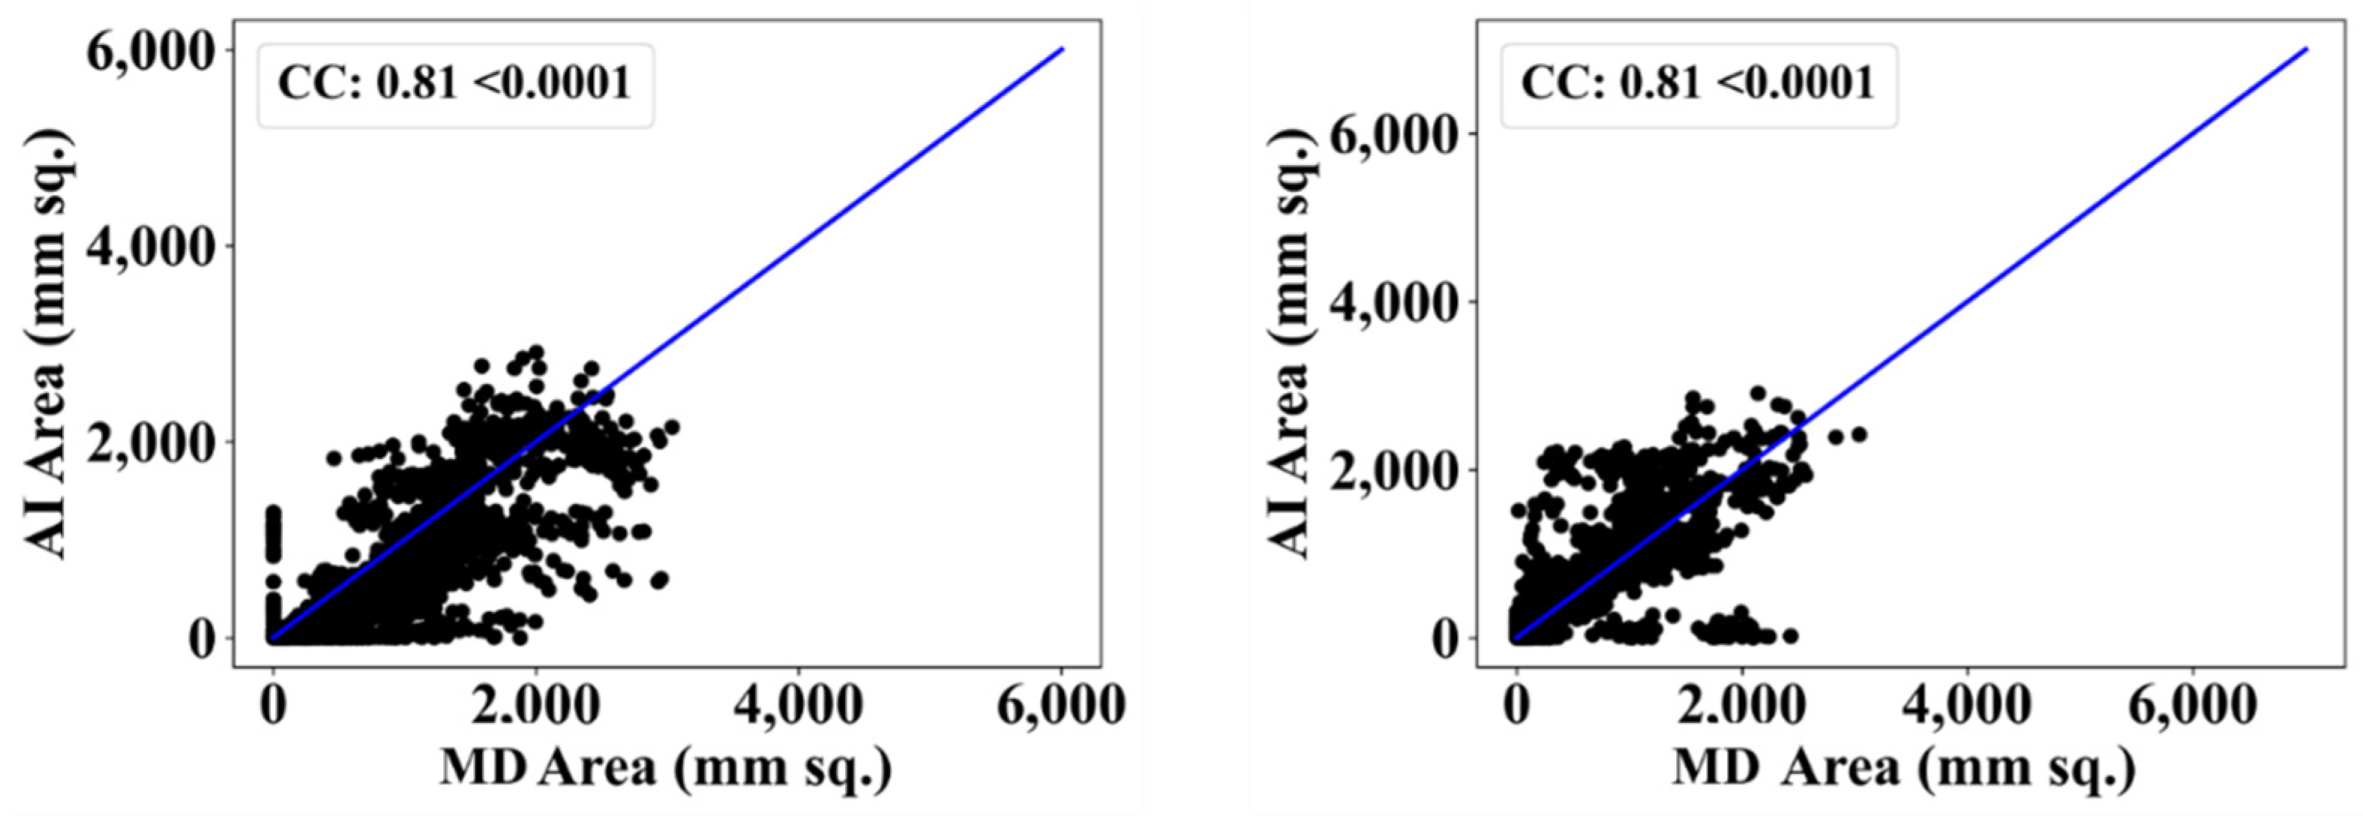
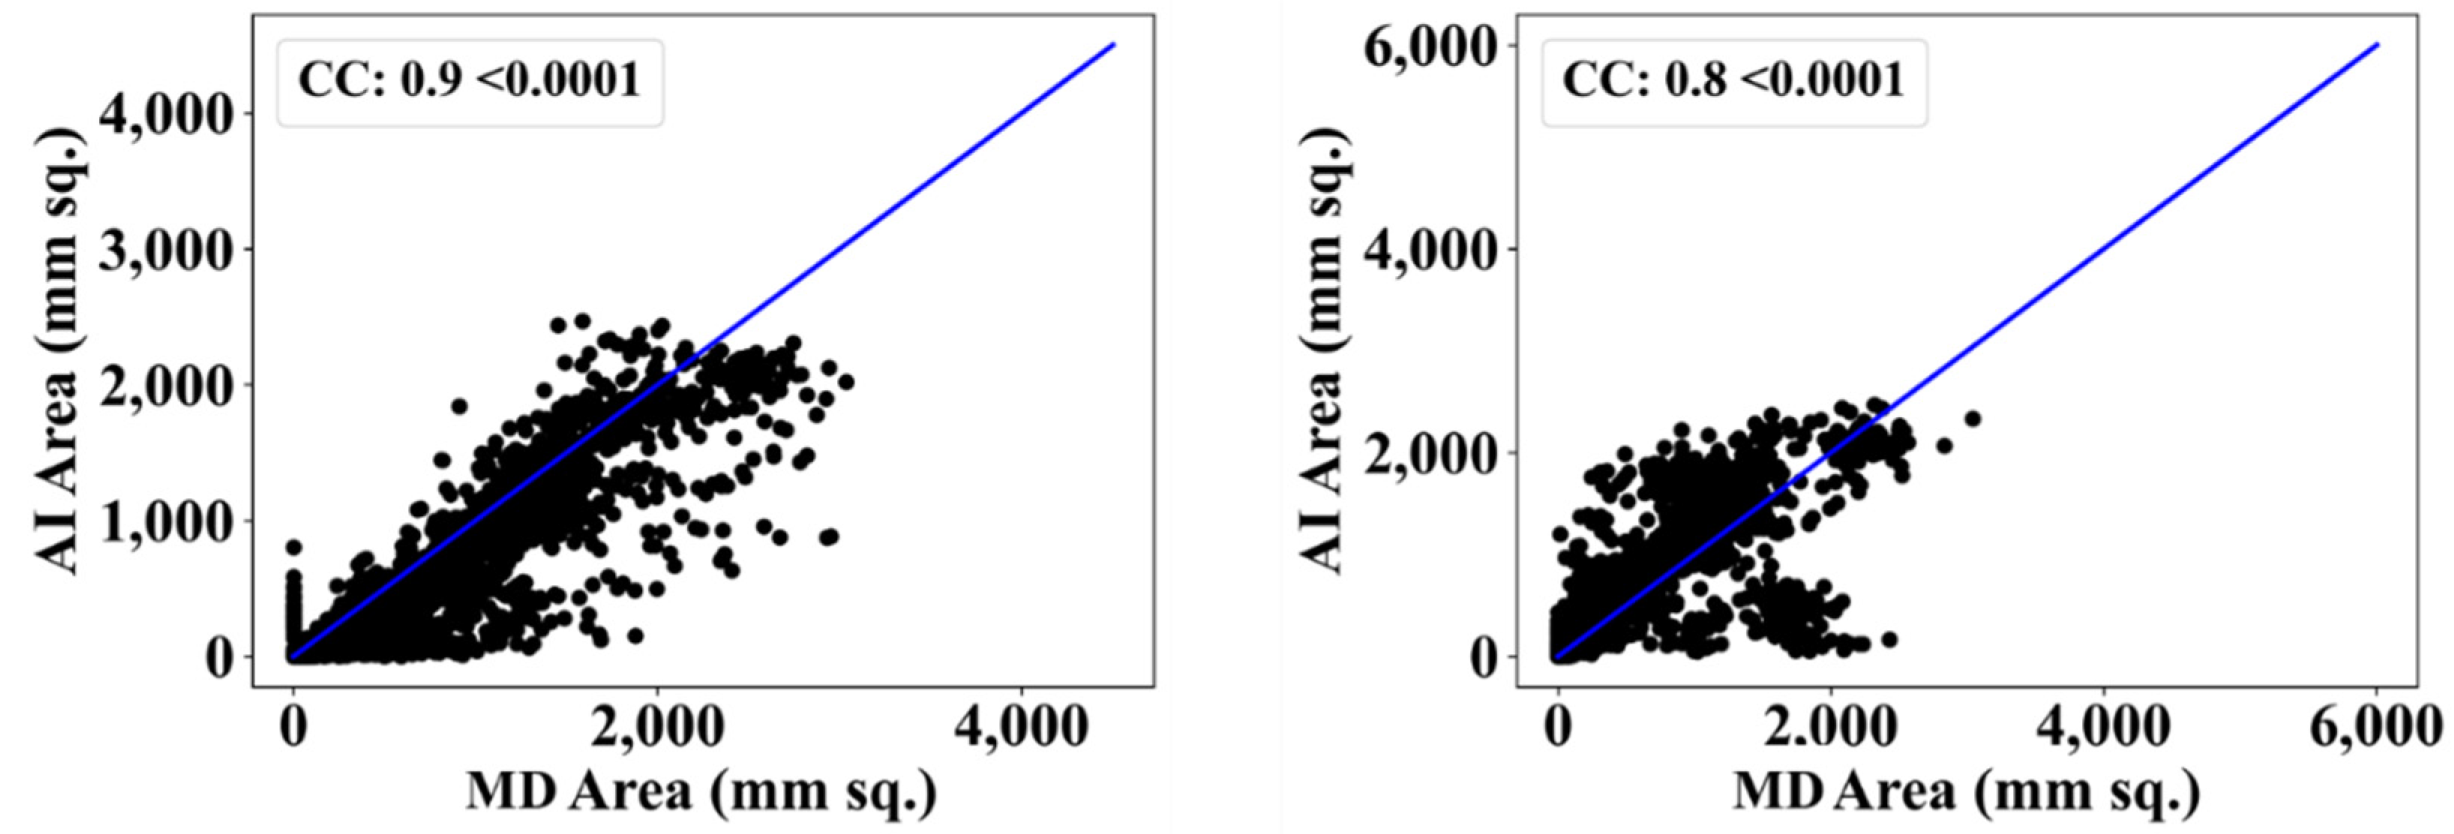
| MD 1 | MD 2 | |||
|---|---|---|---|---|
| CC | % Diff * | CC | % Diff * | |
| ResNet-SegNet | 0.90 | 11% | 0.80 | 2% |
| PSPNet | 0.90 | 11% | 0.81 | 1% |
| VGG-SegNet | 0.79 | 2% | 0.79 | 4% |
| VGG-UNet | 0.81 | 0% | 0.81 | 1% |
| ResNet-UNet | 0.92 | 14% | 0.80 | 2% |
| Mean AI | 0.86 | 8% | 0.80 | 2% |
| MedSeg | 0.81 | - | 0.82 | - |
| Paired t-Test | Mann-Whitney | Wilcoxon | |
|---|---|---|---|
| PSPNet vs. MD 1 | p < 0.0001 | p < 0.0001 | p < 0.0001 |
| PSPNet vs. MD 2 | p < 0.0001 | p < 0.0001 | p < 0.0001 |
| VGG-SegNet vs. MD 1 | p < 0.0001 | p < 0.0001 | p < 0.0001 |
| VGG-SegNet vs. MD 2 | p < 0.0001 | p < 0.0001 | p < 0.0001 |
| ResNet-SegNet vs. MD 1 | p < 0.0001 | p < 0.0001 | p < 0.0001 |
| ResNet-SegNet vs. MD 2 | p < 0.0001 | p < 0.0001 | p < 0.0001 |
| VGG-UNet vs. MD 1 | p < 0.0001 | p < 0.0001 | p < 0.0001 |
| VGG-UNet vs. MD 2 | p < 0.0001 | p < 0.0001 | p < 0.0001 |
| ResNet-UNet vs. MD 1 | p < 0.0001 | p < 0.0001 | p < 0.0001 |
| ResNet-UNet vs. MD 2 | p < 0.0001 | p < 0.0001 | p < 0.0001 |
| MedSeg vs. MD 1 | p < 0.0001 | p < 0.0001 | p < 0.0001 |
| MedSeg vs. MD 2 | p < 0.0001 | p < 0.0001 | p < 0.0001 |
| MD 1 vs. MD 2 | p < 0.0001 | p < 0.0001 | p < 0.0001 |
| SN | Attributes | PSP-Net | VGG-SegNet | VGG-UNet | ResNet-SegNet | ResNet-UNet |
|---|---|---|---|---|---|---|
| 1 | Backbone-encoder | NA | VGG-16 | VGG-16 | Res-50 | Res-50 |
| 2 | # Parameters | ~4.4 M | ~11.6 M | ~12.4 M | ~15 M | ~16.5 M |
| 3 | # NN layers | 54 | 33 | 36 | 160 | 165 |
| 4 | Model size (MB) | 50 | 133 | 142 | 171 | 188 |
| 5 | Batch size | 8 | 8 | 4 | 4 | 4 |
| 6 | Training time * | ~15 | ~50 | ~54 | ~60 | ~63 |
| 7 | Prediction time | <1 s | <1 s | <1 s | <1 s | <1 s |
| A1 | A2 | A3 | A4 | A5 | A6 | A7 | A8 | A9 | A10 | A11 | A12 | A13 | A14 | A15 | A16 | A17 | A18 |
|---|---|---|---|---|---|---|---|---|---|---|---|---|---|---|---|---|---|
| Author | Year | Model | Classifier | # Patients | # Img | # GT Tracings | Focus | Objective | Modality | Opt& | Augm# | DSC | ACC | AUC | Rad * | CE | Bench |
| Ding et al. [109] | 2021 | MT-nCov-Net | Res2Net50 | 189 | 36485 | 8 | Segm. | Lesion | CT | ✓ | ✓ | 0.86 | 99.61 | 0.92 | 3 | ✓ | ✓ |
| Hou et al. [110] | 2021 | Improved Canny edge detector | NA | 271 | 812 | NA | NA | Lesion | CT | ✓ | 🗶 | 🗶 | 🗶 | 🗶 | 🗶 | 🗶 | 🗶 |
| Lizzi et al. [112] | 2021 | Cascaded UNet | NA | NA | NA | NA | Class. + Segm. | Lesion | CT | ✓ | ✓ | 0.62 | 93 | 🗶 | 1 | ✓ | 🗶 |
| Qi et al. [113] | 2021 | DR-MIL | (ResNet-50 and Xception | 241 | 2410 | 1 | NA | NA | CT | 🗶 | ✓ | 🗶 | 95 | 0.943 | 🗶 | ✓ | ✓ |
| Paluru et al. [114] | 2021 | Anam-Net | custom (UNet + ENet) | 69 | 4339 | 1 | Segm. | Lesion | CT | ✓ | 🗶 | 0.77 | 98 | 🗶 | 🗶 | ✓ | ✓ |
| Zhang et al. [115] | 2020 | CoSinGAN | NA | 70 | 704 | 1 | Class. + Segm. | Lesion | CT | ✓ | ✓ | 0.75 | 🗶 | 🗶 | 🗶 | 🗶 | ✓ |
| Singh et al. [111] | 2021 | LungINFseg | Modified UNet | 20 | 1800 | 1 | Heatmap + Segm. | Lesion | CT | ✓ | ✓ | 0.8 | 80 | 🗶 | 🗶 | 🗶 | ✓ |
| Amyar et al. [117] | 2020 | UNet | NA | 1369 | 1369 | 1 | Class. + Segm. | Lesion | CT | ✓ | 🗶 | 0.88 | 94 | 0.97 | 🗶 | ✓ | ✓ |
| Budak et al. [116] | 2021 | A-SegNet | NA | 69 | 473 | 1 | Segm. | Lesion | CT | ✓ | 🗶 | 0.89 | 🗶 | 🗶 | 🗶 | 🗶 | 🗶 |
| Cai et al. [118] | 2020 | UNet | NA | 99 | 250 | 1 | Class. + Segm. | Lung + lesion + predict ICU stay | CT | ✓ | 🗶 | 0.77 | 🗶 | 🗶 | 🗶 | ✓ | 🗶 |
| Ma et al. [119] | 2021 | UNet | NA | 70 | NA | 1 | Segm. | Lesion | CT | ✓ | 🗶 | 0.67 | 🗶 | 🗶 | 2 | ✓ | ✓ |
| Kuchana et al. [120] | 2020 | UNet and attention UNet, | NA | 50 | 929 | 1 | Segm. | Lung + lesion | CT | ✓ | 🗶 | 0.84 | 🗶 | 🗶 | 1 | 🗶 | 🗶 |
| Suri et al. [proposed] | 2021 | PSPNet, VGG-SegNet ResNet-SegNet VGG-UNet ResNet-UNet | VGG, ResNet | 40 | 3000 | 2 | Segm. | Lesion | CT | ✓ | 🗶 | 0.79 0.79 0.77 0.80 0.83 | 0.95 0.96 0.95 0.97 0.98 | 0.95 0.94 0.87 0.91 0.87 | 2 | ✓ | ✓ |
Publisher’s Note: MDPI stays neutral with regard to jurisdictional claims in published maps and institutional affiliations. |
© 2022 by the authors. Licensee MDPI, Basel, Switzerland. This article is an open access article distributed under the terms and conditions of the Creative Commons Attribution (CC BY) license (https://creativecommons.org/licenses/by/4.0/).
Share and Cite
Suri, J.S.; Agarwal, S.; Chabert, G.L.; Carriero, A.; Paschè, A.; Danna, P.S.C.; Saba, L.; Mehmedović, A.; Faa, G.; Singh, I.M.; et al. COVLIAS 1.0Lesion vs. MedSeg: An Artificial Intelligence Framework for Automated Lesion Segmentation in COVID-19 Lung Computed Tomography Scans. Diagnostics 2022, 12, 1283. https://0-doi-org.brum.beds.ac.uk/10.3390/diagnostics12051283
Suri JS, Agarwal S, Chabert GL, Carriero A, Paschè A, Danna PSC, Saba L, Mehmedović A, Faa G, Singh IM, et al. COVLIAS 1.0Lesion vs. MedSeg: An Artificial Intelligence Framework for Automated Lesion Segmentation in COVID-19 Lung Computed Tomography Scans. Diagnostics. 2022; 12(5):1283. https://0-doi-org.brum.beds.ac.uk/10.3390/diagnostics12051283
Chicago/Turabian StyleSuri, Jasjit S., Sushant Agarwal, Gian Luca Chabert, Alessandro Carriero, Alessio Paschè, Pietro S. C. Danna, Luca Saba, Armin Mehmedović, Gavino Faa, Inder M. Singh, and et al. 2022. "COVLIAS 1.0Lesion vs. MedSeg: An Artificial Intelligence Framework for Automated Lesion Segmentation in COVID-19 Lung Computed Tomography Scans" Diagnostics 12, no. 5: 1283. https://0-doi-org.brum.beds.ac.uk/10.3390/diagnostics12051283