
Photon Counting CT Angiography of the Head and Neck: Image Quality Assessment of Polyenergetic and Virtual Monoenergetic Reconstructions

 , , and
Abstract
:1. Introduction
2. Materials and Methods
2.1. Patient Population
2.2. CT Protocols and Image Acquisition
2.3. Quantitative Image Analysis
2.4. Qualitative Image Analysis
2.5. Statistical Analysis
3. Results
3.1. Patient Population and Radiation Dose Parameters
3.2. Objective Analysis
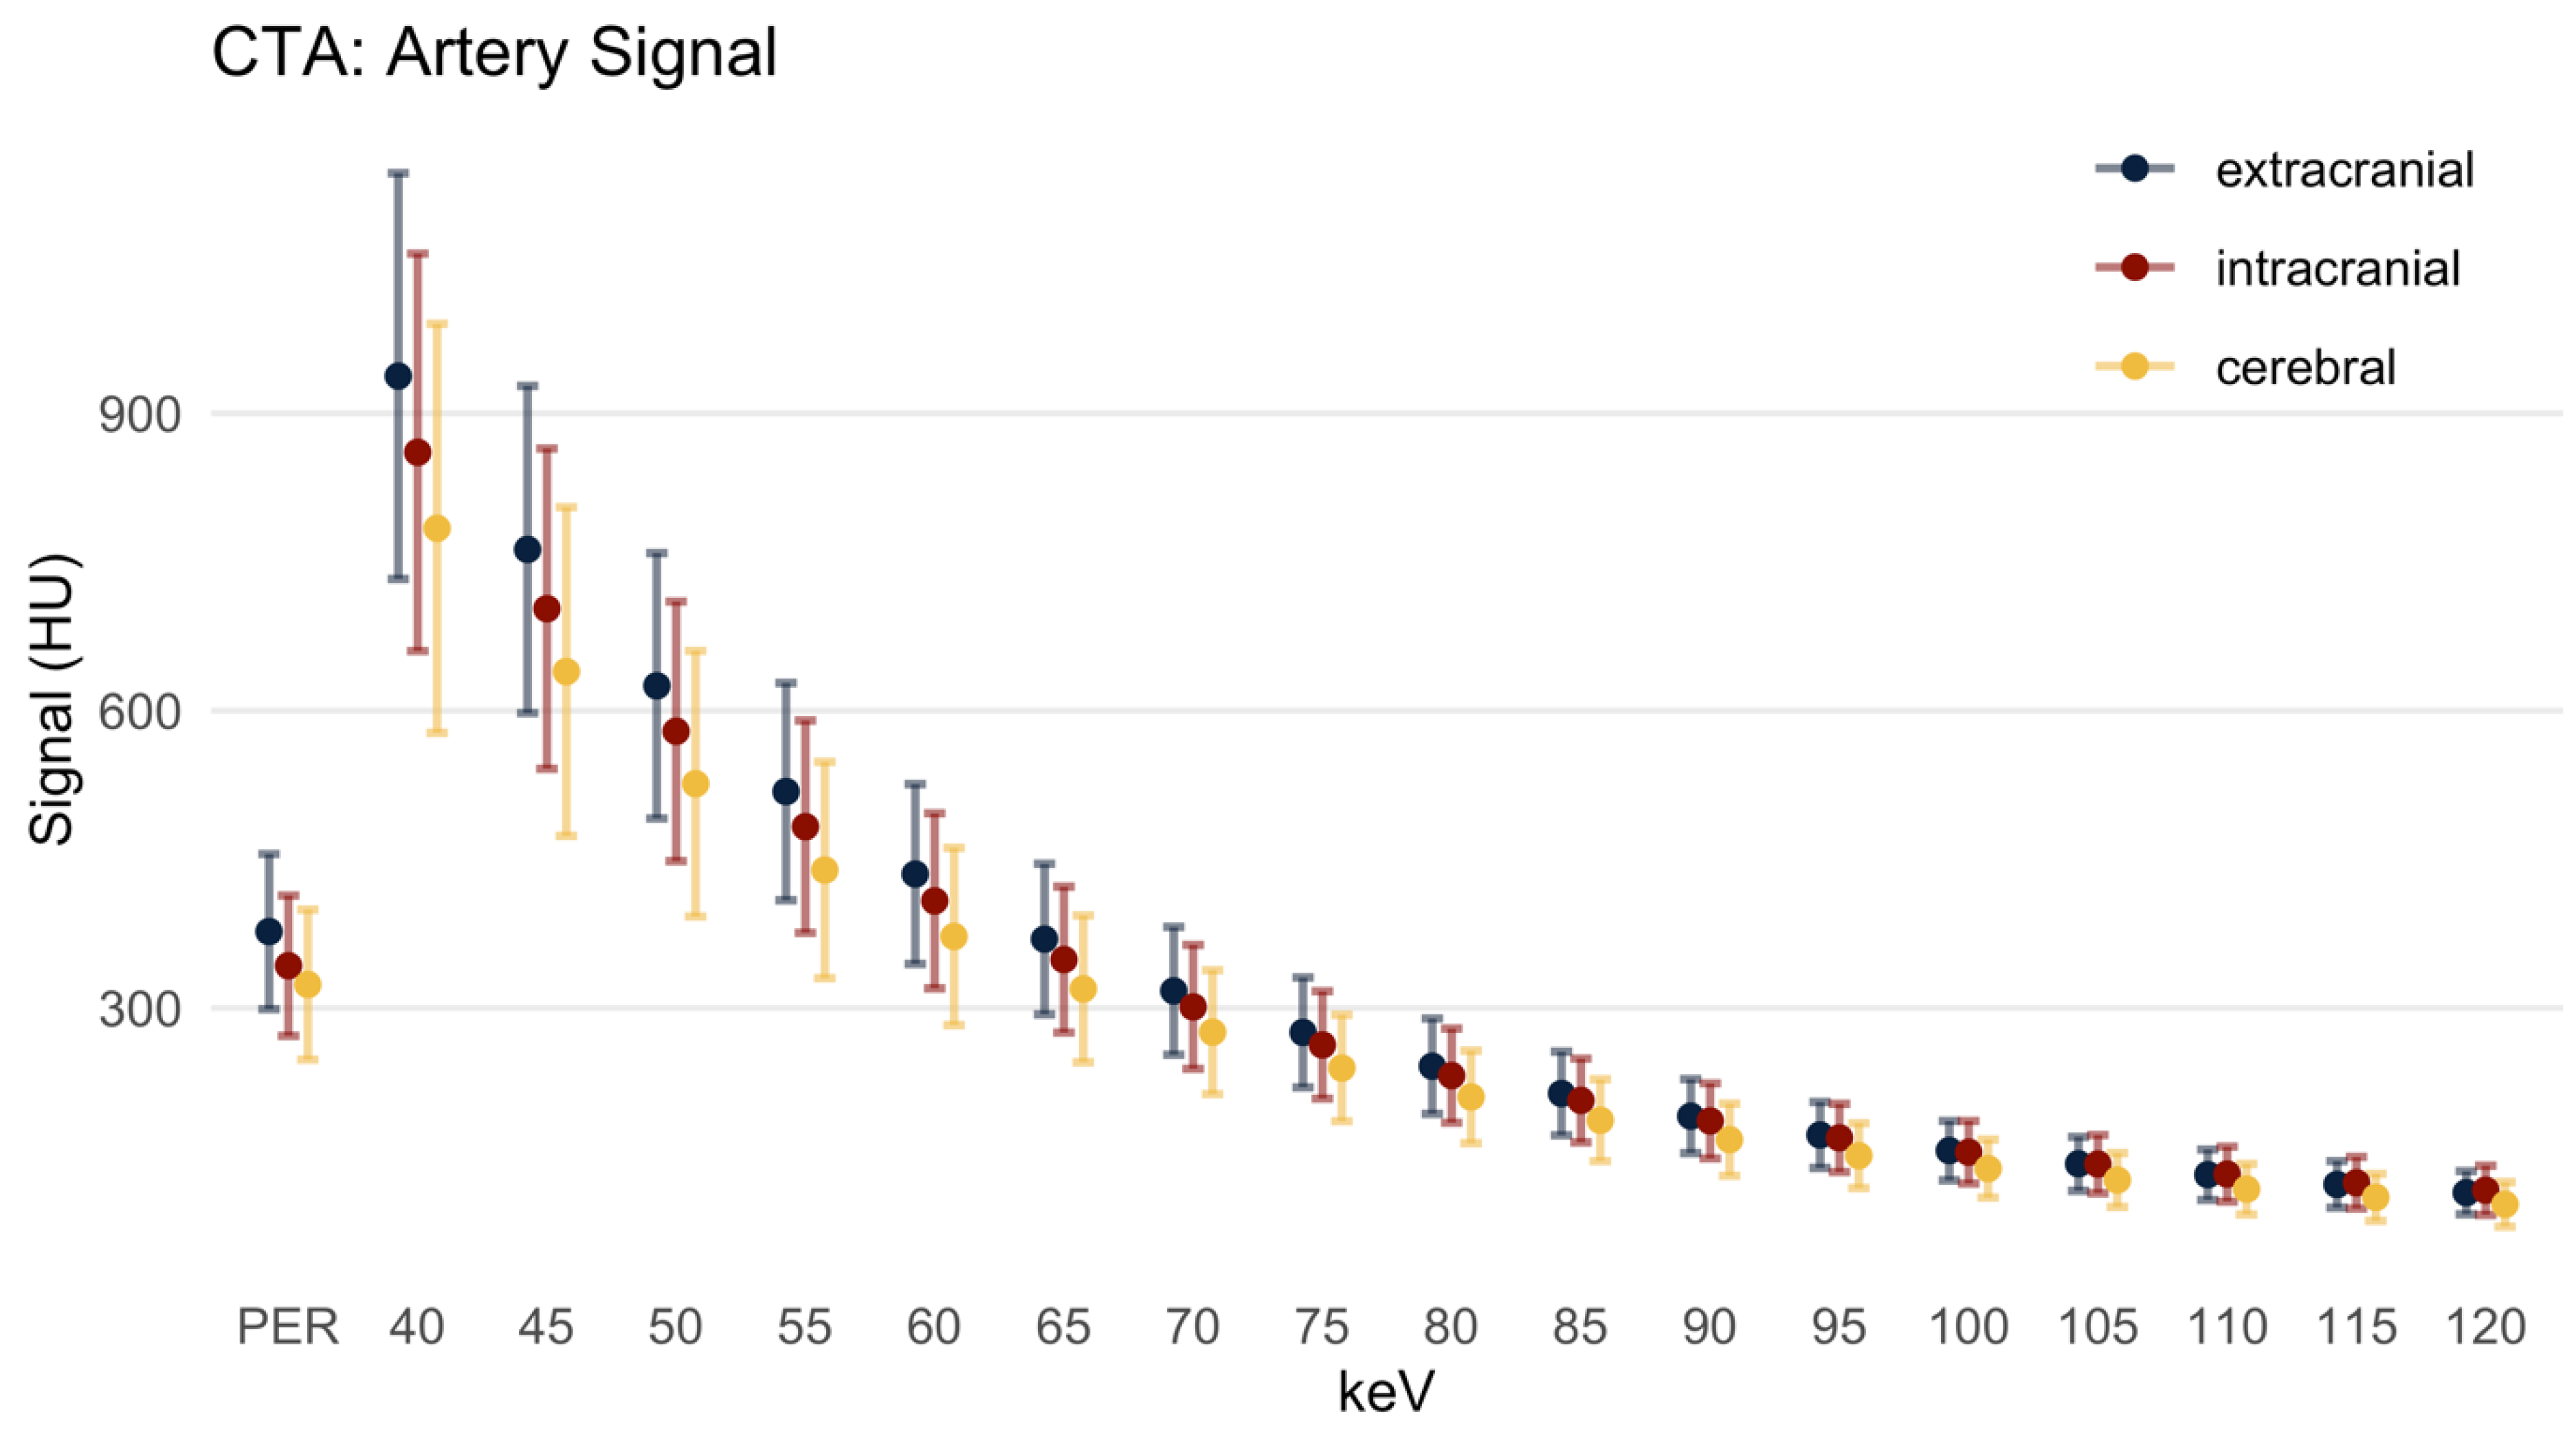
3.2.1. Signal
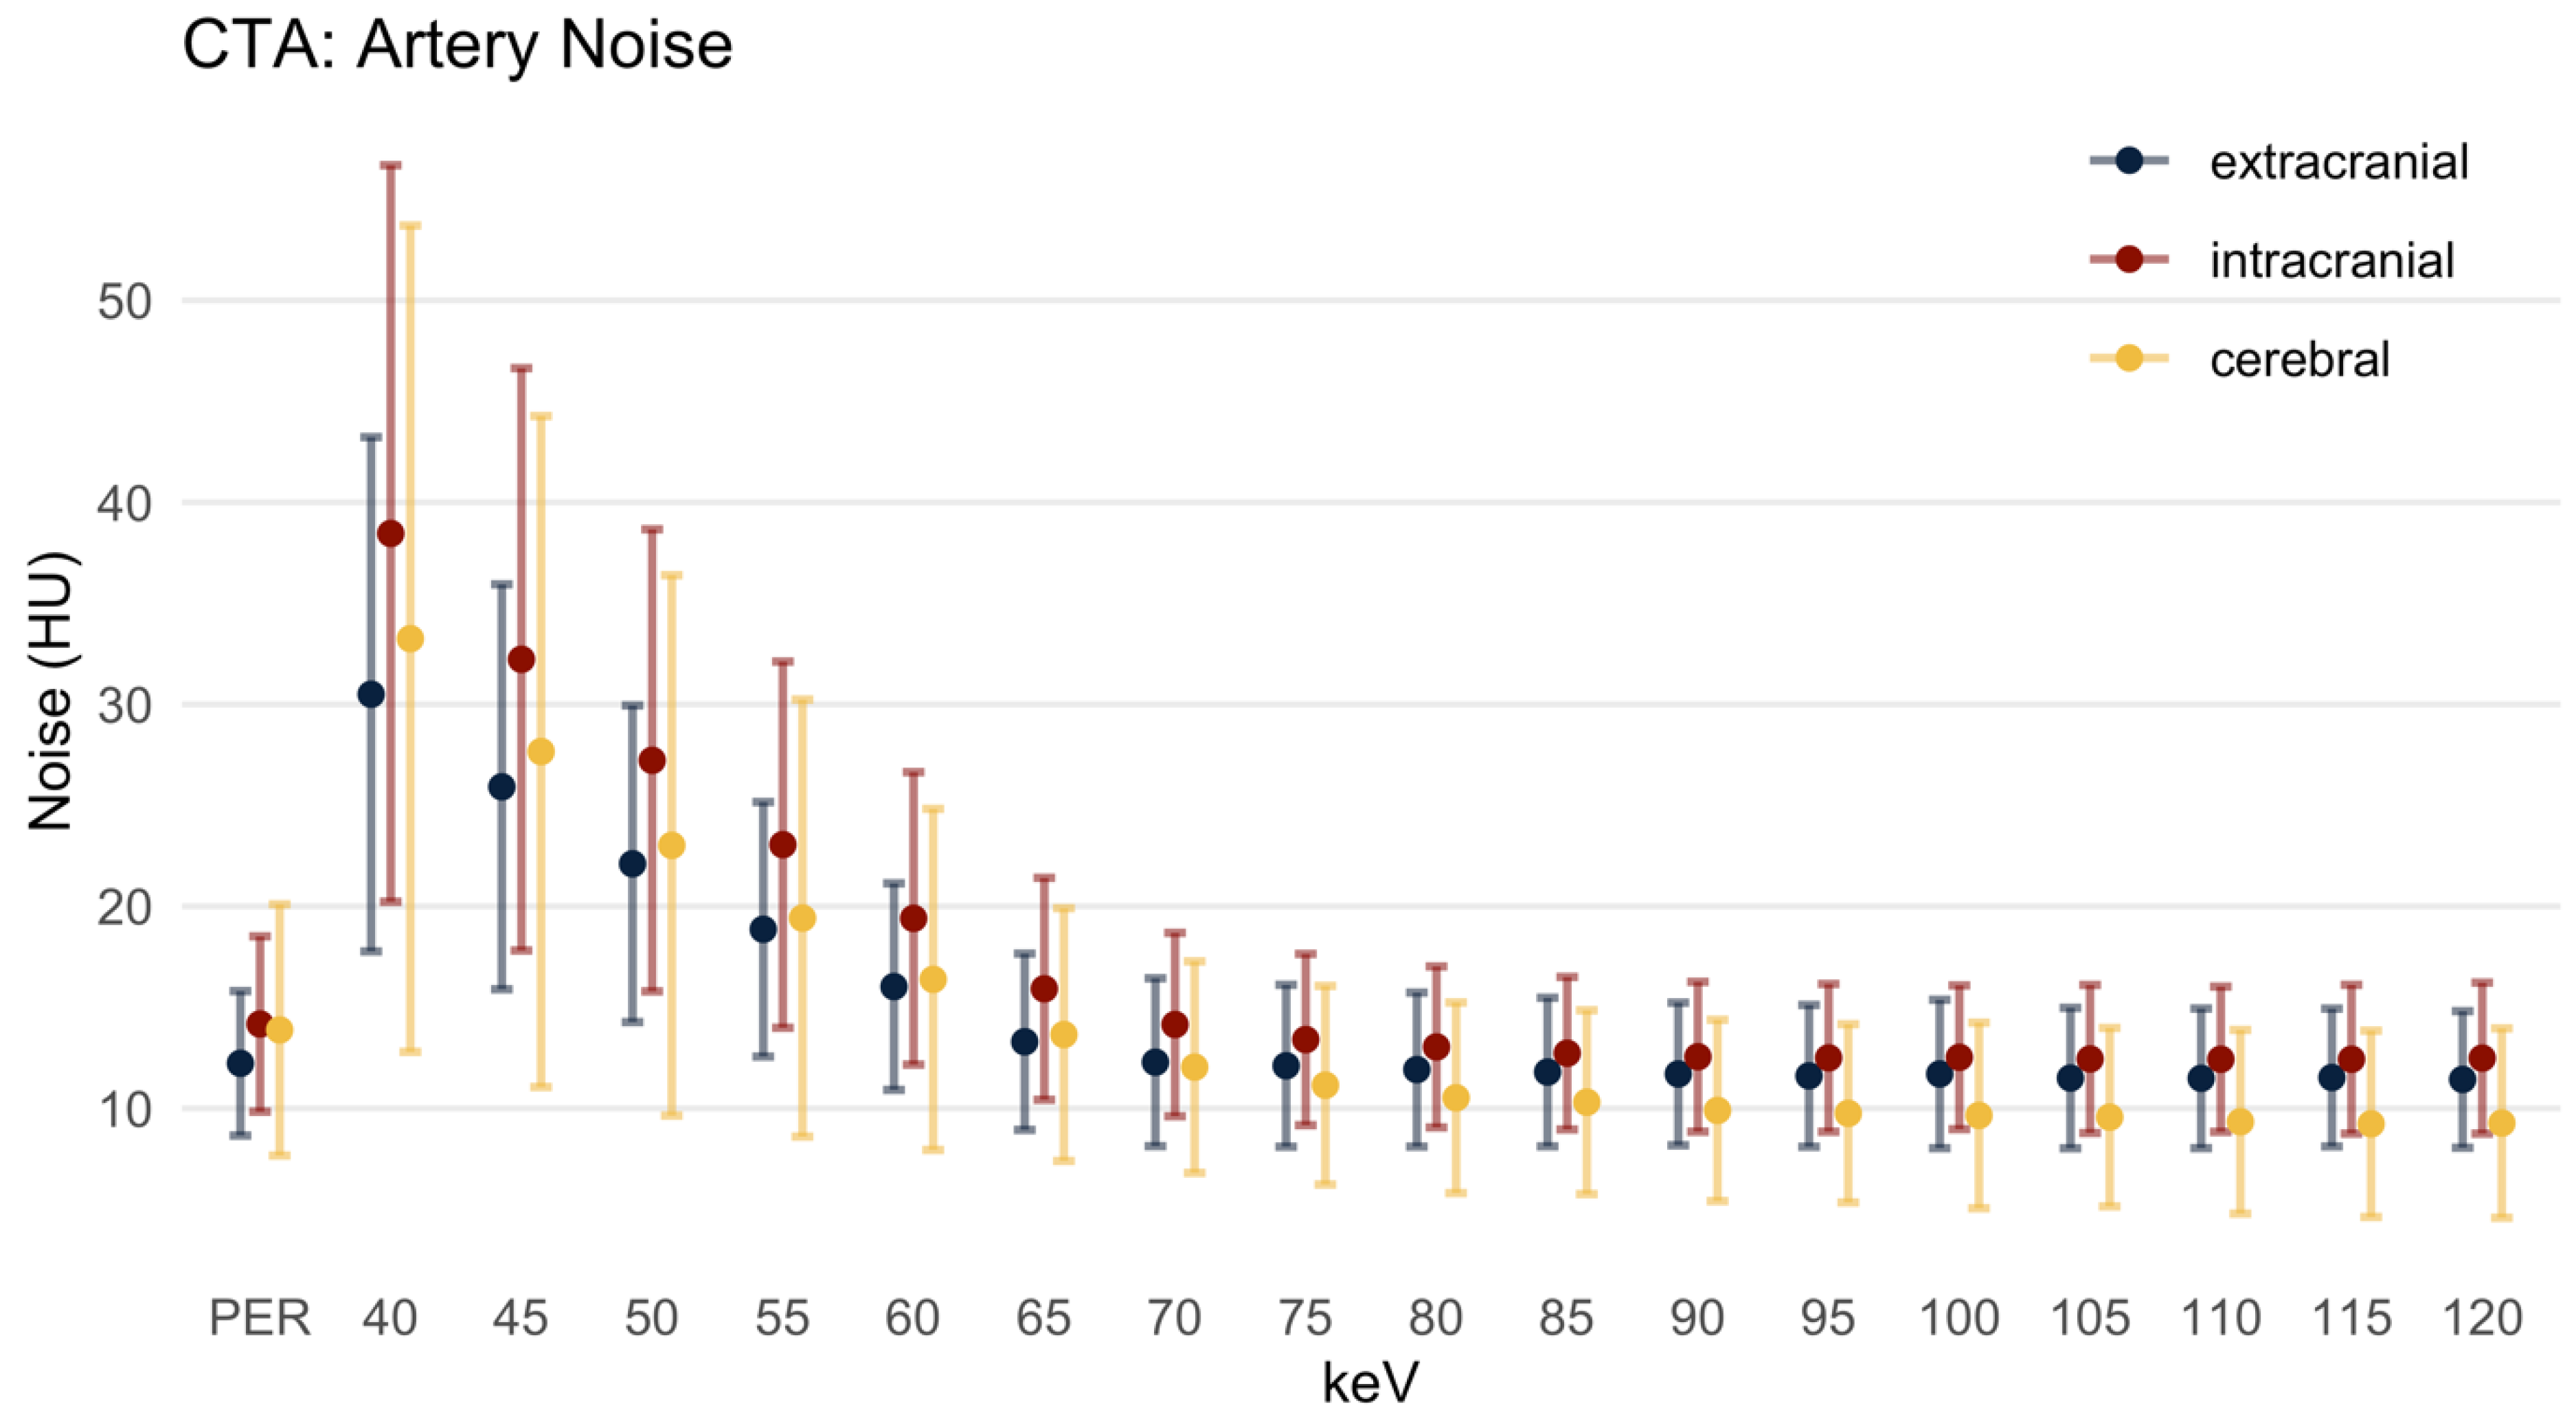
3.2.2. Image Noise
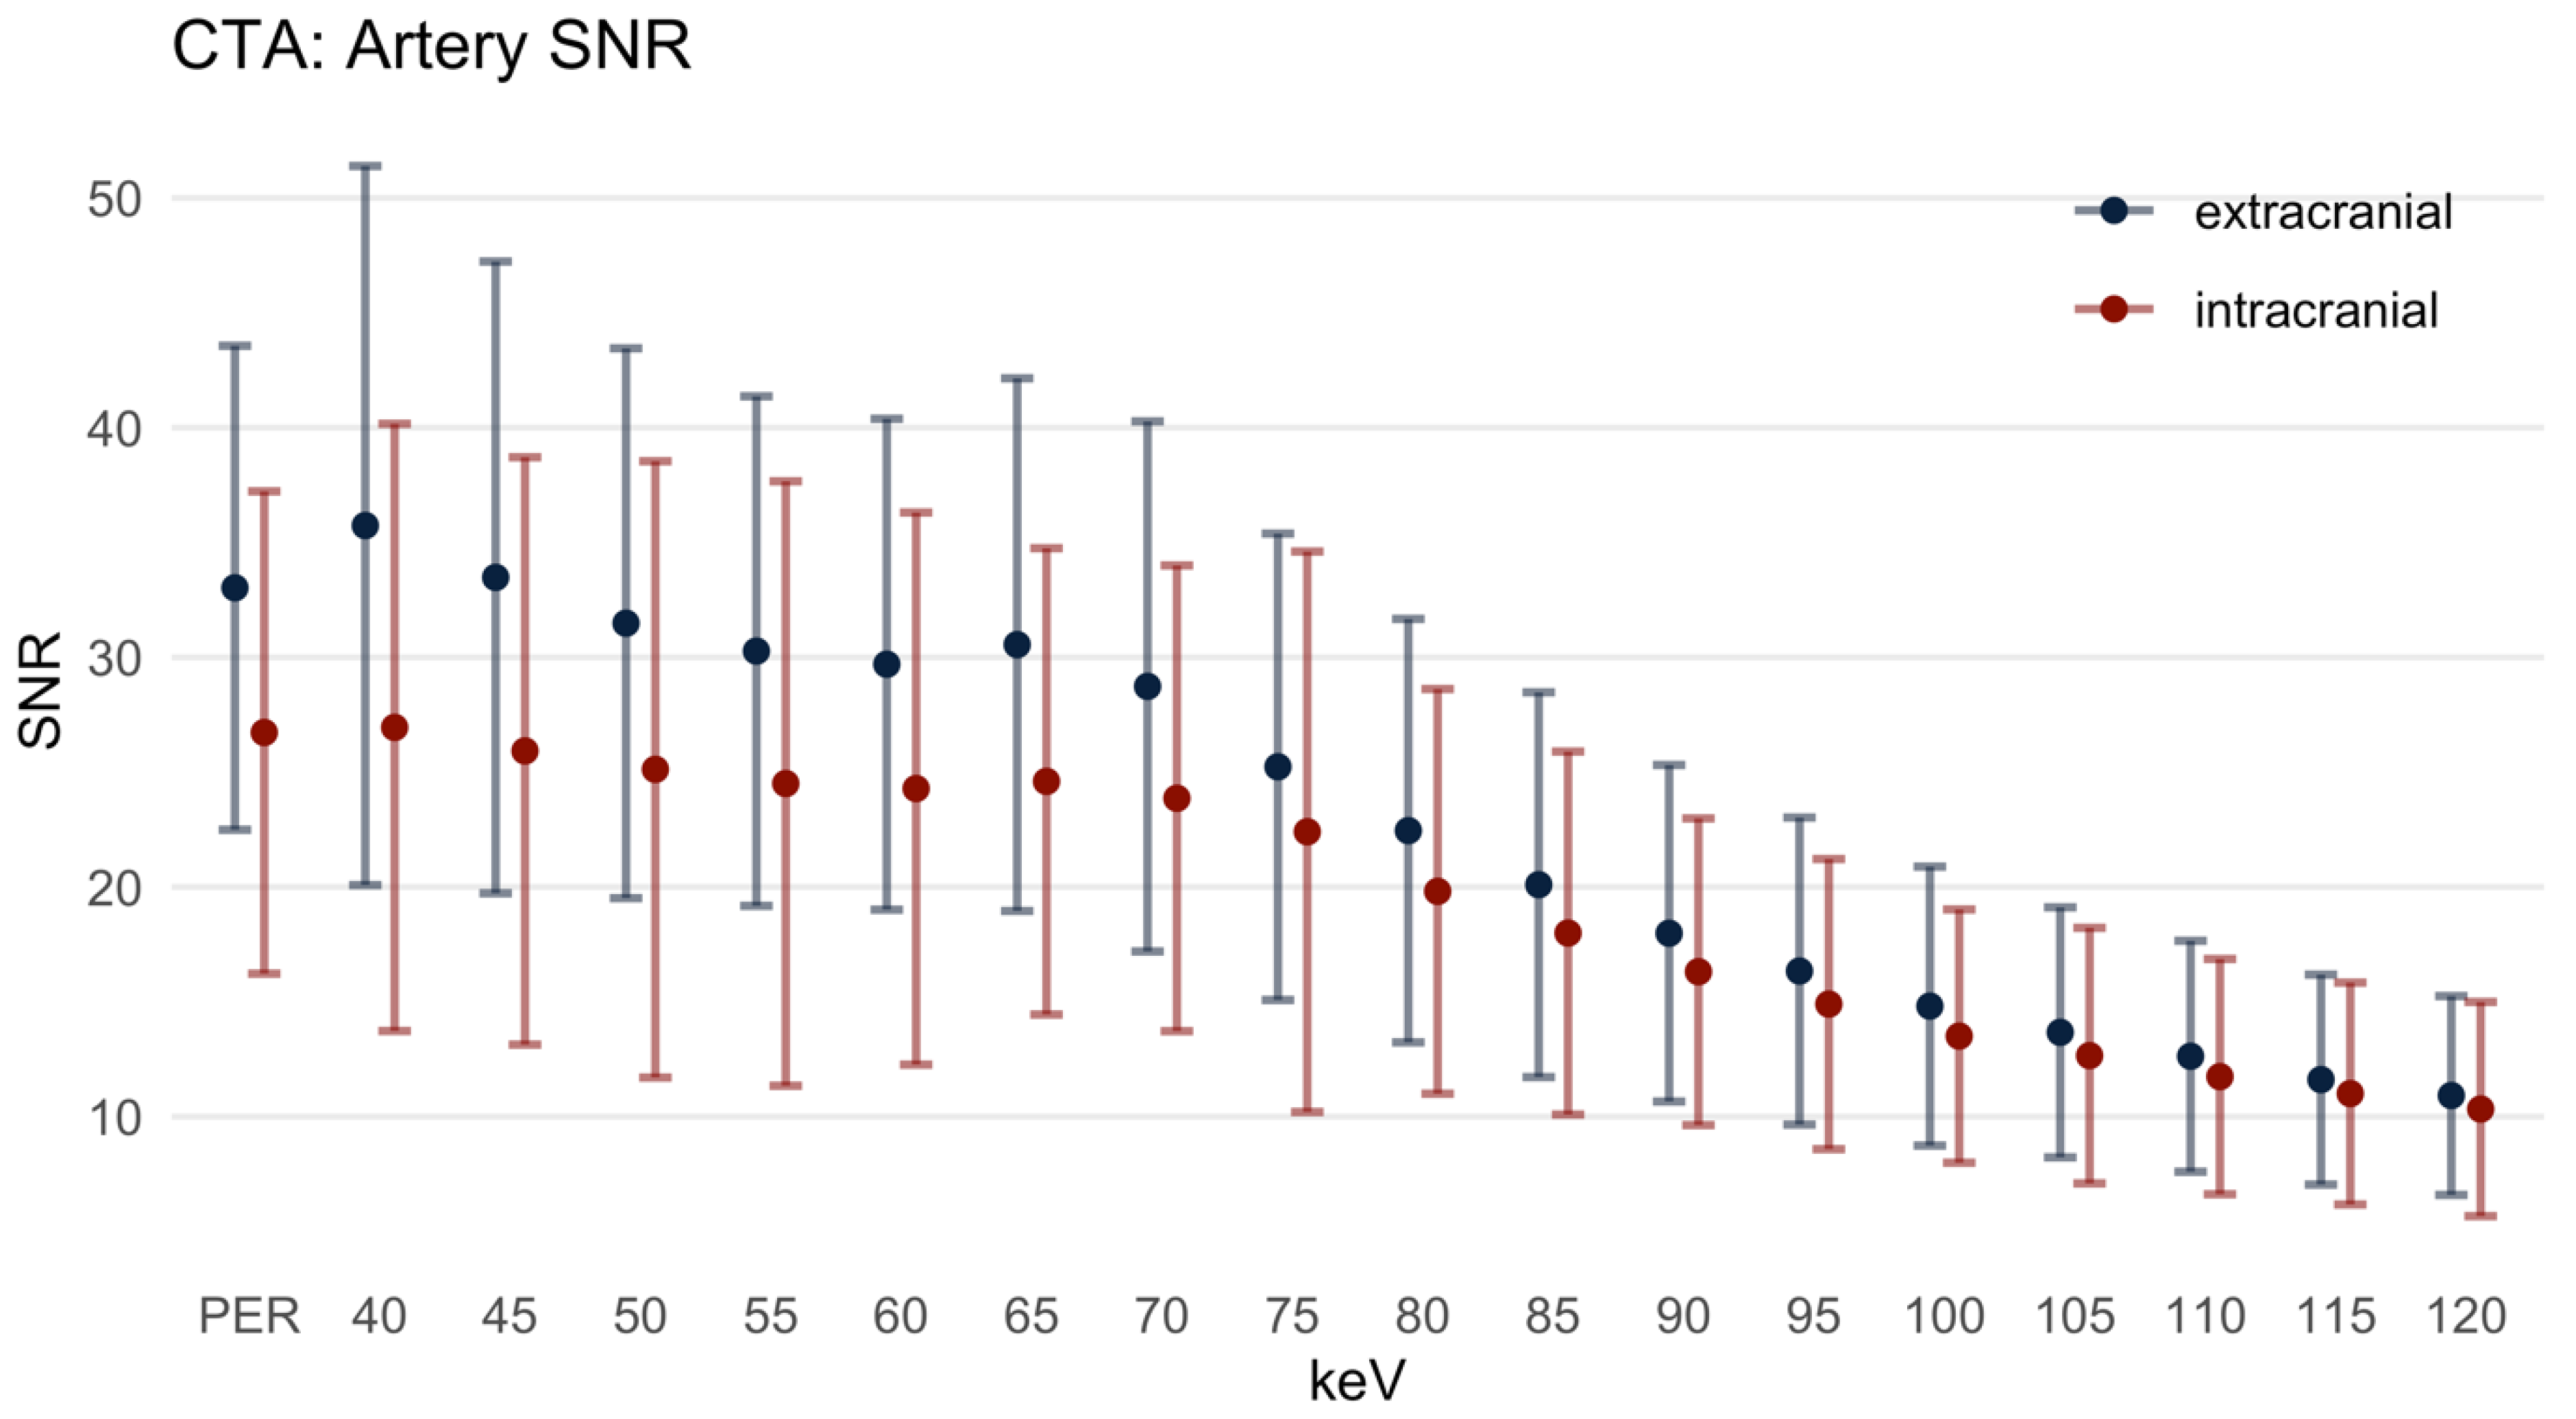
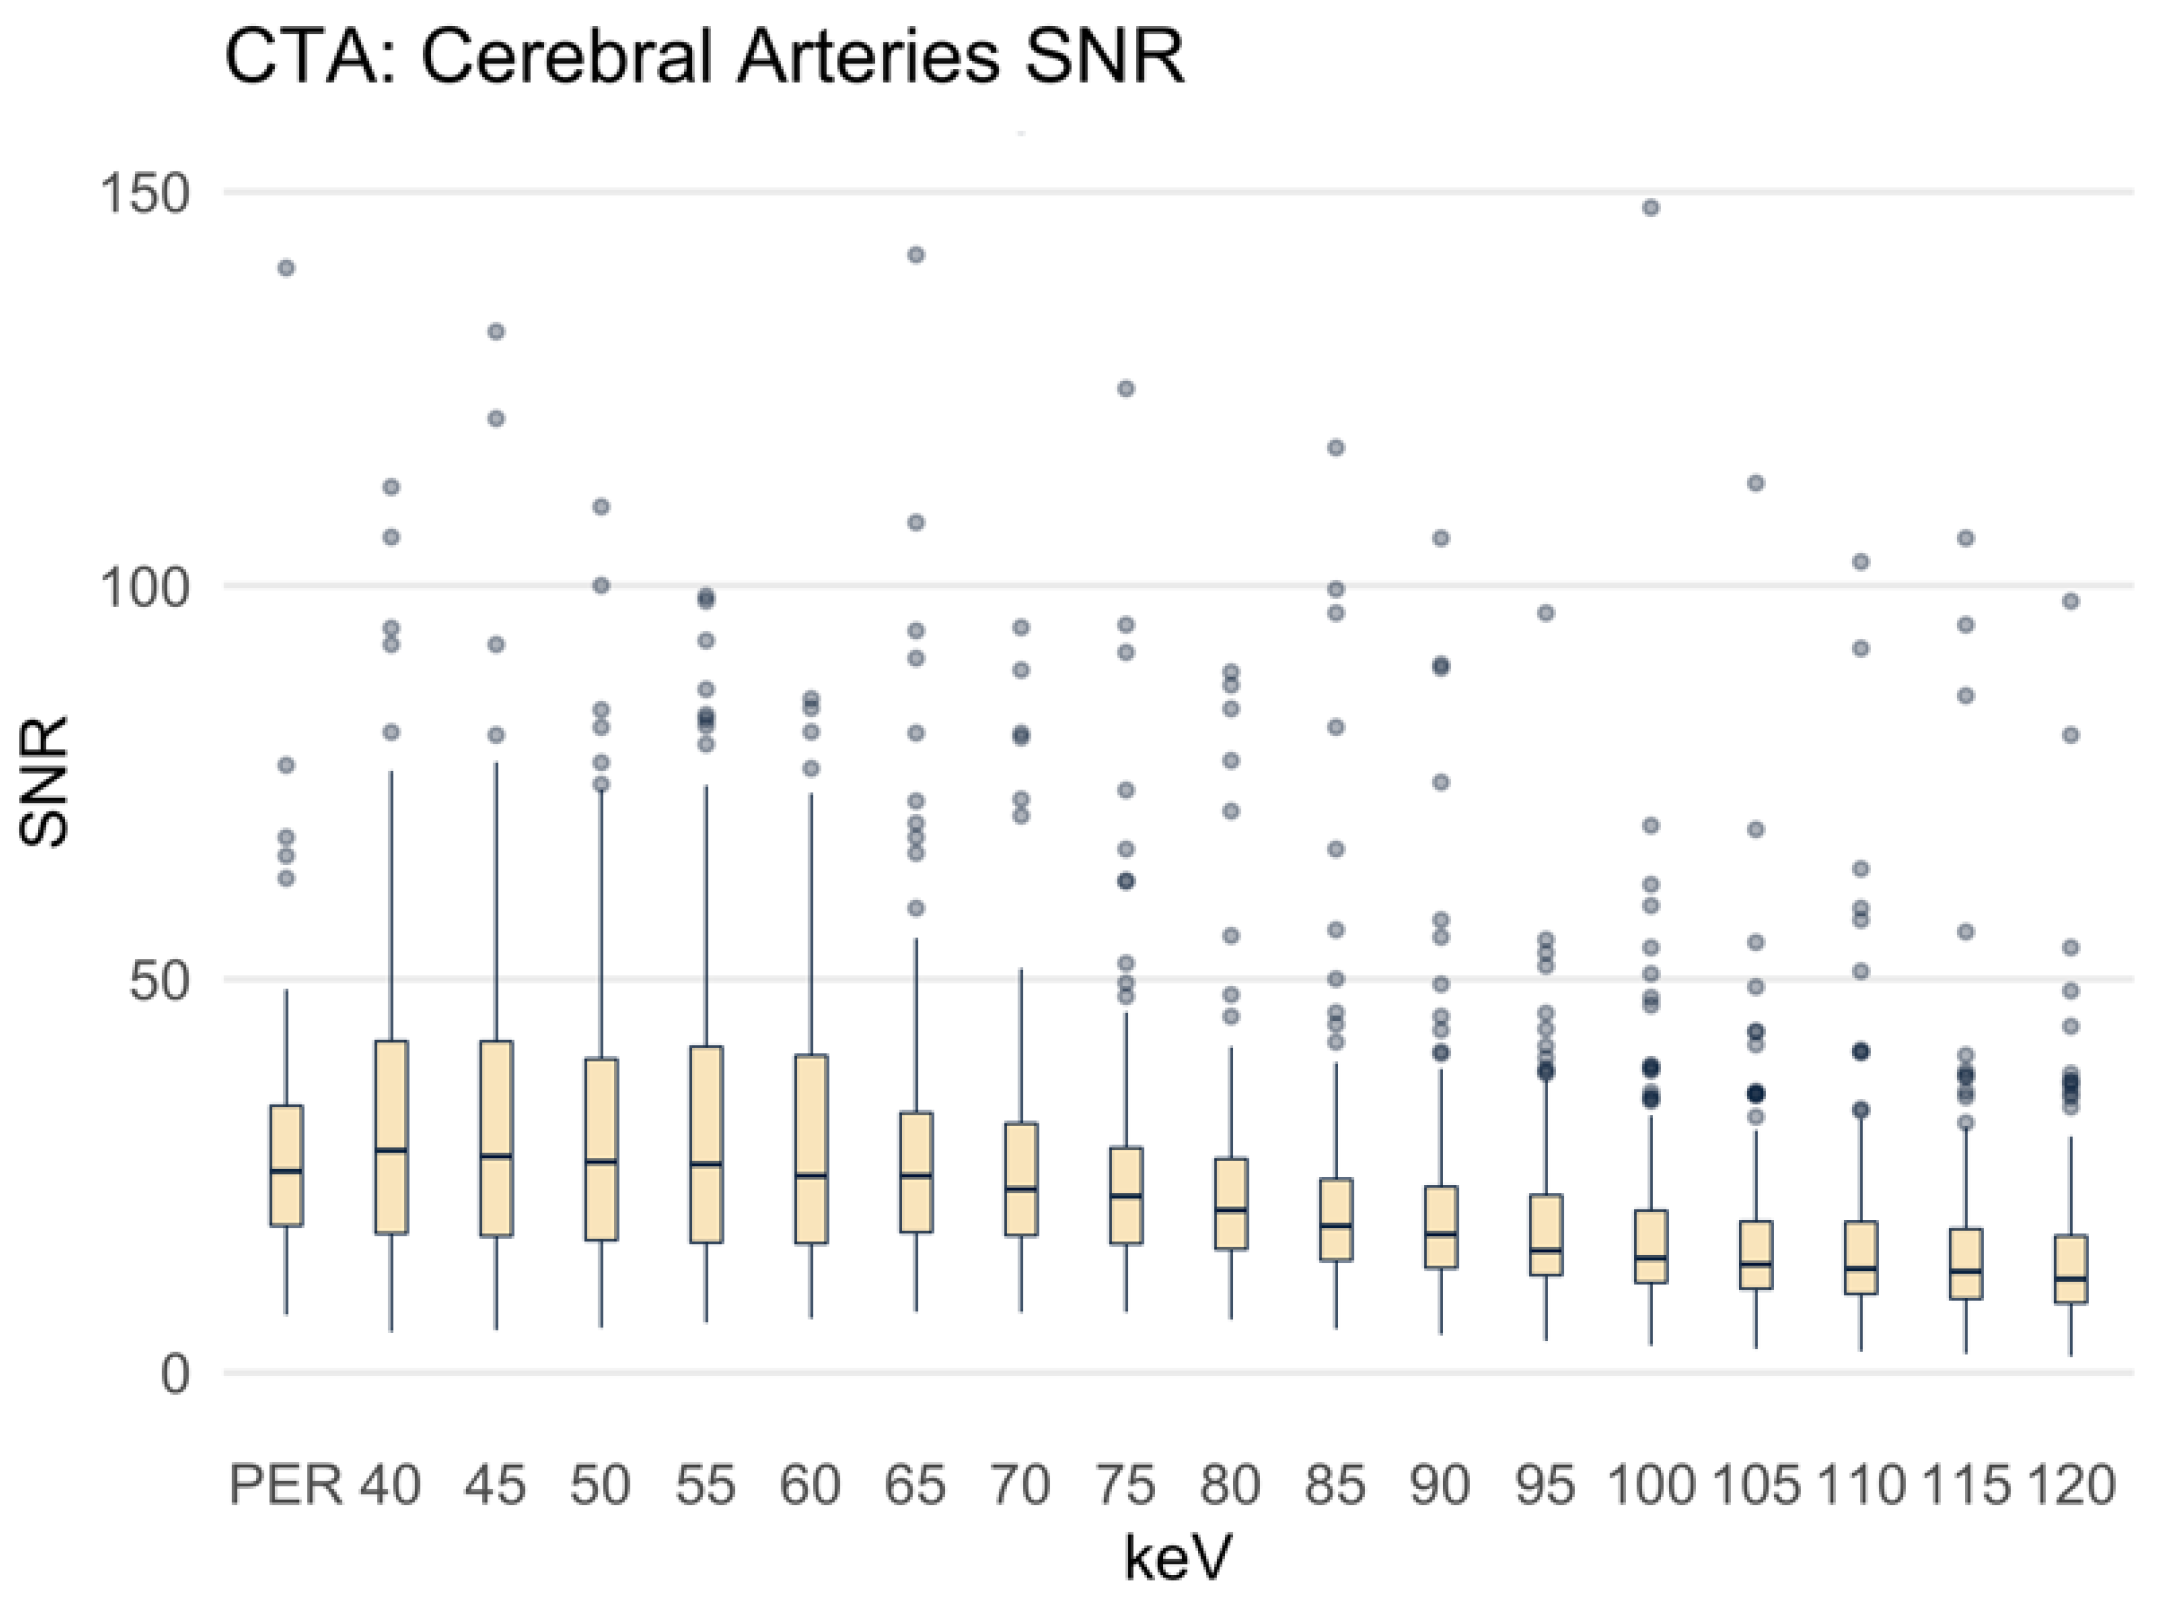
3.2.3. Signal-to-Noise-Ratio
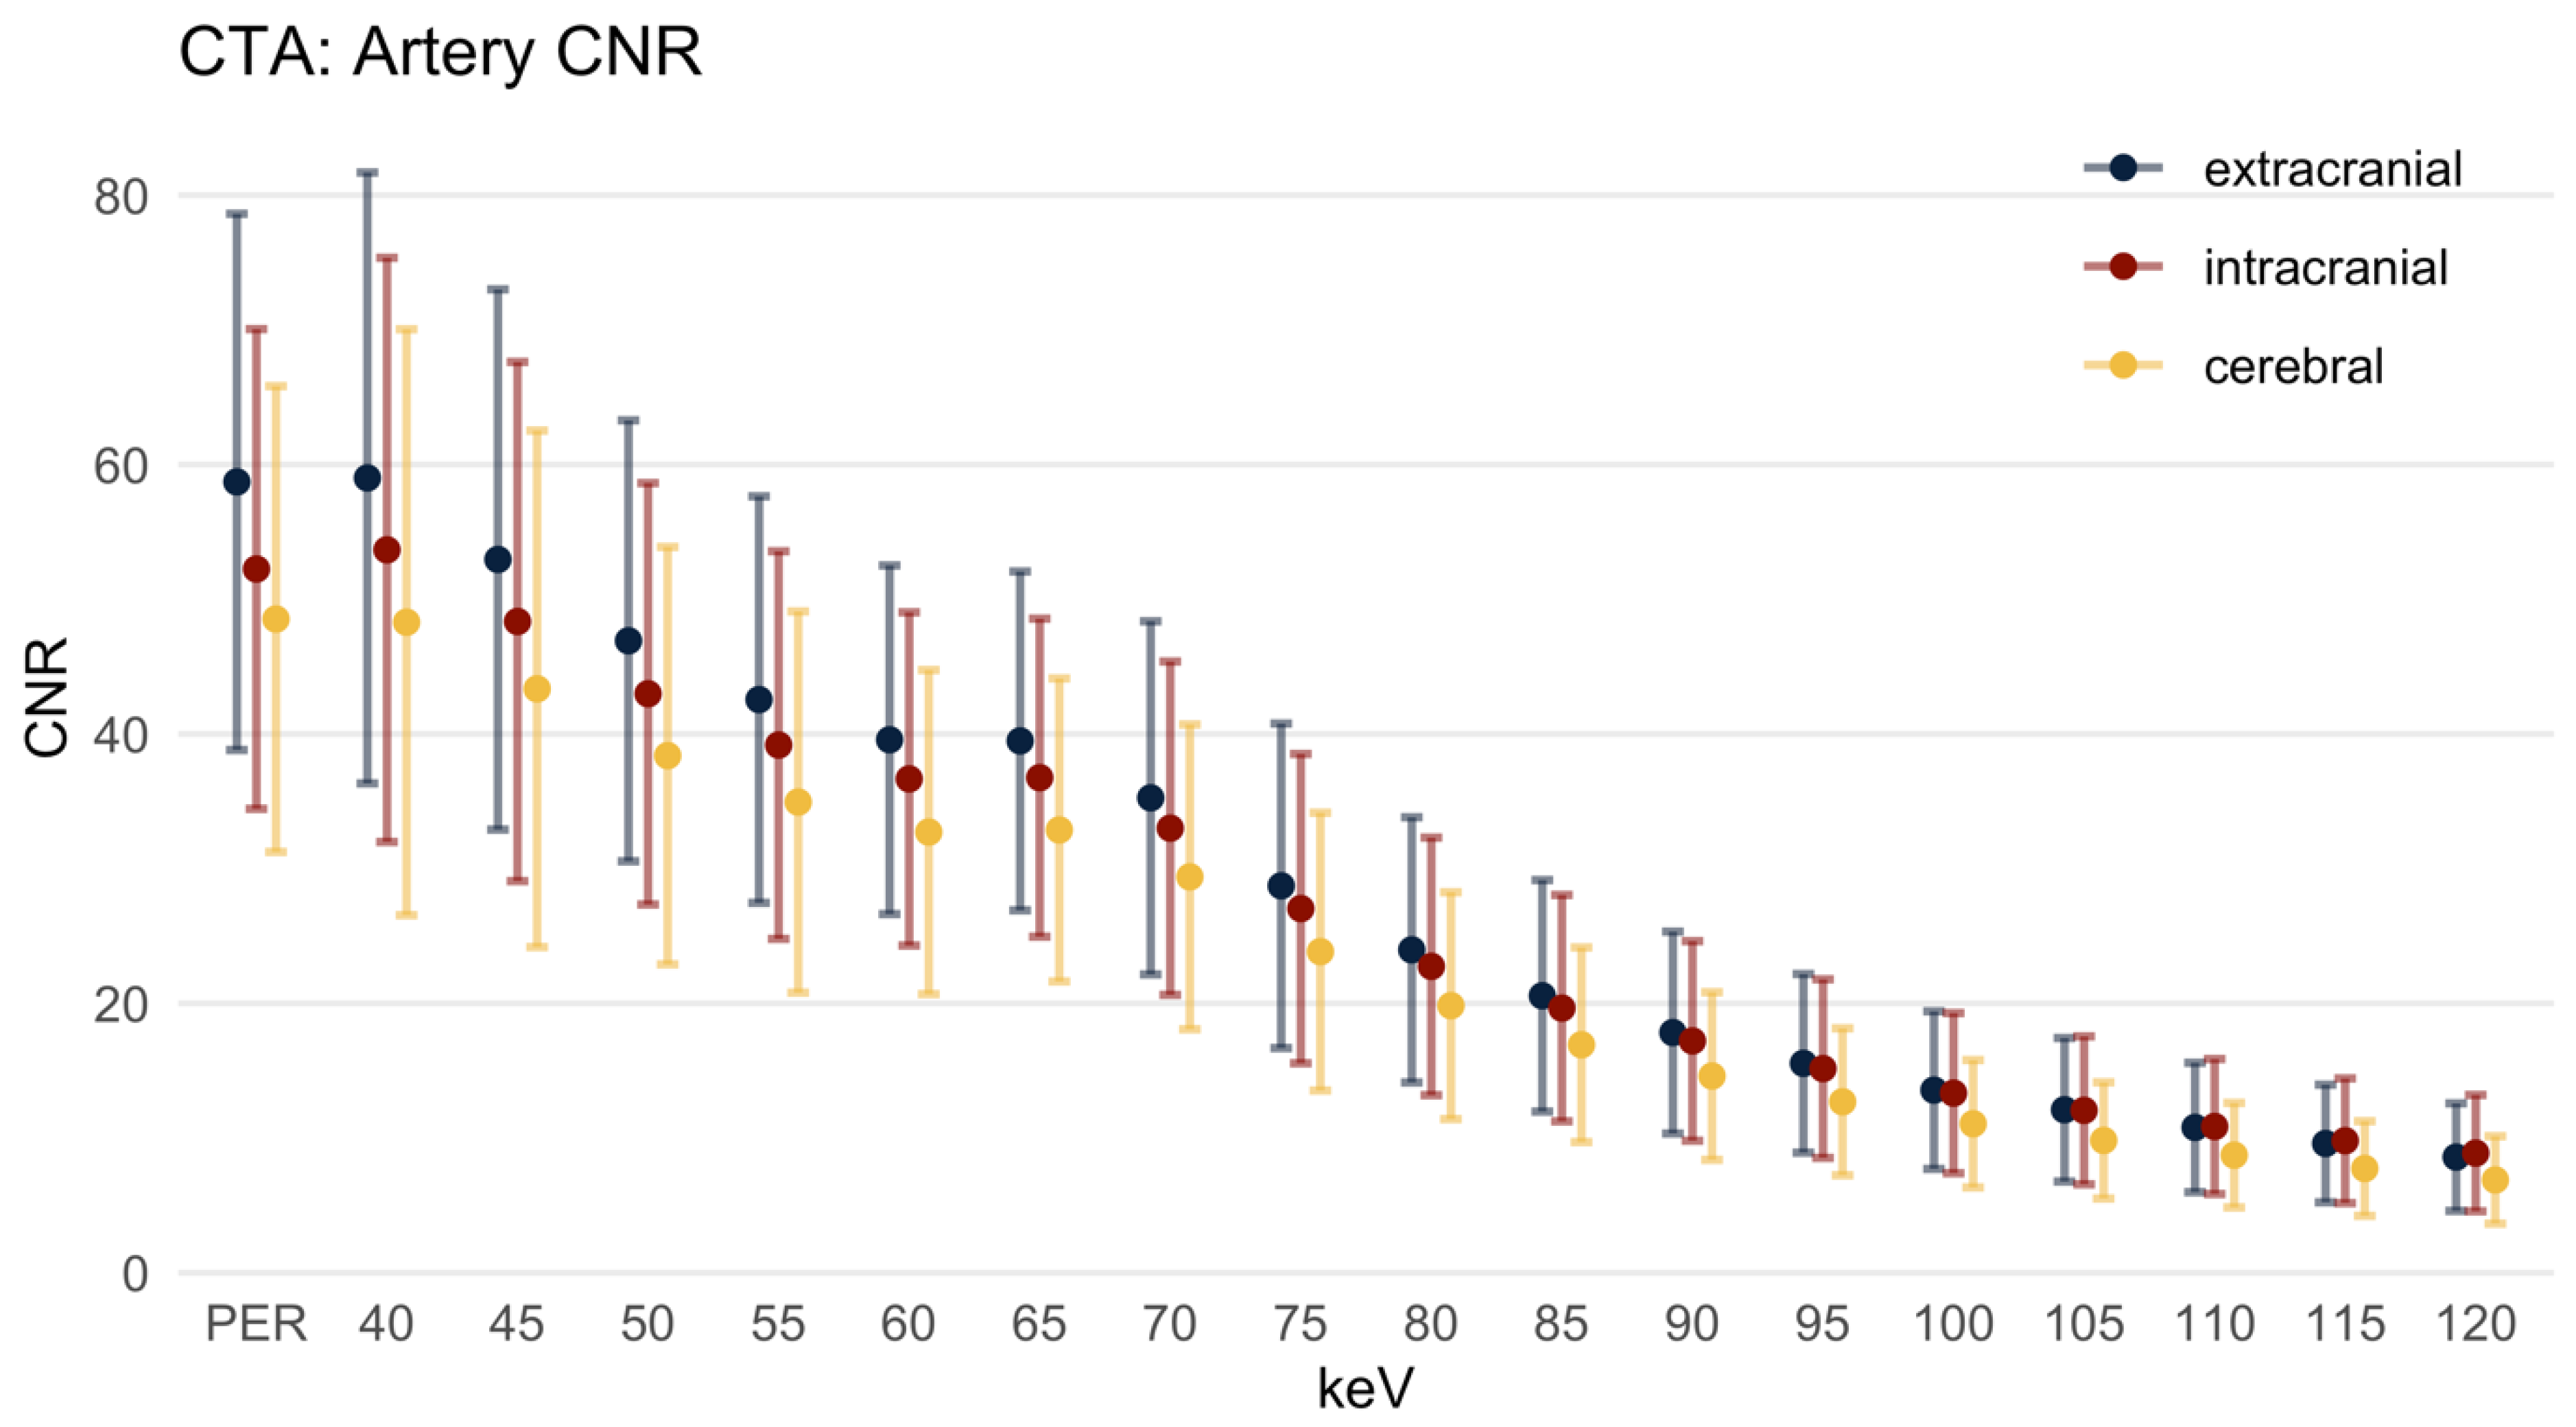
3.2.4. Contrast-to-Noise-Ratio
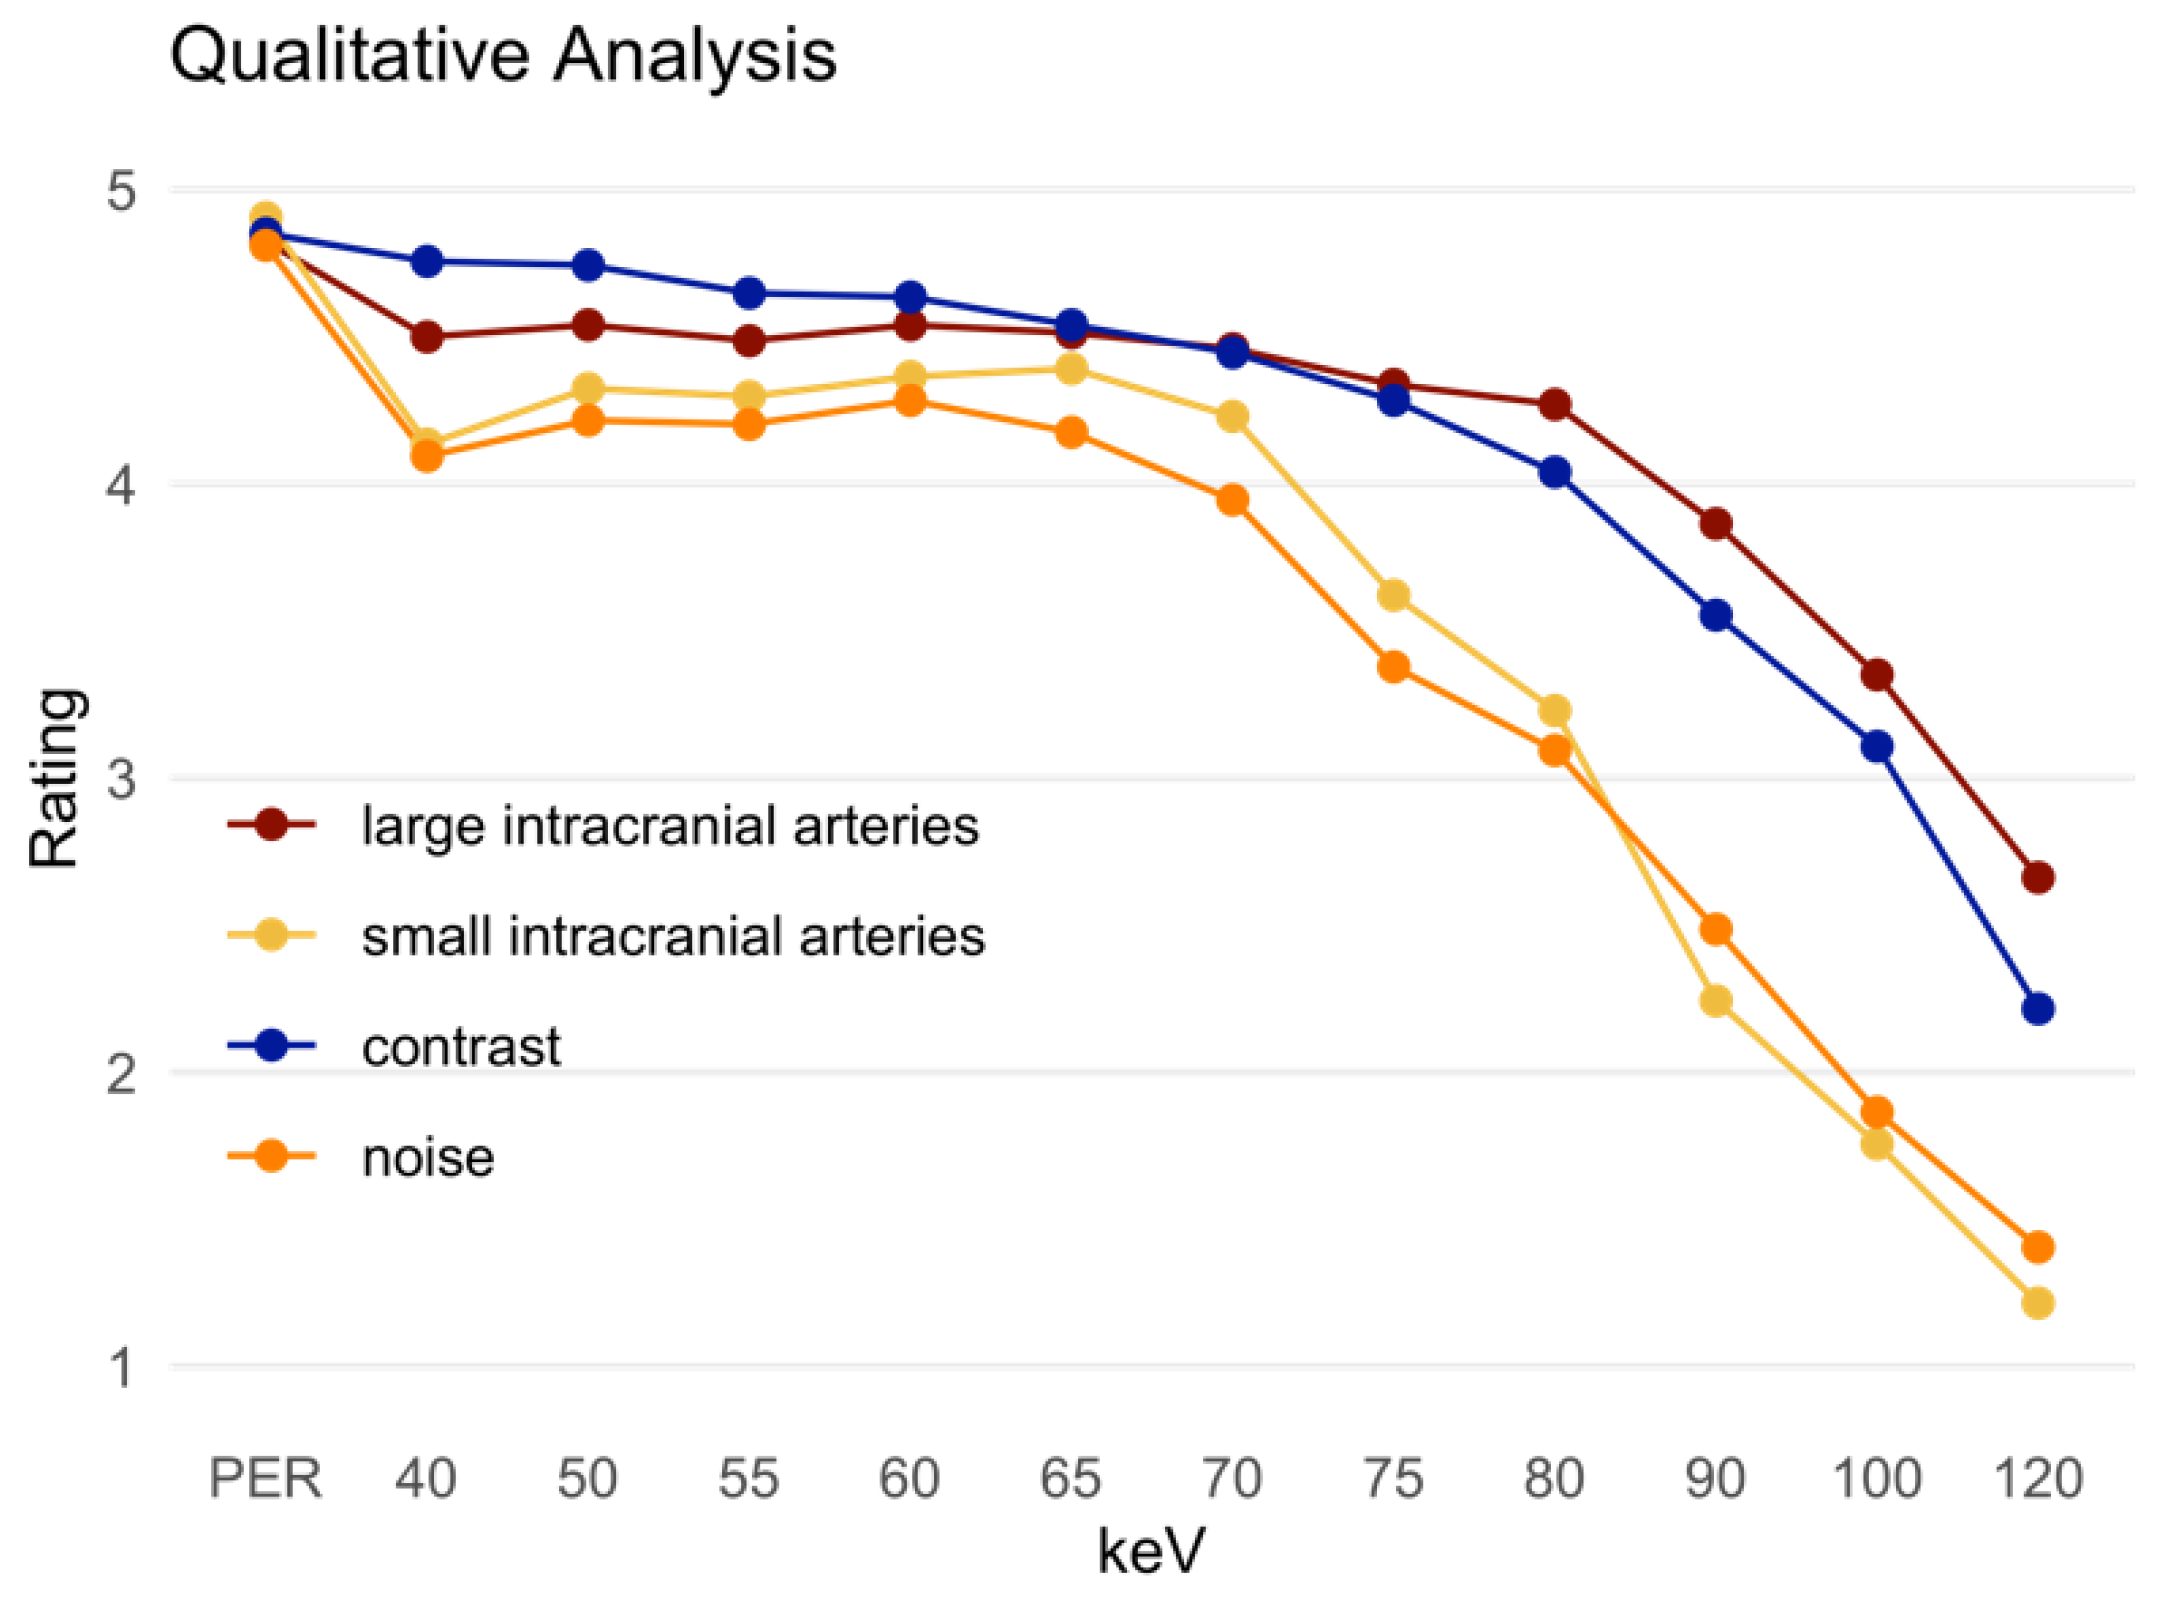
3.3. Qualitative Analysis
4. Discussion
Supplementary Materials
Author Contributions
Funding
Institutional Review Board Statement
Informed Consent Statement
Data Availability Statement
Acknowledgments
Conflicts of Interest
References
- Powers, W.J. Acute Ischemic Stroke. N. Engl. J. Med. 2020, 383, 252–260. [Google Scholar] [CrossRef] [PubMed]
- Martin, A.; Tse, G.; Connolly, D.J.A.; Batty, R. A Pictorial Review of Intracranial Haemorrhage Revisited. Curr. Med. Imaging Rev. 2019, 15, 853–865. [Google Scholar] [CrossRef] [PubMed]
- Lennartz, S.; Laukamp, K.R.; Neuhaus, V.; Große Hokamp, N.; Le Blanc, M.; Maus, V.; Kabbasch, C.; Mpotsaris, A.; Maintz, D.; Borggrefe, J. Dual-layer detector CT of the head: Initial experience in visualization of intracranial hemorrhage and hypodense brain lesions using virtual monoenergetic images. Eur. J. Radiol. 2018, 108, 177–183. [Google Scholar] [CrossRef] [PubMed]
- Flohr, T.G.; McCollough, C.H.; Bruder, H.; Petersilka, M.; Gruber, K.; Süss, C.; Grasruck, M.; Stierstorfer, K.; Krauss, B.; Raupach, R.; et al. First performance evaluation of a dual-source CT (DSCT) system. Eur. Radiol. 2006, 16, 256–268. [Google Scholar] [CrossRef] [PubMed]
- D'Angelo, T.; Cicero, G.; Mazziotti, S.; Ascenti, G.; Albrecht, M.H.; Martin, S.S.; Othman, A.E.; Vogl, T.J.; Wichmann, J.L. Dual energy computed tomography virtual monoenergetic imaging: Technique and clinical applications. Br. J. Radiol. 2019, 92, 20180546. [Google Scholar] [CrossRef]
- Alvarez, R.E.; Macovski, A. Energy-selective reconstructions in X-ray computerized tomography. Phys. Med. Biol. 1976, 21, 733–744. [Google Scholar] [CrossRef]
- Yu, L.; Leng, S.; McCollough, C.H. Dual-energy CT-based monochromatic imaging. AJR Am. J. Roentgenol. 2012, 199, S9–S15. [Google Scholar] [CrossRef] [PubMed]
- Michael, A.E.; Boriesosdick, J.; Schoenbeck, D.; Woeltjen, M.M.; Saeed, S.; Kroeger, J.R.; Horstmeier, S.; Lennartz, S.; Borggrefe, J.; Niehoff, J.H. Image-Quality Assessment of Polyenergetic and Virtual Monoenergetic Reconstructions of Unenhanced CT Scans of the Head: Initial Experiences with the First Photon-Counting CT Approved for Clinical Use. Diagnostics 2022, 12, 265. [Google Scholar] [CrossRef]
- Meinel, F.G.; Bischoff, B.; Zhang, Q.; Bamberg, F.; Reiser, M.F.; Johnson, T.R. Metal artifact reduction by dual-energy computed tomography using energetic extrapolation: A systematically optimized protocol. Investig. Radiol. 2012, 47, 406–414. [Google Scholar] [CrossRef]
- Zopfs, D.; Lennartz, S.; Pennig, L.; Glauner, A.; Abdullayev, N.; Bremm, J.; Große Hokamp, N.; Persigehl, T.; Kabbasch, C.; Borggrefe, J.; et al. Virtual monoenergetic images and post-processing algorithms effectively reduce CT artifacts from intracranial aneurysm treatment. Sci. Rep. 2020, 10, 6629. [Google Scholar] [CrossRef]
- Niehoff, J.H.; Woeltjen, M.M.; Saeed, S.; Michael, A.E.; Boriesosdick, J.; Borggrefe, J.; Kroeger, J.R. Assessment of hepatic steatosis based on virtual non-contrast computed tomography: Initial experiences with a photon counting scanner approved for clinical use. Eur. J. Radiol. 2022, 149, 110185. [Google Scholar] [CrossRef]
- Kreisler, B. Photon counting Detectors: Concept, technical Challenges, and clinical outlook. Eur. J. Radiol. 2022, 149, 110229. [Google Scholar] [CrossRef]
- Danielsson, M.; Persson, M.; Sjölin, M. Photon-counting x-ray detectors for CT. Phys. Med. Biol. 2021, 66, 03tr01. [Google Scholar] [CrossRef] [PubMed]
- Willemink, M.J.; Persson, M.; Pourmorteza, A.; Pelc, N.J.; Fleischmann, D. Photon-counting CT: Technical Principles and Clinical Prospects. Radiology 2018, 289, 293–312. [Google Scholar] [CrossRef] [PubMed]
- Flohr, T.; Petersilka, M.; Henning, A.; Ulzheimer, S.; Ferda, J.; Schmidt, B. Photon-counting CT review. Phys. Med. 2020, 79, 126–136. [Google Scholar] [CrossRef]
- Rotzinger, D.C.; Racine, D.; Becce, F.; Lahoud, E.; Erhard, K.; Si-Mohamed, S.A.; Greffier, J.; Viry, A.; Boussel, L.; Meuli, R.A.; et al. Performance of Spectral Photon-Counting Coronary CT Angiography and Comparison with Energy-Integrating-Detector CT: Objective Assessment with Model Observer. Diagnostics 2021, 11, 2376. [Google Scholar] [CrossRef] [PubMed]
- Neuhaus, V.; Große Hokamp, N.; Abdullayev, N.; Maus, V.; Kabbasch, C.; Mpotsaris, A.; Maintz, D.; Borggrefe, J. Comparison of virtual monoenergetic and polyenergetic images reconstructed from dual-layer detector CT angiography of the head and neck. Eur. Radiol. 2018, 28, 1102–1110. [Google Scholar] [CrossRef] [PubMed]
- Bouthillier, H.; van Loveren, R.; Keller, J.T. Segments of the internal carotid artery: A new classification. Neurosurgery 1996, 38, 425–432. [Google Scholar] [CrossRef] [PubMed]
- Schneider, D.; Apfaltrer, P.; Sudarski, S.; Nance, J.W., Jr.; Haubenreisser, H.; Fink, C.; Schoenberg, S.O.; Henzler, T. Optimization of kiloelectron volt settings in cerebral and cervical dual-energy CT angiography determined with virtual monoenergetic imaging. Acad. Radiol. 2014, 21, 431–436. [Google Scholar] [CrossRef] [PubMed]
- Apfaltrer, P.; Sudarski, S.; Schneider, D.; Nance, J.W., Jr.; Haubenreisser, H.; Fink, C.; Schoenberg, S.O.; Henzler, T. Value of monoenergetic low-kV dual energy CT datasets for improved image quality of CT pulmonary angiography. Eur. J. Radiol. 2014, 83, 322–328. [Google Scholar] [CrossRef] [PubMed]
- Sudarski, S.; Apfaltrer, P.; Nance, J.W., Jr.; Schneider, D.; Meyer, M.; Schoenberg, S.O.; Fink, C.; Henzler, T. Optimization of keV-settings in abdominal and lower extremity dual-source dual-energy CT angiography determined with virtual monoenergetic imaging. Eur. J. Radiol. 2013, 82, e574–e581. [Google Scholar] [CrossRef] [PubMed]
- Albrecht, M.H.; Scholtz, J.E.; Husers, K.; Beeres, M.; Bucher, A.M.; Kaup, M.; Martin, S.S.; Fischer, S.; Bodelle, B.; Bauer, R.W.; et al. Advanced image-based virtual monoenergetic dual-energy CT angiography of the abdomen: Optimization of kiloelectron volt settings to improve image contrast. Eur. Radiol. 2016, 26, 1863–1870. [Google Scholar] [CrossRef] [PubMed]
- Huang, X.; Gao, S.; Ma, Y.; Lu, X.; Jia, Z.; Hou, Y. The optimal monoenergetic spectral image level of coronary computed tomography (CT) angiography on a dual-layer spectral detector CT with half-dose contrast media. Quant. Imaging Med. Surg. 2020, 10, 592–603. [Google Scholar] [CrossRef]
- Wang, Y.; Wang, Y.; Hu, P.; Niu, Z.; Hu, H. Comparative study of the image quality of twin beam dual energy and single energy carotid CT angiography. Eur. J. Radiol. 2022, 148, 110160. [Google Scholar] [CrossRef]
- Wichmann, J.L.; Nöske, E.M.; Kraft, J.; Burck, I.; Wagenblast, J.; Eckardt, A.; Frellesen, C.; Kerl, J.M.; Bauer, R.W.; Bodelle, B.; et al. Virtual monoenergetic dual-energy computed tomography: Optimization of kiloelectron volt settings in head and neck cancer. Investig. Radiol. 2014, 49, 735–741. [Google Scholar] [CrossRef] [PubMed]
- Kaup, M.; Scholtz, J.E.; Engler, A.; Albrecht, M.H.; Bauer, R.W.; Kerl, J.M.; Beeres, M.; Lehnert, T.; Vogl, T.J.; Wichmann, J.L. Dual-Energy Computed Tomography Virtual Monoenergetic Imaging of Lung Cancer: Assessment of Optimal Energy Levels. J. Comput. Assist. Tomogr. 2016, 40, 80–85. [Google Scholar] [CrossRef] [PubMed]
- Leithner, D.; Mahmoudi, S.; Wichmann, J.L.; Martin, S.S.; Lenga, L.; Albrecht, M.H.; Booz, C.; Arendt, C.T.; Beeres, M.; D'Angelo, T.; et al. Evaluation of virtual monoenergetic imaging algorithms for dual-energy carotid and intracerebral CT angiography: Effects on image quality, artefacts and diagnostic performance for the detection of stenosis. Eur. J. Radiol. 2018, 99, 111–117. [Google Scholar] [CrossRef]
- Euler, A.; Higashigaito, K.; Mergen, V.; Sartoretti, T.; Zanini, B.; Schmidt, B.; Flohr, T.G.; Ulzheimer, S.; Eberhard, M.; Alkadhi, H. High-Pitch Photon-Counting Detector Computed Tomography Angiography of the Aorta: Intraindividu-al Comparison to Energy-Integrating Detector Computed Tomography at Equal Radiation Dose. Investig. Radiol. 2022, 57, 115–121. [Google Scholar] [CrossRef]
- Si-Mohamed, S.A.; Boccalini, S.; Lacombe, H.; Diaw, A.; Varasteh, M.; Rodesch, P.A.; Dessouky, R.; Villien, M.; Tatard-Leitman, V.; Bochaton, T.; et al. Coronary CT Angiography with Photon-counting CT: First-In-Human Results. Radiology 2022, 303, 303–313. [Google Scholar] [CrossRef] [PubMed]
- Turnier, H.; Houdek, P.V.; Trefler, M. Measurements of the partial volume phenomenon. Comput. Tomogr. 1979, 3, 213–219. [Google Scholar] [CrossRef]
- Ge, Y.; Ji, X.; Zhang, R.; Li, K.; Chen, G.H. K-edge energy-based calibration method for photon counting detectors. Phys. Med. Biol. 2017, 63, 015022. [Google Scholar] [CrossRef] [Green Version]
- Thomsen, F.S.L.; Horstmeier, S.; Niehoff, J.H.; Peña, J.A.; Borggrefe, J. Effective Spatial Resolution of Photon Counting CT in High-Resolution Imaging of Trabecular Structures Is Superior to Conventional Clinical CT and Similar to High-Resolution Peripheral CT. Investig. Radiol. 2022, 57. [Google Scholar] [CrossRef] [PubMed]
- Leng, S.; Bruesewitz, M.; Tao, S.; Rajendran, K.; Halaweish, A.F.; Campeau, N.G.; Fletcher, J.G.; McCollough, C.H. Photon-counting Detector CT: System Design and Clinical Applications of an Emerging Technology. Radiographics 2019, 39, 729–743. [Google Scholar] [CrossRef] [PubMed]
- Tranvinh, E.; Heit, J.J.; Hacein-Bey, L.; Provenzale, J.; Wintermark, M. Contemporary Imaging of Cerebral Arteriovenous Malformations. AJR Am. J. Roentgenol. 2017, 208, 1320–1330. [Google Scholar] [CrossRef] [PubMed]
- Guo, Y.; Ou, S.X.; Qian, M.; Zeng, X.; Li, B. Dual-energy CT angiography for the diagnosis of intracranial dural arteriovenous fistula. Int. J. Clin. Exp. Med. 2015, 8, 7802–7808. [Google Scholar] [PubMed]
- Asadi, H.; Dowling, R.; Yan, B.; Wong, S.; Mitchell, P. Advances in endovascular treatment of acute ischaemic stroke. Intern Med. J. 2015, 45, 798–805. [Google Scholar] [CrossRef] [PubMed]
- March, B.T.; Jayaraman, M.V. Aneurysms, arteriovenous malformations, and dural arteriovenous fistulas: Diagnosis and treatment. Semin. Roentgenol. 2014, 49, 10–21. [Google Scholar] [CrossRef]


| Extracranial Arteries | PER | MER | p-Value |
|---|---|---|---|
| Signal | 377.15 ± 78.26 HU | 937.55 ± 204.71 HU (40 keV) | p < 0.001 |
| Noise | 12.23 ± 3.58 HU | 11.43 ± 3.38 HU (120 keV) | p < 0.001 |
| SNR | 33.03 ± 10.54 | 35.74 ± 15.65 (40 keV) | p = 0.003 |
| CNR | 58.72 ± 19.90 | 59.01 ± 22.68 (40 keV) | p = 0.447 |
| Intracranial Arteries | |||
| Signal | 342.76 ± 70.77 HU | 860.64 ± 200.45 HU (40 keV) | p < 0.001 |
| Noise | 14.18 ± 4.34 HU | 12.43 ± 3.60 HU (110 keV) | p < 0.001 |
| SNR | 26.73 ± 10.50 | 26.95 ± 13.22 (40 keV) | p = 0.901 |
| CNR | 52.25 ± 17.81 | 53.67 ± 21.68 (40 keV) | p = 0.775 |
| Cerebral Arteries | |||
| Signal | 323.68 ± 75.67 HU | 783.95 ± 206.30 HU (40 keV) | p < 0.001 |
| Noise | 13.88 ± 6.22 HU | 9.23 ± 4.61 HU (115 keV) | p < 0.001 |
| SNR | 28.60 ± 16.97 | 40.87 ± 66.94 (50 keV) | p < 0.001 |
| CNR | 48.53 ± 17.29 | 48.30 ± 21.75 (40 keV) | p = 0.181 |
| Qualitative Analysis | PER | MER | p-Value |
|---|---|---|---|
| Intracranial large arteries | 4.82 ± 0.42 | 4.54 ± 0.53 (50 keV) | <0.001 |
| Small intracranial arteries | 4.91 ± 0.41 | 4.39 ± 0.66 (65 keV) | <0.001 |
| Contrast | 4.85 ± 0.36 | 4.76 ± 0.43 (40 keV) | 0.057 |
| Noise | 4.81 ± 0.43 | 4.28 ± 0.75 (60 keV) | <0.001 |
Publisher’s Note: MDPI stays neutral with regard to jurisdictional claims in published maps and institutional affiliations. |
© 2022 by the authors. Licensee MDPI, Basel, Switzerland. This article is an open access article distributed under the terms and conditions of the Creative Commons Attribution (CC BY) license (https://creativecommons.org/licenses/by/4.0/).
Share and Cite
Michael, A.E.; Boriesosdick, J.; Schoenbeck, D.; Lopez-Schmidt, I.; Kroeger, J.R.; Moenninghoff, C.; Horstmeier, S.; Pennig, L.; Borggrefe, J.; Niehoff, J.H. Photon Counting CT Angiography of the Head and Neck: Image Quality Assessment of Polyenergetic and Virtual Monoenergetic Reconstructions. Diagnostics 2022, 12, 1306. https://0-doi-org.brum.beds.ac.uk/10.3390/diagnostics12061306
Michael AE, Boriesosdick J, Schoenbeck D, Lopez-Schmidt I, Kroeger JR, Moenninghoff C, Horstmeier S, Pennig L, Borggrefe J, Niehoff JH. Photon Counting CT Angiography of the Head and Neck: Image Quality Assessment of Polyenergetic and Virtual Monoenergetic Reconstructions. Diagnostics. 2022; 12(6):1306. https://0-doi-org.brum.beds.ac.uk/10.3390/diagnostics12061306
Chicago/Turabian StyleMichael, Arwed Elias, Jan Boriesosdick, Denise Schoenbeck, Ingo Lopez-Schmidt, Jan Robert Kroeger, Christoph Moenninghoff, Sebastian Horstmeier, Lenhard Pennig, Jan Borggrefe, and Julius Henning Niehoff. 2022. "Photon Counting CT Angiography of the Head and Neck: Image Quality Assessment of Polyenergetic and Virtual Monoenergetic Reconstructions" Diagnostics 12, no. 6: 1306. https://0-doi-org.brum.beds.ac.uk/10.3390/diagnostics12061306