A Whole-Genome Sequencing Association Study of Low Bone Mineral Density Identifies New Susceptibility Loci in the Phase I Qatar Biobank Cohort

 and
and
Abstract
:1. Introduction
2. Materials and Methods
2.1. Subjects
2.2. iDXA Scan
2.3. Genotyping and Bioinformatics Analysis
2.4. Statistical Analysis
3. Results
3.1. Baseline Characteristics
3.2. Variants Associated with BMD
3.3. Validation of Previous Associations with BMD
4. Discussion
5. Conclusions
Supplementary Materials
Author Contributions
Funding
Acknowledgments
Conflicts of Interest
Data Availability
References
- Munch, S.; Shapiro, S. The silent thief: Osteoporosis and women’s health care across the life span. Health Soc. Work 2006, 31, 44–53. [Google Scholar] [CrossRef]
- Sözen, T.; Özışık, L.; Başaran, N.Ç. An overview and management of osteoporosis. Eur. J. Rheumatol. 2017, 4, 46–56. [Google Scholar] [CrossRef] [PubMed]
- Kanis, J.A.; Oden, A.; McCloskey, E.V.; Johansson, H.; Wahl, D.A.; Cooper, C. A systematic review of hip fracture incidence and probability of fracture worldwide. Osteoporos. Int. 2012, 23, 2239–2256. [Google Scholar] [CrossRef] [PubMed] [Green Version]
- Tian, L.; Yang, R.; Wei, L.; Liu, J.; Yang, Y.; Shao, F.; Ma, W.; Li, T.; Wang, Y.; Guo, T. Prevalence of osteoporosis and related lifestyle and metabolic factors of postmenopausal women and elderly men: A cross-sectional study in Gansu province, Northwestern of China. Med. Baltim. 2017, 96, e8294. [Google Scholar] [CrossRef]
- Ralston, S.H. Genetics of osteoporosis. Proc. Nutr. Soc. 2007, 66, 158–165. [Google Scholar] [CrossRef] [PubMed] [Green Version]
- Morris, J.A.; Kemp, J.P.; Youlten, S.E.; Laurent, L.; Logan, J.G.; Chai, R.C.; Vulpescu, N.A.; Forgetta, V.; Kleinman, A.; Mohanty, S.T.; et al. An atlas of genetic influences on osteoporosis in humans and mice. Nat. Genet. 2019, 51, 258–266. [Google Scholar] [CrossRef] [PubMed]
- Estrada, K.; Styrkarsdottir, U.; Evangelou, E.; Hsu, Y.H.; Duncan, E.L.; Ntzani, E.E.; Oei, L.; Albagha, O.M.; Amin, N.; Kemp, J.P.; et al. Genome-wide meta-analysis identifies 56 bone mineral density loci and reveals 14 loci associated with risk of fracture. Nat. Genet. 2012, 44, 491–501. [Google Scholar] [CrossRef] [PubMed] [Green Version]
- Kemp, J.P.; Morris, J.A.; Medina-Gomez, C.; Forgetta, V.; Warrington, N.M.; Youlten, S.E.; Zheng, J.; Gregson, C.L.; Grundberg, E.; Trajanoska, K.; et al. Identification of 153 new loci associated with heel bone mineral density and functional involvement of GPC6 in osteoporosis. Nat. Genet. 2017, 49, 1468–1475. [Google Scholar] [CrossRef] [Green Version]
- Yang, T.-L.; Shen, H.; Liu, A.; Dong, S.-S.; Zhang, L.; Deng, F.-Y.; Zhao, Q.; Deng, H.-W. A road map for understanding molecular and genetic determinants of osteoporosis. Nat. Rev. Endocrinol. 2020, 16, 91–103. [Google Scholar] [CrossRef]
- Sweileh, W.M.; Al-Jabi, S.W.; Zyoud, S.H.; Sawalha, A.F.; Ghanim, M.A. Osteoporosis is a neglected health priority in Arab World: A comparative bibliometric analysis. SpringerPlus 2014, 3, 427. [Google Scholar] [CrossRef] [Green Version]
- Sadat-Ali, M.; Al-Habdan Ibrahim, M.; Al-Turki Haifa, A.; Azam Mohammed, Q. An epidemiological analysis of the incidence of osteoporosis and osteoporosis-related fractures among the Saudi Arabian population. Ann. Saudi Med. 2012, 32, 637–641. [Google Scholar] [CrossRef] [PubMed]
- Bener, A.; Hammoudeh, M.; Zirie, M. Prevalence and predictors of osteoporosis and the impact of life style factors on bone mineral density. APLAR J. Rheumatol. 2007, 10, 227–233. [Google Scholar] [CrossRef]
- Al Kuwari, H.; Al Thani, A.; Al Marri, A.; Al Kaabi, A.; Abderrahim, H.; Afifi, N.; Qafoud, F.; Chan, Q.; Tzoulaki, I.; Downey, P.; et al. The Qatar Biobank: Background and methods. BMC Public Health 2015, 15, 1208. [Google Scholar] [CrossRef] [PubMed] [Green Version]
- Siris, E.S.; Adler, R.; Bilezikian, J.; Bolognese, M.; Dawson-Hughes, B.; Favus, M.J.; Harris, S.T.; Jan de Beur, S.M.; Khosla, S.; Lane, N.E.; et al. The clinical diagnosis of osteoporosis: A position statement from the National Bone Health Alliance Working Group. Osteoporos. Int. 2014, 25, 1439–1443. [Google Scholar] [CrossRef] [Green Version]
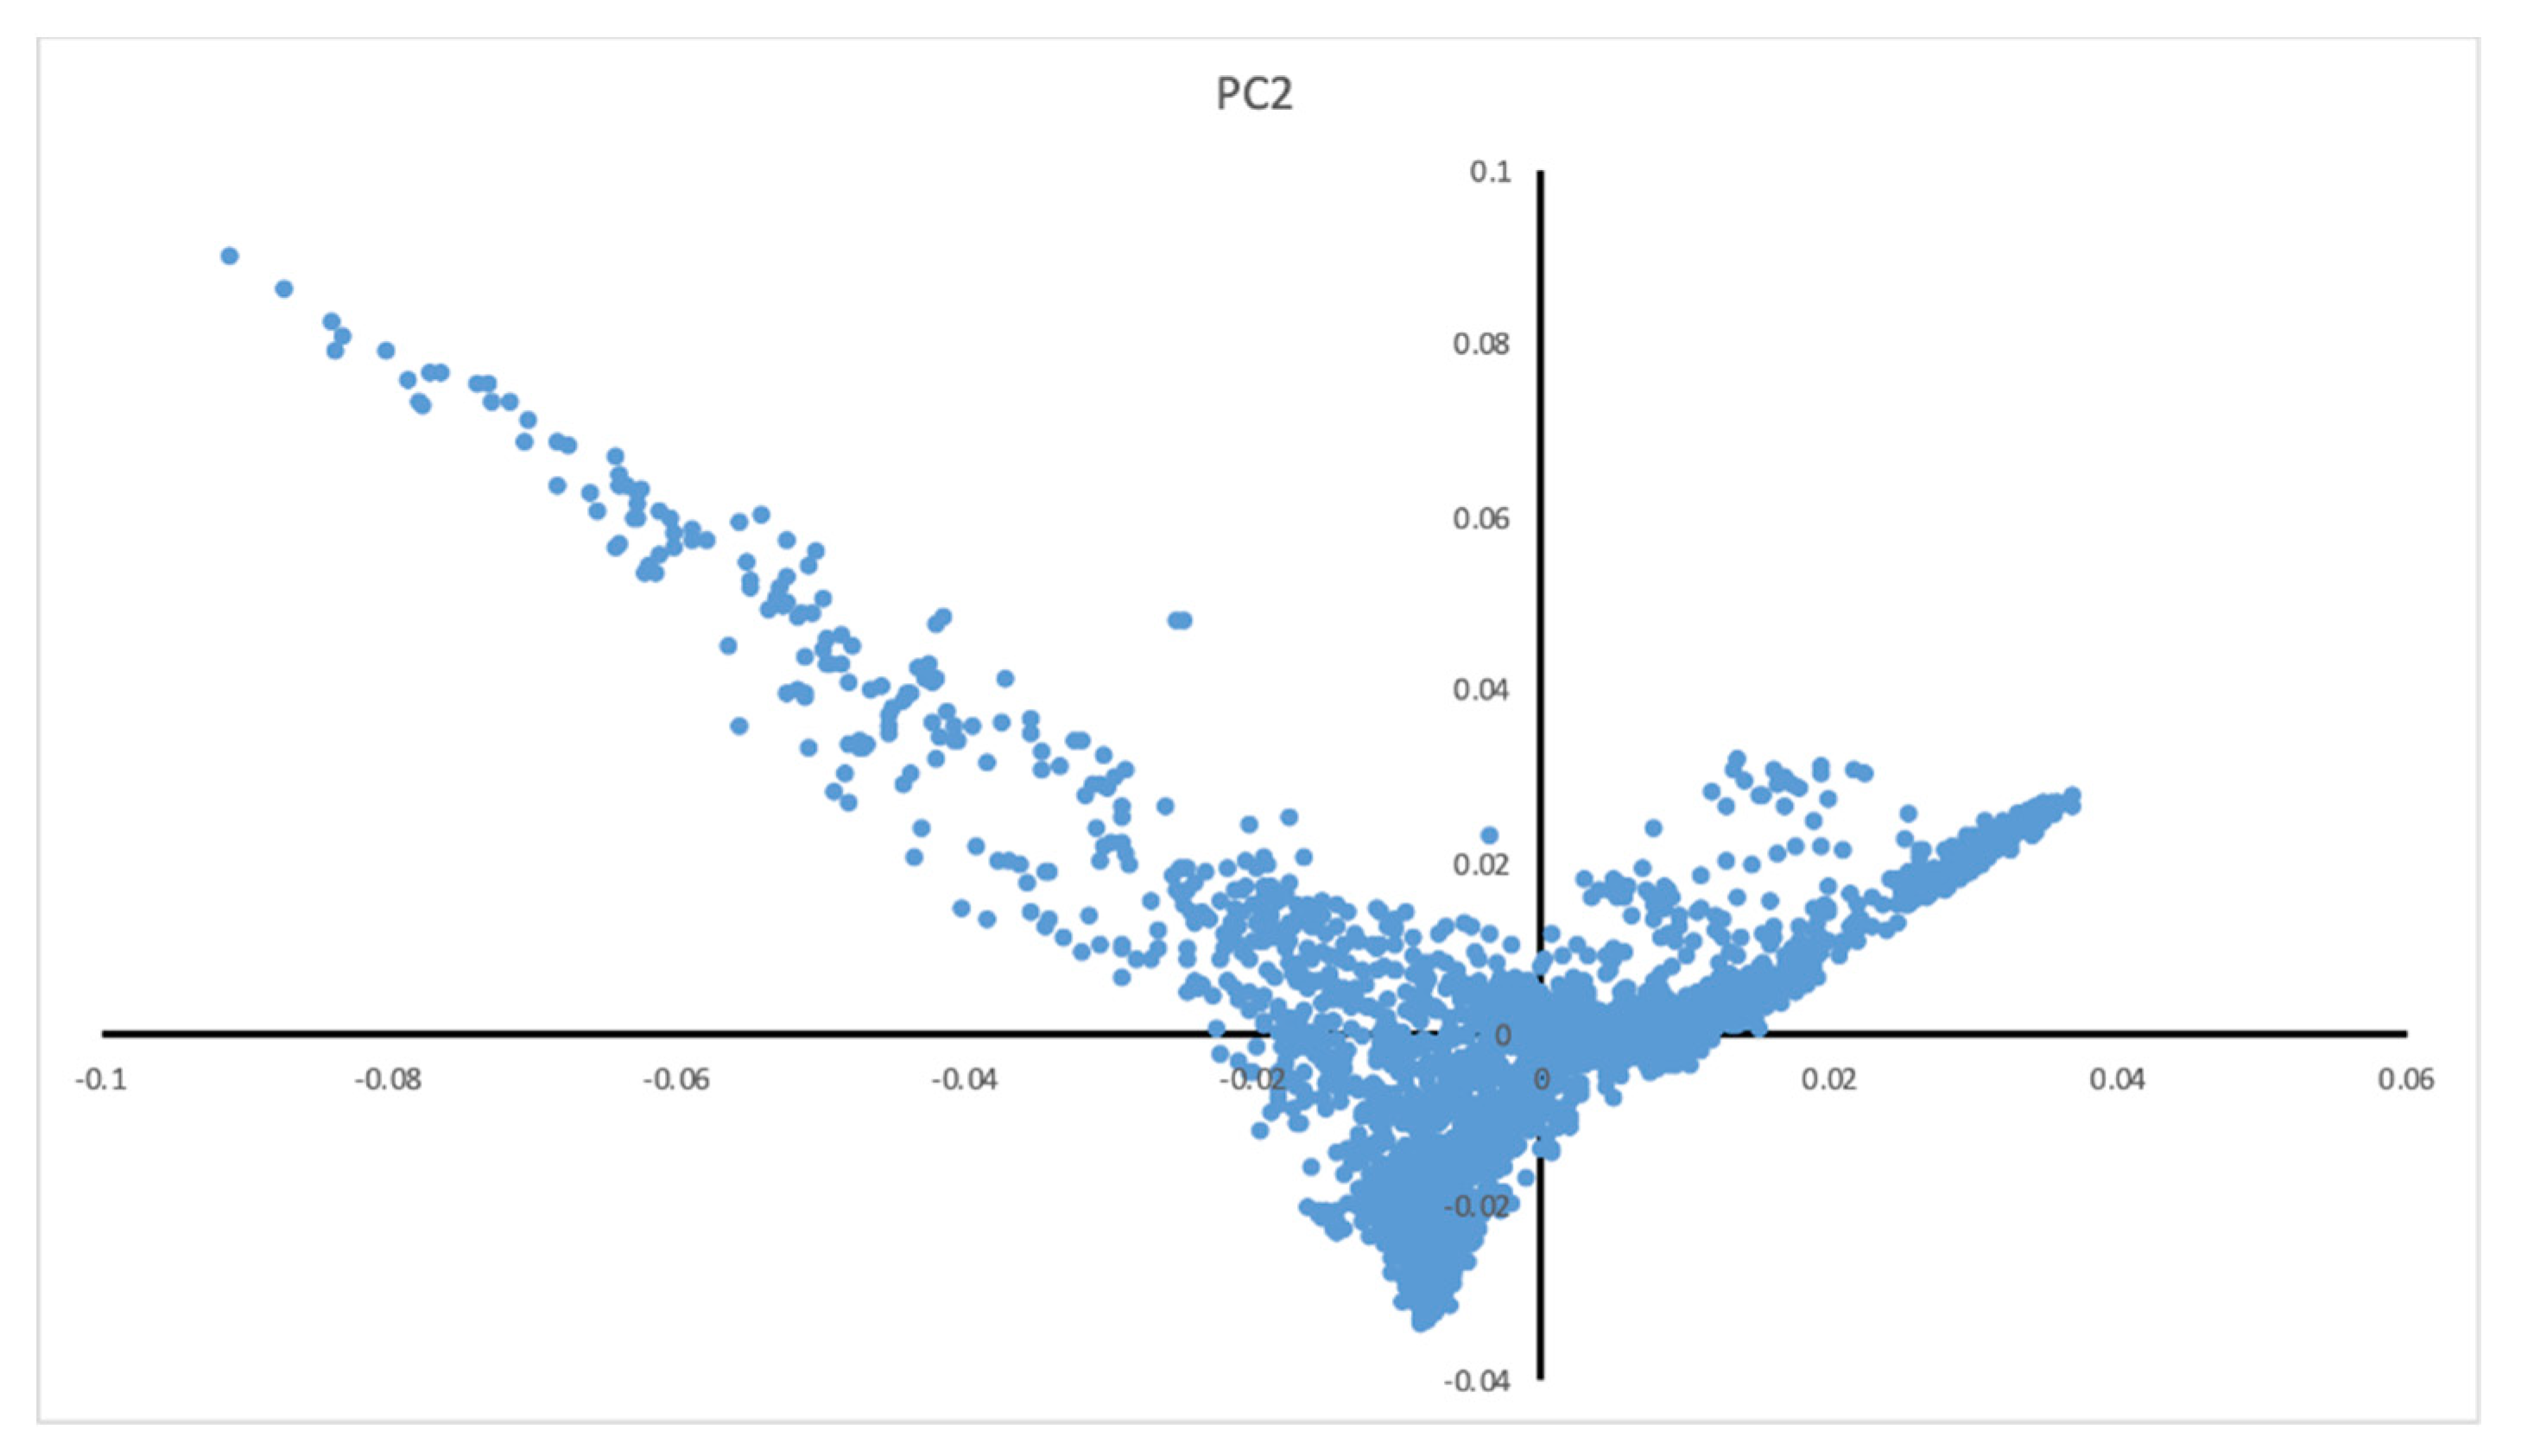
- Price, A.L.; Patterson, N.J.; Plenge, R.M.; Weinblatt, M.E.; Shadick, N.A.; Reich, D. Principal components analysis corrects for stratification in genome-wide association studies. Nat. Genet. 2006, 38, 904–909. [Google Scholar] [CrossRef]
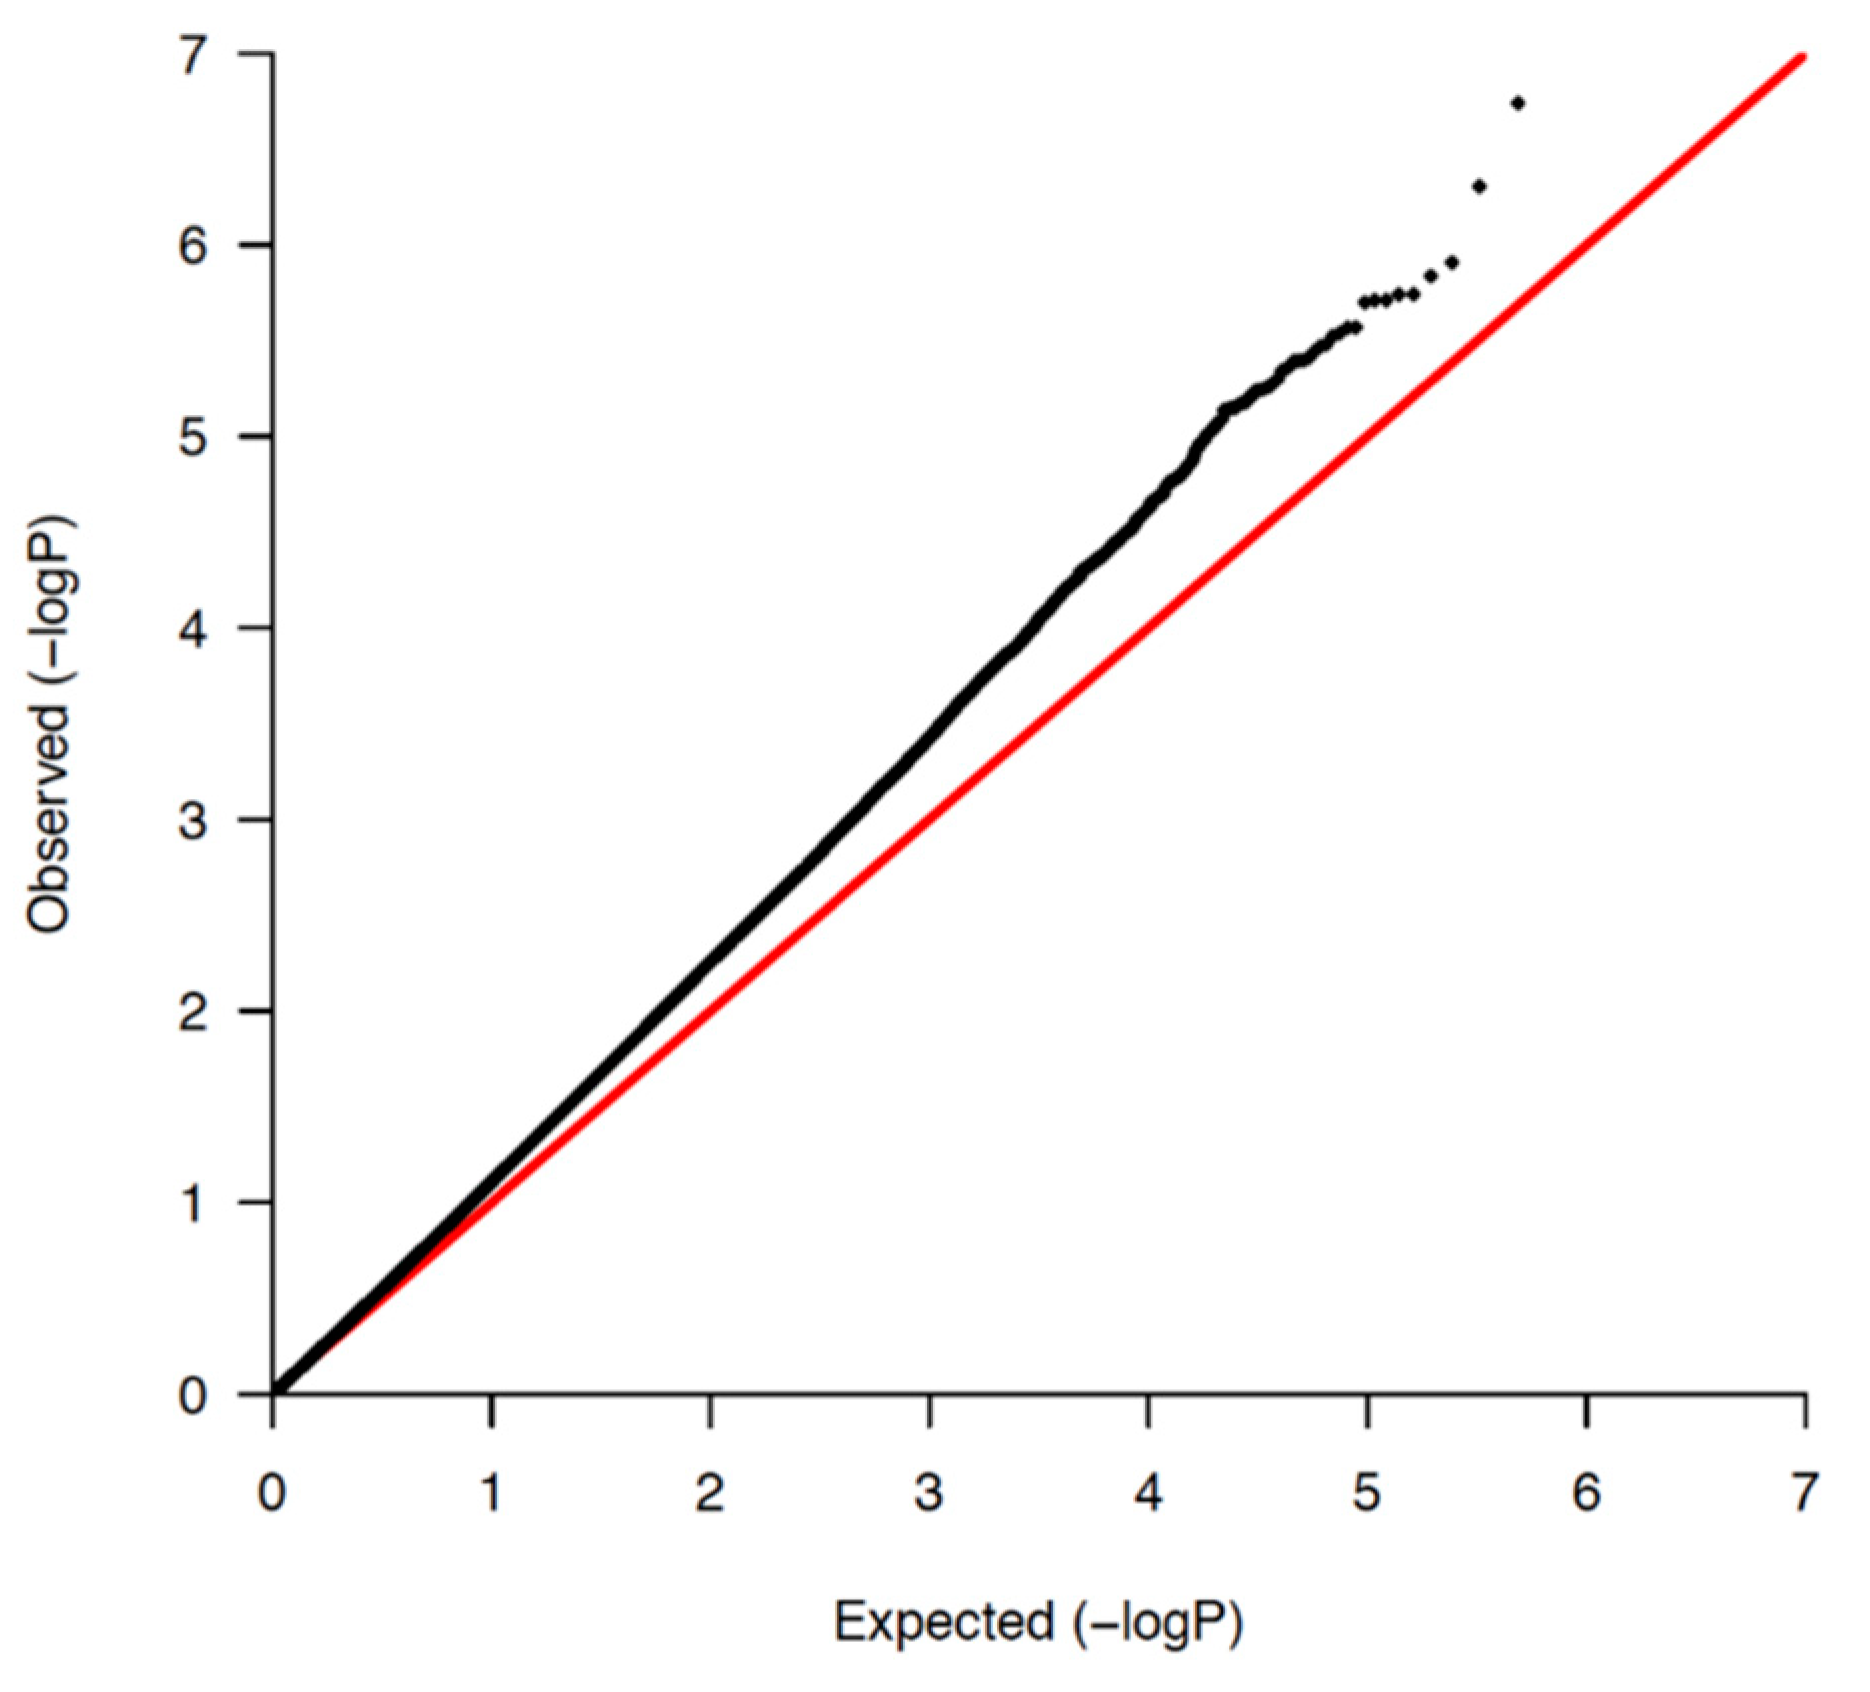
- Turner, S. qqman: An R package for visualizing GWAS results using Q-Q and manhattan plots. J. Open Source Softw. 2018, 3, 731. [Google Scholar] [CrossRef] [Green Version]
- Wang, K.; Li, M.; Hakonarson, H. ANNOVAR: Functional annotation of genetic variants from high-throughput sequencing data. Nucleic Acids Res. 2010, 38, e164. [Google Scholar] [CrossRef]
- Ben-Omran, T.; Al Ghanim, K.; Yavarna, T.; El Akoum, M.; Samara, M.; Chandra, P.; Al-Dewik, N. Effects of consanguinity in a cohort of subjects with certain genetic disorders in Qatar. Mol. Genet. Genom. Med. 2020, 8, e1051. [Google Scholar] [CrossRef]
- Erzurumluoglu, A.M.; Shihab, H.A.; Rodriguez, S.; Gaunt, T.R.; Day, I.N.M. Importance of Genetic Studies in Consanguineous Populations for the Characterization of Novel Human Gene Functions. Ann. Hum. Genet. 2016, 80, 187–196. [Google Scholar] [CrossRef] [PubMed] [Green Version]
- Silva, A.M.; Moura, S.R.; Teixeira, J.H.; Barbosa, M.A.; Santos, S.G.; Almeida, M.I. Long noncoding RNAs: A missing link in osteoporosis. Bone Res. 2019, 7, 10. [Google Scholar] [CrossRef] [PubMed] [Green Version]
- Yang, X.; Zhang, Y.; Li, Y.; Wen, T. MALAT1 enhanced the proliferation of human osteoblasts treated with ultra-high molecular weight polyethylene by targeting VEGF via miR-22-5p. Int. J. Mol. Med. 2018, 41, 1536–1546. [Google Scholar] [CrossRef] [PubMed] [Green Version]
- Liu, M.; Yang, P.; Mao, G.; Deng, J.; Peng, G.; Ning, X.; Yang, H.; Sun, H. Long non-coding RNA MALAT1 as a valuable biomarker for prognosis in osteosarcoma: A systematic review and meta-analysis. Int. J. Surg. 2019, 72, 206–213. [Google Scholar] [CrossRef] [PubMed]
- Peterson, Y.K.; Luttrell, L.M. The Diverse Roles of Arrestin Scaffolds in G Protein-Coupled Receptor Signaling. Pharmacol. Rev. 2017, 69, 256–297. [Google Scholar] [CrossRef] [Green Version]
- Jones, D.R. A potential osteoporosis target in the FAS ligand/FAS pathway of osteoblast to osteoclast signaling. Ann. Transl. Med. 2015, 3, 189. [Google Scholar] [CrossRef] [PubMed]
- Smida, J.; Xu, H.; Zhang, Y.; Baumhoer, D.; Ribi, S.; Kovac, M.; von Luettichau, I.; Bielack, S.; O’Leary, V.B.; Leib-Mösch, C.; et al. Genome-wide analysis of somatic copy number alterations and chromosomal breakages in osteosarcoma. Int. J. Cancer 2017, 141, 816–828. [Google Scholar] [CrossRef] [PubMed] [Green Version]
- Walsh, T.; Pierce, S.B.; Lenz, D.R.; Brownstein, Z.; Dagan-Rosenfeld, O.; Shahin, H.; Roeb, W.; McCarthy, S.; Nord, A.S.; Gordon, C.R.; et al. Genomic duplication and overexpression of TJP2/ZO-2 leads to altered expression of apoptosis genes in progressive nonsyndromic hearing loss DFNA51. Am. J. Hum. Genet. 2010, 87, 101–109. [Google Scholar] [CrossRef] [PubMed] [Green Version]
- Liu, L.; Zhao, M.; Xie, Z.-G.; Liu, J.; Peng, H.-P.; Pei, Y.-F.; Sun, H.-P.; Zhang, L. Twelve New Genomic Loci Associated with Bone Mineral Density. Front. Endocrinol. 2020, 11, 243. [Google Scholar] [CrossRef] [Green Version]
- Wong, A.K.; Krishnan, A.; Troyanskaya, O.G. GIANT 2.0: Genome-scale integrated analysis of gene networks in tissues. Nucleic Acids Res. 2018, 46, W65–W70. [Google Scholar] [CrossRef] [Green Version]
- Oichi, T.; Otsuru, S.; Usami, Y.; Enomoto-Iwamoto, M.; Iwamoto, M. Wnt signaling in chondroprogenitors during long bone development and growth. Bone 2020, 137, 115368. [Google Scholar] [CrossRef]
- Zhu, Y.; Xu, G.; Patel, A.; McLaughlin, M.M.; Silverman, C.; Knecht, K.; Sweitzer, S.; Li, X.; McDonnell, P.; Mirabile, R.; et al. Cloning, expression, and initial characterization of a novel cytokine-like gene family. Genomics 2002, 80, 144–150. [Google Scholar] [CrossRef]
- Khayat, M.; Tilghman, J.M.; Chervinsky, I.; Zalman, L.; Chakravarti, A.; Shalev, S.A. A PIGN mutation responsible for multiple congenital anomalies-hypotonia-seizures syndrome 1 (MCAHS1) in an Israeli-Arab family. Am. J. Med. Genet. A 2016, 170A, 176–182. [Google Scholar] [CrossRef] [PubMed] [Green Version]
- Wu, Y.; Zheng, Z.; Visscher, P.M.; Yang, J. Quantifying the mapping precision of genome-wide association studies using whole-genome sequencing data. Genome Biol. 2017, 18, 86. [Google Scholar] [CrossRef] [PubMed] [Green Version]


| Parameter | Male (±SD) | Female (±SD) |
|---|---|---|
| Number of participants | 1442 | 1558 |
| Age (years) | 36.59 (±10.6) | 36.19 (±11.6) |
| Height (cm) | 172.37 (±6.3) | 158.09 (±5.9) |
| Weight (kg) | 84.84 (±17.9) | 71.18 (±15.9) |
| BMI | 28.29 (±5.4) | 28.48 (±6.2) |
| Normal | Osteopenia | Osteoporosis | |
|---|---|---|---|
| Total body | 2617 (89%) | 285 (9.71%) | 33 (1.1%) |
| Femoral Trochanter | 1991 (68.6%) | 718 (24.7%) | 194 (6.68%) |
| Femoral upper neck | 2291 (78%) | 496 (16.9%) | 116 (3.95%) |
| Ward’s triangle | 1643 (56.5%) | 885 (30.5%) | 375 (12.9%) |
| Total Cohort Mean (SD) | Male Mean (SD) | Female Mean (SD) | p-Value | |
|---|---|---|---|---|
| Total body | 0.39 (±1.15) | 0.64 (±1.16) | 0.17 (±1.10) | p < 0.001 |
| Femoral trochanter | −0.37 (±1.177) | −0.59 (±1.25) | −0.67 (±1.01) | p < 0.001 |
| Femoral upper neck | 0.06 (±1.31) | 0.37 (±1.427) | −2.25 (±1.11) | p < 0.001 |
| Ward’s triangle | −0.69 (±1.22) | −0.47 (±1.33) | −0.89 (±1.08) | p < 0.001 |
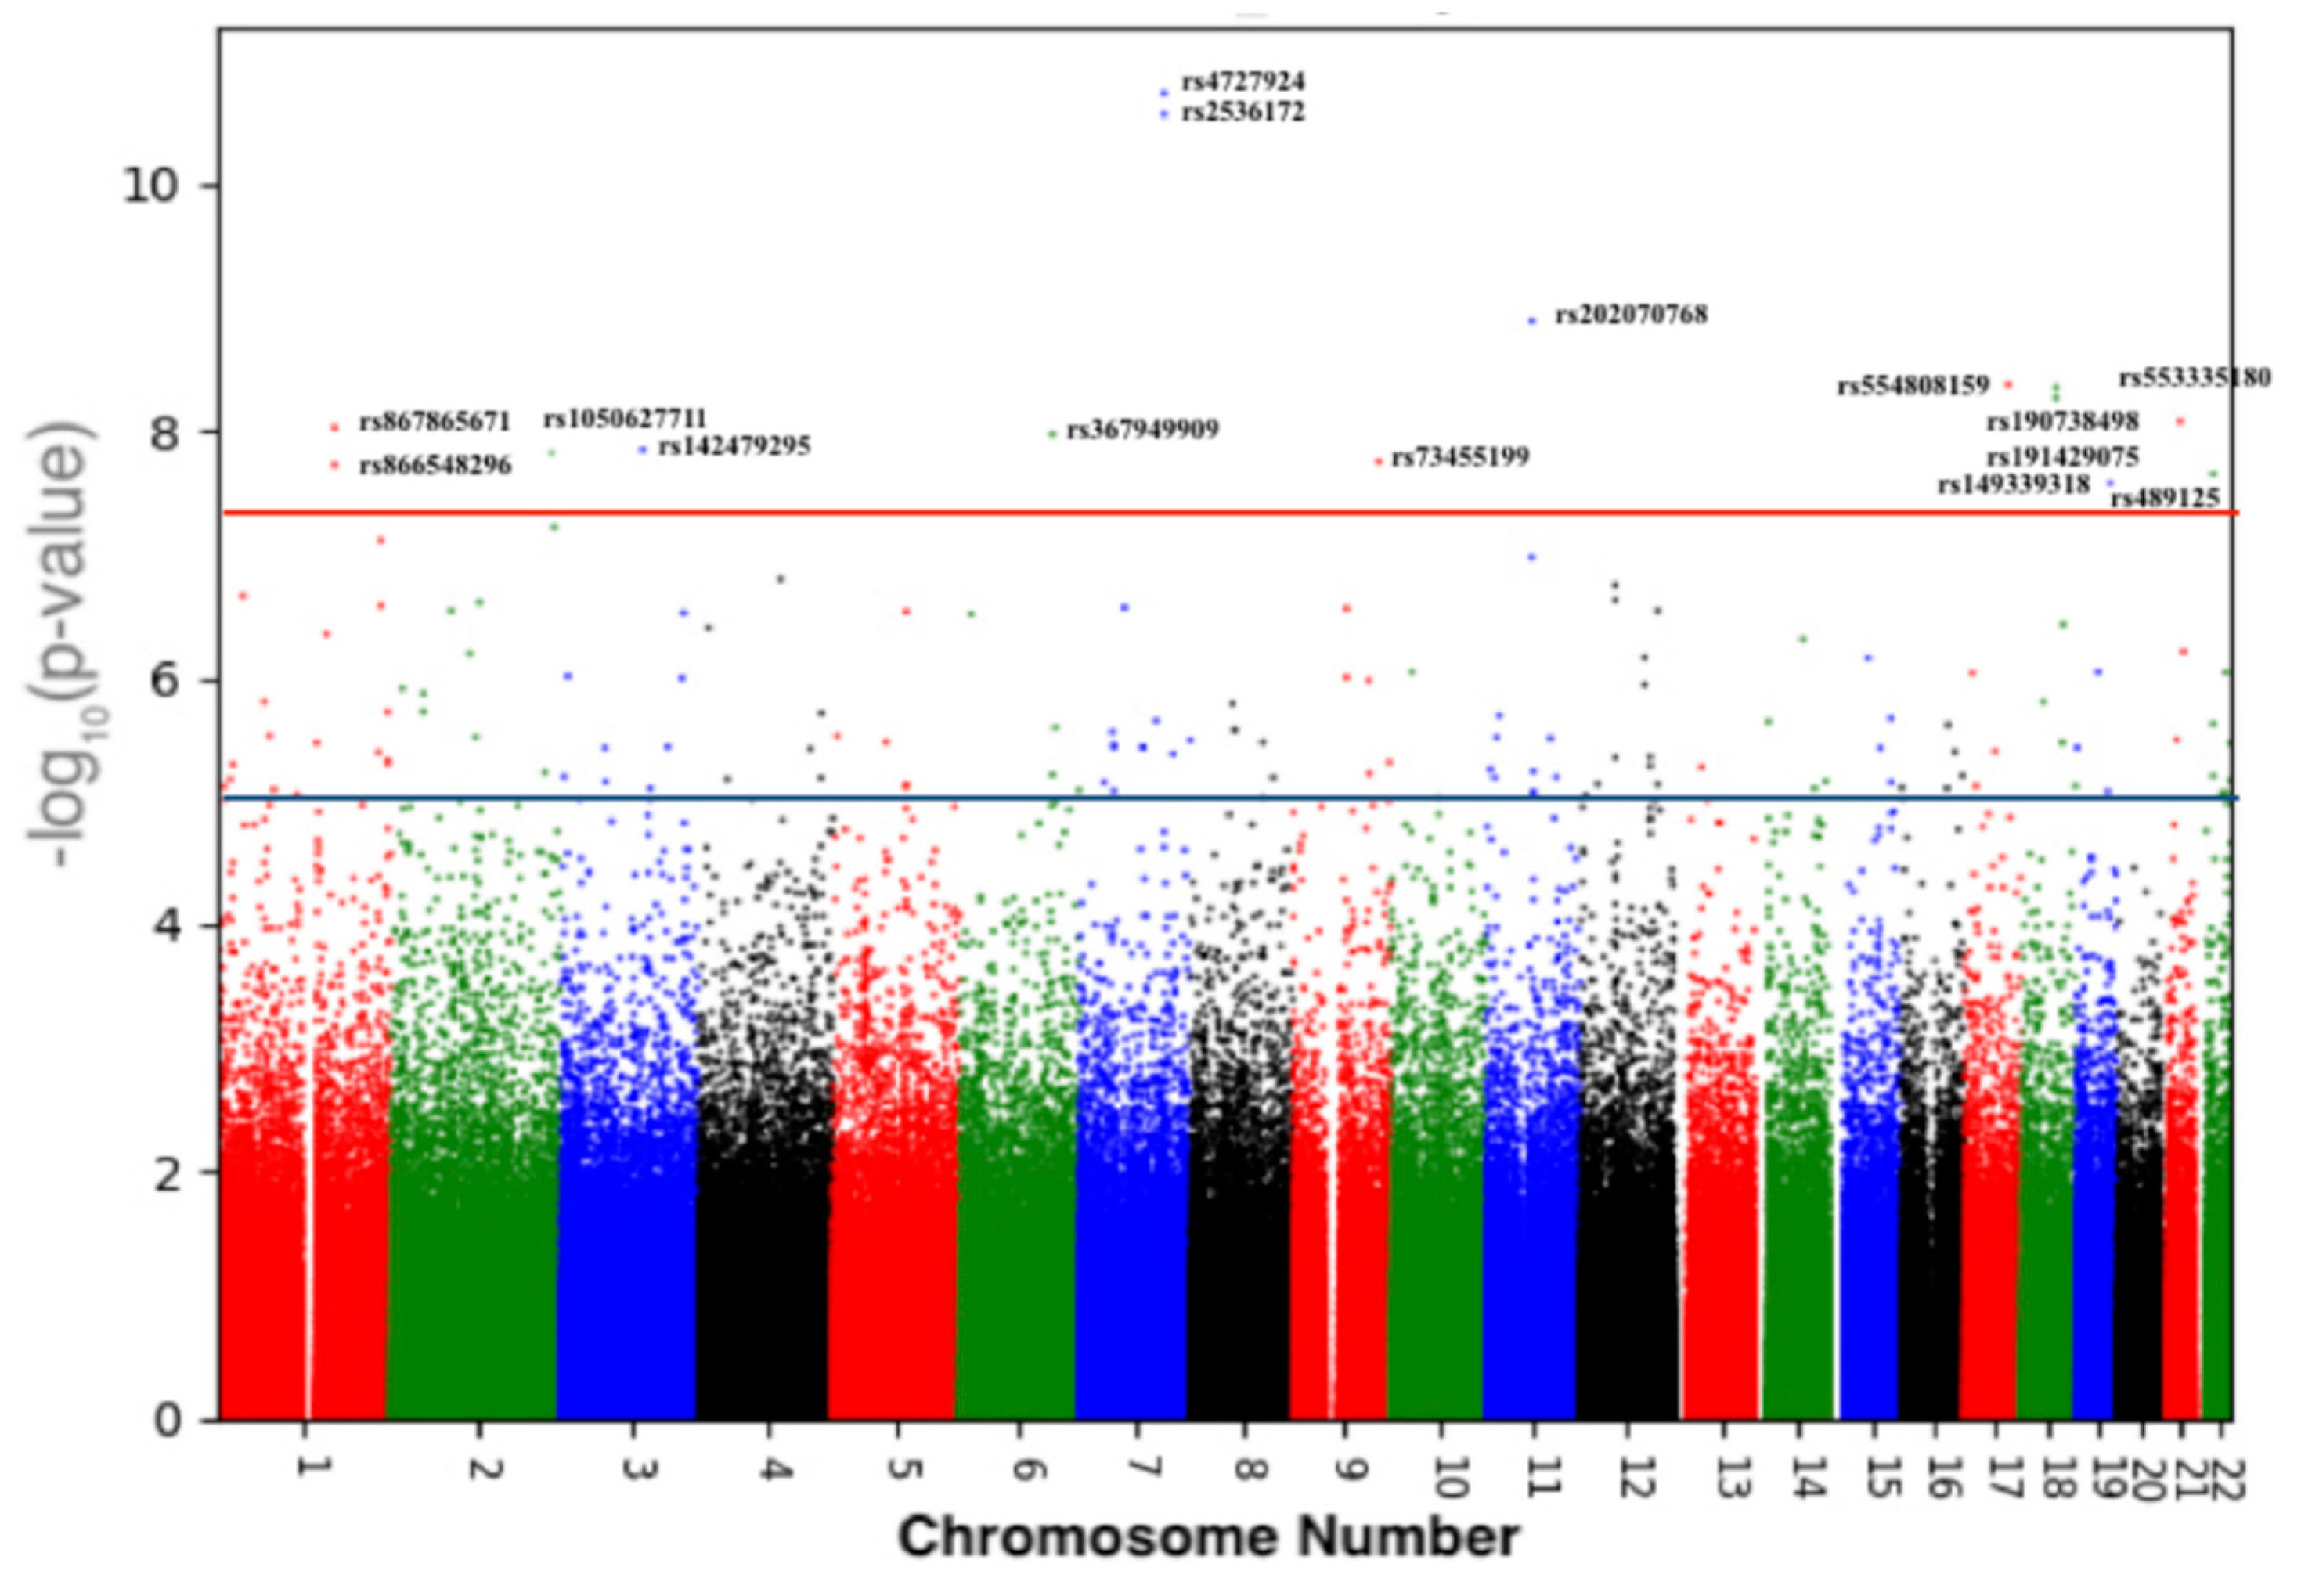
| Chr | RefSNP | Position (GRCh37) | Band | Ancestor Allele | Effect Allele | p-Value | Gene |
|---|---|---|---|---|---|---|---|
| Replicated in the UK-Biobank and GEFOS studies | |||||||
| 7 | rs4727924 | 121031879 | q31.31 | C | T | 1.86 × 10⁻¹¹ | FAM3C |
| 7 | rs2536172 | 120997560 | q31.31 | A | T | 5.75 × 10⁻⁸ | FAM3C/WNT16 intronic |
| 18 | rs190738498 | 59831463 | q21.33 | G | A | 5.71 × 10⁻⁸ | PIGN: Intronic |
| 18 | rs191429075 | 59790212 | q21.33 | C | T | 6.93 × 10⁻⁸ | PIGN: Intronic |
| 22 | rs489125 | 25911056 | q12.1 | G | A | 2.25 × 10⁻⁸ | CRYBB2P1: intronic |
| New findings in the Qatari population | |||||||
| 11 | rs202070768 | 65273453 | q13.1 | T | C | 1.30 × 10⁻⁹ | MALAT1/TALAM1 |
| 17 | rs554808159 | 61978607 | q23.3 | C | T | 4.25 × 10⁻⁹ | intergenic |
| 1 | rs867865671 | 172626211 | q24.3 | A | G | 3.03 × 10⁻⁸ | FASLG: intronic |
| 1 | rs866548296 | 234651783 | q42.2 | C | T | 7.77 × 10⁻⁸ | intergenic |
| 2 | rs1050627711 | 233310901 | q37.1 | C | T | 6.08 × 10⁻⁸ | SAG: Intronic |
| 3 | rs142479295 | 117374777 | q13.32 | T | Dup T | 9.68 × 10⁻⁸ | LSAMP: intronic |
| 6 | rs367949909 | 132861904 | q23.2 | T | C | 4.94 × 10⁻⁸ | intergenic |
| 9 | rs73455199 | 71961260 | q21.12 | A | G | 3.38 × 10⁻⁸ | FAM189A2: Intronic |
| 19 | rs149339318 | 44503670 | q13.31 | TA | Del TA | 8.35 × 10⁻⁸ | LOC101928063: intronic |
| 21 | rs199894228/rs553335180 | 26574354 | q21.2 | T | Del T | 8.44 × 10⁻⁹ | intergenic |
Publisher’s Note: MDPI stays neutral with regard to jurisdictional claims in published maps and institutional affiliations. |
© 2021 by the authors. Licensee MDPI, Basel, Switzerland. This article is an open access article distributed under the terms and conditions of the Creative Commons Attribution (CC BY) license (http://creativecommons.org/licenses/by/4.0/).
Share and Cite
Younes, N.; Syed, N.; Yadav, S.K.; Haris, M.; Abdallah, A.M.; Abu-Madi, M. A Whole-Genome Sequencing Association Study of Low Bone Mineral Density Identifies New Susceptibility Loci in the Phase I Qatar Biobank Cohort. J. Pers. Med. 2021, 11, 34. https://0-doi-org.brum.beds.ac.uk/10.3390/jpm11010034
Younes N, Syed N, Yadav SK, Haris M, Abdallah AM, Abu-Madi M. A Whole-Genome Sequencing Association Study of Low Bone Mineral Density Identifies New Susceptibility Loci in the Phase I Qatar Biobank Cohort. Journal of Personalized Medicine. 2021; 11(1):34. https://0-doi-org.brum.beds.ac.uk/10.3390/jpm11010034
Chicago/Turabian StyleYounes, Nadin, Najeeb Syed, Santosh K. Yadav, Mohammad Haris, Atiyeh M. Abdallah, and Marawan Abu-Madi. 2021. "A Whole-Genome Sequencing Association Study of Low Bone Mineral Density Identifies New Susceptibility Loci in the Phase I Qatar Biobank Cohort" Journal of Personalized Medicine 11, no. 1: 34. https://0-doi-org.brum.beds.ac.uk/10.3390/jpm11010034