
Simultaneous Inhibition of Three Major Cytokines and Its Therapeutic Effects: A Peptide-Based Novel Therapy against Endotoxemia in Mice

 , ,
, ,  , and
, and 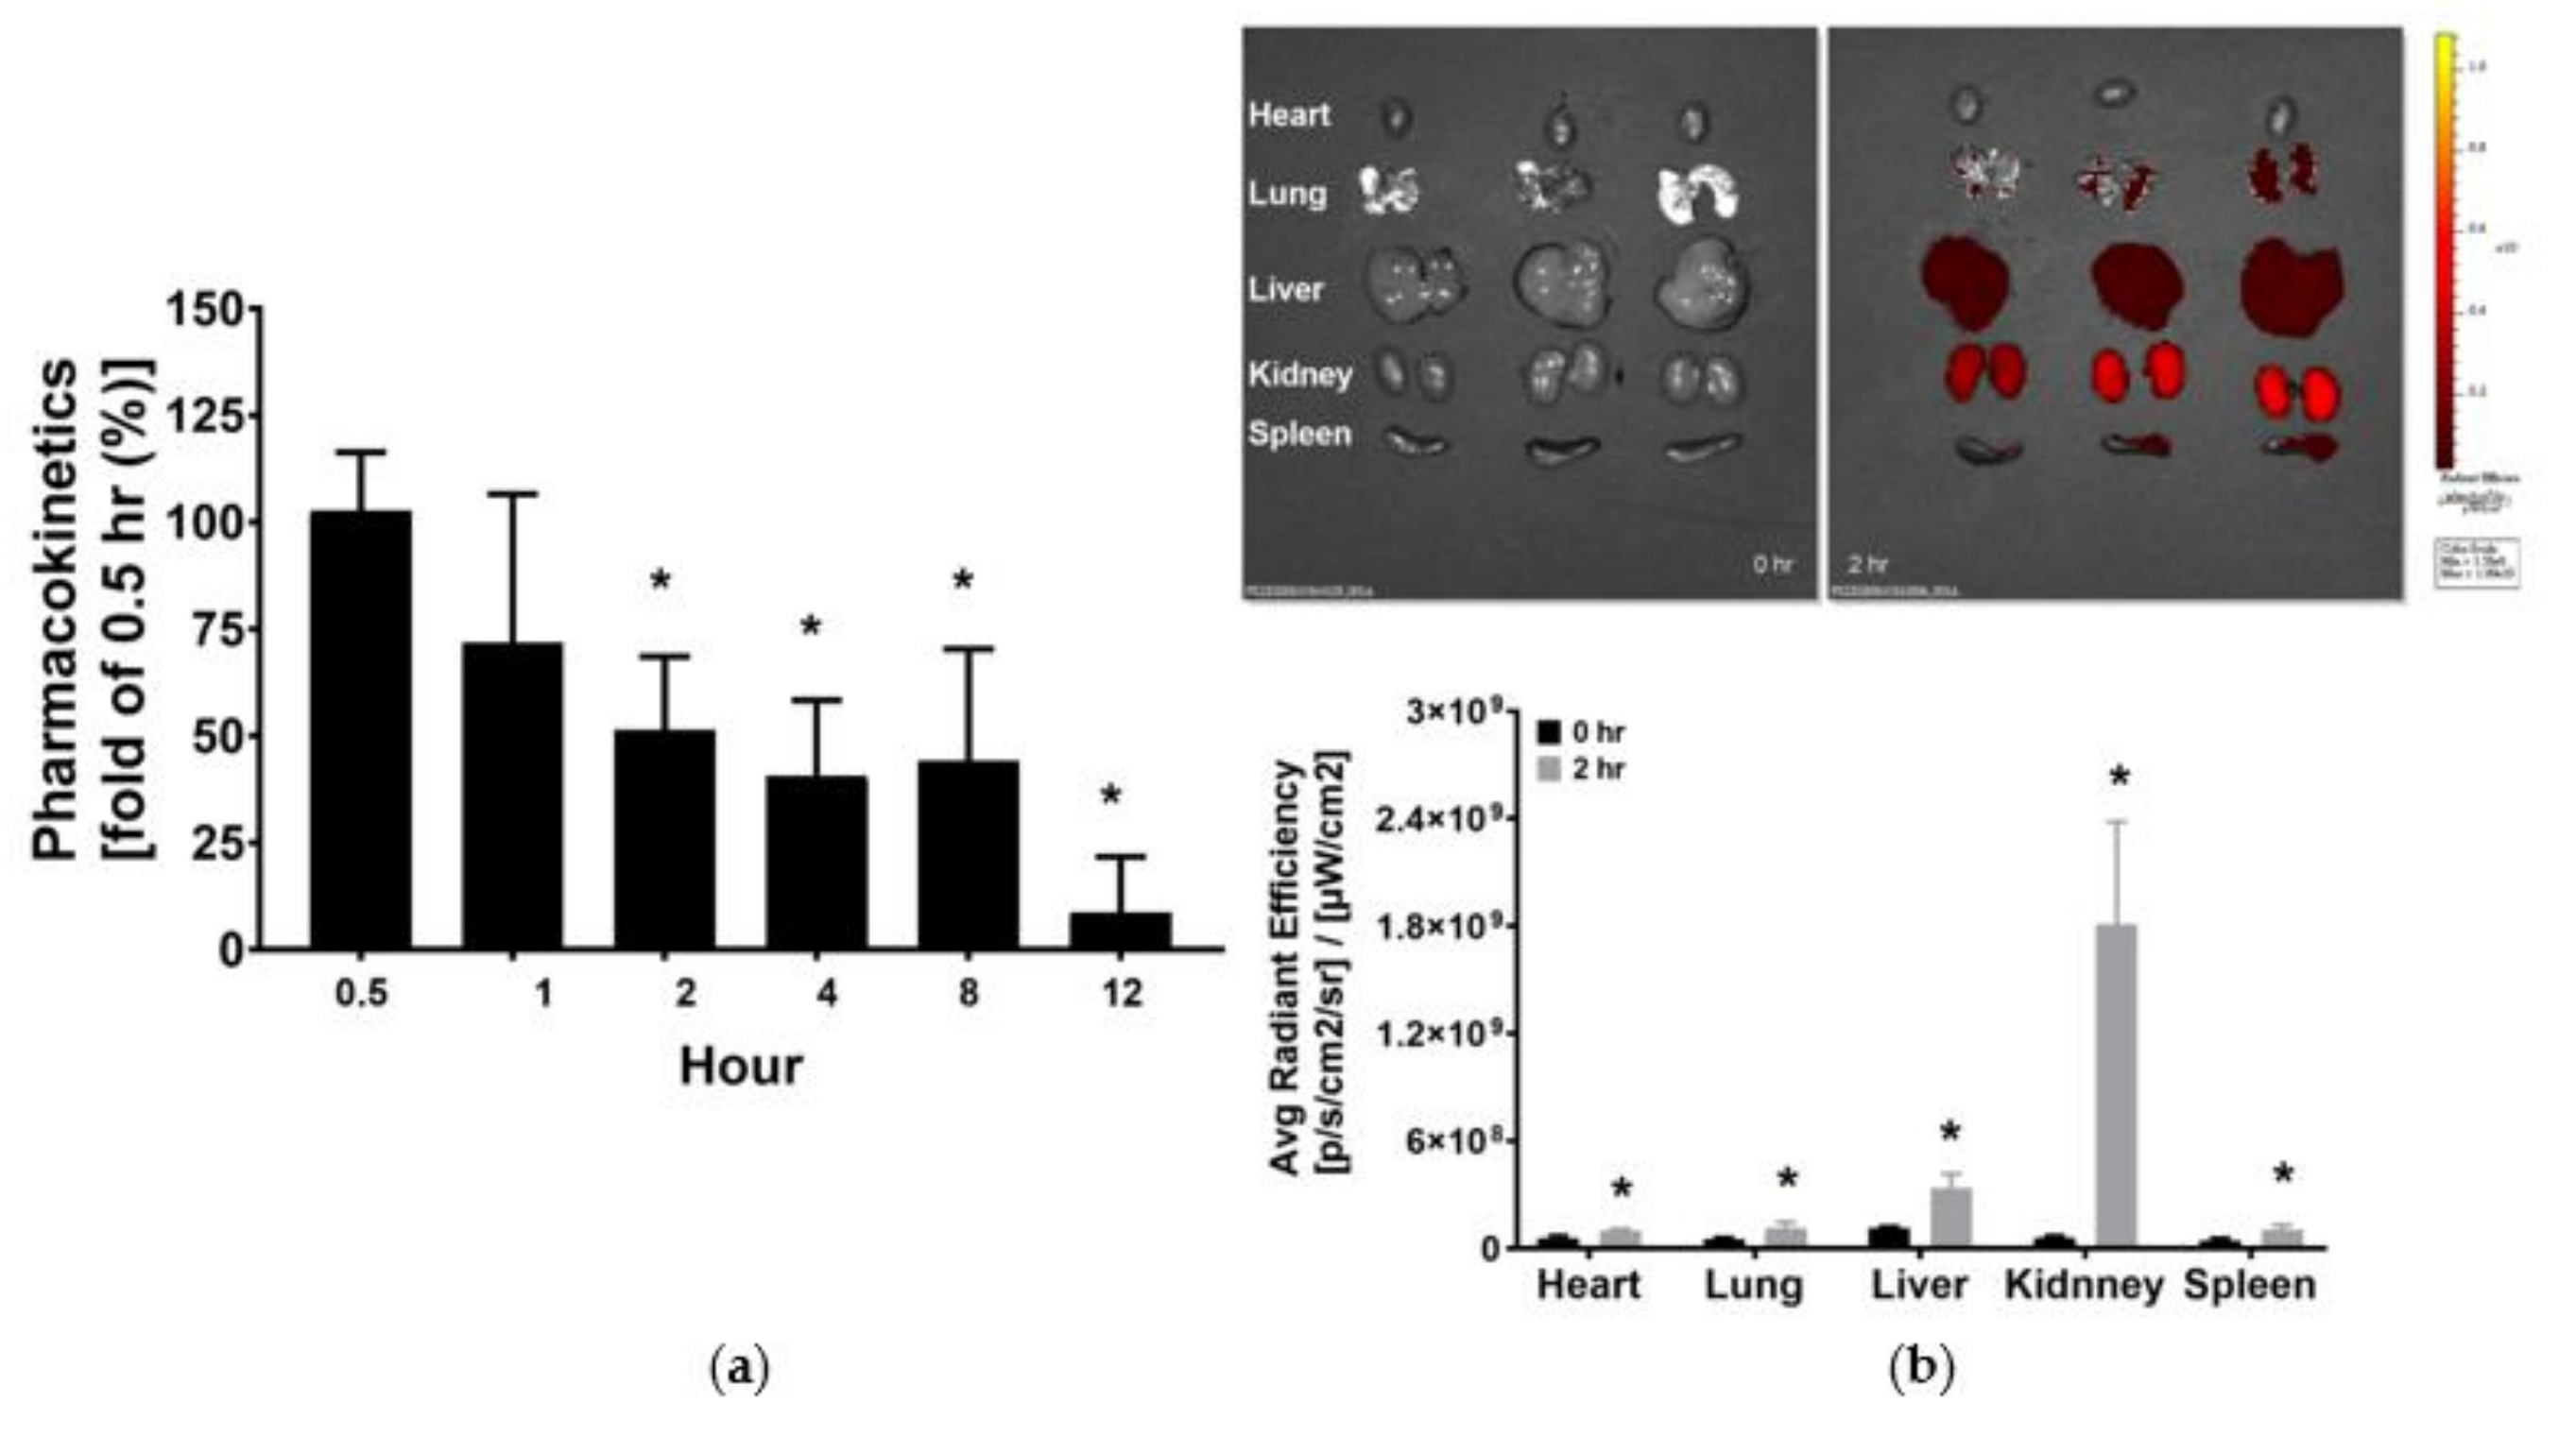
Abstract
:1. Introduction
2. Materials and Methods
2.1. Approval of Animal Experiment and Study
2.2. Peptide Design and Synthesis
2.3. Pharmacokinetic Analysis
2.4. Ex Vivo Bioluminescence Imaging
2.5. Cytokine Receptor Binding Assay
2.6. Endotoxemia Murine Model and Peptide Therapy
2.7. Blood Sampling, Liver Harvesting, and Wet/Dry Weight (W/D) Ratio Determination
2.8. Vacular Permeability Assay
2.9. Liver Enzyme Measurements
2.10. Histological Analysis of Liver
2.11. Enzyme-Linked Immunosorbent Assay (ELISA)
2.12. Immunohistochemistry Staining
2.13. The Terminal Deoxynucleotidyl Transferase dUTP Nick End Labeling (TUNEL) Assay
2.14. Immunoblotting Assay
2.15. Statistical Analysis
3. Results
3.1. Pharmacokinetics and Tissue Distribution of KCF18
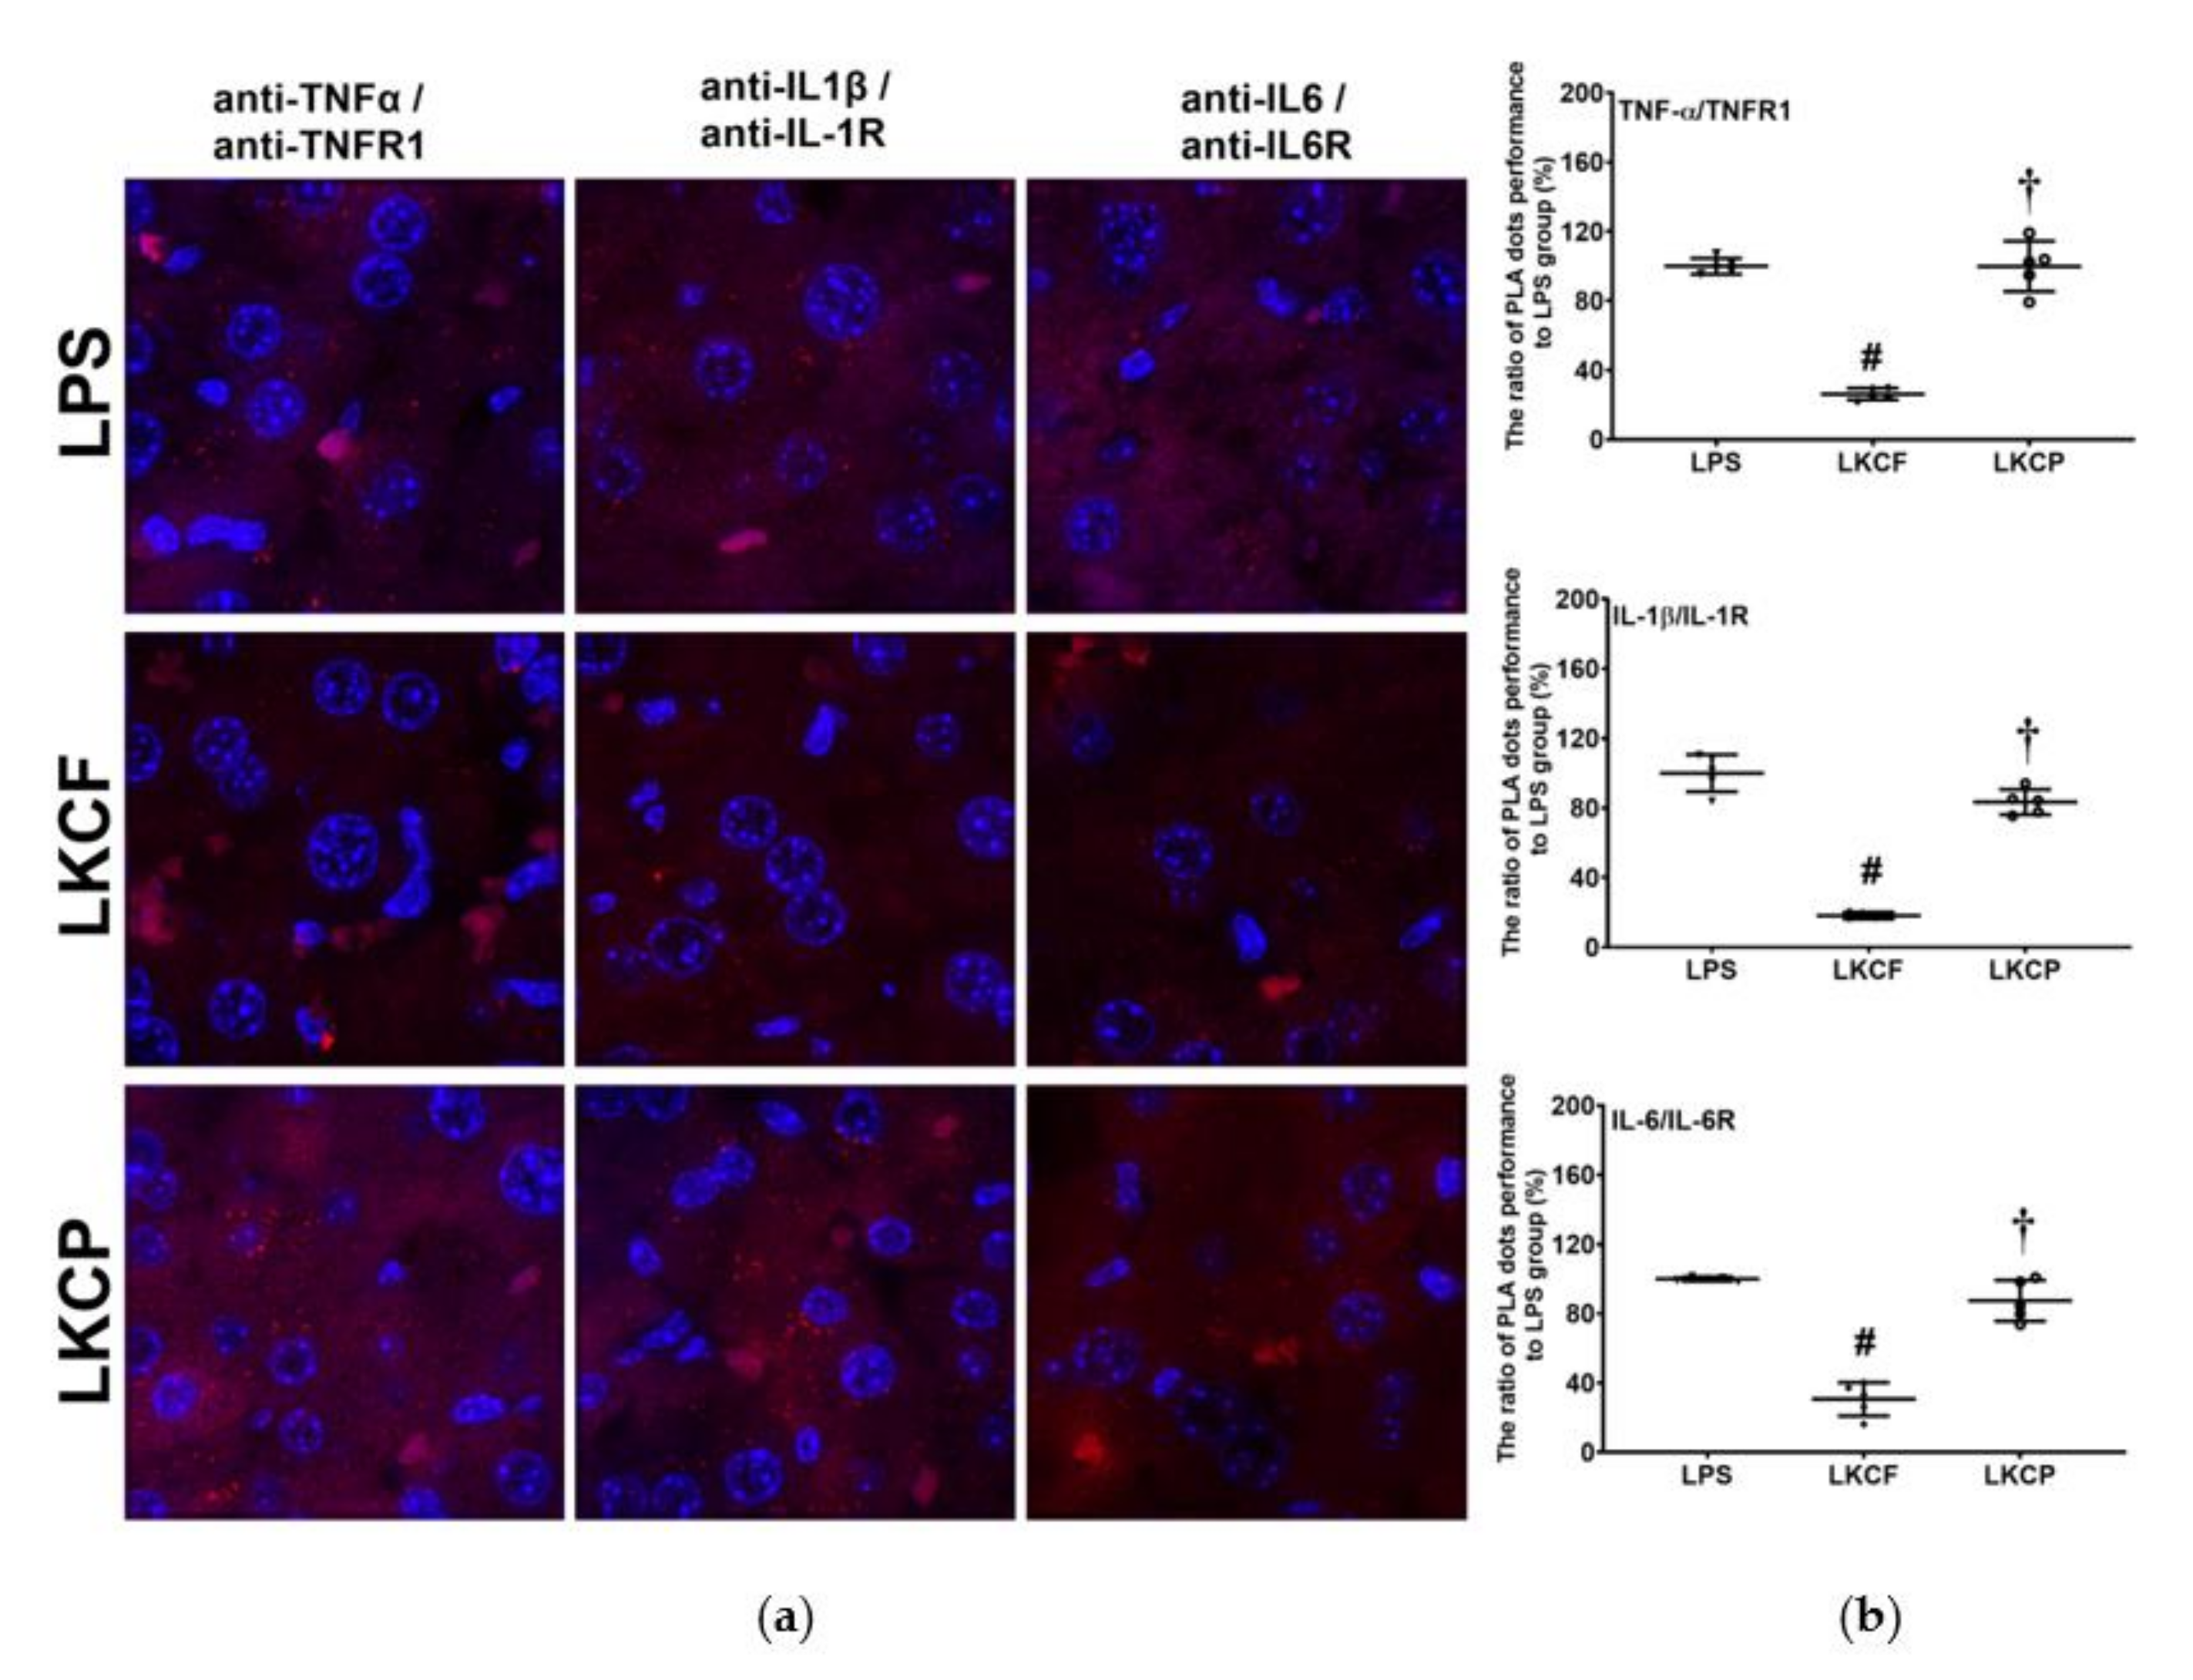
3.2. KCF18 Inhibits LPS-Induced Cytokine Receptor Bindings in the Liver
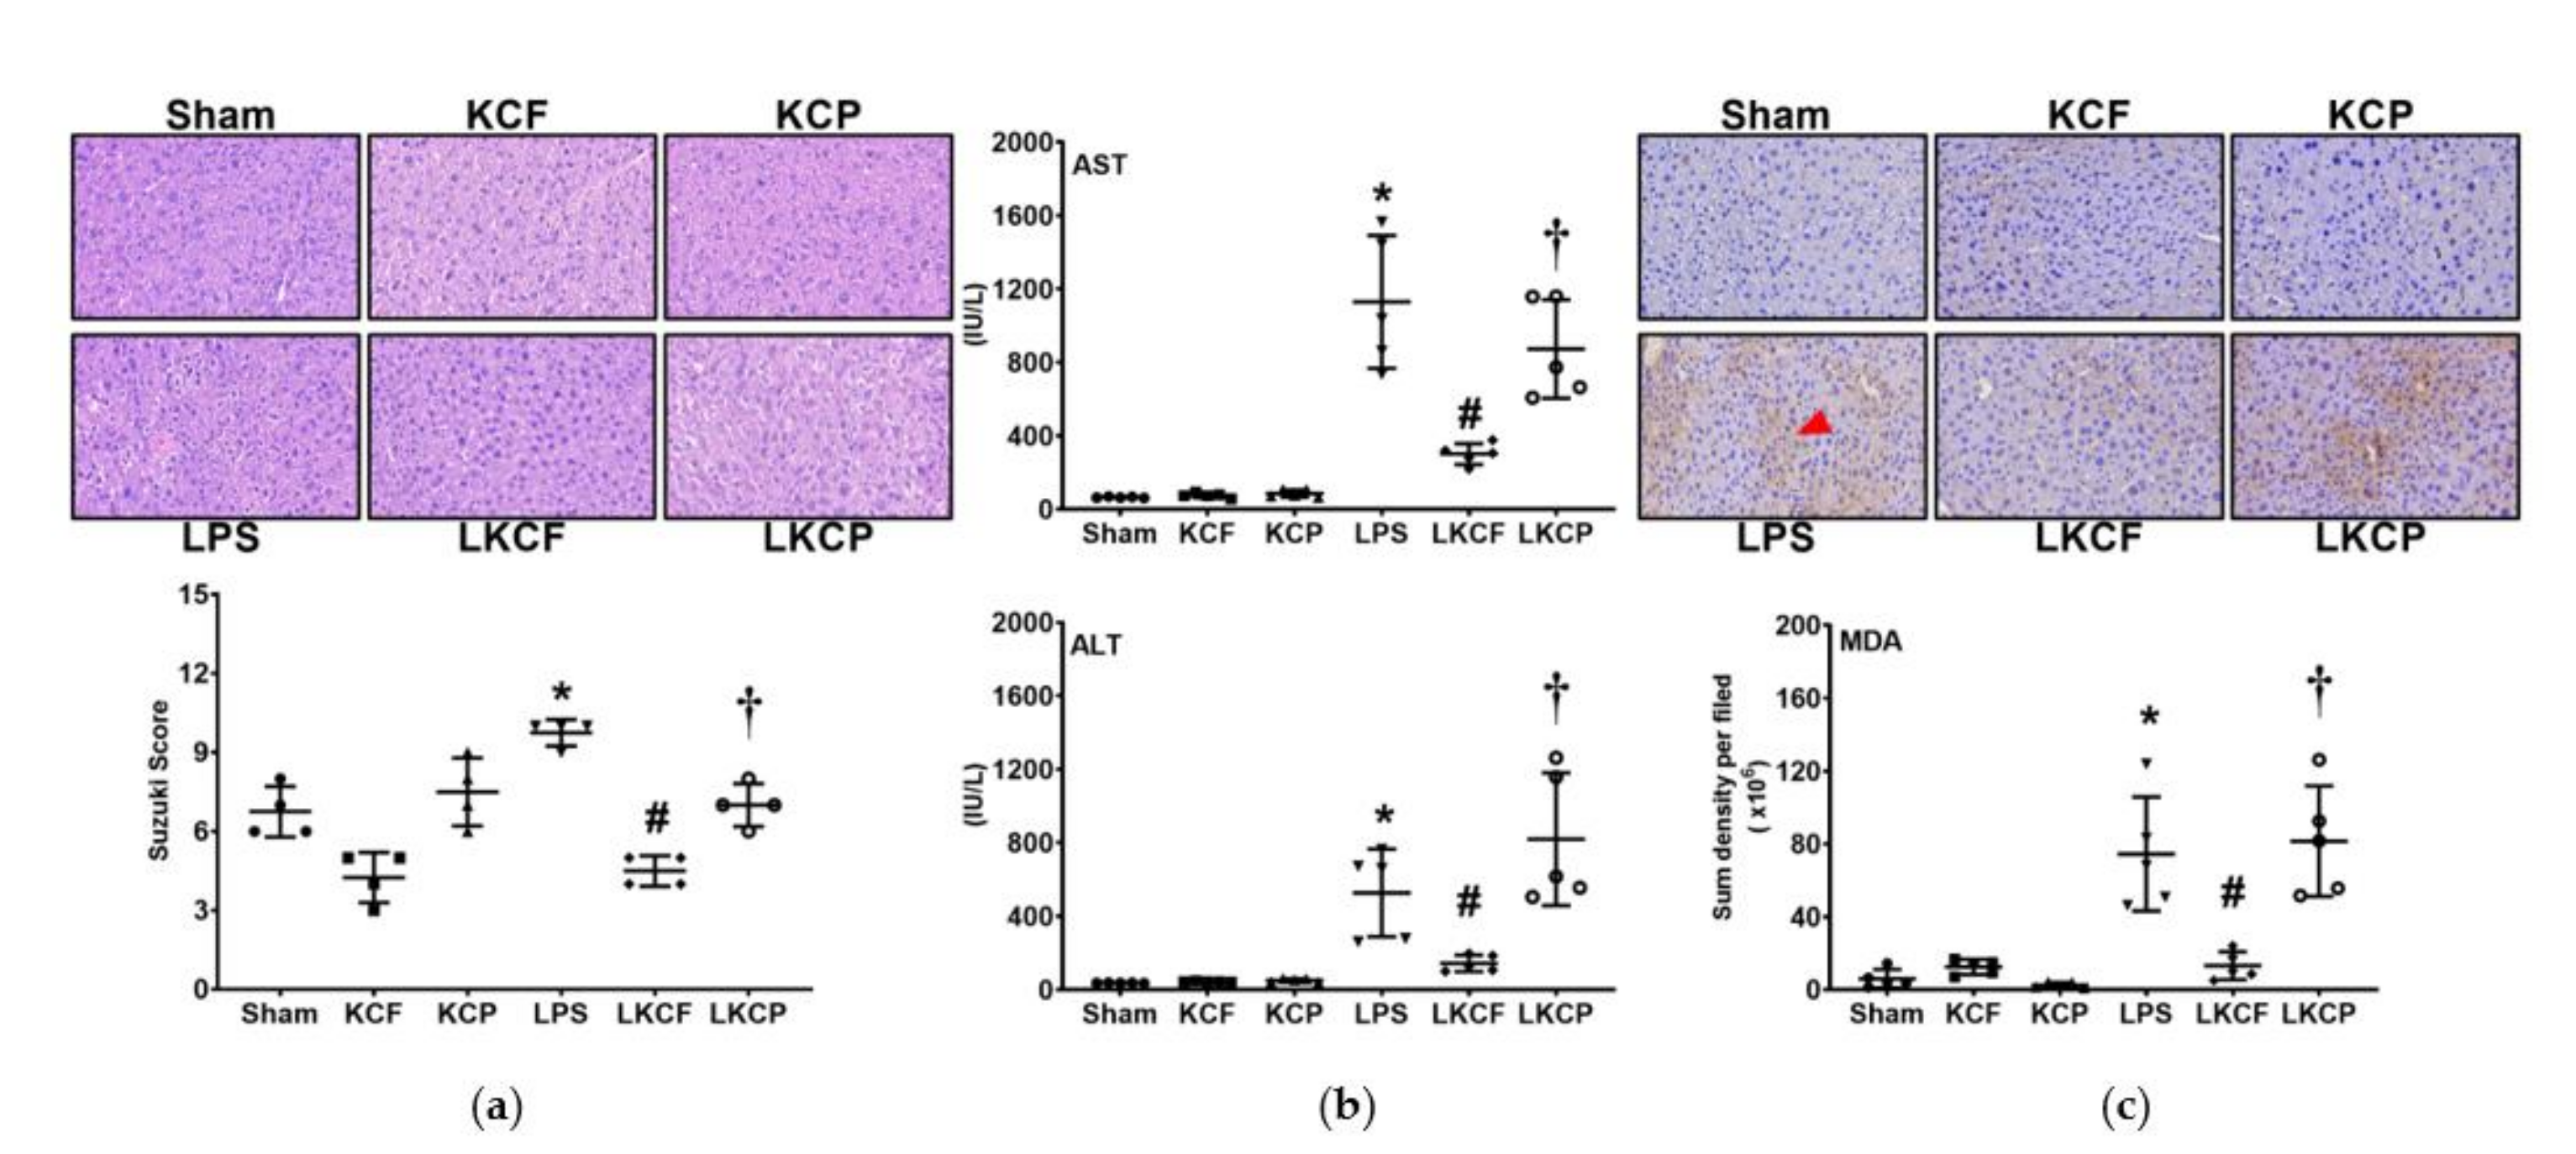
3.3. KCF18 Inhibits LPS-Induced Liver Injury and Oxidation
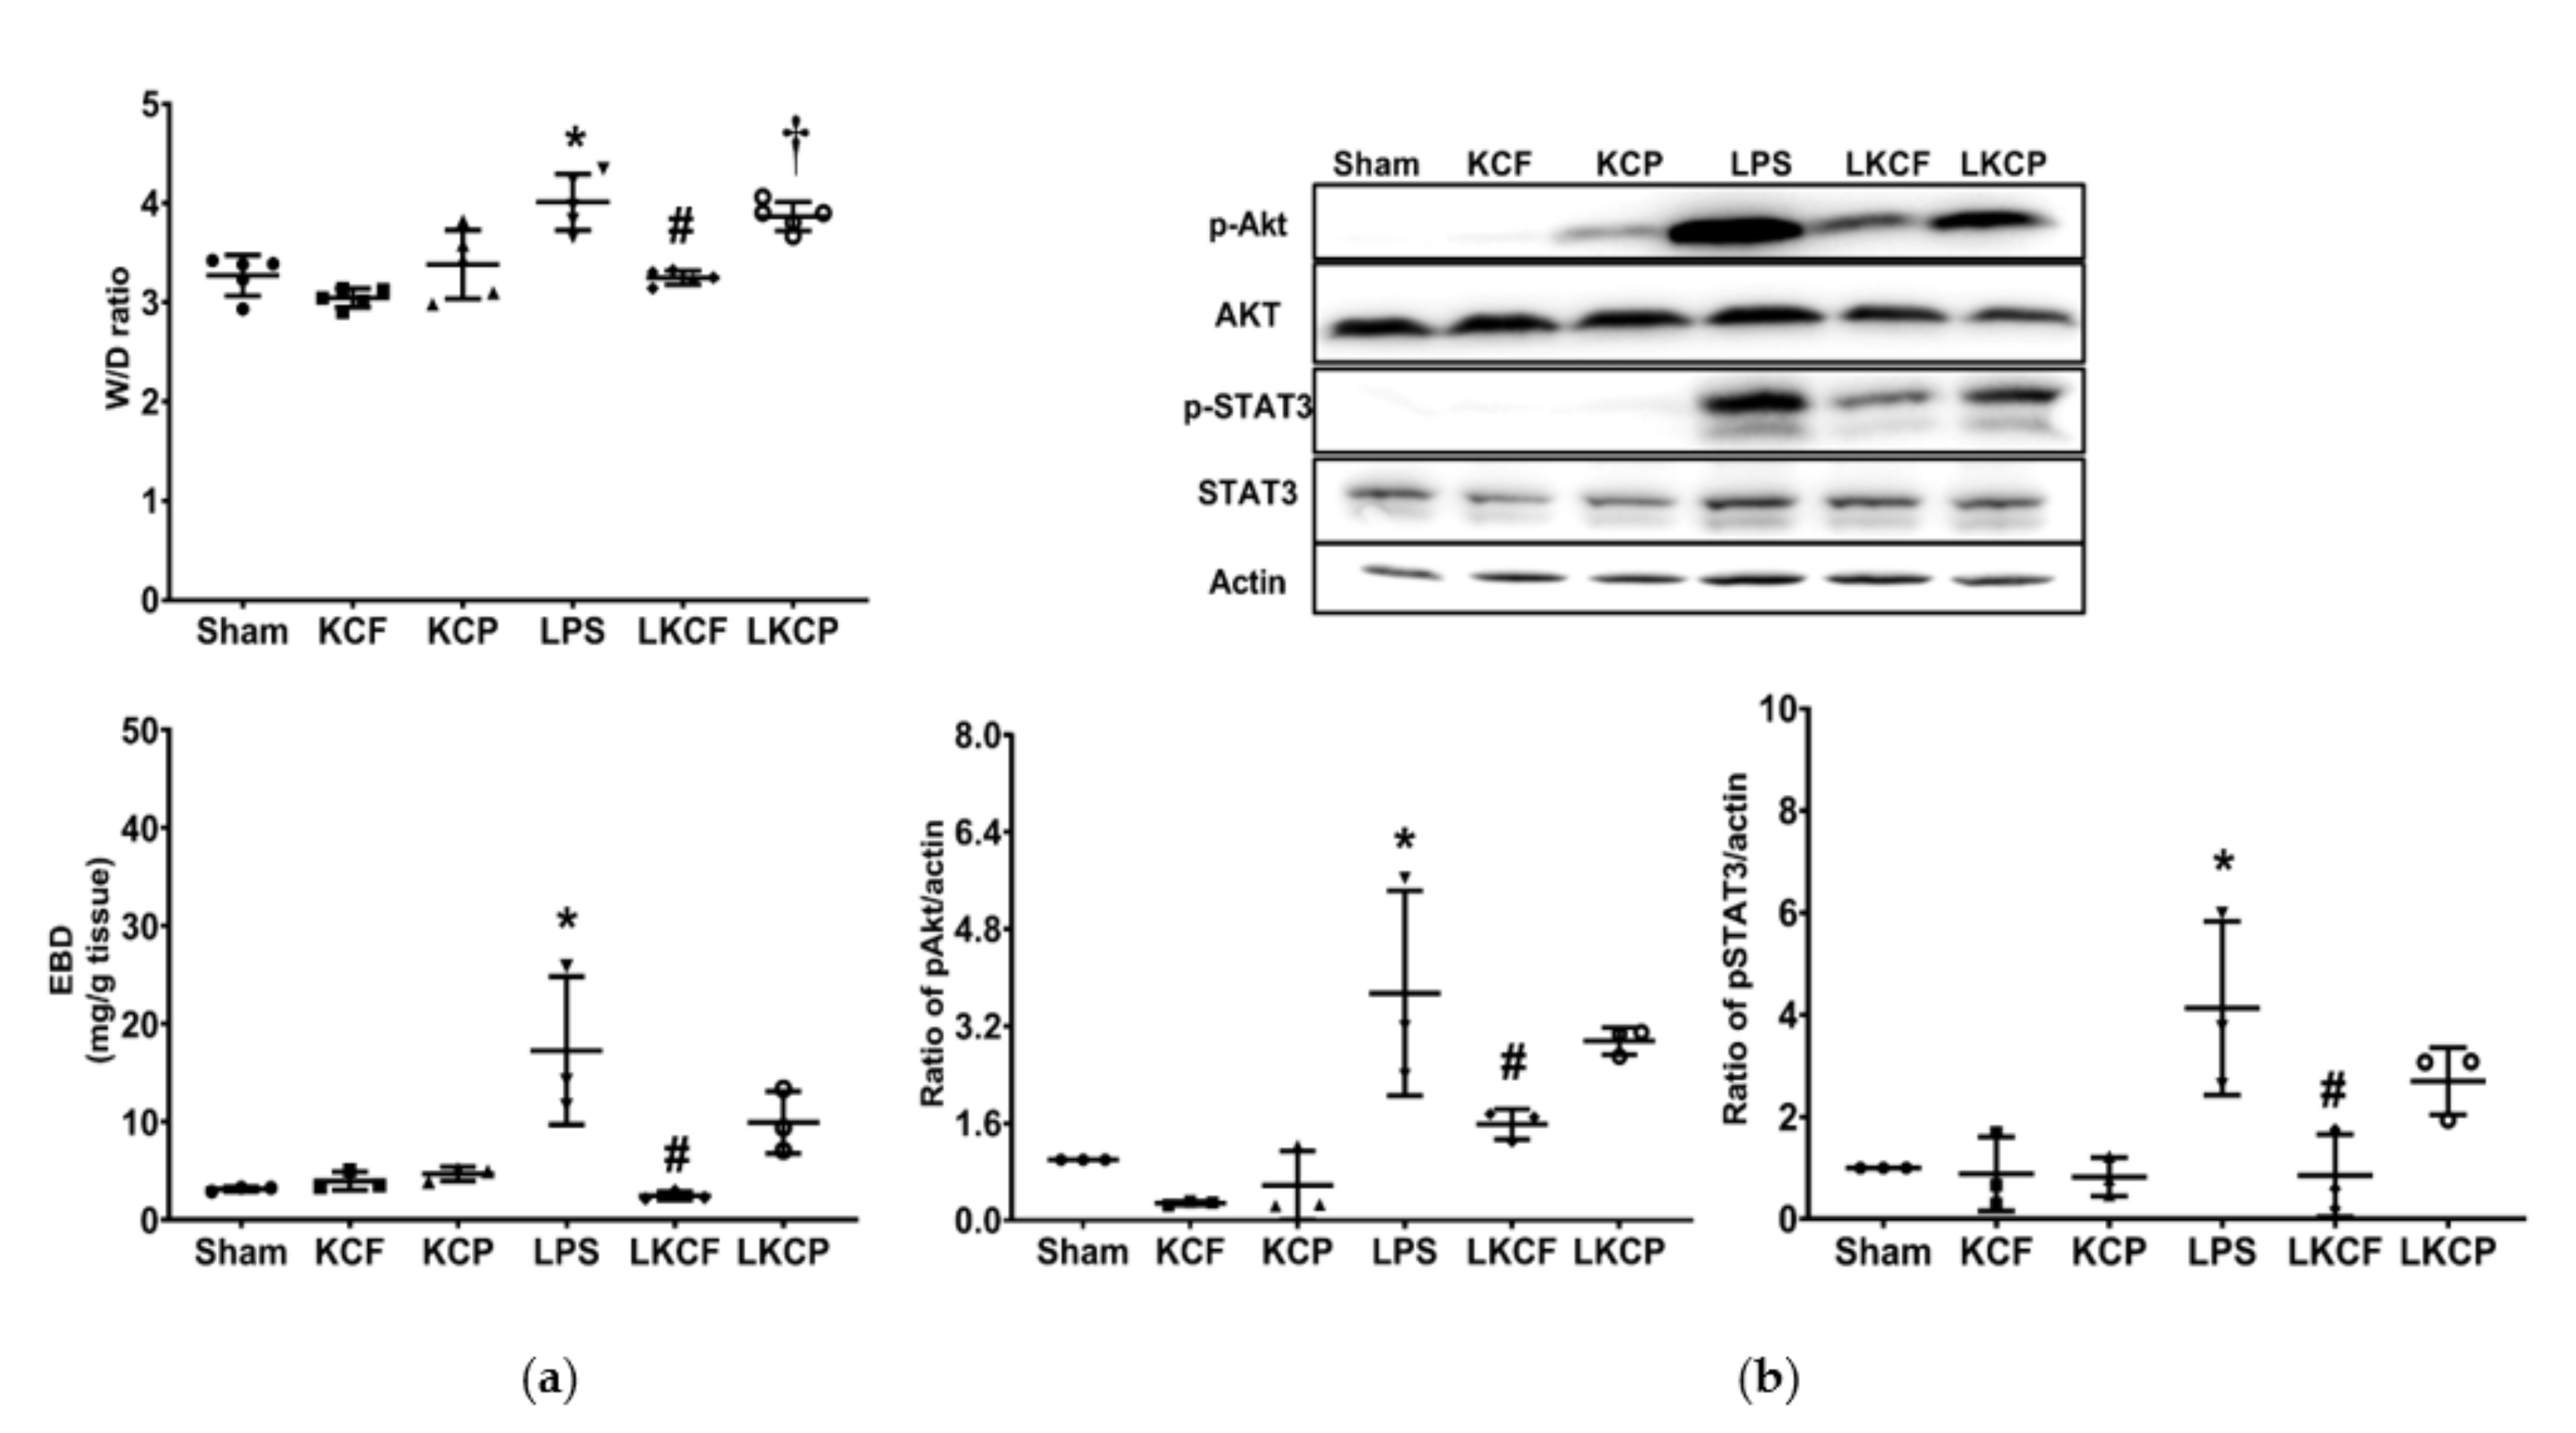
3.4. KCF18 Inhibits the LPS-Induced Increase in Vascular Permeability and Akt and STAT3 Activation
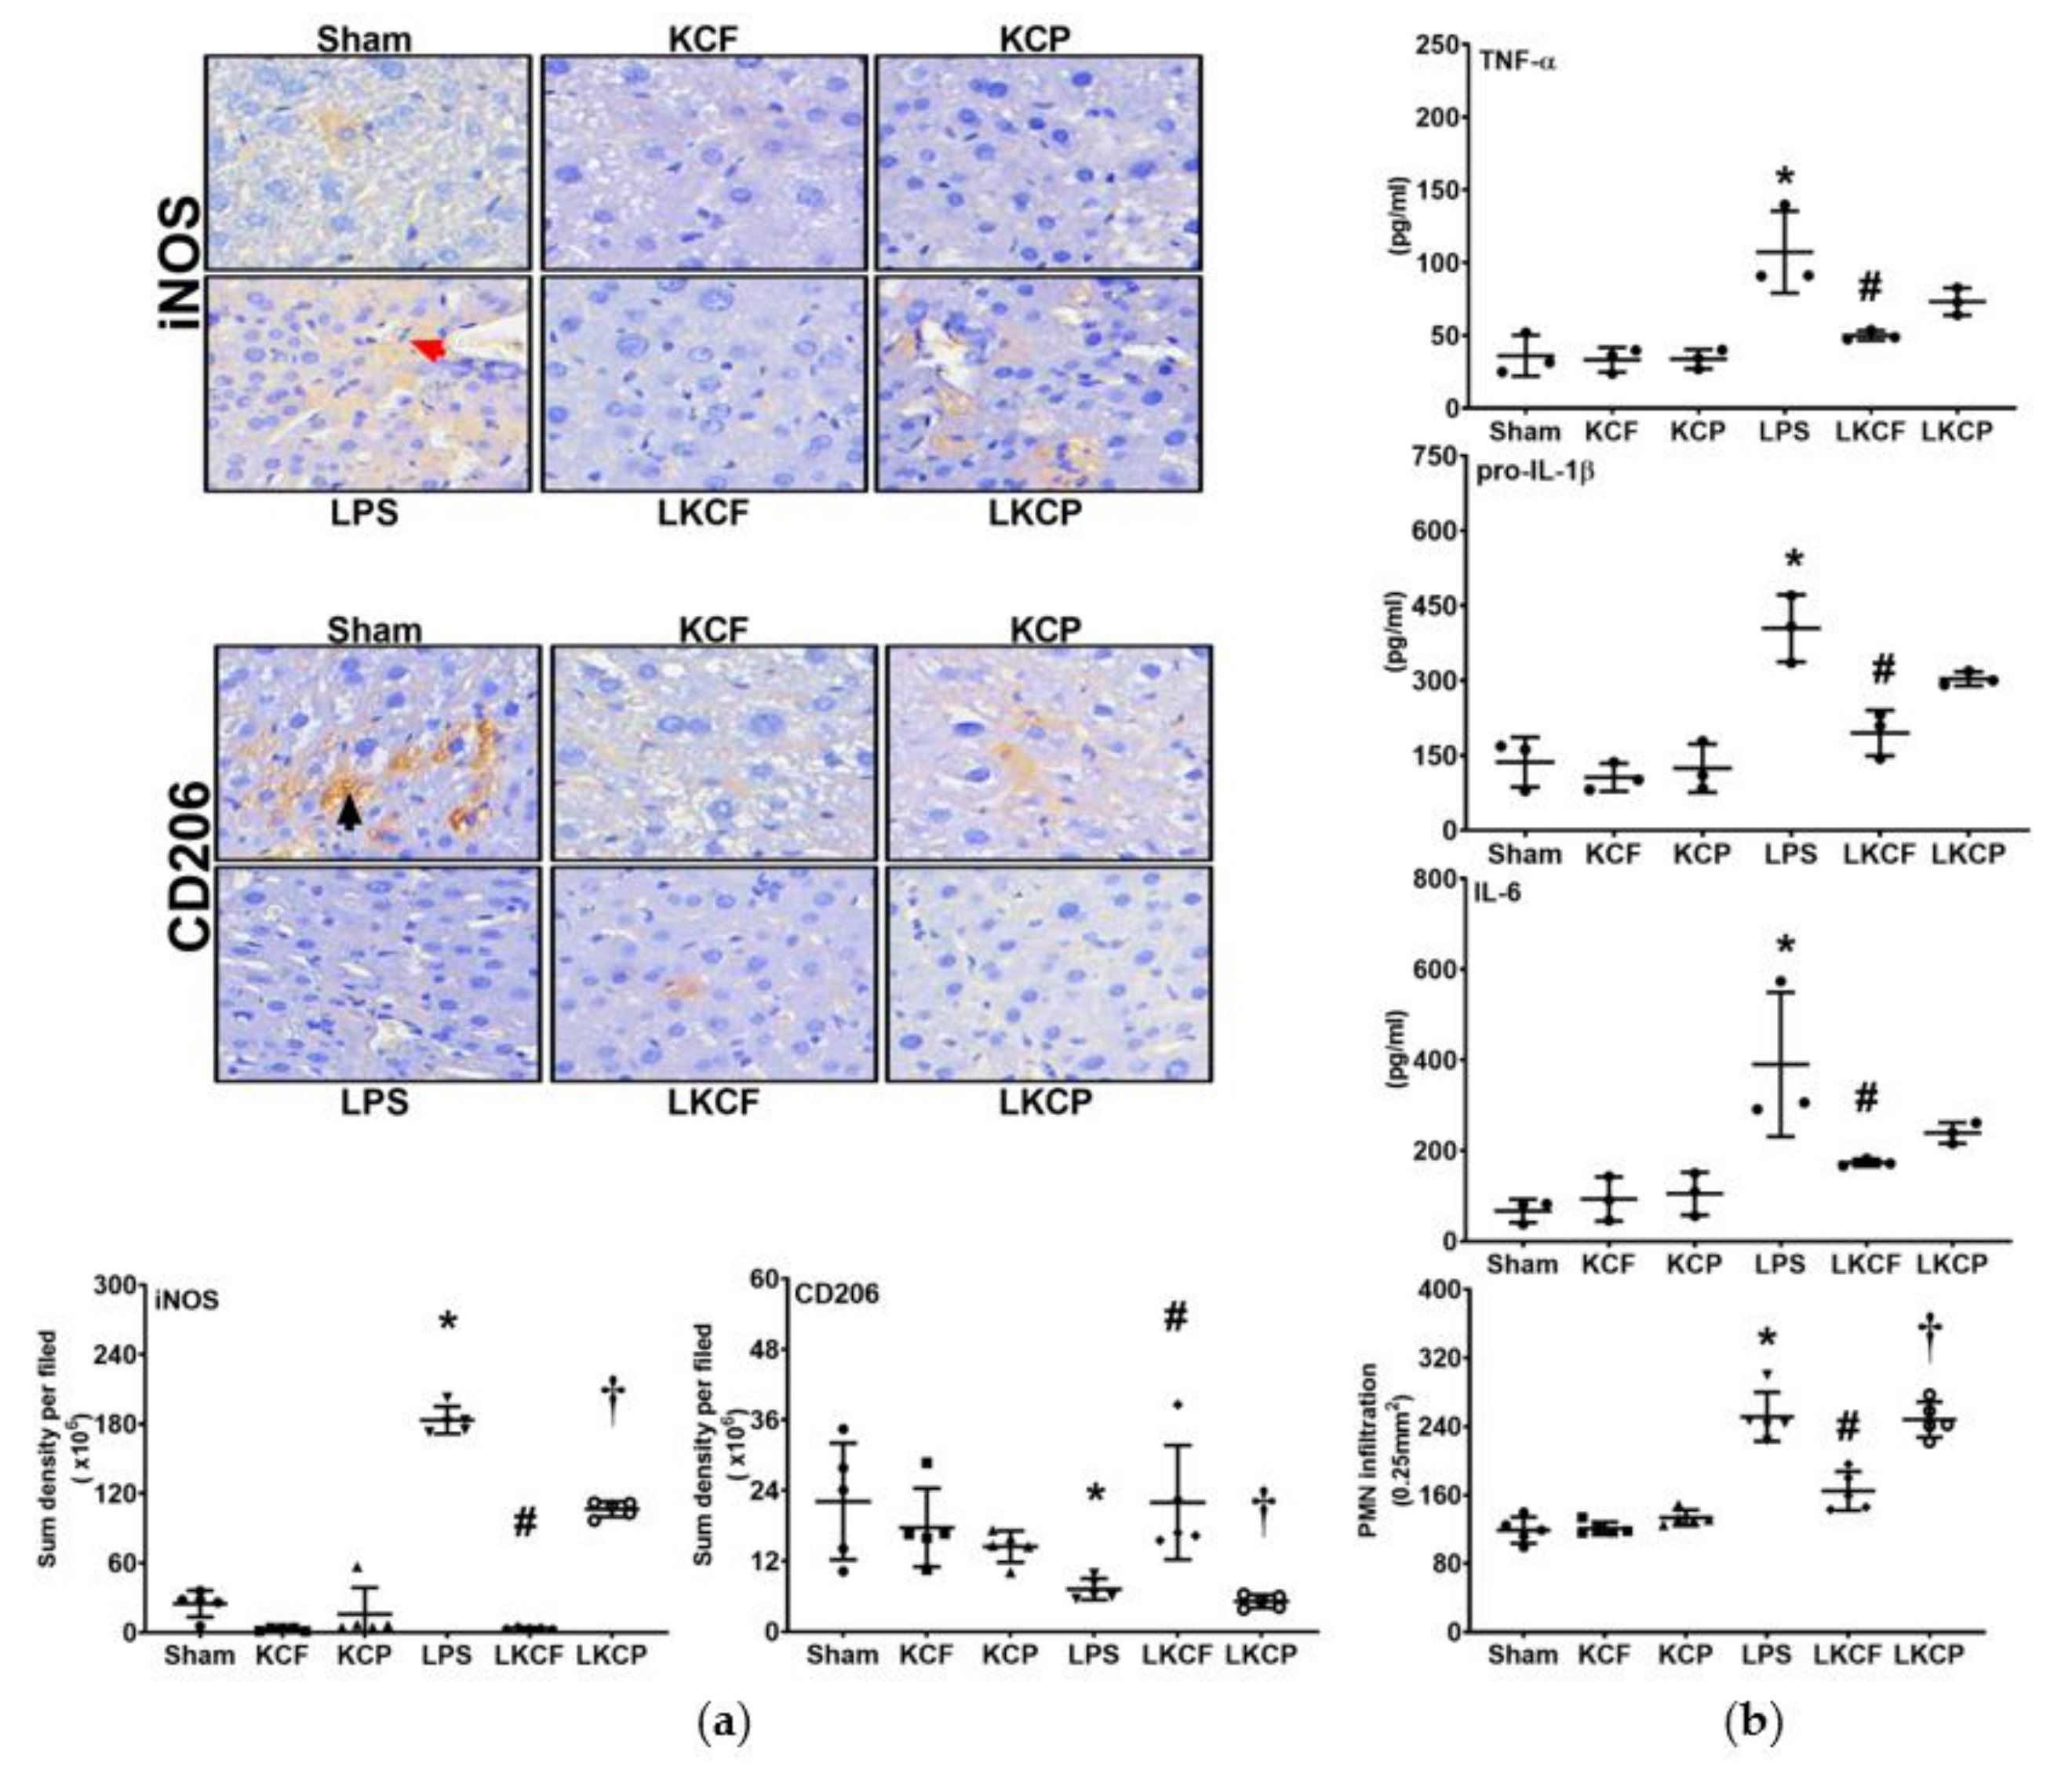
3.5. KCF18 Inhibits LPS-Induced Liver Inflammation
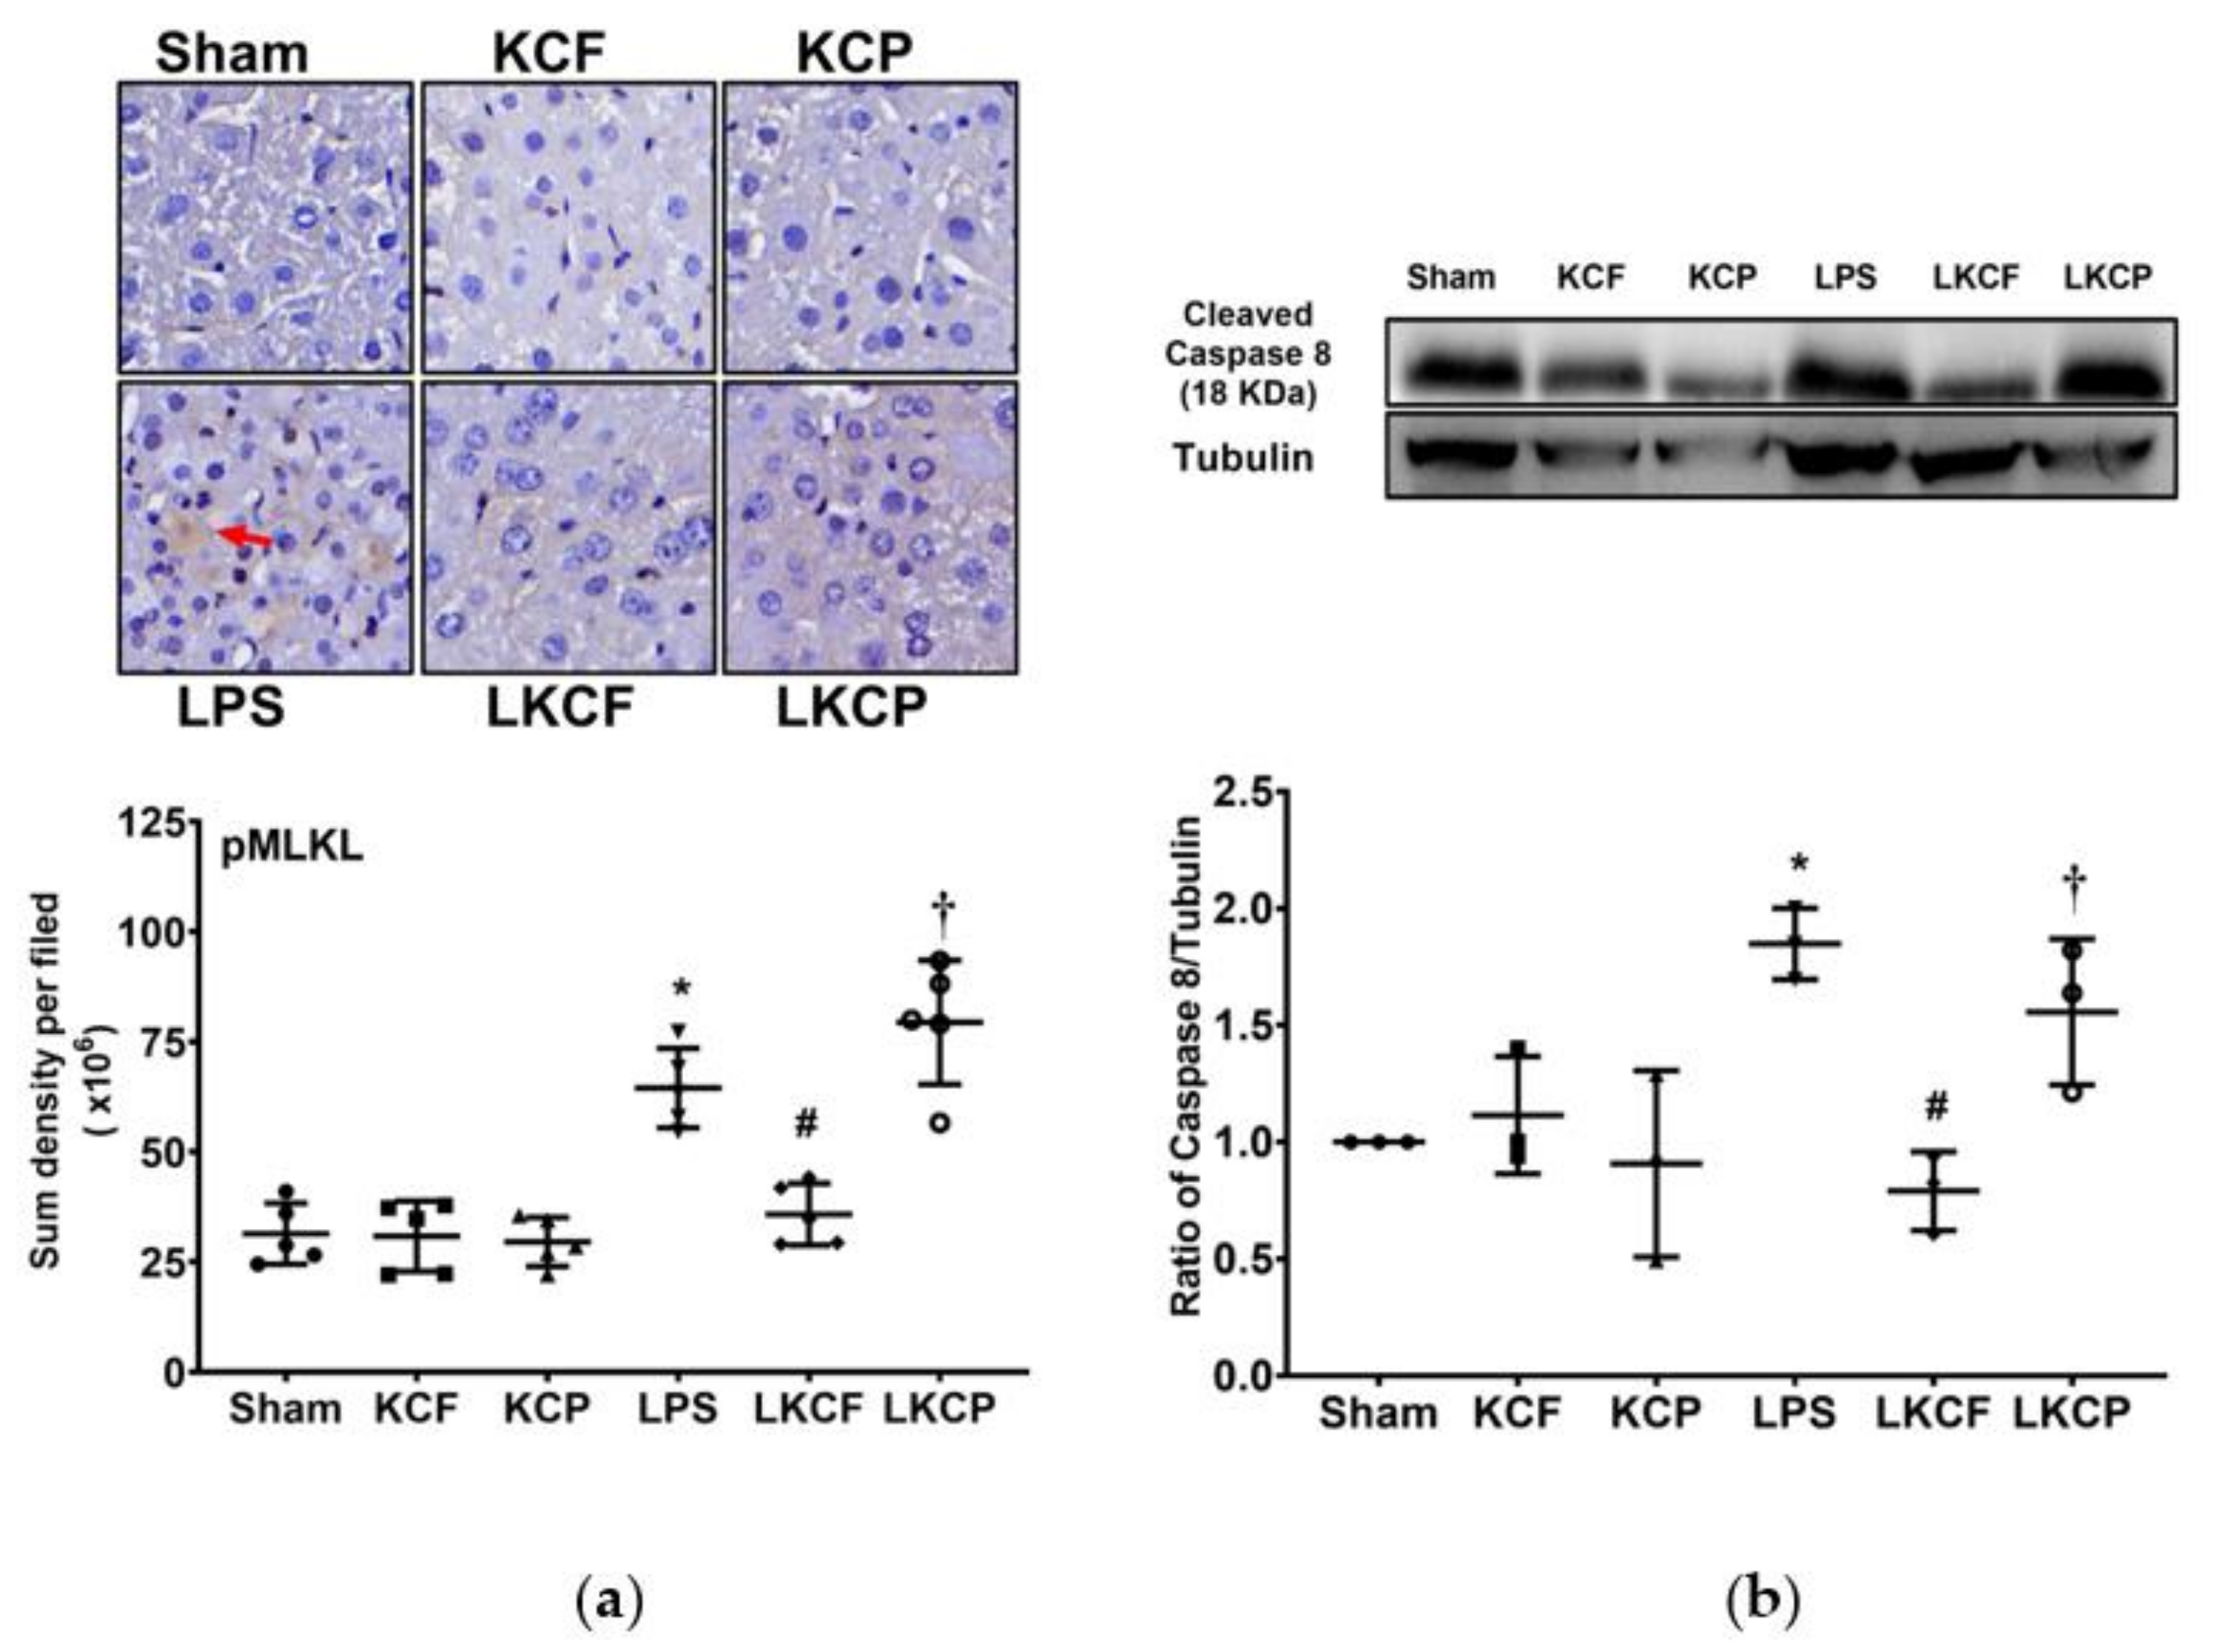
3.6. KCF18 Inhibits LPS-Induced Liver Necroptosis
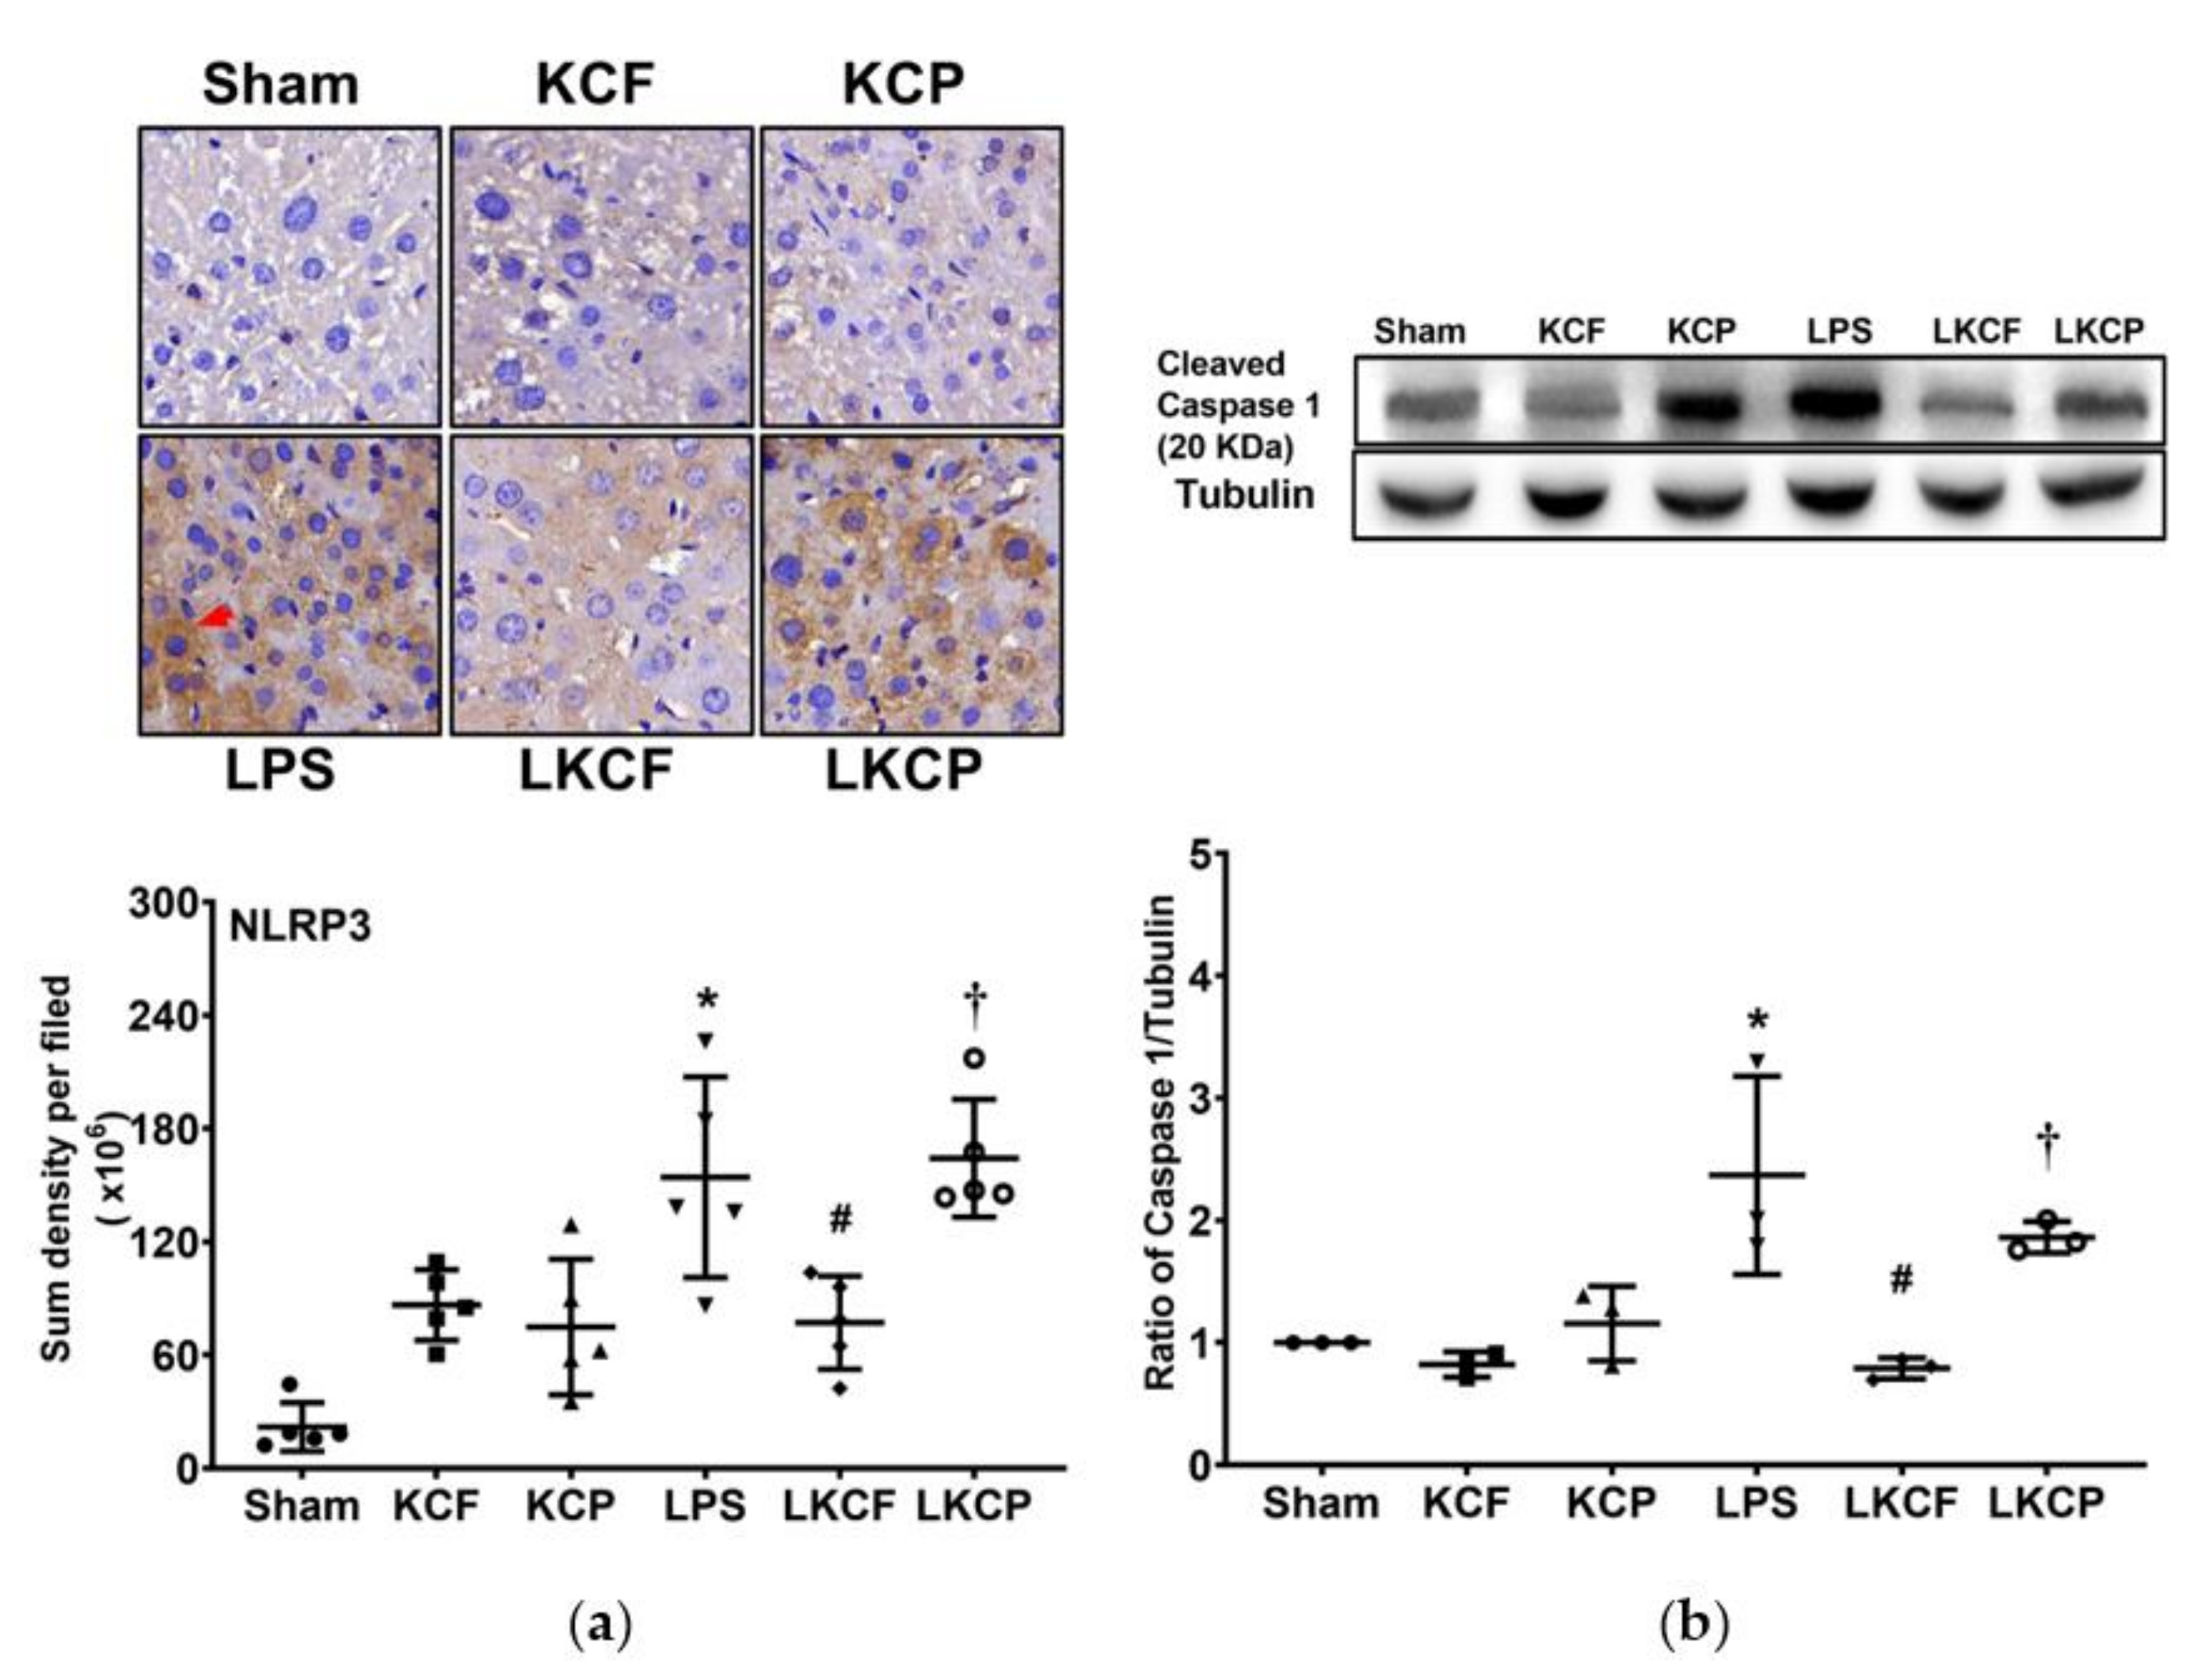
3.7. KCF18 Inhibits LPS-Induced Liver Pyroptosis
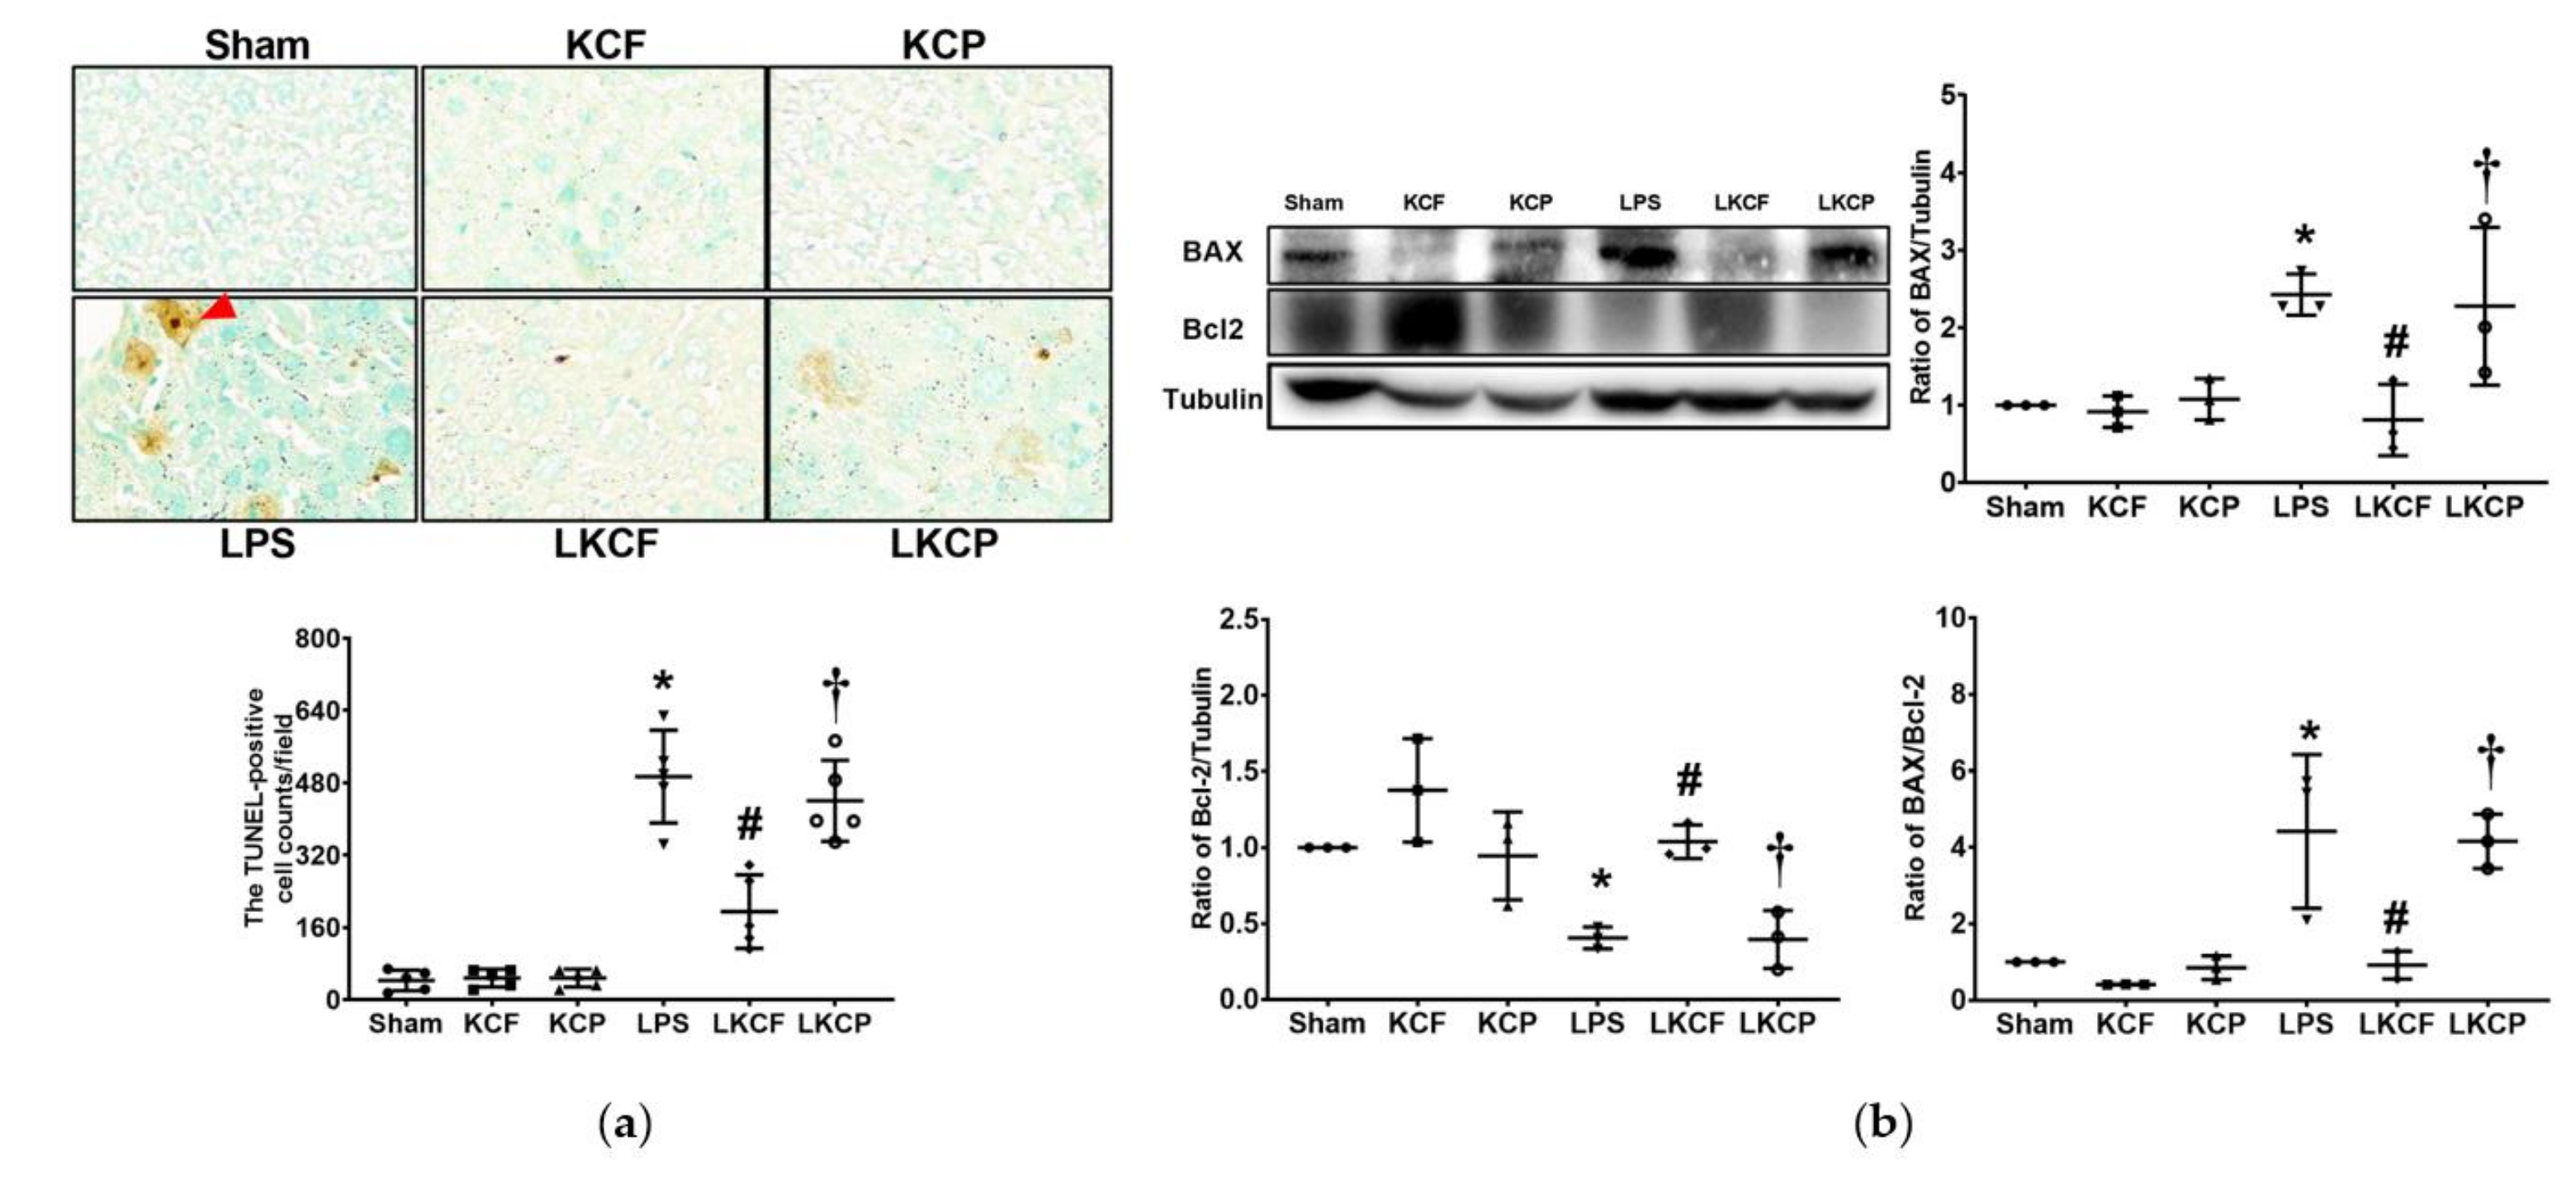
3.8. KCF18 Inhibits LPS-Induced Liver Apoptosis
4. Discussion
5. Conclusions
Author Contributions
Funding
Institutional Review Board Statement
Informed Consent Statement
Data Availability Statement
Acknowledgments
Conflicts of Interest
References
- Spooner, C.E.; Markowitz, N.P.; Saravolatz, L.D. The role of tumor necrosis factor in sepsis. Clin. Immunol. Immunopathol. 1992, 62, S11–S17. [Google Scholar] [CrossRef] [Green Version]
- Furutani, M.; Arii, S.; Monden, K.; Adachi, Y.; Funaki, N.; Higashitsuji, H.; Fujita, S.; Mise, M.; Ishiguro, S.; Kitao, T.; et al. Immunologic activation of hepatic macrophages in septic rats: A possible mechanism of sepsis-associated liver injury. J. Lab. Clin. Med. 1994, 123, 430–436. [Google Scholar]
- Deutschman, C.S.; Cereda, M.; Ochroch, E.A.; Raj, N.R. Sepsis-induced cholestasis, steatosis, hepatocellular injury, and impaired hepatocellular regeneration are enhanced in interleukin-6 −/− mice. Crit. Care Med. 2006, 34, 2613–2620. [Google Scholar] [CrossRef]
- Liu, S.F.; Malik, A.B. NF-kappa B activation as a pathological mechanism of septic shock and inflammation. Am. J. Physiol. Lung Cell Mol. Physiol. 2006, 290, L622–L645. [Google Scholar] [CrossRef]
- Paik, Y.H.; Schwabe, R.F.; Bataller, R.; Russo, M.P.; Jobin, C.; Brenner, D.A. Toll-like receptor 4 mediates inflammatory signaling by bacterial lipopolysaccharide in human hepatic stellate cells. Hepatology 2003, 37, 1043–1055. [Google Scholar] [CrossRef]
- Michie, H.R.; Manogue, K.R.; Spriggs, D.R.; Revhaug, A.; O’Dwyer, S.; Dinarello, C.A.; Cerami, A.; Wolff, S.M.; Wilmore, D.W. Detection of circulating tumor necrosis factor after endotoxin administration. N. Engl. J. Med. 1988, 318, 1481–1486. [Google Scholar] [CrossRef] [PubMed]
- Hesse, D.G.; Tracey, K.J.; Fong, Y.; Manogue, K.R.; Palladino, M.A., Jr.; Cerami, A.; Shires, G.T.; Lowry, S.F. Cytokine appearance in human endotoxemia and primate bacteremia. Surg. Gynecol. Obs. 1988, 166, 147–153. [Google Scholar]
- Balk, R.A. Pathogenesis and management of multiple organ dysfunction or failure in severe sepsis and septic shock. Crit. Care Clin. 2000, 16, 337–352. [Google Scholar] [CrossRef]
- Damas, P.; Ledoux, D.; Nys, M.; Vrindts, Y.; De Groote, D.; Franchimont, P.; Lamy, M. Cytokine serum level during severe sepsis in human IL-6 as a marker of severity. Ann. Surg. 1992, 215, 356–362. [Google Scholar] [CrossRef] [PubMed]
- Parameswaran, N.; Patial, S. Tumor necrosis factor-α signaling in macrophages. Crit. Rev. Eukaryot. Gene Express 2010, 20, 87–103. [Google Scholar] [CrossRef]
- Sheikh, M.S.; Huang, Y. Death receptor activation complexes: It takes two to activate TNF receptor 1. Cell Cycle 2003, 2, 550–552. [Google Scholar] [CrossRef] [PubMed] [Green Version]
- Challa, S.; Chan, F.K. Going up in flames: Necrotic cell injury and inflammatory diseases. Cell. Mol. Life Sci. 2010, 67, 3241–3253. [Google Scholar] [CrossRef] [PubMed] [Green Version]
- Wang, S.; El-Deiry, W.S. TRAIL and apoptosis induction by TNF-family death receptors. Oncogene 2003, 22, 8628–8633. [Google Scholar] [CrossRef] [PubMed] [Green Version]
- Joosten, L.A.; Netea, M.G.; Dinarello, C.A. Interleukin-1β in innate inflammation, autophagy and immunity. Semin. Immunol. 2013, 25, 416–424. [Google Scholar] [CrossRef]
- Eder, C. Mechanisms of interleukin-1beta release. Immunobiology 2009, 214, 543–553. [Google Scholar] [CrossRef] [PubMed]
- Kuno, K.; Matsushima, K. The IL-1 receptor signaling pathway. J. Leukoc. Biol. 1994, 56, 542–547. [Google Scholar] [CrossRef] [PubMed]
- Ran, S.; Huang, J.; Liu, B.; Gu, S.; Jiang, W.; Liang, J. Enterococcus Faecalis activates NLRP3 inflammasomes leading to increased interleukin-1 beta secretion and pyroptosis of THP-1 macrophages. Microb. Pathog. 2021, 154, 104761. [Google Scholar] [CrossRef] [PubMed]
- Unver, N.; McAllister, F. L-6 family cytokines: Key inflammatory mediators as biomarkers and potential therapeutic targets. Cytokine Growth Factor Rev. 2018, 41, 10–17. [Google Scholar] [CrossRef] [PubMed]
- Uciechowski, P.; Dempke, W.C.M. Interleukin-6: A Masterplayer in the Cytokine Network. Oncology 2020, 98, 131–137. [Google Scholar] [CrossRef]
- Zegeye, M.M.; Lindkvist, M.; Fälker, K.; Kumawat, A.K.; Paramel, G.; Grenegård, M.; Sirsjö, A.; Ljungberg, L.U. Activation of the JAK/STAT3 and PI3K/AKT pathways are crucial for IL-6 trans-signaling-mediated pro-inflammatory response in human vascular endothelial cells. Cell Commun. Signal. 2018, 1, 55. [Google Scholar] [CrossRef]
- Chang, C.Y.; Hsu, H.J.; Foo, J.; Shih, H.J.; Huang, C.J. Peptide-Based TNF-α-Binding Decoy Therapy Mitigates Lipopolysaccharide-Induced Liver Injury in Mice. Pharmaceuticals 2020, 13, 280. [Google Scholar] [CrossRef]
- Monaco, C.; Nanchahal, J.; Taylor, P.; Feldmann, M. Anti-TNF therapy: Past, present and future. Int. Immunol. 2015, 27, 55–62. [Google Scholar] [CrossRef] [PubMed]
- Weehuizen, T.A.; Lankelma, J.M.; De Jong, H.K.; De Boer, O.J.; Roelofs, J.J.; Day, N.P.; Gram, H.; De Vos, A.F.; Wiersinga, W.J. Therapeutic Administration of a Monoclonal Anti-Il-1β Antibody Protects Against Experimental Melioidosis. Shock 2016, 46, 566–574. [Google Scholar] [CrossRef] [PubMed] [Green Version]
- Riedemann, N.C.; Neff, T.A.; Guo, R.F.; Bernacki, K.D.; Laudes, I.J.; Sarma, J.V.; Lambris, J.D.; Ward, P.A. Protective effects of IL-6 blockade in sepsis are linked to reduced C5a receptor expression. J. Immunol. 2003, 170, 503–507. [Google Scholar] [CrossRef] [PubMed] [Green Version]
- Kroemer, R.T. Structure-based drug design: Docking and scoring. Curr. Protein Pept. Sci. 2007, 8, 312–328. [Google Scholar] [CrossRef] [PubMed]
- Jiang, S.J.; Tsai, P.I.; Peng, S.Y.; Chang, C.C.; Chung, Y.; Tsao, H.H.; Huang, H.T.; Chen, S.Y.; Hsu, H.J. A potential peptide derived from cytokine receptors can bind proinflammatory cytokines as a therapeutic strategy for anti-inflammation. Sci. Rep. 2019, 9, 2317. [Google Scholar] [CrossRef] [Green Version]
- Zhu, Y.; Yang, S.; Wang, J.; Mao, Y.; Xu, Y.; An, J.; Huang, Z. LC-MS/MS assay for the determination of a novel D-peptide antagonist of CXCR4 in rat plasma and its application to a preclinical pharmacokinetic study. J. Pharm. Biomed. Anal. 2018, 161, 159–167. [Google Scholar] [CrossRef]
- Bagchi, S.; Fredriksson, R.; Wallén-Mackenzie, Å. In Situ Proximity Ligation Assay (PLA). Methods Mol. Biol. 2015, 1318, 149–159. [Google Scholar] [CrossRef]
- Hamesch, K.; Borkham-Kamphorst, E.; Strnad, P.; Weiskirchen, R. Lipopolysaccharide-induced inflammatory liver injury in mice. Lab. Anim. 2015, 49, 37–46. [Google Scholar] [CrossRef]
- Wimmer, M.; Wilmering, B.; Sasse, D. The relation of rat liver wet weight to dry weight. Histochemistry 1985, 83, 571–572. [Google Scholar] [CrossRef]
- Wick, M.J.; Harral, J.W.; Loomis, Z.L.; Dempsey, E.C. An Optimized Evans Blue Protocol to Assess Vascular Leak in the Mouse. J. Vis. Exp. 2018, 139, 57037. [Google Scholar] [CrossRef] [PubMed]
- Suzuki, S.; Nakamura, S.; Koizumi, T.; Sakaguchi, S.; Baba, S.; Muro, H.; Fujise, Y. The beneficial effect of a prostaglandin I2 analog on ischemic rat liver. Transplantation 1991, 52, 979–983. [Google Scholar] [CrossRef]
- Endig, J.; Unrau, L.; Sprezyna, P.; Rading, S.; Karsak, M.; Goltz, D.; Heukamp, L.C.; Tiegs, G.; Diehl, L. Acute Liver Injury after CCl4 Administration is Independent of Smad7 Expression in Myeloid Cells. Int. J. Mol. Sci. 2019, 20, 5528. [Google Scholar] [CrossRef] [Green Version]
- Beljaars, L.; Schippers, M.; Reker-Smit, C.; Martinez, F.O.; Helming, L.; Poelstra, K.; Melgert, B.N. Hepatic Localization of Macrophage Phenotypes during Fibrogenesis and Resolution of Fibrosis in Mice and Humans. Front. Immunol. 2014, 5, 430. [Google Scholar] [CrossRef] [PubMed] [Green Version]
- Wang, H.; Sun, L.; Su, L.; Rizo, J.; Liu, L.; Wang, L.F.; Wang, F.S.; Wang, X. Mixed lineage kinase domain-like protein MLKL causes necrotic membrane disruption upon phosphorylation by RIP3. Mol. Cell 2014, 54, 133–146. [Google Scholar] [CrossRef] [Green Version]
- Shojaie, L.; Iorga, A.; Dara, L. Cell Death in Liver Diseases: A Review. Int. J. Mol. Sci. 2020, 21, 9682. [Google Scholar] [CrossRef]
- Singer, G.; Stokes, K.Y.; Neil Granger, D. Reactive oxygen and nitrogen species in sepsis-induced hepatic microvascular dysfunction. Inflamm. Res. 2013, 62, 155–164. [Google Scholar] [CrossRef] [PubMed] [Green Version]
- Thiemermann, C. Nitric oxide and septic shock. Gen. Pharm. 1997, 29, 159–166. [Google Scholar] [CrossRef]
- Tomita, M.; Tsumoto, K. Hybridoma technologies for antibody production. Immunotherapy 2011, 3, 371–380. [Google Scholar] [CrossRef]
- Bazan, J.; Całkosiński, I.; Gamian, A. Phage display—A powerful technique for immunotherapy: 1. Introduction and potential of therapeutic applications. Hum. Vaccin Immunother. 2012, 8, 1817–1828. [Google Scholar] [CrossRef] [Green Version]
- Saeed, A.F.; Wang, R.; Ling, S.; Wang, S. Antibody Engineering for Pursuing a Healthier Future. Front. Microbiol. 2017, 8, 495. [Google Scholar] [CrossRef] [Green Version]
- Saladin, P.M.; Zhang, B.D.; Reichert, J.M. Current trends in the clinical development of peptide therapeutics. Idrugs 2009, 12, 779–784. [Google Scholar] [PubMed]
- Chousterman, B.G.; Swirski, F.K.; Weber, G.F. Cytokine storm and sepsis disease pathogenesis. Semin. Immunopathol. 2017, 39, 517–528. [Google Scholar] [CrossRef]
- Hu, B.; Huang, S.; Yin, L. The cytokine storm and COVID-19. J. Med. Virol. 2021, 93, 250–256. [Google Scholar] [CrossRef]
- REMAP-CAP Investigators. Interleukin-6 Receptor Antagonists in Critically Ill Patients with Covid-19. N. Engl. J. Med. 2021, 384, 1491–1502. [Google Scholar] [CrossRef] [PubMed]
- Castelnovo, L.; Tamburello, A.; Lurati, A.; Zaccara, E.; Marrazza, M.G.; Olivetti, M.; Mumoli, N.; Mastroiacovo, D.; Colombo, D.; Ricchiuti, E.; et al. Anti-IL6 treatment of serious COVID-19 disease: A monocentric retrospective experience. Medicine 2021, 100, e23582. [Google Scholar] [CrossRef]
- Goodwin, D.; Simerska, P.; Toth, I. Peptides as therapeutics with enhanced bioactivity. Curr. Med. Chem. 2012, 19, 4451–4461. [Google Scholar] [CrossRef] [PubMed]
- Seymour, C.R.; Rosengart, M.R. Septic Shock. JAMA 2015, 314, 708–717. [Google Scholar] [CrossRef] [PubMed] [Green Version]
- Osuchowski, M.F.; Ayala, A.; Bahrami, S.; Bauer, M.; Boros, M.; Cavaillon, J.M.; Chaudry, I.H.; Coopersmith, C.M.; Deutschman, C.S.; Drechsler, S.; et al. Minimum Quality Threshold in Pre-Clinical Sepsis Studies (MQTiPSS): An International Expert Consensus Initiative for Improvement of Animal Modeling in Sepsis. Shock 2018, 50, 377–380. [Google Scholar] [CrossRef] [Green Version]
- Lewis, A.J.; Seymour, C.W.; Rosengart, M.R. Current Murine Models of Sepsis. Surg. Infect. 2016, 17, 385–393. [Google Scholar] [CrossRef] [Green Version]


Publisher’s Note: MDPI stays neutral with regard to jurisdictional claims in published maps and institutional affiliations. |
© 2021 by the authors. Licensee MDPI, Basel, Switzerland. This article is an open access article distributed under the terms and conditions of the Creative Commons Attribution (CC BY) license (https://creativecommons.org/licenses/by/4.0/).
Share and Cite
Shih, H.-J.; Chang, C.-Y.; Chiang, M.; Le, V.L.; Hsu, H.-J.; Huang, C.-J. Simultaneous Inhibition of Three Major Cytokines and Its Therapeutic Effects: A Peptide-Based Novel Therapy against Endotoxemia in Mice. J. Pers. Med. 2021, 11, 436. https://0-doi-org.brum.beds.ac.uk/10.3390/jpm11050436
Shih H-J, Chang C-Y, Chiang M, Le VL, Hsu H-J, Huang C-J. Simultaneous Inhibition of Three Major Cytokines and Its Therapeutic Effects: A Peptide-Based Novel Therapy against Endotoxemia in Mice. Journal of Personalized Medicine. 2021; 11(5):436. https://0-doi-org.brum.beds.ac.uk/10.3390/jpm11050436
Chicago/Turabian StyleShih, Hung-Jen, Chao-Yuan Chang, Milton Chiang, Van Long Le, Hao-Jen Hsu, and Chun-Jen Huang. 2021. "Simultaneous Inhibition of Three Major Cytokines and Its Therapeutic Effects: A Peptide-Based Novel Therapy against Endotoxemia in Mice" Journal of Personalized Medicine 11, no. 5: 436. https://0-doi-org.brum.beds.ac.uk/10.3390/jpm11050436