
Individualized Prognostic Prediction of the Long-Term Functional Trajectory in Pediatric Acquired Brain Injury

 , ,
, ,
Abstract
: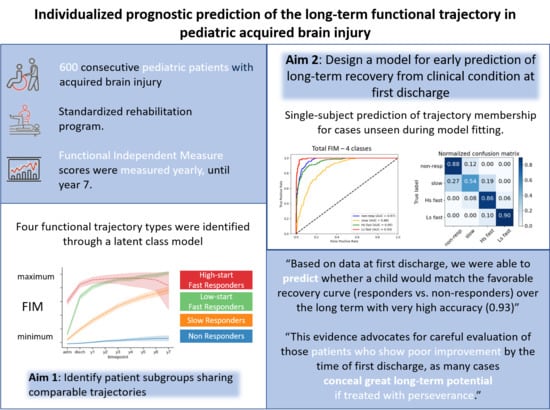
1. Introduction
2. Materials and Methods
2.1. Participants, Inclusion Criteria, Measures at Admission, Discharge and Outcome
2.2. Functional Independence Measure (FIM) and Functional Independence Measure for Children (WeeFIM)
2.3. Statistical Analysis
2.3.1. Clustering
2.3.2. Prediction
3. Results
3.1. Sample Description
3.2. Trajectory Descriptors and Bias over Time
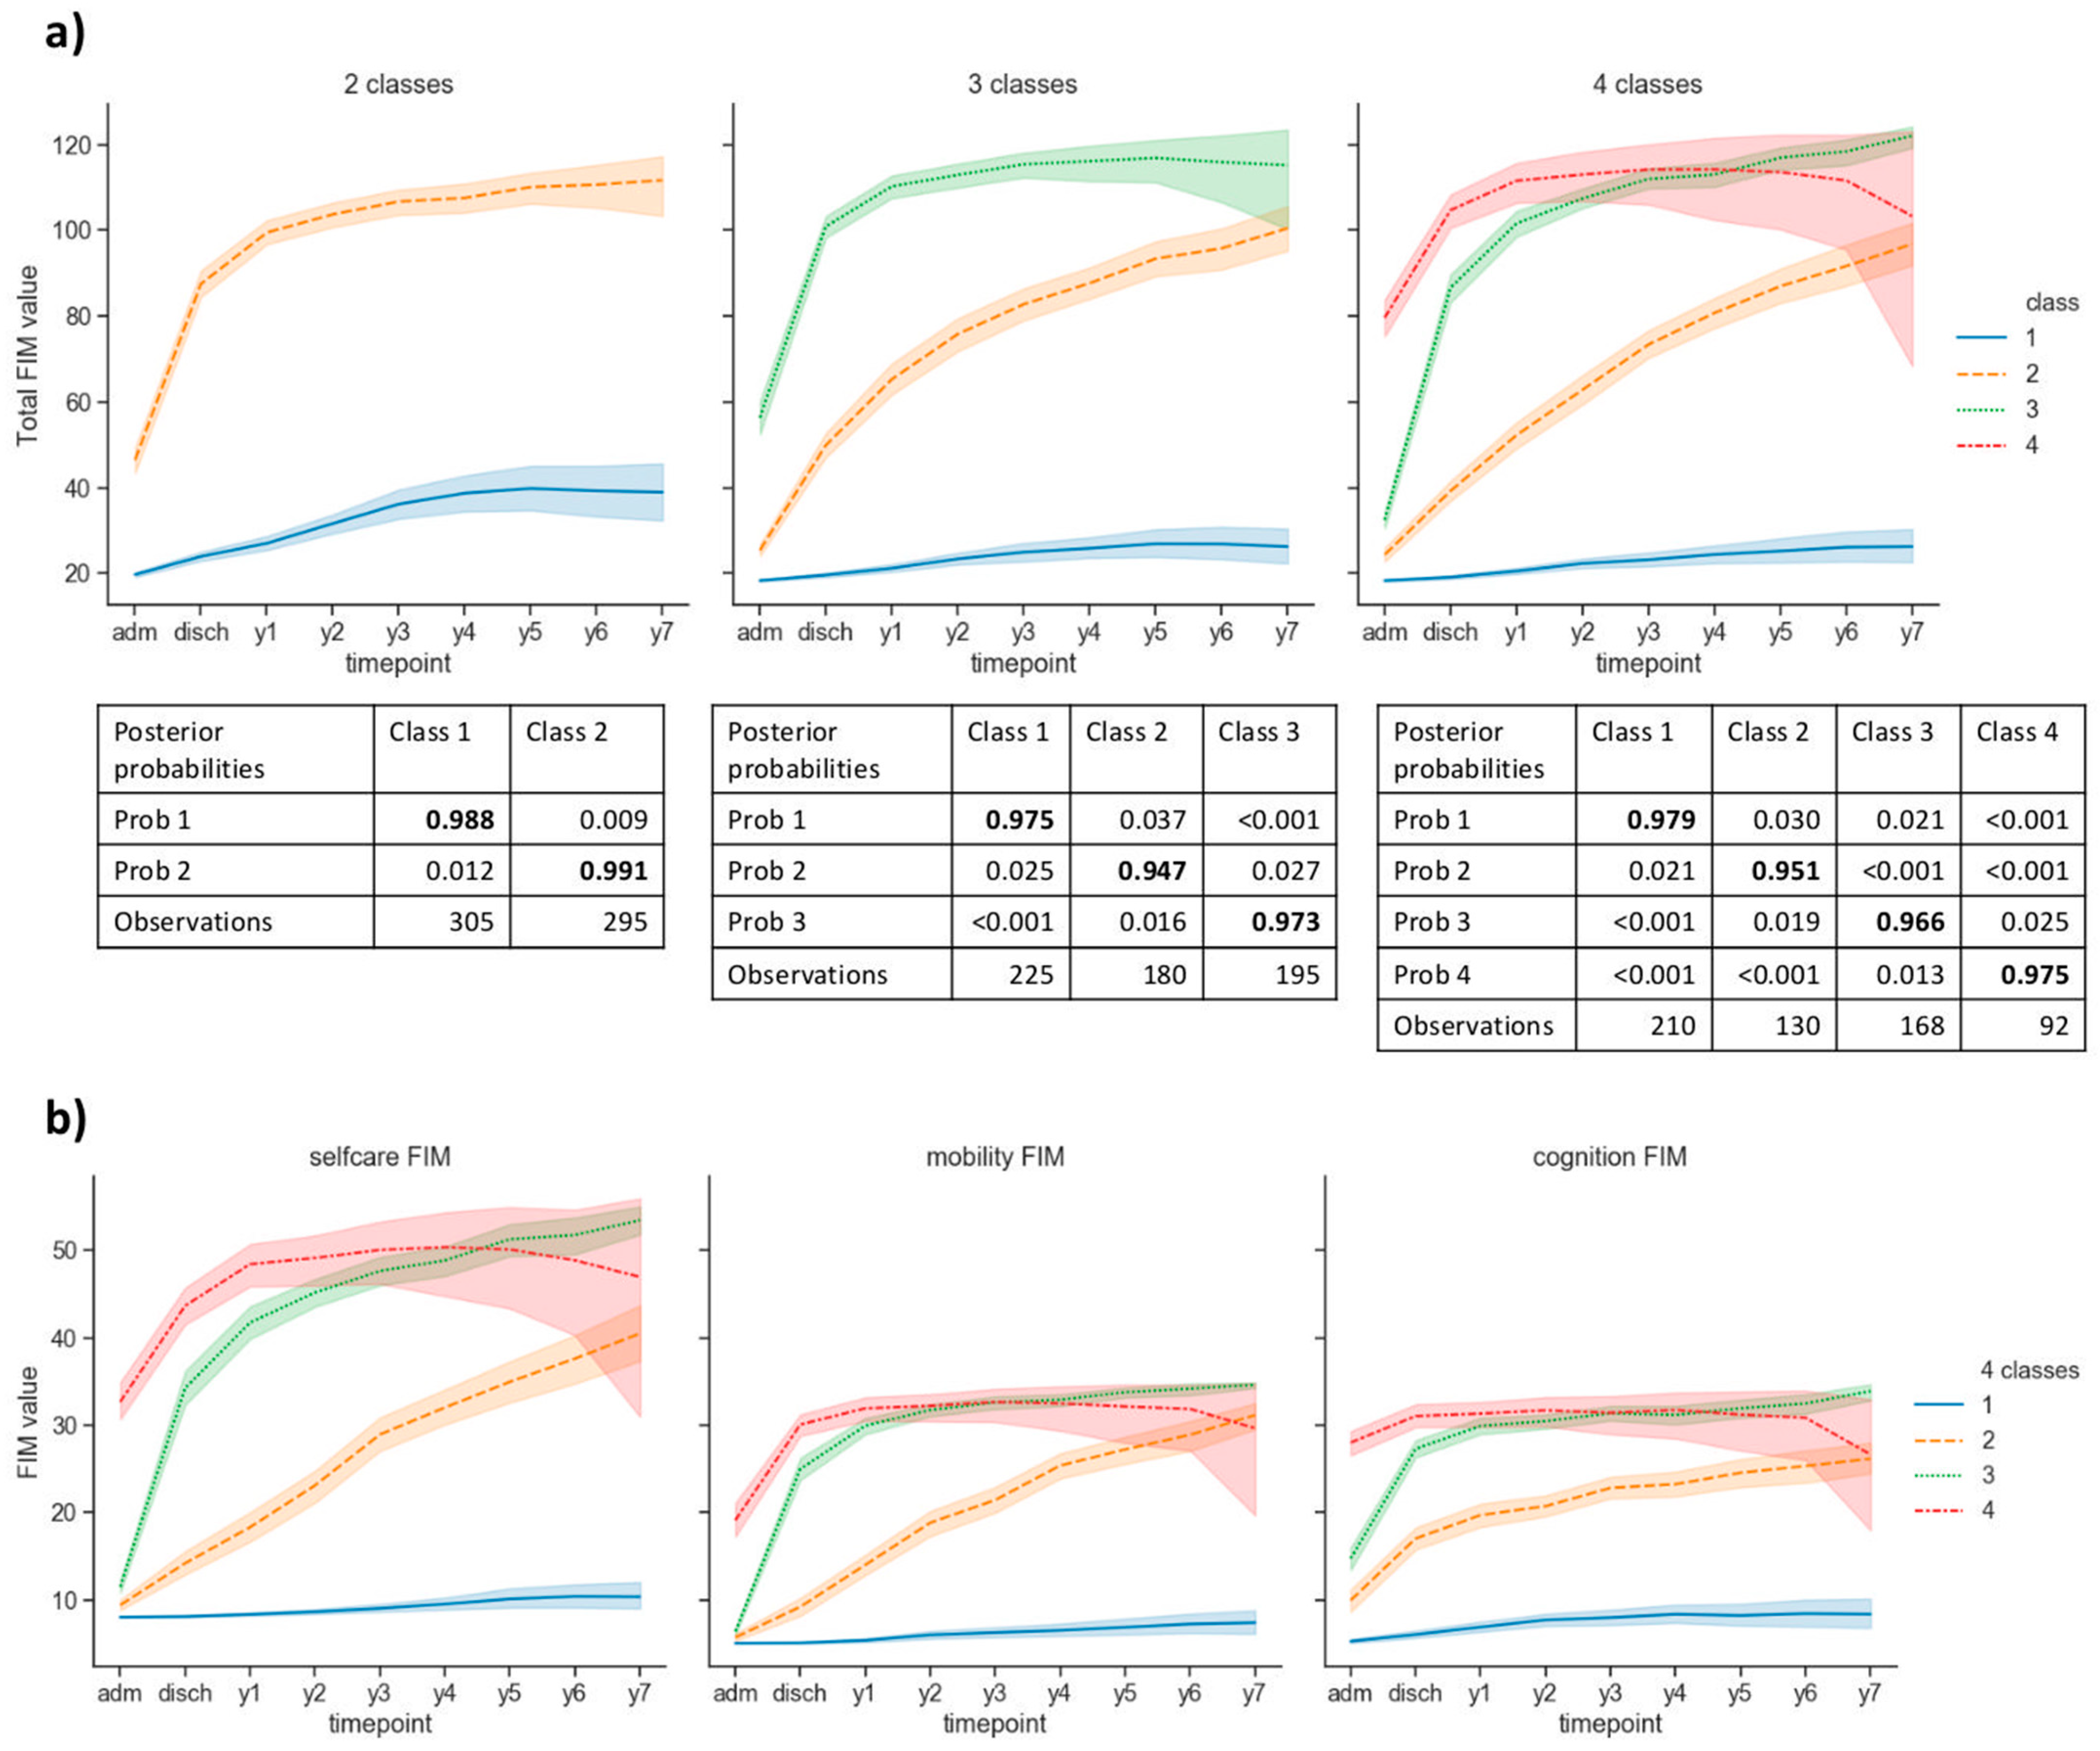
3.3. Clustering
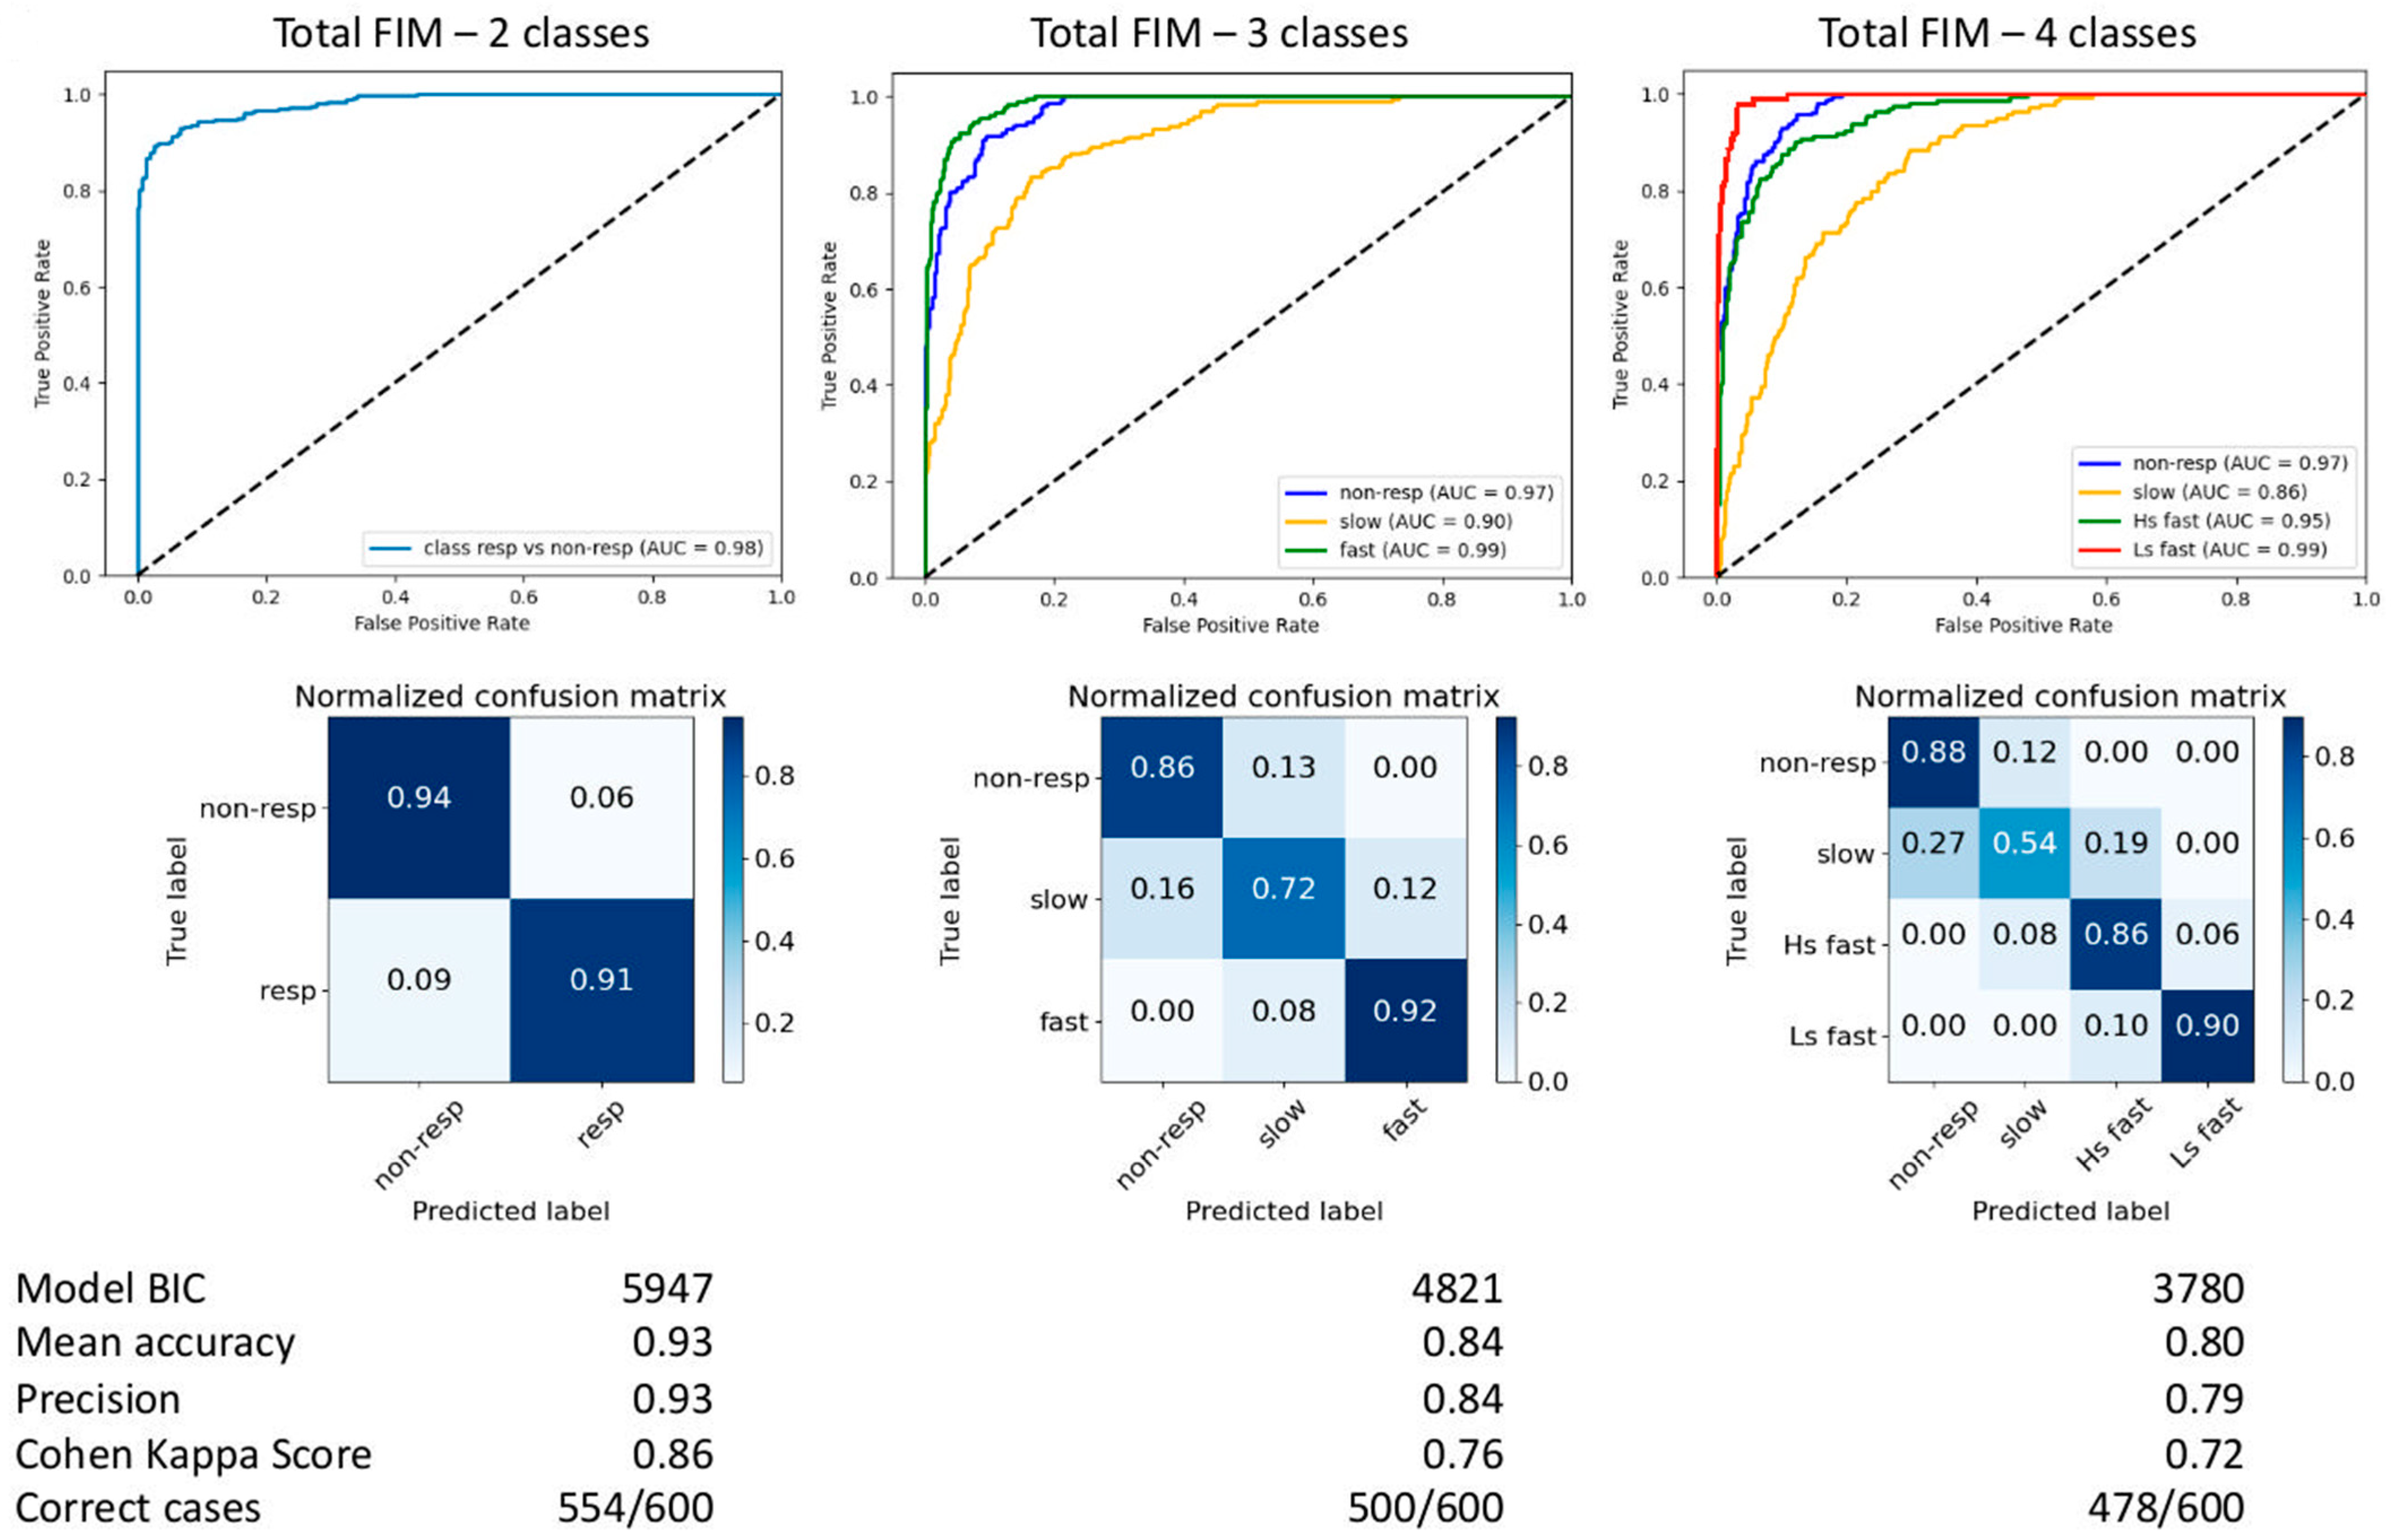
3.4. Single-Subject Prediction at First Discharge
4. Discussion
Study Limitations
5. Conclusions
Supplementary Materials
Author Contributions
Funding
Institutional Review Board Statement
Informed Consent Statement
Data Availability Statement
Conflicts of Interest
References
- Corrigan, J.D.; Hammond, F.M. Traumatic Brain Injury as a Chronic Health Condition. Arch. Phys. Med. Rehabil. 2013, 94, 1199–1201. [Google Scholar] [CrossRef]
- Hammond, F.M.; Giacino, J.T.; Nakase Richardson, R.; Sherer, M.; Zafonte, R.D.; Whyte, J.; Arciniegas, D.B.; Tang, X. Disorders of Consciousness Due to Traumatic Brain Injury: Functional Status Ten Years Post-Injury. J. Neurotrauma 2019, 36, 1136–1146. [Google Scholar] [CrossRef]
- Fragala, M.A.; Haley, S.M.; Dumas, H.M.; Rabin, J.P. Classifying Mobility Recovery in Children and Youth with Brain Injury during Hospital-Based Rehabilitation. Brain Inj. 2002. [Google Scholar] [CrossRef] [PubMed]
- Villa, F.; Colombo, K.; Pastore, V.; Locatelli, F.; Molteni, E.; Galbiati, S.; Galbiati, S.; Strazzer, S. LOCFAS-Assessed Evolution of Cognitive and Behavioral Functioning in a Sample of Pediatric Patients with Severe Acquired Brain Injury in the Postacute Phase. J. Child Neurol. 2015, 9, 1125–1134. [Google Scholar] [CrossRef]
- Granger, C.V.; Hamilton, B.B.; Keith, R.A.; Zielezny, M.; Sherwin, F.S. Advances in Functional Assessment for Medical Rehabilitation. Top. Geriatr. Rehabil. 1985. [Google Scholar] [CrossRef]
- Ardolino, A.; Sleat, G.; Willett, K. Outcome Measurements in Major Trauma—Results of a Consensus Meeting. Injury 2012, 43. [Google Scholar] [CrossRef] [PubMed]
- Zonfrillo, M.R.; Durbin, D.R.; Winston, F.K.; Zhang, X.; Stineman, M.G. Residual Cognitive Disability after Completion of Inpatient Rehabilitation among Injured Children. J. Pediatrics 2014, 164. [Google Scholar] [CrossRef] [PubMed] [Green Version]
- Williams, K.S.; Young, D.K.; Burke, G.A.A.; Fountain, D.M. Comparing the WeeFIM and PEDI in Neurorehabilitation for Children with Acquired Brain Injury: A Systematic Review. Dev. Neurorehabilit. 2017, 20. [Google Scholar] [CrossRef] [PubMed]
- Marino, C.; Botticello, A.; Coyne, J.H.; Dribbon, M.; Deluca, J. The Effect of Admission Functional Independence on Early Recovery in Pediatric Traumatic and Nontraumatic Brain Injury. J. Head Trauma Rehabil. 2018, 33. [Google Scholar] [CrossRef]
- Suskauer, S.J.; Slomine, B.S.; Inscore, A.B.; Lewelt, A.J.; Kirk, J.W.; Salorio, C.F. Injury Severity Variables as Predictors of WeeFIM Scores in Pediatric TBI: Time to Follow Commands Is Best. J. Pediatric Rehabil. Med. 2009, 2, 297–307. [Google Scholar] [CrossRef]
- Shaklai, S.; Peretz, R.; Spasser, R.; Simantov, M.; Groswasser, Z. Long-Term Functional Outcome after Moderate-to-Severe Paediatric Traumatic Brain Injury. Brain Inj. 2014, 28, 915–921. [Google Scholar] [CrossRef] [PubMed]
- Maddux, A.B.; Cox-Martin, M.; Dichiaro, M.; Bennett, T.D. The Association between the Functional Status Scale and the Pediatric Functional Independence Measure in Children Who Survive Traumatic Brain Injury. Pediatric Crit. Care Med. 2018, 19. [Google Scholar] [CrossRef] [PubMed]
- Ressel, V.; O’Gorman Tuura, R.; Scheer, I.; van Hedel, H.J.A. Diffusion Tensor Imaging Predicts Motor Outcome in Children with Acquired Brain Injury. Brain Imaging Behav. 2017, 11. [Google Scholar] [CrossRef] [PubMed]
- Ressel, V.; van Hedel, H.J.A.; Scheer, I.; O’Gorman Tuura, R. Comparison of DTI Analysis Methods for Clinical Research: Influence of Pre-Processing and Tract Selection Methods. Eur. Radiol. Exp. 2018, 2. [Google Scholar] [CrossRef]
- Molteni, E.; Pagani, E.; Strazzer, S.; Arrigoni, F.; Beretta, E.; Boffa, G.; Galbiati, S.; Filippi, M.; Rocca, M.A. Fronto-Temporal Vulnerability to Disconnection in Paediatric Moderate and Severe Traumatic Brain Injury. Eur. J. Neurol. 2019. [Google Scholar] [CrossRef]
- Lu, J.; Roe, C.; Sigurdardottir, S.; Andelic, N.; Forslund, M. Trajectory of Functional Independent Measurements during First Five Years after Moderate and Severe Traumatic Brain Injury. J. Neurotrauma 2018. [Google Scholar] [CrossRef]
- Recla, M.; Bardoni, A.; Pastore, V.; Dominici, C.; Locatelli, F.; Galbiati, S.; Strazzer, S. Cognitive Functioning after TBI Occured in School-Aged Children. Brain Inj. 2012. [Google Scholar] [CrossRef]
- Shaklai, S.; Peretz Fish, R.; Simantov, M.; Groswasser, Z. Prognostic Factors in Childhood-Acquired Brain Injury. Brain Inj. 2018, 32, 533–539. [Google Scholar] [CrossRef]
- Forsyth, R.J.; Salorio, C.F.; Christensen, J.R. Modelling Early Recovery Patterns after Paediatric Traumatic Brain Injury. Arch. Dis. Child. 2010, 95, 266–270. [Google Scholar] [CrossRef]
- Heindl, U.T.; Laub, M.C. Outcome of Persistent Vegetative State Following Hypoxic or Traumatic Brain Injury in Children and Adolescents. Neuropediatrics 1996. [Google Scholar] [CrossRef] [PubMed]
- Eilander, H.J.; Timmerman, R.B.W.; Scheirs, J.G.M.; van Heugten, C.M.; de Kort, P.L.M.; Prevo, A.J.H. Children and Young Adults in a Prolonged Unconscious State after Severe Brain Injury: Long-Term Functional Outcome as Measured by the DRS and the GOSE after Early Intensive Neurorehabilitation. Brain Inj. 2007. [Google Scholar] [CrossRef] [PubMed]
- Kelly, G.; Mobbs, S.; Pritkin, J.N.; Mayston, M.; Mather, M.; Rosenbaum, P.; Henderson, R.; Forsyth, R. Gross Motor Function Measure-66 Trajectories in Children Recovering after Severe Acquired Brain Injury. Dev. Med. Child Neurol. 2015. [Google Scholar] [CrossRef] [PubMed]
- Physicians, R.C. The Vegetative State: Guidance on Diagnosis and Management. Report of a Working Party. R. Coll. Physicians 2003. [Google Scholar] [CrossRef]
- Giacino, J.T.; Ashwal, S.; Childs, N.; Cranford, R.; Jennett, B.; Katz, D.I.; Kelly, J.P.; Rosenberg, J.H.; Whyte, J.; Zafonte, R.D.; et al. The Minimally Conscious State: Definition and Diagnostic Criteria. Neurology 2002. [Google Scholar] [CrossRef]
- Teasdale, G.; Jennett, B. Assessment of Coma and Impared Conciousness. Lancet 1974, 304, 81–84. [Google Scholar] [CrossRef]
- Jennett, B.; Bond, M. Assessment of Outcome after Severe Brain Damage. Lancet 1975, 1, 480–484. [Google Scholar] [CrossRef]
- Hall, K.; Cope, D.; Rappaport, M. Glasgow Outcome Scale and Disability Rating Scale: Comparative Usefulness in Following Recovery in Traumatic Head Injury. Arch. Phys. Med. Rehabil. 1985, 66, 35–37. [Google Scholar]
- Beretta, E.; Molteni, E.; Galbiati, S.; Stefanoni, G.; Strazzer, S. Five-Year Motor Functional Outcome in Children with Acquired Brain Injury. Yet to the End of the Story? Dev. Neurorehabilit. 2018. [Google Scholar] [CrossRef]
- Uniform Data System for Medical Rehabilitation. The WeeFIM II Clinical Guide, v.6.0; Uniform Data System for Medical Rehabilitation: Buffalo, NY, USA, 2006. [Google Scholar]
- Msall, M.E.; DiGaudio, K.; Duffy, L.C.; LaForest, S.; Braun, S.; Granger, C.V. WeeFIM. Normative Sample of an Instrument for Tracking Functional Independence in Children. Clin. Pediatrics 1994, 33, 431–438. [Google Scholar] [CrossRef]
- Ottenbacher, K.J.; Msall, M.E.; Lyon, N.R.; Duffy, L.C.; Granger, C.V.; Braun, S. Interrater Agreement and Stability of the Functional Independence Measure for Children (WeeFIM): Use in Children with Developmental Disabilities. Arch. Phys. Med. Rehabil. 1997, 78, 1309–1315. [Google Scholar] [CrossRef]
- Ziviani, J.; Ottenbacher, K.J.; Shephard, K.; Foreman, S.; Astbury, W.; Ireland, P. Concurrent Validity of the Functional Independence Measure for Children (WeeFIM) and the Pediatric Evaluation of Disabilities Inventory in Children with Developmental Disabilities and Acquired Brain Injuries. Phys. Occup. Ther. Pediatrics 2001, 21, 91–101. [Google Scholar] [CrossRef]
- Rice, S.A.; Blackman, J.A.; Braun, S.; Linn, R.T.; Granger, C.V.; Wagner, D.P. Rehabilitation of Children with Traumatic Brain Injury: Descriptive Analysis of a Nationwide Sample Using the WeeFIM. Arch. Phys. Med. Rehabil. 2005, 86, 834–836. [Google Scholar] [CrossRef]
- Austin, C.; Slomine, B.; de Matt, E.; Salorio, C.; Suskauer, S. Time to Follow Commands Remains the Most Useful Injury Severity Variable for Predicting WeeFIM® Scores 1 Year after Paediatric TBI. Brain Inj. 2013, 27, 1056–1062. [Google Scholar] [CrossRef] [PubMed] [Green Version]
- Hammond, F.M.; Corrigan, J.D.; Ketchum, J.M.; Malec, J.F.; Dams-O’Connor, K.; Hart, T.; Novack, T.A.; Bogner, J.; Dahdah, M.N.; Whiteneck, G.G. Prevalence of Medical and Psychiatric Comorbidities Following Traumatic Brain Injury. J. Head Trauma Rehabil. 2019. [Google Scholar] [CrossRef]
- Giacino, J.T.; Kezmarsky, M.A.; DeLuca, J.; Cicerone, K.D. Monitoring Rate of Recovery to Predict Outcome in Minimally Responsive Patients. Arch. Phys. Med. Rehabil. 1991. [Google Scholar] [CrossRef]
- Whyte, J.; Katz, D.; Long, D.; DiPasquale, M.C.; Polansky, M.; Kalmar, K.; Giacino, J.; Childs, N.; Mercer, W.; Novak, P.; et al. Predictors of Outcome in Prolonged Posttraumatic Disorders of Consciousness and Assessment of Medication Effects: A Multicenter Study. Arch. Phys. Med. Rehabil. 2005. [Google Scholar] [CrossRef] [PubMed]
- Molteni, E.; Colombo, K.; Pastore, V.; Galbiati, S.; Recla, M.; Locatelli, F.; Galbiati, S.; Fedeli, C.; Strazzer, S. Joint Neuropsychological Assessment through Coma/Near Coma and Level of Cognitive Functioning Assessment Scales Reduces Negative Findings in Pediatric Disorders of Consciousness. Brain Sci. 2020, 10, 162. [Google Scholar] [CrossRef] [PubMed] [Green Version]
- Corrigan, J.D.; Cuthbert, J.P.; Harrison-Felix, C.; Whiteneck, G.G.; Bell, J.M.; Miller, A.C.; Coronado, V.G.; Pretz, C.R. US Population Estimates of Health and Social Outcomes 5 Years after Rehabilitation for Traumatic Brain Injury. J. Head Trauma Rehabil. 2014. [Google Scholar] [CrossRef] [PubMed] [Green Version]
- Williamson, M.L.C.; Elliott, T.R.; Bogner, J.; Dreer, L.E.; Arango-Lasprilla, J.C.; Kolakowsky-Hayner, S.A.; Pretz, C.R.; Lequerica, A.; Perrin, P.B. Trajectories of Life Satisfaction over the First 10 Years after Traumatic Brain Injury: Race, Gender, and Functional Ability. J. Head Trauma Rehabil. 2016. [Google Scholar] [CrossRef] [Green Version]
- Erler, K.S.; Whiteneck, G.G.; Juengst, S.B.; Locascio, J.J.; Bogner, J.A.; Kaminski, J.; Giacino, J.T. Predicting the Trajectory of Participation after Traumatic Brain Injury: A Longitudinal Analysis. J. Head Trauma Rehabil. 2018. [Google Scholar] [CrossRef]
- Pastore, V.; Galbiati, S.; Villa, F.; Colombo, K.; Recla, M.; Adduci, A.; Avantaggiato, P.; Bardoni, A.; Strazzer, S. Psychological and Adjustment Problems Due to Acquired Brain Lesions in Pediatric Patients: A Comparison of Vascular, Infectious, and Other Origins. J. Child Neurol. 2014, 29. [Google Scholar] [CrossRef] [PubMed]
- Keenan, H.T.; Clark, A.E.; Holubkov, R.; Cox, C.S.; Patel, R.P.; Moore, K.R.; Ewing-Cobbs, L. Latent Class Analysis to Classify Injury Severity in Pediatric Traumatic Brain Injury. J. Neurotrauma 2020, 37. [Google Scholar] [CrossRef] [PubMed]


| Total Sample N = 600 | Traumatic N = 276 | Non-Traumatic N = 324 | |
|---|---|---|---|
| Age at event (months) | Mean (SD) | Mean (SD) | Mean (SD) |
| 89.5 (62.1) | 106.6 (63.0) | 74.9 (57.4) | |
| Median [IQR] | Median [IQR] | Median [IQR] | |
| Days of coma * | 20 [7; 80] | 20 [10; 67.5] | 15 [7.5; 90] |
| Time from event to admission (months) | 43 [27; 69] | 39.5 [26; 61] | 45 [28; 73] |
| N (%) | N (%) | N (%) | |
| Patients in unresponsive wakefulness syndrome for at least one year | 81 (13.5) | 27 (9.8) | 54 (16.7) |
| Median (Mode) | Median (Mode) | Median (Mode) | |
| GCS score at event | 6 (3) | 5 (3) | 6 (3) |
| GOS score at admission | 3 (3) | 3 (3) | 3 (3) |
| DRS at admission | 20 (24) | 19 (22) | 20 (24) |
| GOS score at discharge | 3 (3) | 4 (3) | 3 (3) |
| DRS at discharge | 8 (5) | 7 (5) | 11 (5) |
| N (%) | N (%) | N (%) | |
| Male | 367 (61.2) | 187 (67.8) | 180 (55.6) |
| Female | 233 (38.8) | 89 (32.2) | 144 (44.4) |
| N (%) | N (%) | N (%) | |
| Cranial fracture at event | 120 (20.0) | 120 (43.5) | 0 (0.0) |
| DC/N in acute | 288 (48.0) | 153 (55.4) | 135 (41.7) |
| Epilepsy during in-stay | 163 (27.2) | 55 (19.9) | 108 (33.3) |
| Motor impairment ad admission: | N (%) | N (%) | N (%) |
| Quadriparesis | 322 (53.7) | 139 (50.4) | 183 (56.5) |
| Right hemiparesis | 85 (14.2) | 36 (13.0) | 49 (15.1) |
| Left hemiparesis | 78 (13.0) | 40 (14.5) | 38 (11.7) |
| Paraparesis | 7 (1.2) | 3 (1.1) | 4 (1.2) |
| Ataxia | 40 (6.7) | 18 (6.5) | 22 (6.8) |
| Minimal dysfunction $ | 40 (6.7) | 23 (8.3) | 17 (5.2) |
| None | 28 (4.7) | 17 (6.2) | 11 (3.4) |
| Admission | Discharge | Year 1 | Year 2 | Year 3 | Year 4 | Year 5 | Year 6 | Year 7 | |
|---|---|---|---|---|---|---|---|---|---|
| FIM domains | Median [IQR] | Median [IQR] | Median [IQR] | Median [IQR] | Median [IQR] | Median [IQR] | Median [IQR] | Median [IQR] | Median [IQR] |
| Total | 18 [18; 38] | 38 [18; 85] | 48 [19; 100] | 60 [21; 105] | 67 [20; 104] | 69 [20; 105] | 79 [19; 112] | 69 [18; 106] | 51 [18; 105] |
| Selfcare | 8 [8; 12] | 11 [8; 33] | 16 [8; 42] | 23 [8; 42] | 25 [8; 43] | 27 [8; 45] | 30 [8; 48] | 25 [8; 45] | 18 [8; 45] |
| Mobility | 5 [5; 6] | 8 [5; 27] | 14 [5; 31] | 19 [5; 32] | 20 [5; 32] | 24 [5; 32] | 26 [5; 33] | 22 [5; 33] | 17 [5; 34] |
| Cognition | 5 [5; 17] | 15 [5; 27] | 17 [6; 29] | 18 [7; 30] | 20 [7; 30] | 20 [7; 30] | 22 [6; 30] | 19 [5; 30] | 16 [5; 28] |
| N (%) | N (%) | N (%) | N (%) | N (%) | N (%) | N (%) | N (%) | N (%) | |
| Missing data points | 0 (0) | 0 (0) | 92 (15) | 183 (31) | 278 (46) | 350 (58) | 407 (68) | 462 (77) | 497 (83) |
| Deaths * | - | - | 4 (1) | 7 (1) | 10 (2) | 14 (2) | 14 (2) | 23 (4) | 23 (4) |
| Recovery | - | - | 31 (5) | 62 (10) | 81 (14) | 92 (15) | 100 (17) | 107 (18) | 110 (18) |
| Opt out | - | - | 49 (8) | 89 (15) | 120 (20) | 144 (24) | 152 (25) | 158 (26) | 159 (27) |
| Censored | - | - | 8 (1) | 25 (4) | 67 (11) | 100 (17) | 141 (24) | 174 (29) | 205 (34) |
Publisher’s Note: MDPI stays neutral with regard to jurisdictional claims in published maps and institutional affiliations. |
© 2021 by the authors. Licensee MDPI, Basel, Switzerland. This article is an open access article distributed under the terms and conditions of the Creative Commons Attribution (CC BY) license (https://creativecommons.org/licenses/by/4.0/).
Share and Cite
Molteni, E.; Ranzini, M.B.M.; Beretta, E.; Modat, M.; Strazzer, S. Individualized Prognostic Prediction of the Long-Term Functional Trajectory in Pediatric Acquired Brain Injury. J. Pers. Med. 2021, 11, 675. https://0-doi-org.brum.beds.ac.uk/10.3390/jpm11070675
Molteni E, Ranzini MBM, Beretta E, Modat M, Strazzer S. Individualized Prognostic Prediction of the Long-Term Functional Trajectory in Pediatric Acquired Brain Injury. Journal of Personalized Medicine. 2021; 11(7):675. https://0-doi-org.brum.beds.ac.uk/10.3390/jpm11070675
Chicago/Turabian StyleMolteni, Erika, Marta Bianca Maria Ranzini, Elena Beretta, Marc Modat, and Sandra Strazzer. 2021. "Individualized Prognostic Prediction of the Long-Term Functional Trajectory in Pediatric Acquired Brain Injury" Journal of Personalized Medicine 11, no. 7: 675. https://0-doi-org.brum.beds.ac.uk/10.3390/jpm11070675