
Diabetic and Hypertensive Retinopathy Screening in Fundus Images Using Artificially Intelligent Shallow Architectures


Abstract
:1. Introduction
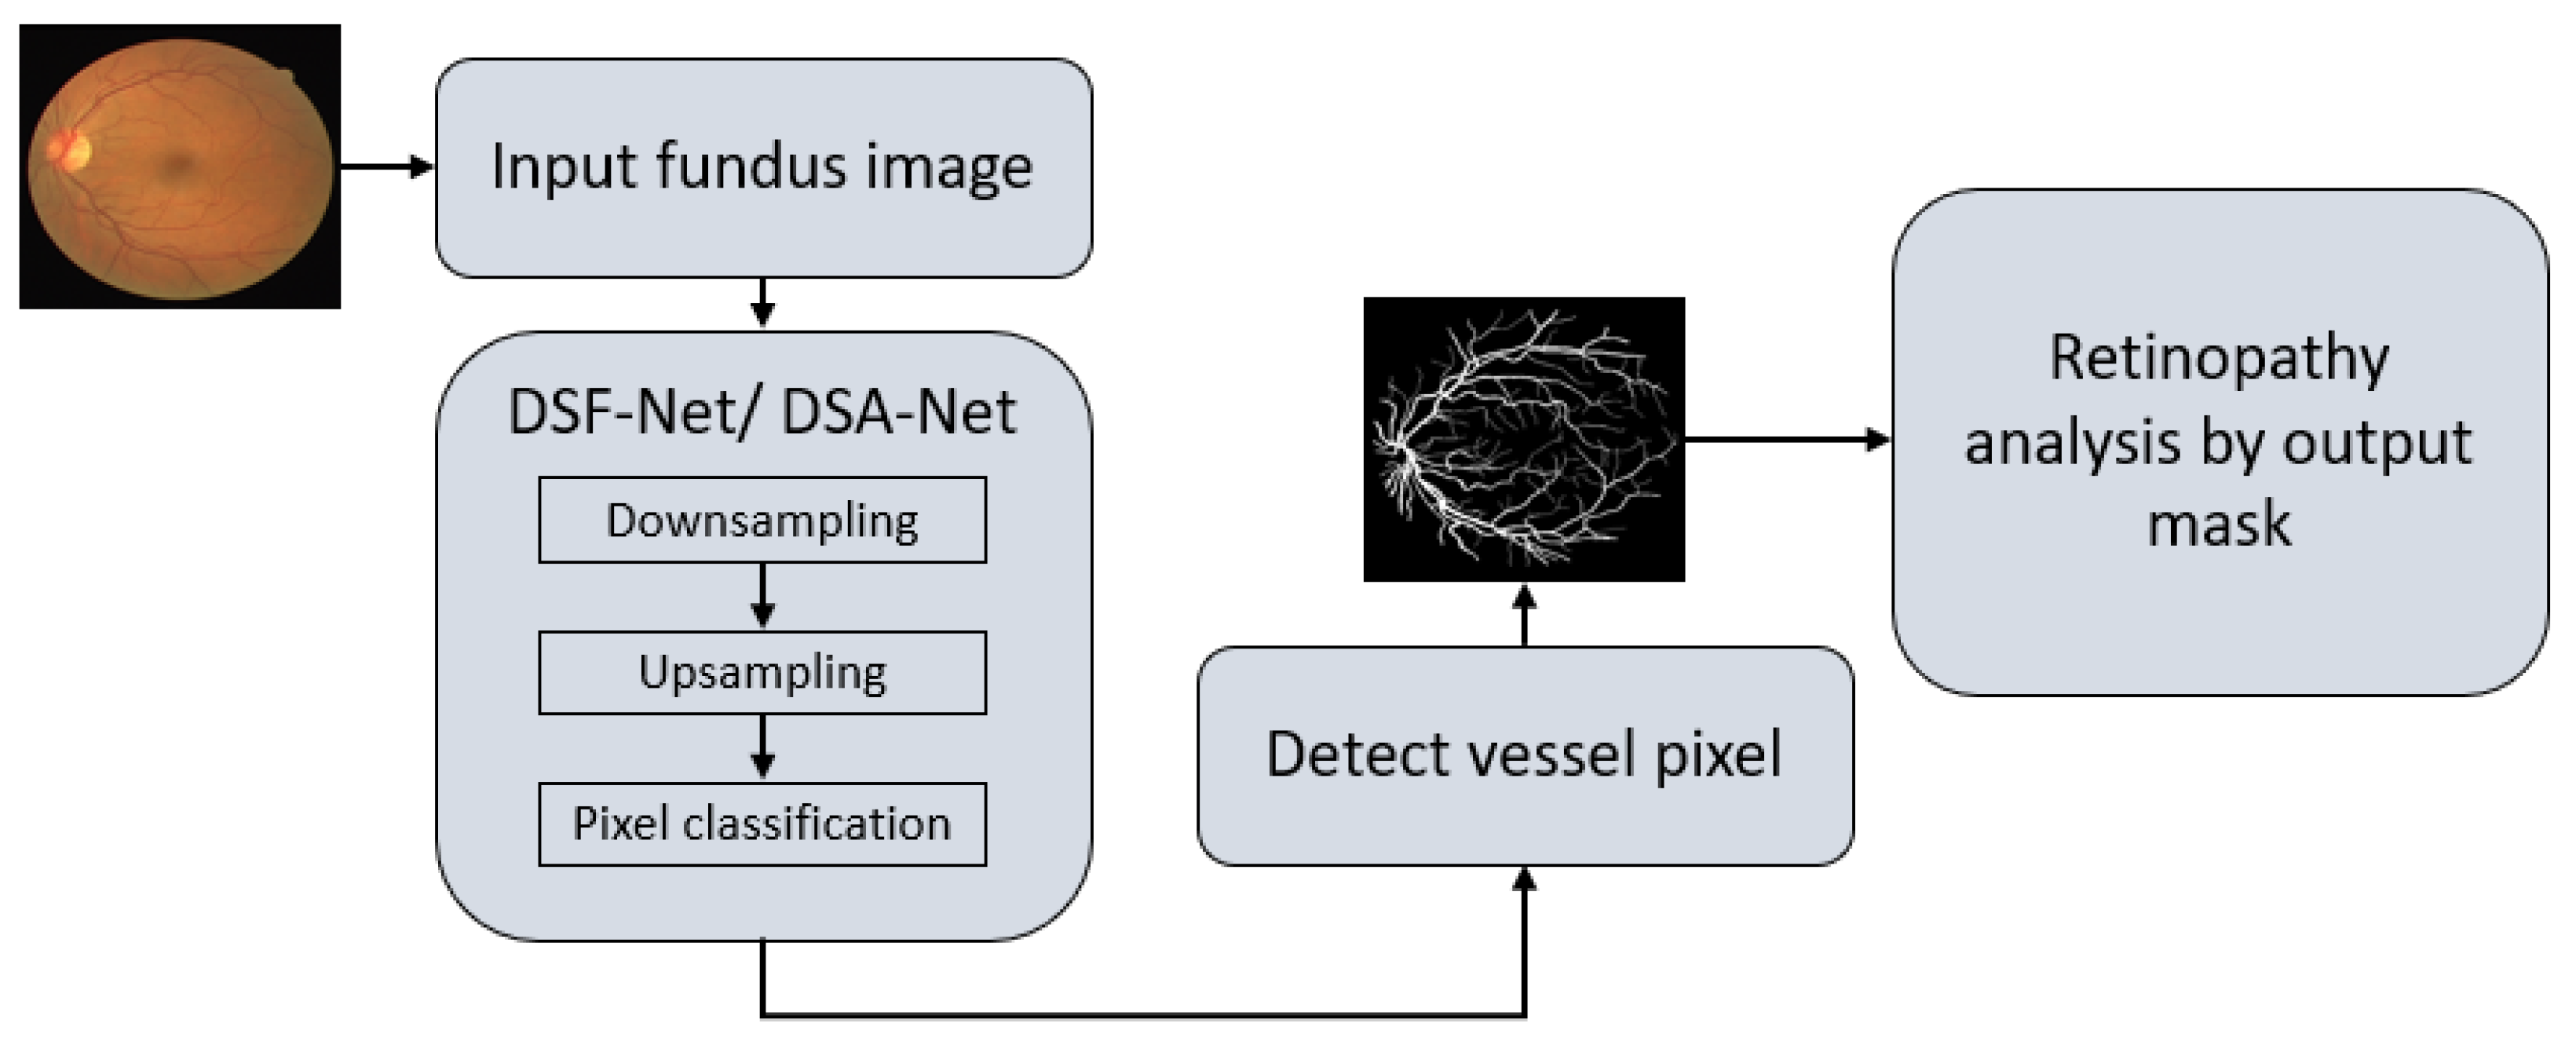
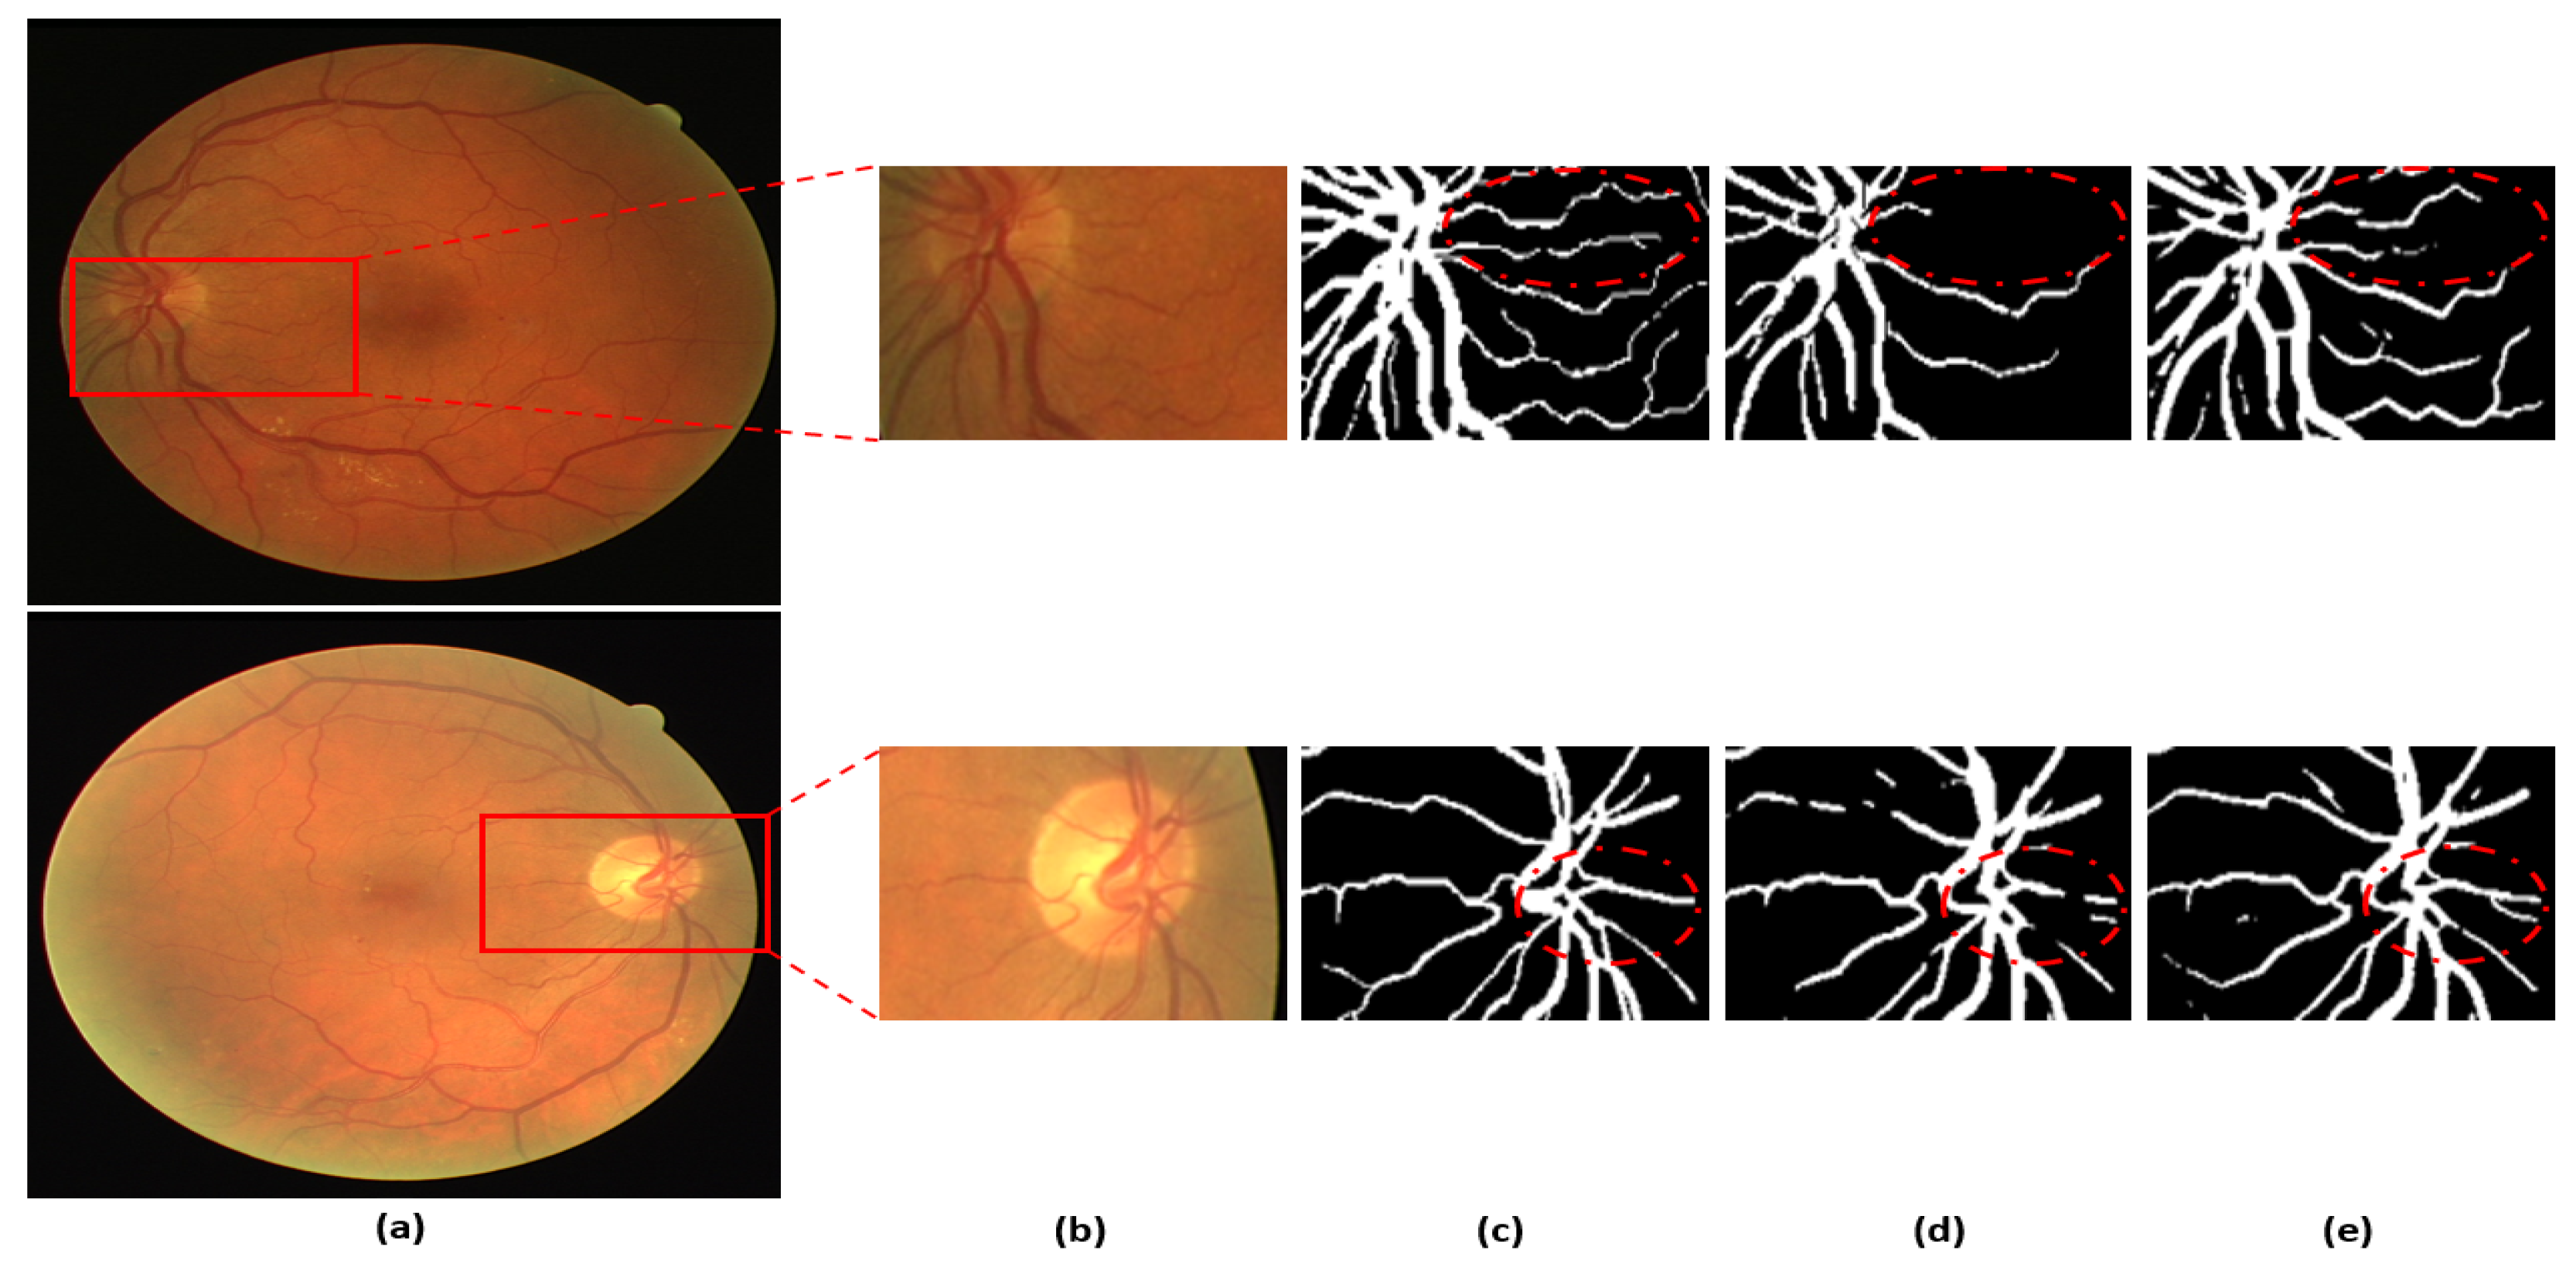
- The proposed method performs automatic segmentation of retinal vasculature, providing the opportunity for ophthalmic analysis of diabetic and hypertensive retinopathy and tracking of vascular changes.
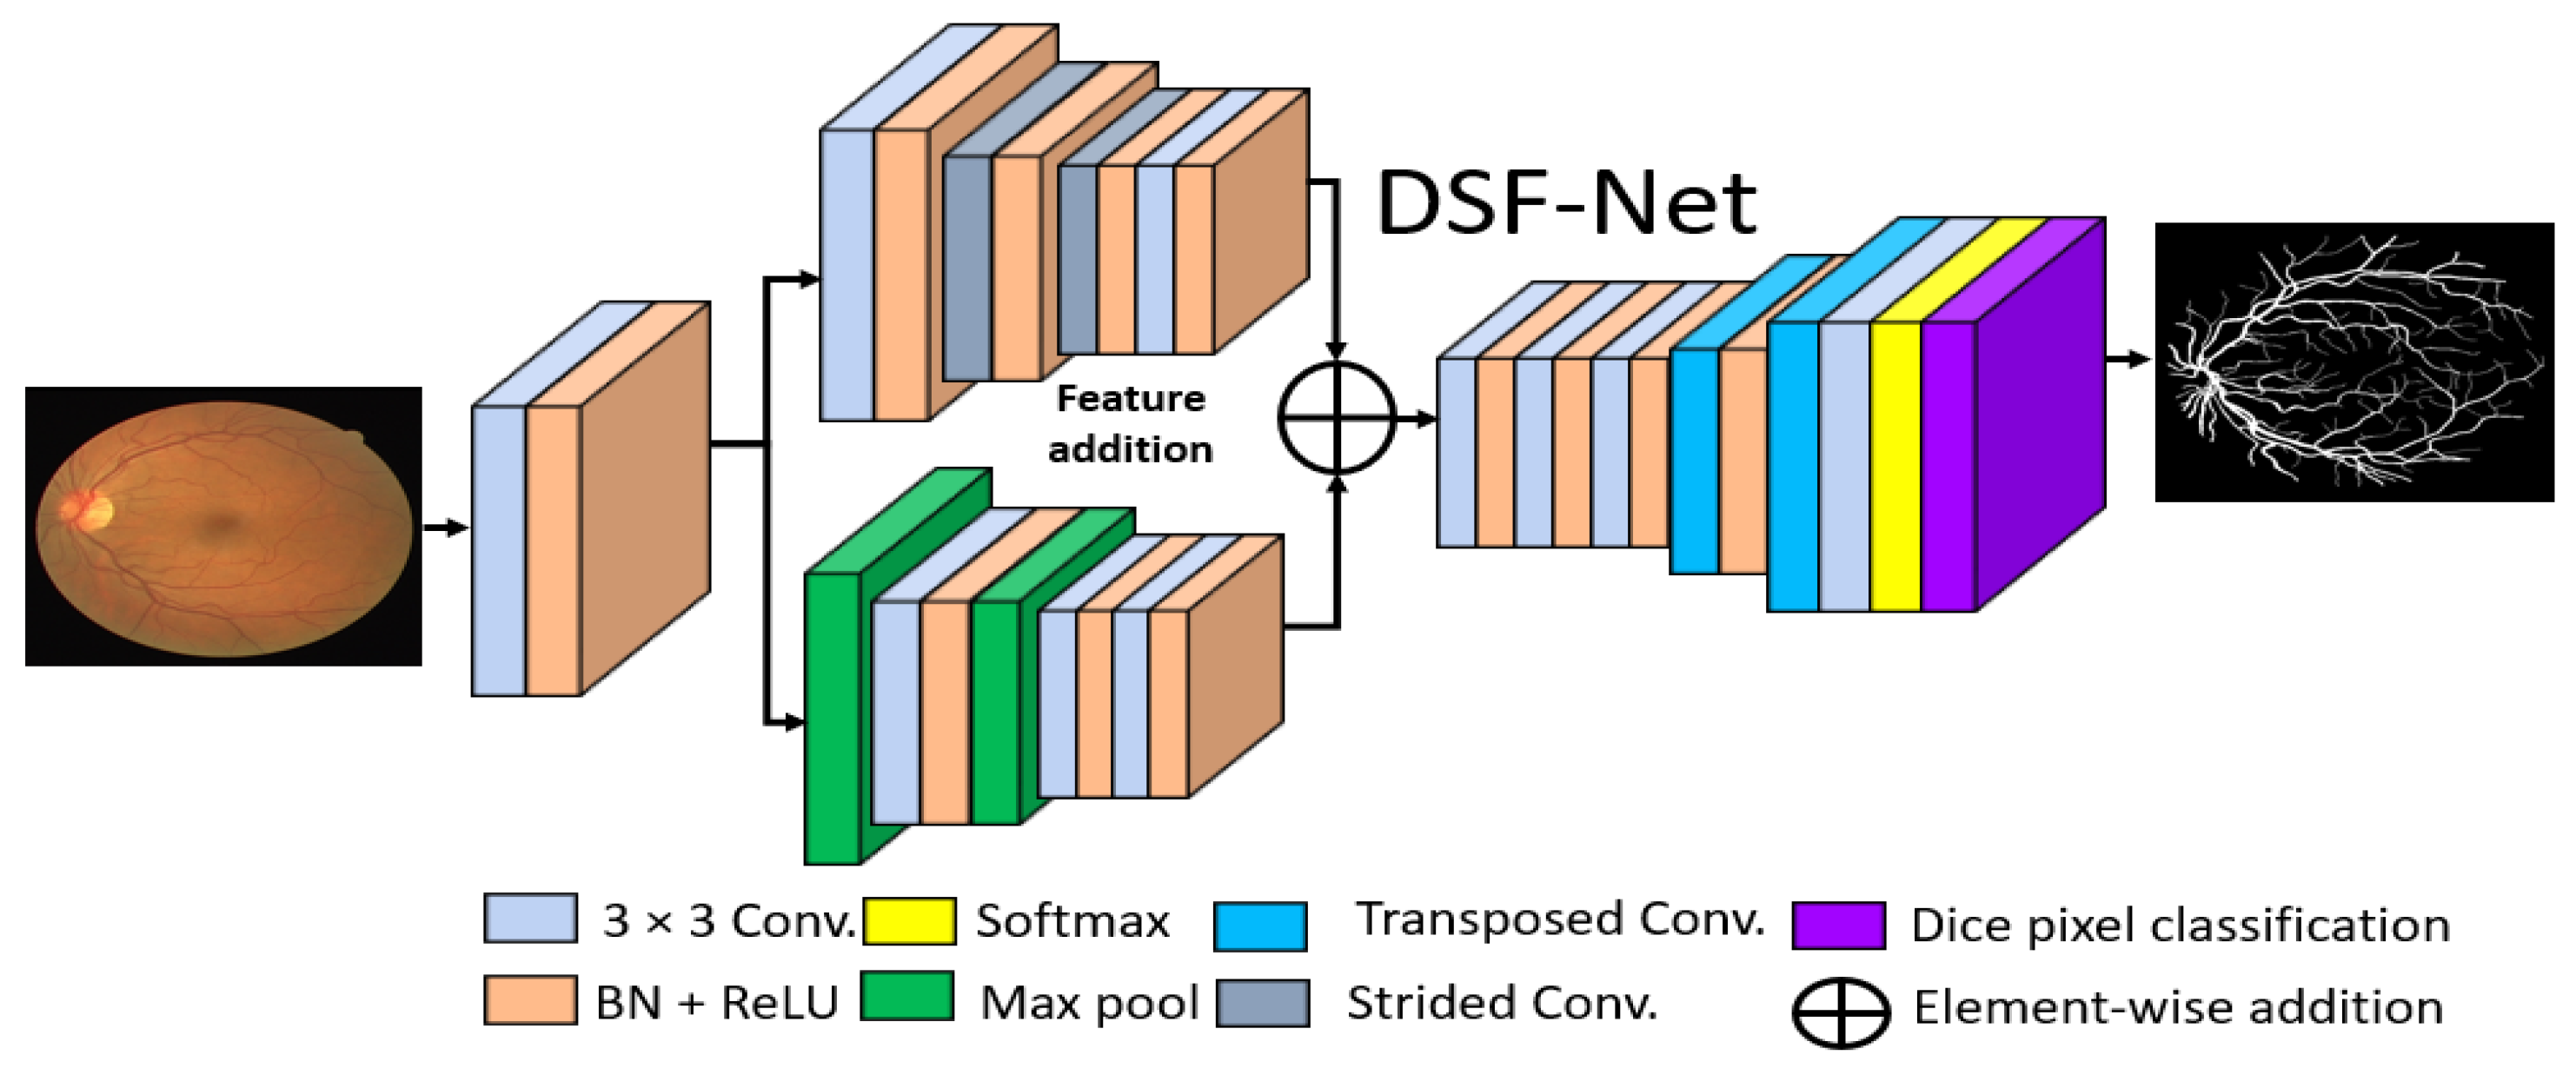
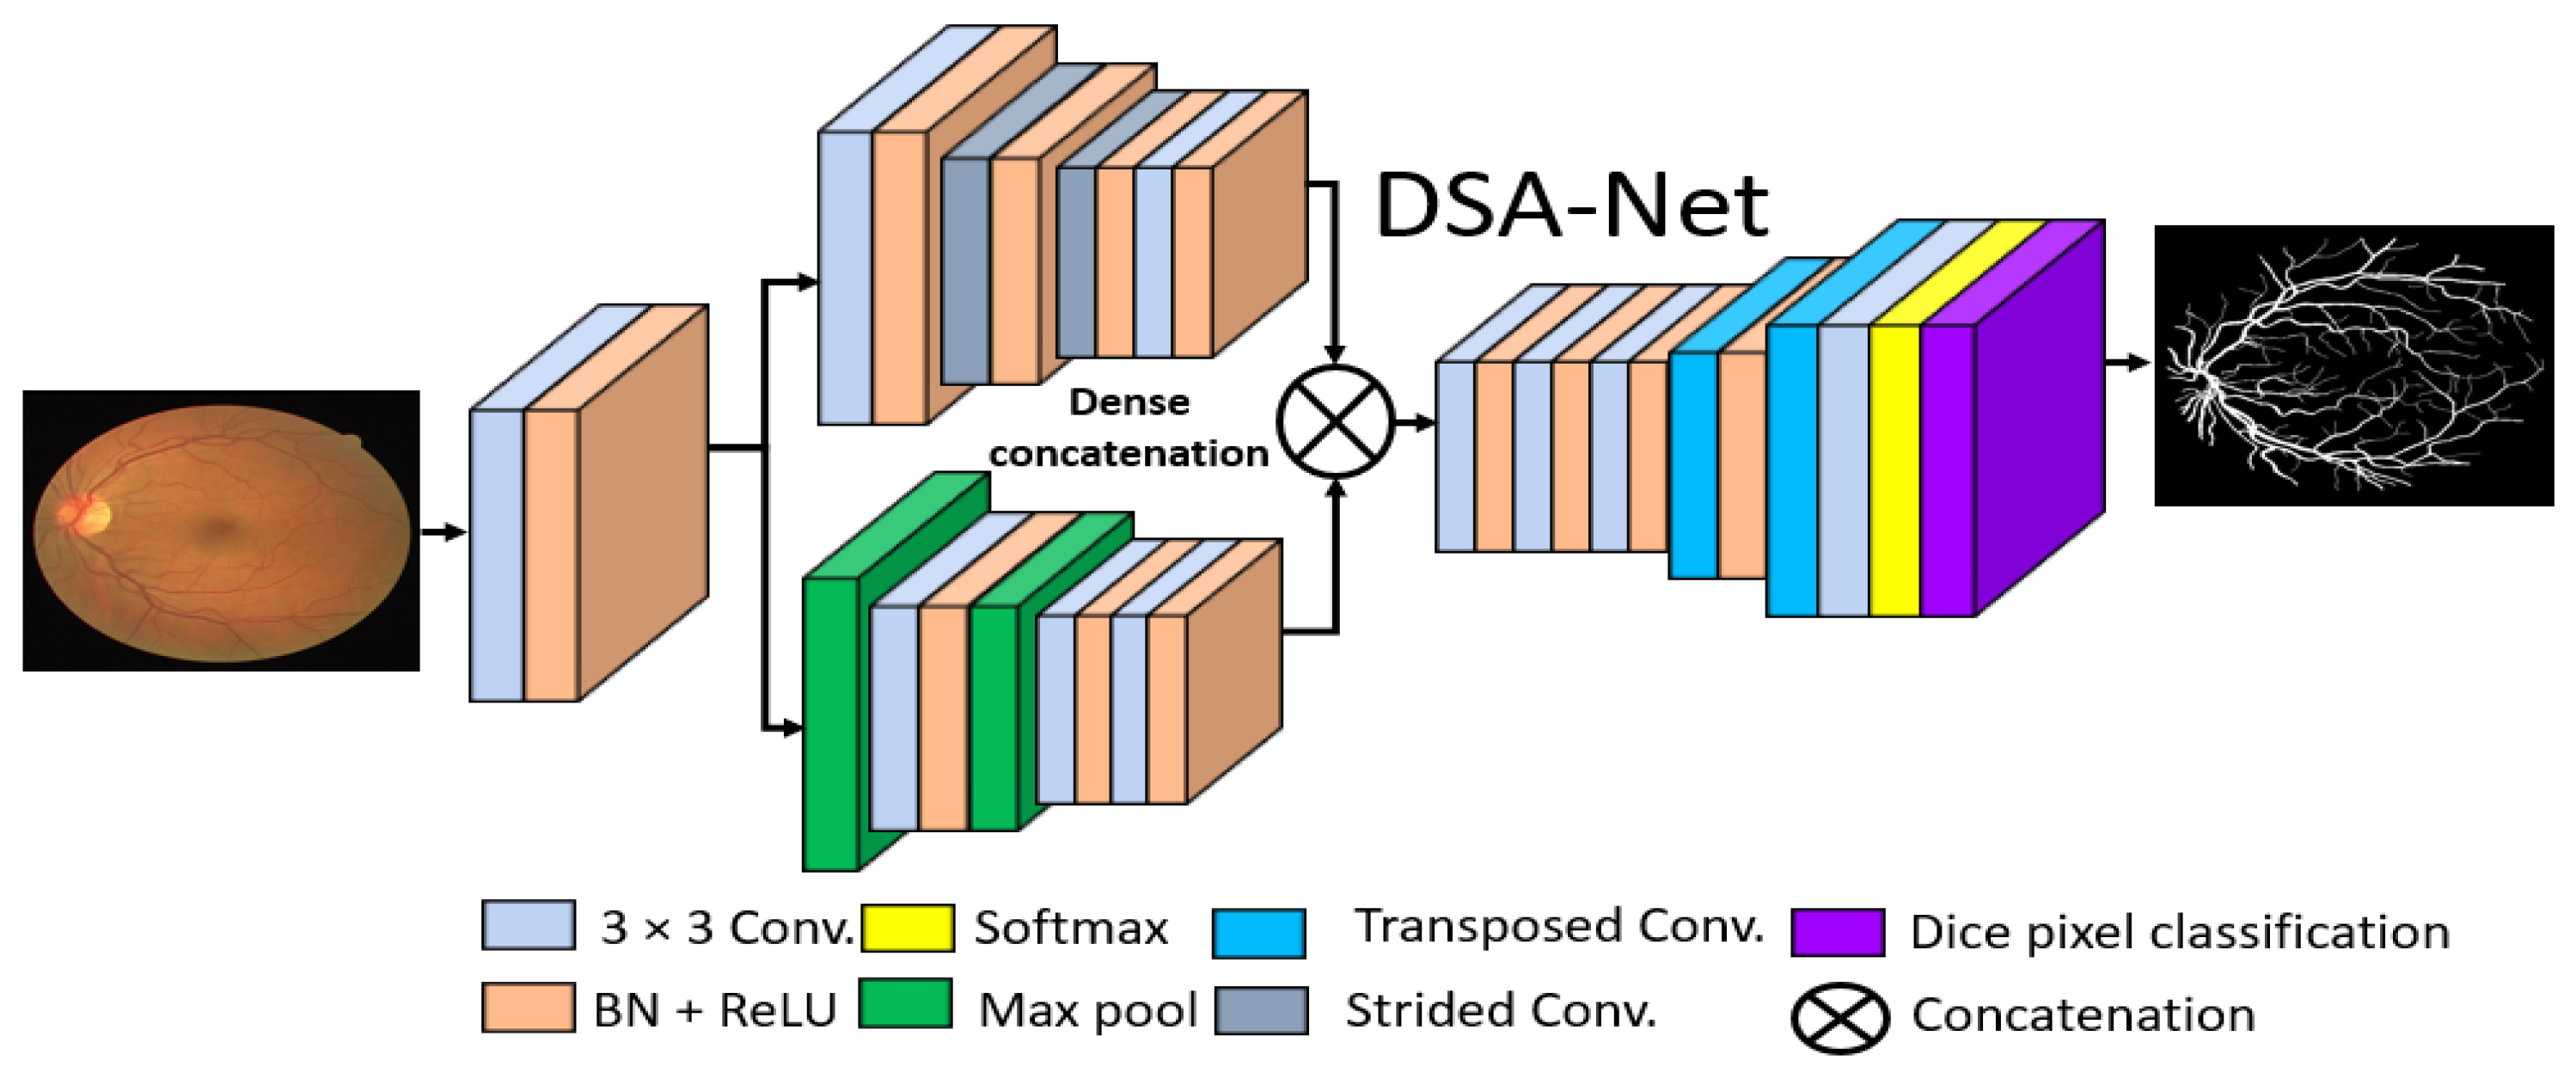
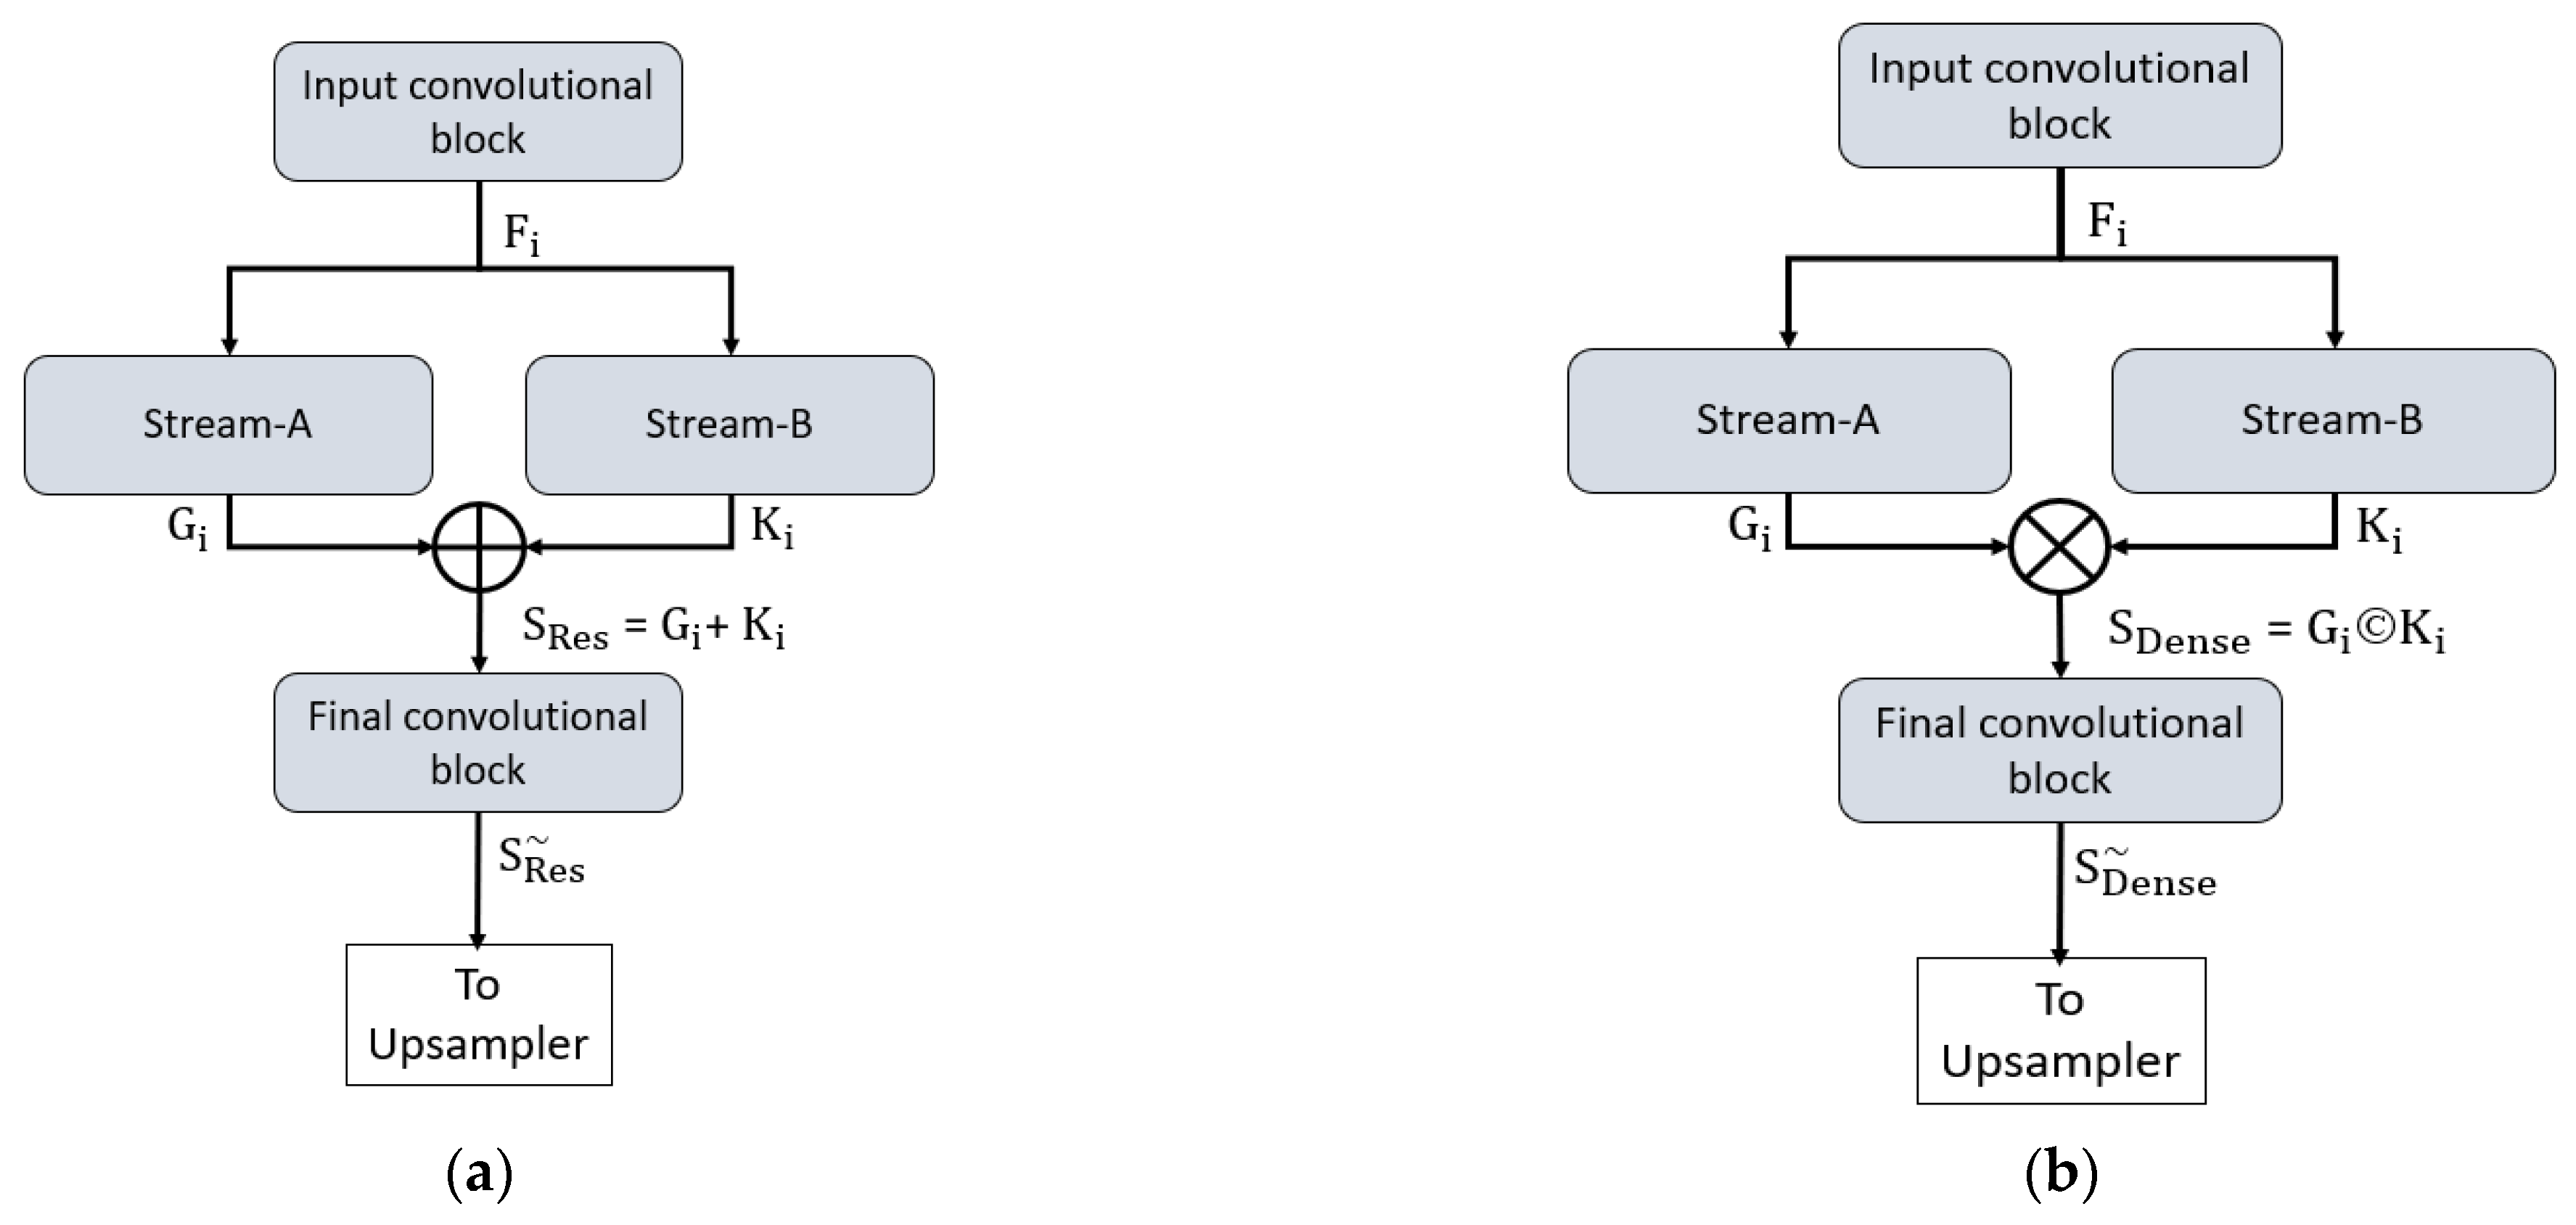
- The proposed method avoids intensive conventional image processing schemes for the preprocessing of fundus images, and two separate networks DSF-Net and DSA-Net are provided with feature fusion and concatenation that consume only 1.5 million trainable parameters.
- The Dice pixel classification layer effectively addresses the class imbalance between the vessel and the non-vessel pixels.
- The proposed trained models and codes are open for reuse and fair comparison [24].
2. Material and Methods
2.1. Datasets
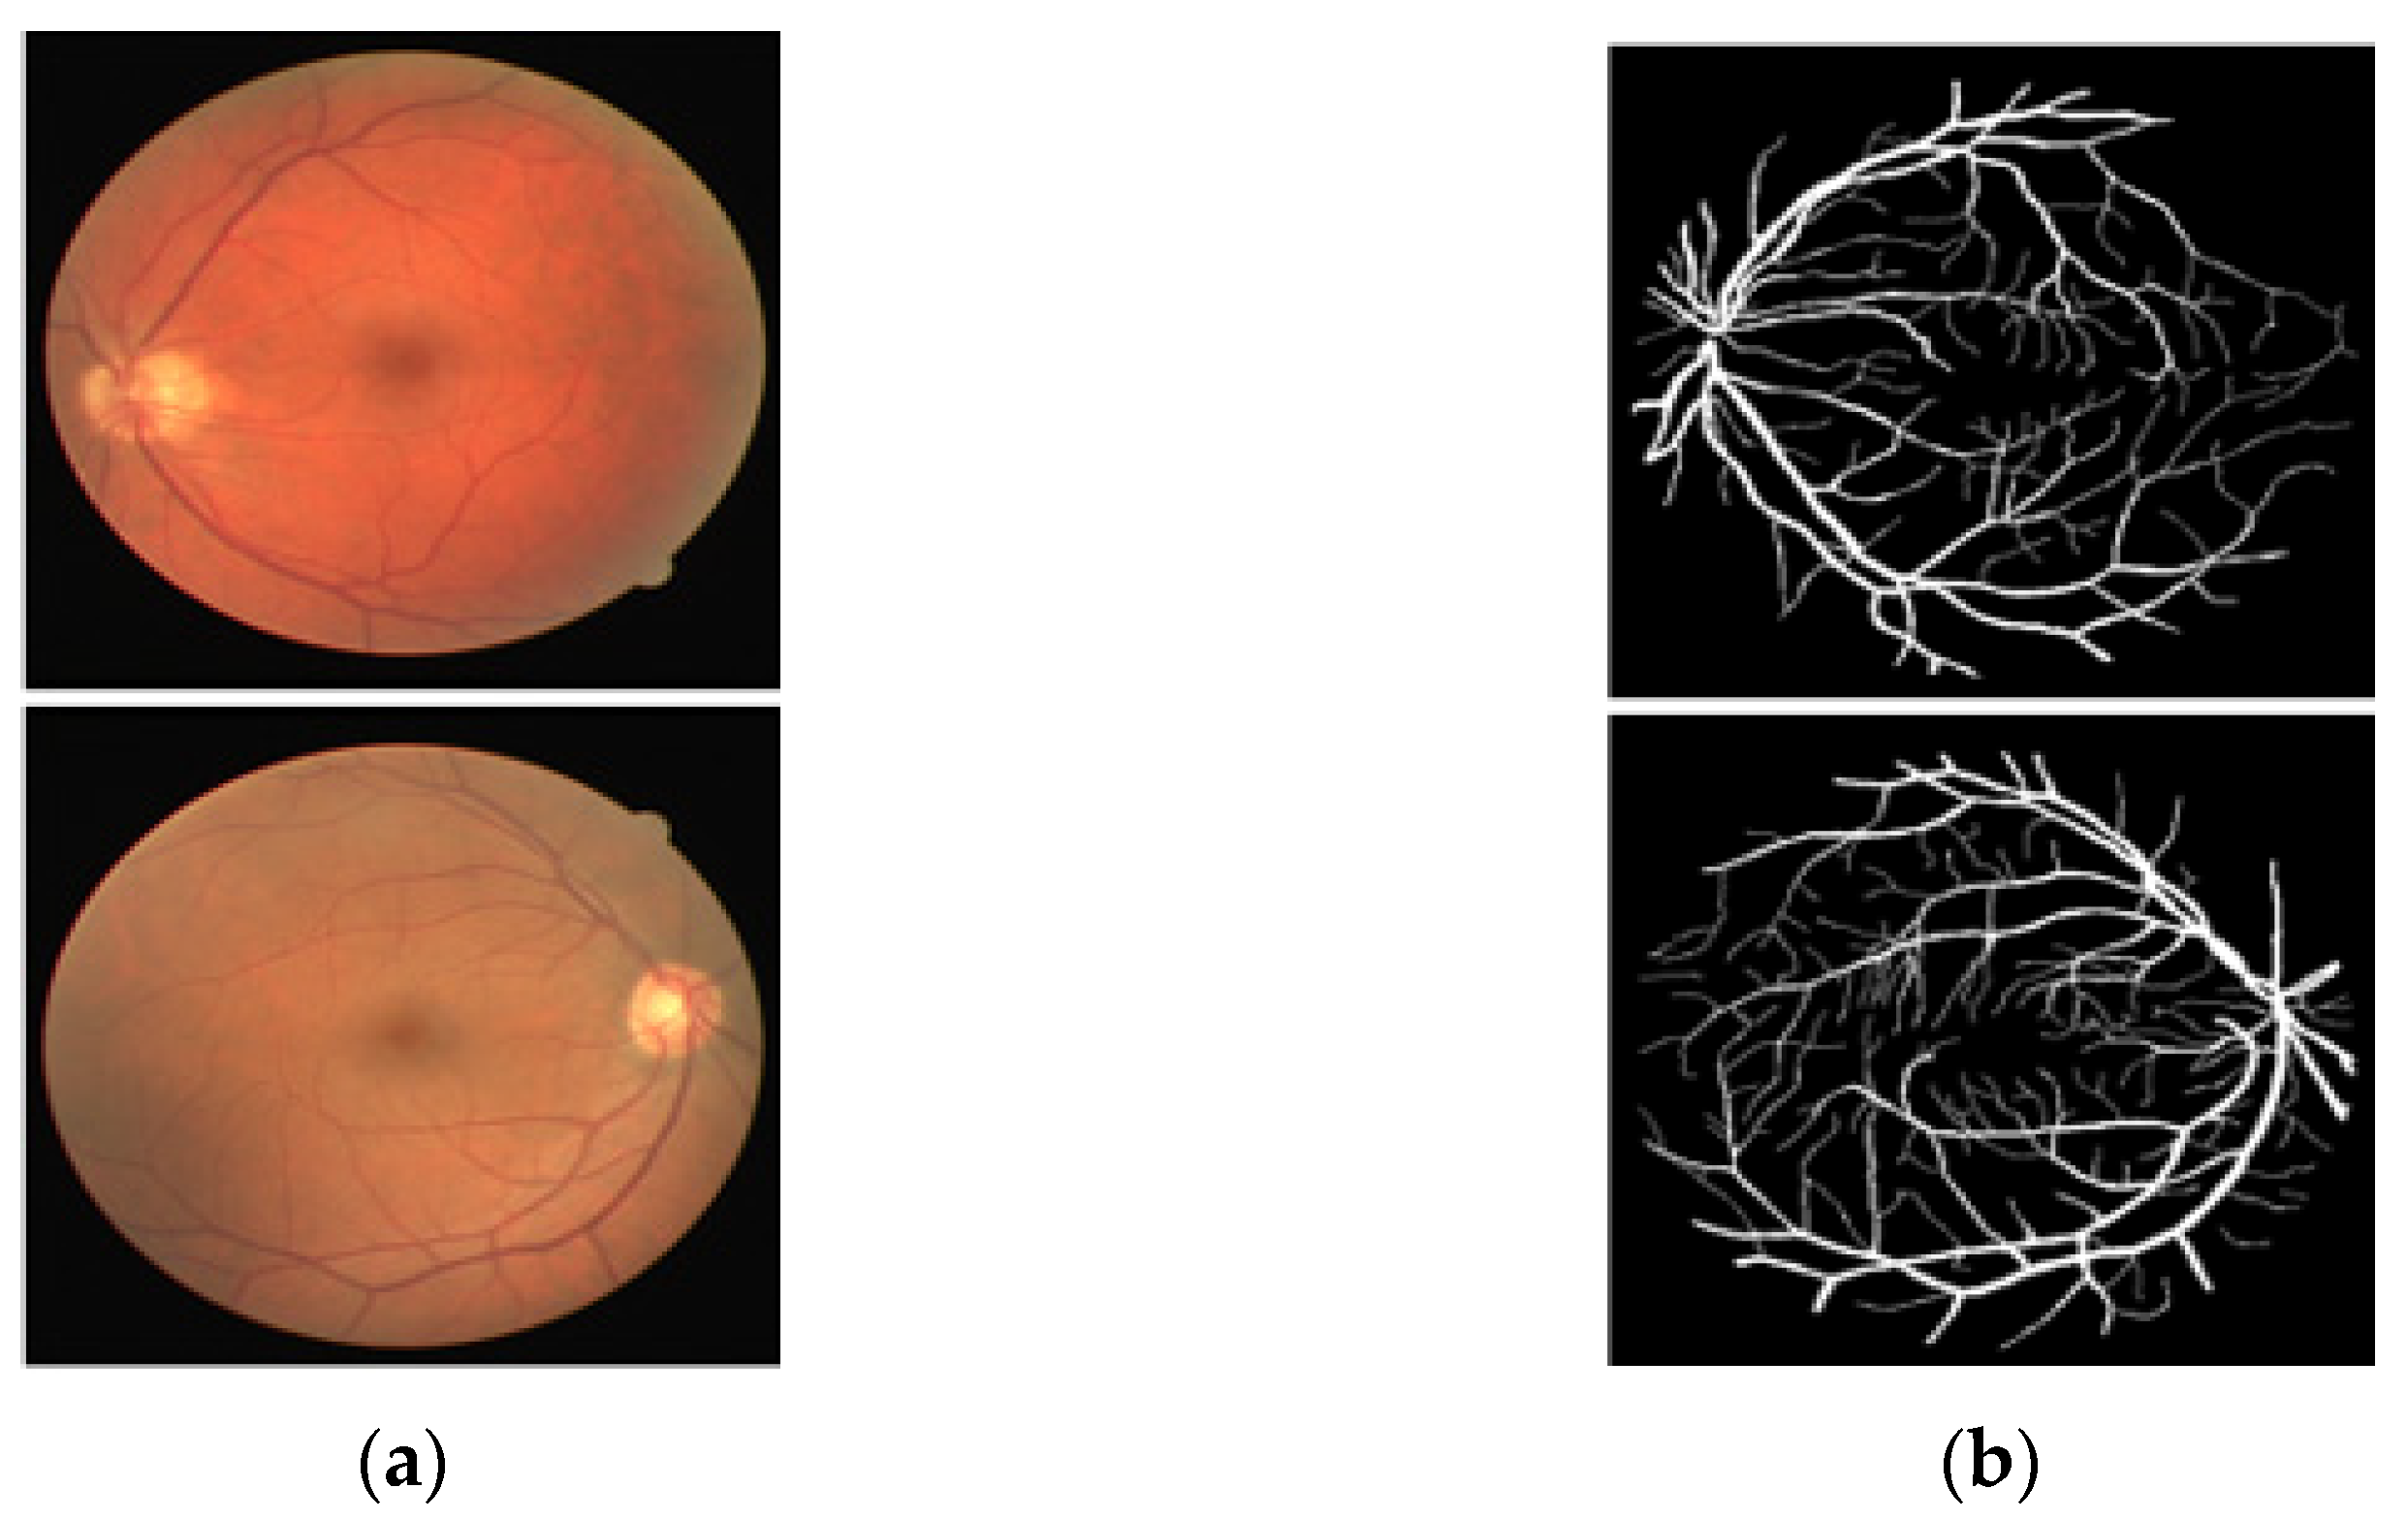
2.1.1. DRIVE
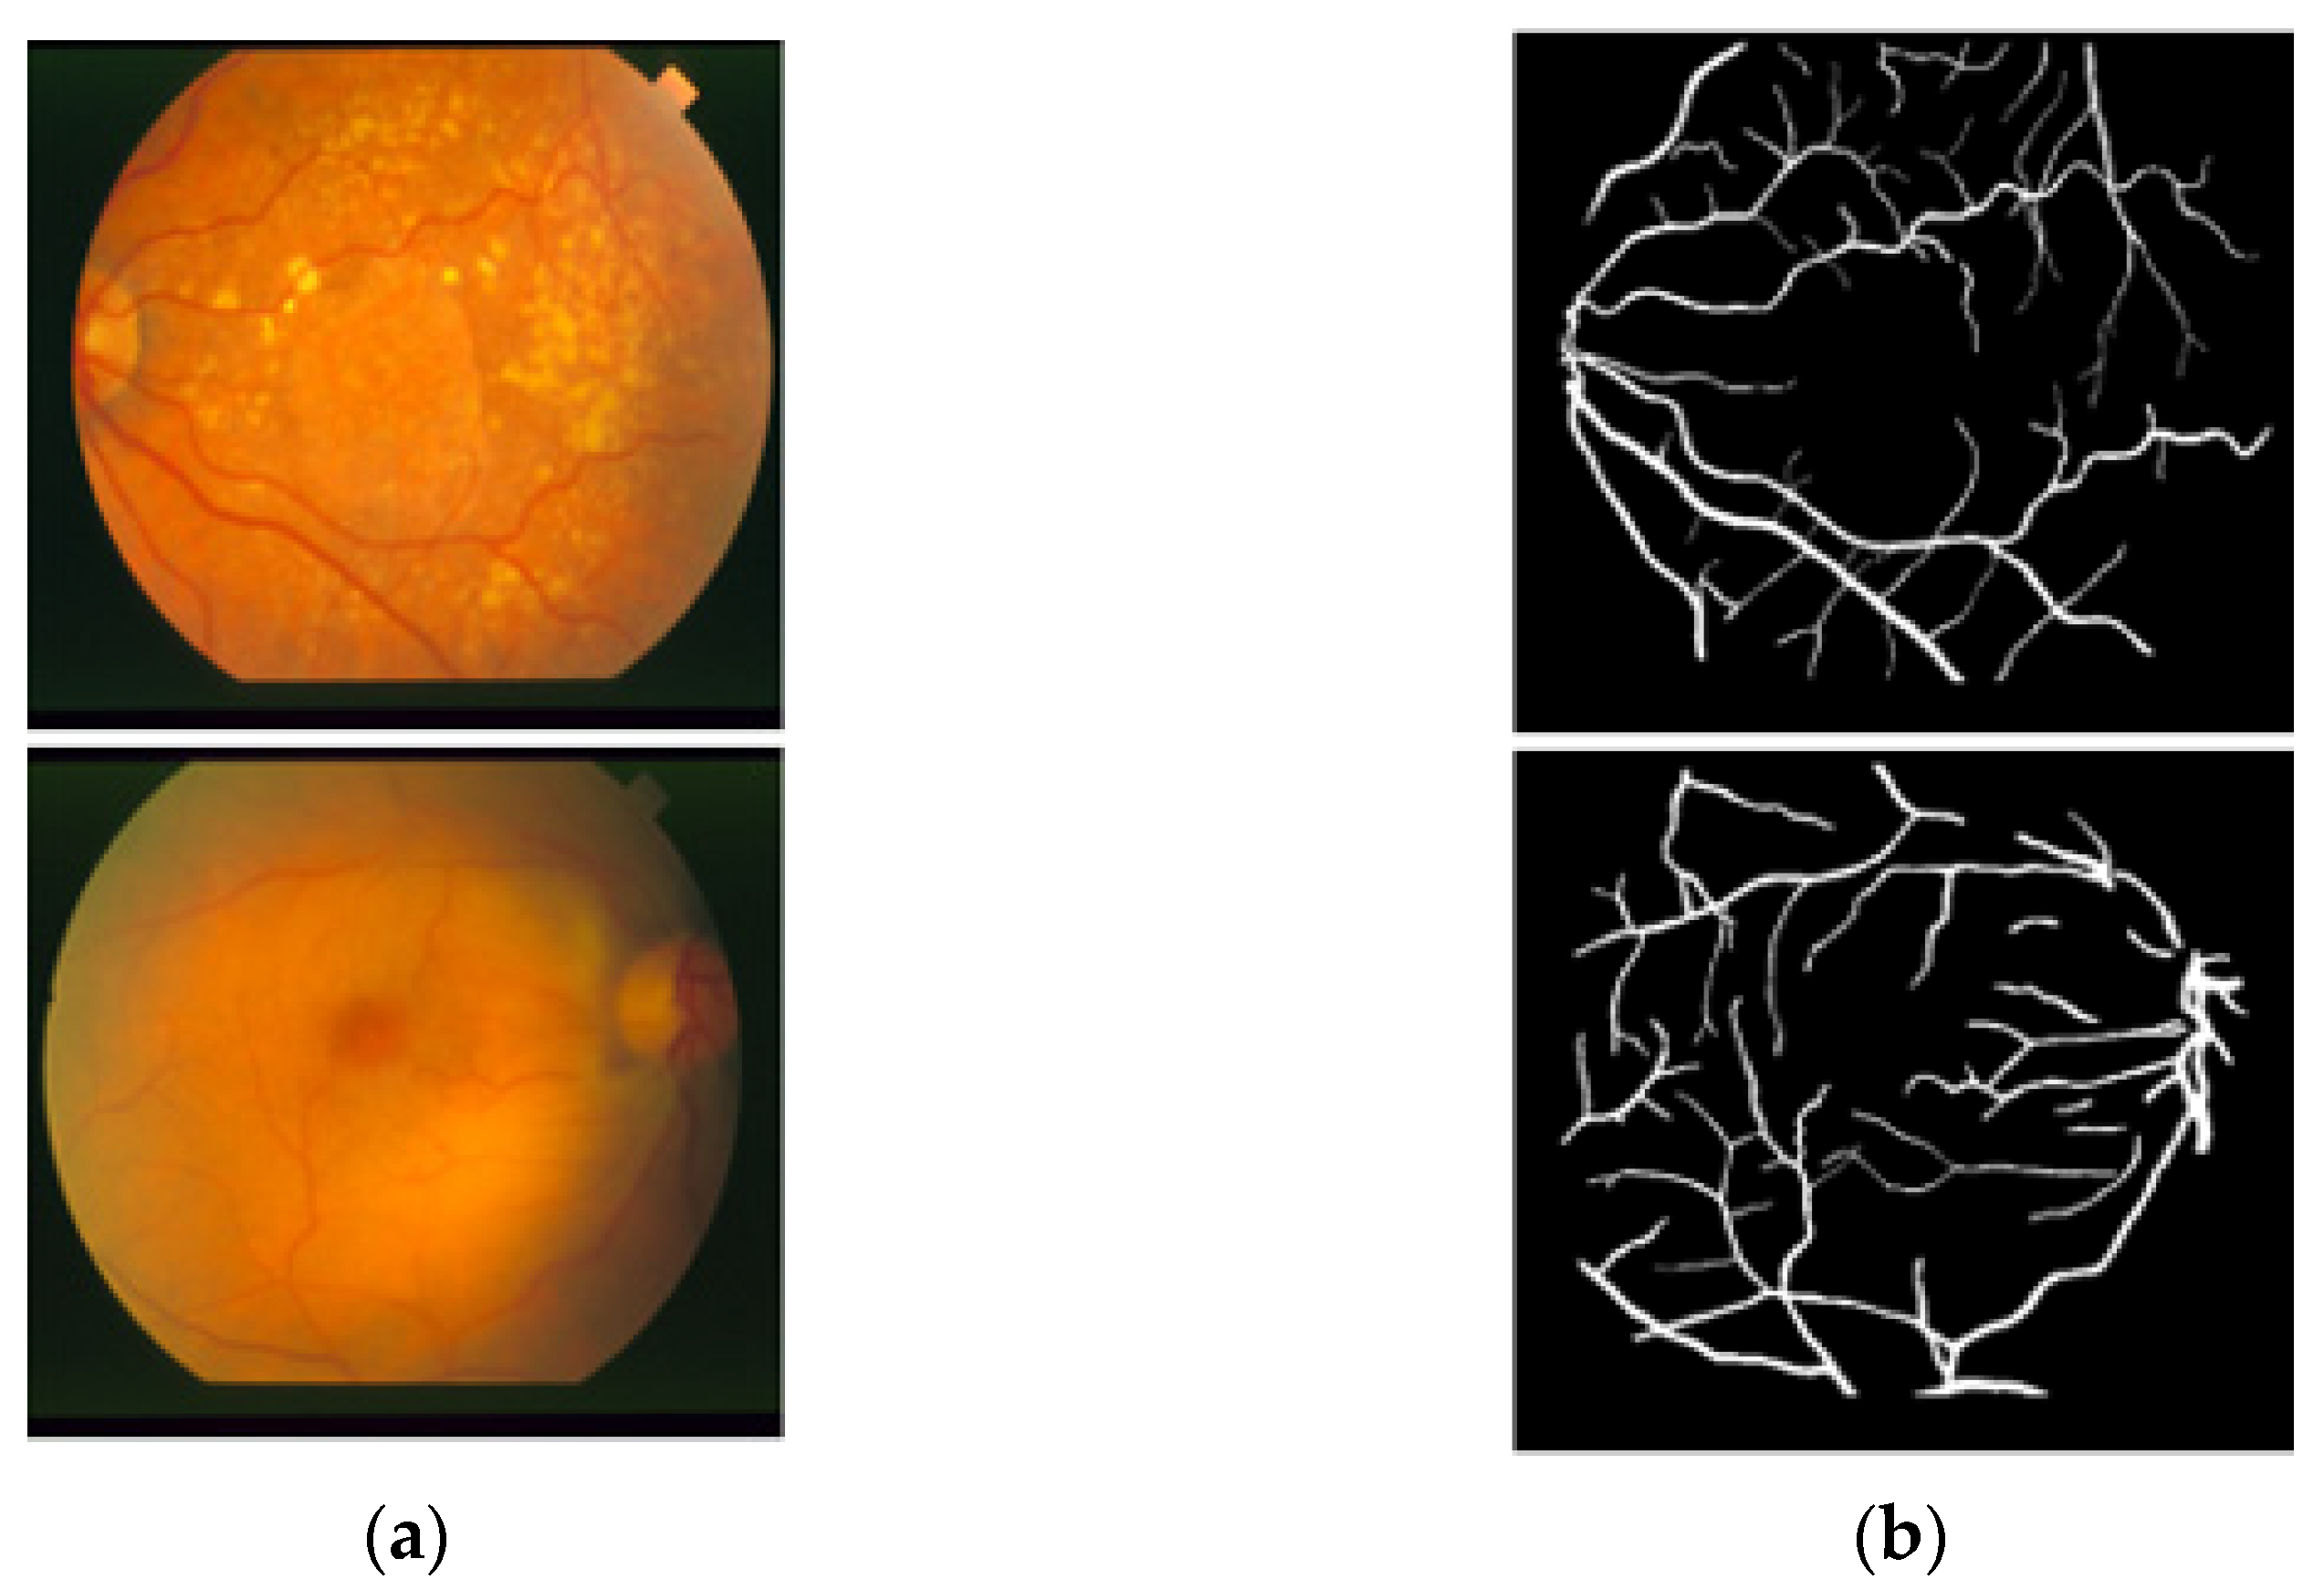
2.1.2. STARE
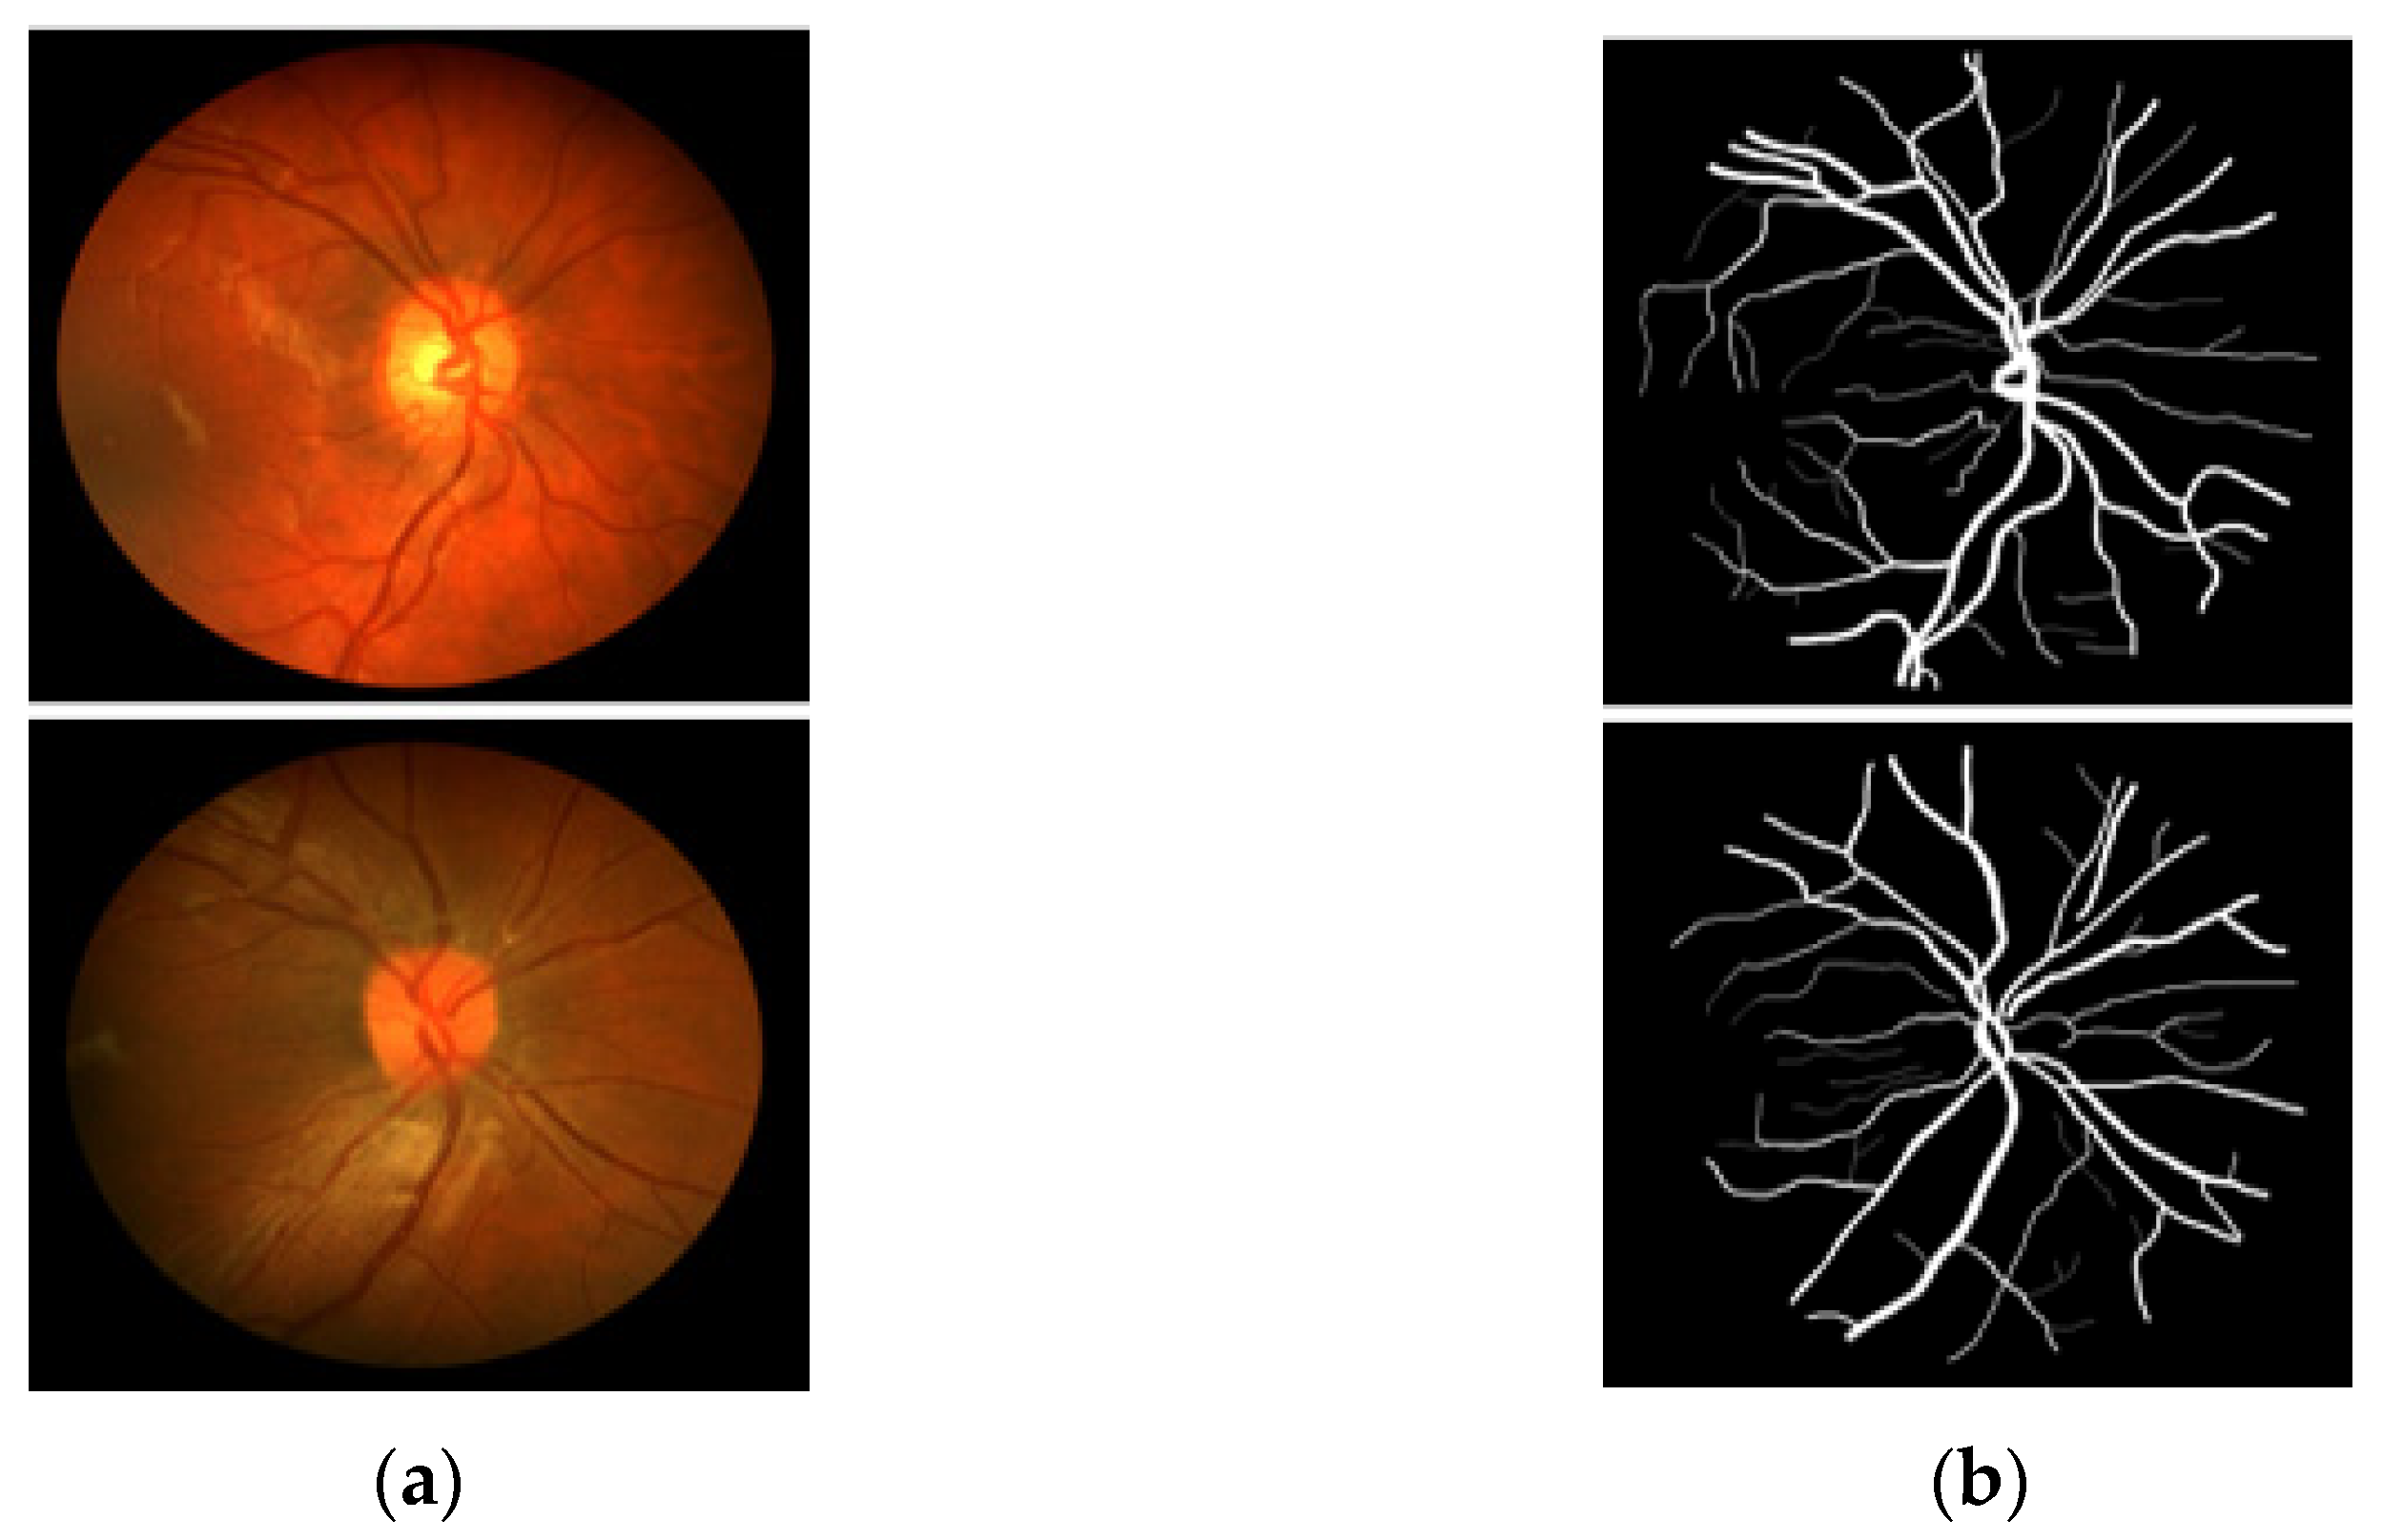
2.1.3. CHASE-DB1
2.2. Method
2.2.1. Summary of the Proposed Method
2.2.2. Structure of the Proposed Method
2.2.3. Encoder of the Proposed Architecture
2.2.4. Decoder of the Proposed Architecture
2.2.5. Experimental Environment and Data Augmentation
3. Results
3.1. Evaluation of the Proposed Method
3.2. Ablation Study
3.3. Architectural and Visual Comparison of the Proposed Method with Existing Methods
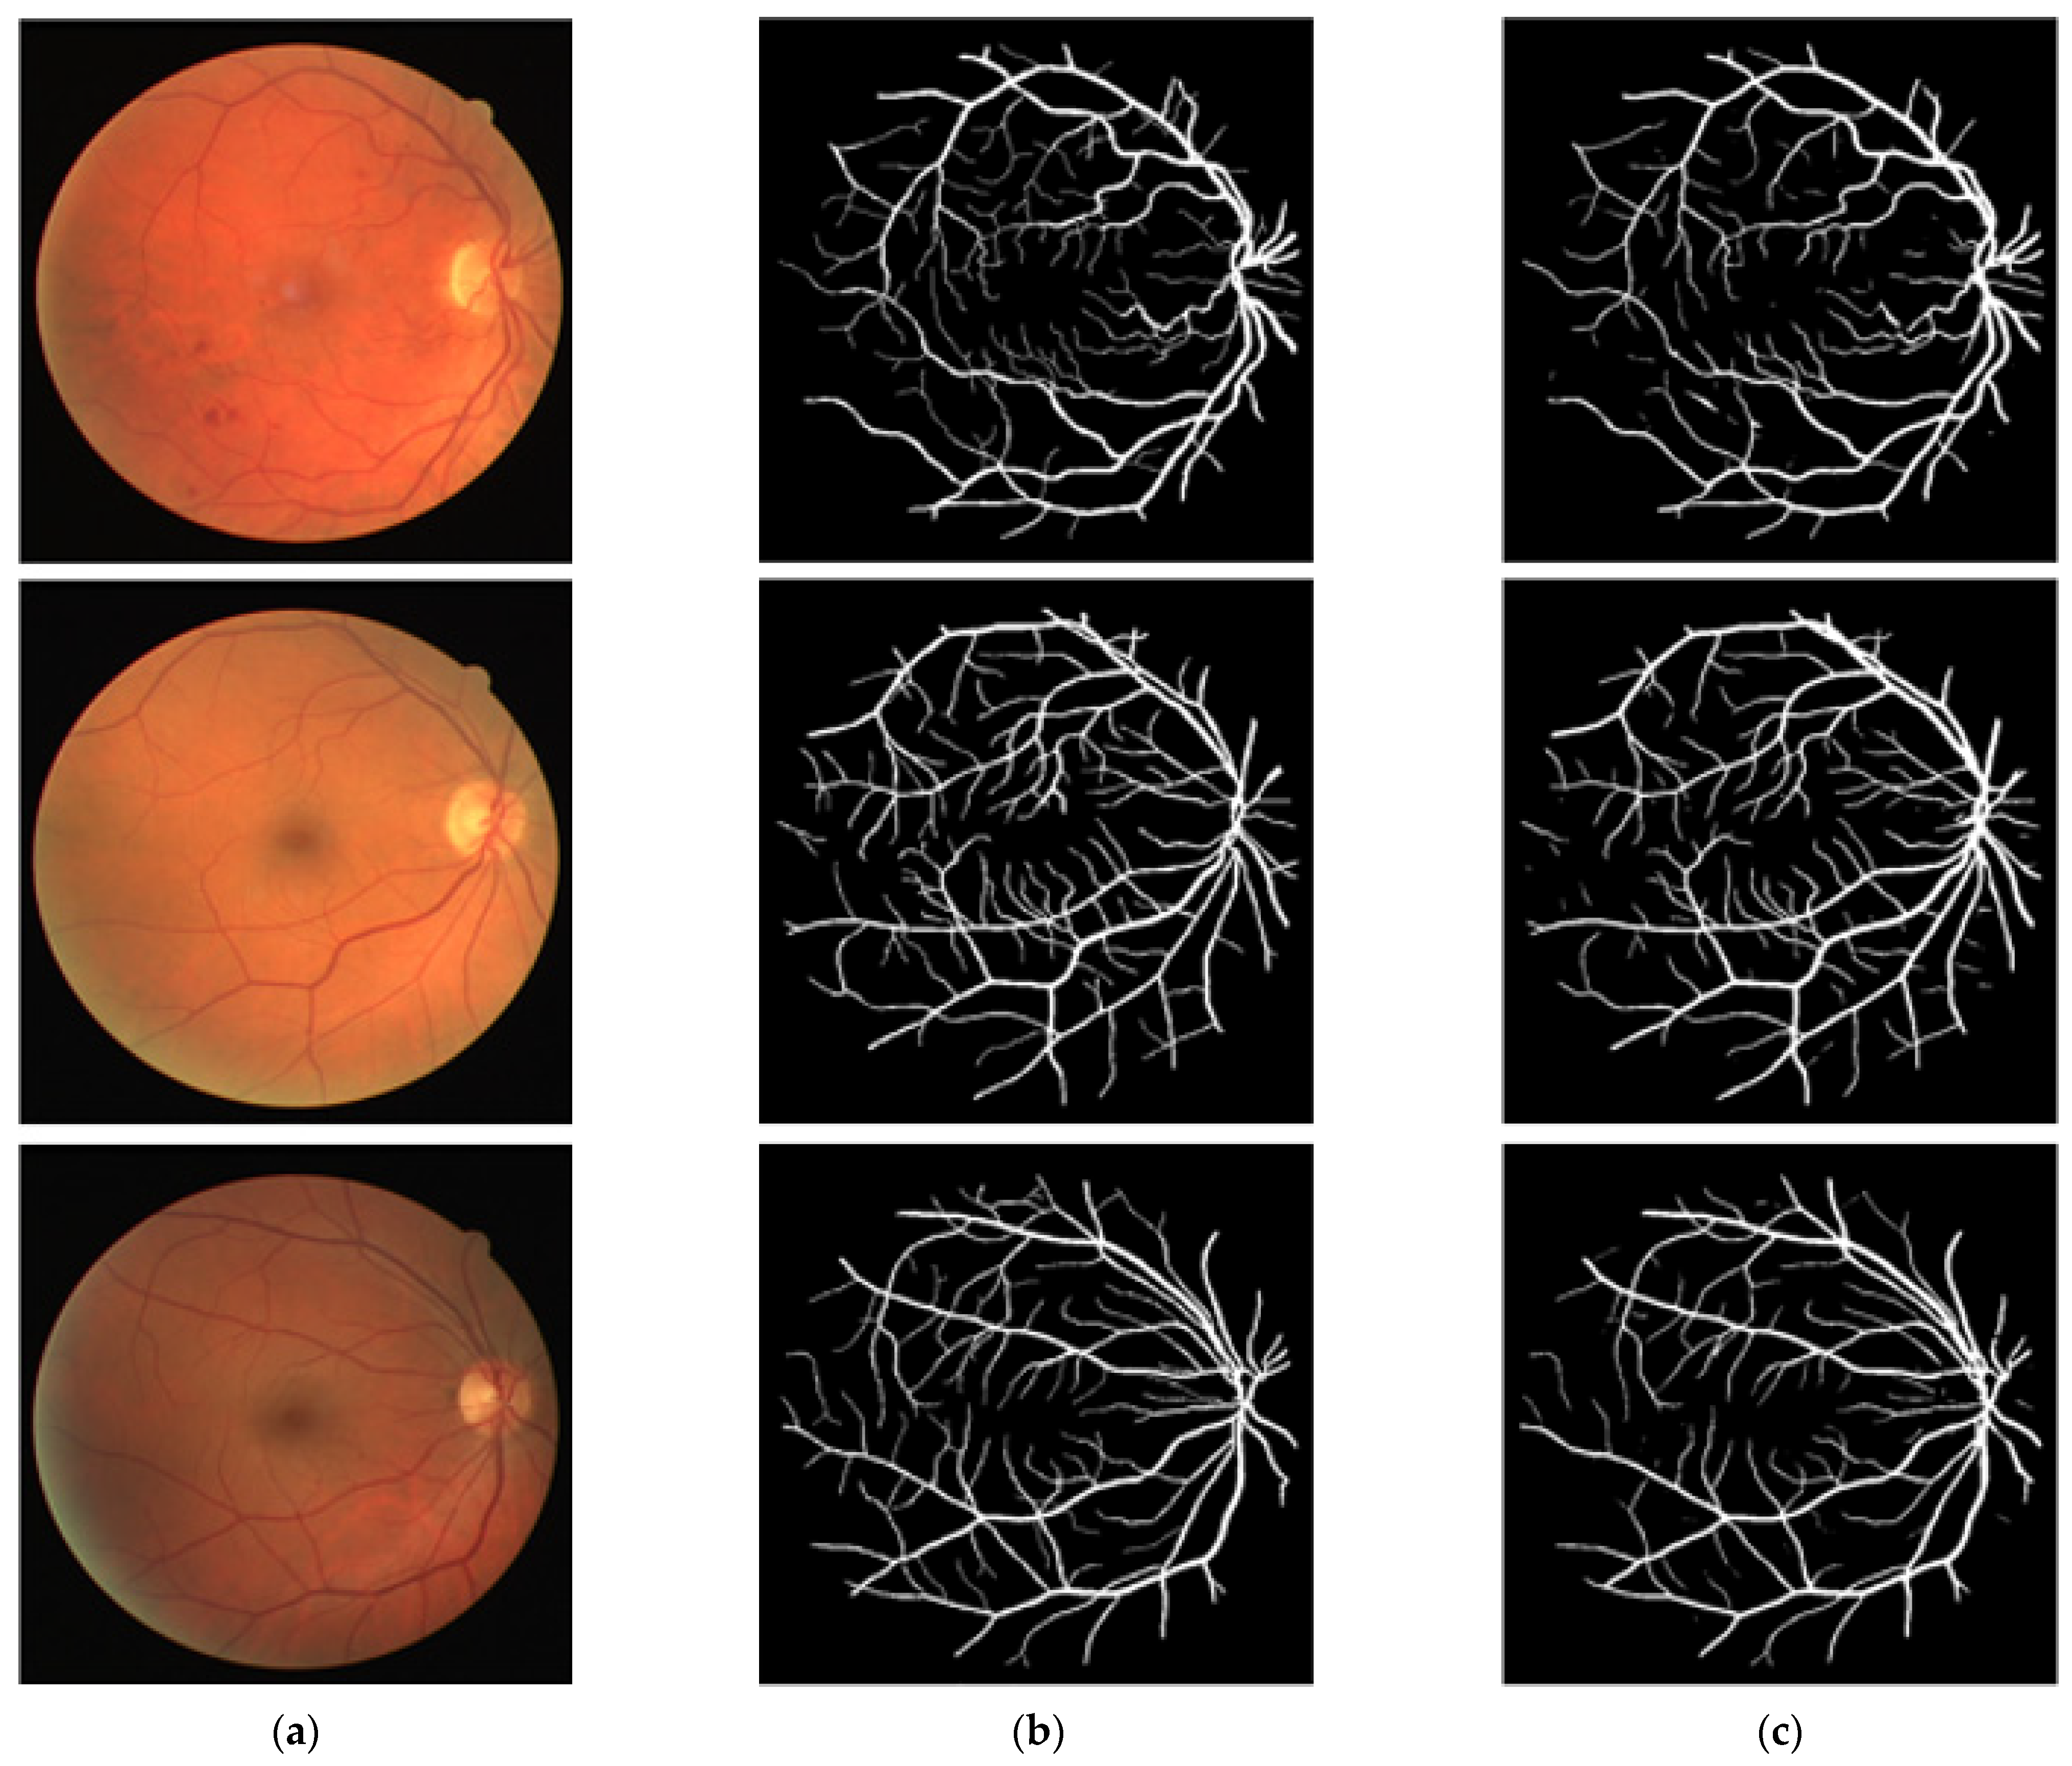
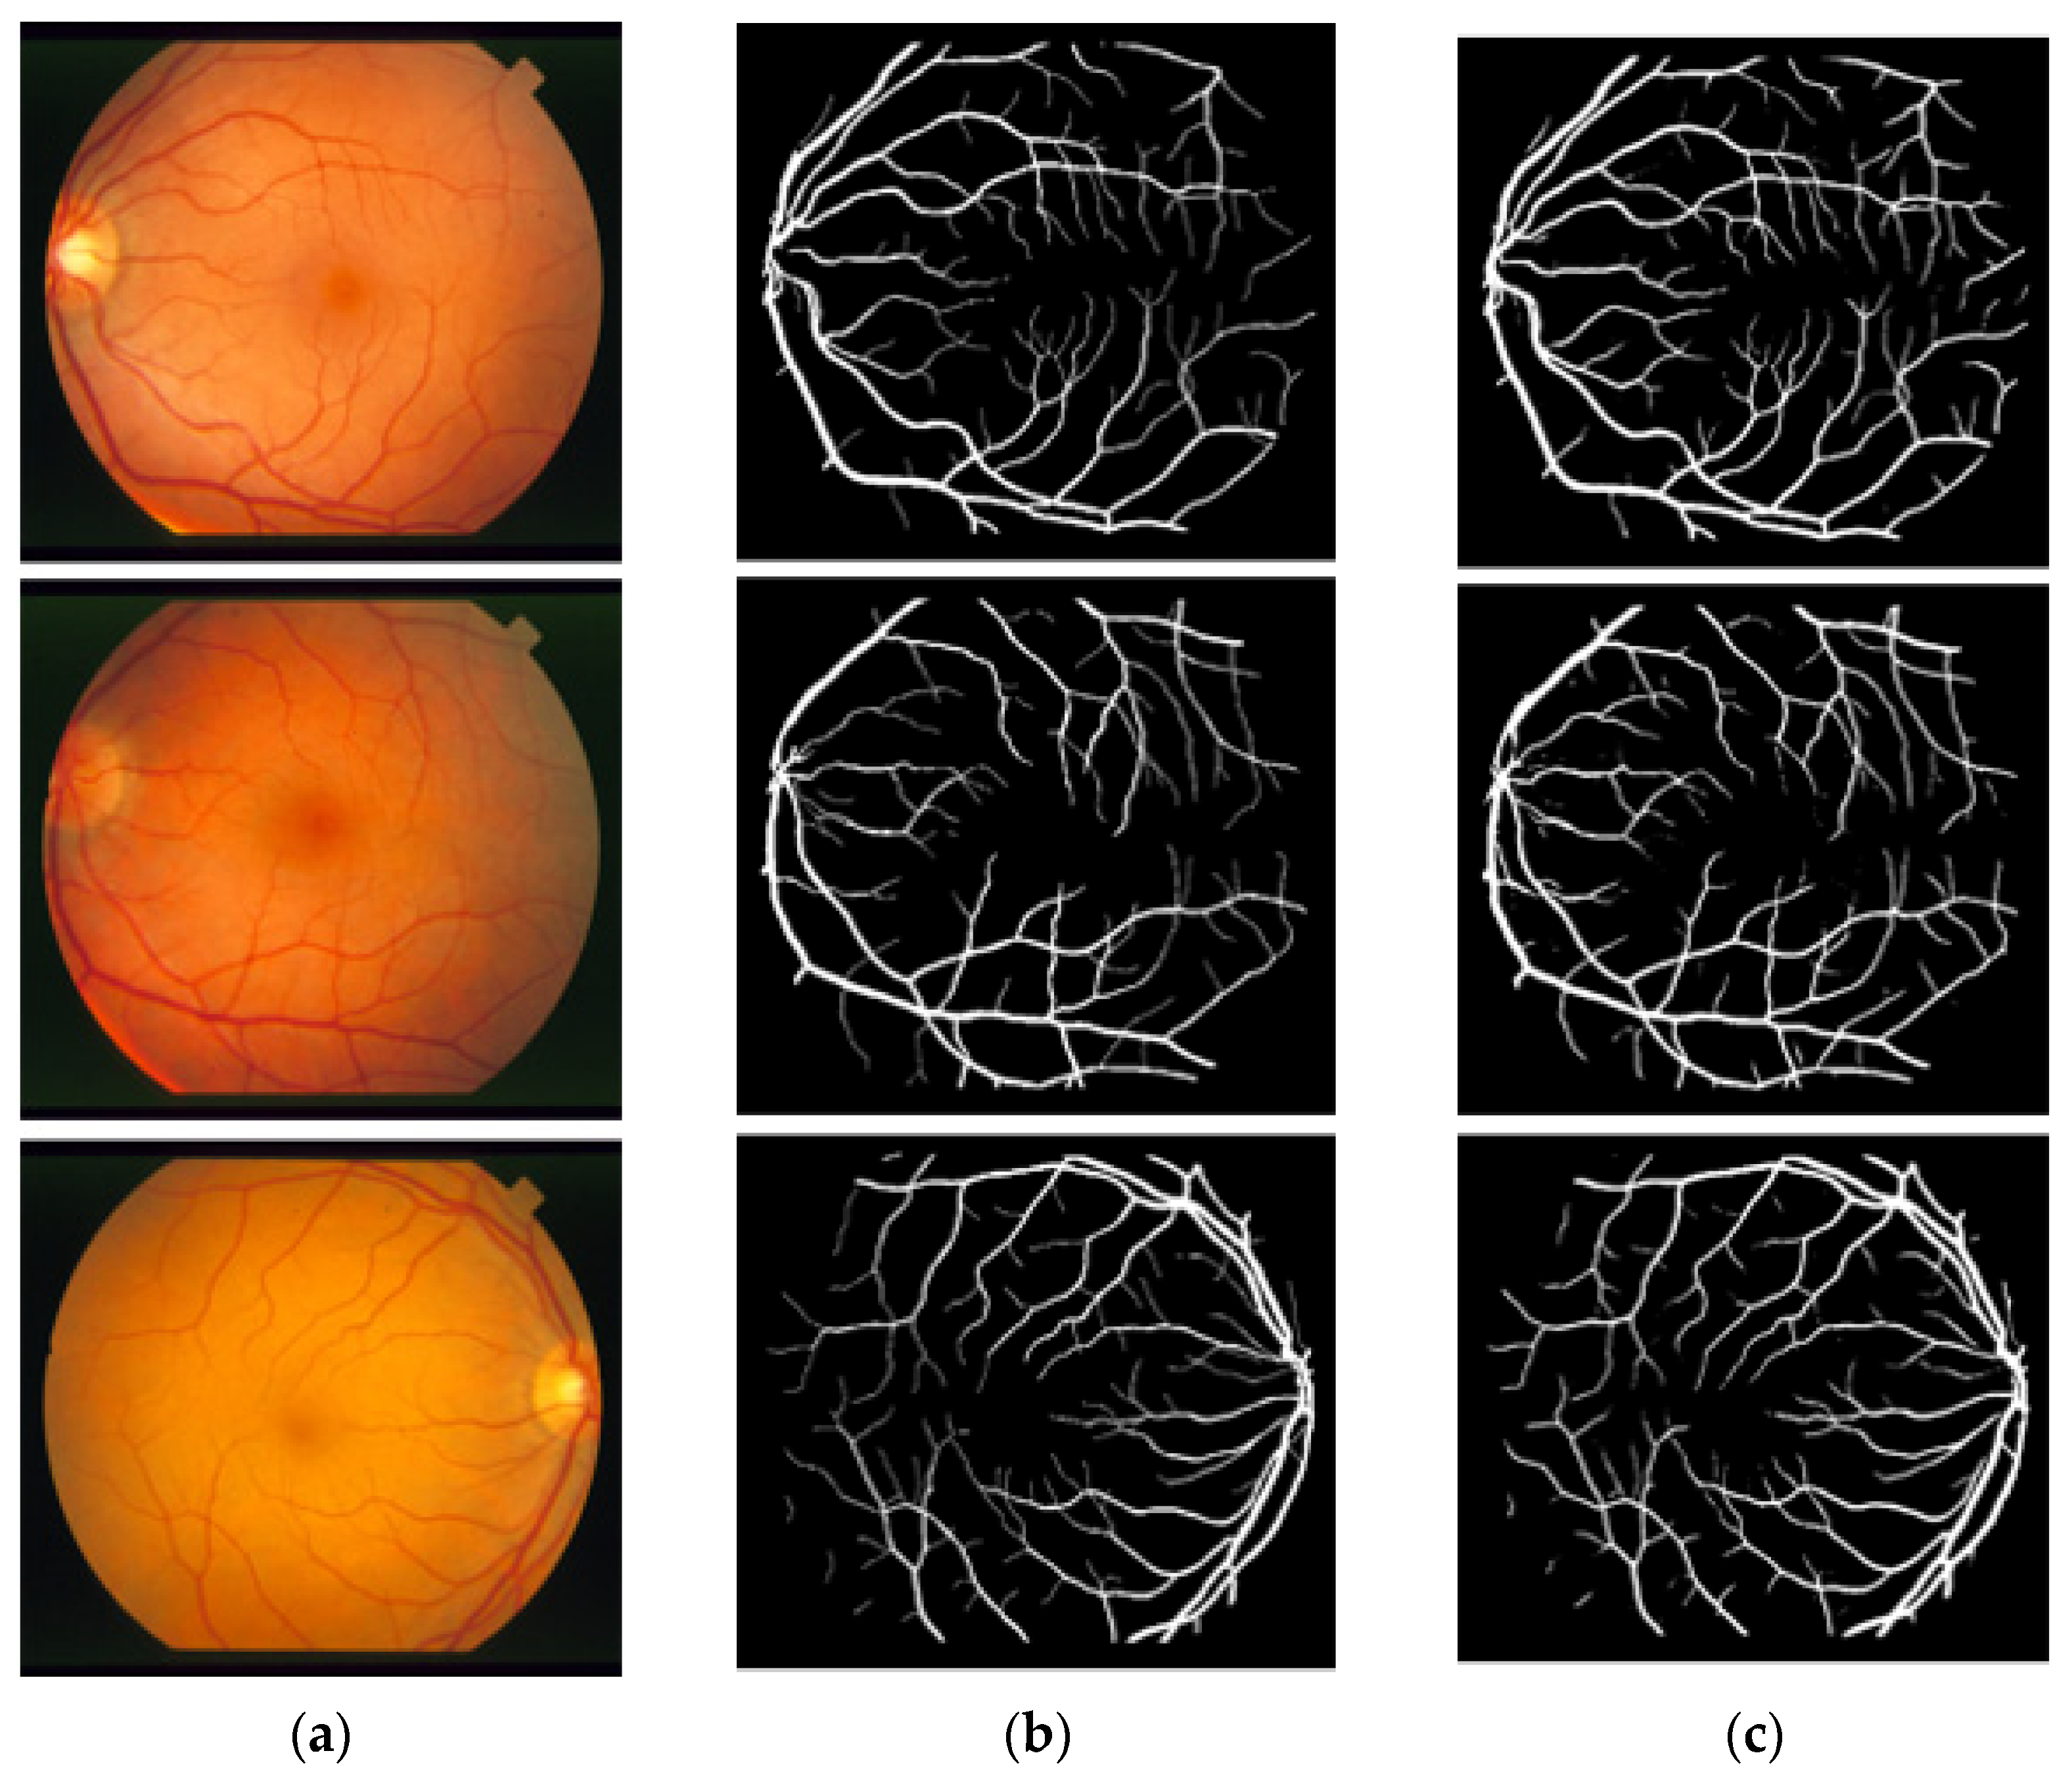
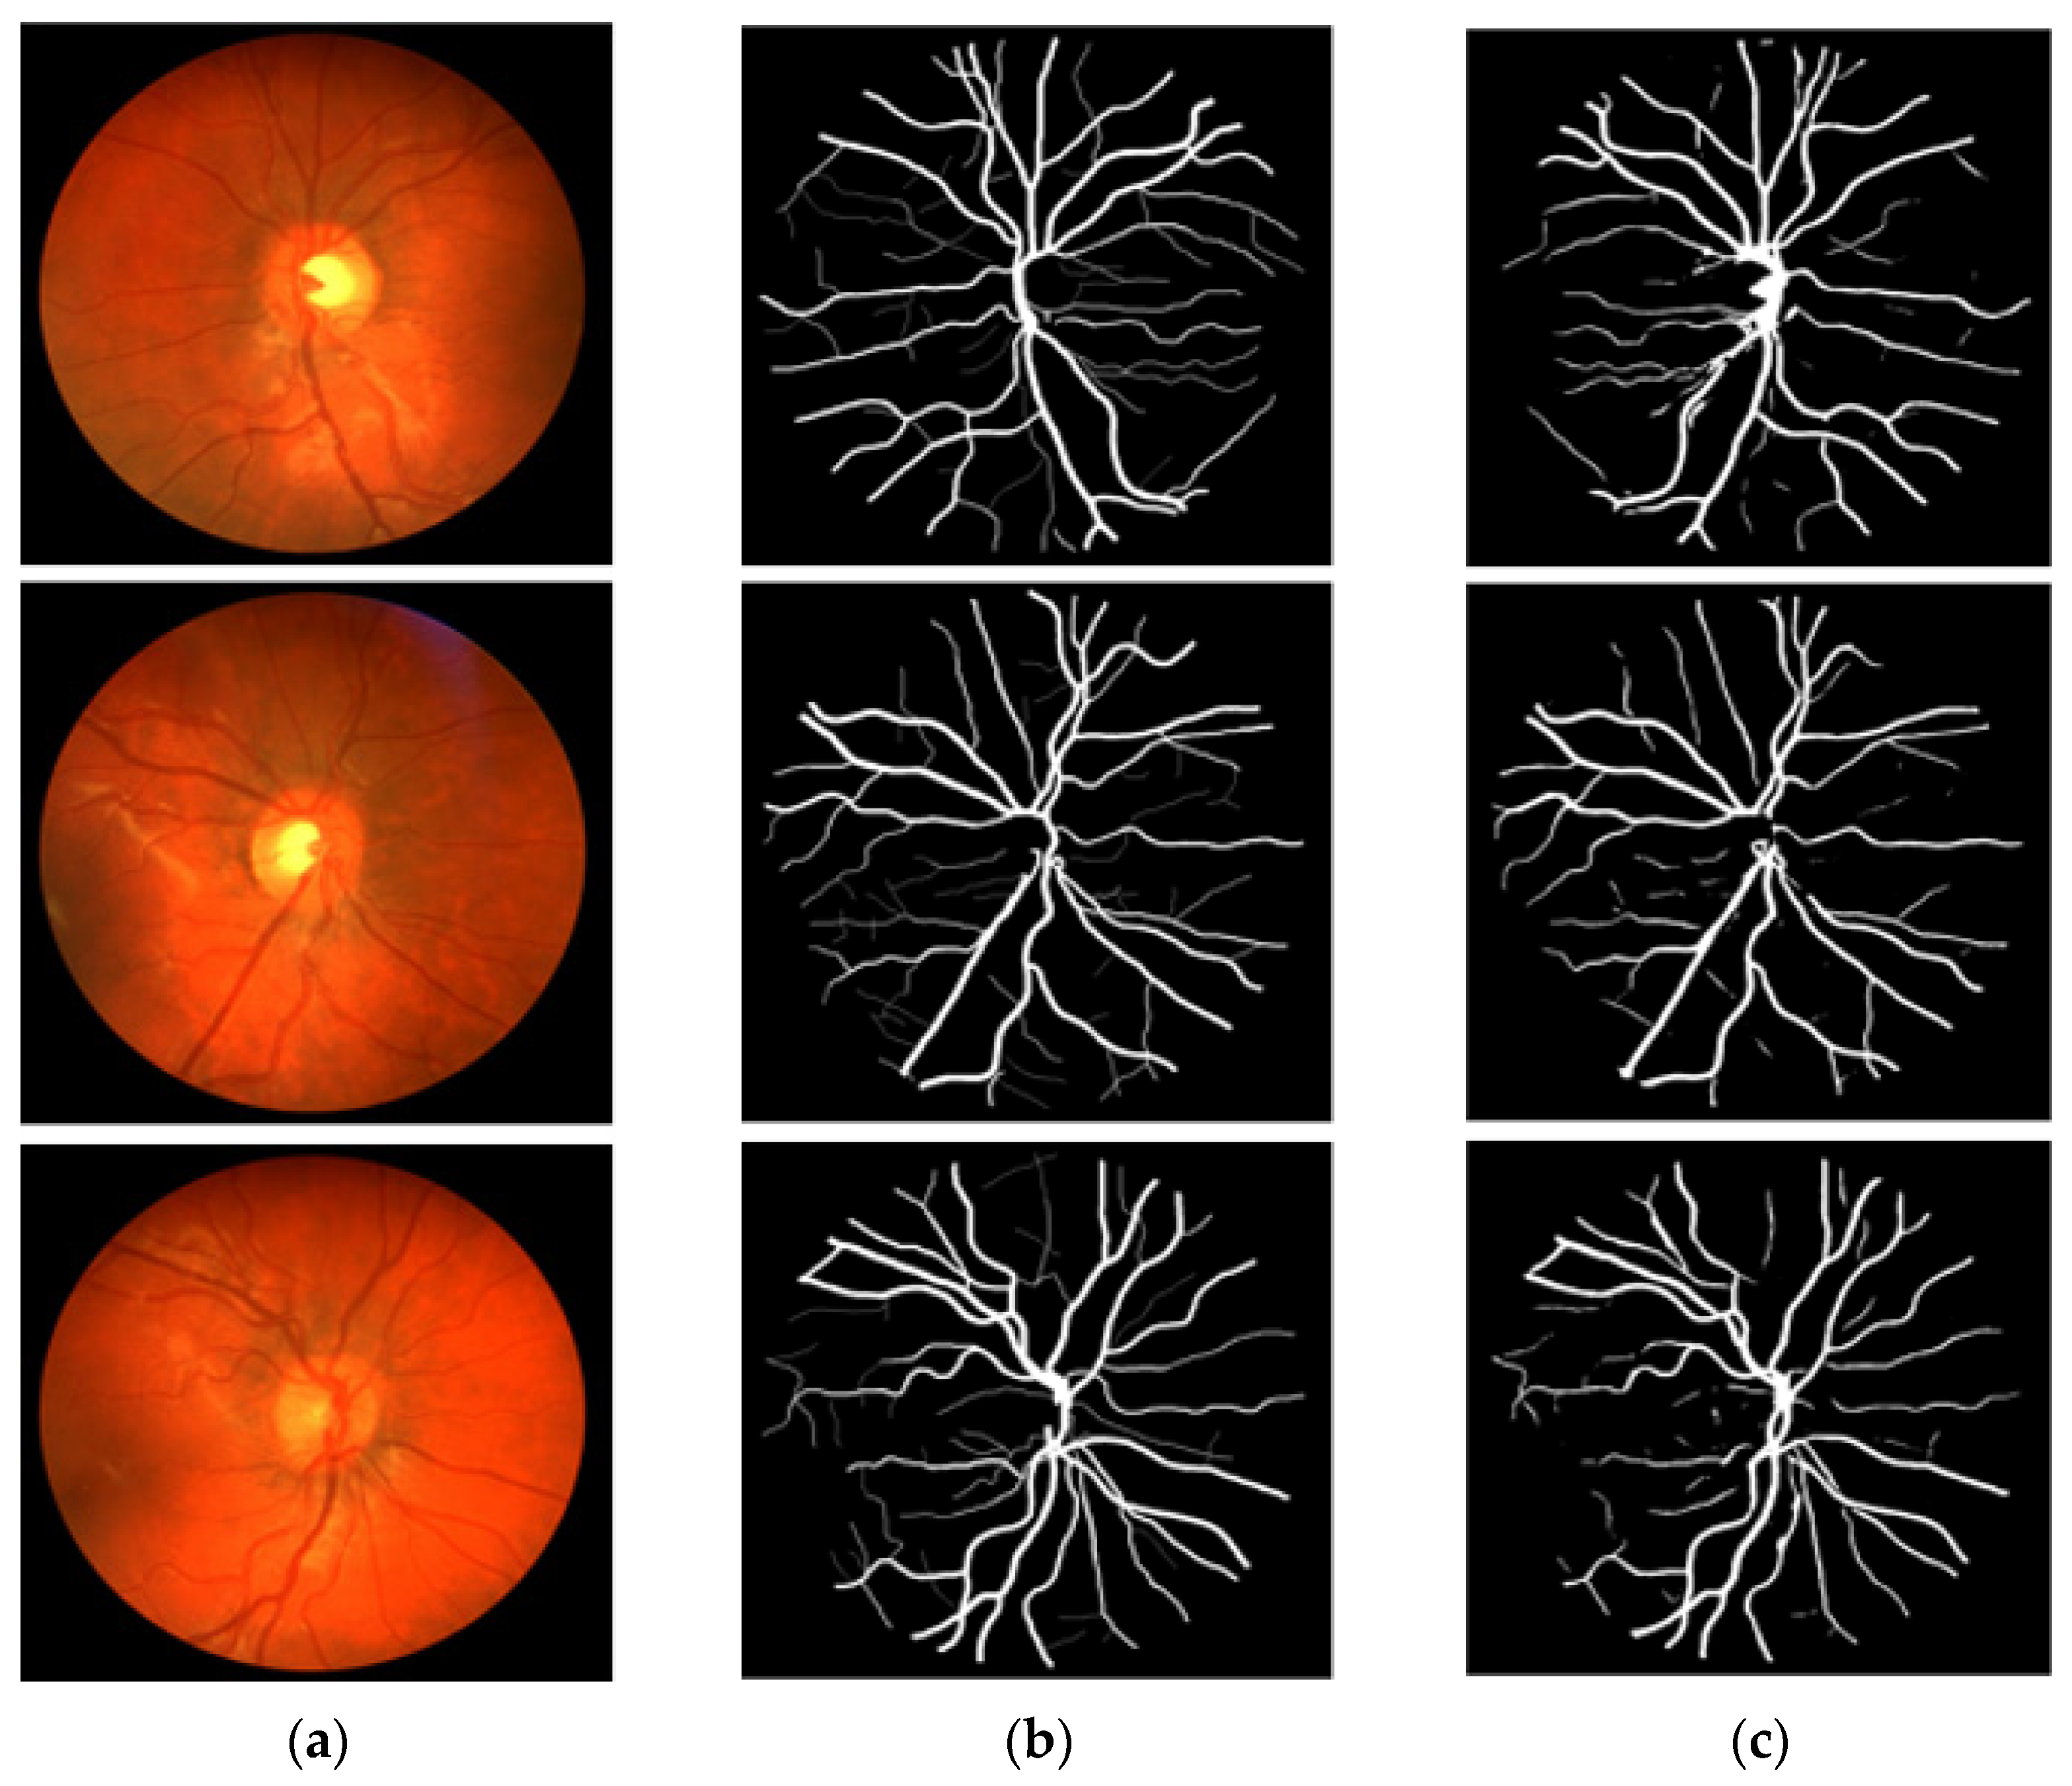
3.4. Visual Results of the Proposed Method for Vessel Segmentation
4. Discussion
4.1. Principal Findings
4.2. Limitations and Future Work
5. Conclusions
Supplementary Materials
Author Contributions
Funding
Institutional Review Board Statement
Informed Consent Statement
Data Availability Statement
Acknowledgments
Conflicts of Interest
References
- Kazeminia, S.; Baur, C.; Kuijper, A.; van Ginneken, B.; Navab, N.; Albarqouni, S.; Mukhopadhyay, A. GANs for Medical Image Analysis. Artif. Intell. Med. 2020, 109, 101938. [Google Scholar] [CrossRef]
- Mittal, K.; Rajam, V.M.A. Computerized Retinal Image Analysis—A Survey. Multimed. Tools Appl. 2020, 79, 22389–22421. [Google Scholar] [CrossRef]
- Badar, M.; Haris, M.; Fatima, A. Application of Deep Learning for Retinal Image Analysis: A Review. Comput. Sci. Rev. 2020, 35, 100203. [Google Scholar] [CrossRef]
- Lo Castro, D.; Tegolo, D.; Valenti, C. A Visual Framework to Create Photorealistic Retinal Vessels for Diagnosis Purposes. J. Biomed. Inform. 2020, 108, 103490. [Google Scholar] [CrossRef] [PubMed]
- Guo, S.; Yin, S.; Tse, G.; Li, G.; Su, L.; Liu, T. Association Between Caliber of Retinal Vessels and Cardiovascular Disease: A Systematic Review and Meta-Analysis. Curr. Atheroscler. Rep. 2020, 22, 16. [Google Scholar] [CrossRef]
- Tajbakhsh, N.; Jeyaseelan, L.; Li, Q.; Chiang, J.N.; Wu, Z.; Ding, X. Embracing Imperfect Datasets: A Review of Deep Learning Solutions for Medical Image Segmentation. Med. Image Anal. 2020, 63, 101693. [Google Scholar] [CrossRef] [Green Version]
- Fu, Q.; Li, S.; Wang, X. MSCNN-AM: A Multi-Scale Convolutional Neural Network with Attention Mechanisms for Retinal Vessel Segmentation. IEEE Access 2020, 8, 163926–163936. [Google Scholar] [CrossRef]
- Guo, Y.; Peng, Y. BSCN: Bidirectional Symmetric Cascade Network for Retinal Vessel Segmentation. BMC Med. Imaging 2020, 20, 20. [Google Scholar] [CrossRef] [PubMed] [Green Version]
- Miri, M.; Amini, Z.; Rabbani, H.; Kafieh, R. A Comprehensive Study of Retinal Vessel Classification Methods in Fundus Images. J. Med. Signals Sens. 2017, 7, 59–70. [Google Scholar]
- Sharif, M.; Shah, J.H. Automatic Screening of Retinal Lesions for Grading Diabetic Retinopathy. Int. Arab J. Inf. Technol. 2019, 122, 766–774. [Google Scholar]
- Alyoubi, W.L.; Shalash, W.M.; Abulkhair, M.F. Diabetic Retinopathy Detection through Deep Learning Techniques: A Review. Inform. Med. Unlocked 2020, 20, 100377. [Google Scholar] [CrossRef]
- Dai, W.; Dong, N.; Wang, Z.; Liang, X.; Zhang, H.; Xing, E.P. SCAN: Structure Correcting Adversarial Network for Organ Segmentation in Chest X-Rays. In Proceedings of the Deep Learning in Medical Image Analysis and Multimodal Learning for Clinical Decision Support, Granada, Spain, 20 September 2018; pp. 263–273. [Google Scholar]
- Kim, Y.D.; Noh, K.J.; Byun, S.J.; Lee, S.; Kim, T.; Sunwoo, L.; Lee, K.J.; Kang, S.-H.; Park, K.H.; Park, S.J. Effects of Hypertension, Diabetes, and Smoking on Age and Sex Prediction from Retinal Fundus Images. Sci. Rep. 2020, 10, 4623. [Google Scholar] [CrossRef]
- Saghiri, M.A.; Suscha, A.; Wang, S.; Saghiri, A.M.; Sorenson, C.M.; Sheibani, N. Noninvasive Temporal Detection of Early Retinal Vascular Changes during Diabetes. Sci. Rep. 2020, 10, 17370. [Google Scholar] [CrossRef] [PubMed]
- Arsalan, M.; Owais, M.; Mahmood, T.; Choi, J.; Park, K.R. Artificial Intelligence-Based Diagnosis of Cardiac and Related Diseases. J. Clin. Med. 2020, 9, 871. [Google Scholar] [CrossRef] [PubMed] [Green Version]
- Owais, M.; Arsalan, M.; Mahmood, T.; Kang, J.K.; Park, K.R. Automated Diagnosis of Various Gastrointestinal Lesions Using a Deep Learning-Based Classification and Retrieval Framework with a Large Endoscopic Database: Model Development and Validation. J. Med. Int. Res. 2020, 22, e18563. [Google Scholar] [CrossRef] [PubMed]
- Arsalan, M.; Baek, N.R.; Owais, M.; Mahmood, T.; Park, K.R. Deep Learning-Based Detection of Pigment Signs for Analysis and Diagnosis of Retinitis Pigmentosa. Sensors 2020, 20, 3454. [Google Scholar] [CrossRef] [PubMed]
- Mahmood, T.; Arsalan, M.; Owais, M.; Lee, M.B.; Park, K.R. Artificial Intelligence-Based Mitosis Detection in Breast Cancer Histopathology Images Using Faster R-CNN and Deep CNNs. J. Clin. Med. 2020, 9, 749. [Google Scholar] [CrossRef] [Green Version]
- Sengupta, S.; Singh, A.; Leopold, H.A.; Gulati, T.; Lakshminarayanan, V. Ophthalmic Diagnosis Using Deep Learning with Fundus Images—A Critical Review. Artif. Intell. Med. 2020, 102, 101758. [Google Scholar] [CrossRef]
- Arsalan, M.; Owais, M.; Mahmood, T.; Cho, S.W.; Park, K.R. Aiding the Diagnosis of Diabetic and Hypertensive Retinopathy Using Artificial Intelligence-Based Semantic Segmentation. J. Clin. Med. 2019, 8, 1446. [Google Scholar] [CrossRef] [Green Version]
- Lal, S.; Rehman, S.U.; Shah, J.H.; Meraj, T.; Rauf, H.T.; Damaševičius, R.; Mohammed, M.A.; Abdulkareem, K.H. Adversarial Attack and Defence through Adversarial Training and Feature Fusion for Diabetic Retinopathy Recognition. Sensors 2021, 21, 3922. [Google Scholar] [CrossRef]
- Tsiknakis, N.; Theodoropoulos, D.; Manikis, G.; Ktistakis, E.; Boutsora, O.; Berto, A.; Scarpa, F.; Scarpa, A.; Fotiadis, D.I.; Marias, K. Deep Learning for Diabetic Retinopathy Detection and Classification Based on Fundus Images: A Review. Comput. Biol. Med. 2021, 135, 104599. [Google Scholar] [CrossRef] [PubMed]
- Naveed, K.; Abdullah, F.; Madni, H.A.; Khan, M.A.U.; Khan, T.M.; Naqvi, S.S. Towards Automated Eye Diagnosis: An Improved Retinal Vessel Segmentation Framework Using Ensemble Block Matching 3D Filter. Diagnostics 2021, 11, 114. [Google Scholar] [CrossRef]
- DSF-Net and DSA-Net Models. Available online: http://dm.dgu.edu/link.html (accessed on 16 May 2020).
- Staal, J.; Abramoff, M.D.; Niemeijer, M.; Viergever, M.A.; van Ginneken, B. Ridge-Based Vessel Segmentation in Color Images of the Retina. IEEE Trans. Med. Imaging 2004, 23, 501–509. [Google Scholar] [CrossRef]
- Hoover, A.; Kouznetsova, V.; Goldbaum, M. Locating Blood Vessels in Retinal Images by Piece-Wise Threshold Probing of a Matched Filter Response. IEEE Trans. Med. Imaging 2000, 19, 203–210. [Google Scholar] [CrossRef] [PubMed] [Green Version]
- Fraz, M.M.; Remagnino, P.; Hoppe, A.; Uyyanonvara, B.; Rudnicka, A.R.; Owen, C.G.; Barman, S.A. An Ensemble Classification-Based Approach Applied to Retinal Blood Vessel Segmentation. IEEE Trans. Biomed. Eng. 2012, 59, 2538–2548. [Google Scholar] [CrossRef] [PubMed]
- Badrinarayanan, V.; Kendall, A.; Cipolla, R. SegNet: A Deep Convolutional Encoder-Decoder Architecture for Image Segmentation. IEEE Trans. Pattern Anal. Mach. Intell. 2017, 39, 2481–2495. [Google Scholar] [CrossRef]
- Ronneberger, O.; Fischer, P.; Brox, T. U-Net: Convolutional Networks for Biomedical Image Segmentation. In Proceedings of the Medical Image Computing and Computer-Assisted Intervention, Munich, Germany, 5–9 October 2015; pp. 234–241. [Google Scholar]
- Singh, P.; Raj, P.; Namboodiri, V.P. EDS Pooling Layer. Image Vis. Comput. 2020, 98, 103923. [Google Scholar] [CrossRef]
- Sudre, C.H.; Li, W.; Vercauteren, T.; Ourselin, S.; Jorge Cardoso, M. Generalised Dice Overlap as a Deep Learning Loss Function for Highly Unbalanced Segmentations. In Proceedings of the Deep Learning in Medical Image Analysis and Multimodal Learning for Clinical Decision Support, Québec City, QC, Canada, 14 September 2017; pp. 240–248. [Google Scholar]
- Crum, W.R.; Camara, O.; Hill, D.L.G. Generalized Overlap Measures for Evaluation and Validation in Medical Image Analysis. IEEE Trans. Med. Imaging 2006, 25, 1451–1461. [Google Scholar] [CrossRef]
- Kingma, D.P.; Ba, J. Adam: A Method for Stochastic Optimization. In Proceedings of the International Conference for Learning Representations, San Diego, CA, USA, 7–9 May 2015; pp. 1–15. [Google Scholar]
- Islam, M.M.; Yang, H.-C.; Poly, T.N.; Jian, W.-S.; Li, Y.-C.J. Deep Learning Algorithms for Detection of Diabetic Retinopathy in Retinal Fundus Photographs: A Systematic Review and Meta-Analysis. Comput. Methods Progr. Biomed. 2020, 191, 105320. [Google Scholar] [CrossRef]
- Lv, Y.; Ma, H.; Li, J.; Liu, S. Attention Guided U-Net with Atrous Convolution for Accurate Retinal Vessels Segmentation. IEEE Access 2020, 8, 32826–32839. [Google Scholar] [CrossRef]
- Samuel, P.M.; Veeramalai, T. VSSC Net: Vessel Specific Skip Chain Convolutional Network for Blood Vessel Segmentation. Comput. Methods Progr. Biomed. 2021, 198, 105769. [Google Scholar] [CrossRef]
- Soomro, T.A.; Afifi, A.J.; Gao, J.; Hellwich, O.; Khan, M.A.U.; Paul, M.; Zheng, L. Boosting Sensitivity of a Retinal Vessel Segmentation Algorithm with Convolutional Neural Network. In Proceedings of the International Conference on Digital Image Computing: Techniques and Applications, Sydney, NSW, Australia, 29 November–1 December 2017; pp. 1–8. [Google Scholar]
- Livingston, E.H. Who Was Student and Why Do We Care so Much about His T-Test? J. Surg. Res. 2004, 118, 58–65. [Google Scholar] [CrossRef] [PubMed]
- Zhu, C.; Zou, B.; Zhao, R.; Cui, J.; Duan, X.; Chen, Z.; Liang, Y. Retinal Vessel Segmentation in Colour Fundus Images Using Extreme Learning Machine. Comput. Med. Imaging Graph. 2017, 55, 68–77. [Google Scholar] [CrossRef] [PubMed]
- Jin, Q.; Meng, Z.; Pham, T.D.; Chen, Q.; Wei, L.; Su, R. DUNet: A Deformable Network for Retinal Vessel Segmentation. Knowl.-Based Syst. 2019, 178, 149–162. [Google Scholar] [CrossRef] [Green Version]
- Selvaraju, R.R.; Cogswell, M.; Das, A.; Vedantam, R.; Parikh, D.; Batra, D. Grad-CAM: Visual Explanations from Deep Networks via Gradient-Based Localization. In Proceedings of the IEEE International Conference on Computer Vision, Venice, Italy, 22–29 October 2017; pp. 618–626. [Google Scholar]
- Zhang, J.; Chen, Y.; Bekkers, E.; Wang, M.; Dashtbozorg, B.; ter Haar Romeny, B.M. Retinal Vessel Delineation Using a Brain-Inspired Wavelet Transform and Random Forest. Pattern Recognit. 2017, 69, 107–123. [Google Scholar] [CrossRef]
- Tan, J.H.; Acharya, U.R.; Bhandary, S.V.; Chua, K.C.; Sivaprasad, S. Segmentation of Optic Disc, Fovea and Retinal Vasculature Using a Single Convolutional Neural Network. J. Comput. Sci. 2017, 20, 70–79. [Google Scholar] [CrossRef] [Green Version]
- Girard, F.; Kavalec, C.; Cheriet, F. Joint Segmentation and Classification of Retinal Arteries/Veins from Fundus Images. Artif. Intell. Med. 2019, 94, 96–109. [Google Scholar] [CrossRef] [Green Version]
- Hu, K.; Zhang, Z.; Niu, X.; Zhang, Y.; Cao, C.; Xiao, F.; Gao, X. Retinal Vessel Segmentation of Color Fundus Images Using Multiscale Convolutional Neural Network with an Improved Cross-Entropy Loss Function. Neurocomputing 2018, 309, 179–191. [Google Scholar] [CrossRef]
- Fu, H.; Xu, Y.; Lin, S.; Kee Wong, D.W.; Liu, J. DeepVessel: Retinal Vessel Segmentation via Deep Learning and Conditional Random Field. In Proceedings of the International Conference on Medical Image Computing and Computer-Assisted Intervention, Athens, Greece, 17–21 October 2016; pp. 132–139. [Google Scholar]
- Wang, X.; Jiang, X.; Ren, J. Blood Vessel Segmentation from Fundus Image by a Cascade Classification Framework. Pattern Recognit. 2019, 88, 331–341. [Google Scholar] [CrossRef]
- Chudzik, P.; Al-Diri, B.; Calivá, F.; Hunter, A. DISCERN: Generative Framework for Vessel Segmentation Using Convolutional Neural Network and Visual Codebook. In Proceedings of the 40th Annual International Conference of the IEEE Engineering in Medicine and Biology Society, Honolulu, HI, USA, 18–21 July 2018; pp. 5934–5937. [Google Scholar]
- Yan, Z.; Yang, X.; Cheng, K.T. A Three-Stage Deep Learning Model for Accurate Retinal Vessel Segmentation. IEEE J. Biomed. Health Inform. 2018, 23, 1427–1436. [Google Scholar] [CrossRef]
- Soomro, T.A.; Hellwich, O.; Afifi, A.J.; Paul, M.; Gao, J.; Zheng, L. Strided U-Net Model: Retinal Vessels Segmentation Using Dice Loss. In Proceedings of the Digital Image Computing: Techniques and Applications, Canberra, Australia, 10–13 December 2018; pp. 1–8. [Google Scholar]
- Leopold, H.A.; Orchard, J.; Zelek, J.S.; Lakshminarayanan, V. PixelBNN: Augmenting the PixelCNN with Batch Normalization and the Presentation of a Fast Architecture for Retinal Vessel Segmentation. J. Imaging 2019, 5, 26. [Google Scholar] [CrossRef] [Green Version]
- Wang, C.; Zhao, Z.; Ren, Q.; Xu, Y.; Yu, Y. Dense U-Net Based on Patch-Based Learning for Retinal Vessel Segmentation. Entropy 2019, 21, 168. [Google Scholar] [CrossRef] [PubMed] [Green Version]
- Feng, S.; Zhuo, Z.; Pan, D.; Tian, Q. CcNet: A Cross-Connected Convolutional Network for Segmenting Retinal Vessels Using Multi-Scale Features. Neurocomputing 2020, 392, 268–276. [Google Scholar] [CrossRef]
- Oliveira, A.; Pereira, S.; Silva, C.A. Retinal Vessel Segmentation Based on Fully Convolutional Neural Networks. Expert Syst. Appl. 2018, 112, 229–242. [Google Scholar] [CrossRef] [Green Version]
- Guo, S.; Wang, K.; Kang, H.; Zhang, Y.; Gao, Y.; Li, T. BTS-DSN: Deeply Supervised Neural Network with Short Connections for Retinal Vessel Segmentation. Int. J. Med. Inform. 2019, 126, 105–113. [Google Scholar] [CrossRef] [PubMed] [Green Version]
- Khan, T.M.; Naqvi, S.S.; Arsalan, M.; Khan, M.A.; Khan, H.A.; Haider, A. Exploiting Residual Edge Information in Deep Fully Convolutional Neural Networks for Retinal Vessel Segmentation. In Proceedings of the International Joint Conference on Neural Networks, Glasgow, UK, 19–24 July 2020; pp. 1–8. [Google Scholar]
- Kromm, C.; Rohr, K. Inception Capsule Network for Retinal Blood Vessel Segmentation and Centerline Extraction. In Proceedings of the IEEE 17th International Symposium on Biomedical Imaging, Iowa City, IA, USA, 3–7 April 2020; pp. 1223–1226. [Google Scholar]
- Li, X.; Jiang, Y.; Li, M.; Yin, S. Lightweight Attention Convolutional Neural Network for Retinal Vessel Segmentation. IEEE Trans. Ind. Inform. 2020, 17, 1958–1967. [Google Scholar] [CrossRef]
- Hajabdollahi, M.; Esfandiarpoor, R.; Najarian, K.; Karimi, N.; Samavi, S.; Reza-Soroushmeh, S.M. Low Complexity Convolutional Neural Network for Vessel Segmentation in Portable Retinal Diagnostic Devices. In Proceedings of the 25th IEEE International Conference on Image Processing, Athens, Greece, 7–10 October 2018; pp. 2785–2789. [Google Scholar]
- Smart, T.J.; Richards, C.J.; Bhatnagar, R.; Pavesio, C.; Agrawal, R.; Jones, P.H. A Study of Red Blood Cell Deformability in Diabetic Retinopathy Using Optical Tweezers. In Proceedings of the Optical Trapping and Optical Micromanipulation XII, San Diego, CA, USA, 9–13 August 2015; p. 954825. [Google Scholar]
- Laibacher, T.; Weyde, T.; Jalali, S. M2U-Net: Effective and Efficient Retinal Vessel Segmentation for Real-World Applications. In Proceedings of the IEEE/CVF Conference on Computer Vision and Pattern Recognition Workshops, Long Beach, CA, USA, 16–17 June 2019; pp. 115–124. [Google Scholar]


| Database | Total Images | Test | Train | Image with Pathology | Cross-Validation | No. of Experiments |
|---|---|---|---|---|---|---|
| DRIVE [25] | 40 | 20 | 20 | 7 | Train–test defined | 1 |
| STARE [26] | 20 | 1 | 19 | 10 | Leave-one-out | 20 |
| CHASE-DB1 [27] | 28 | 14 | 14 | - | Two-fold | 2 |
| Hyperparameters | Value |
|---|---|
| Initial learning rate | 0.0001 |
| Optimizer | Adam [33] |
| Epsilon | 0.000001 |
| Normalization | Global L2 normalization |
| Epochs | 35 |
| Iterations | 11,200 |
| Shuffling images | Each epoch |
| Method | Acc | SE | SP | AUC | Parameters | Model Size |
|---|---|---|---|---|---|---|
| DSF-Net (Proposed) | 96.93 | 81.94 | 98.38 | 98.30 | 1.5 M | 3.63 MB |
| DSA-Net (Proposed) | 96.93 | 82.68 | 98.30 | 98.42 | 1.5 M | 3.81 MB |
| Method | Acc | SE | SP | No. of 3 × 3 Convolutions | No. of Parameters (million) | Model Size |
|---|---|---|---|---|---|---|
| Vess-Net [20] | 96.55 | 80.22 | 98.10 | 16 | 9.7 | 36.6 MB |
| U-Net [29] ** | 96.78 | 81.34 | 98.27 | 18 | 31.03 | 70.9 MB |
| U-Net [35] | 95.54 | 78.49 | 98.02 | 18 | 31.03 | - |
| AA-UNet [35] | 95.58 | 79.41 | 97.98 | 16 | 28.25 | - |
| VSSC Net [36] | 96.27 | 78.27 | 98.21 | - | 8 | - |
| SegNet [37] | 94.8 | 74.6 | 91.7 | 26 | 29.46 | - |
| DSF-Net (Proposed) | 96.93 | 81.94 | 98.38 | 9 | 1.5 | 3.63 MB |
| DSA-Net (Proposed) | 96.93 | 82.68 | 98.30 | 9 | 1.5 | 3.81 MB |
Publisher’s Note: MDPI stays neutral with regard to jurisdictional claims in published maps and institutional affiliations. |
© 2021 by the authors. Licensee MDPI, Basel, Switzerland. This article is an open access article distributed under the terms and conditions of the Creative Commons Attribution (CC BY) license (https://creativecommons.org/licenses/by/4.0/).
Share and Cite
Arsalan, M.; Haider, A.; Choi, J.; Park, K.R. Diabetic and Hypertensive Retinopathy Screening in Fundus Images Using Artificially Intelligent Shallow Architectures. J. Pers. Med. 2022, 12, 7. https://0-doi-org.brum.beds.ac.uk/10.3390/jpm12010007
Arsalan M, Haider A, Choi J, Park KR. Diabetic and Hypertensive Retinopathy Screening in Fundus Images Using Artificially Intelligent Shallow Architectures. Journal of Personalized Medicine. 2022; 12(1):7. https://0-doi-org.brum.beds.ac.uk/10.3390/jpm12010007
Chicago/Turabian StyleArsalan, Muhammad, Adnan Haider, Jiho Choi, and Kang Ryoung Park. 2022. "Diabetic and Hypertensive Retinopathy Screening in Fundus Images Using Artificially Intelligent Shallow Architectures" Journal of Personalized Medicine 12, no. 1: 7. https://0-doi-org.brum.beds.ac.uk/10.3390/jpm12010007