
PhenGenVar: A User-Friendly Genetic Variant Detection and Visualization Tool for Precision Medicine

 ,
,  , and
, and 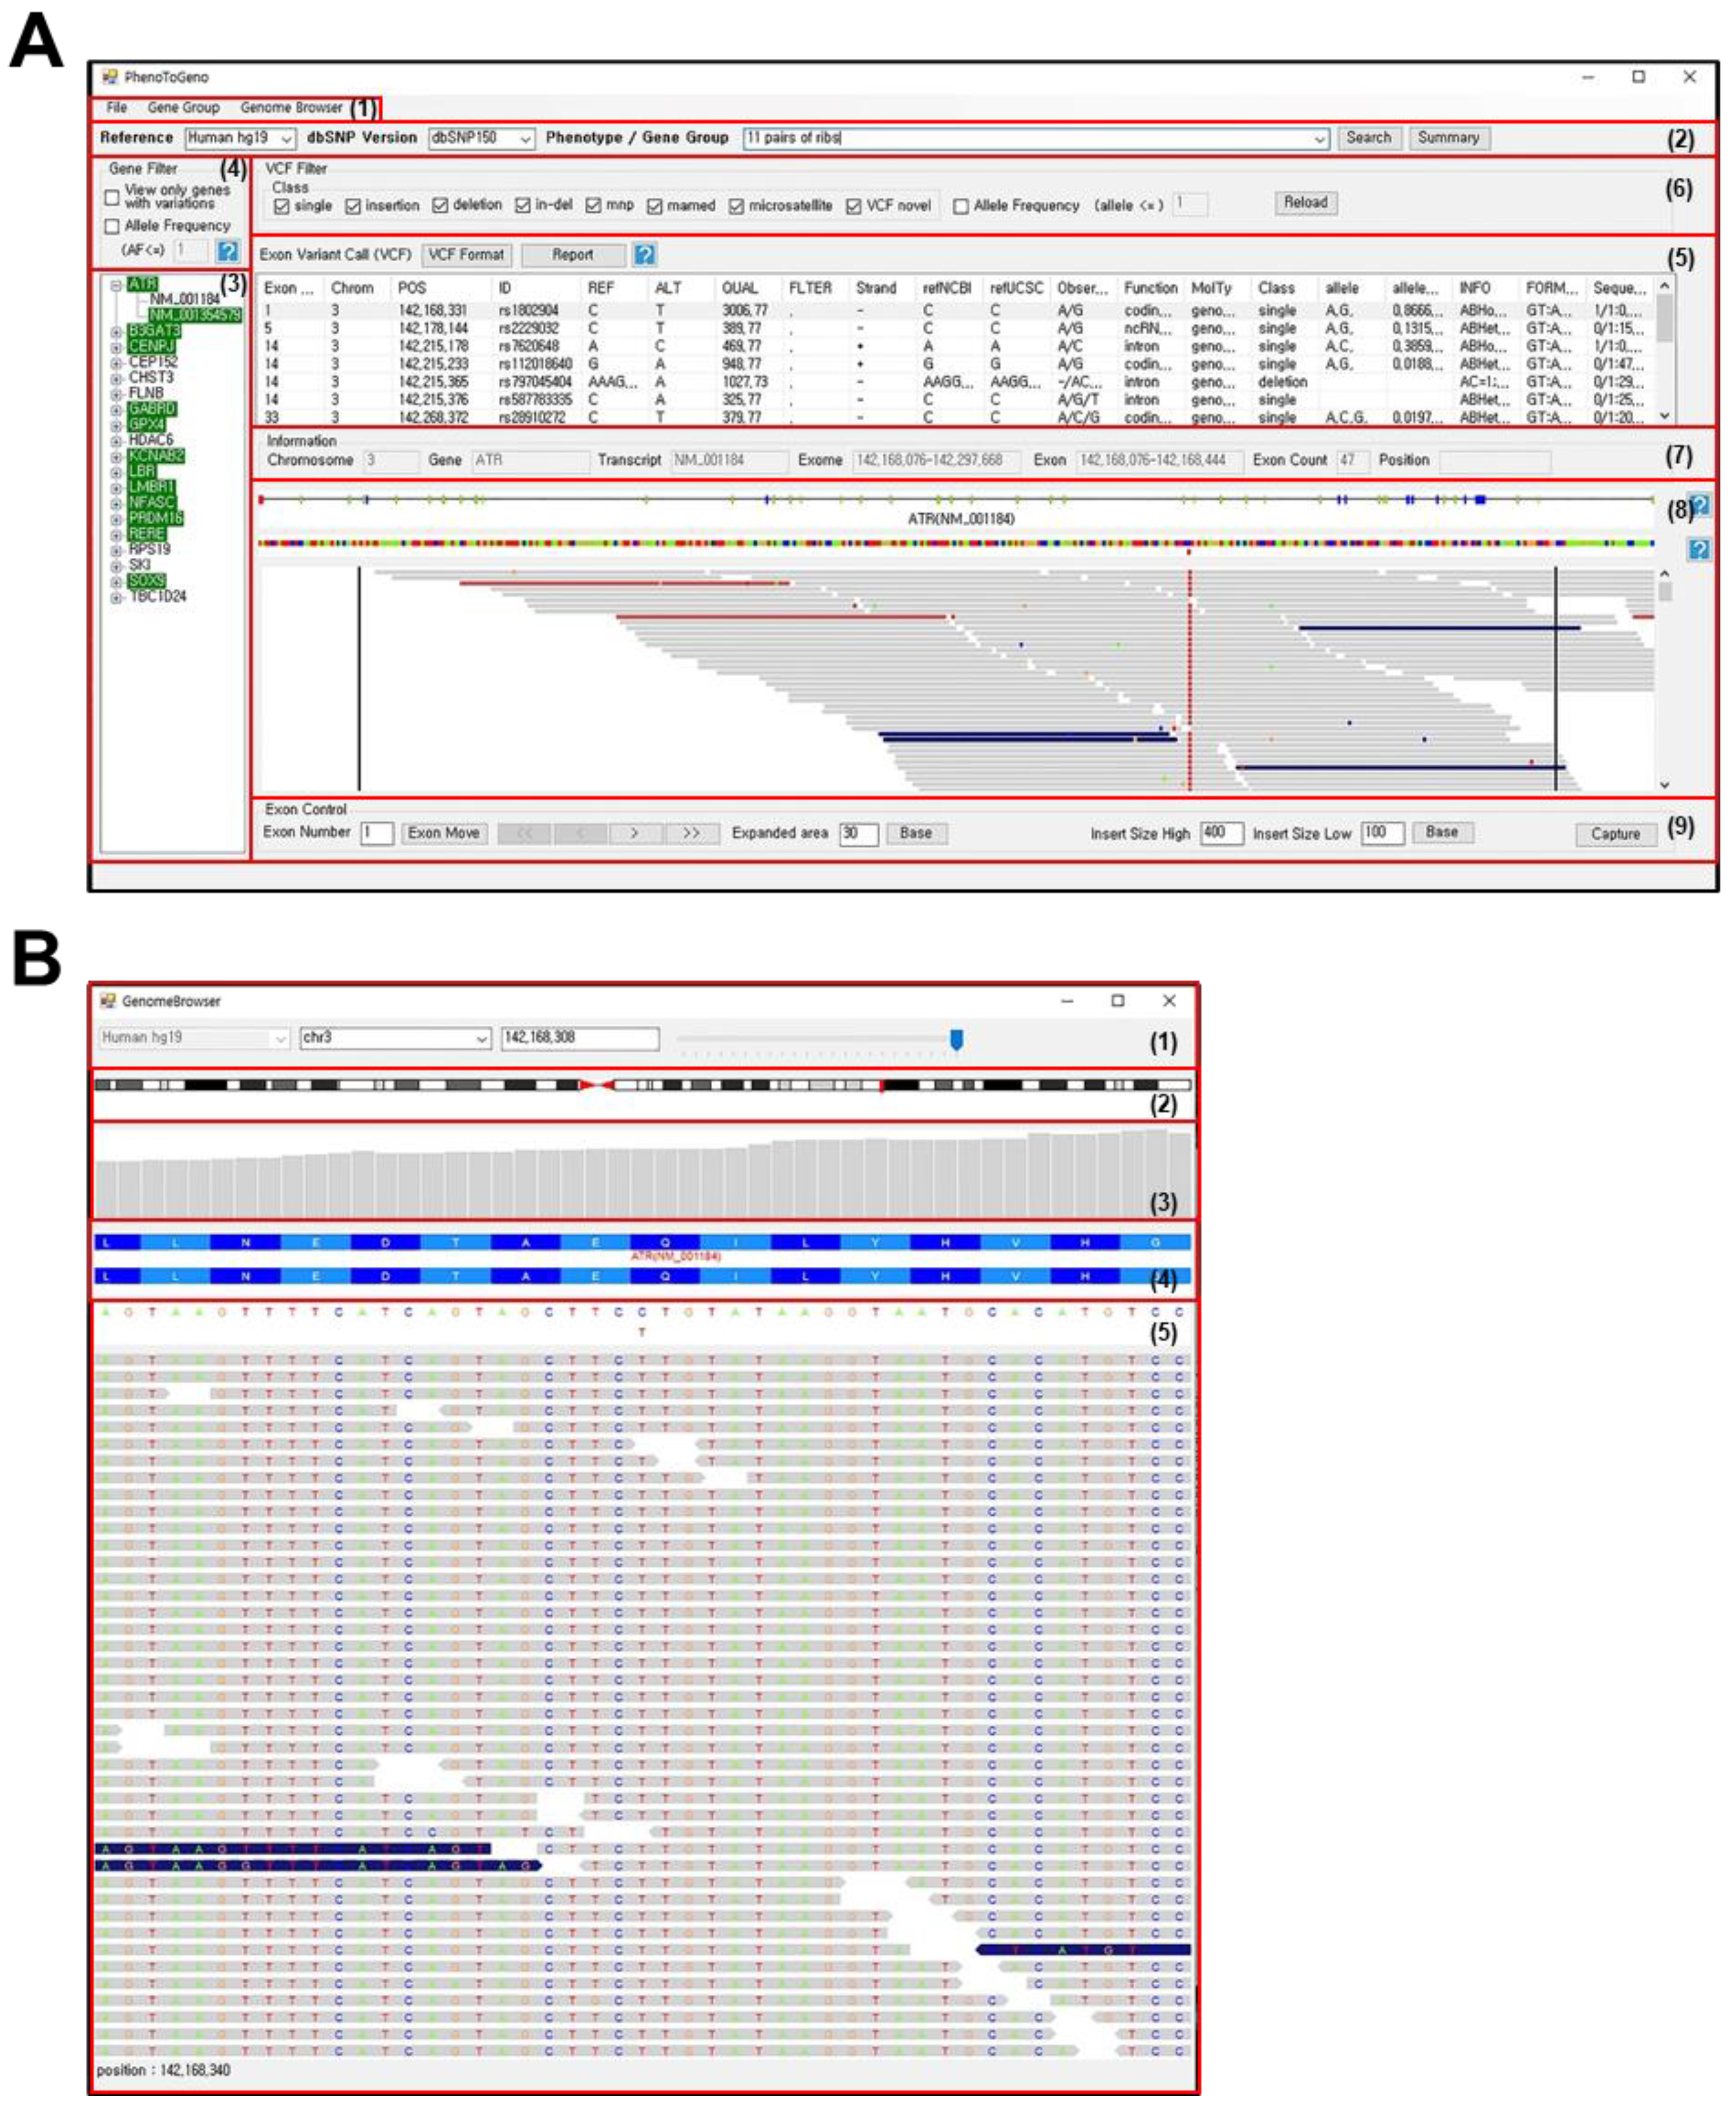
Abstract
:1. Introduction
2. Materials and Methods
2.1. Development of Visual Interface for PhenGenVar Browser
2.2. Database Embedded in the PhenGenVar Application
2.3. Sample Data Used in This Study
2.4. Implementation
3. Results
3.1. Development of a PhenGenVar Browser Application
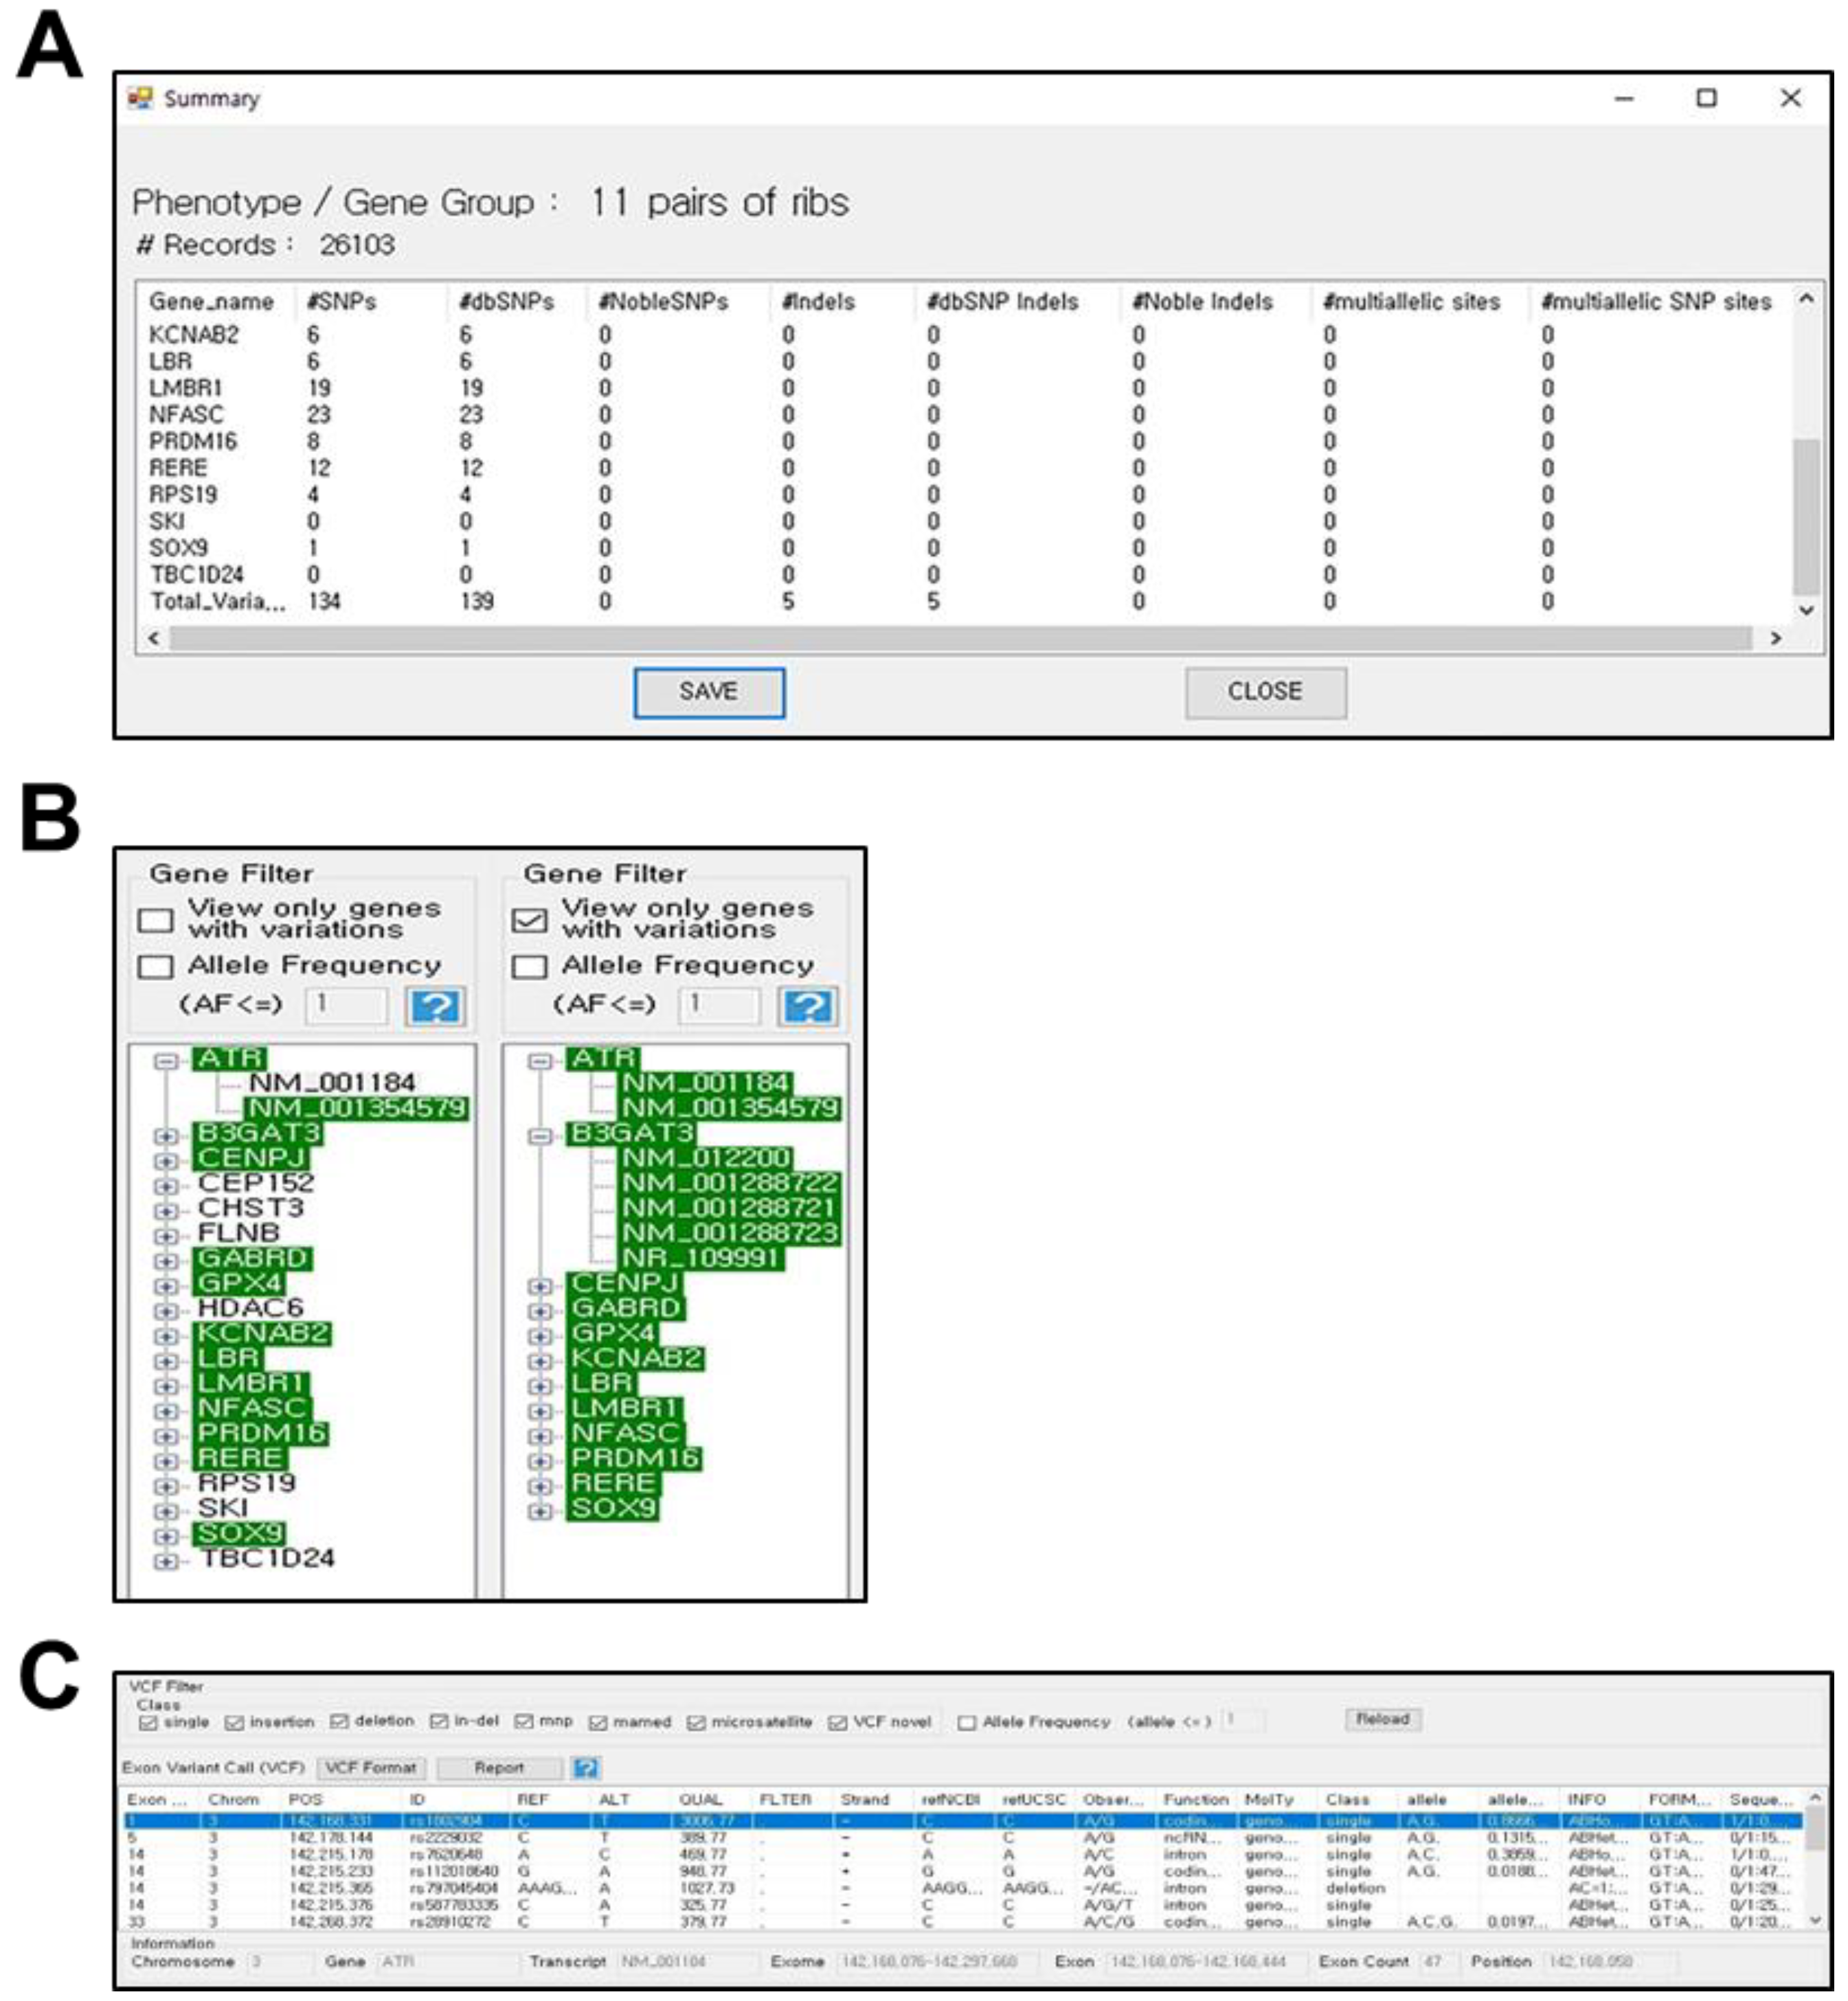
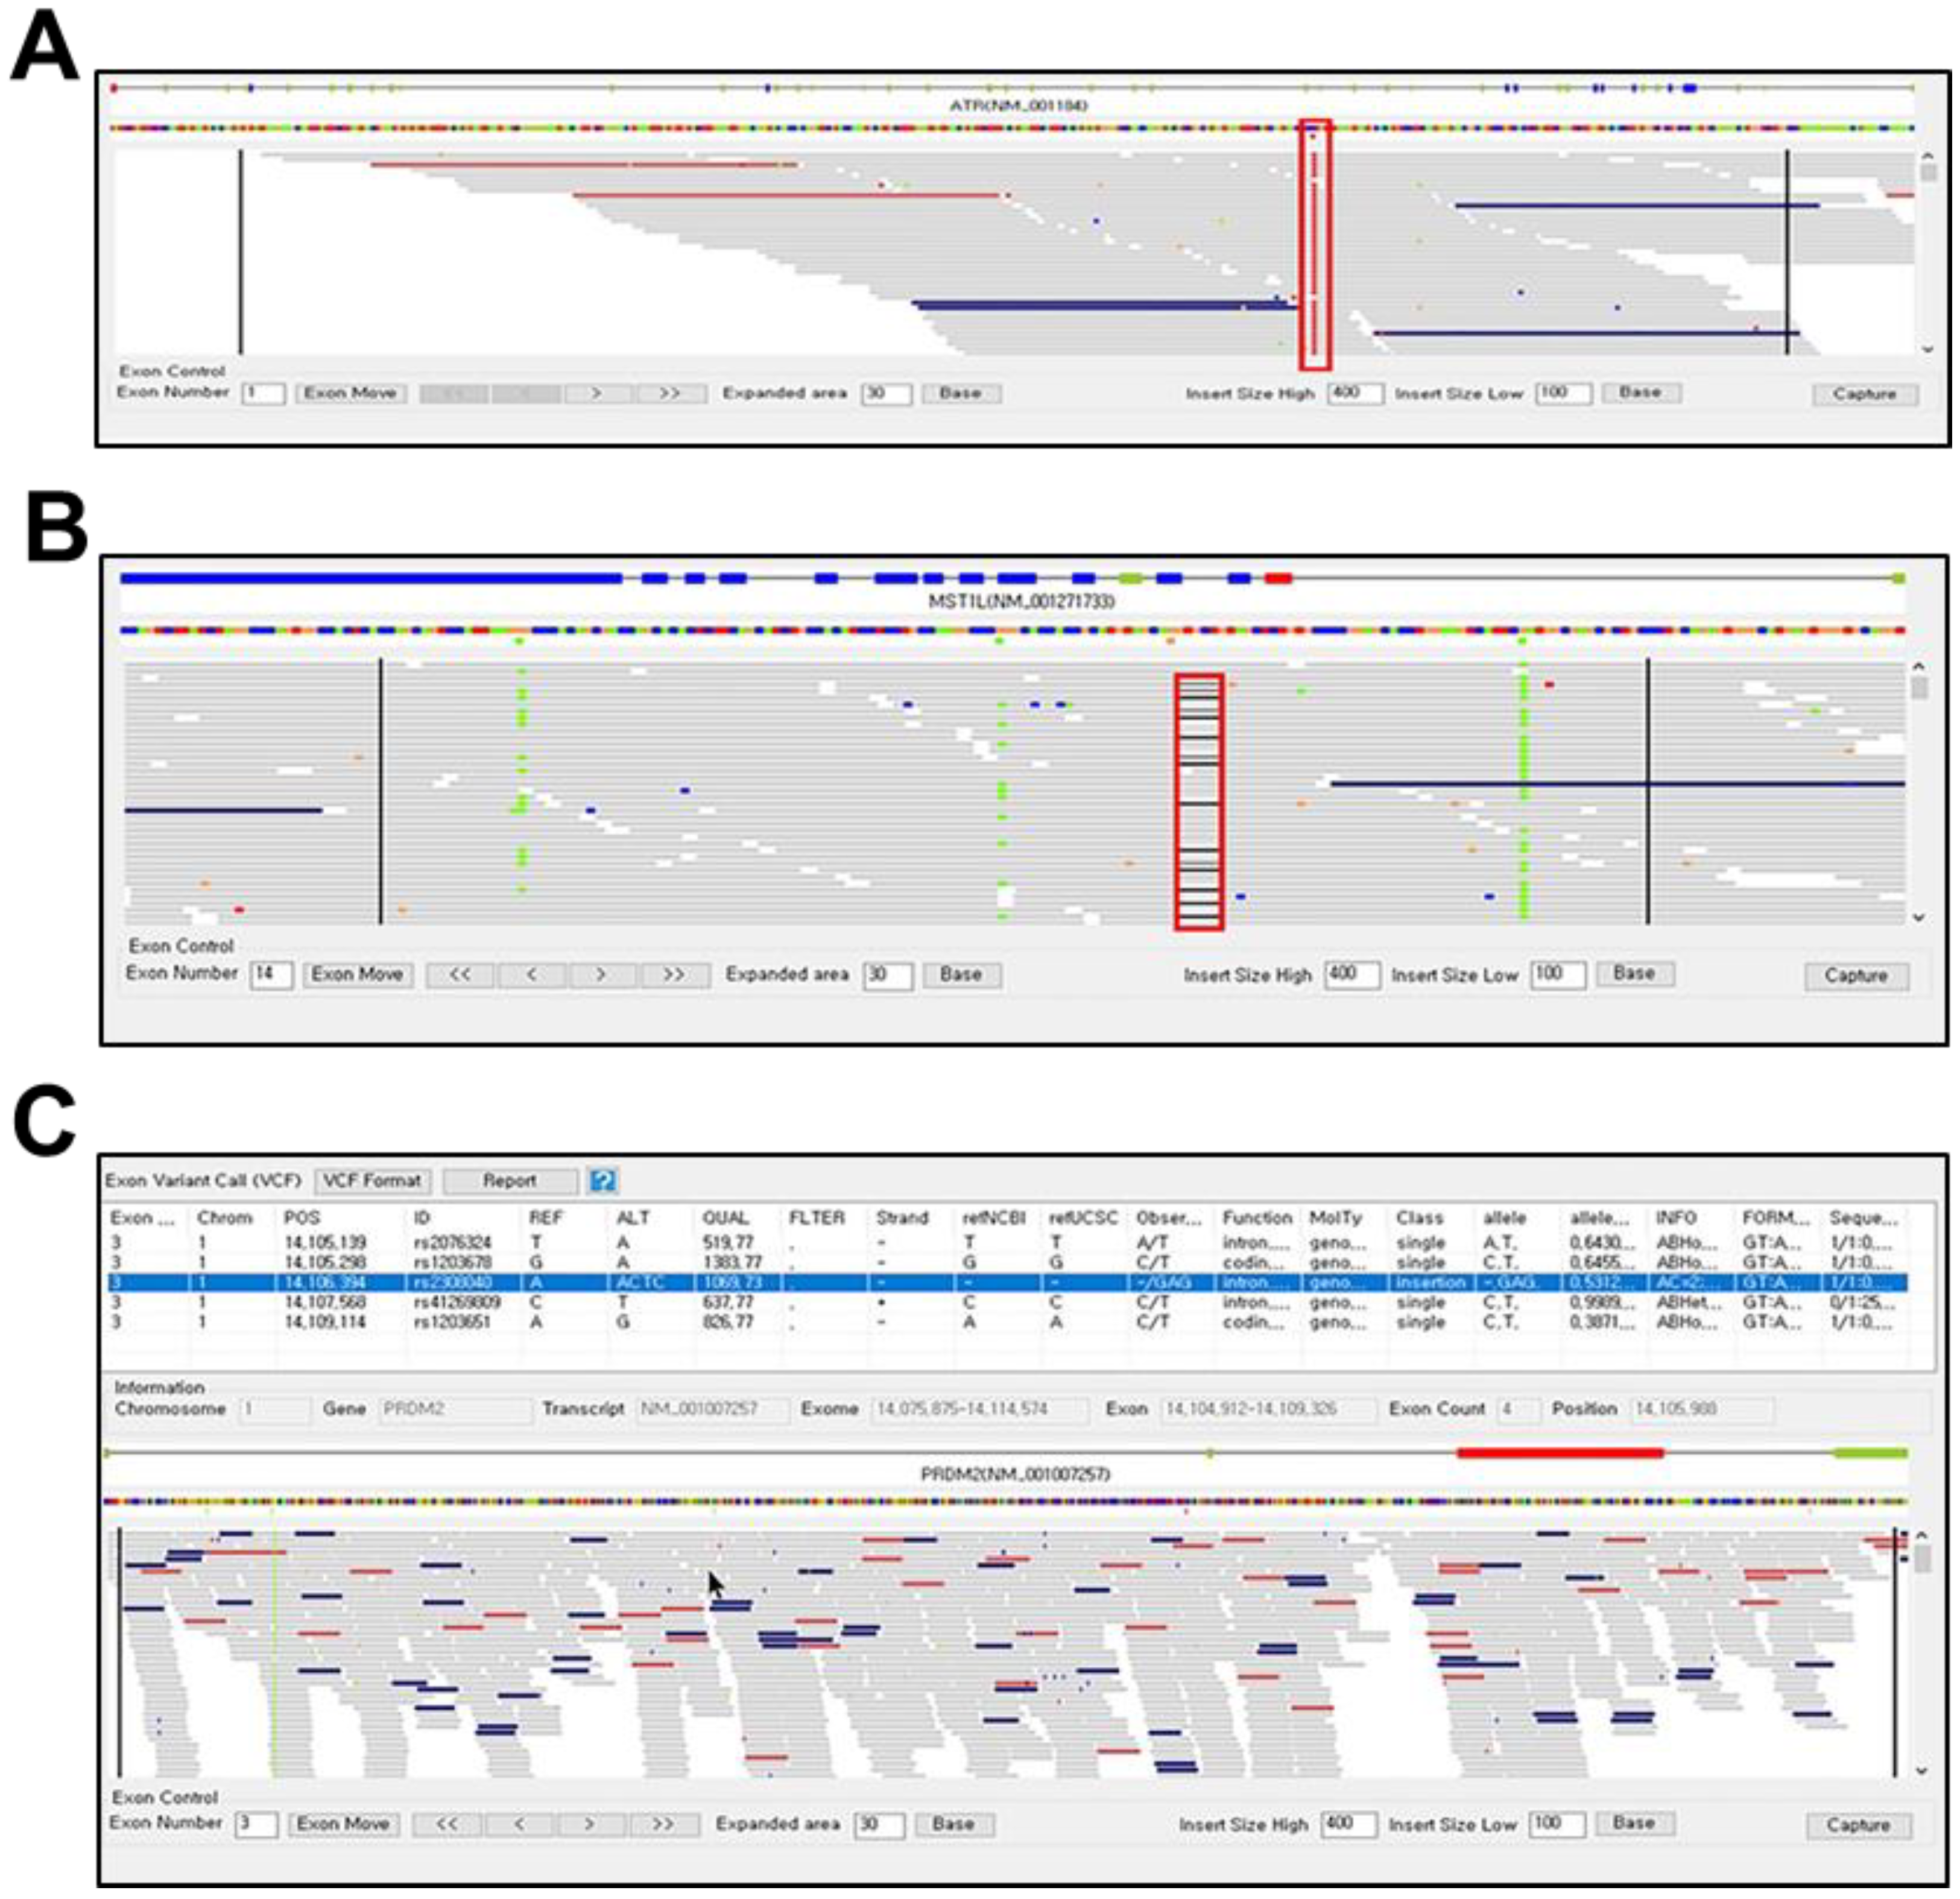
3.2. PhenGenVar Exome Browser for Gene-Level Variation Analysis
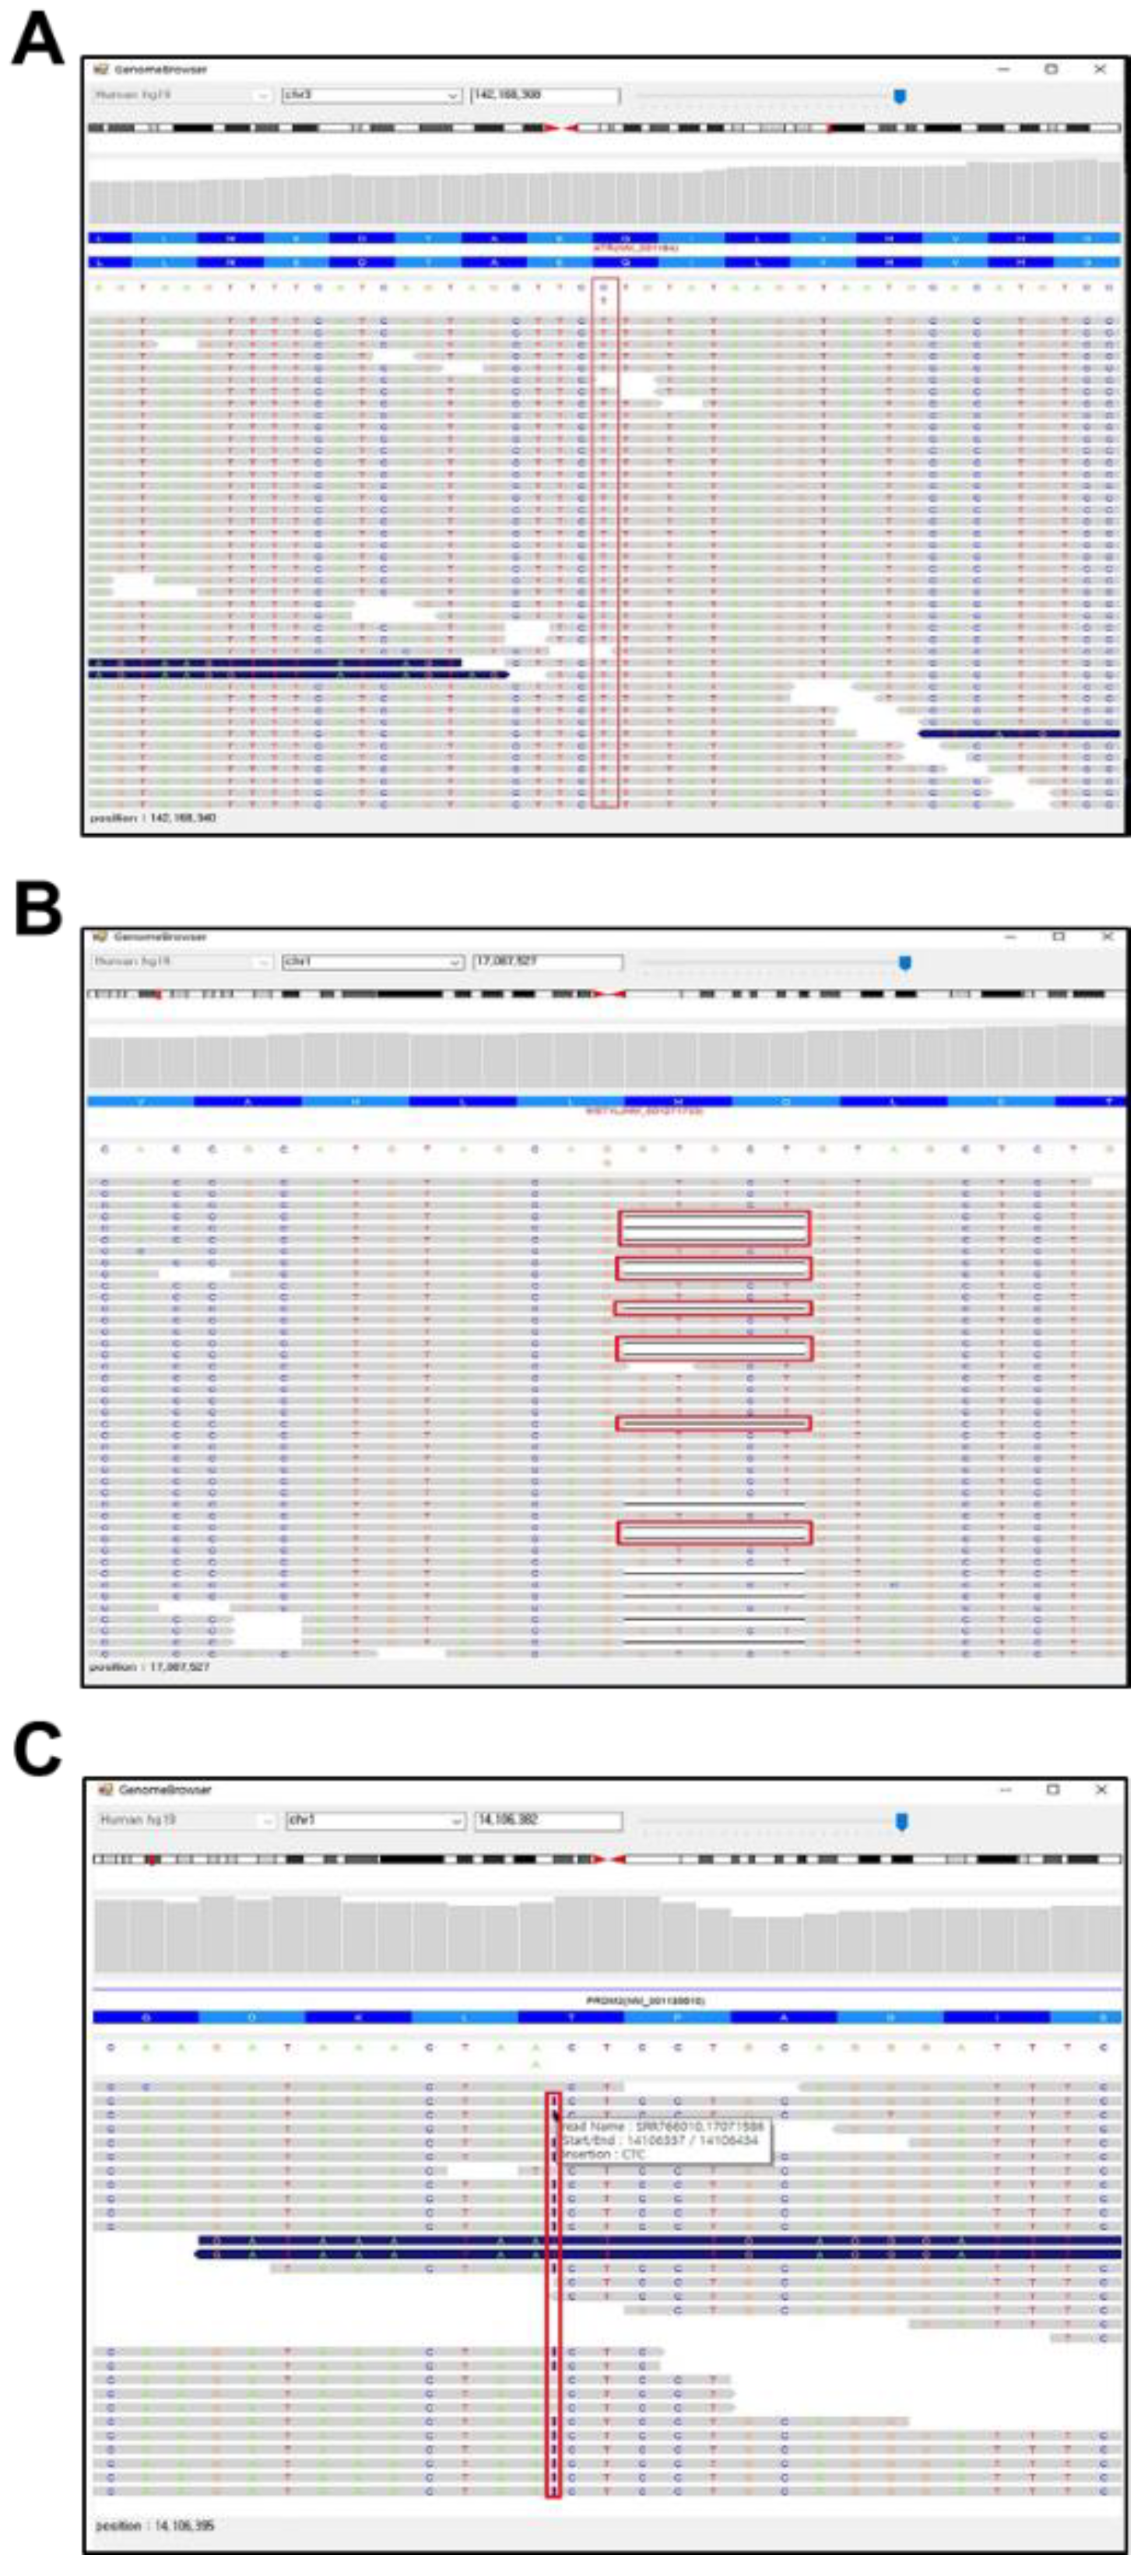
3.3. PhenGenVar Genome Browser for Single Base-Resolution Analysis
4. Discussion
5. Conclusions
Supplementary Materials
Author Contributions
Funding
Institutional Review Board Statement
Data Availability Statement
Acknowledgments
Conflicts of Interest
References
- Collins, F.S.; Varmus, H. A new initiative on precision medicine. N. Engl. J. Med. 2015, 372, 793–795. [Google Scholar] [CrossRef]
- Human Genome Sequencing Consortium, International. Finishing the euchromatic sequence of the human genome. Nature 2004, 431, 931–945. [Google Scholar] [CrossRef] [PubMed]
- DePristo, M.A.; Banks, E.; Poplin, R.; Garimella, K.V.; Maguire, J.R.; Hartl, C.; Philippakis, A.A.; del Angel, G.; Rivas, M.A.; Hanna, M.; et al. A framework for variation discovery and genotyping using next-generation DNA sequencing data. Nat. Genet. 2011, 43, 491–498. [Google Scholar] [CrossRef] [PubMed]
- Easton, D.F.; Pharoah, P.D.; Antoniou, A.C.; Tischkowitz, M.; Tavtigian, S.V.; Nathanson, K.L.; Devilee, P.; Meindl, A.; Couch, F.J.; Southey, M.; et al. Gene-panel sequencing and the prediction of breast-cancer risk. N. Engl. J. Med. 2015, 372, 2243–2257. [Google Scholar] [CrossRef]
- Smedley, D.; Jacobsen, J.O.; Jager, M.; Kohler, S.; Holtgrewe, M.; Schubach, M.; Siragusa, E.; Zemojtel, T.; Buske, O.J.; Washington, N.L.; et al. Next-generation diagnostics and disease-gene discovery with the Exomiser. Nat. Protoc. 2015, 10, 2004–2015. [Google Scholar] [CrossRef] [PubMed]
- Choi, M.; Scholl, U.I.; Ji, W.; Liu, T.; Tikhonova, I.R.; Zumbo, P.; Nayir, A.; Bakkaloglu, A.; Ozen, S.; Sanjad, S.; et al. Genetic diagnosis by whole exome capture and massively parallel DNA sequencing. Proc. Natl. Acad. Sci. USA 2009, 106, 19096–19101. [Google Scholar] [CrossRef]
- 1000 Genomes Project Consortium; Abecasis, G.R.; Altshuler, D.; Auton, A.; Brooks, L.D.; Durbin, R.M.; Gibbs, R.A.; Hurles, M.E.; McVean, G.A. A map of human genome variation from population-scale sequencing. Nature 2010, 467, 1061–1073. [Google Scholar] [CrossRef]
- Lambert, J.C.; Ibrahim-Verbaas, C.A.; Harold, D.; Naj, A.C.; Sims, R.; Bellenguez, C.; DeStafano, A.L.; Bis, J.C.; Beecham, G.W.; Grenier-Boley, B.; et al. Meta-analysis of 74,046 individuals identifies 11 new susceptibility loci for Alzheimer’s disease. Nat. Genet. 2013, 45, 1452–1458. [Google Scholar] [CrossRef]
- Lu, X.; Wang, L.; Chen, S.; He, L.; Yang, X.; Shi, Y.; Cheng, J.; Zhang, L.; Gu, C.C.; Huang, J.; et al. Genome-wide association study in Han Chinese identifies four new susceptibility loci for coronary artery disease. Nat. Genet. 2012, 44, 890–894. [Google Scholar] [CrossRef]
- Sladek, R.; Rocheleau, G.; Rung, J.; Dina, C.; Shen, L.; Serre, D.; Boutin, P.; Vincent, D.; Belisle, A.; Hadjadj, S.; et al. A genome-wide association study identifies novel risk loci for type 2 diabetes. Nature 2007, 445, 881–885. [Google Scholar] [CrossRef]
- Corder, E.H.; Saunders, A.M.; Strittmatter, W.J.; Schmechel, D.E.; Gaskell, P.C.; Small, G.W.; Roses, A.D.; Haines, J.L.; Pericak-Vance, M.A. Gene dose of apolipoprotein E type 4 allele and the risk of Alzheimer’s disease in late onset families. Science 1993, 261, 921–923. [Google Scholar] [CrossRef] [PubMed]
- Guerreiro, R.; Wojtas, A.; Bras, J.; Carrasquillo, M.; Rogaeva, E.; Majounie, E.; Cruchaga, C.; Sassi, C.; Kauwe, J.S.; Younkin, S.; et al. TREM2 variants in Alzheimer’s disease. N. Engl. J. Med. 2013, 368, 117–127. [Google Scholar] [CrossRef] [PubMed]
- Jonsson, T.; Stefansson, H.; Steinberg, S.; Jonsdottir, I.; Jonsson, P.V.; Snaedal, J.; Bjornsson, S.; Huttenlocher, J.; Levey, A.I.; Lah, J.J.; et al. Variant of TREM2 associated with the risk of Alzheimer’s disease. N. Engl. J. Med. 2013, 368, 107–116. [Google Scholar] [CrossRef] [PubMed]
- Harold, D.; Abraham, R.; Hollingworth, P.; Sims, R.; Gerrish, A.; Hamshere, M.L.; Pahwa, J.S.; Moskvina, V.; Dowzell, K.; Williams, A.; et al. Genome-wide association study identifies variants at CLU and PICALM associated with Alzheimer’s disease. Nat. Genet. 2009, 41, 1088–1093. [Google Scholar] [CrossRef]
- Hollingworth, P.; Harold, D.; Sims, R.; Gerrish, A.; Lambert, J.C.; Carrasquillo, M.M.; Abraham, R.; Hamshere, M.L.; Pahwa, J.S.; Moskvina, V.; et al. Common variants at ABCA7, MS4A6A/MS4A4E, EPHA1, CD33 and CD2AP are associated with Alzheimer’s disease. Nat. Genet. 2011, 43, 429–435. [Google Scholar] [CrossRef]
- Anglian Breast Cancer Study Group. Prevalence and penetrance of BRCA1 and BRCA2 mutations in a population-based series of breast cancer cases. Br. J. Cancer 2000, 83, 1301–1308. [Google Scholar] [CrossRef]
- Peto, J.; Collins, N.; Barfoot, R.; Seal, S.; Warren, W.; Rahman, N.; Easton, D.F.; Evans, C.; Deacon, J.; Stratton, M.R. Prevalence of BRCA1 and BRCA2 gene mutations in patients with early-onset breast cancer. J. Natl. Cancer Inst. 1999, 91, 943–949. [Google Scholar] [CrossRef]
- Antoniou, A.; Pharoah, P.D.; Narod, S.; Risch, H.A.; Eyfjord, J.E.; Hopper, J.L.; Loman, N.; Olsson, H.; Johannsson, O.; Borg, A.; et al. Average risks of breast and ovarian cancer associated with BRCA1 or BRCA2 mutations detected in case Series unselected for family history: A combined analysis of 22 studies. Am. J. Hum. Genet. 2003, 72, 1117–1130. [Google Scholar] [CrossRef]
- Torkamani, A.; Wineinger, N.E.; Topol, E.J. The personal and clinical utility of polygenic risk scores. Nat. Rev. Genet. 2018, 19, 581–590. [Google Scholar] [CrossRef]
- Marc, D.T.; Khairat, S.S. Medical Subject Headings (MeSH) for indexing and retrieving open-source healthcare data. Stud. Health Technol. Inform. 2014, 202, 157–160. [Google Scholar]
- Noy, N.F.; de Coronado, S.; Solbrig, H.; Fragoso, G.; Hartel, F.W.; Musen, M.A. Representing the NCI Thesaurus in OWL DL: Modeling tools help modeling languages. Appl. Ontol. 2008, 3, 173–190. [Google Scholar] [CrossRef] [PubMed]
- Spackman, K. SNOMED RT and SNOMEDCT. Promise of an international clinical terminology. MD Comput. 2000, 17, 29. [Google Scholar] [PubMed]
- Bodenreider, O. The Unified Medical Language System (UMLS): Integrating biomedical terminology. Nucleic Acids Res. 2004, 32, D267–D270. [Google Scholar] [CrossRef] [PubMed]
- Kohler, S.; Gargano, M.; Matentzoglu, N.; Carmody, L.C.; Lewis-Smith, D.; Vasilevsky, N.A.; Danis, D.; Balagura, G.; Baynam, G.; Brower, A.M.; et al. The Human Phenotype Ontology in 2021. Nucleic Acids Res. 2021, 49, D1207–D1217. [Google Scholar] [CrossRef] [PubMed]
- Hamosh, A.; Scott, A.F.; Amberger, J.S.; Bocchini, C.A.; McKusick, V.A. Online Mendelian Inheritance in Man (OMIM), a knowledgebase of human genes and genetic disorders. Nucleic Acids Res. 2005, 33, D514–D517. [Google Scholar] [CrossRef]
- Poplin, R.; Chang, P.C.; Alexander, D.; Schwartz, S.; Colthurst, T.; Ku, A.; Newburger, D.; Dijamco, J.; Nguyen, N.; Afshar, P.T.; et al. A universal SNP and small-indel variant caller using deep neural networks. Nat. Biotechnol. 2018, 36, 983–987. [Google Scholar] [CrossRef]
- Rausch, T.; Zichner, T.; Schlattl, A.; Stutz, A.M.; Benes, V.; Korbel, J.O. DELLY: Structural variant discovery by integrated paired-end and split-read analysis. Bioinformatics 2012, 28, i333–i339. [Google Scholar] [CrossRef]
- Li, H. FermiKit: Assembly-based variant calling for Illumina resequencing data. Bioinformatics 2015, 31, 3694–3696. [Google Scholar] [CrossRef]
- McKenna, A.; Hanna, M.; Banks, E.; Sivachenko, A.; Cibulskis, K.; Kernytsky, A.; Garimella, K.; Altshuler, D.; Gabriel, S.; Daly, M.; et al. The Genome Analysis Toolkit: A MapReduce framework for analyzing next-generation DNA sequencing data. Genome Res. 2010, 20, 1297–1303. [Google Scholar] [CrossRef]
- Escaramis, G.; Docampo, E.; Rabionet, R. A decade of structural variants: Description, history and methods to detect structural variation. Brief. Funct. Genom. 2015, 14, 305–314. [Google Scholar] [CrossRef]
- Rimmer, A.; Phan, H.; Mathieson, I.; Iqbal, Z.; Twigg, S.R.F.; Consortium, W.G.S.; Wilkie, A.O.M.; McVean, G.; Lunter, G. Integrating mapping-, assembly- and haplotype-based approaches for calling variants in clinical sequencing applications. Nat. Genet. 2014, 46, 912–918. [Google Scholar] [CrossRef] [PubMed]
- Kim, S.; Scheffler, K.; Halpern, A.L.; Bekritsky, M.A.; Noh, E.; Kallberg, M.; Chen, X.; Kim, Y.; Beyter, D.; Krusche, P.; et al. Strelka2: Fast and accurate calling of germline and somatic variants. Nat. Methods 2018, 15, 591–594. [Google Scholar] [CrossRef] [PubMed]
- Koboldt, D.C.; Chen, K.; Wylie, T.; Larson, D.E.; McLellan, M.D.; Mardis, E.R.; Weinstock, G.M.; Wilson, R.K.; Ding, L. VarScan: Variant detection in massively parallel sequencing of individual and pooled samples. Bioinformatics 2009, 25, 2283–2285. [Google Scholar] [CrossRef] [PubMed]
- Danecek, P.; Auton, A.; Abecasis, G.; Albers, C.A.; Banks, E.; DePristo, M.A.; Handsaker, R.E.; Lunter, G.; Marth, G.T.; Sherry, S.T.; et al. The variant call format and VCFtools. Bioinformatics 2011, 27, 2156–2158. [Google Scholar] [CrossRef]
- Wang, W.; Hu, W.; Hou, F.; Hu, P.; Wei, Z. SNVerGUI: A desktop tool for variant analysis of next-generation sequencing data. J. Med. Genet. 2012, 49, 753–755. [Google Scholar] [CrossRef]
- Ou, M.; Ma, R.; Cheung, J.; Lo, K.; Yee, P.; Luo, T.; Chan, T.L.; Au, C.H.; Kwong, A.; Luo, R.; et al. database.bio: A web application for interpreting human variations. Bioinformatics 2015, 31, 4035–4037. [Google Scholar] [CrossRef]
- Pandey, R.V.; Pabinger, S.; Kriegner, A.; Weinhausel, A. DaMold: A data-mining platform for variant annotation and visualization in molecular diagnostics research. Hum. Mutat. 2017, 38, 778–787. [Google Scholar] [CrossRef]
- Li, Z.; Liu, Z.; Jiang, Y.; Chen, D.; Ran, X.; Sun, Z.S.; Wu, J. mirVAFC: A Web Server for Prioritizations of Pathogenic Sequence Variants from Exome Sequencing Data via Classifications. Hum. Mutat. 2017, 38, 25–33. [Google Scholar] [CrossRef]
- Van der Velde, K.J.; de Boer, E.N.; van Diemen, C.C.; Sikkema-Raddatz, B.; Abbott, K.M.; Knopperts, A.; Franke, L.; Sijmons, R.H.; de Koning, T.J.; Wijmenga, C.; et al. GAVIN: Gene-Aware Variant INterpretation for medical sequencing. Genome Biol. 2017, 18, 6. [Google Scholar] [CrossRef]
- Lee, I.H.; Lee, K.; Hsing, M.; Choe, Y.; Park, J.H.; Kim, S.H.; Bohn, J.M.; Neu, M.B.; Hwang, K.B.; Green, R.C.; et al. Prioritizing disease-linked variants, genes, and pathways with an interactive whole-genome analysis pipeline. Hum. Mutat. 2014, 35, 537–547. [Google Scholar] [CrossRef]
- Hart, S.N.; Duffy, P.; Quest, D.J.; Hossain, A.; Meiners, M.A.; Kocher, J.P. VCF-Miner: GUI-based application for mining variants and annotations stored in VCF files. Brief. Bioinform. 2016, 17, 346–351. [Google Scholar] [CrossRef] [PubMed]
- Muller, H.; Jimenez-Heredia, R.; Krolo, A.; Hirschmugl, T.; Dmytrus, J.; Boztug, K.; Bock, C. VCF.Filter: Interactive prioritization of disease-linked genetic variants from sequencing data. Nucleic Acids Res. 2017, 45, W567–W572. [Google Scholar] [CrossRef] [PubMed]
- Pietrelli, A.; Valenti, L. myVCF: A desktop application for high-throughput mutations data management. Bioinformatics 2017, 33, 3676–3678. [Google Scholar] [CrossRef] [PubMed]
- Salatino, S.; Ramraj, V. BrowseVCF: A web-based application and workflow to quickly prioritize disease-causative variants in VCF files. Brief. Bioinform. 2017, 18, 774–779. [Google Scholar] [CrossRef]
- Jiang, J.; Gu, J.; Zhao, T.; Lu, H. VCF-Server: A web-based visualization tool for high-throughput variant data mining and management. Mol. Genet. Genom. Med. 2019, 7, e00641. [Google Scholar] [CrossRef]
- Robinson, J.T.; Thorvaldsdottir, H.; Wenger, A.M.; Zehir, A.; Mesirov, J.P. Variant Review with the Integrative Genomics Viewer. Cancer Res. 2017, 77, e31–e34. [Google Scholar] [CrossRef]
- Navarro Gonzalez, J.; Zweig, A.S.; Speir, M.L.; Schmelter, D.; Rosenbloom, K.R.; Raney, B.J.; Powell, C.C.; Nassar, L.R.; Maulding, N.D.; Lee, C.M.; et al. The UCSC Genome Browser database: 2021 update. Nucleic Acids Res. 2021, 49, D1046–D1057. [Google Scholar] [CrossRef]
- Li, H.; Handsaker, B.; Wysoker, A.; Fennell, T.; Ruan, J.; Homer, N.; Marth, G.; Abecasis, G.; Durbin, R.; Genome Project Data Processing, S. The Sequence Alignment/Map format and SAMtools. Bioinformatics 2009, 25, 2078–2079. [Google Scholar] [CrossRef]
- Sayers, E.W.; Bolton, E.E.; Brister, J.R.; Canese, K.; Chan, J.; Comeau, D.C.; Connor, R.; Funk, K.; Kelly, C.; Kim, S.; et al. Database resources of the national center for biotechnology information. Nucleic Acids Res. 2022, 50, D20–D26. [Google Scholar] [CrossRef]
- Genomes Project, C.; Abecasis, G.R.; Auton, A.; Brooks, L.D.; DePristo, M.A.; Durbin, R.M.; Handsaker, R.E.; Kang, H.M.; Marth, G.T.; McVean, G.A. An integrated map of genetic variation from 1092 human genomes. Nature 2012, 491, 56–65. [Google Scholar] [CrossRef]
- Povey, S.; Lovering, R.; Bruford, E.; Wright, M.; Lush, M.; Wain, H. The HUGO Gene Nomenclature Committee (HGNC). Hum. Genet. 2001, 109, 678–680. [Google Scholar] [CrossRef] [PubMed]
- Sherry, S.T.; Ward, M.H.; Kholodov, M.; Baker, J.; Phan, L.; Smigielski, E.M.; Sirotkin, K. dbSNP: The NCBI database of genetic variation. Nucleic Acids Res. 2001, 29, 308–311. [Google Scholar] [CrossRef] [PubMed]
- Boycott, K.M.; Vanstone, M.R.; Bulman, D.E.; MacKenzie, A.E. Rare-disease genetics in the era of next-generation sequencing: Discovery to translation. Nat. Rev. Genet. 2013, 14, 681–691. [Google Scholar] [CrossRef]
- Boycott, K.M.; Hartley, T.; Biesecker, L.G.; Gibbs, R.A.; Innes, A.M.; Riess, O.; Belmont, J.; Dunwoodie, S.L.; Jojic, N.; Lassmann, T.; et al. A Diagnosis for All Rare Genetic Diseases: The Horizon and the Next Frontiers. Cell 2019, 177, 32–37. [Google Scholar] [CrossRef]
- Goodrich, J.K.; Singer-Berk, M.; Son, R.; Sveden, A.; Wood, J.; England, E.; Cole, J.B.; Weisburd, B.; Watts, N.; Caulkins, L.; et al. Determinants of penetrance and variable expressivity in monogenic metabolic conditions across 77,184 exomes. Nat. Commun. 2021, 12, 3505. [Google Scholar] [CrossRef] [PubMed]
- Abul-Husn, N.S.; Soper, E.R.; Odgis, J.A.; Cullina, S.; Bobo, D.; Moscati, A.; Rodriguez, J.E.; Team, C.G.; Regeneron Genetics, C.; Loos, R.J.F.; et al. Exome sequencing reveals a high prevalence of BRCA1 and BRCA2 founder variants in a diverse population-based biobank. Genome Med. 2019, 12, 2. [Google Scholar] [CrossRef]
- Ogiso-Tanaka, E.; Shimizu, T.; Hajika, M.; Kaga, A.; Ishimoto, M. Highly multiplexed AmpliSeq technology identifies novel variation of flowering time-related genes in soybean (Glycine max). DNA Res. 2019, 26, 243–260. [Google Scholar] [CrossRef] [PubMed]


Publisher’s Note: MDPI stays neutral with regard to jurisdictional claims in published maps and institutional affiliations. |
© 2022 by the authors. Licensee MDPI, Basel, Switzerland. This article is an open access article distributed under the terms and conditions of the Creative Commons Attribution (CC BY) license (https://creativecommons.org/licenses/by/4.0/).
Share and Cite
Shin, J.; Jeon, J.; Jung, D.; Kim, K.; Kim, Y.J.; Jeong, D.-H.; Yoon, J. PhenGenVar: A User-Friendly Genetic Variant Detection and Visualization Tool for Precision Medicine. J. Pers. Med. 2022, 12, 959. https://0-doi-org.brum.beds.ac.uk/10.3390/jpm12060959
Shin J, Jeon J, Jung D, Kim K, Kim YJ, Jeong D-H, Yoon J. PhenGenVar: A User-Friendly Genetic Variant Detection and Visualization Tool for Precision Medicine. Journal of Personalized Medicine. 2022; 12(6):959. https://0-doi-org.brum.beds.ac.uk/10.3390/jpm12060959
Chicago/Turabian StyleShin, JaeMoon, Junbeom Jeon, Dawoon Jung, Kiyong Kim, Yun Joong Kim, Dong-Hoon Jeong, and JeeHee Yoon. 2022. "PhenGenVar: A User-Friendly Genetic Variant Detection and Visualization Tool for Precision Medicine" Journal of Personalized Medicine 12, no. 6: 959. https://0-doi-org.brum.beds.ac.uk/10.3390/jpm12060959