Survey of CO2 Radiation Experimental Data in Relation with Planetary Entry


Research Engineer, Ingénierie et Systèmes Avancés, 33610 Cestas, France
Galaxies 2021, 9(1), 15; https://0-doi-org.brum.beds.ac.uk/10.3390/galaxies9010015
Submission received: 16 July 2020
/
Revised: 20 November 2020
/
Accepted: 24 November 2020
/
Published: 23 February 2021
(This article belongs to the Collection A Trip across the Universe: Our Present Knowledge and Future Perspectives)
Abstract
:This paper focuses on a survey of experimental data related to radiation into CO2 plasma flows, which are encountered during Mars and Venus entries. The review emphasizes on VUV and IR radiation, since recent experimental efforts has been devoted to these wavelength ranges since they contribute mostly to CO2 plasma radiation. The main objective of the study is to identify the most attractive datasets for future crosscheck comparisons with the results obtained during future test campaigns with ESTHER shock-tube. The survey accounts for the results obtained in shock-tubes, expansion tube and plasma arc-jets for Mars and Venus test campaigns. The experimental results obtained for propulsion related studies have also been considered.
1. Nomenclature
Acronyms:
| ADST | Arc-Driven Shock Tube |
| CEV | Crew Exploration Vehicle |
| CNRS | Centre National de la Recherche Scientifique |
| CORIA | COmplexe de Recherche Interprofessionnel en Aérothermochimie |
| DLAS | Diode Laser Absorption Spectroscopy |
| EAST | Electric Arc Shock Tube |
| ERWG | European Radiation Working Group |
| HVST | High Velocity Shock Tube |
| ICARE | Institut de Combustion, Aérothermique, Réactivité et Environnement |
| ICP | Inductively Coupled Plasma |
| IR | InfraRed |
| IRS | Institute für RaumfahrtSysteme |
| ISTC | International Science and Technology Center |
| JAXA | Japan Aerospace eXploration Agency |
| KAIST | Korean Advanced Institute of Science and Technology |
| LAEPT | Laboratoire Arc Electrique et Plasmas Thermiques |
| LENS | Large Energy National Shock-tunnel |
| LIF | Laser Induced Fluorescence |
| MIPT | Moscow Institute of Physics and Technology |
| MSL | Mars Surface Laboratory |
| MSU | Moscow State university |
| NASA | National Aeronautics and Space Administration |
| NIR | Near InfraRed |
| PWK | PlasmaWindKanale |
| TALIF | Two-photon Absorption Laser Induced Fluorescence |
| TPS | Thermal Protection System |
| TRP | Technology and Research Programme |
| TSAGI | Russian acronym for Central Institute for Aero-hydrodynamics |
| VIS | VISible |
| VUV | Vacuum UltraViolet |
2. Introduction
Radiation measurements in CO2 plasma flows are of interest for different aerospace applications. In propulsion, their investigation is necessary to study the combustion process in engines and to analyse exhaust plumes. Concerning atmospheric entries, they are key issues for planets such as Mars and Venus, since CO2 is a major component of their atmospheres. Radiation from species formed by CO2 dissociated flows, covers a wide range of wavelengths since some systems radiate in the vacuum ultraviolet (VUV) and other in the infrared.
Measurements in VUV and infrared bands cover a range of wavelength of 62 up to 200 nm, and beyond 700 nm respectively. In hypersonic flows, radiative heating can be significant in both of these spectrum bands depending on plasma composition. However, VUV emission measurement is difficult to achieve due to the instrumentation limitations. Usually dedicated deuterium lamps [1] are used for such measurements. These devices required a specific calibration based on advanced photon metrology [2]. VUV measurements are not only relevant for hypersonic applications, but are also of interest for nuclear fusion, photochemistry, and exobiology; more particularly infrared measurements are a key issue for propulsion systems.
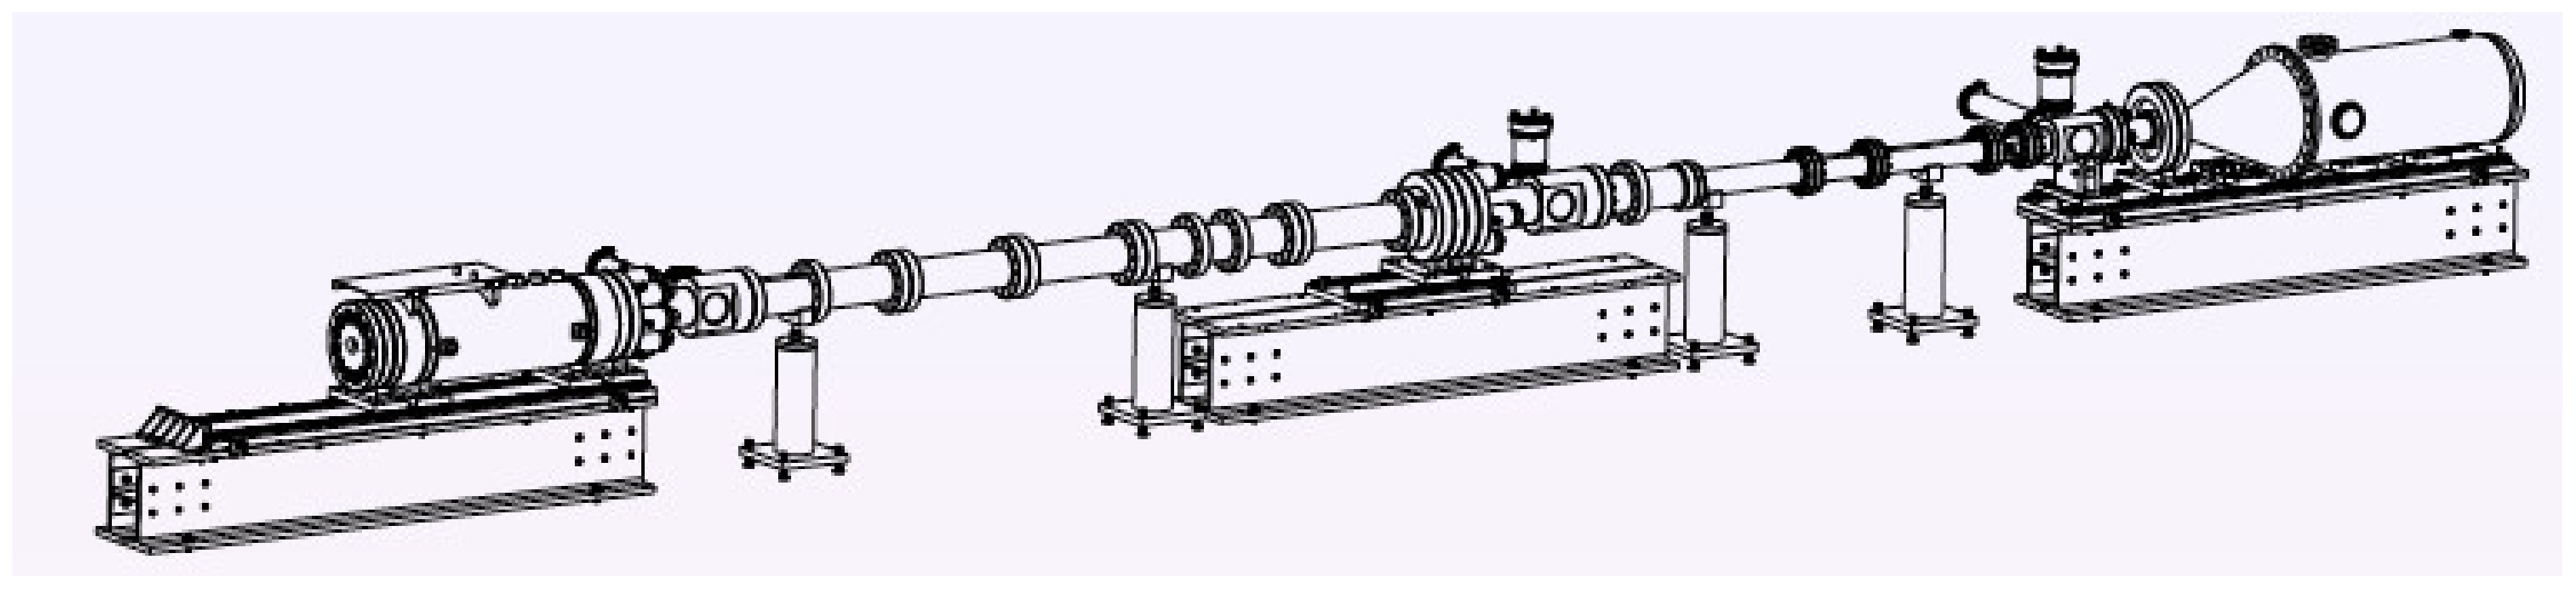
In the following, a literature survey of available data for CO2 radiating flows is presented. First, the data related to propulsion applications are presented, then experimental data obtained for Venus and Mars entry conditions are surveyed. The survey activity benefits from previous studies carried out for Mars entry [3] and shock facilities [4], as well as shock-tube data for Mars entry [5]. The available heritage from previous ESA TRP activities [6,7] has also been considered. In the frame of a research effort on CFD validation in CO2 environment, a large spectral database for CO2 radiation has been gathered, evaluated, and incorporated in the radiation tool PARADE [8,9]. The survey is mostly focusing on the results obtained in shock-tubes and expansion tubes. Data from plasma torches have been also considered; available spectra and measurements could be of interest even if they have been measured for much different flow conditions than those encountered within a shock-tube. The objective of the current study is to identify the most attractive datasets for CO2 radiation, in line with planetary entry, with a focus on VUV and IR contributions. These datasets will be of interest for assessing the future experimental data to be obtained during test campaigns in the European shock tube ESTHER [10]. ESTHER is a facility developed by an international consortium led by IST of Lisbon, under funding from the European Space Agency for supporting future exploration missions. It is a two-stage combustion driven shock-tube (see Figure 1) with laser ignition, with the capability to reach a shock velocity up to 14 km/s for Earth atmospheric entry. Specific instrumentation is going to be added to the facility, with a VUV capability for high-speed entries and a specific IR instrumentation for testing Mars entry conditions. The goal of the current effort is to support the development of this IR capability.
3. Propulsion Analysis
3.1. Introduction
The exhaust plume of an aircraft, or a rocket, is one of the sources of the object IR signature. As a consequence, radiation plumes identification and tracking are of interest for missile and aircraft systems. Species such as CO2, CO, H2O, as well as other combustion products [11] have to be searched for estimating radiation, particularly when species related systems and bands are in the IR domain.
Another interest of CO2 radiation for propulsion applications is CO2 expansion flows [12] in nozzles. This is relevant for sample return mission to planets with a CO2 atmosphere such as Mars or Venus (more particularly to Mars since the ground pressure is low contrary to Venus for which a launch from a balloon could be envisaged). For this objective, activities related to modelling [13], database comparison [11], and experiments [12,14,15] can be found in the literature. In the following, the emphasis will be given to recent experimental campaigns carried out for CO2 radiation.
3.2. Experiments
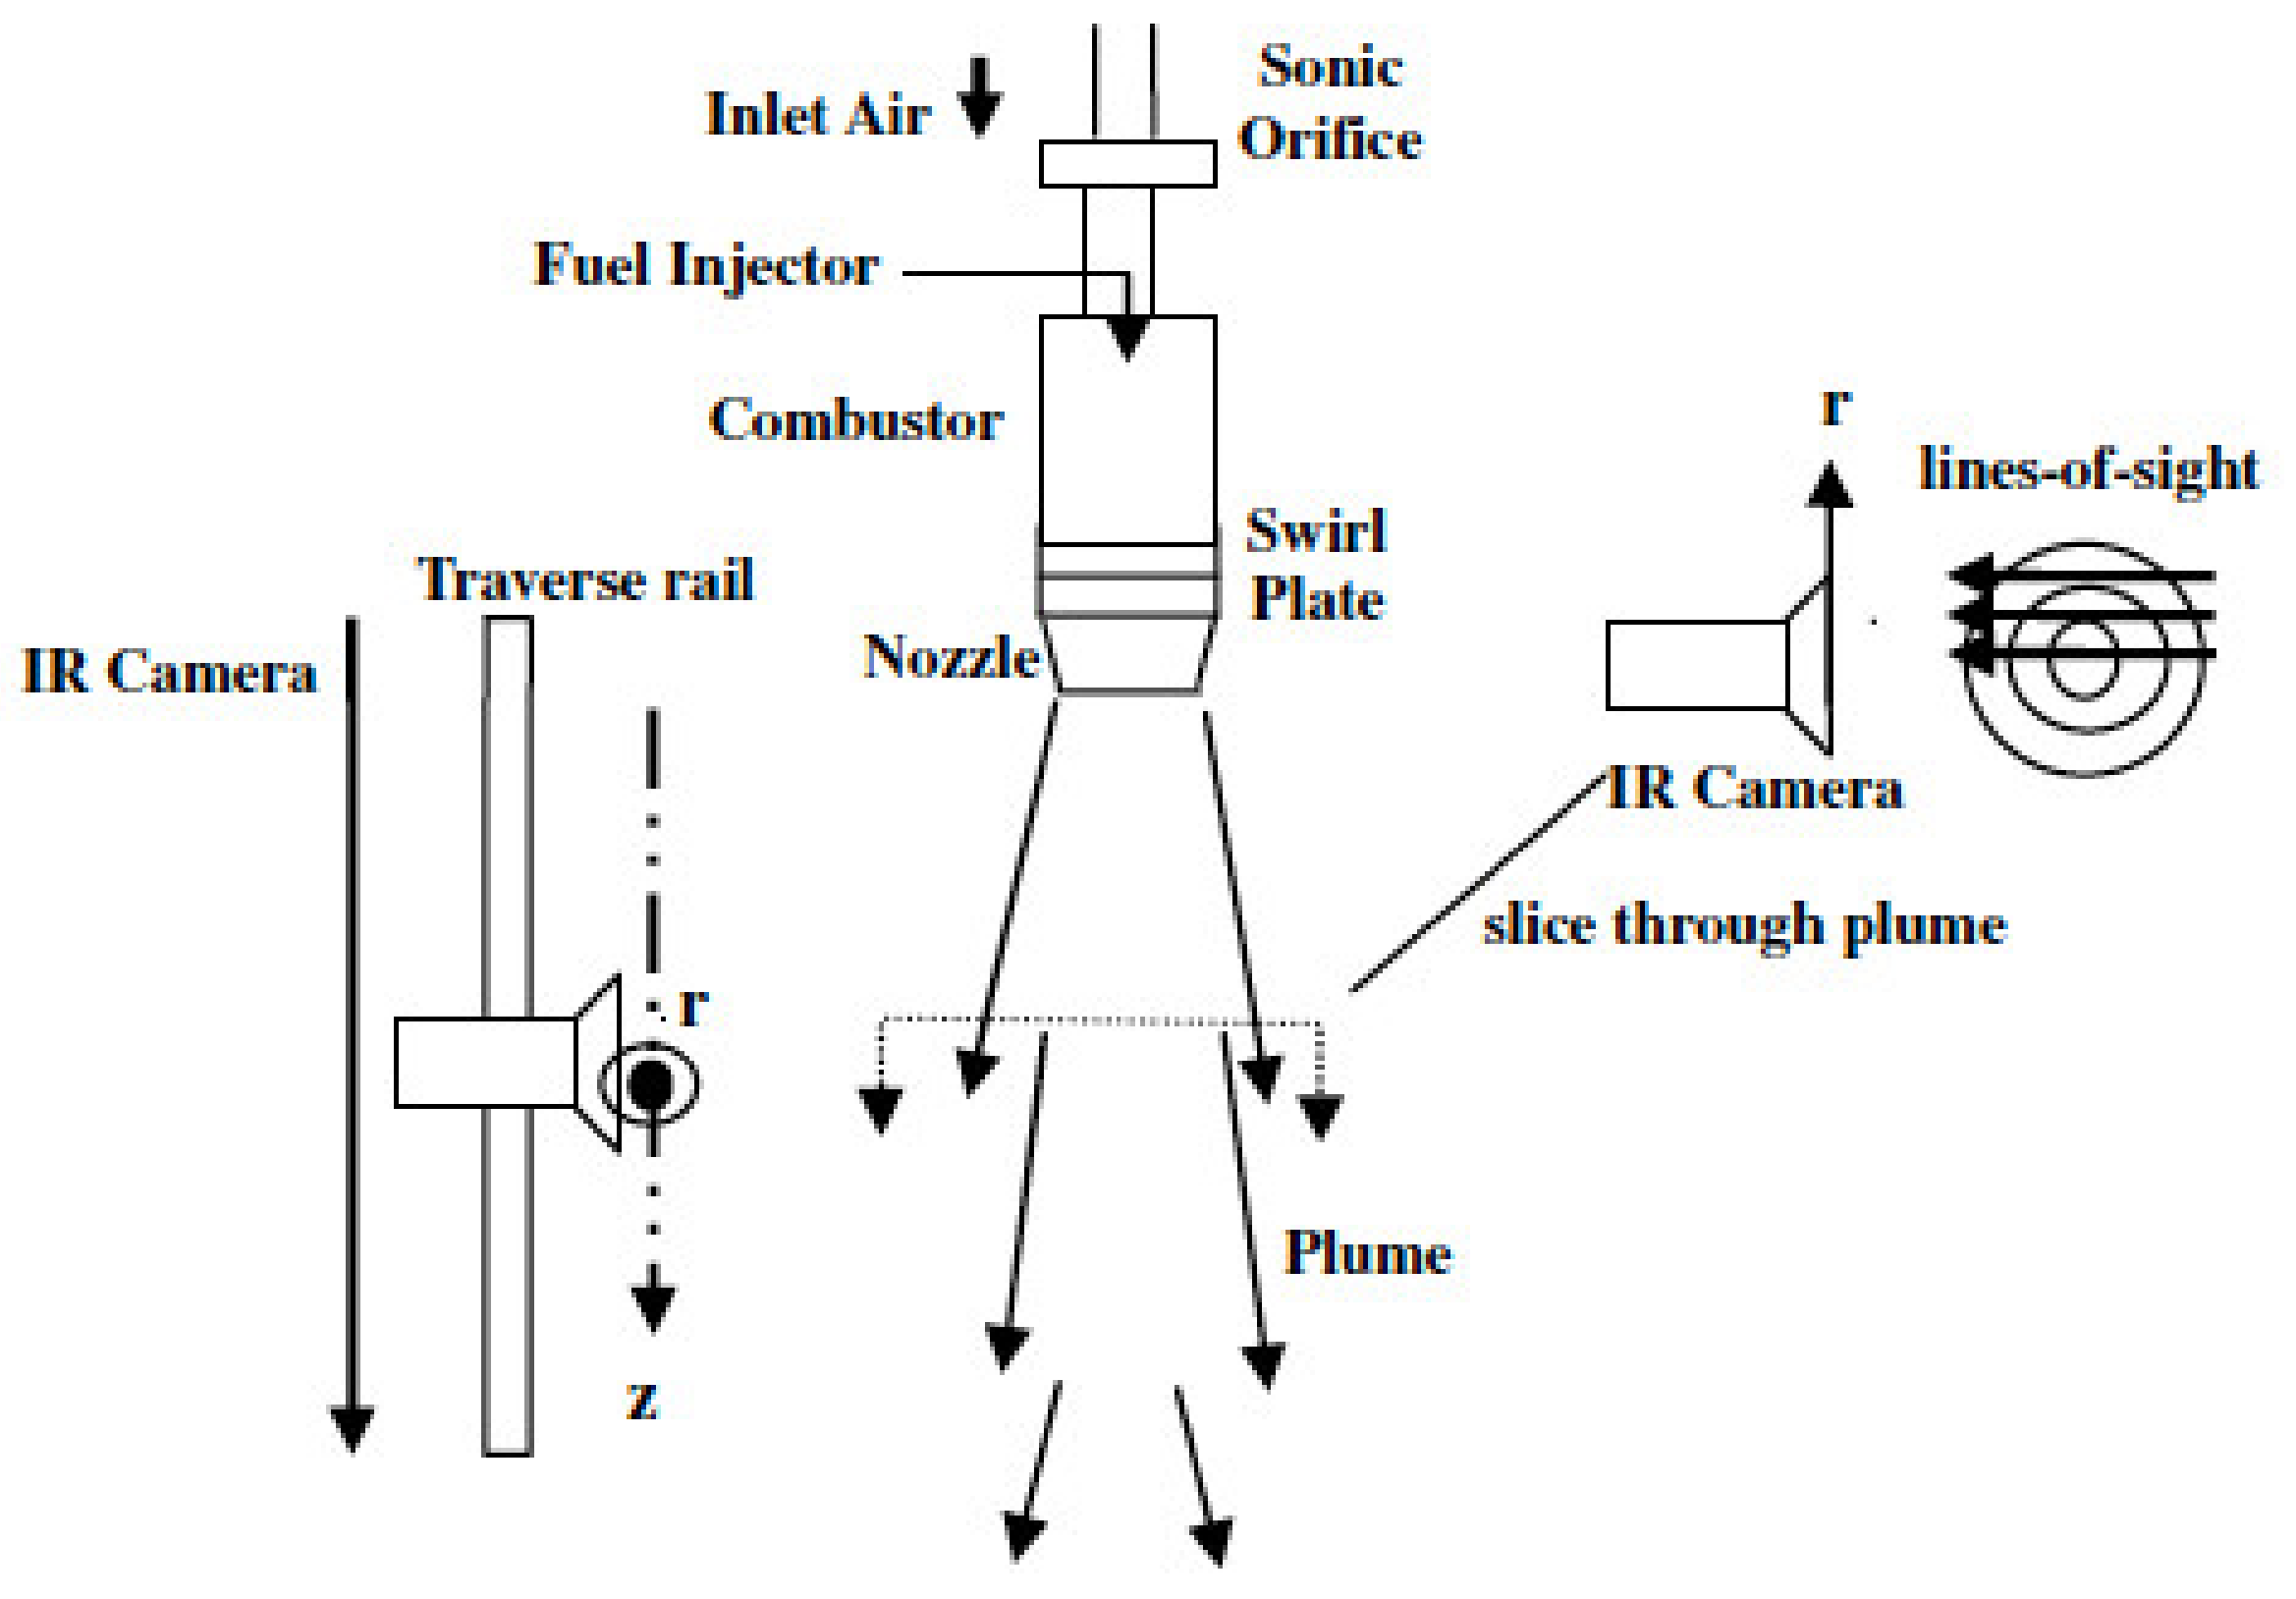
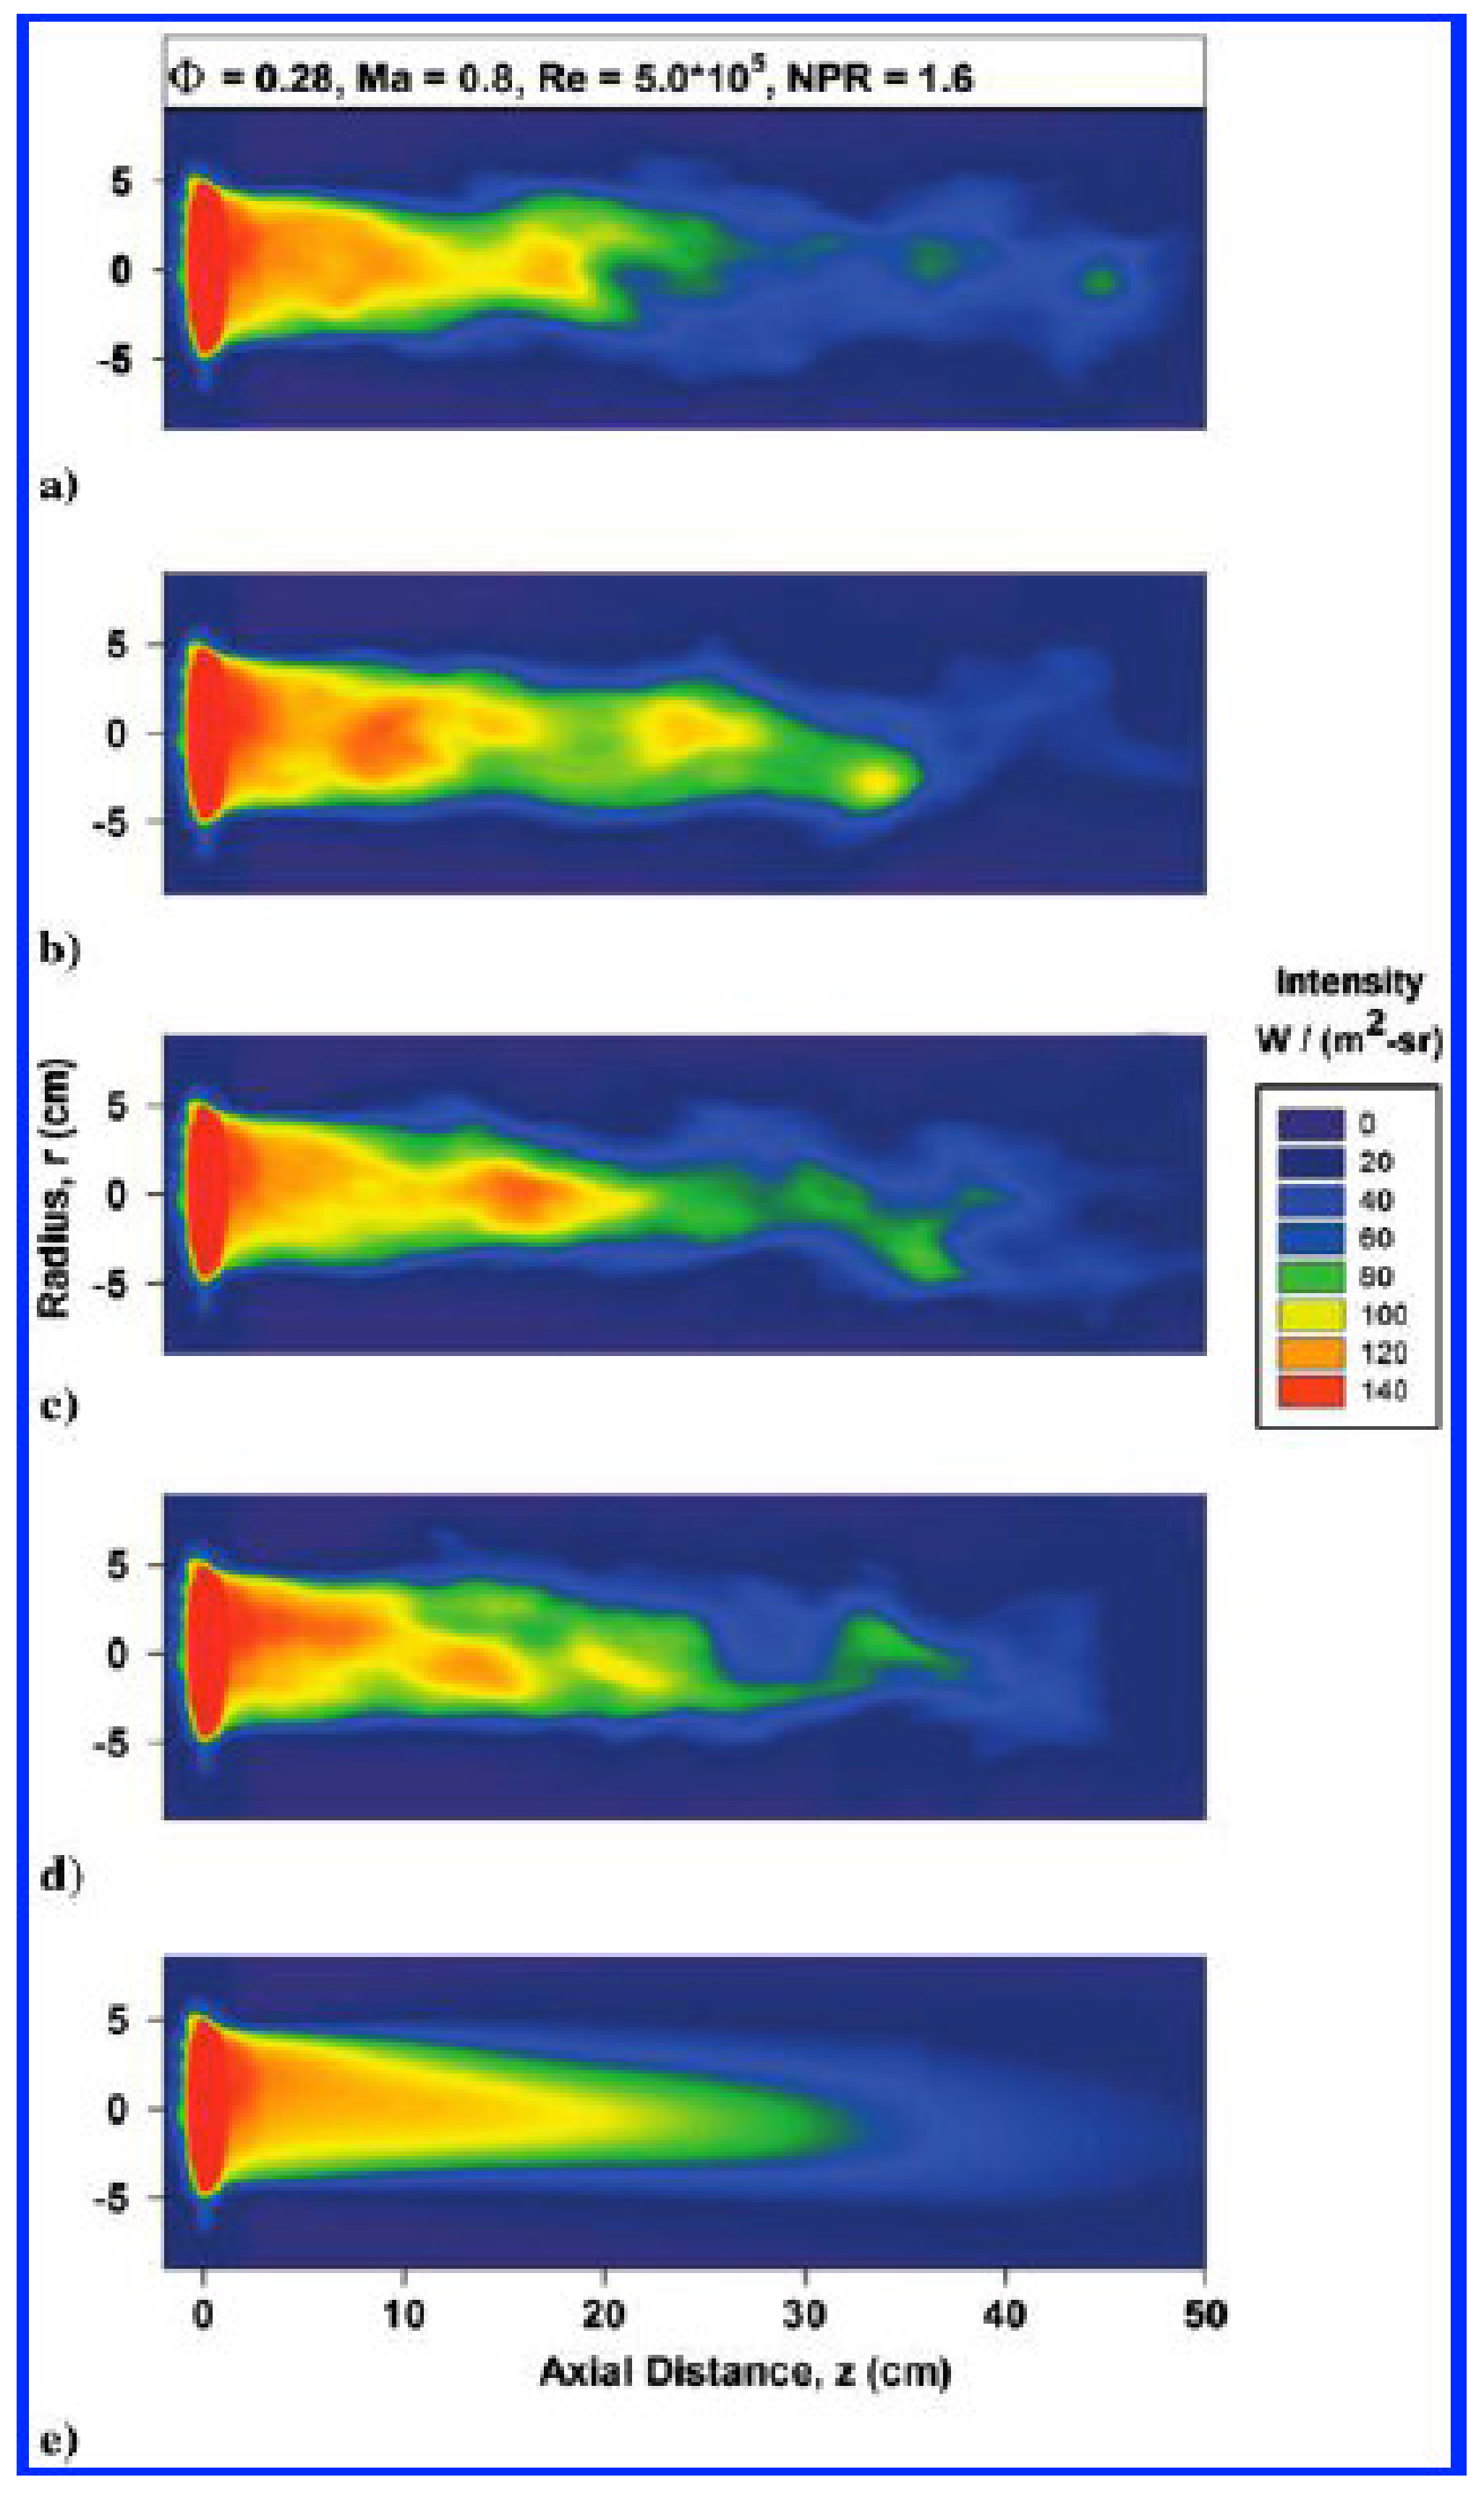
A generic arrangement for investigating plumes is shown in Figure 2. One of the purposes of this test campaign [14] was to investigate the narrowband radiation intensity emitted from a plume. Exit temperature of the exhaust gases was in the vicinity of 800 K. Radiation intensity measurements were obtained using an infrared camera. Corresponding two-dimensional mapping of the radiation intensity distribution at different moments and time-averaged are shown in Figure 3. The two-dimensional mapping radiation measurements obtained this study is of high interest for future instrumentation developments in hypersonic shock-facilities. In this study, narrowband radiation calculations were performed to estimate the contribution from heated water vapour and carbon dioxide to the measured intensity.
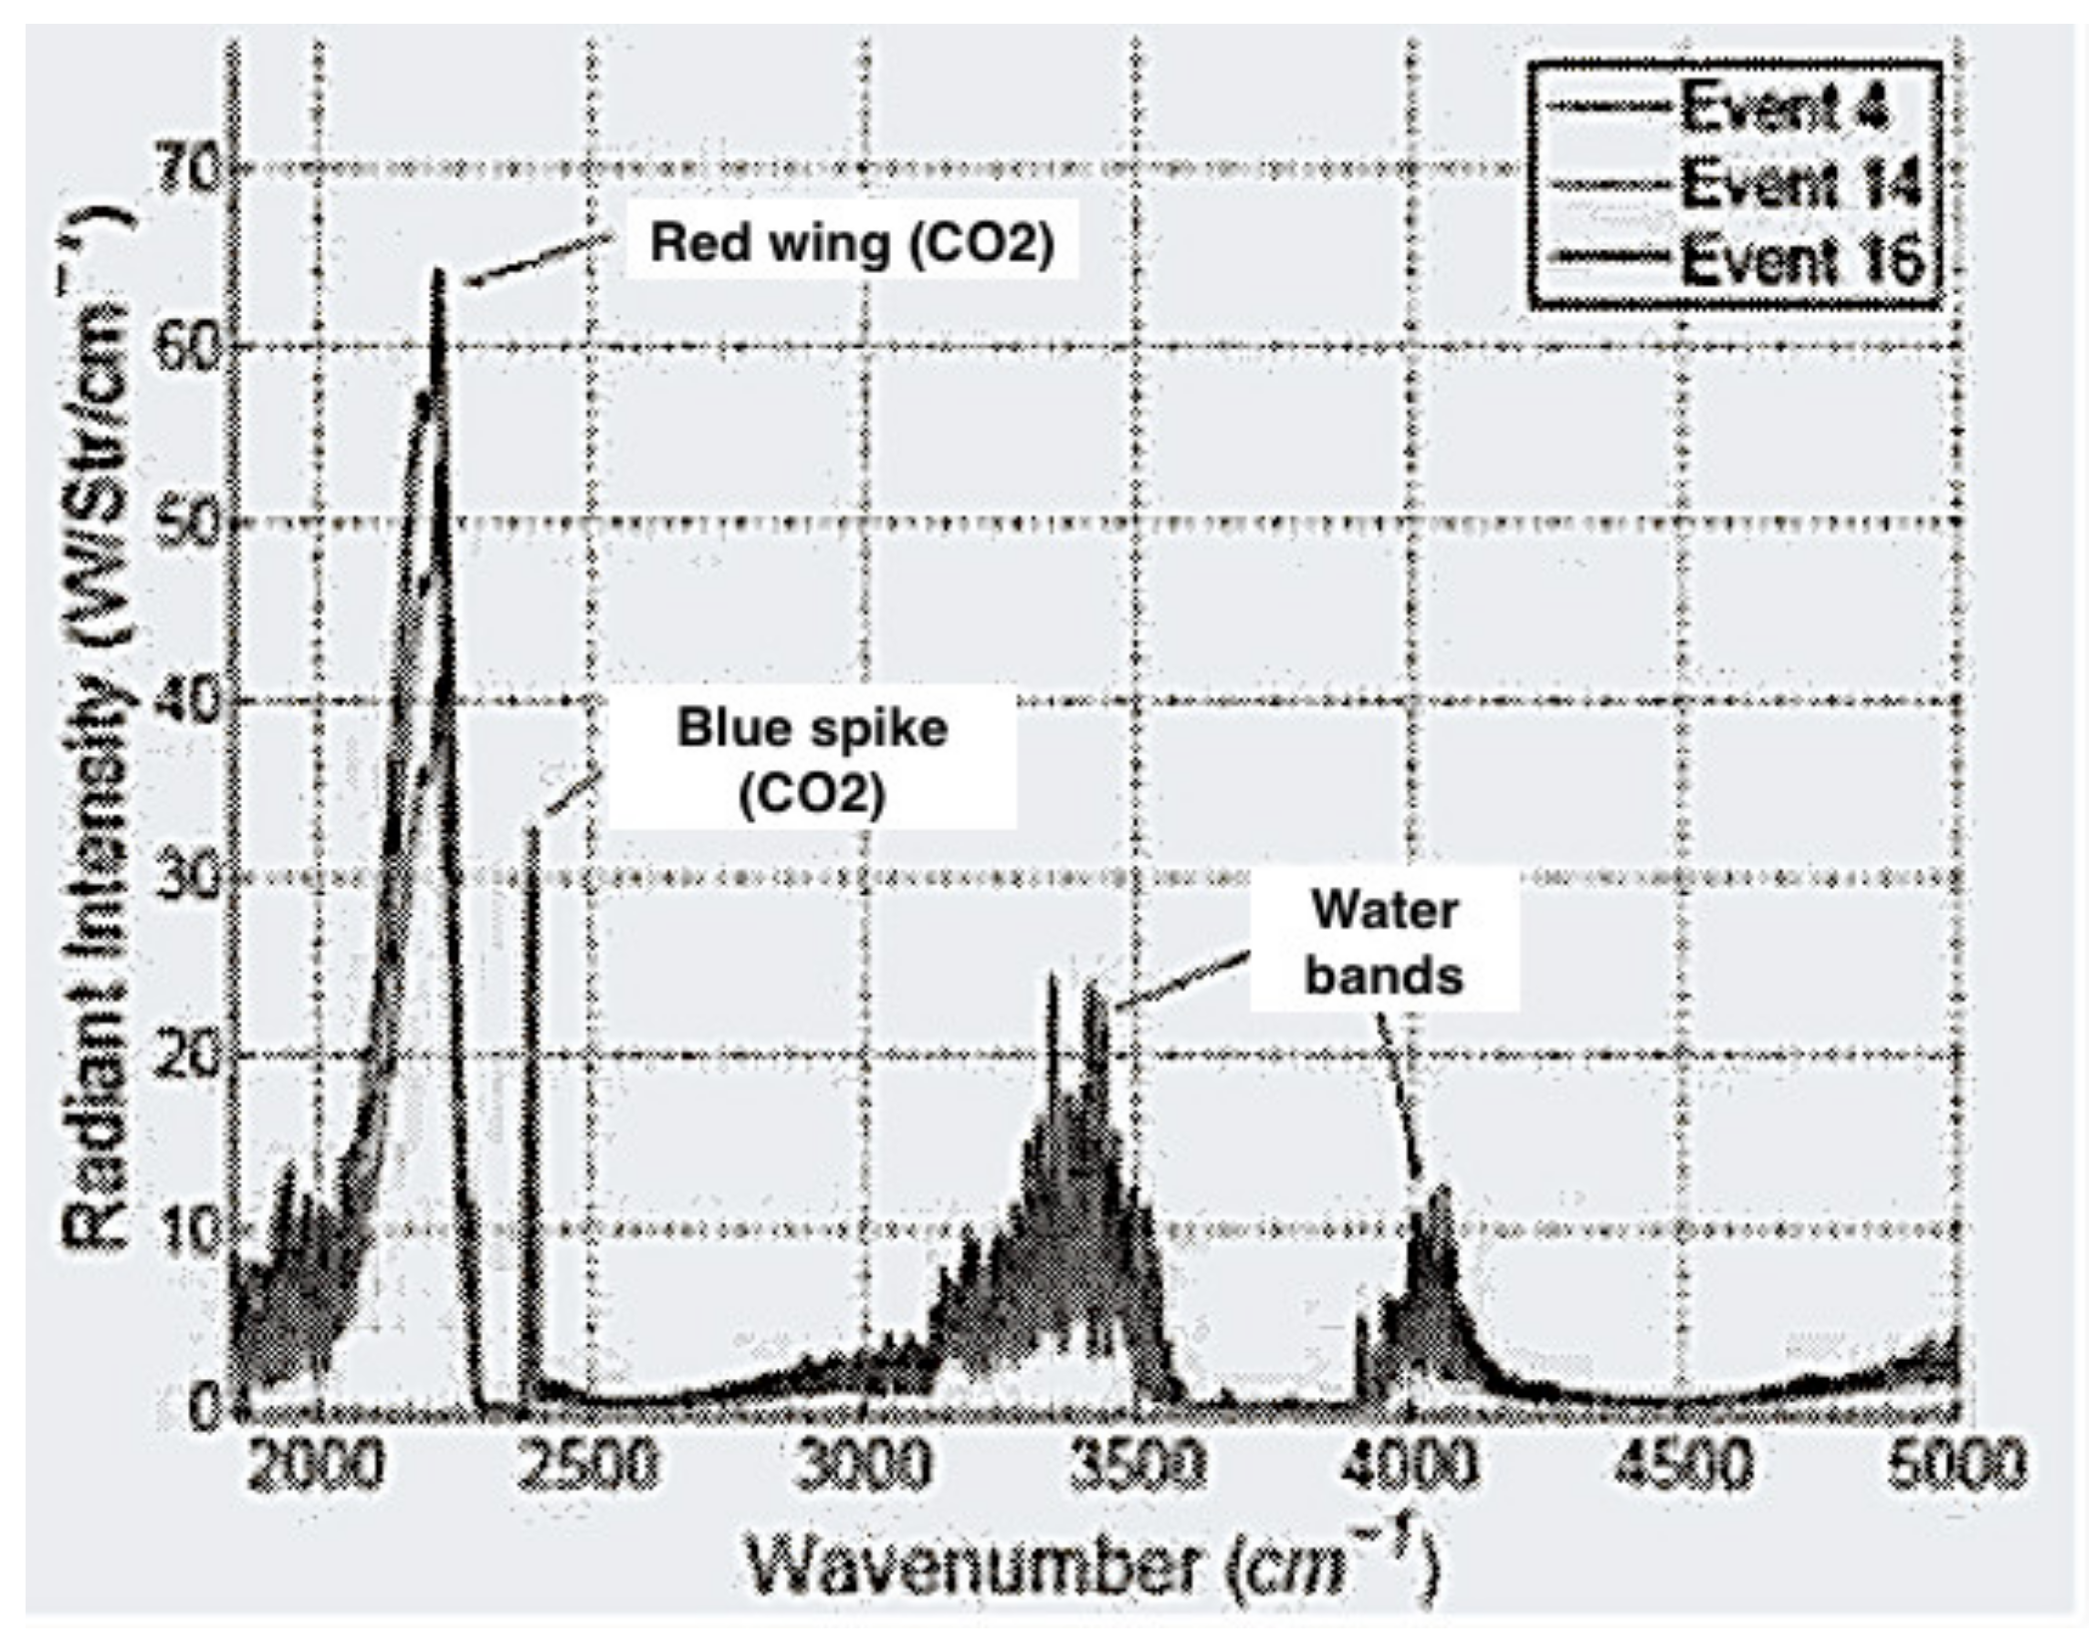
A similar experimental study on plume infrared signature was recently conducted by Higgins et al. [15], but for at higher temperatures, above 2000 K. These authors performed infrared radiation emission measurements of a liquid engine plume, measuring plume radiant intensity profiles, plume IR image, and plume spectral emission distribution. An example of the results obtained, with water and CO2 measured bands is shown in Figure 4.
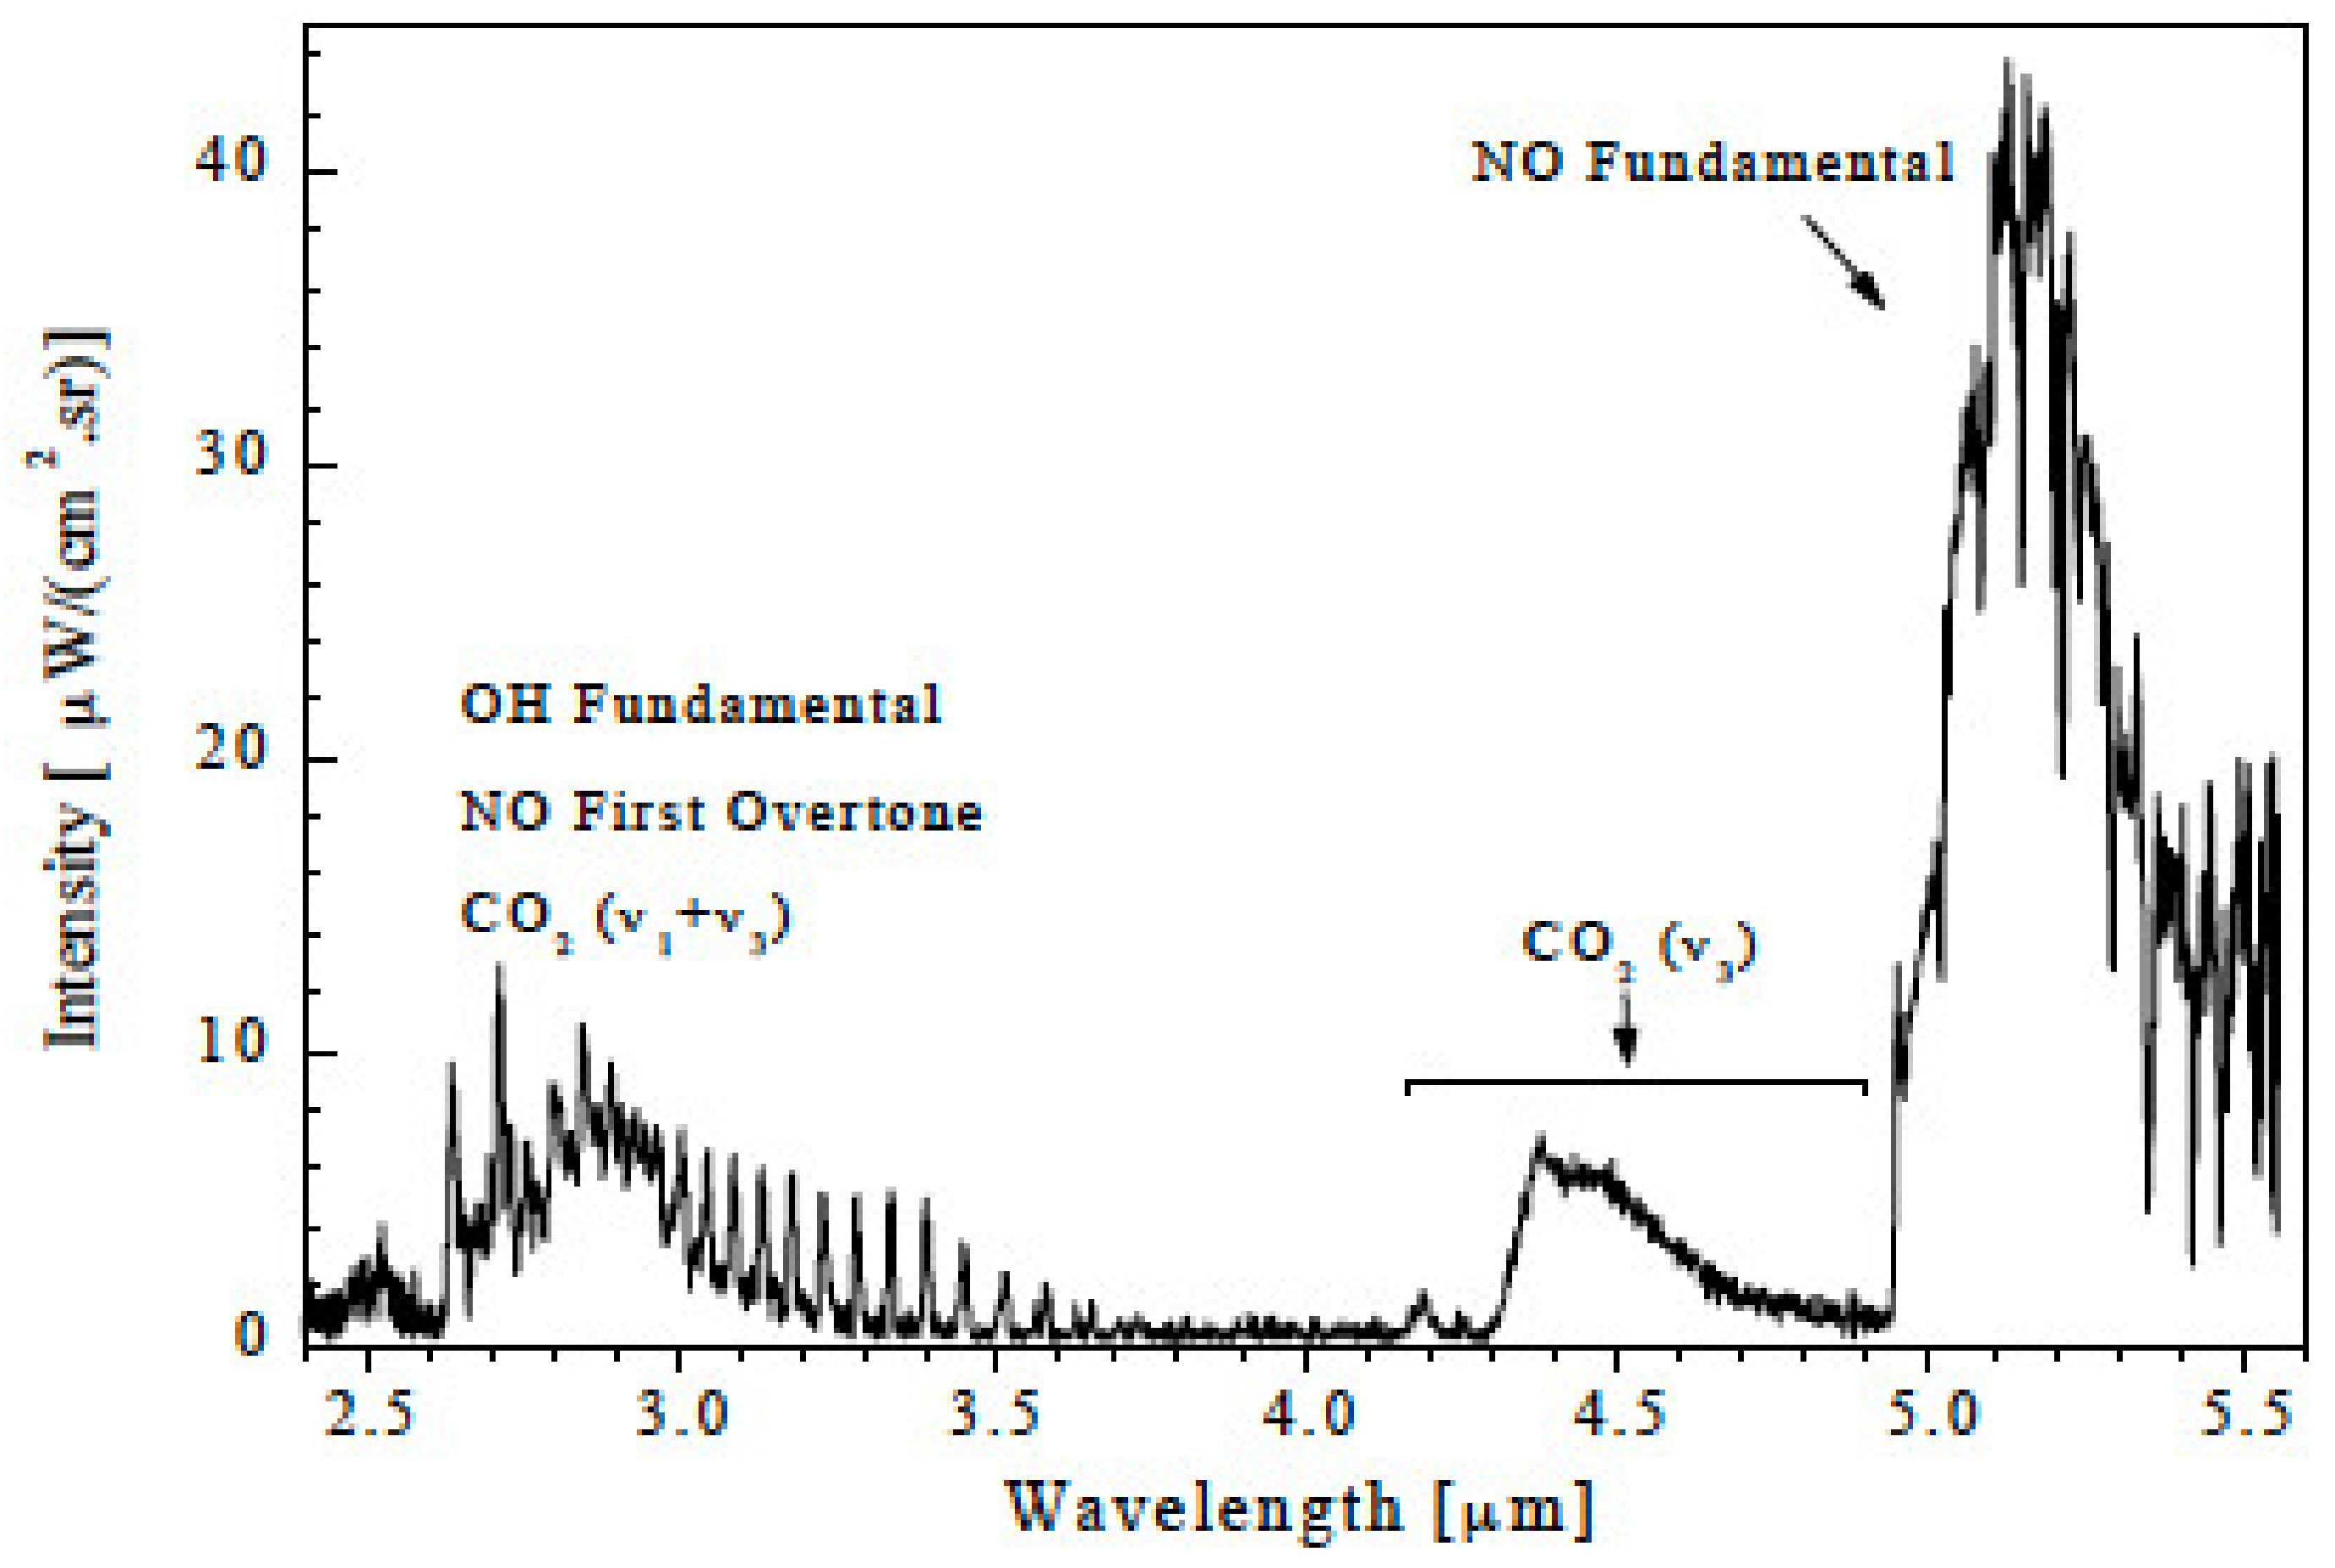
In the same context of infrared signature measurements, Packan et al. [16] have carried out an extensive experimental campaign on radiation in low temperature air plasma. For the tests, air was containing small quantities of CO2 and H2O, measurements were performed in a 50 kW inductive plasma torch at 3400 K. Measured emitted spectrum is shown in Figure 5, highlighting the contributions of NO, OH, CO, and CO2 bands.
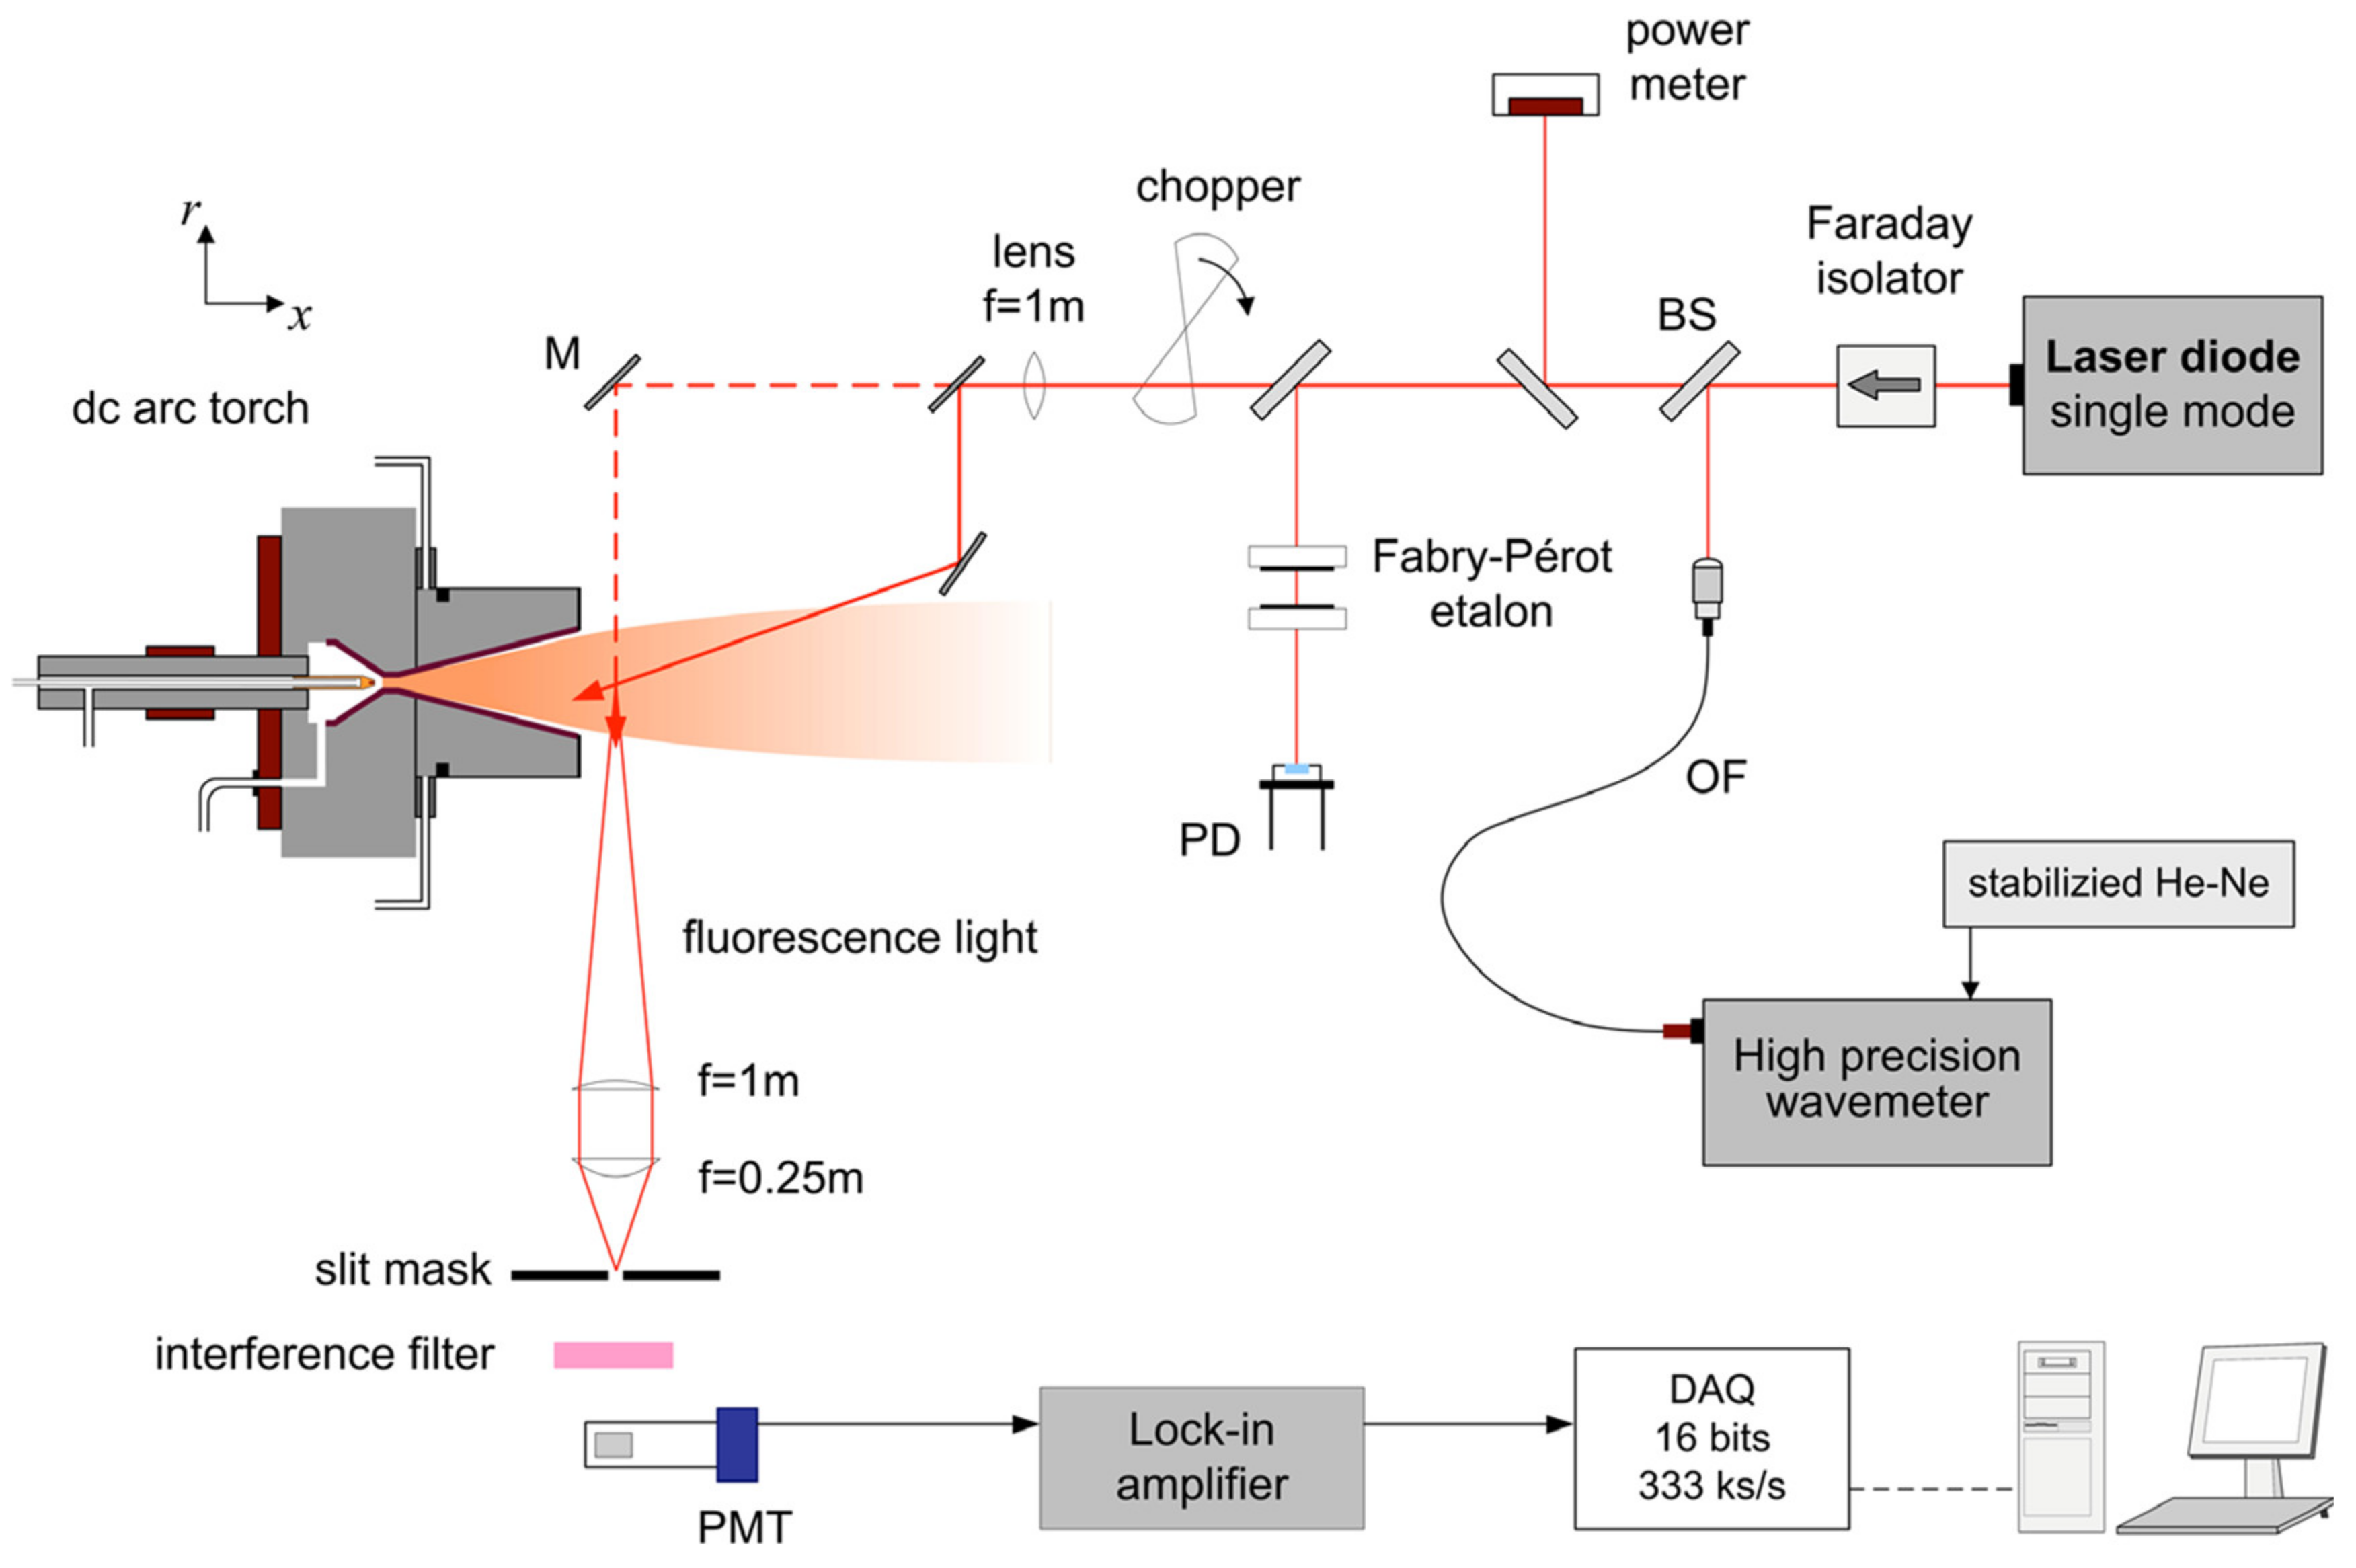
In the perspective of sample return missions to Mars, nozzle flows of CO2 have to be extensively investigated, since the launch of the return capsule from Mars ground will be performed in a CO2 atmosphere. The same would apply for Venus, but for a much higher pressure, even if a launch at high altitude using a balloon could be envisaged. For such objective, CO2 expansion flows have been studied by Mazouffre & Pawelec [12] in an arc-jet operating at low pressure, and both pure CO2 and CO2-N2 mixture were investigated for flow enthalpy of 9.4 and 6 kJ/kg respectively. The experimental set-up is schematized in Figure 6. Tests were performed for supersonic plasma jet, at 4200 m/s for CO2, and 3400 m/s for CO2-N2, with temperature of 17,000 K and 11,000 K in the shock region respectively. Measurements were based on the excitation of oxygen atom metastable level O(5S) as the laser frequency is scanned over the oxygen triplet system (3s → 3p transition) at 777.1944 nm; however they were mostly focused on the velocity and temperature distributions within the plasma jet and no radiation spectra have been published.
4. Venus
4.1. Test Conditions
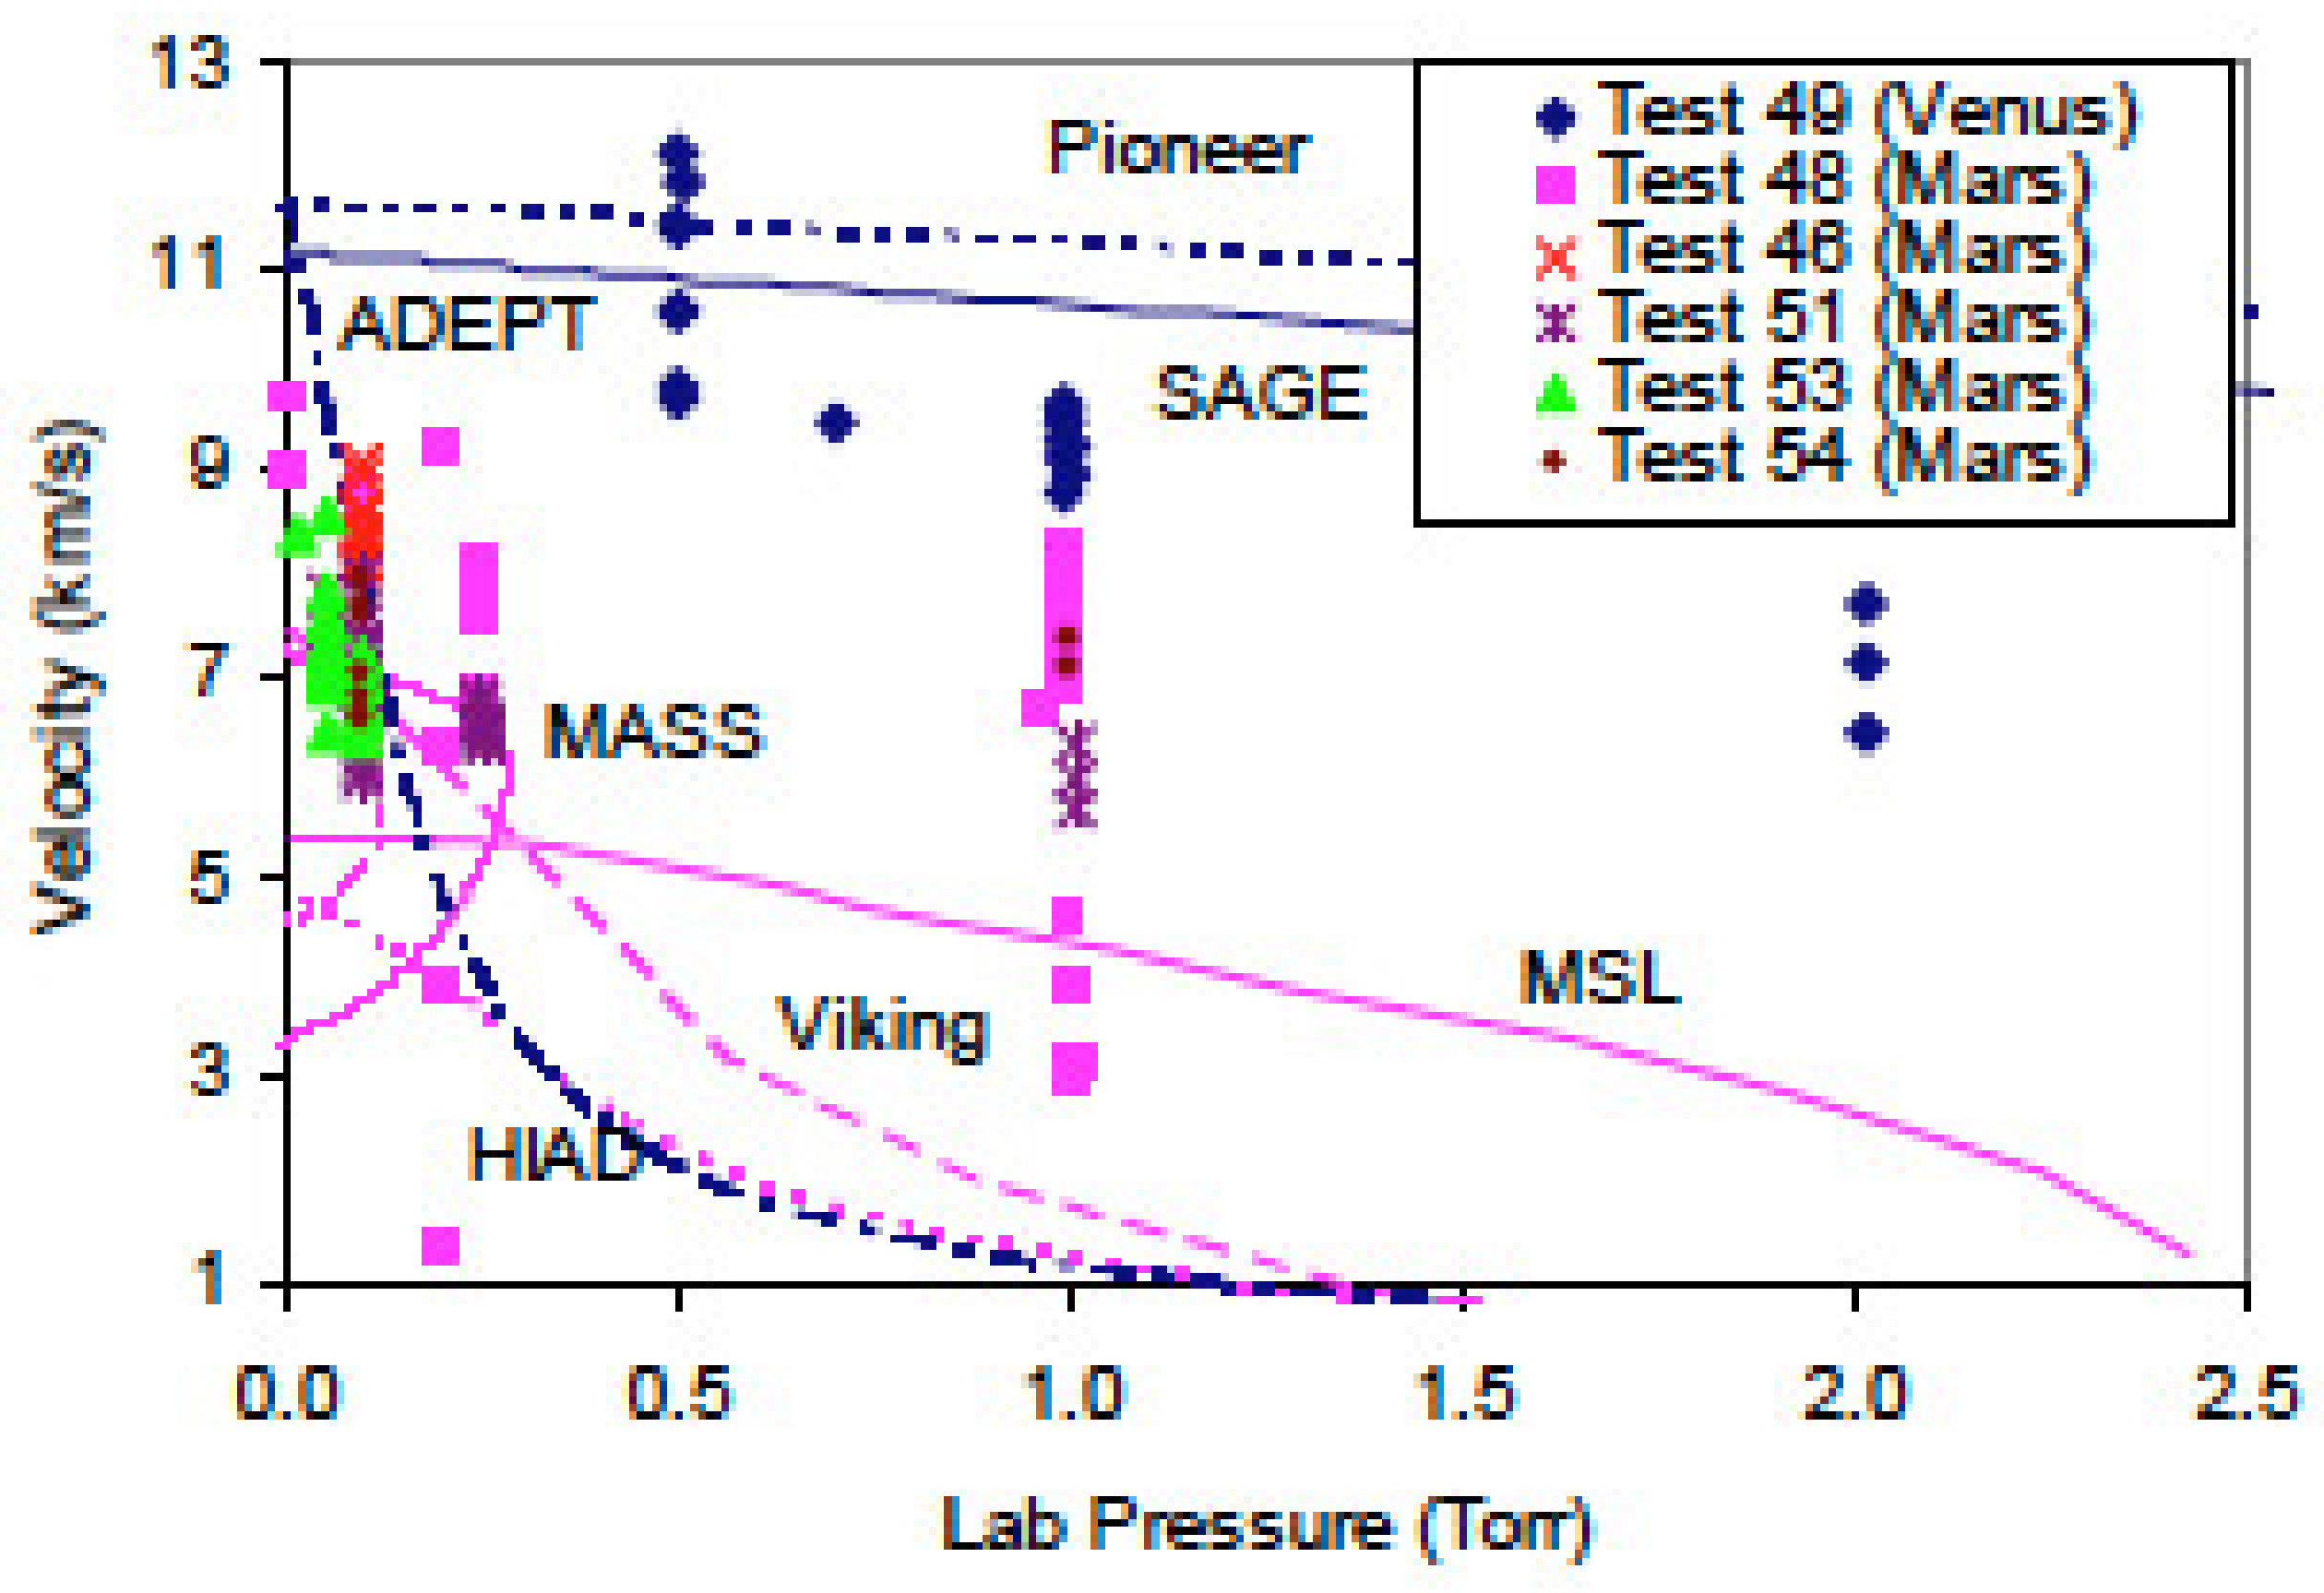
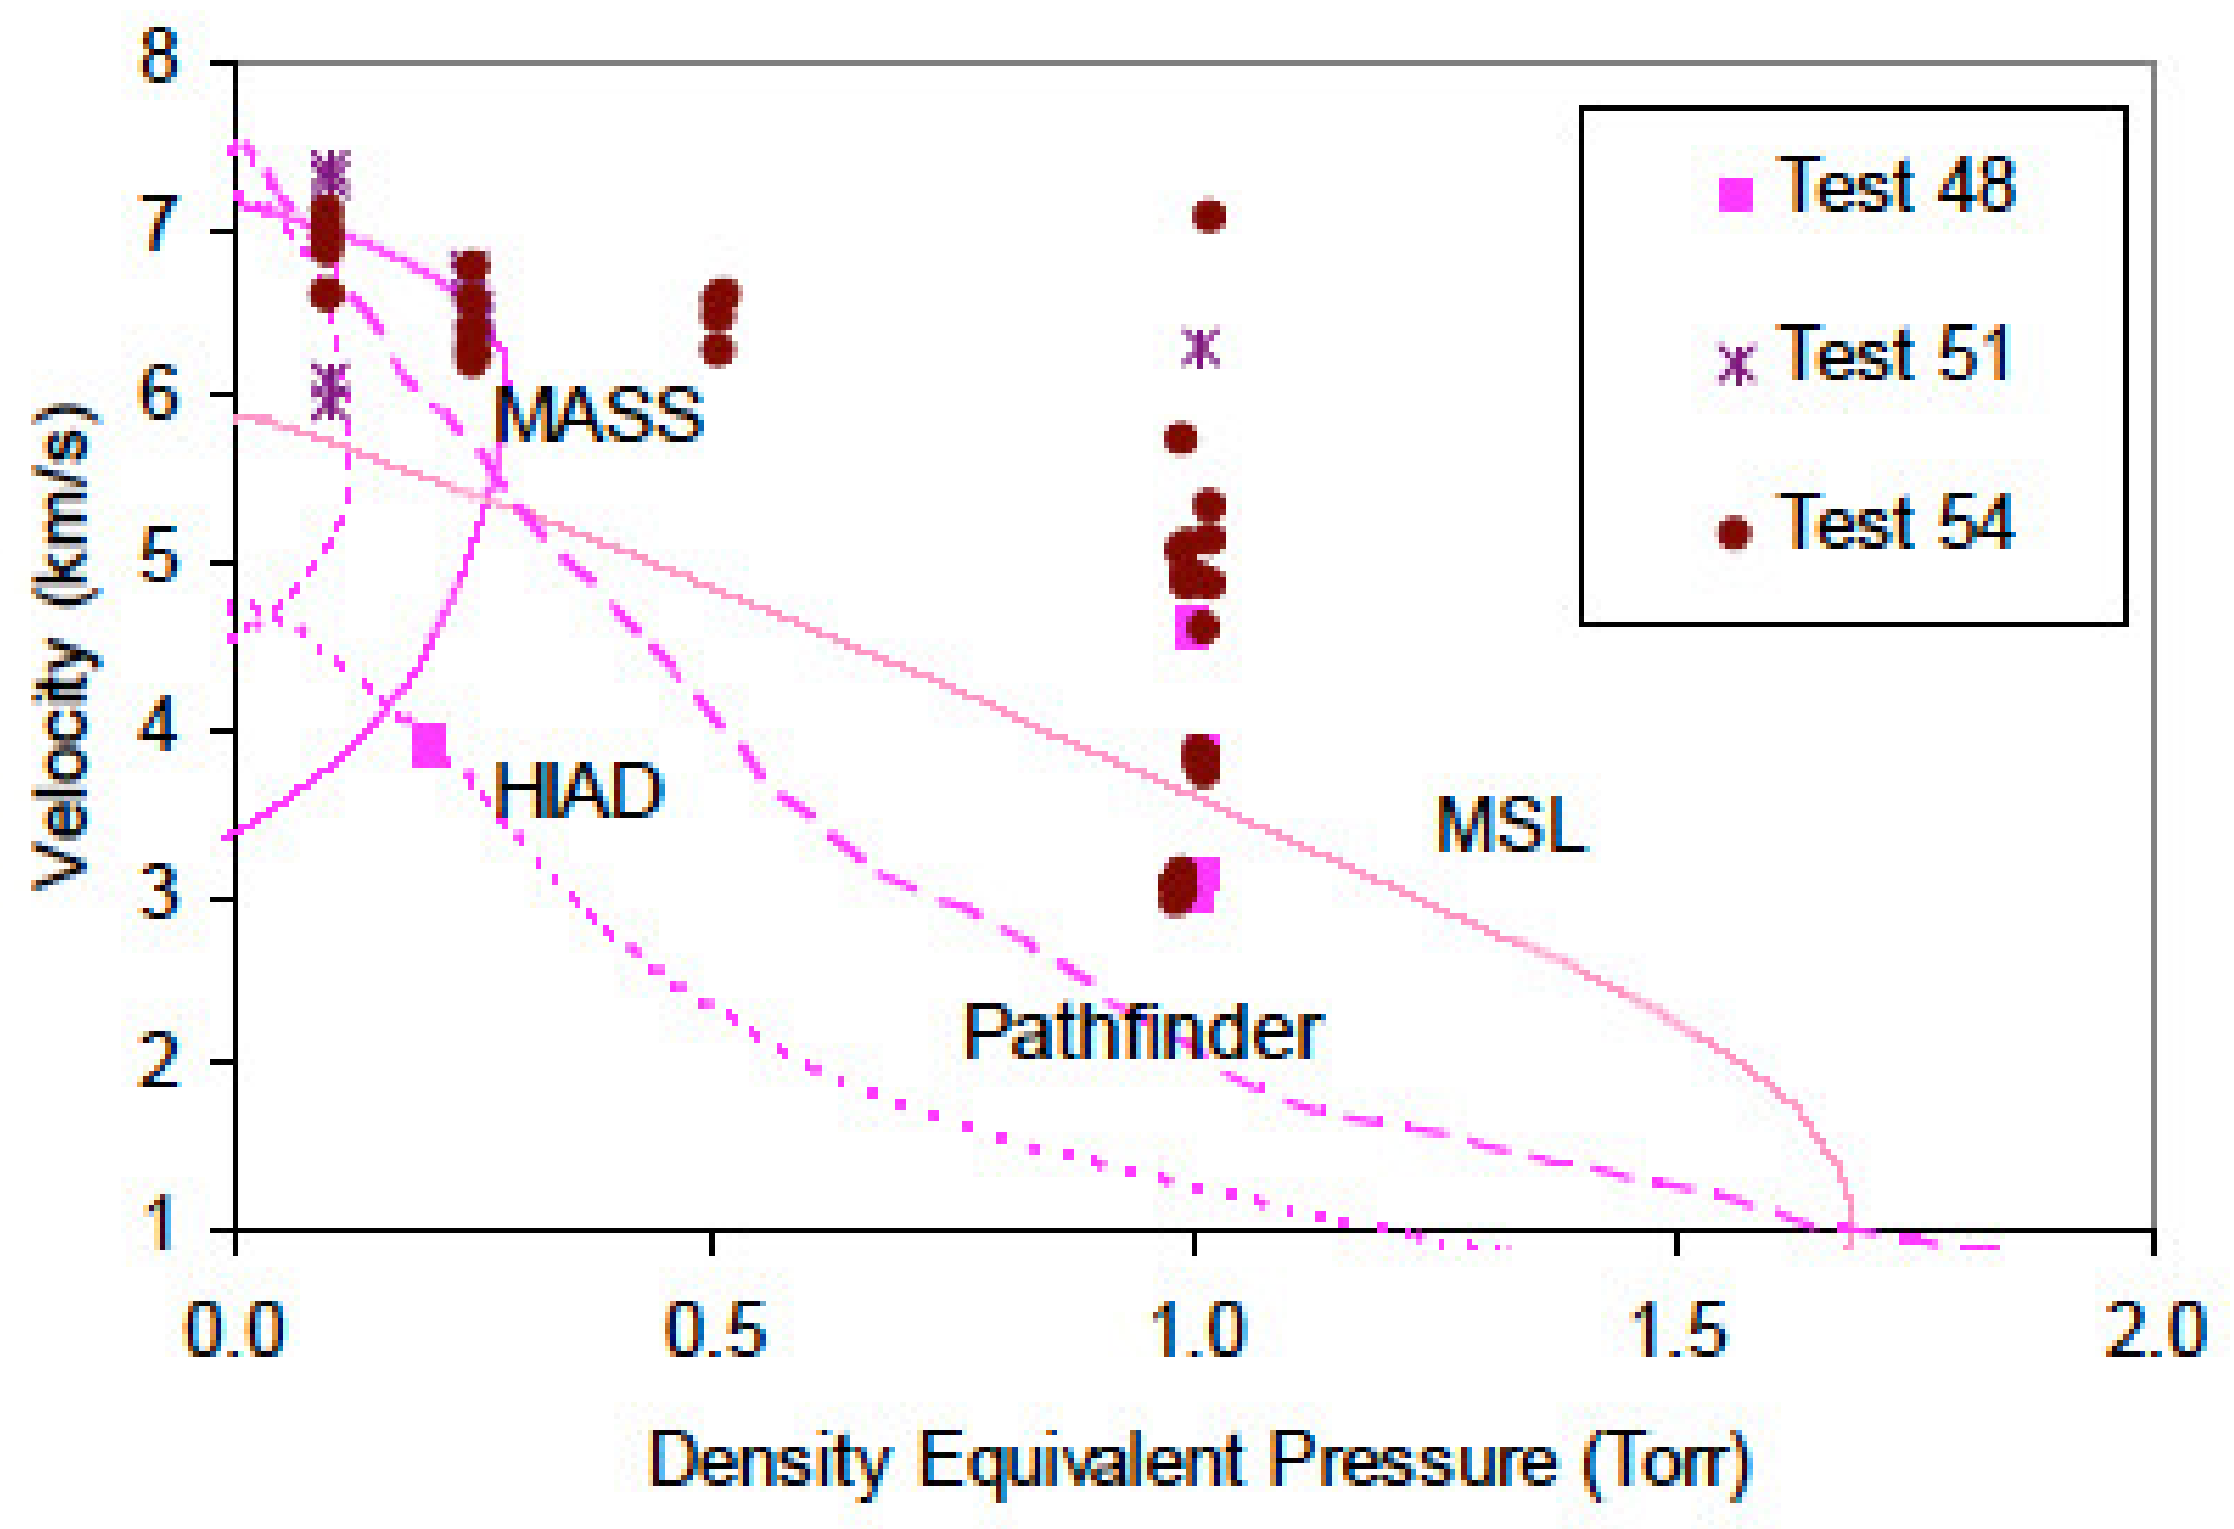
Several experimental studies have been focused on radiation measurements for Mars aerocapture and Venus entry conditions. Experimental campaigns for Venus entry have been carried out in EAST shock-tube by Martinez [1], and Cruden et al. [17,18]. The calibration of the deuterium lamp selected for the VUV measurements is detailed in [1]. In these studies, a 96.5 CO2 and 3.5 N2 atmosphere was considered for Venus, while a 96 CO2 and 4 N2 atmosphere was retained for investigating a Mars aerocapture in [1]. The different entry conditions investigated for VUV measurements related to Venus entry are resumed in Table 1. A comparison between the conditions tested in [17] and the some entry probe trajectories is shown in Figure 7. Experiments were performed from the VUV to IR ranges, from 120 up to 1700 nm at high velocities, in [1], and up to 5000 nm for low velocities, in [17,18].
4.2. Available Datasets
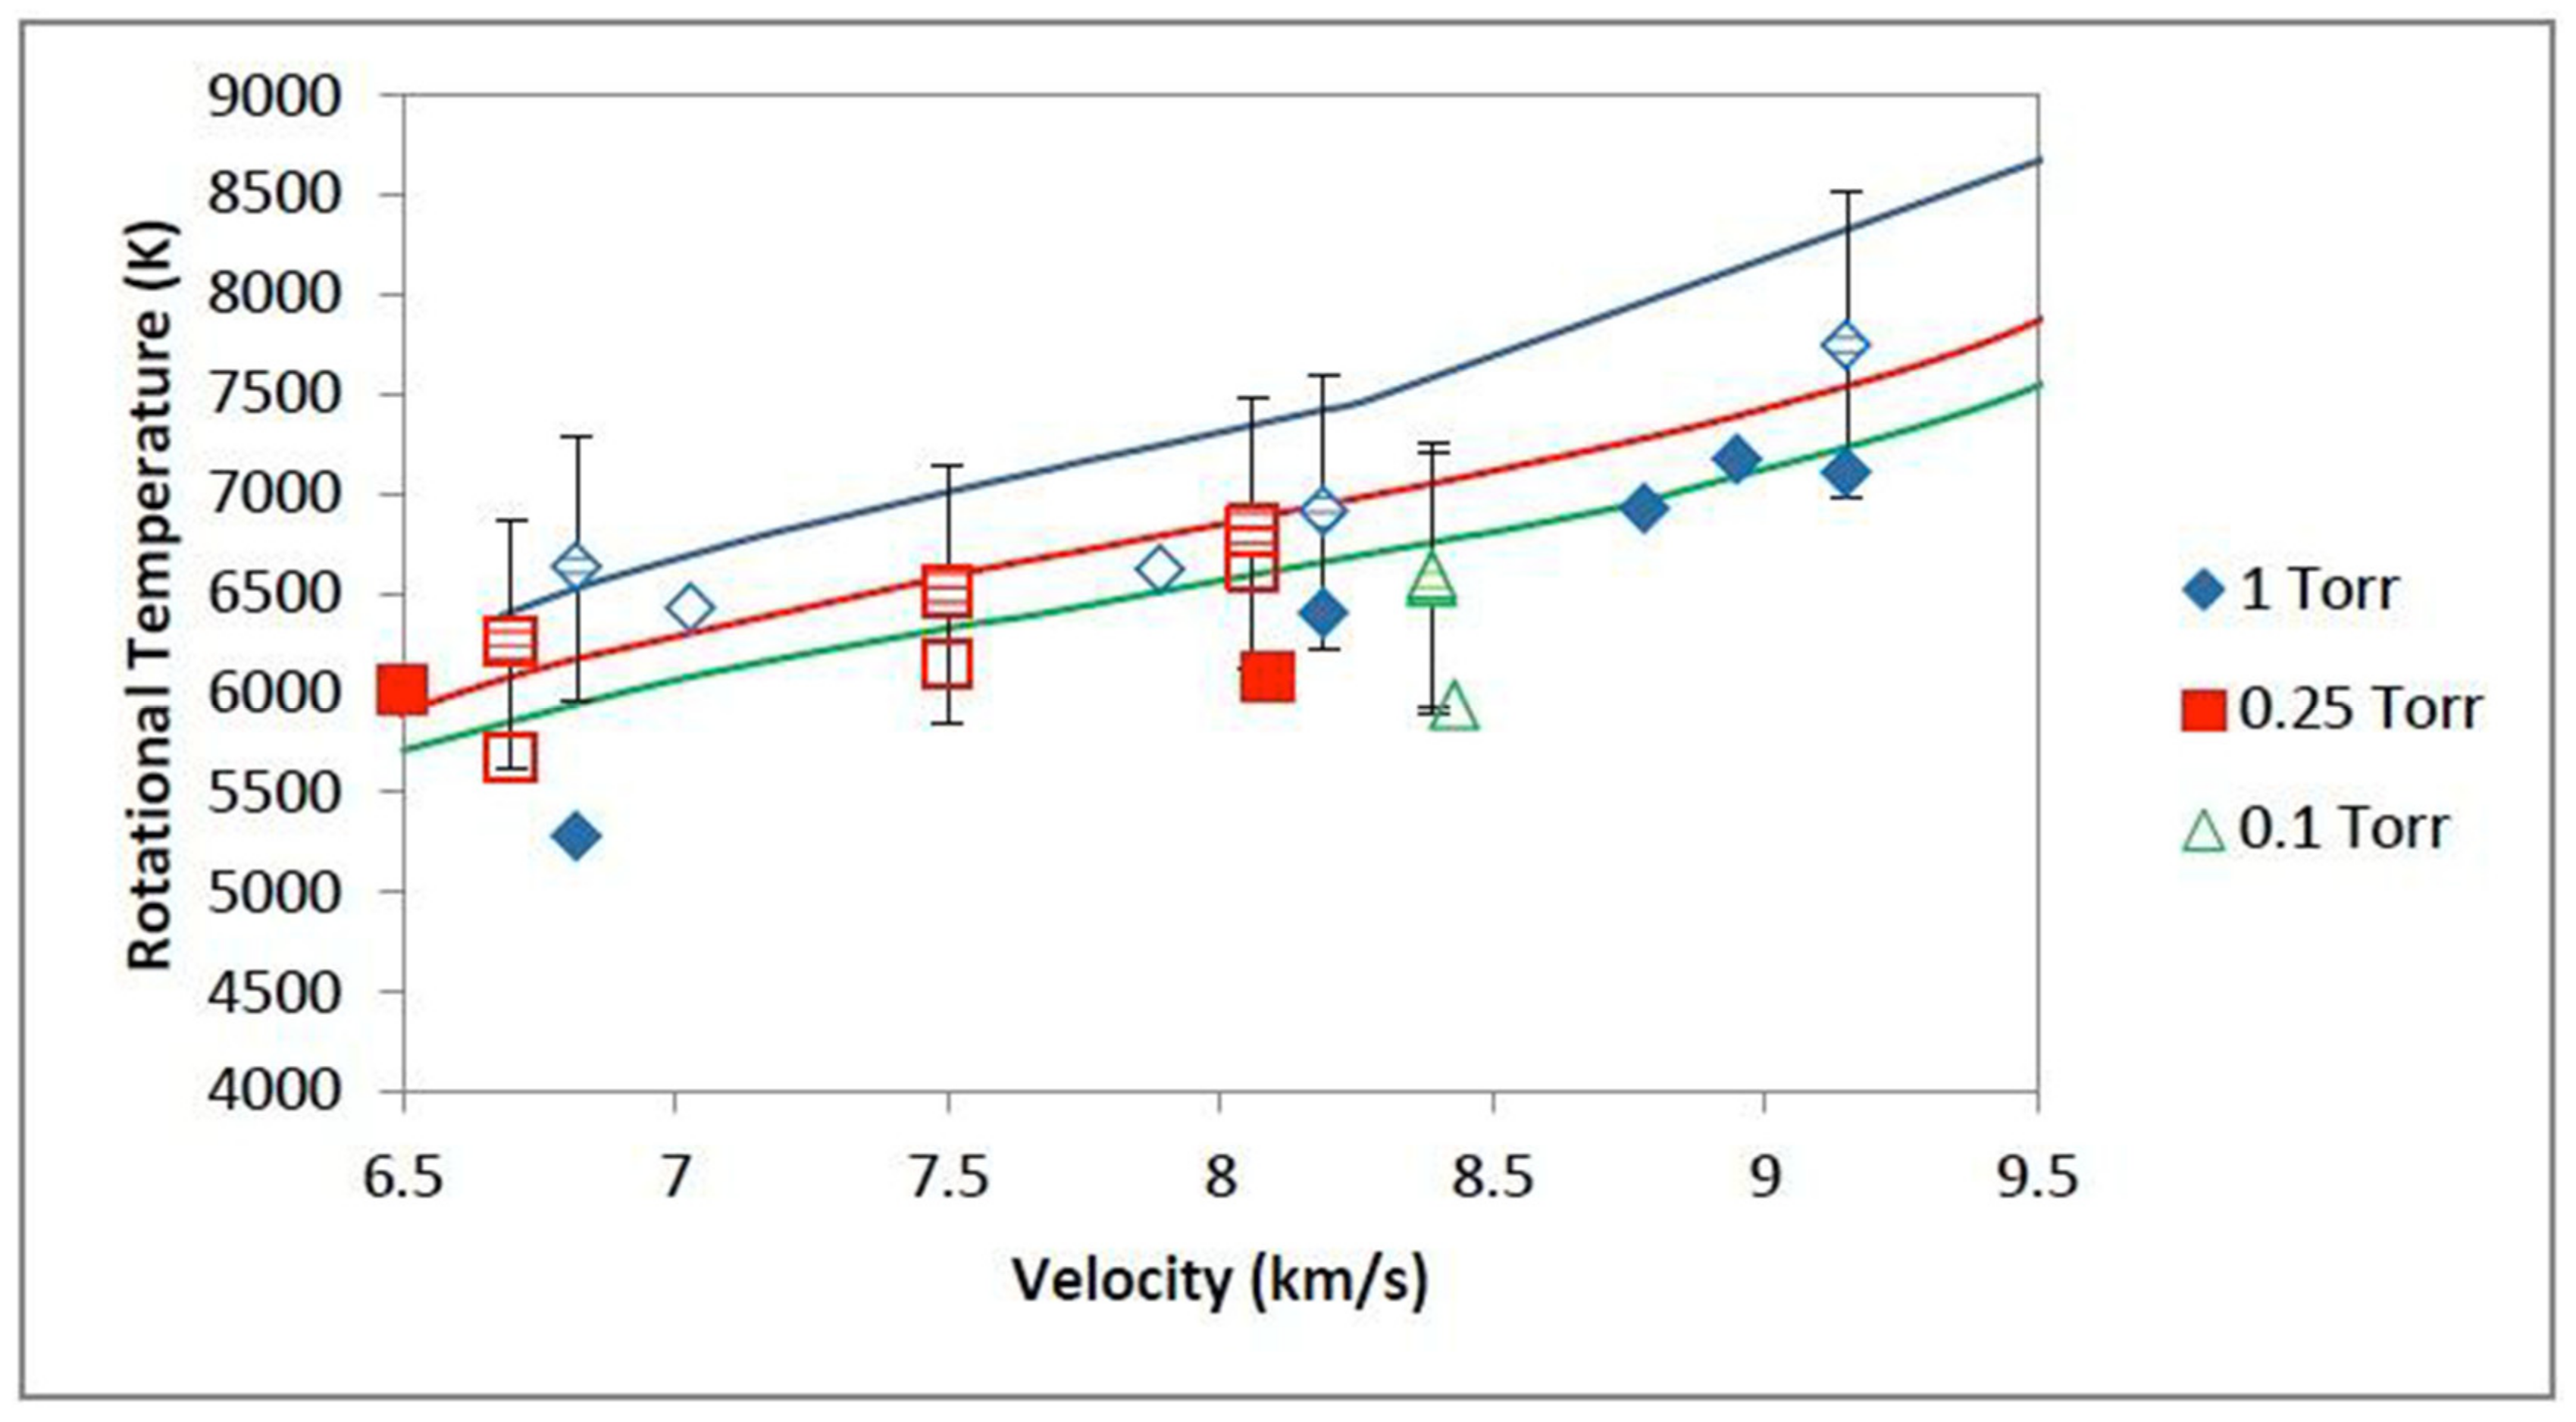
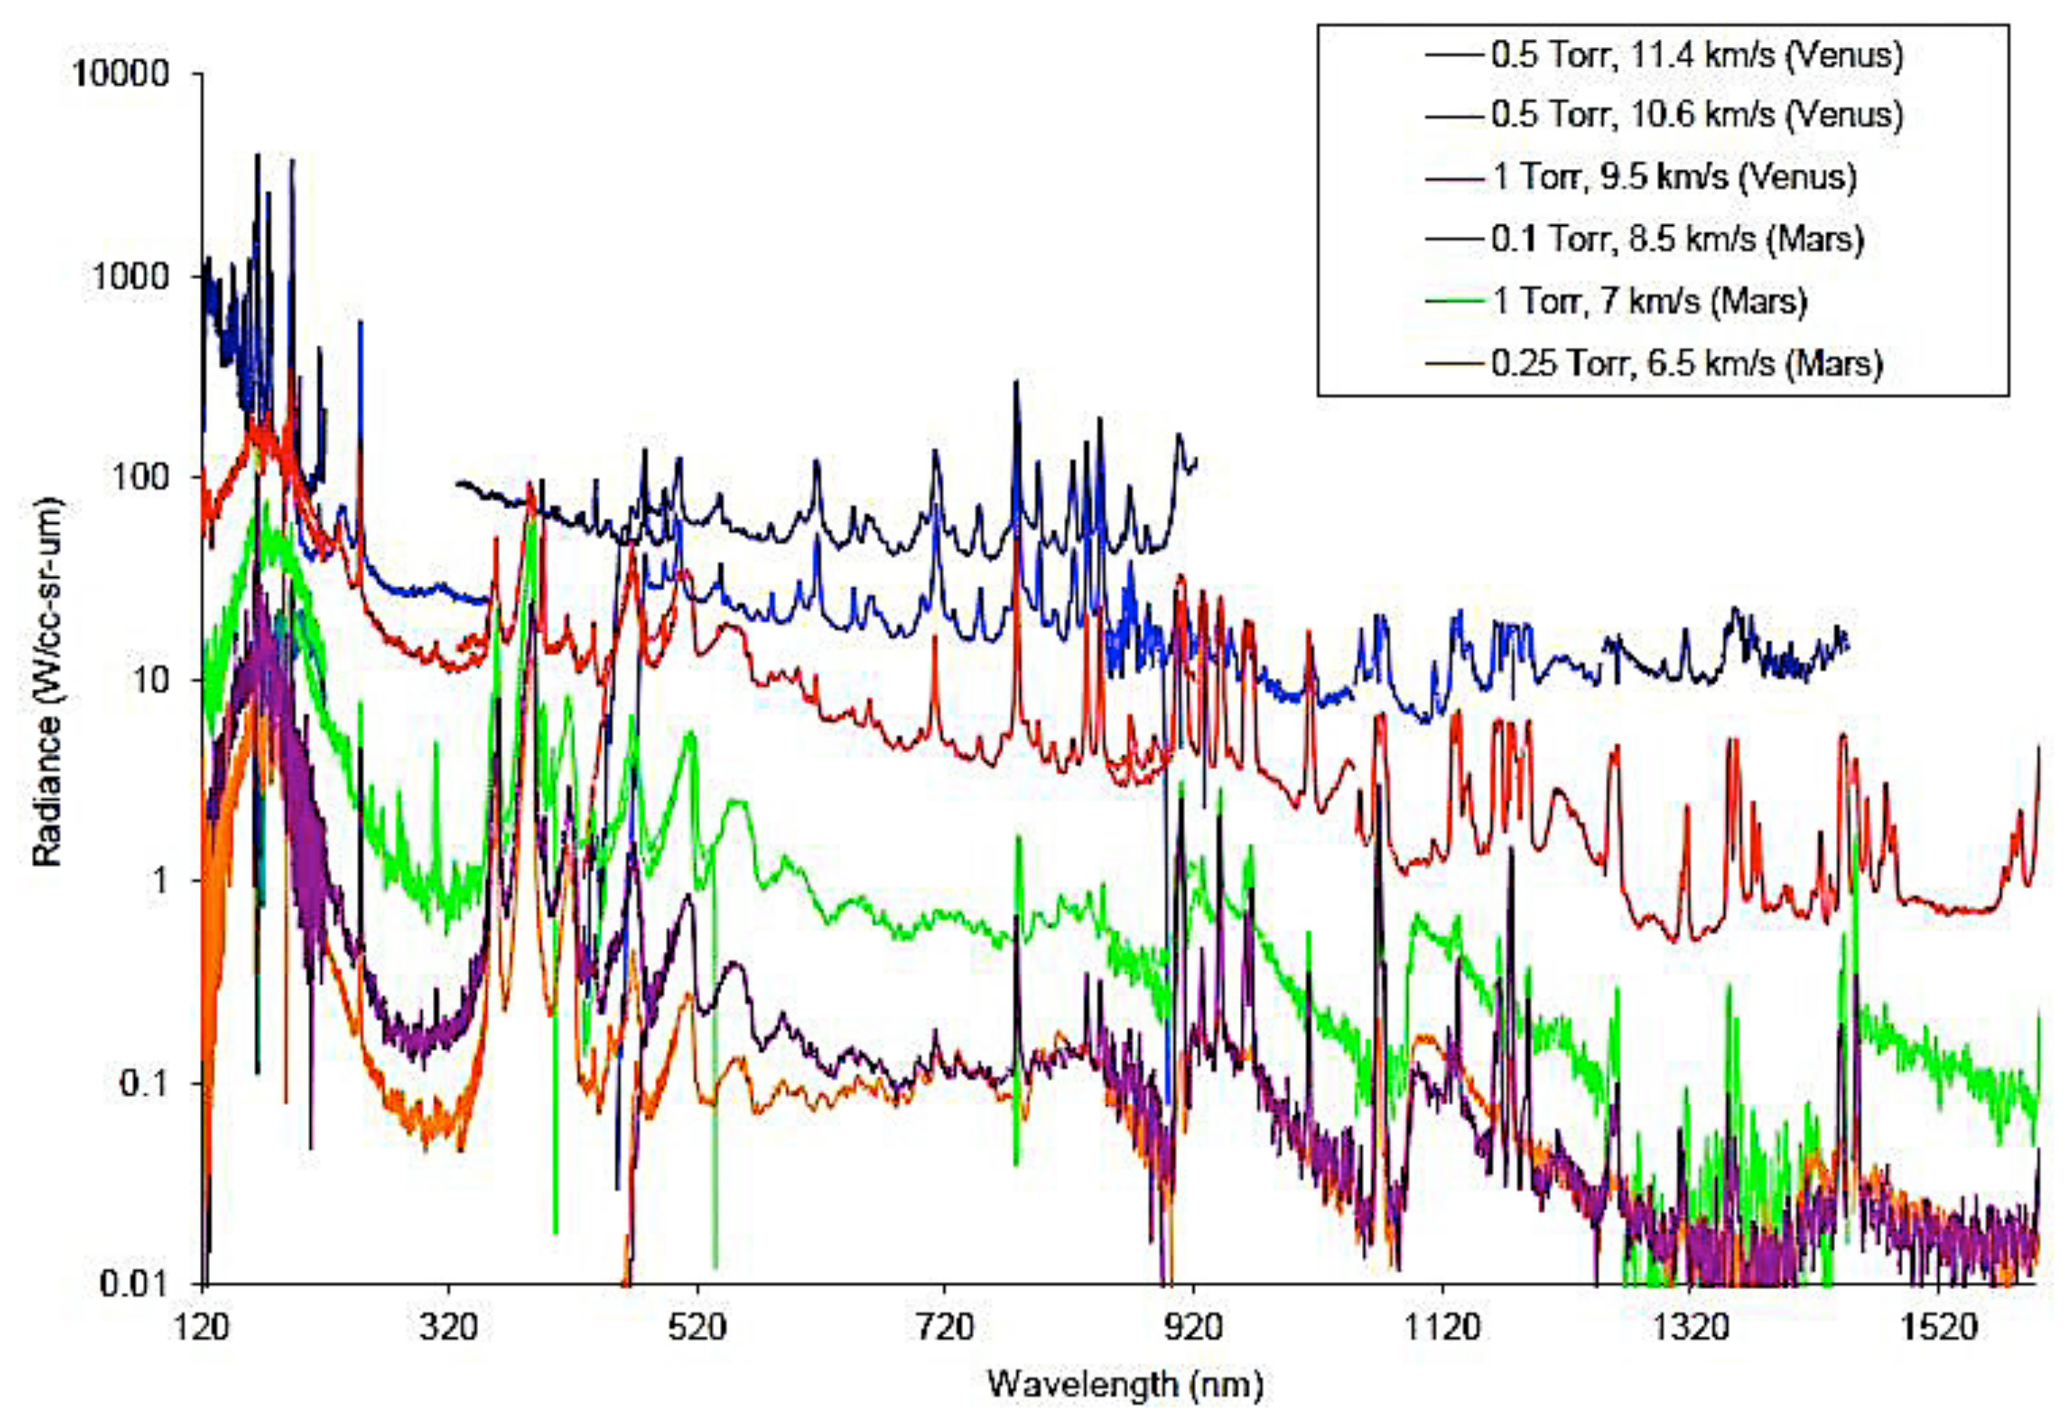
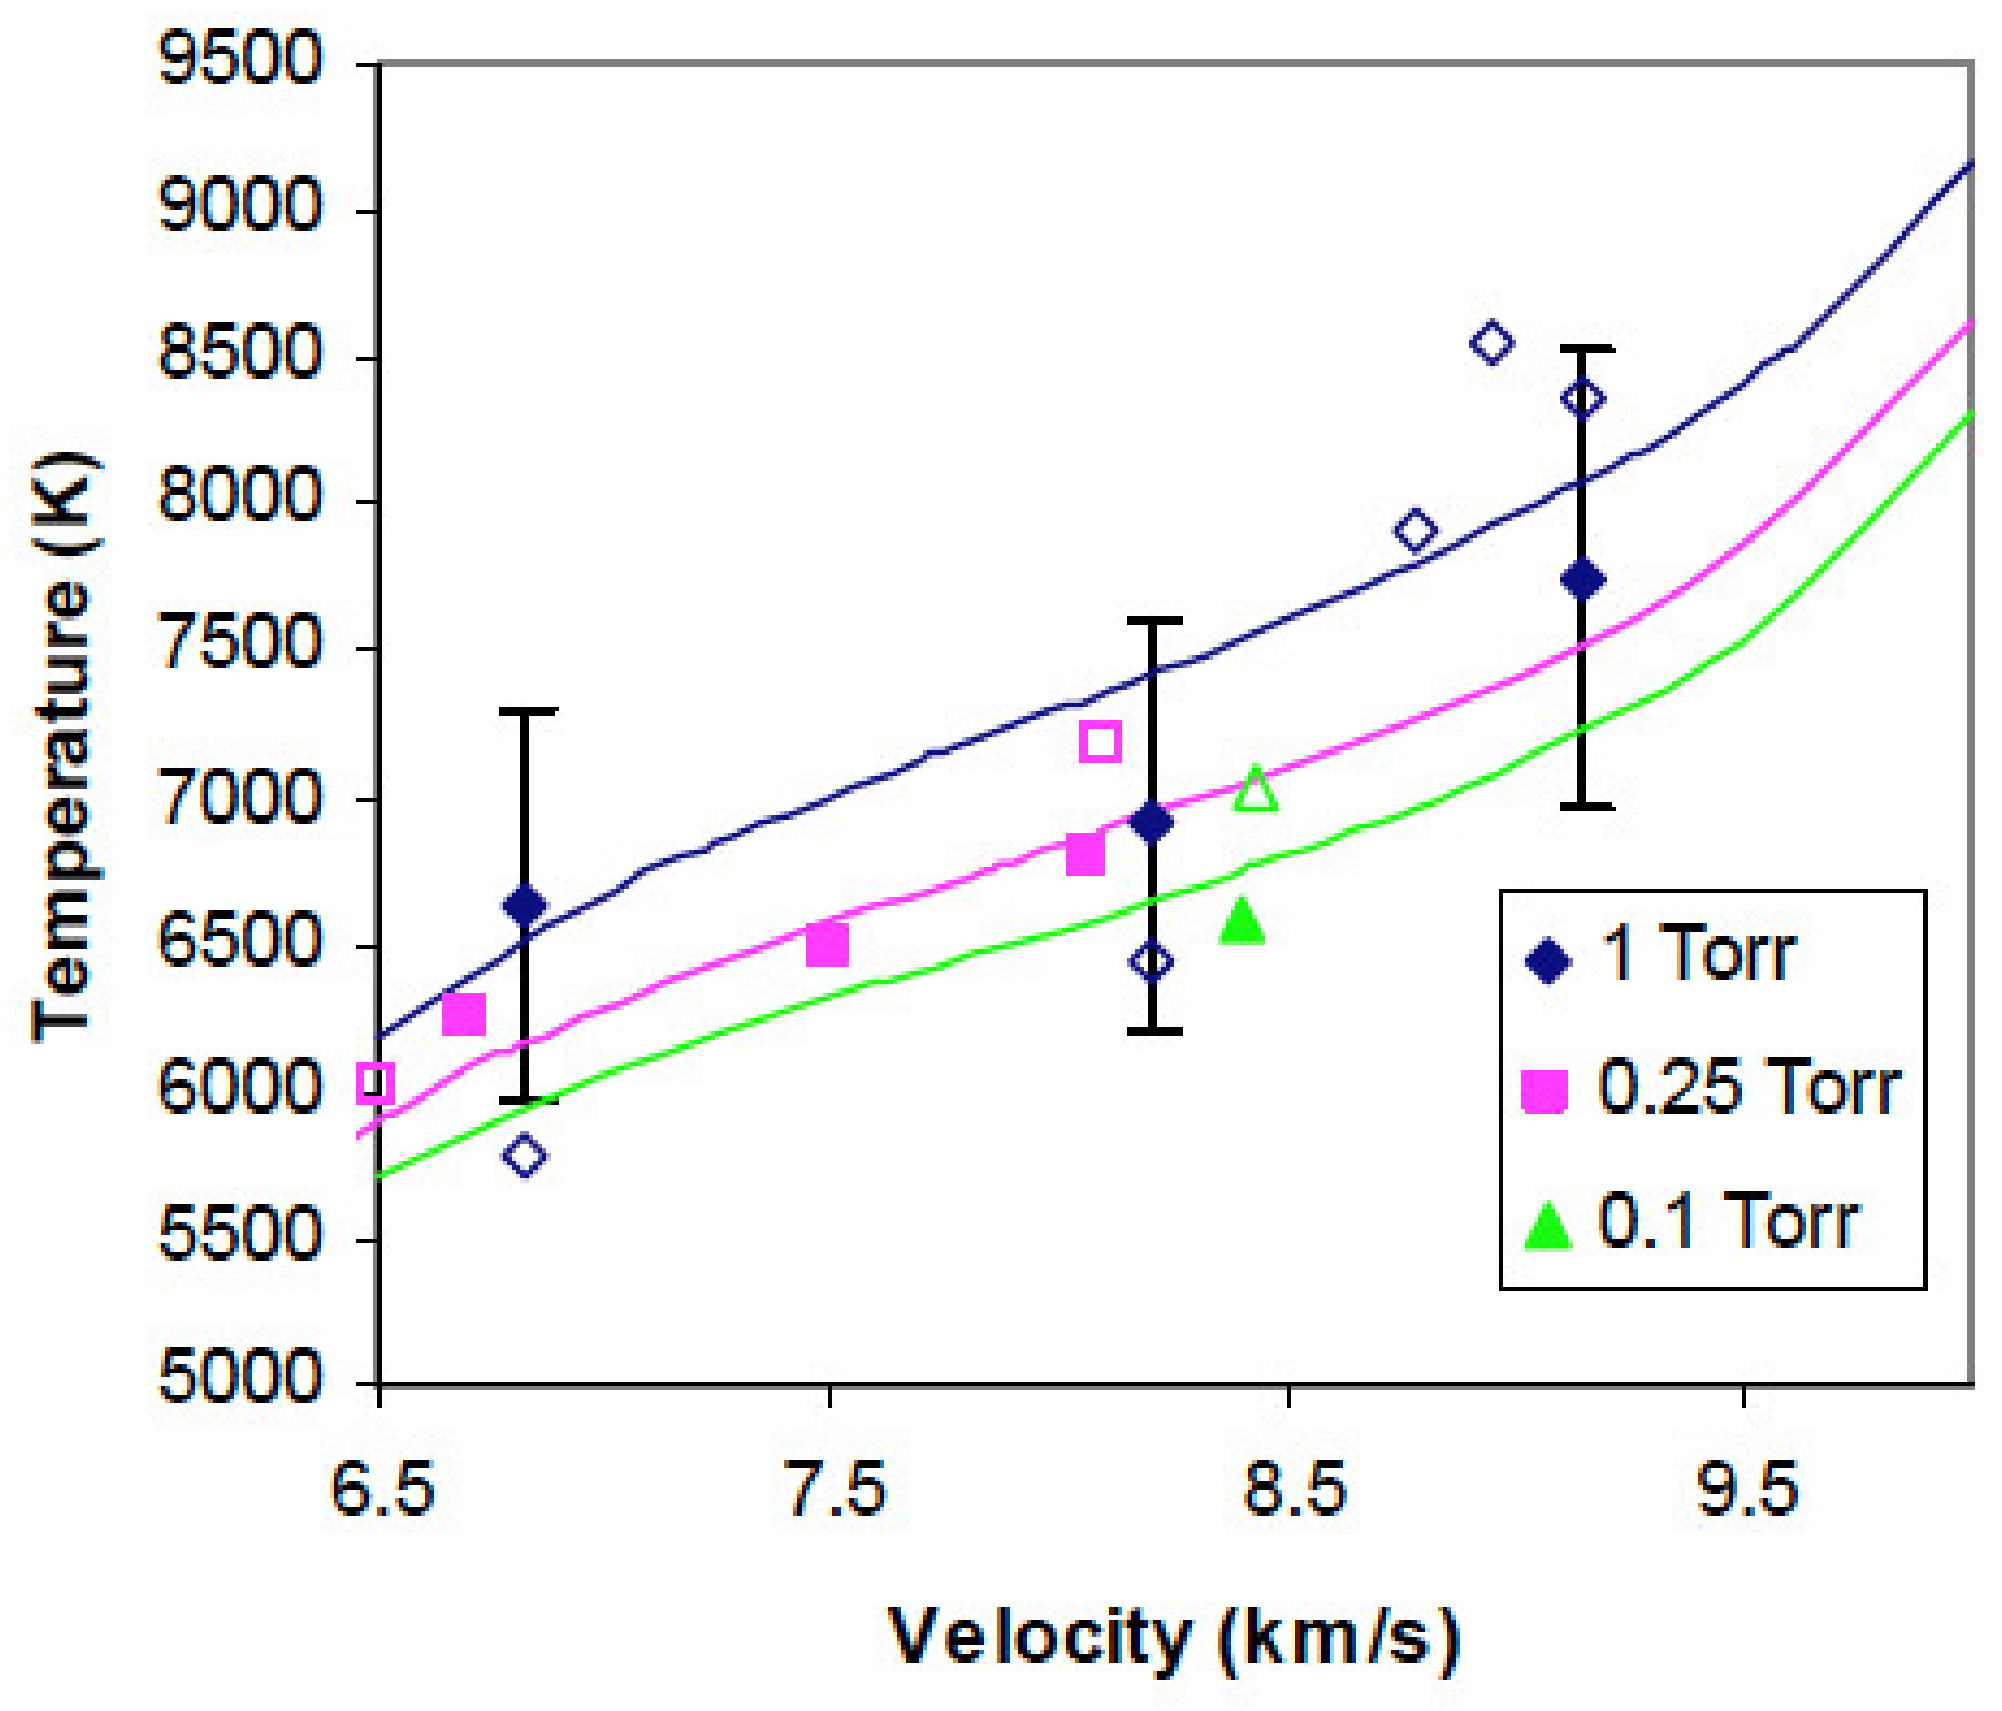
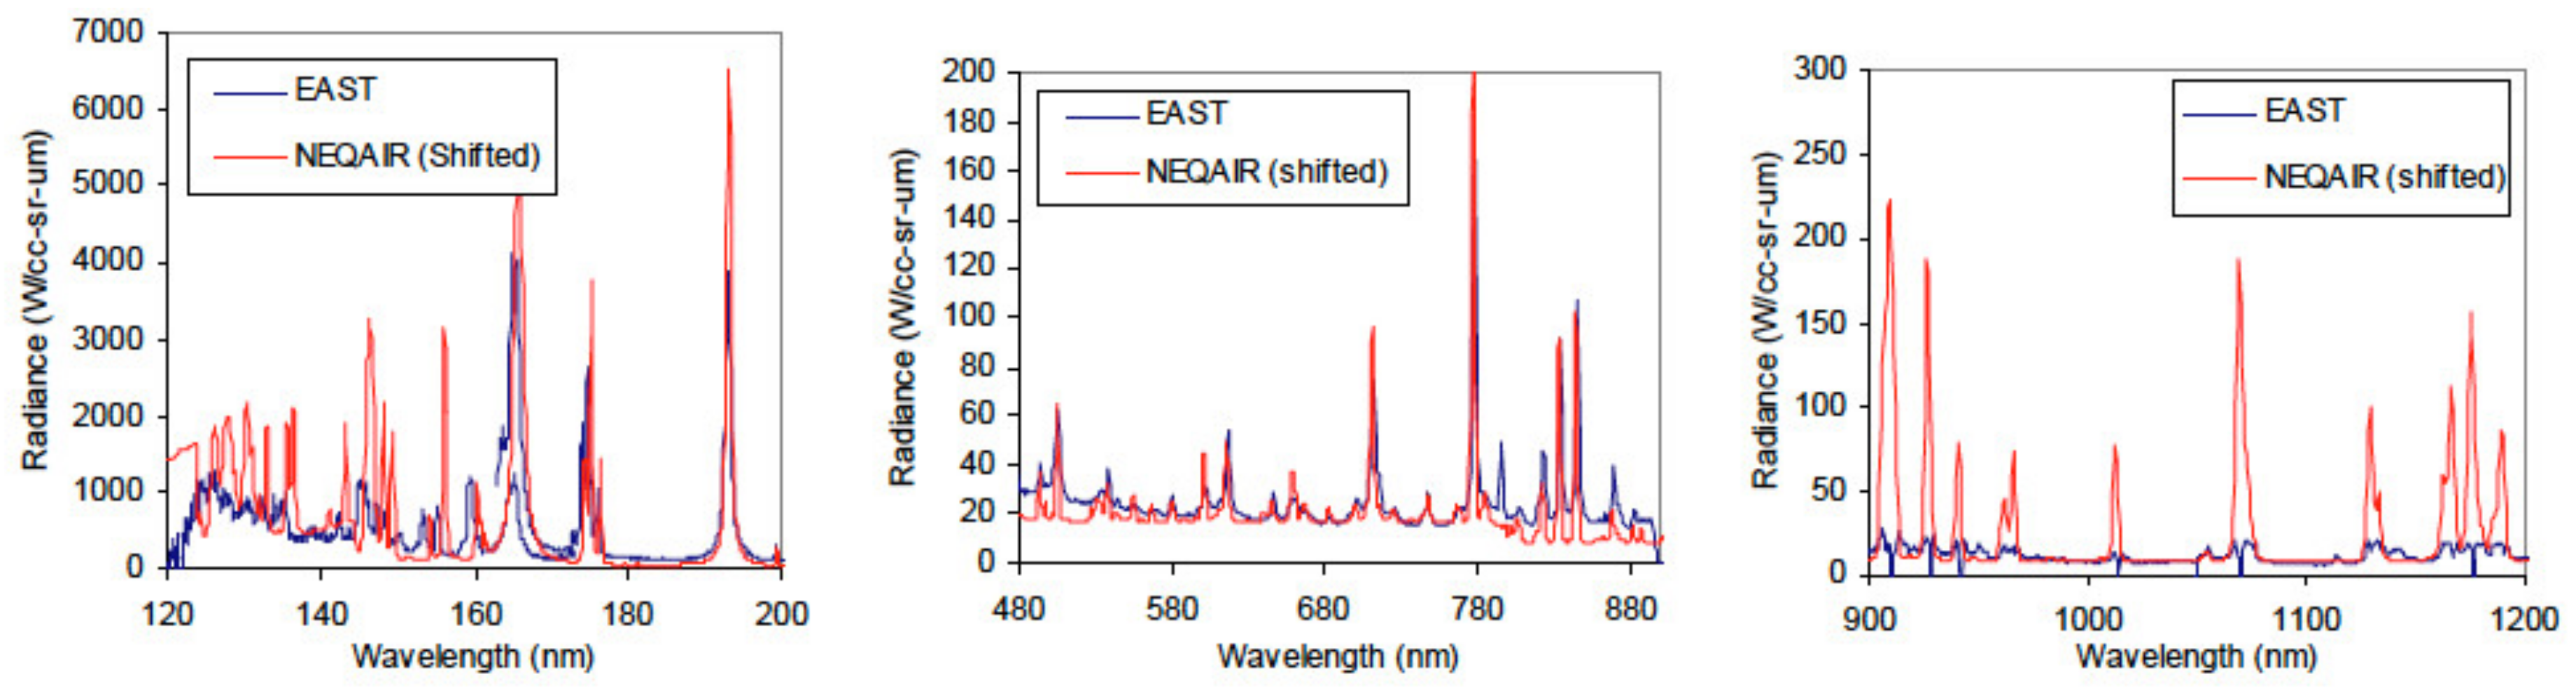
The study carried out by Martinez [1] focuses more particularly on CN, and C2 and their related rotational temperatures. The results obtained for the rotational temperature as function of the shock velocity are displayed in Figure 8. They highlight the increase of the rotational temperature with the shock velocity. The spectra from 120 to 1520 nm, obtained by Martinez [1] for both Mars aerocapture, at 6.5, 7, and 8.5 km/s, and Venus entry conditions, at 9.5, 10.6, and 11.4 km/s, are shown in Figure 9. Datasets cover VUV up to NIR radiation, with the major contribution in the VUV. The VUV range is dominated by the CO(4+) system, two carbon atomic lines are also present at 193 and 248 nm.
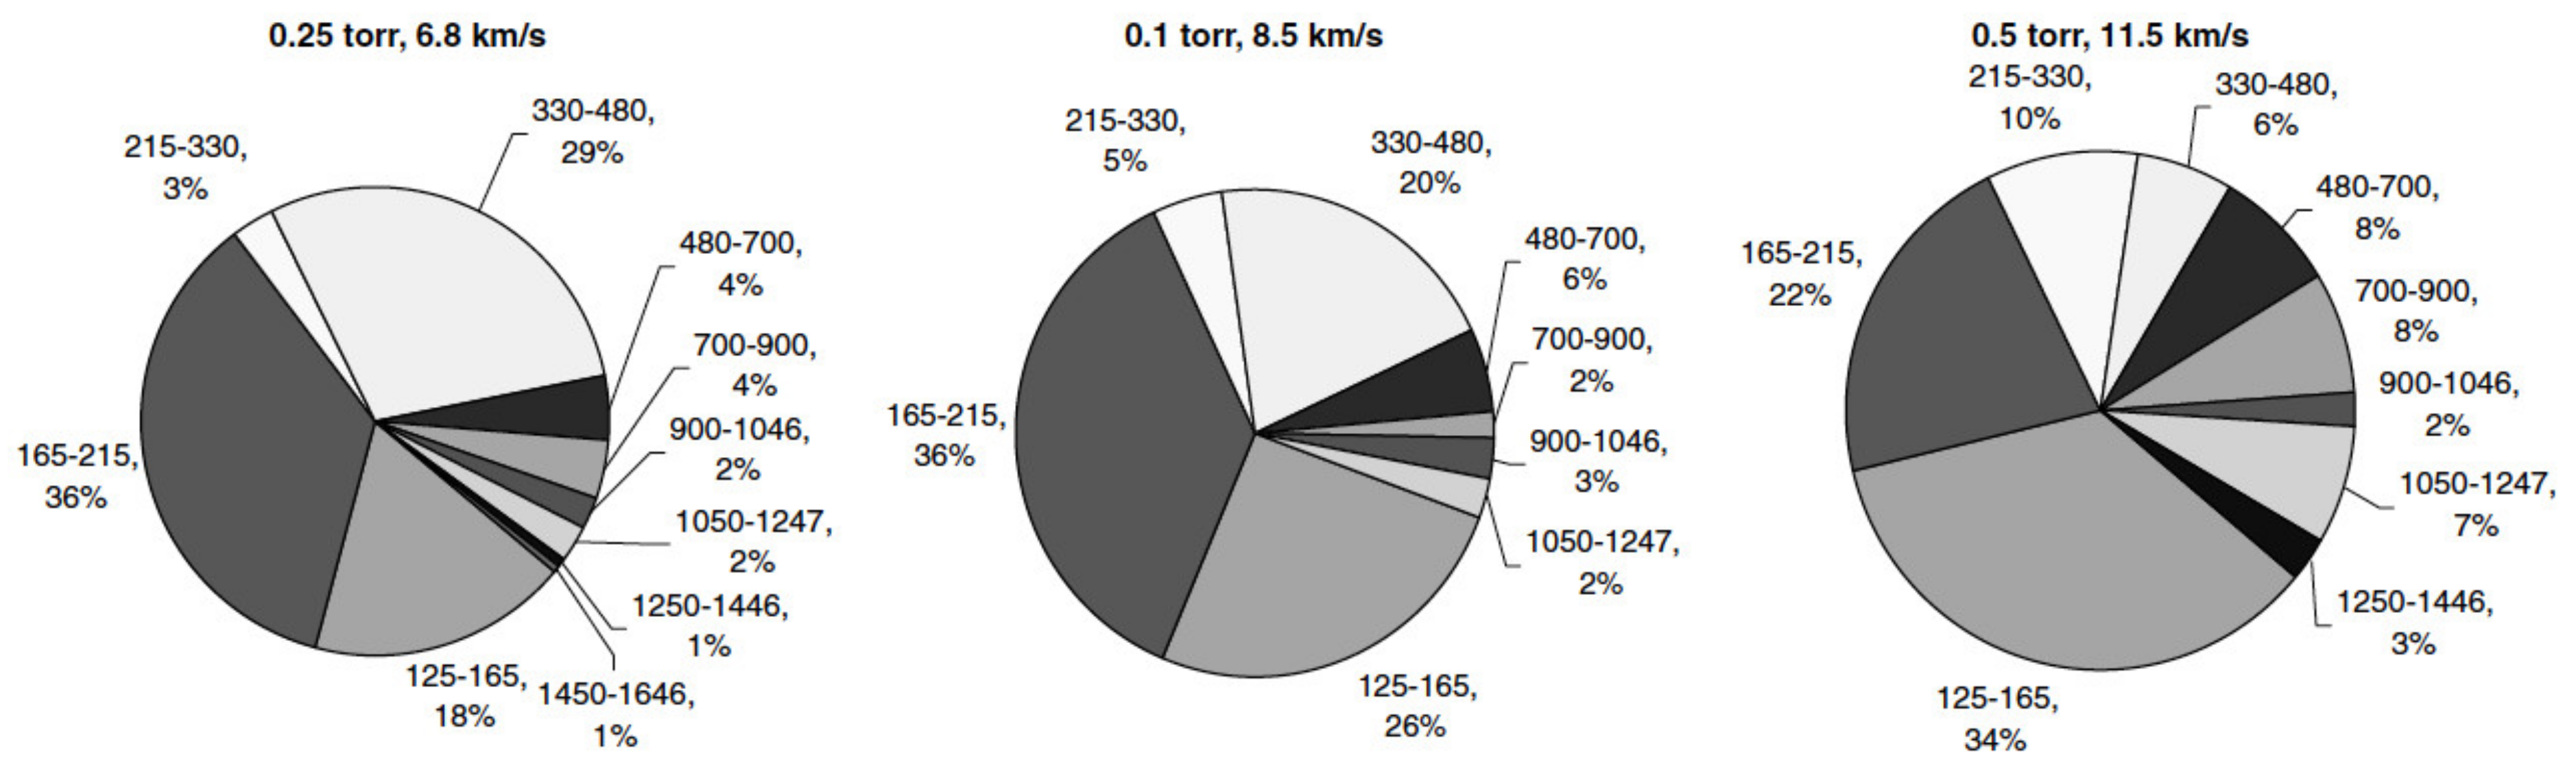
Other test campaigns for Venus entry conditions (3–12 km/s 0.1–2 Torr) were conducted in EAST [17,18] spectral radiance was investigated from VUV through mid-IR (120–1650 nm, and 3000–5000 nm). Tests conditions are plotted in Figure 7. Resolved spectra of the CO 4th positive band in the VUV was also reported for the first time. Measurement of CO2 molecular vibrational radiation was also attempted for low velocities. The contributions of the different spectral regions from VUV to IR, to the total radiance for Venus and Mars entry conditions are resumed in Figure 10. Mid IR was only investigated at low velocities (3–4 km/s). For the other measurements medium resolution imaging was performed for C2 Swan, CN Violet, O 777 nm triplet and C 193 and 248 nm lines.
The observed results are similar to those reported in [1] that can be seen in Figure 9. One of the main radiator is CN radiating 22% less in Venus mixture than in Mars mixture, all other parameters being equal.
The analysis of the different tests shows that below 10 km/s, there is a strong emission from 120–300 nm, due to the CO 4th positive system reaching a maximum at 160 nm, this is the dominant feature in the spectrum. Other major contributors to radiation emission are, NO, strong atomic lines of C, O, and N, and CN Violet, with the four bands at 359, 388, 422, and 461 nm, corresponding to CN Violet system. The radiation intensity emitted by the CN Violet system, increases with the velocity up to 10 km/s, then decreases and vanishes, since the energy present in the flow is sufficient to dissociate the molecule. Swan band for C2, in between 500 and 700 nm, is also present in Figure 9, but at a much weaker level than CN. Like for CN, C2 contribution disappears above 10 km/s due to dissociation effects. The same phenomenon applies to the CN red system, which is strong in the NIR above 700 nm below 9 km/s and vanishes when the shock velocity increases. With the increase in velocity, the atomic lines become visible, as highlighted in Figure 9, with the oxygen atomic triplets at 777 and 1130 nm, and the C atomic lines and 193, 248, and 1069 nm. However, the main features when increasing the velocity is the growth of the background continuum radiation certainly due to interactions between the electrons and atomic and molecular species that include free-bound and bremsstrahlung processes.
The contributions to the total radiance for different wavelength bands have been computed by Cruden et al. [17] and are shown in Figure 10. The first contribution for all pressures and velocities is from VUV to far UV wavelengths, in between 125–215 nm, with 45 to 58% of the total radiation. At these wavelengths the radiation is mostly produced by the CO 4th positive system and from NO. The IR radiation above 900 nm is small with around 10 % of the total radiation. The radiation in the visible domain can be mainly attributed to the CN red system. The region in between 330 and 480 nm, contributes to 35% of the total radiation at 6.5 km/s. This strong contribution decreases at higher velocities, with 12% at 11.5 km/s due to the dissociation effects that are strong. Radiation from C2 Swan, 480–700 nm is for the different cases lower than 10% of the total radiation.
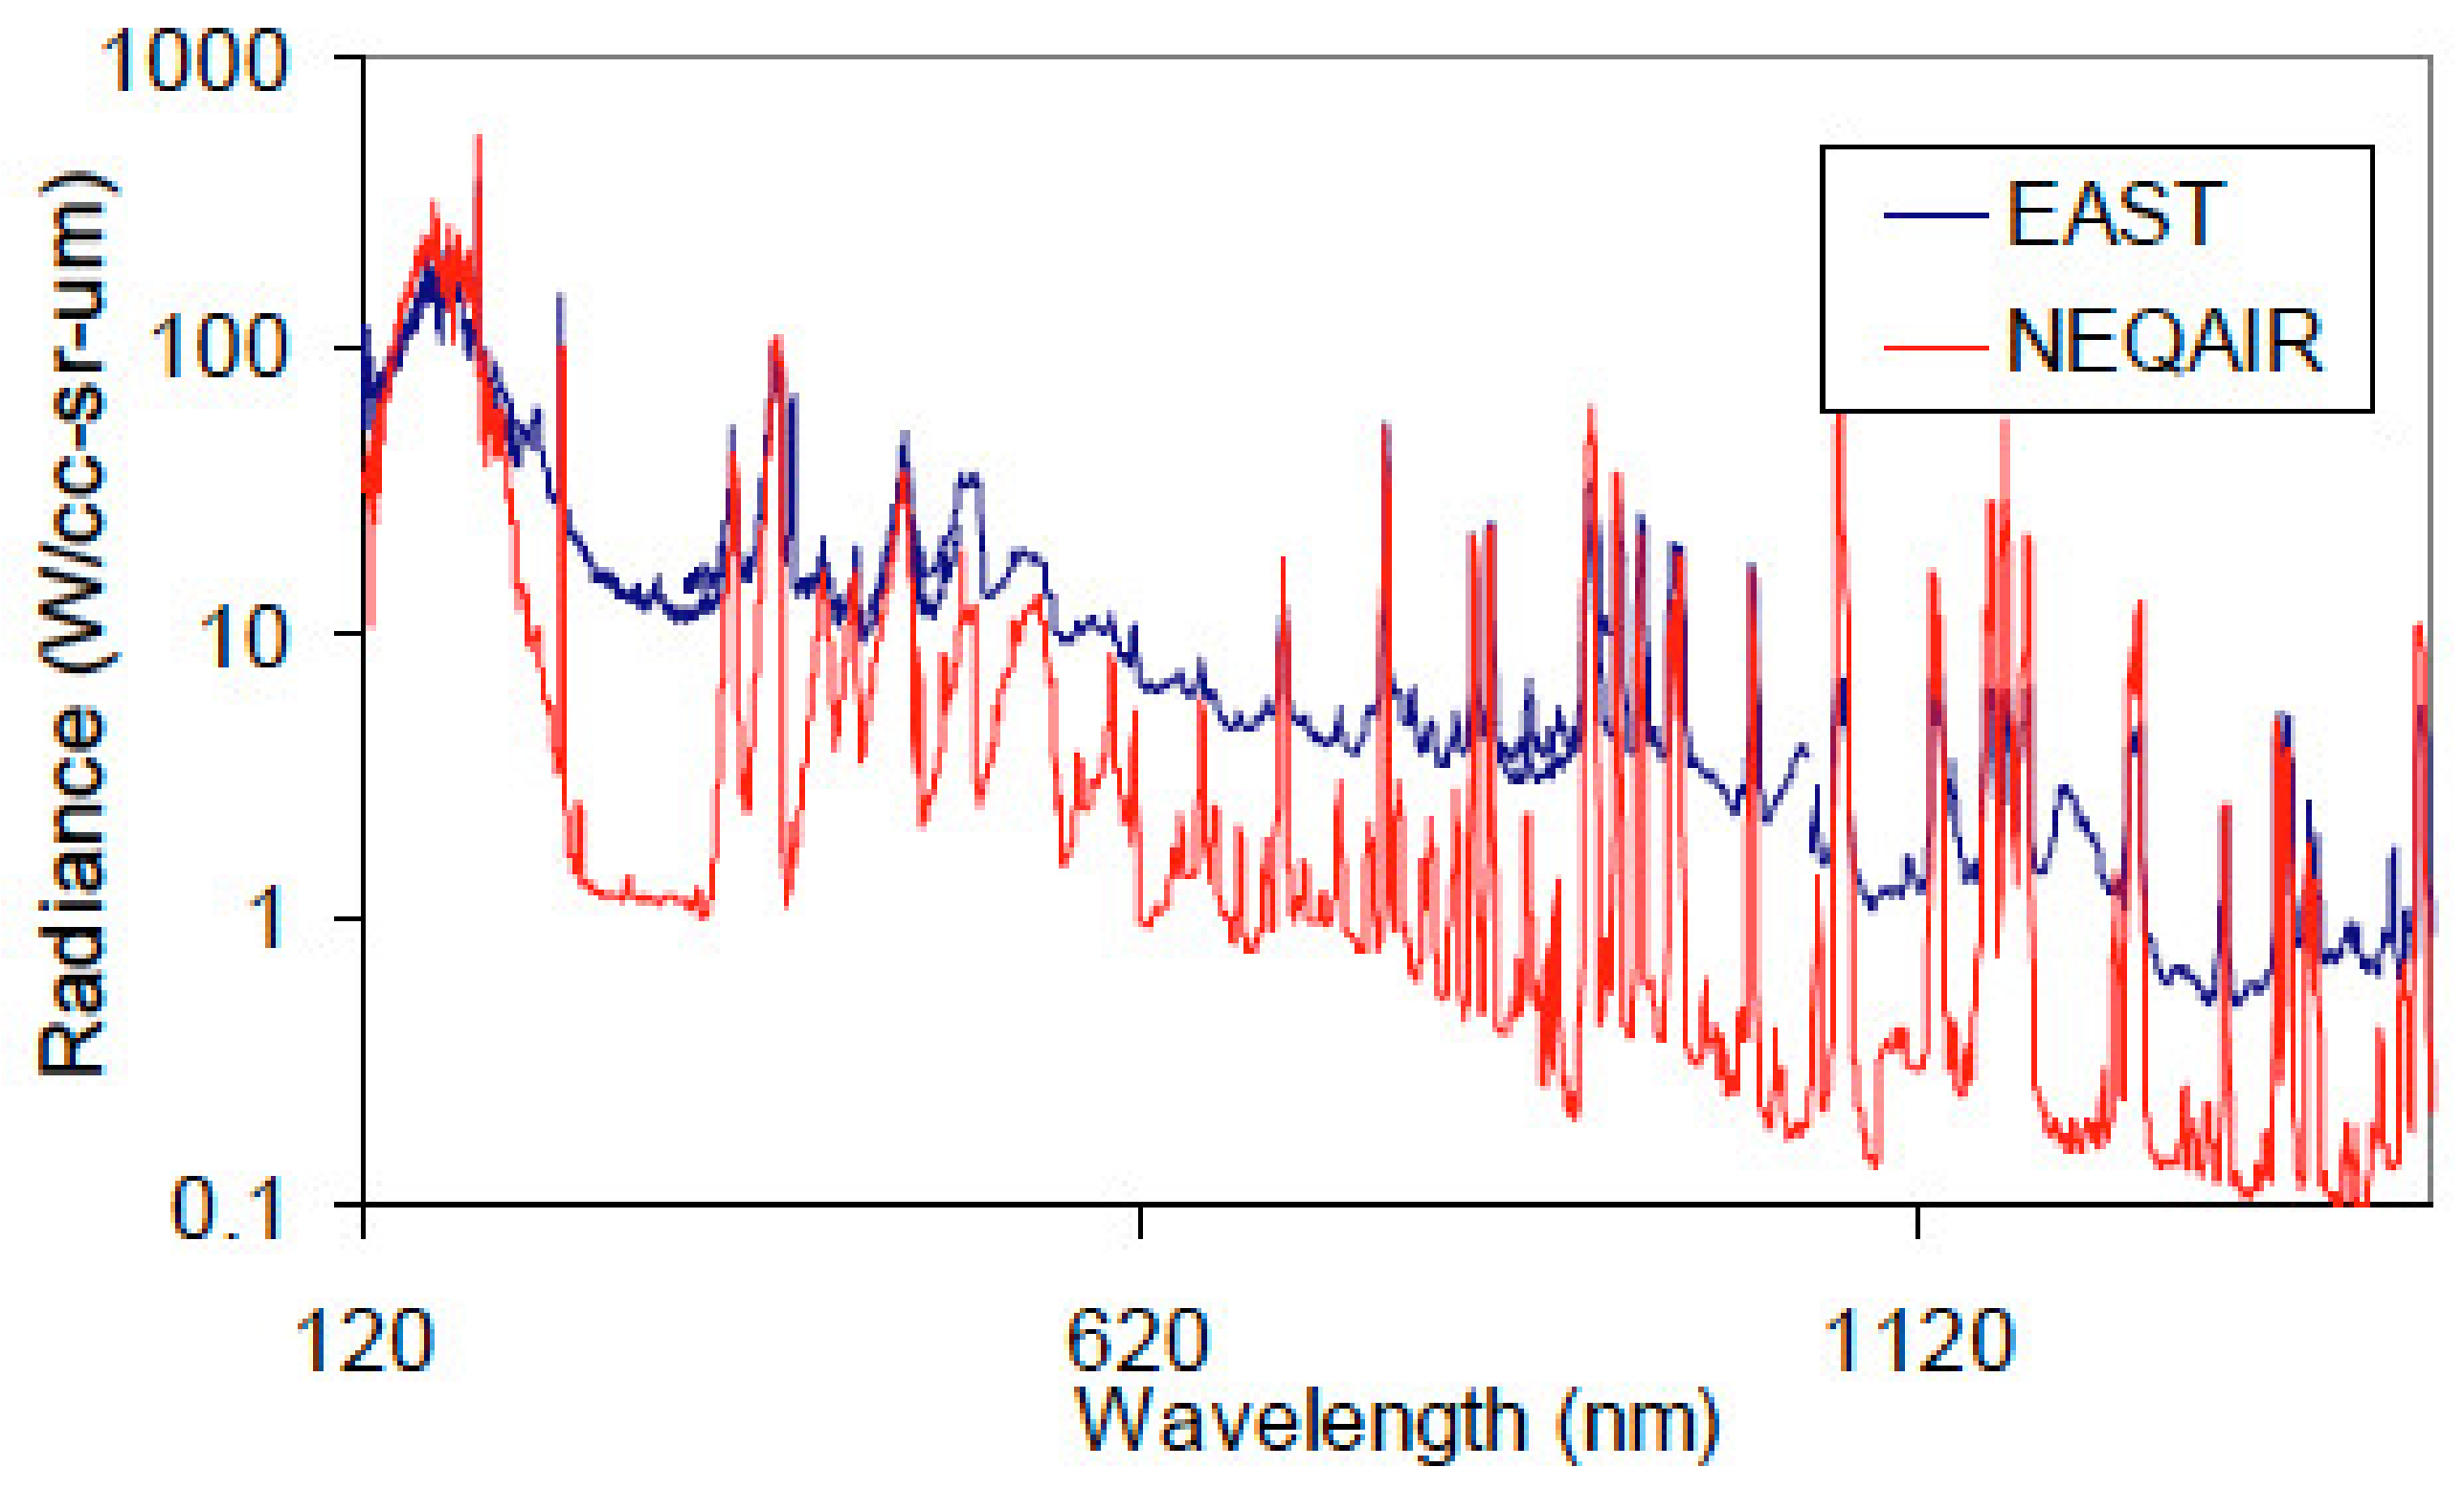
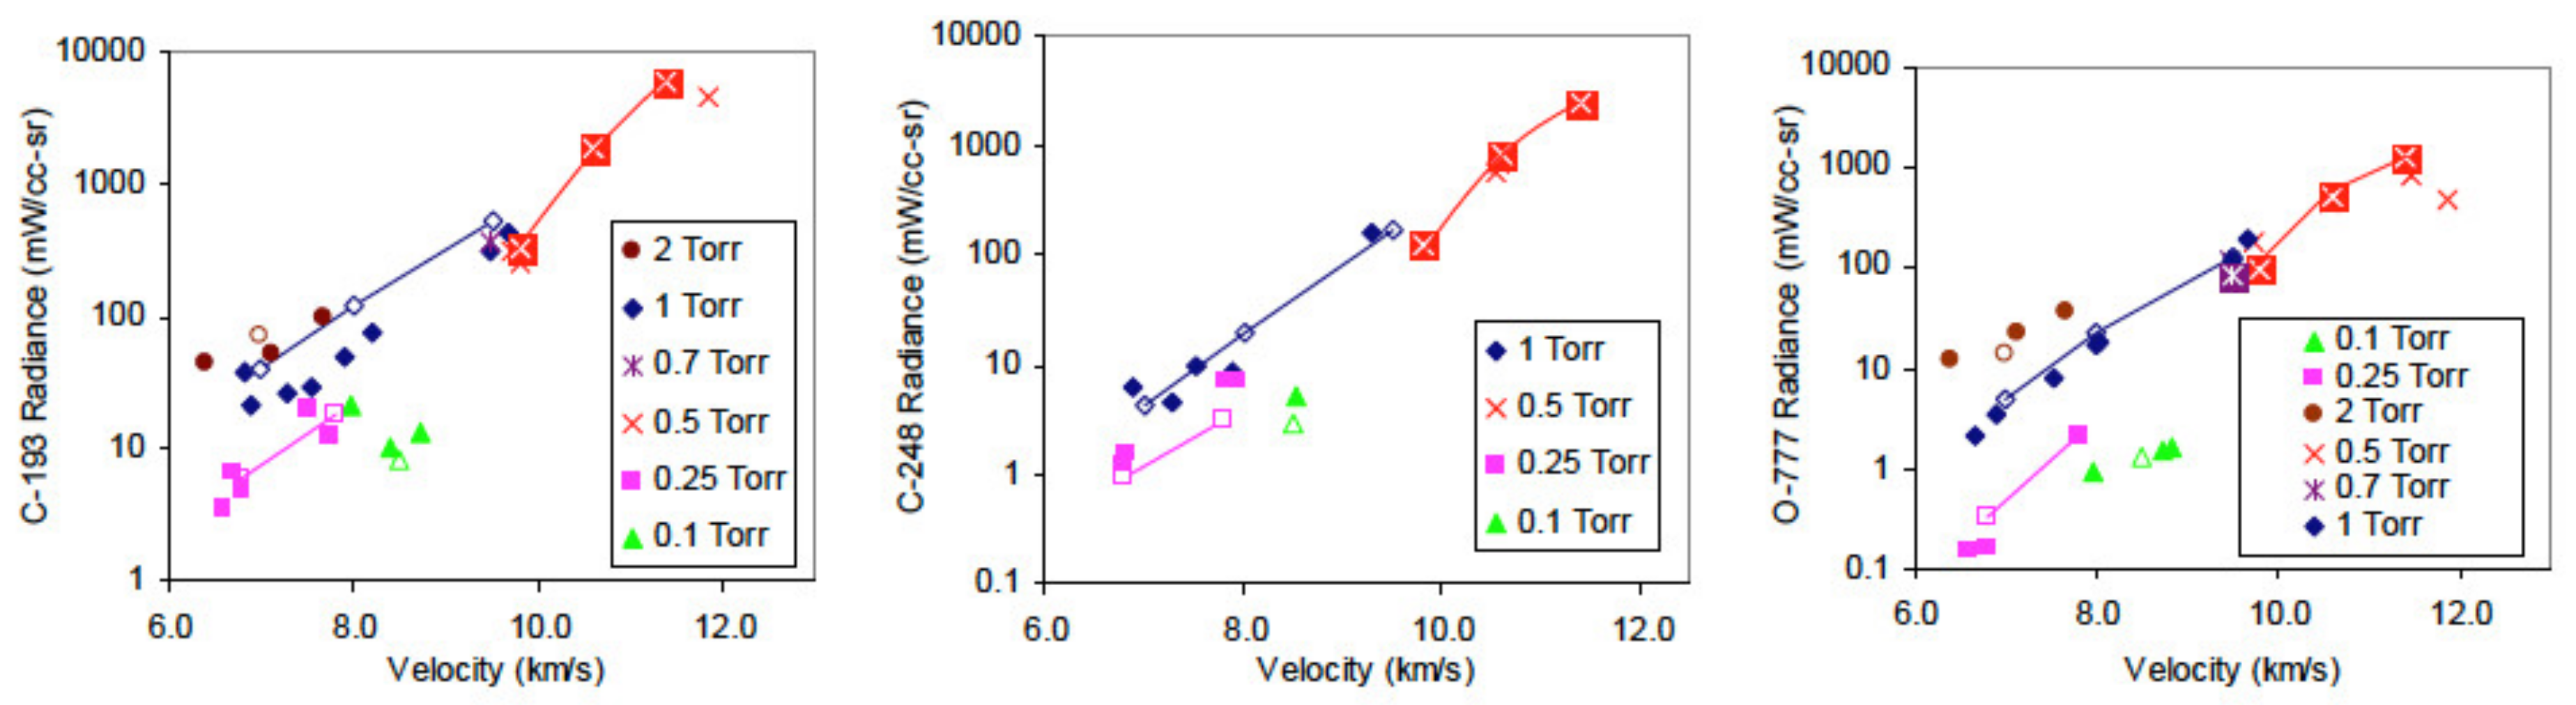
Measurements of C2 and CN bands systems have been used to compute rotational temperature; corresponding results are plotted in Figure 11. Finally, the tests have been reconstructed with NEQAIR [19]. Comparisons between experimental data and numerical calculations for different spectra are shown in Figure 12, Figure 13 and Figure 14. Figure 14 shows the comparisons between EAST data and NEQAIR calculations, of the integrated radiance from carbon lines and oxygen triplet, for the different studied conditions.
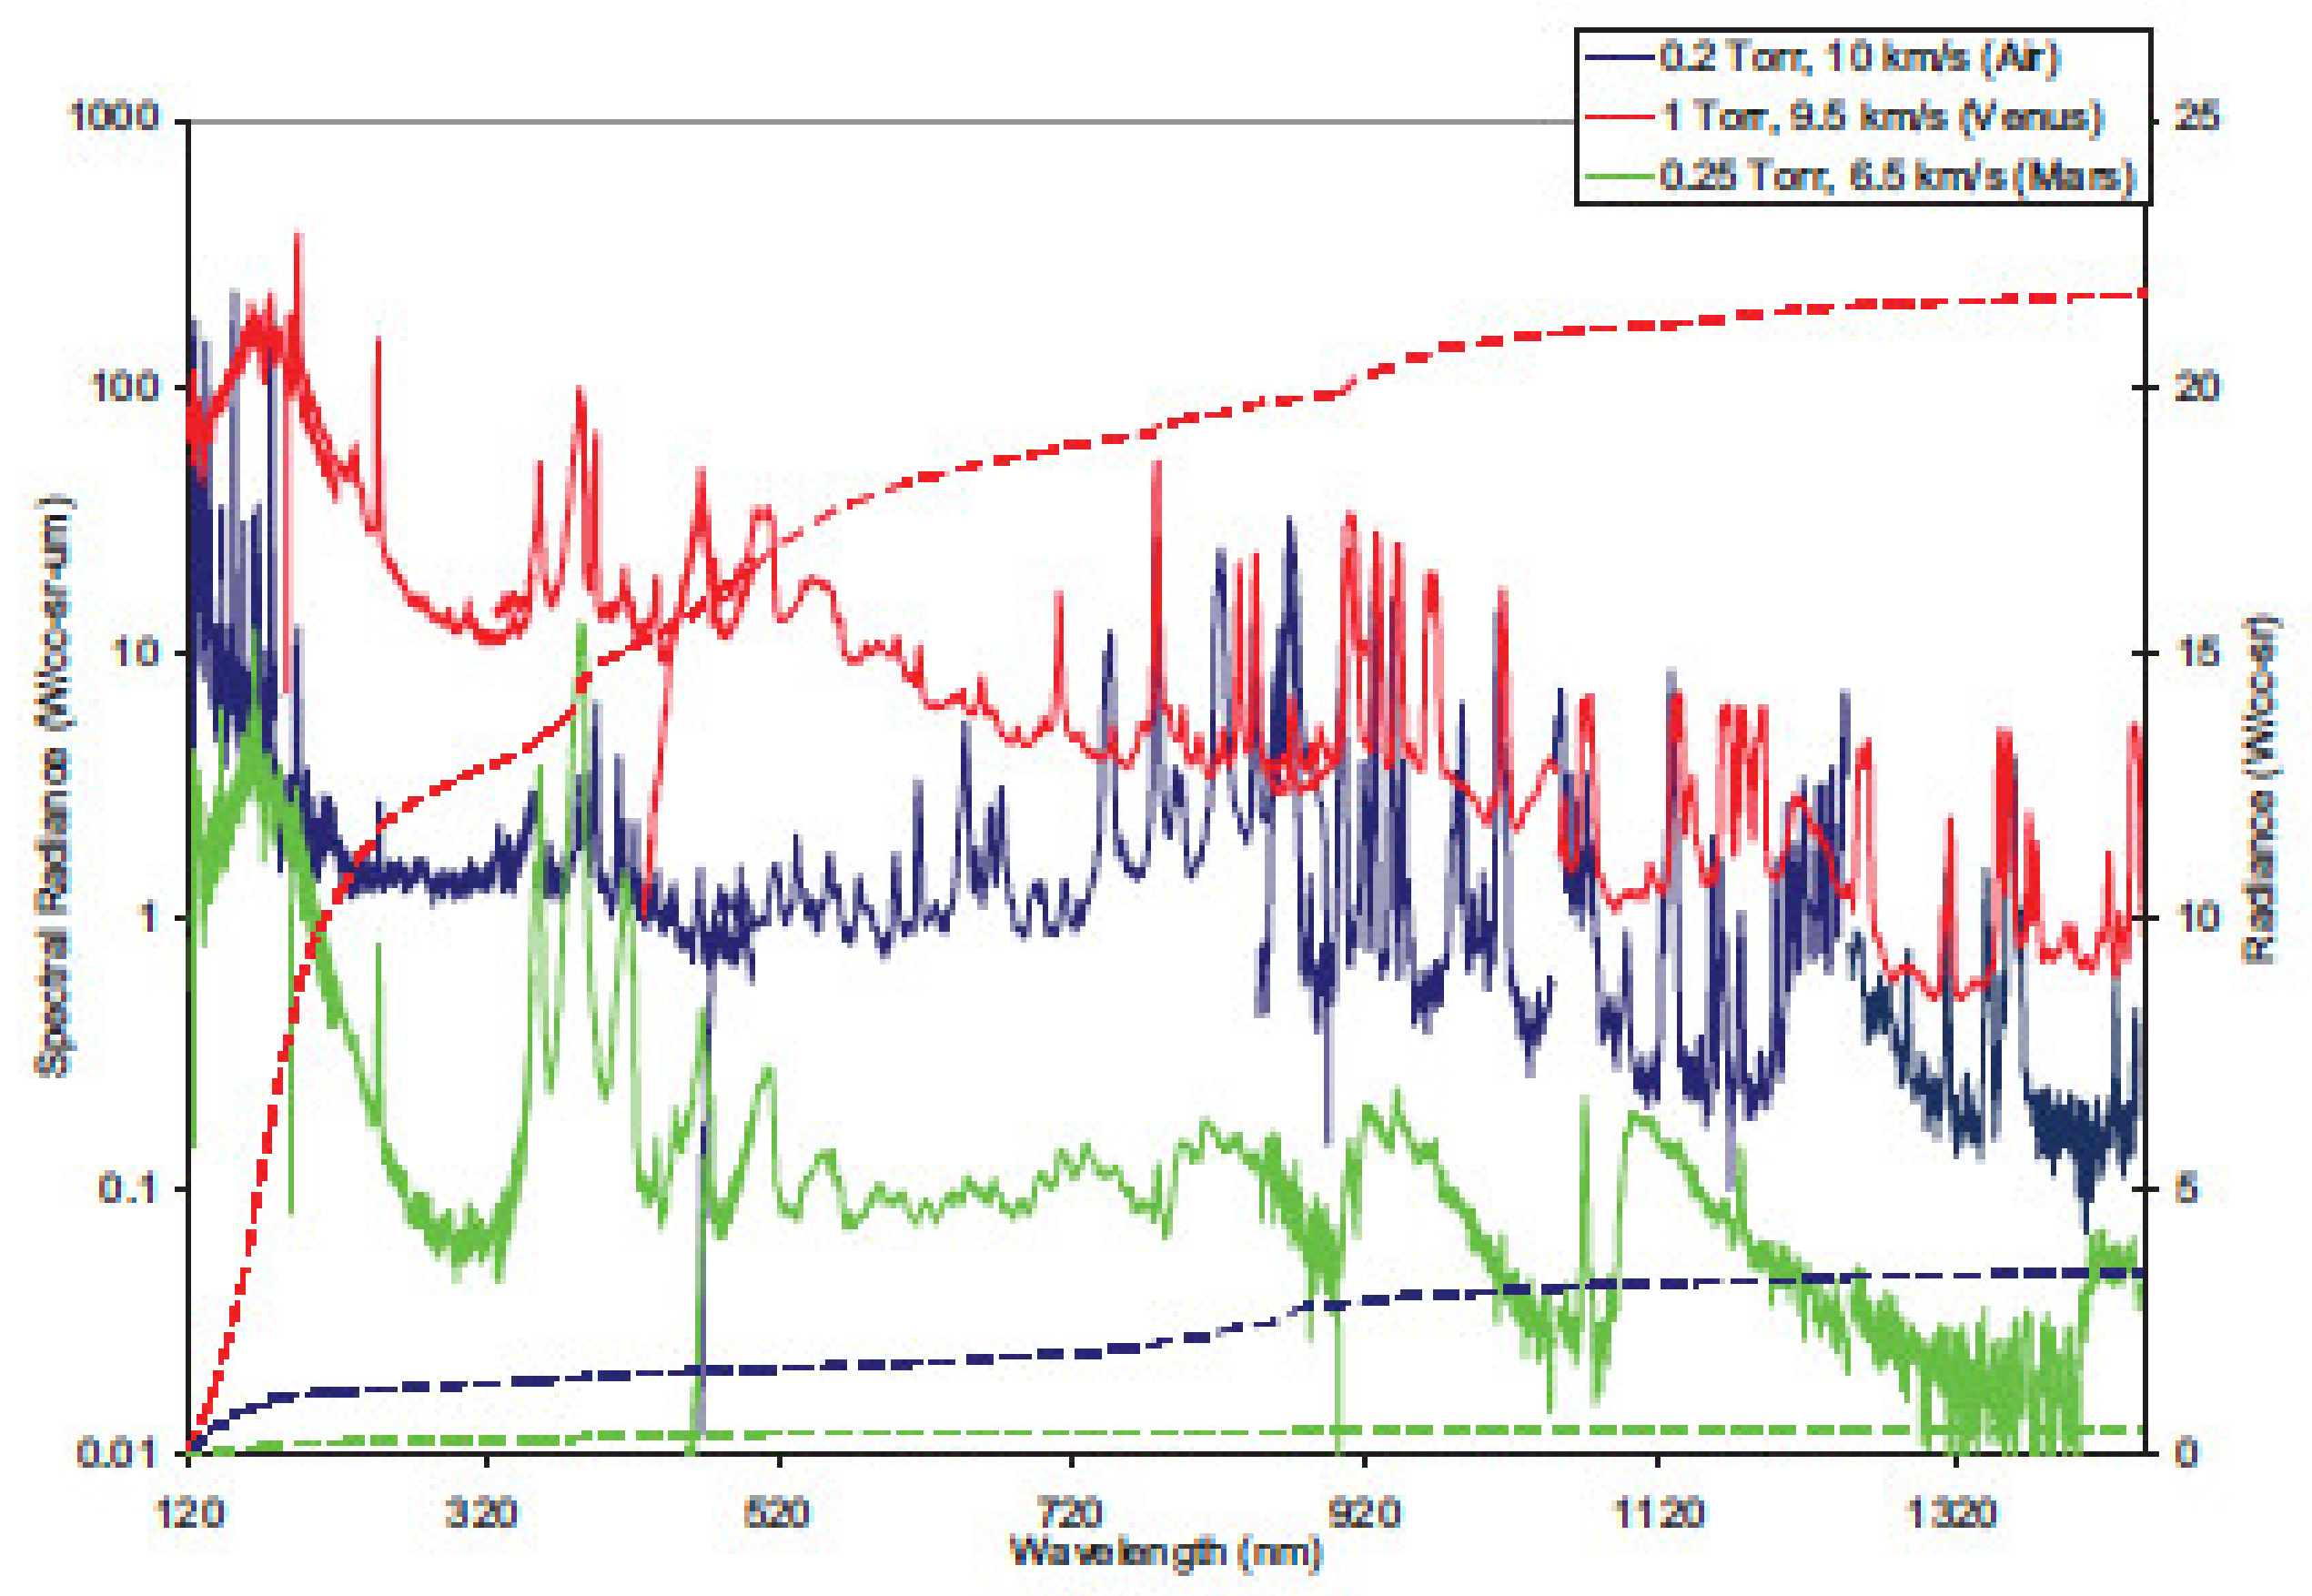
Radiation emission spectra from VUV to mid-IR for Earth, Venus, and Mars entry conditions have been compared in [20] they are plotted in Figure 15. In the same contribution, Cruden [20] has provided extensive details on the calibration of the different measurement techniques used for the test campaigns including the deuterium and mercury lamps for VUV and UV-VIS measurements respectively. Mercury lamp is used for spectral calibration using atomic line sources in UV-VIS, in the infrared, typically, Hg lamps are used for the same finality. For calibration below 300 nm, a deuterium source is frequently used; other options are possible (H2 or Ar arc lamps, Xe lamps, or hollow cathode discharges). Lamps are thermally driven, and as they are limited by the Planck curve they generally do not get hot enough for short wavelength ranges characteristic of V, and VUV radiation.
5. Mars Entry
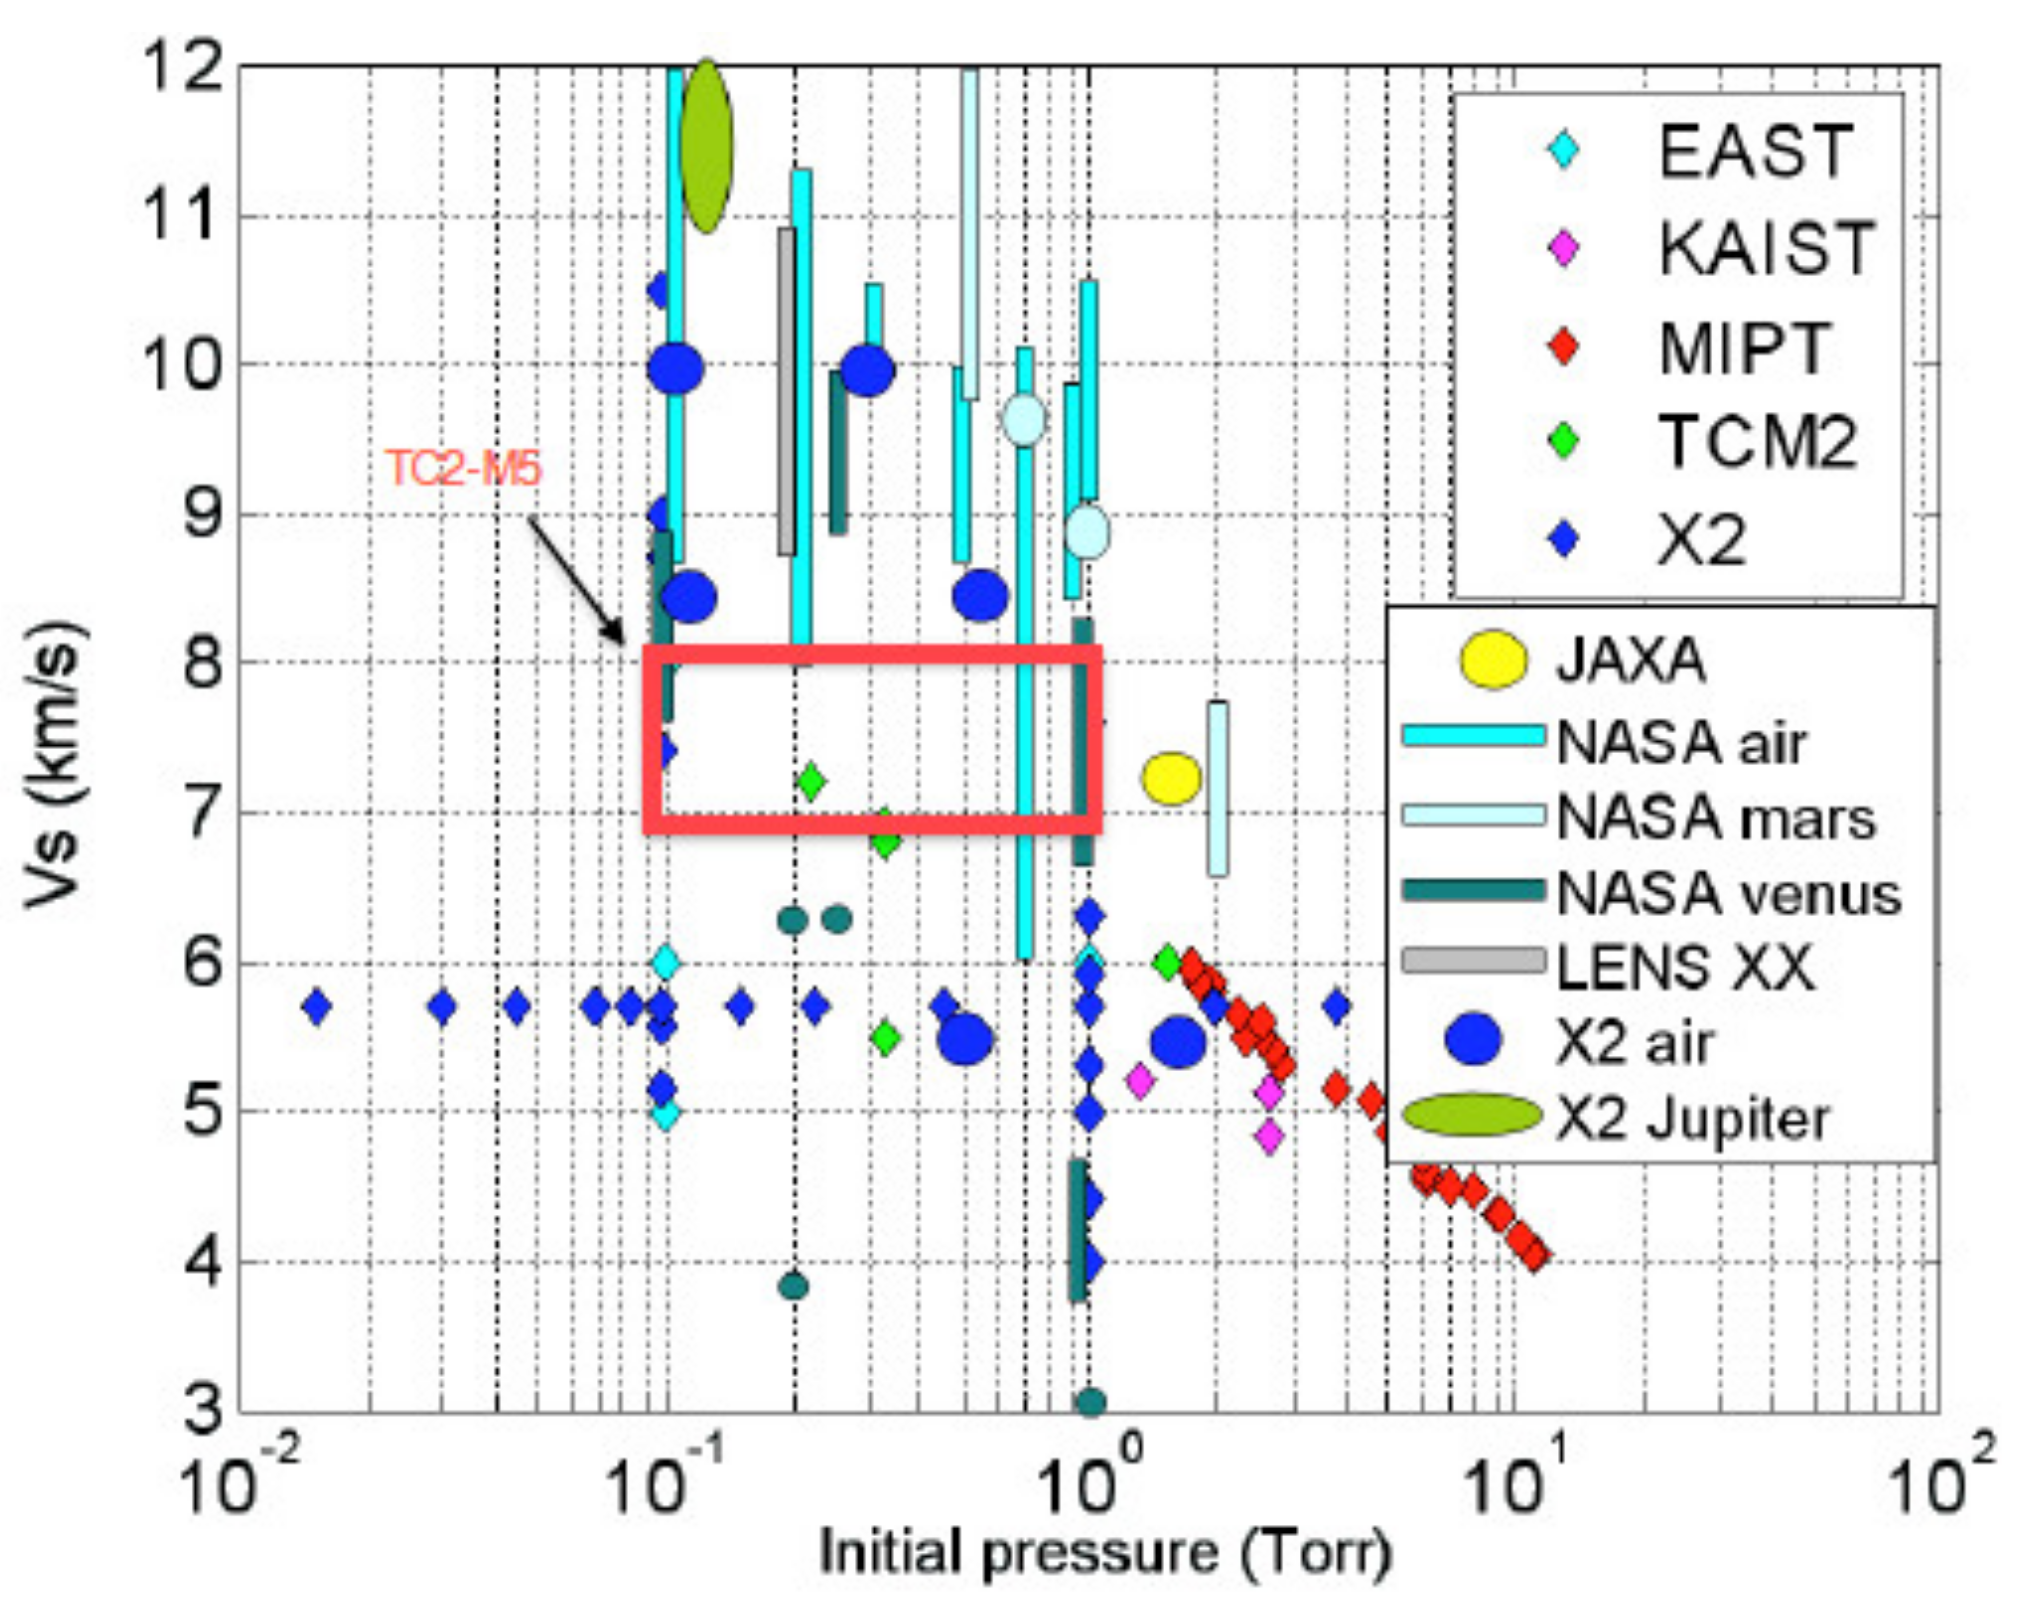
Since the Mars Premier project developed by CNES [3], ESA and CNES have fostered the activities of the European Radiation Working Group (ERWG) for improving radiation capabilities within Europe. In the frame of the working group activities, a test case has been dedicated to Mars entry [21]. The test case conditions are a pressure in between 0.1 and 1 Torr, a velocity range from 7 to 8 km/s and a nominal Mars atmosphere with 96% of CO2 and 4% of N2. They are reported in Figure 16 where the maps of different facilities as well as some existing datasets have been included [22]. The activities of the ERWG have supported most of radiation activities in Europe performed during 20 years. Additionally, with the closure of the TCM2 shock-tube in Marseilles, and due to the delay needed for the design and manufacturing of the ESTHER shock-tube, no similar facility was available in Europe during long years. As a consequence, the existence of the ERWG was an asset to maintain scientific capabilities in the field.
However, if a look is given at the global effort related to experimental campaigns for collecting VUV and IR CO2 radiation data most of the datasets have been obtained using the shock facilities available in Australia, Japan, and USA.
5.1. EAST
Among the available facilities such as shock and expansion tubes, for investigating radiation and chemical kinetics for Mars entry, EAST has been the most used and extensive test campaigns carried out for a wide range Mars entry conditions. Some of these test conditions have been summarized by Cruden [17] in Figure 7.
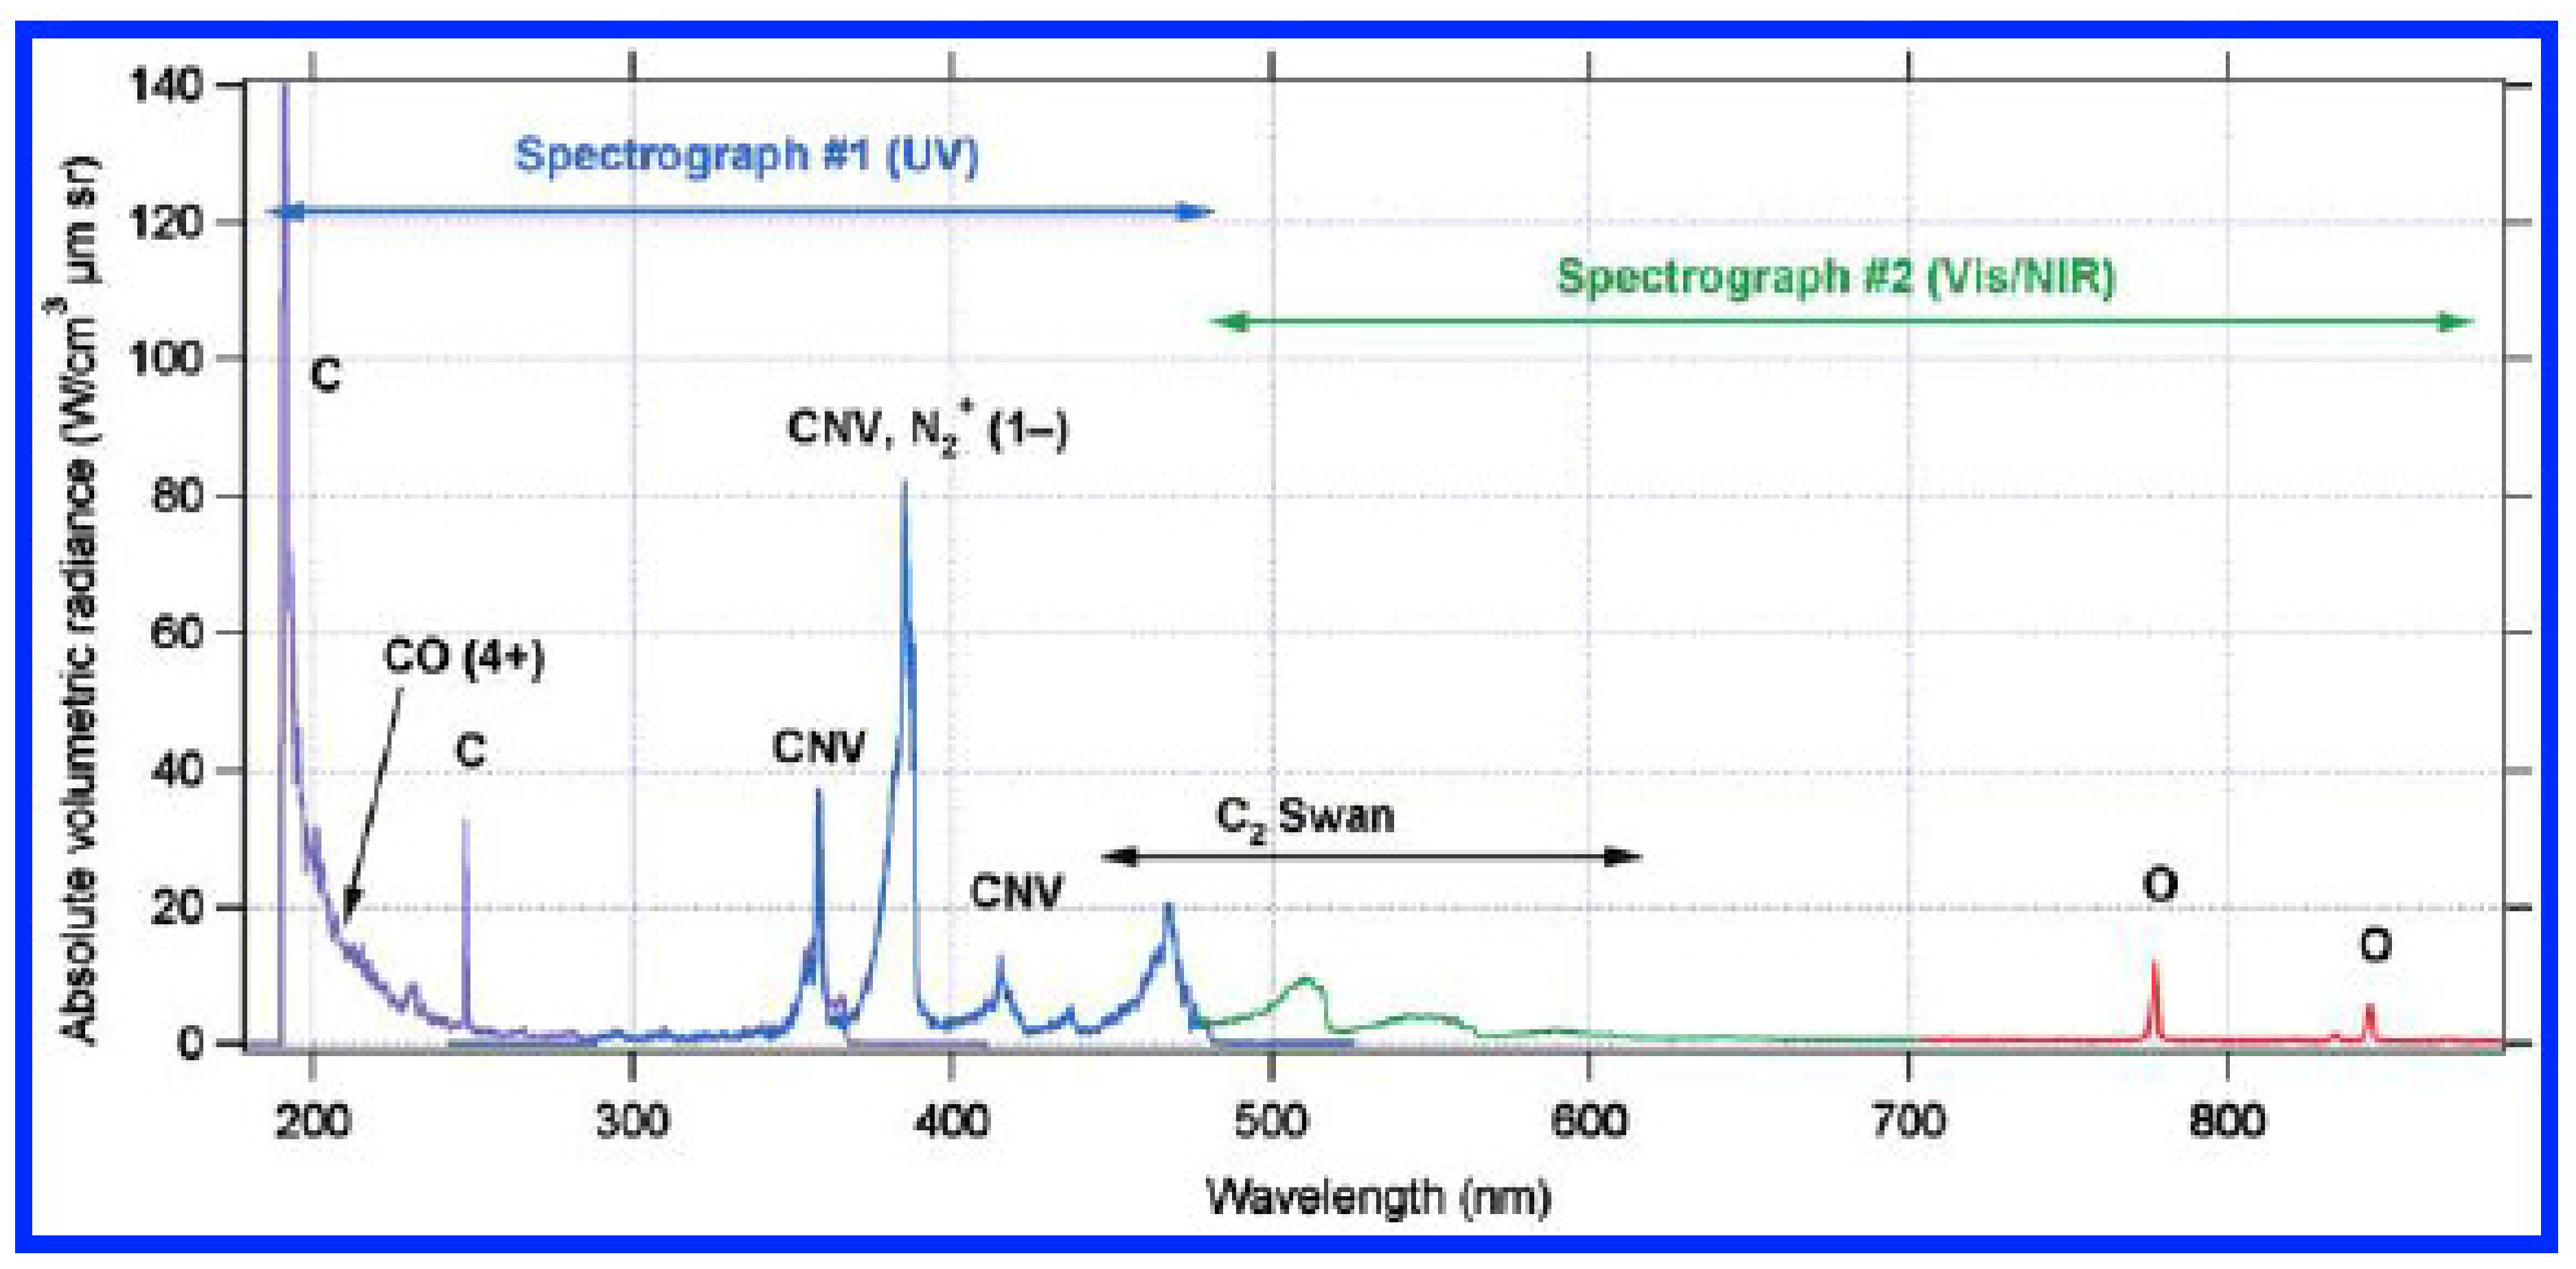
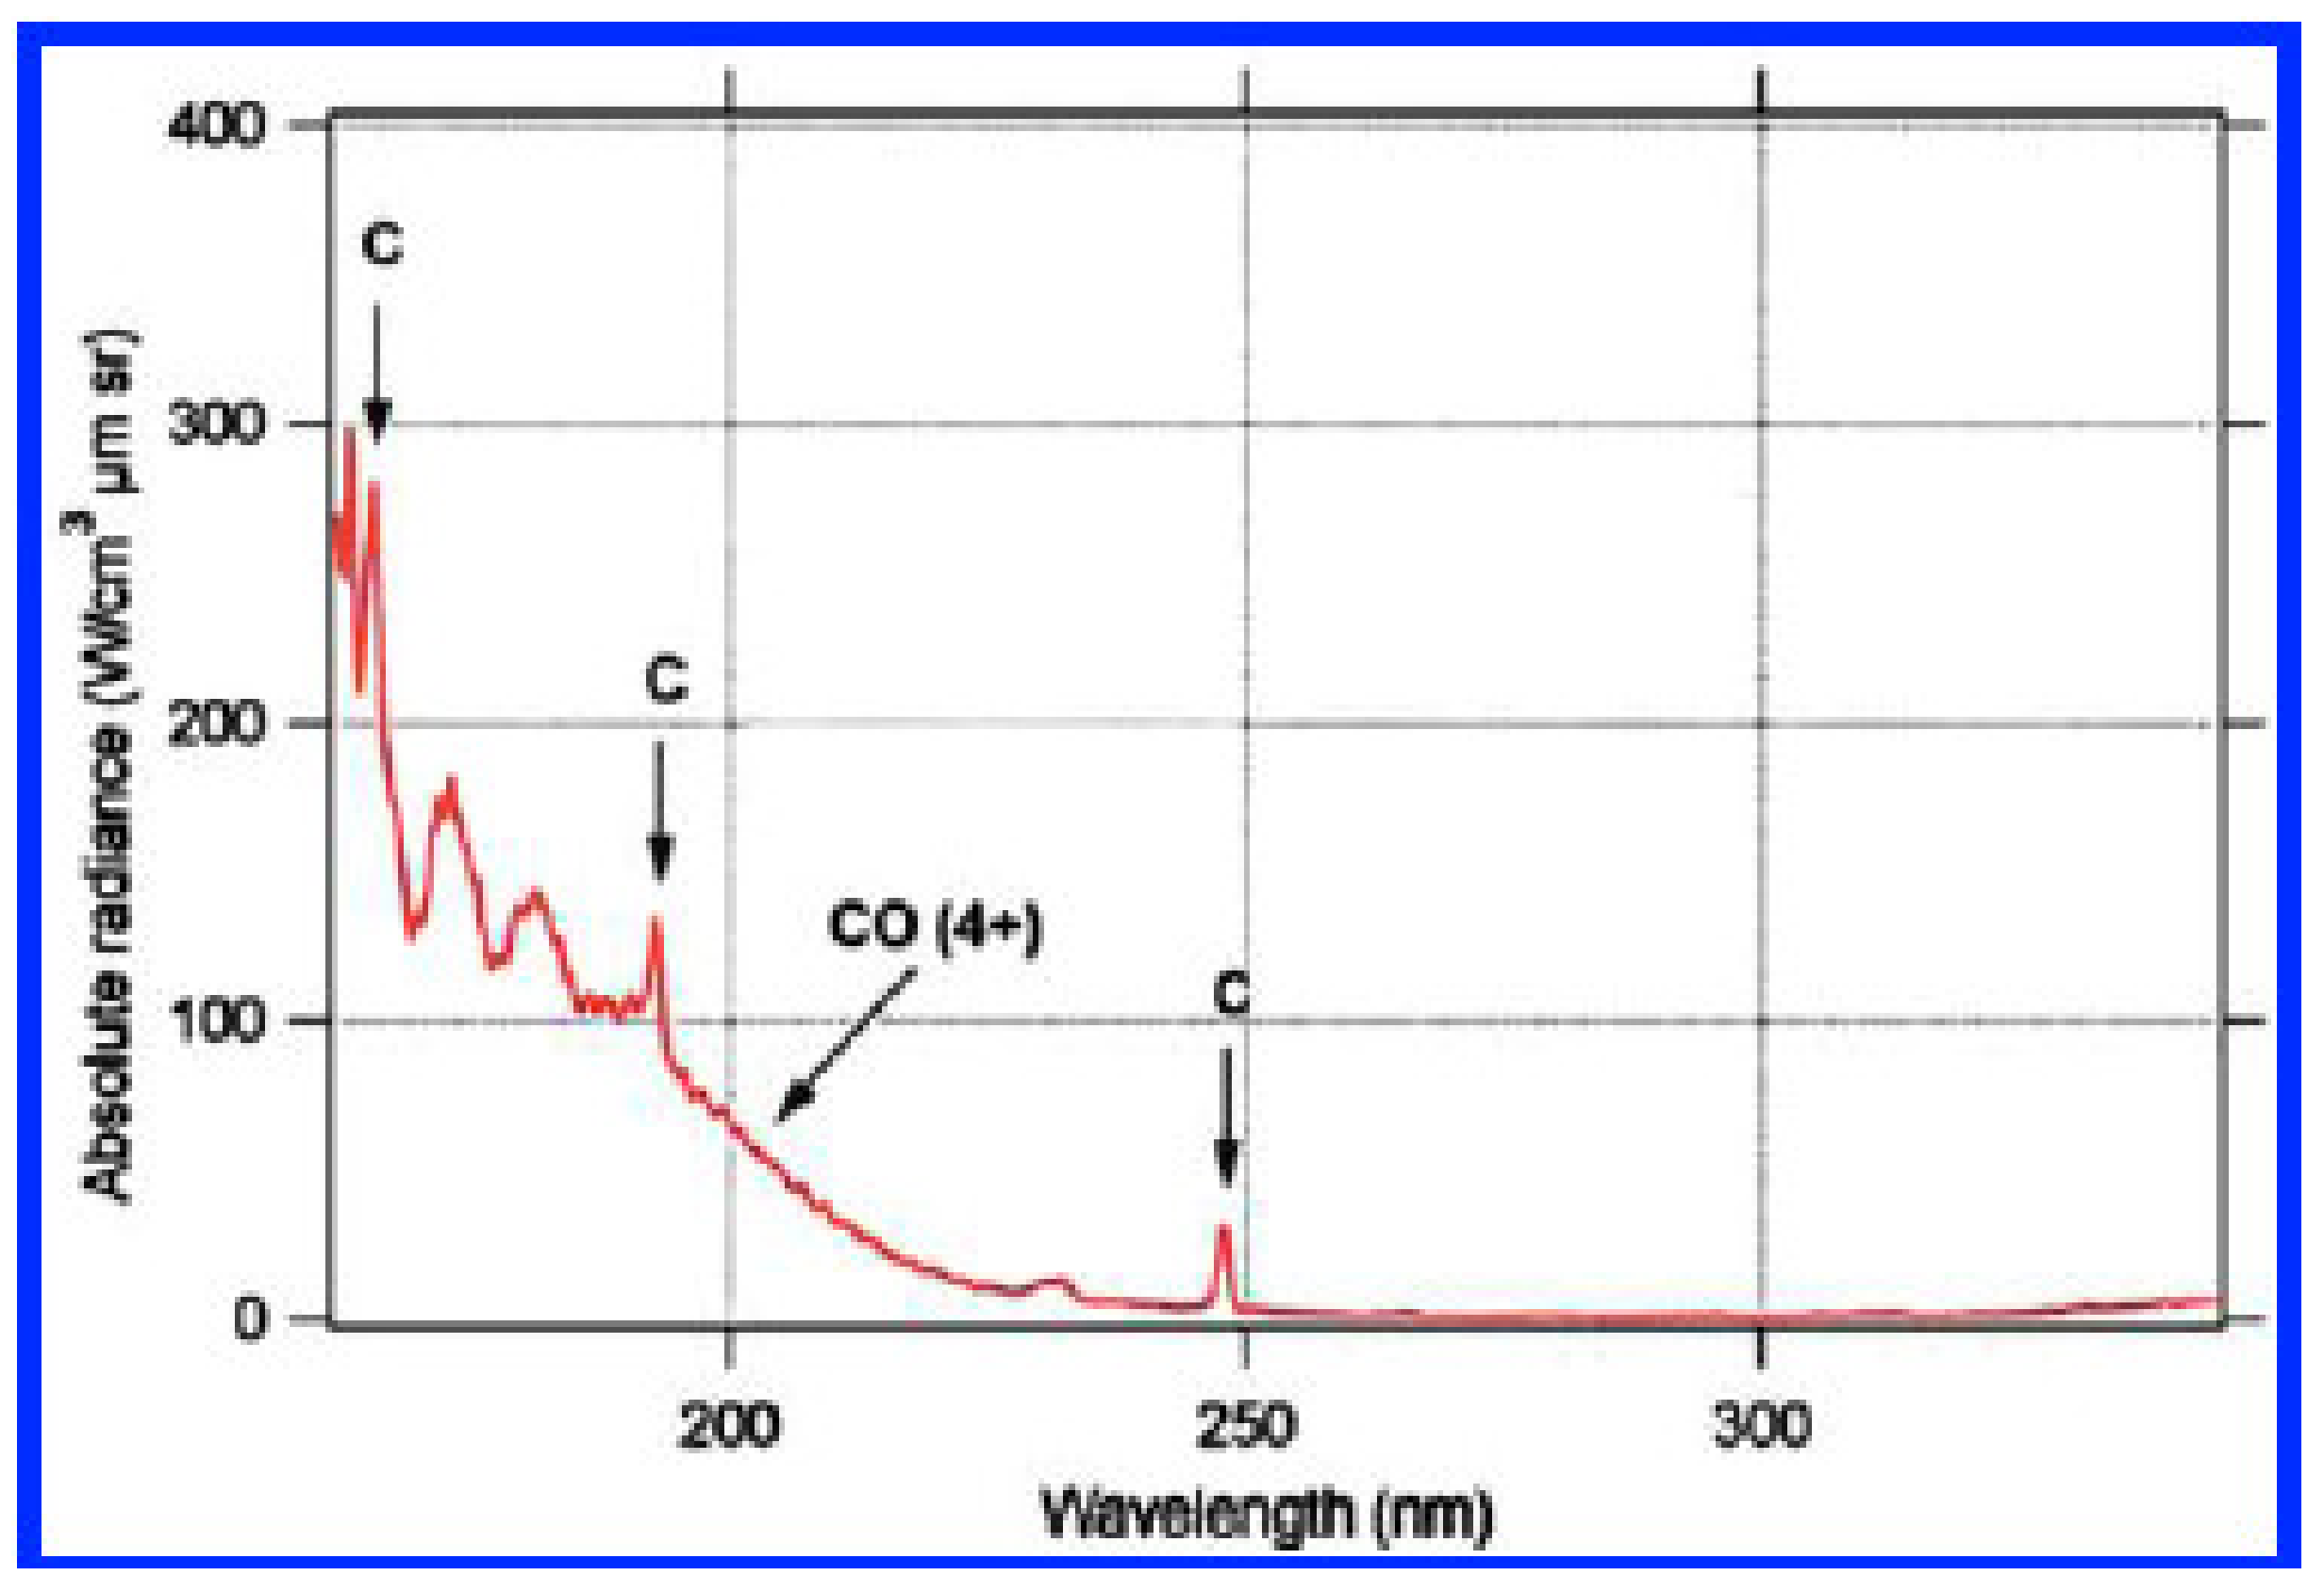
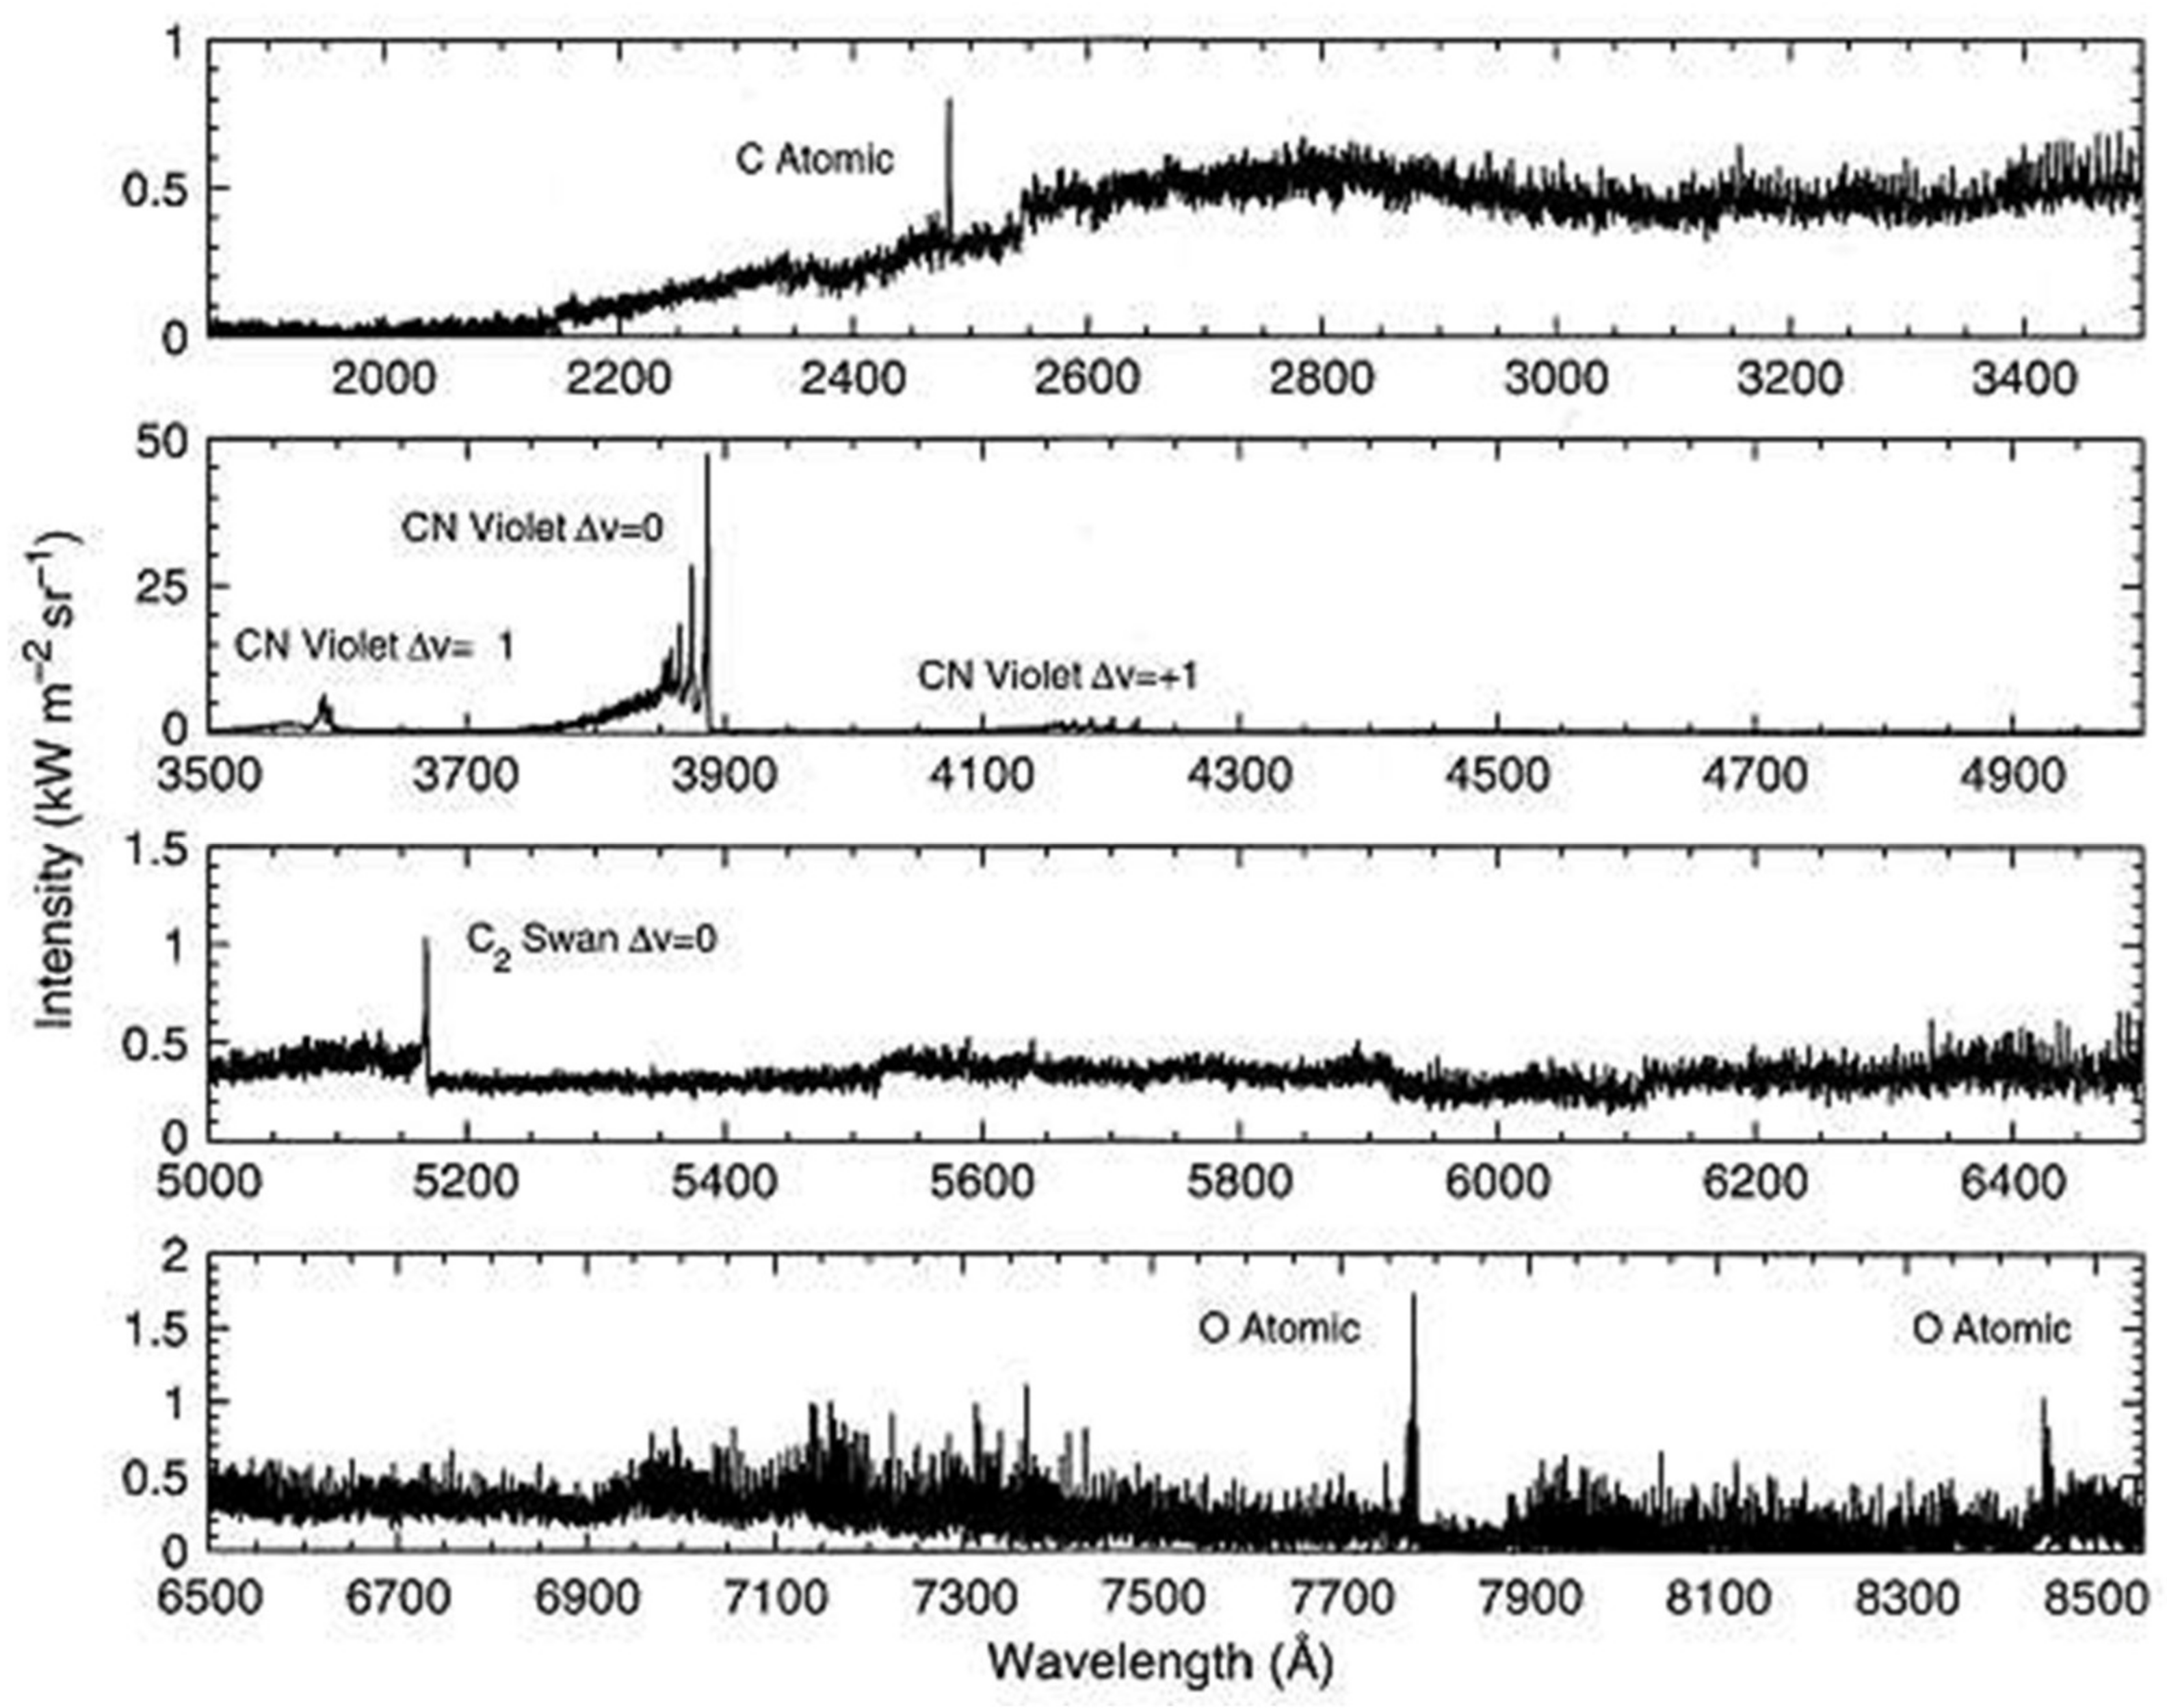
The high velocity range, corresponding to Mars aerocapture conditions, has been studied by Grinstead et al. [23] who have investigated the radiation and species kinetic relaxation for a Mars atmosphere at 0.1 Torr and a shock velocity of 8.6 km/s. Emission spectrum from VUV up to NIR has been measured and is displayed in Figure 17. The major source of radiance is from CO(4+) system even if CN violet, N2+ (1-) and C2 Swan systems as well as several atomic lines for carbon and oxygen are present. High-resolution spectra with corresponding spatial variation of radiance for CN violet and C2 Swan bands have been also published. Detailed VUV part of the spectrum is shown in Figure 18.
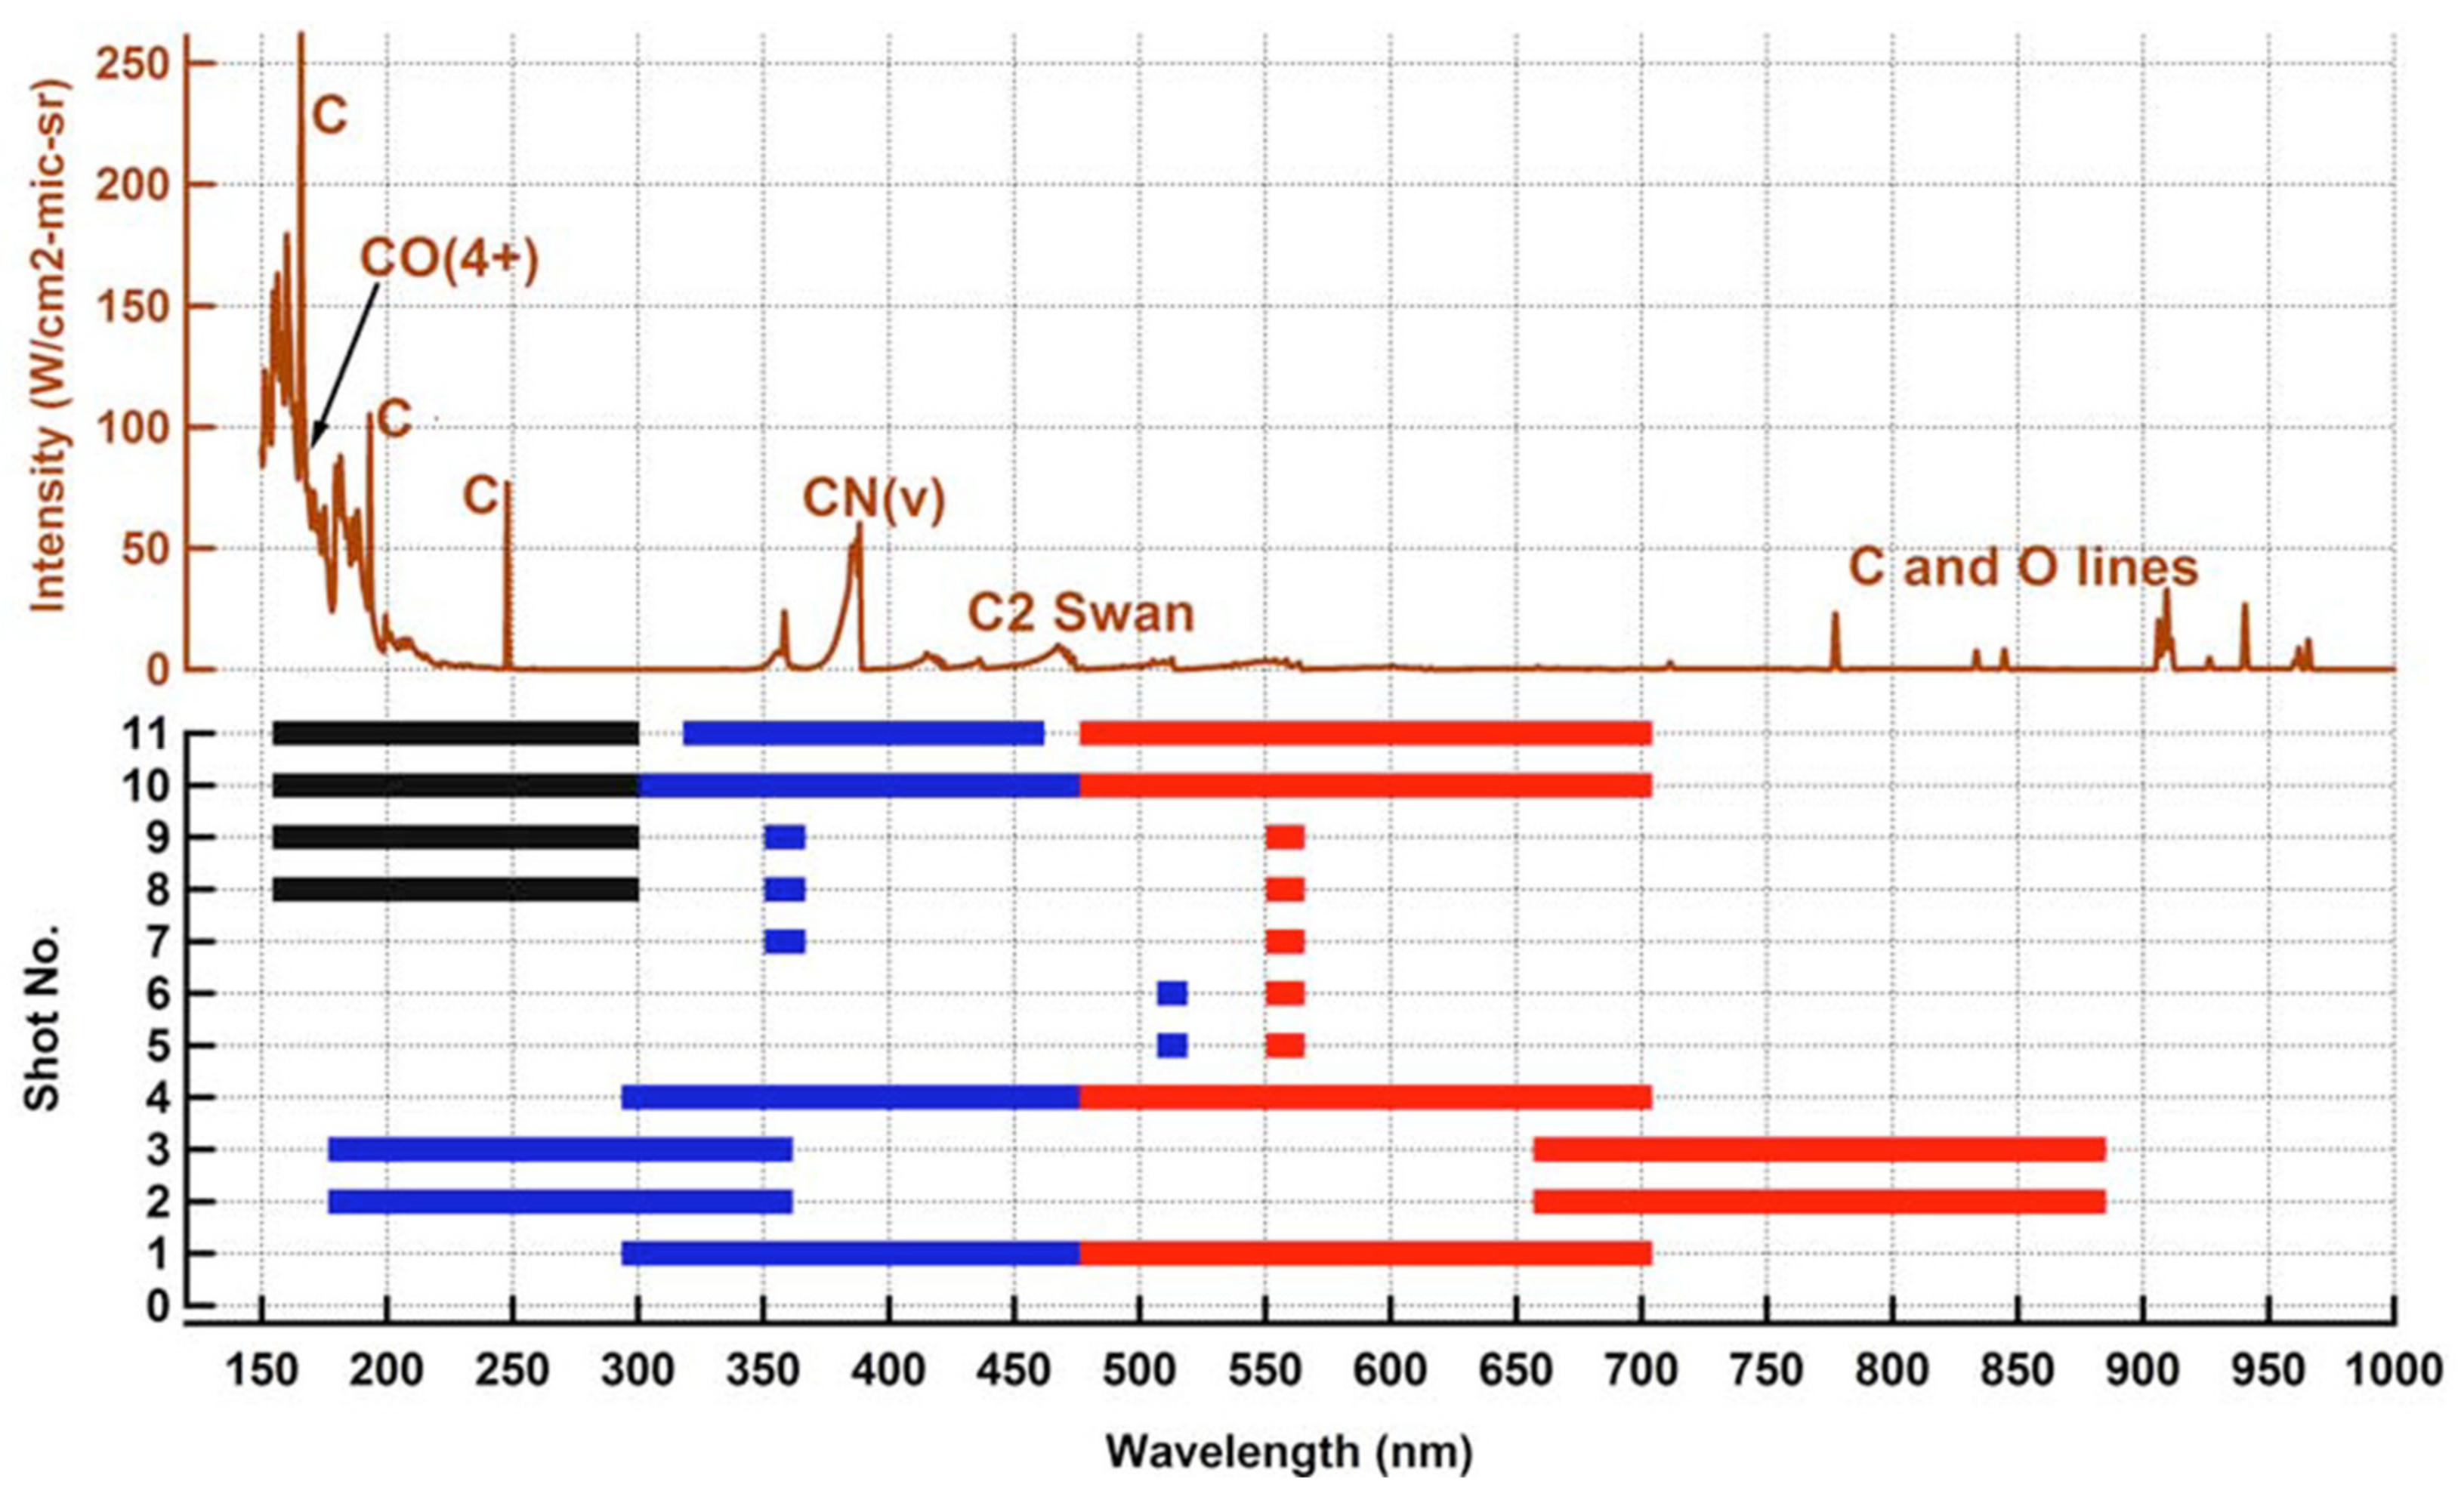
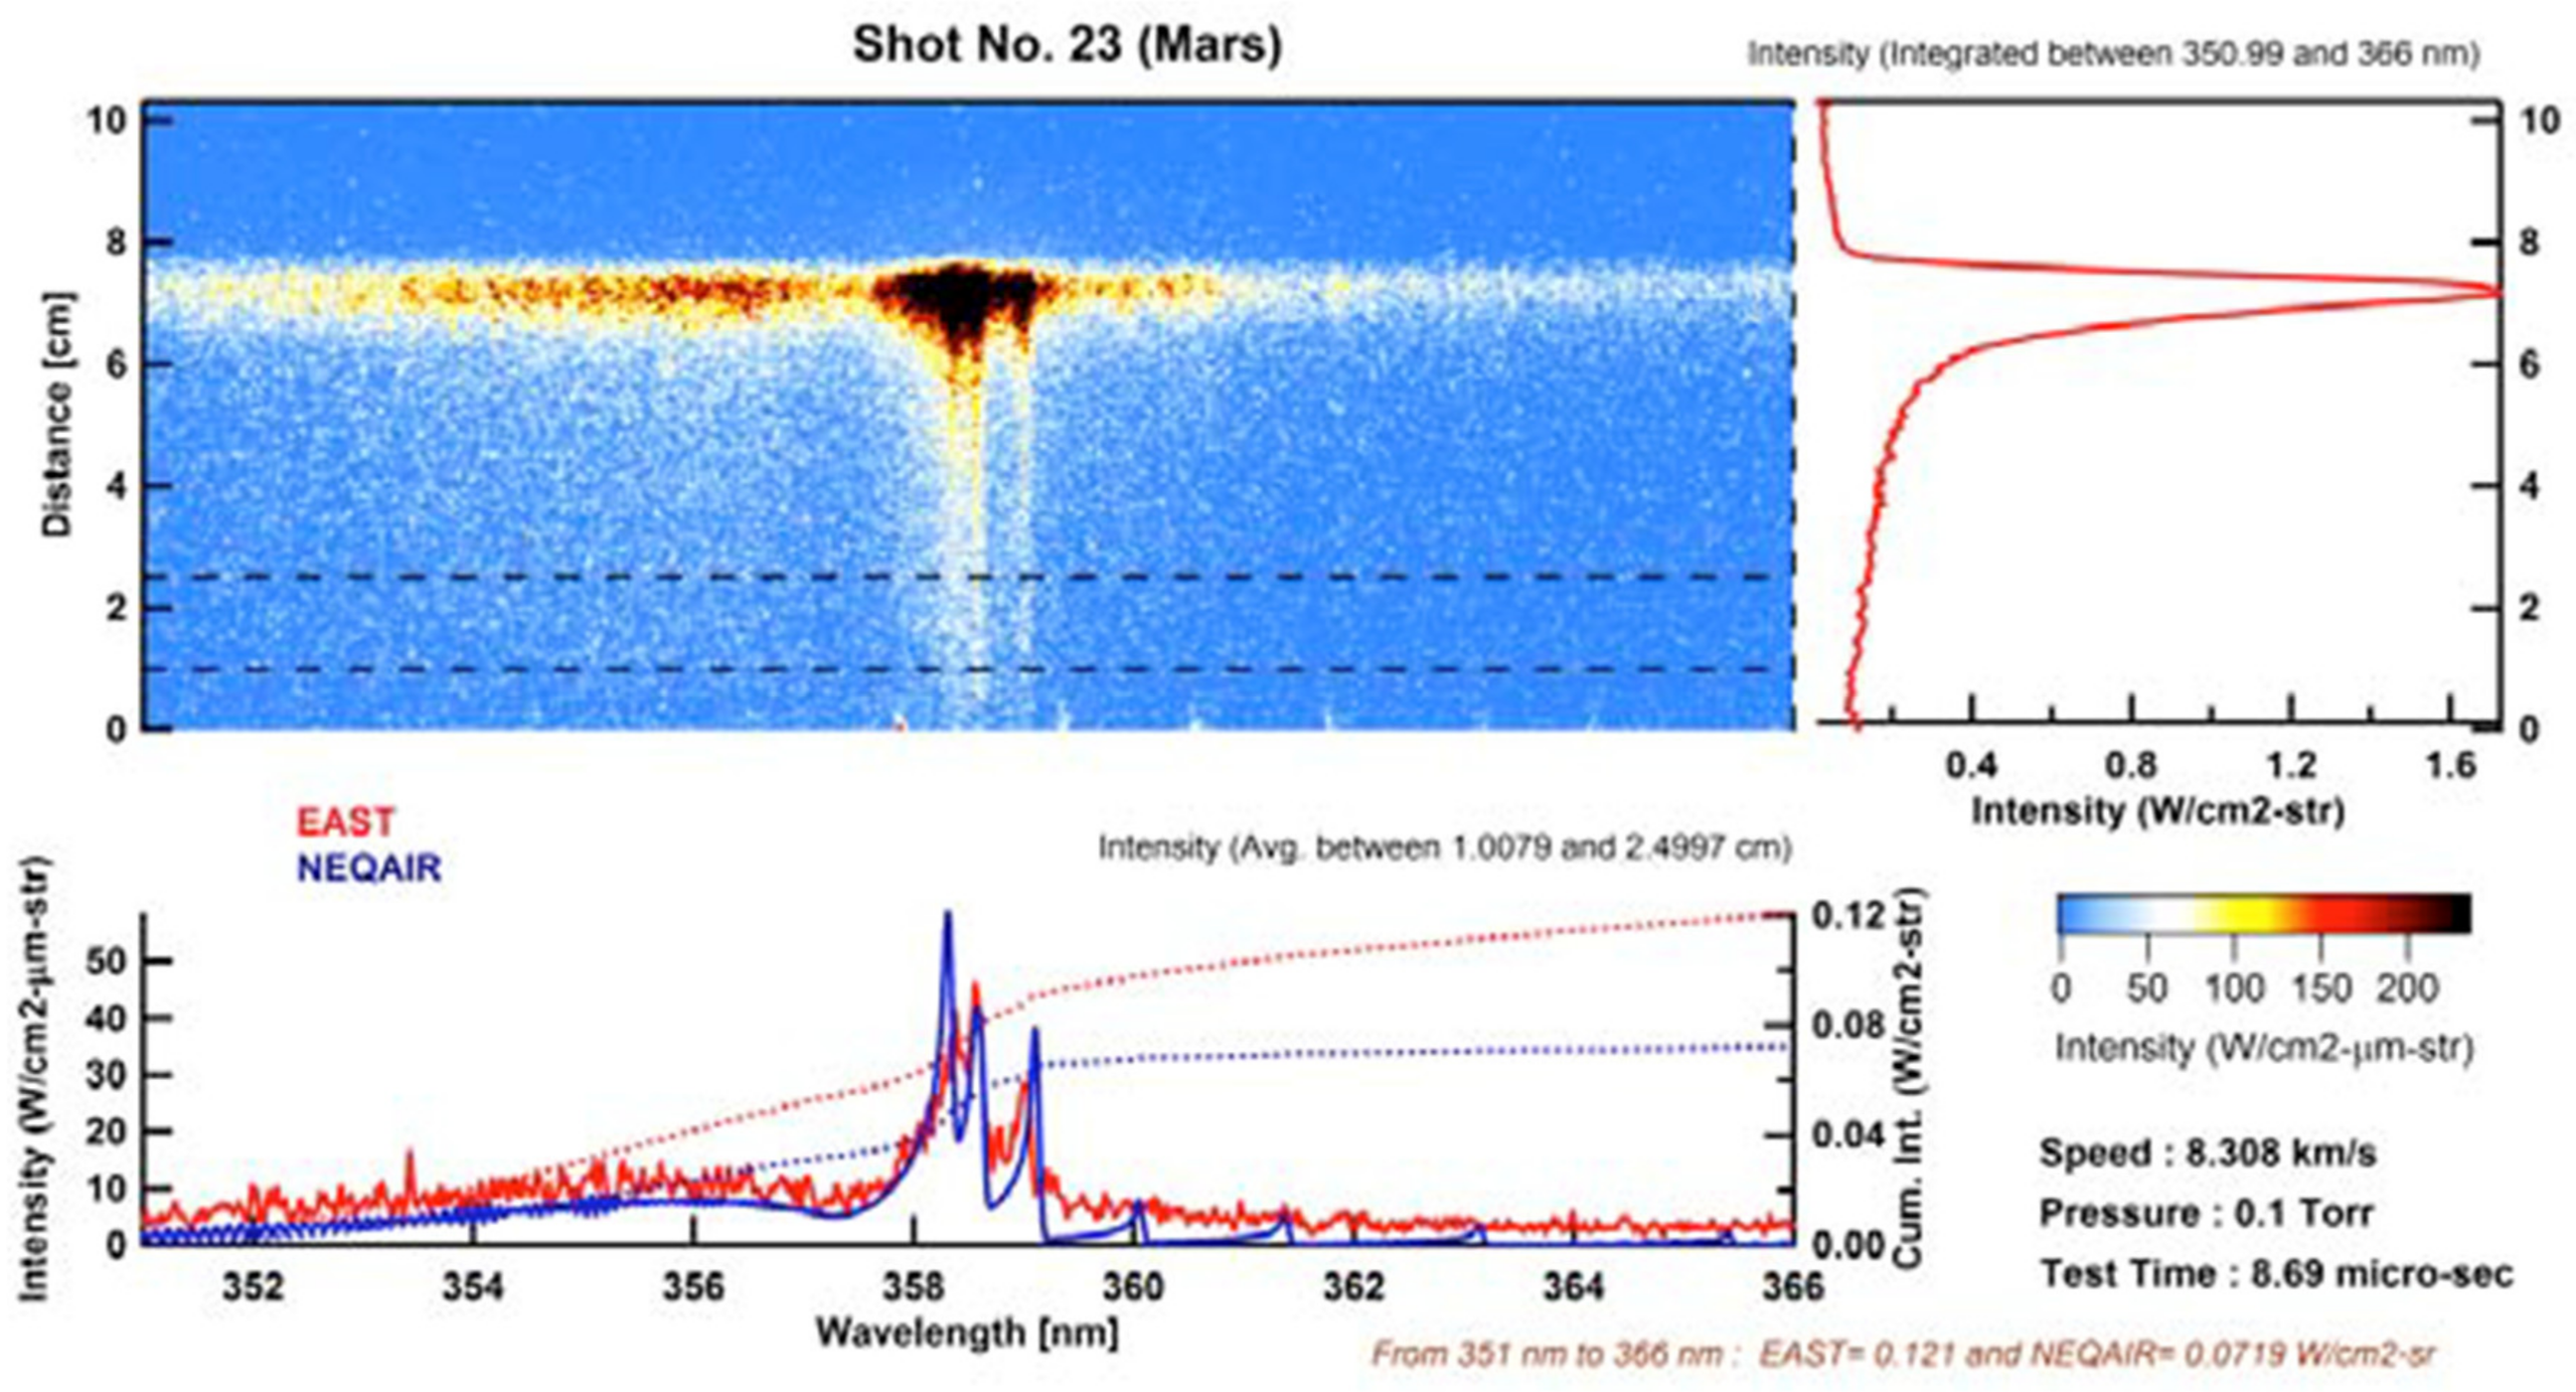
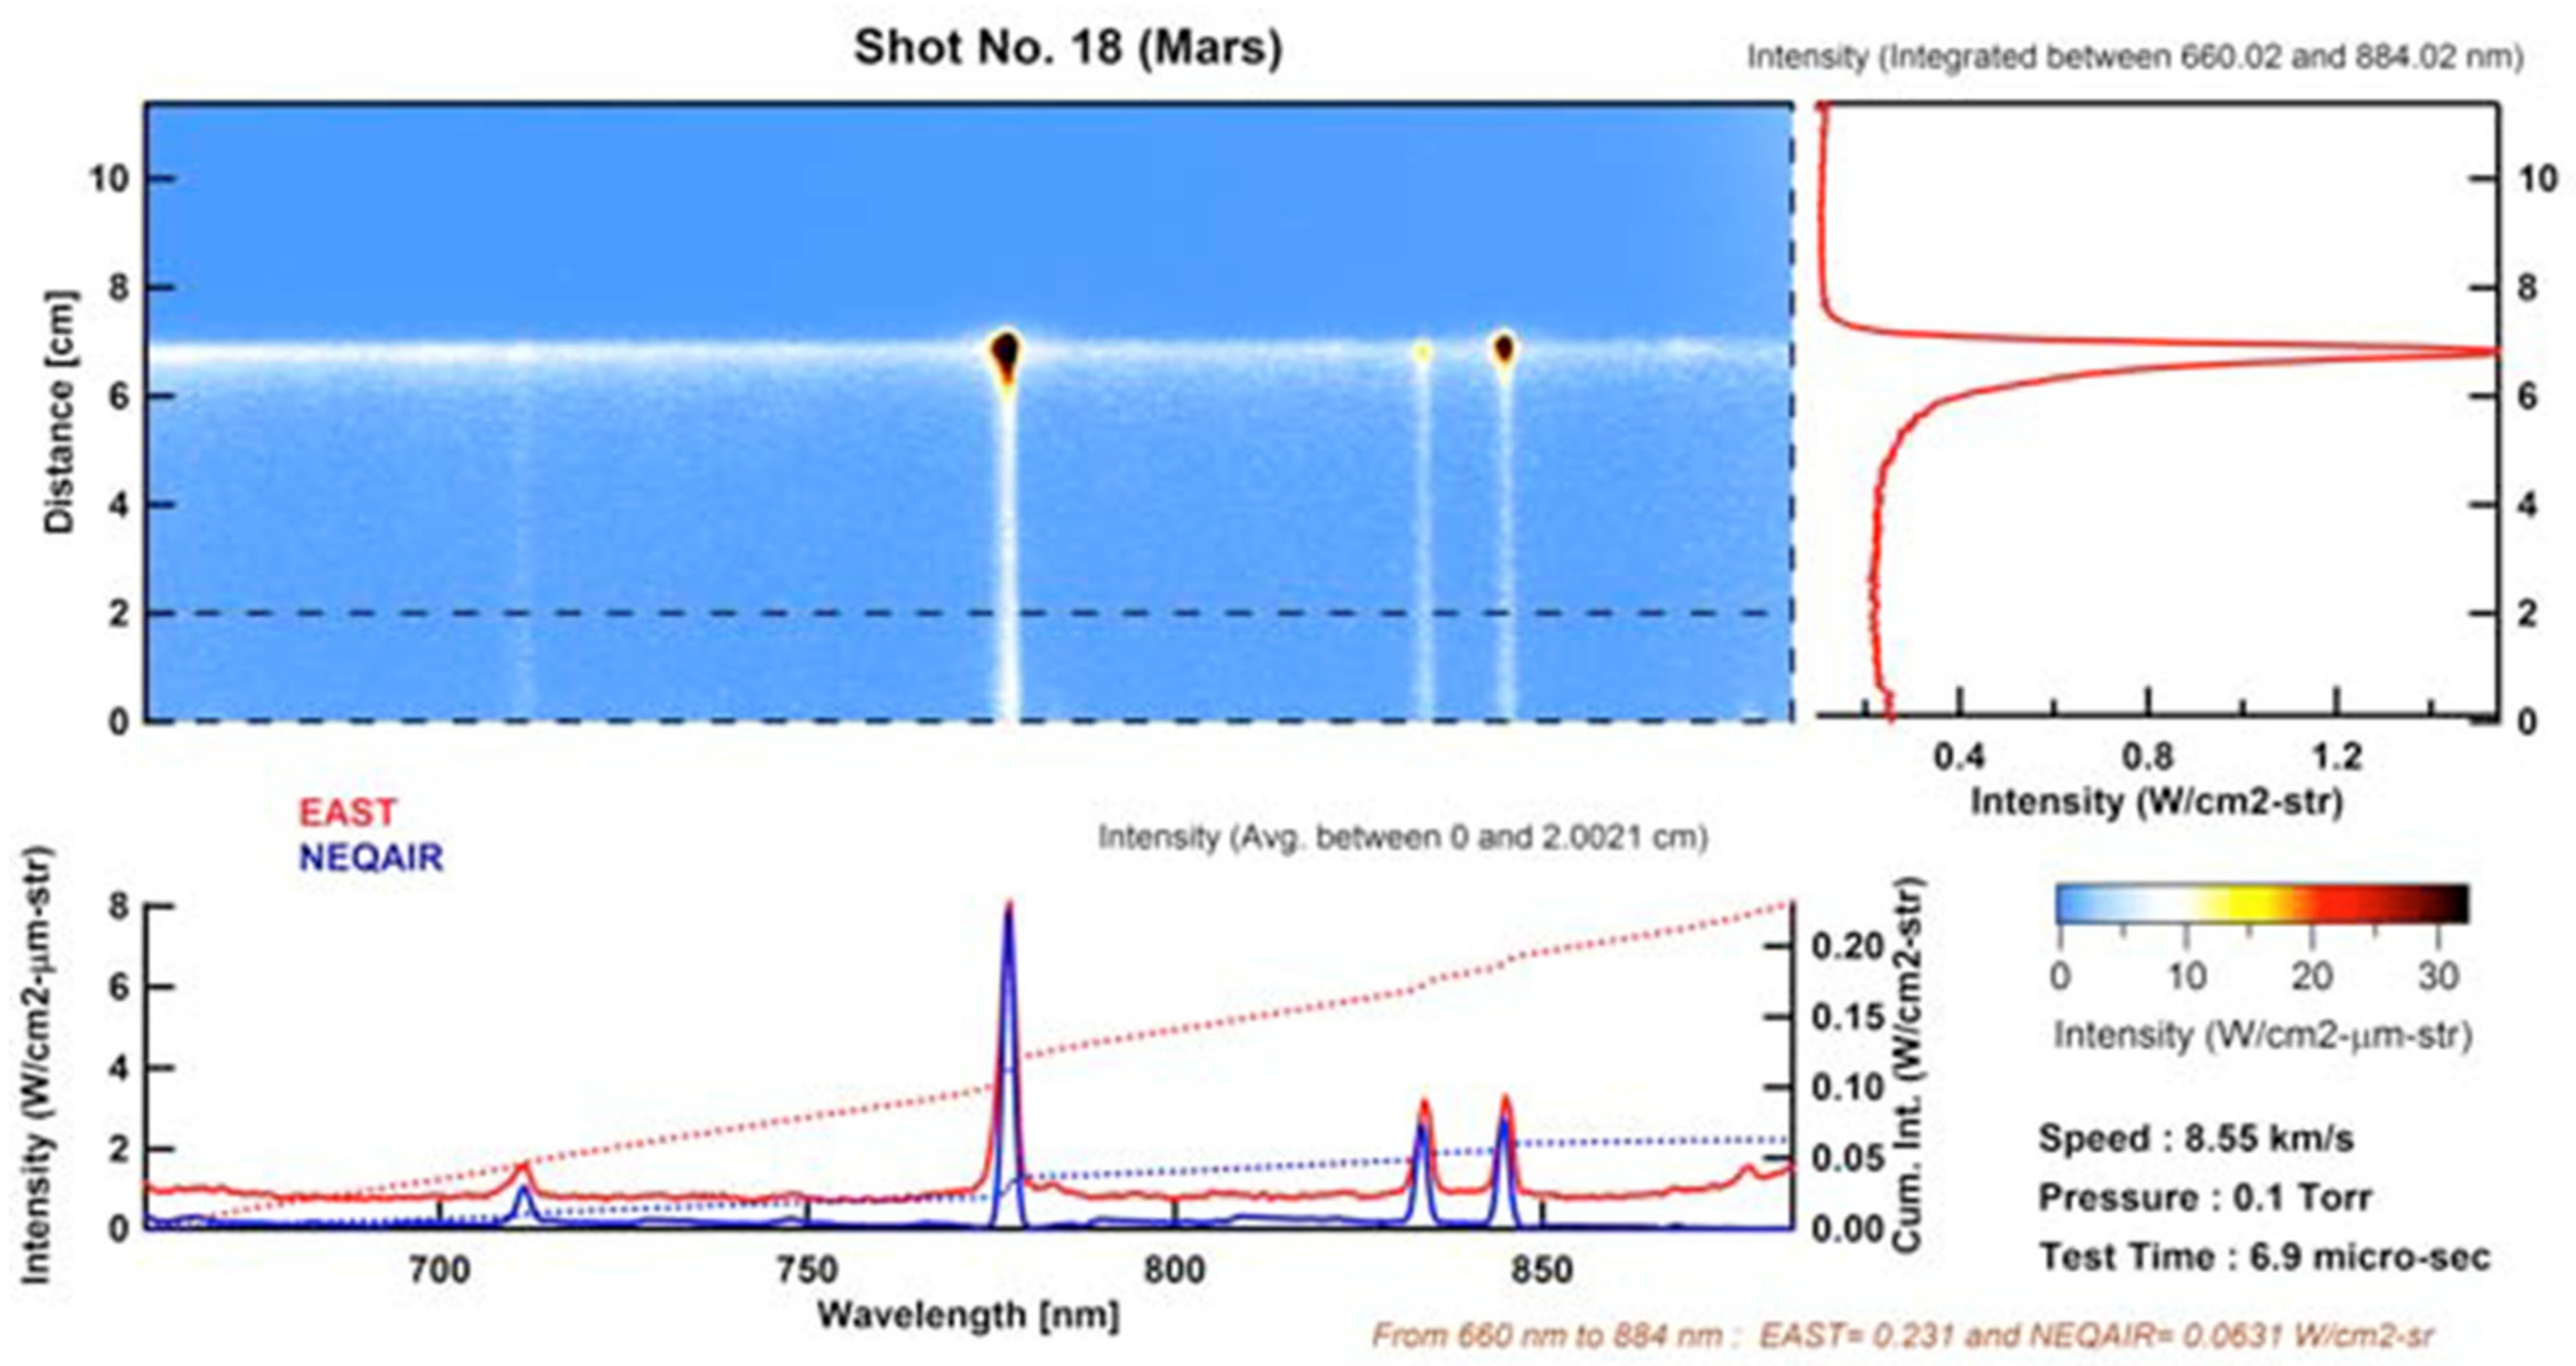
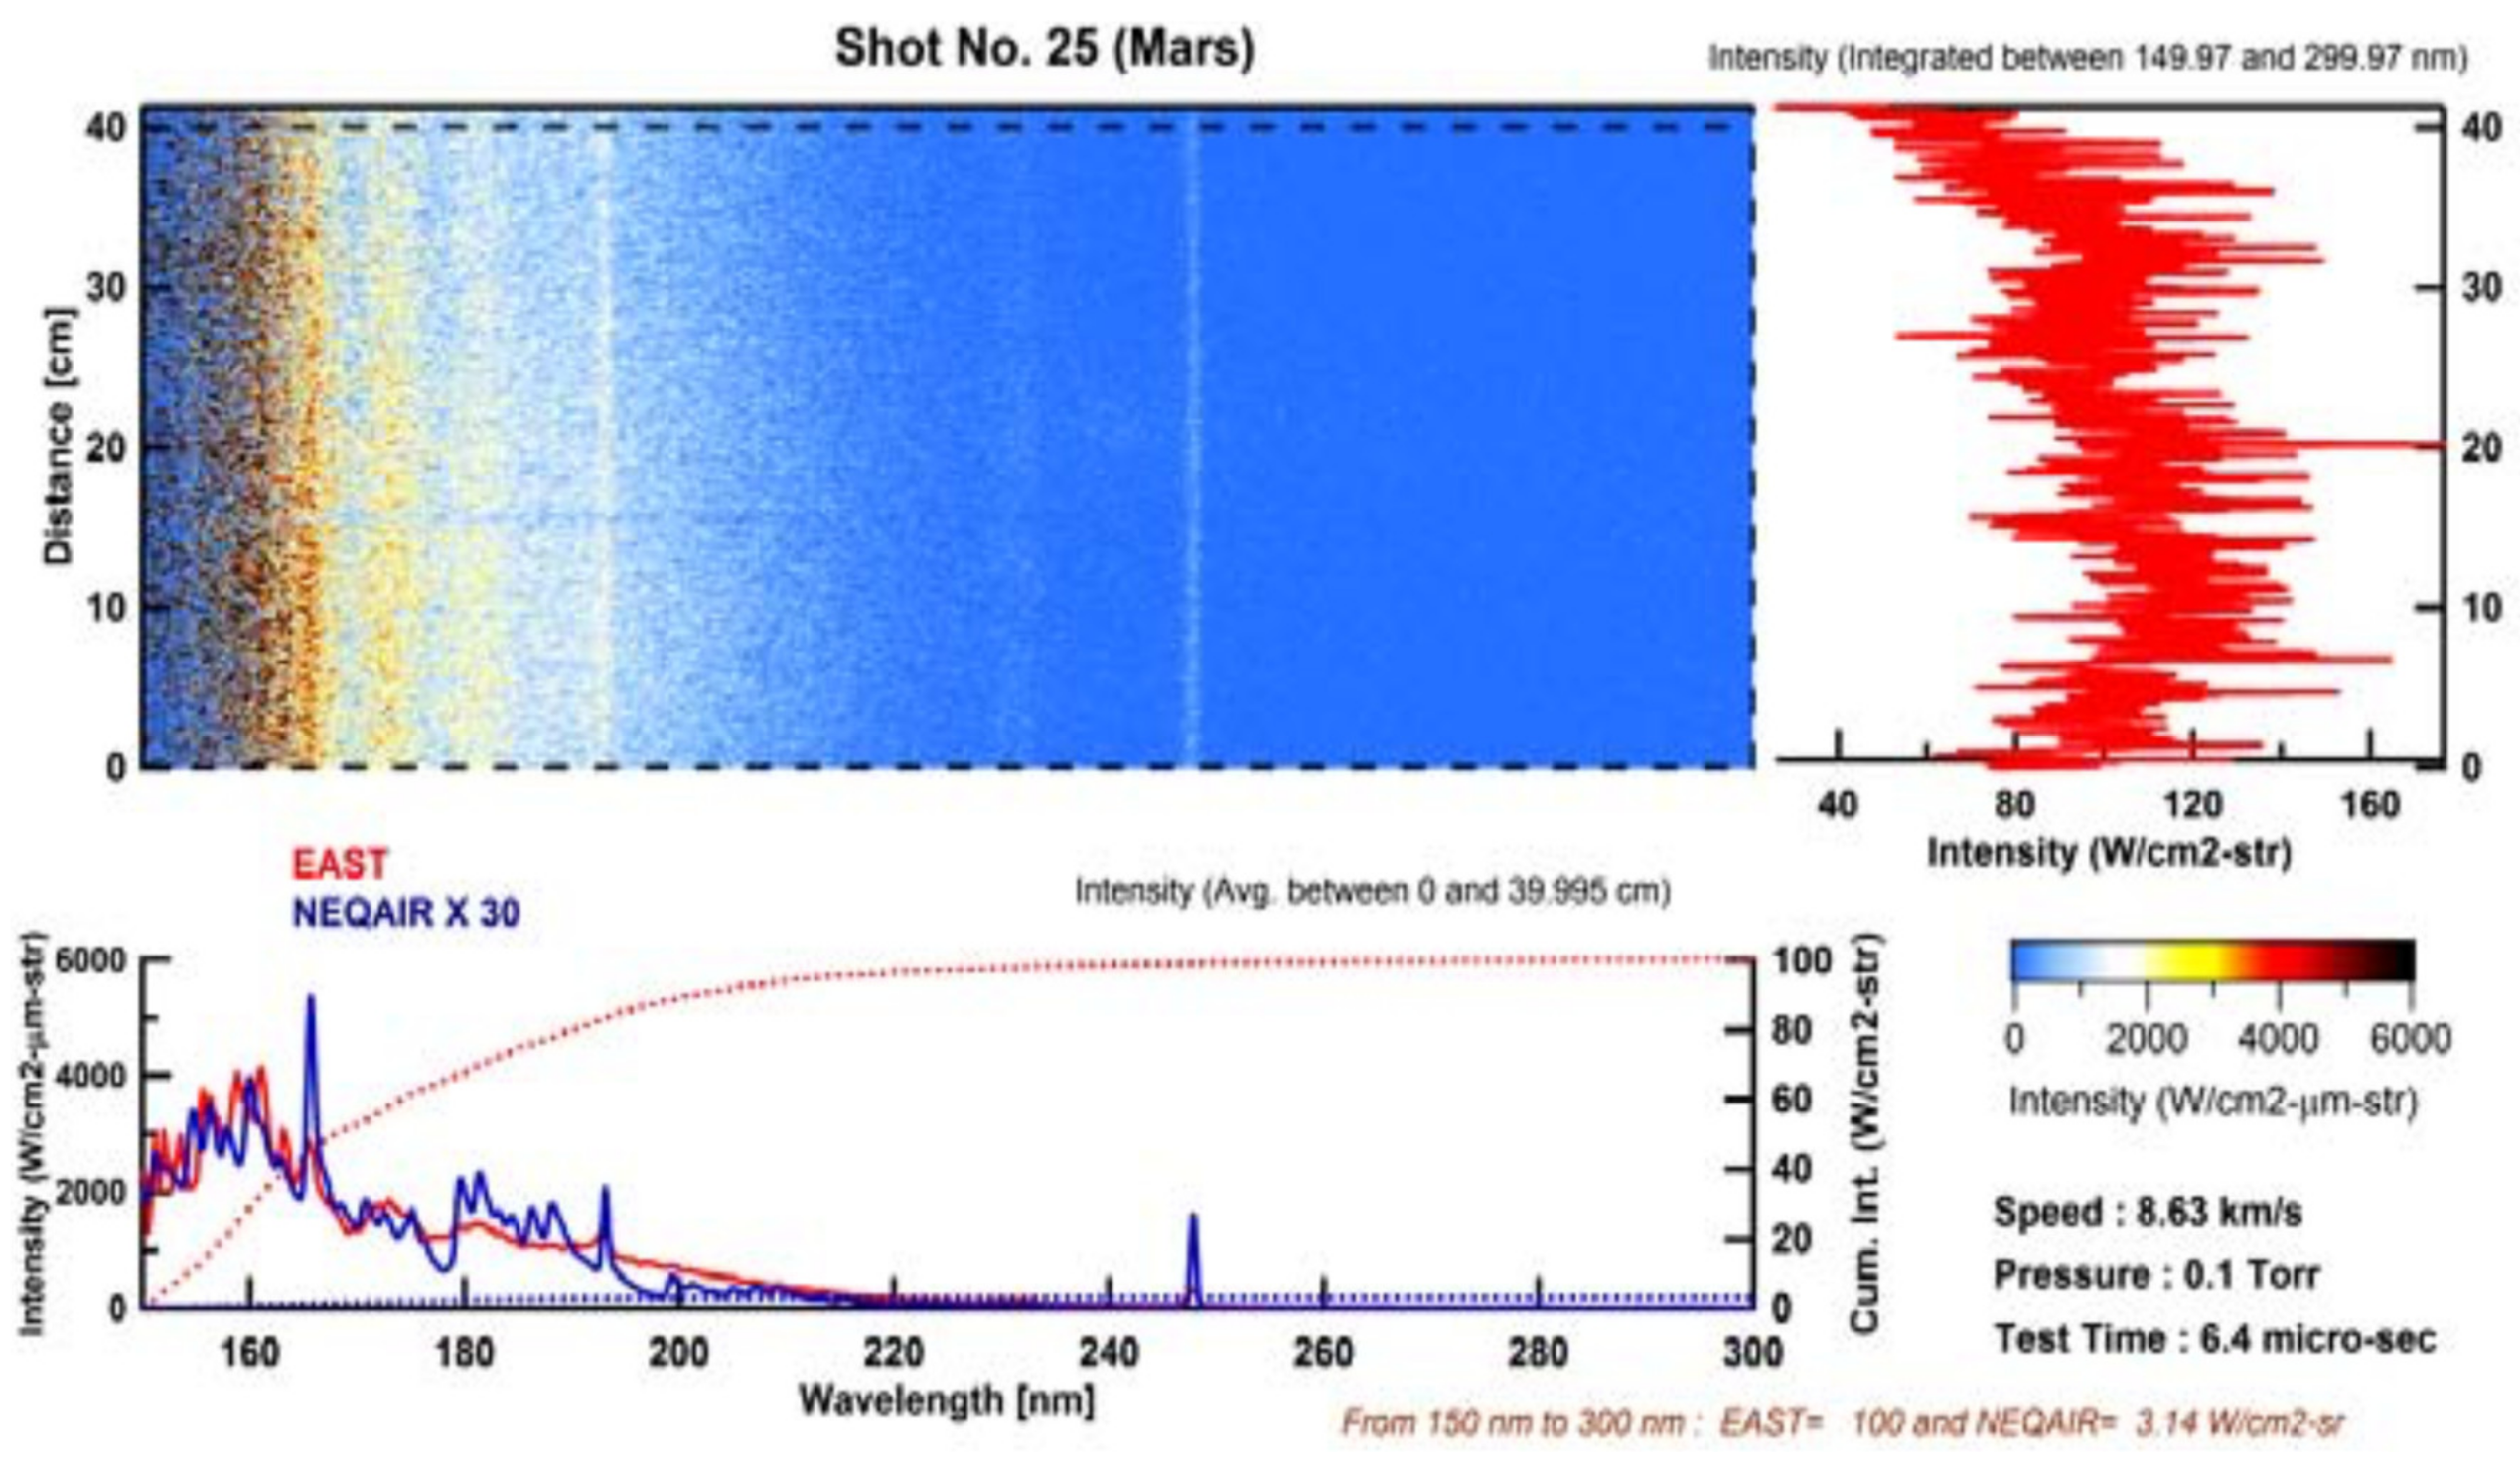
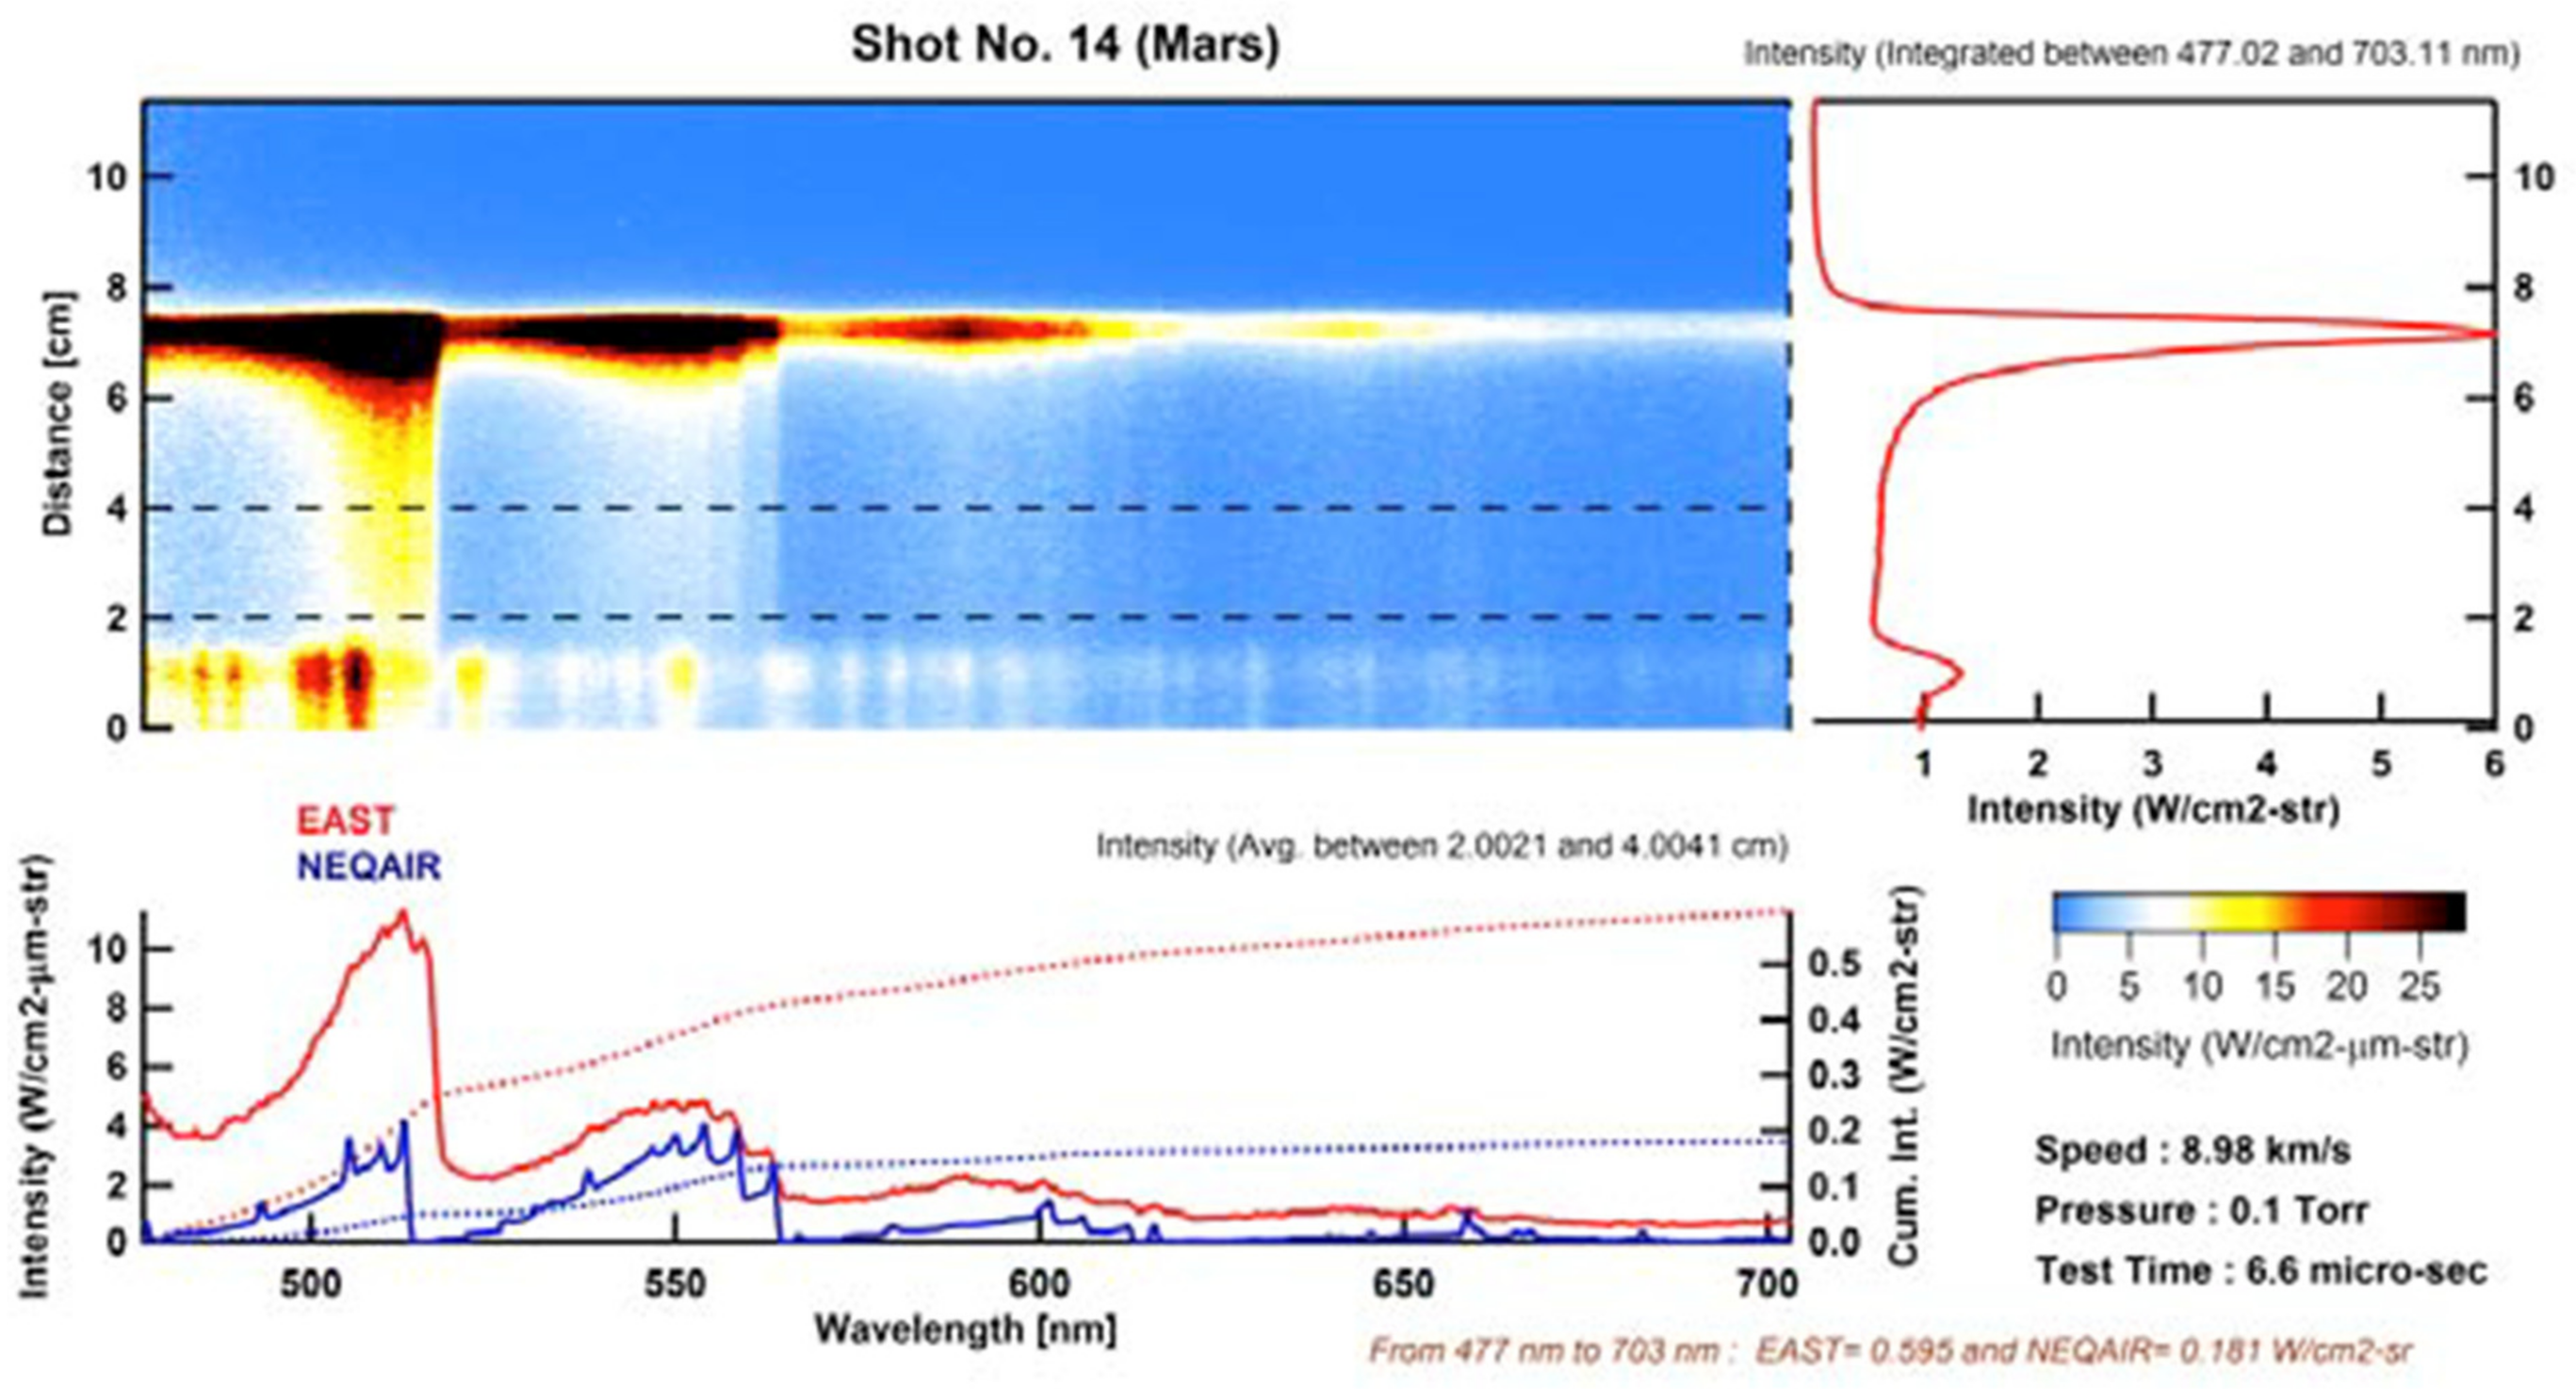
In another contribution, Bose et al. [24] present some experimental data obtained for similar conditions, same pressure and temperature, a Mars atmosphere composition, and shock velocities ranging from 8.3 to 9 km/s. Three spectrographs were used for the test campaign covering wavelengths from the VUV to the NIR as shown in Figure 19. Test results have been compared with NEQAIR predictions; some of these comparisons are plotted in Figure 20, Figure 21, Figure 22 and Figure 23 for shock velocities of 8.3, 8.55, 8.63, and 9 km/s respectively.
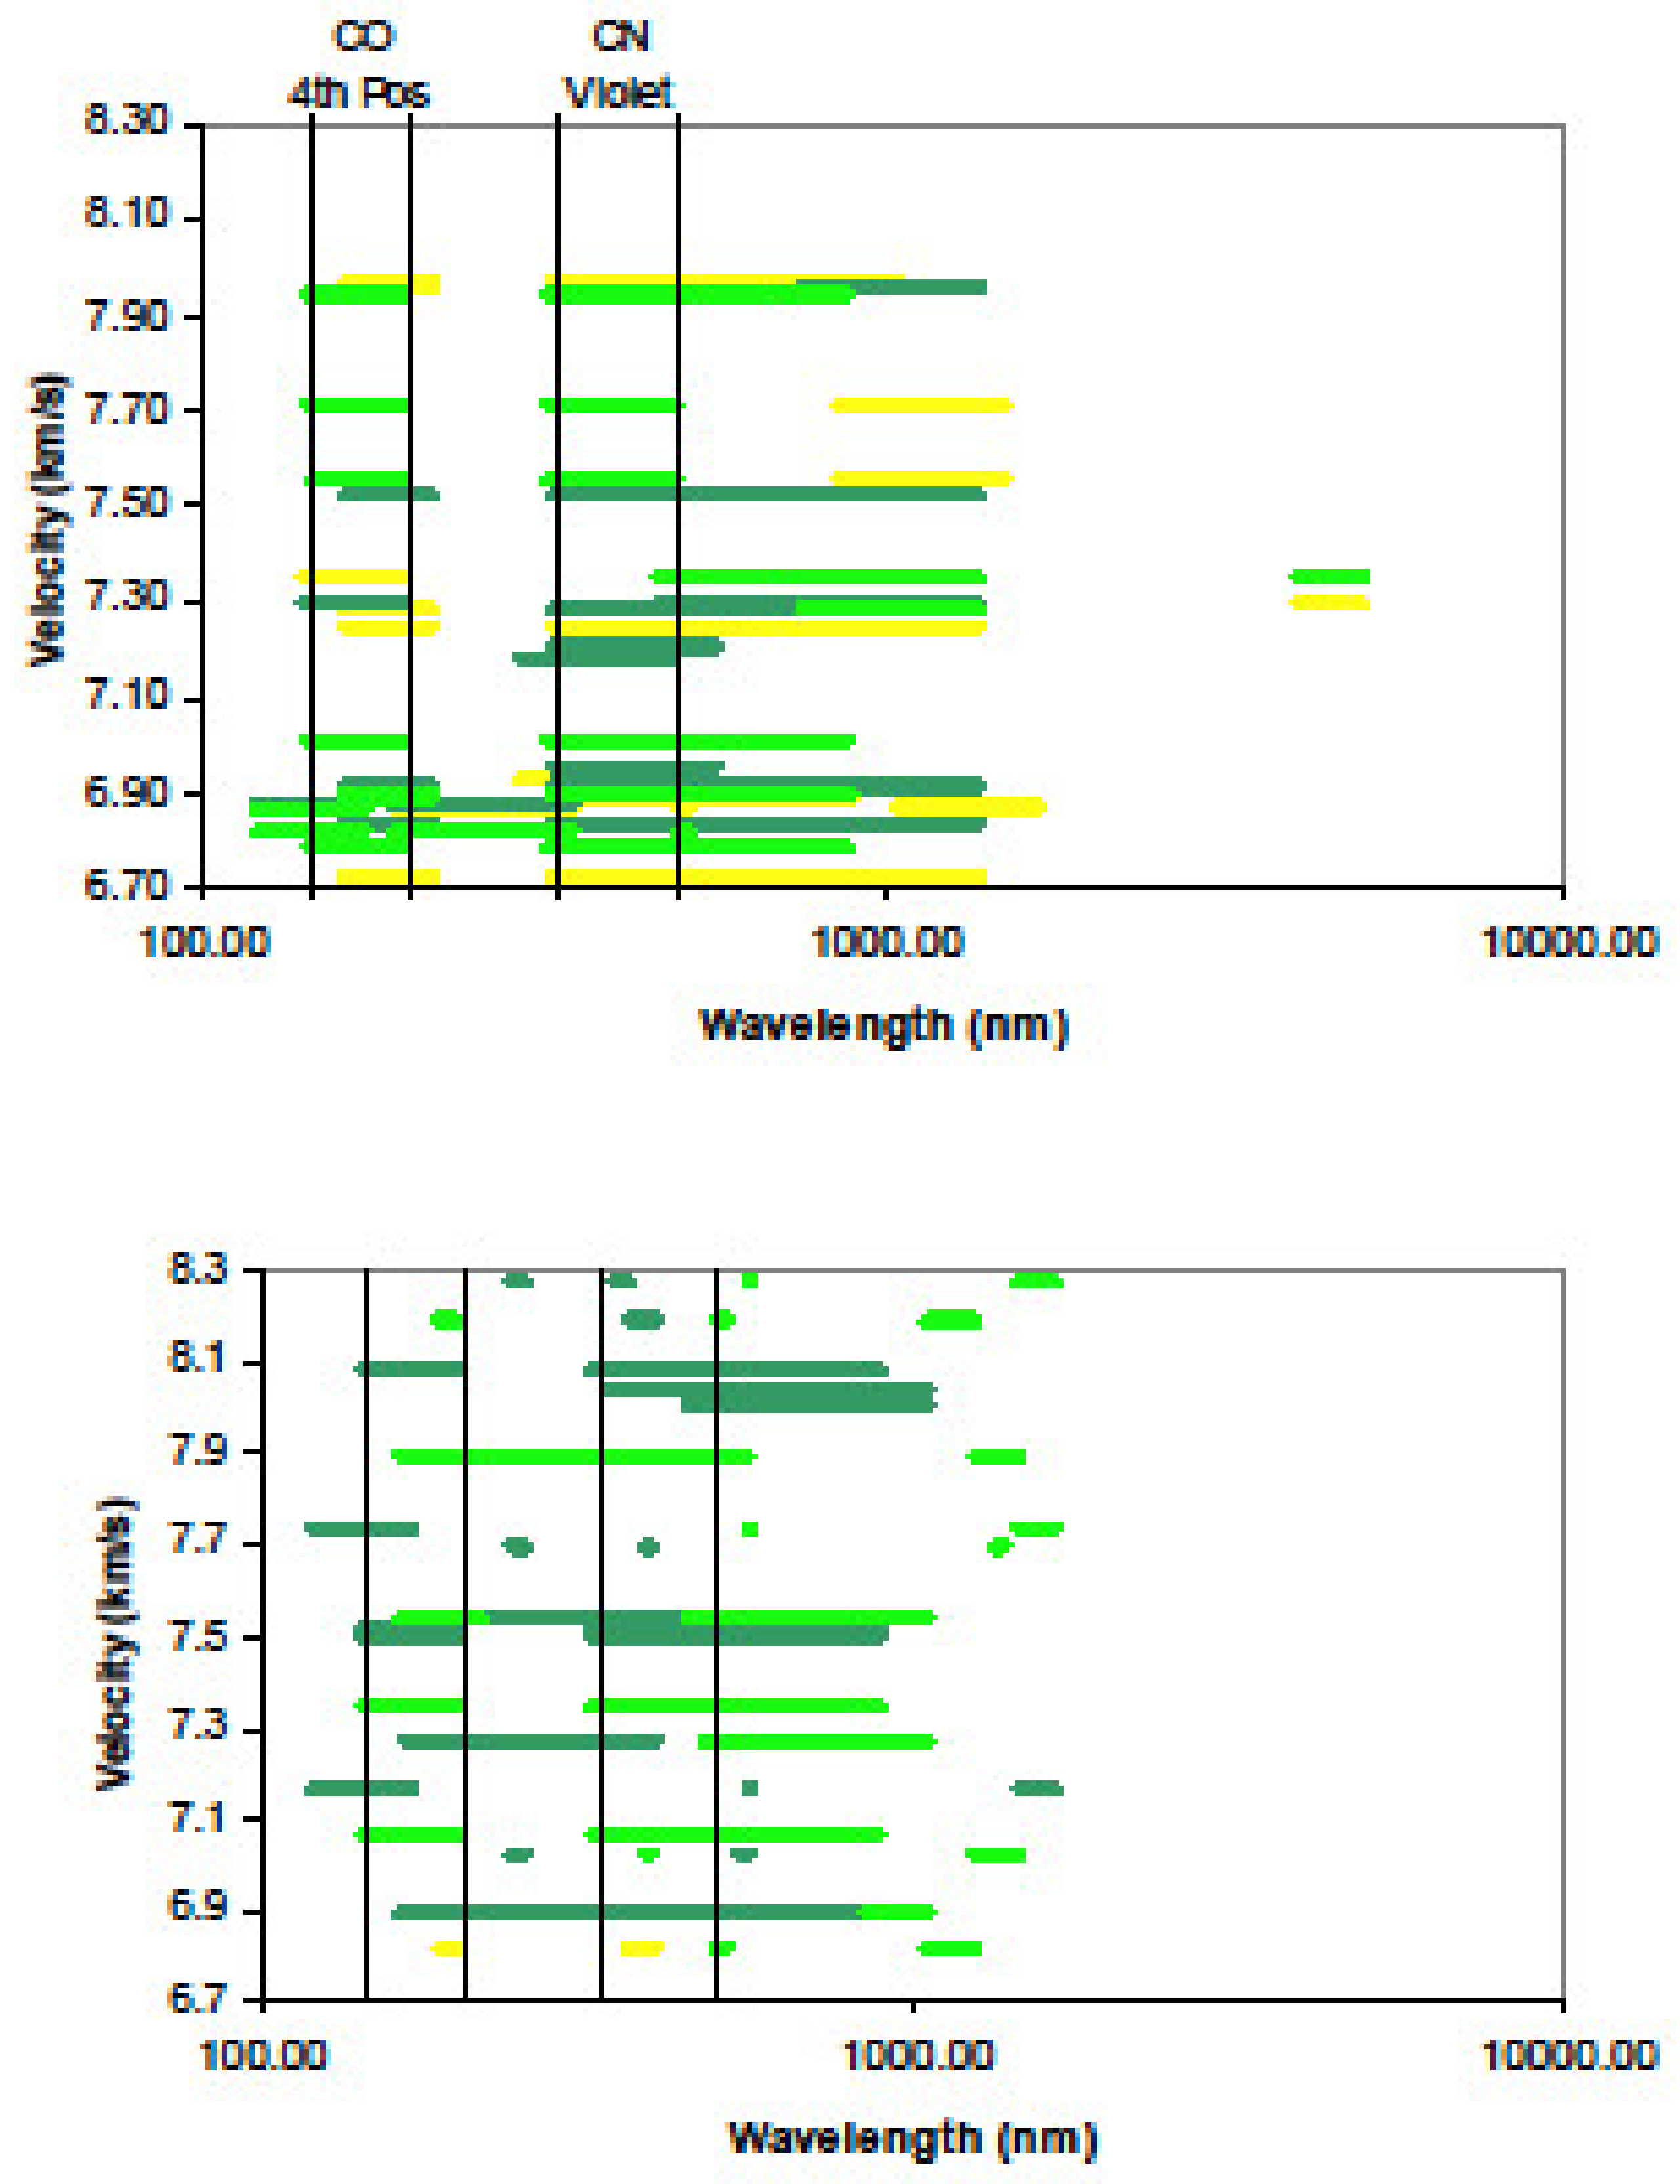
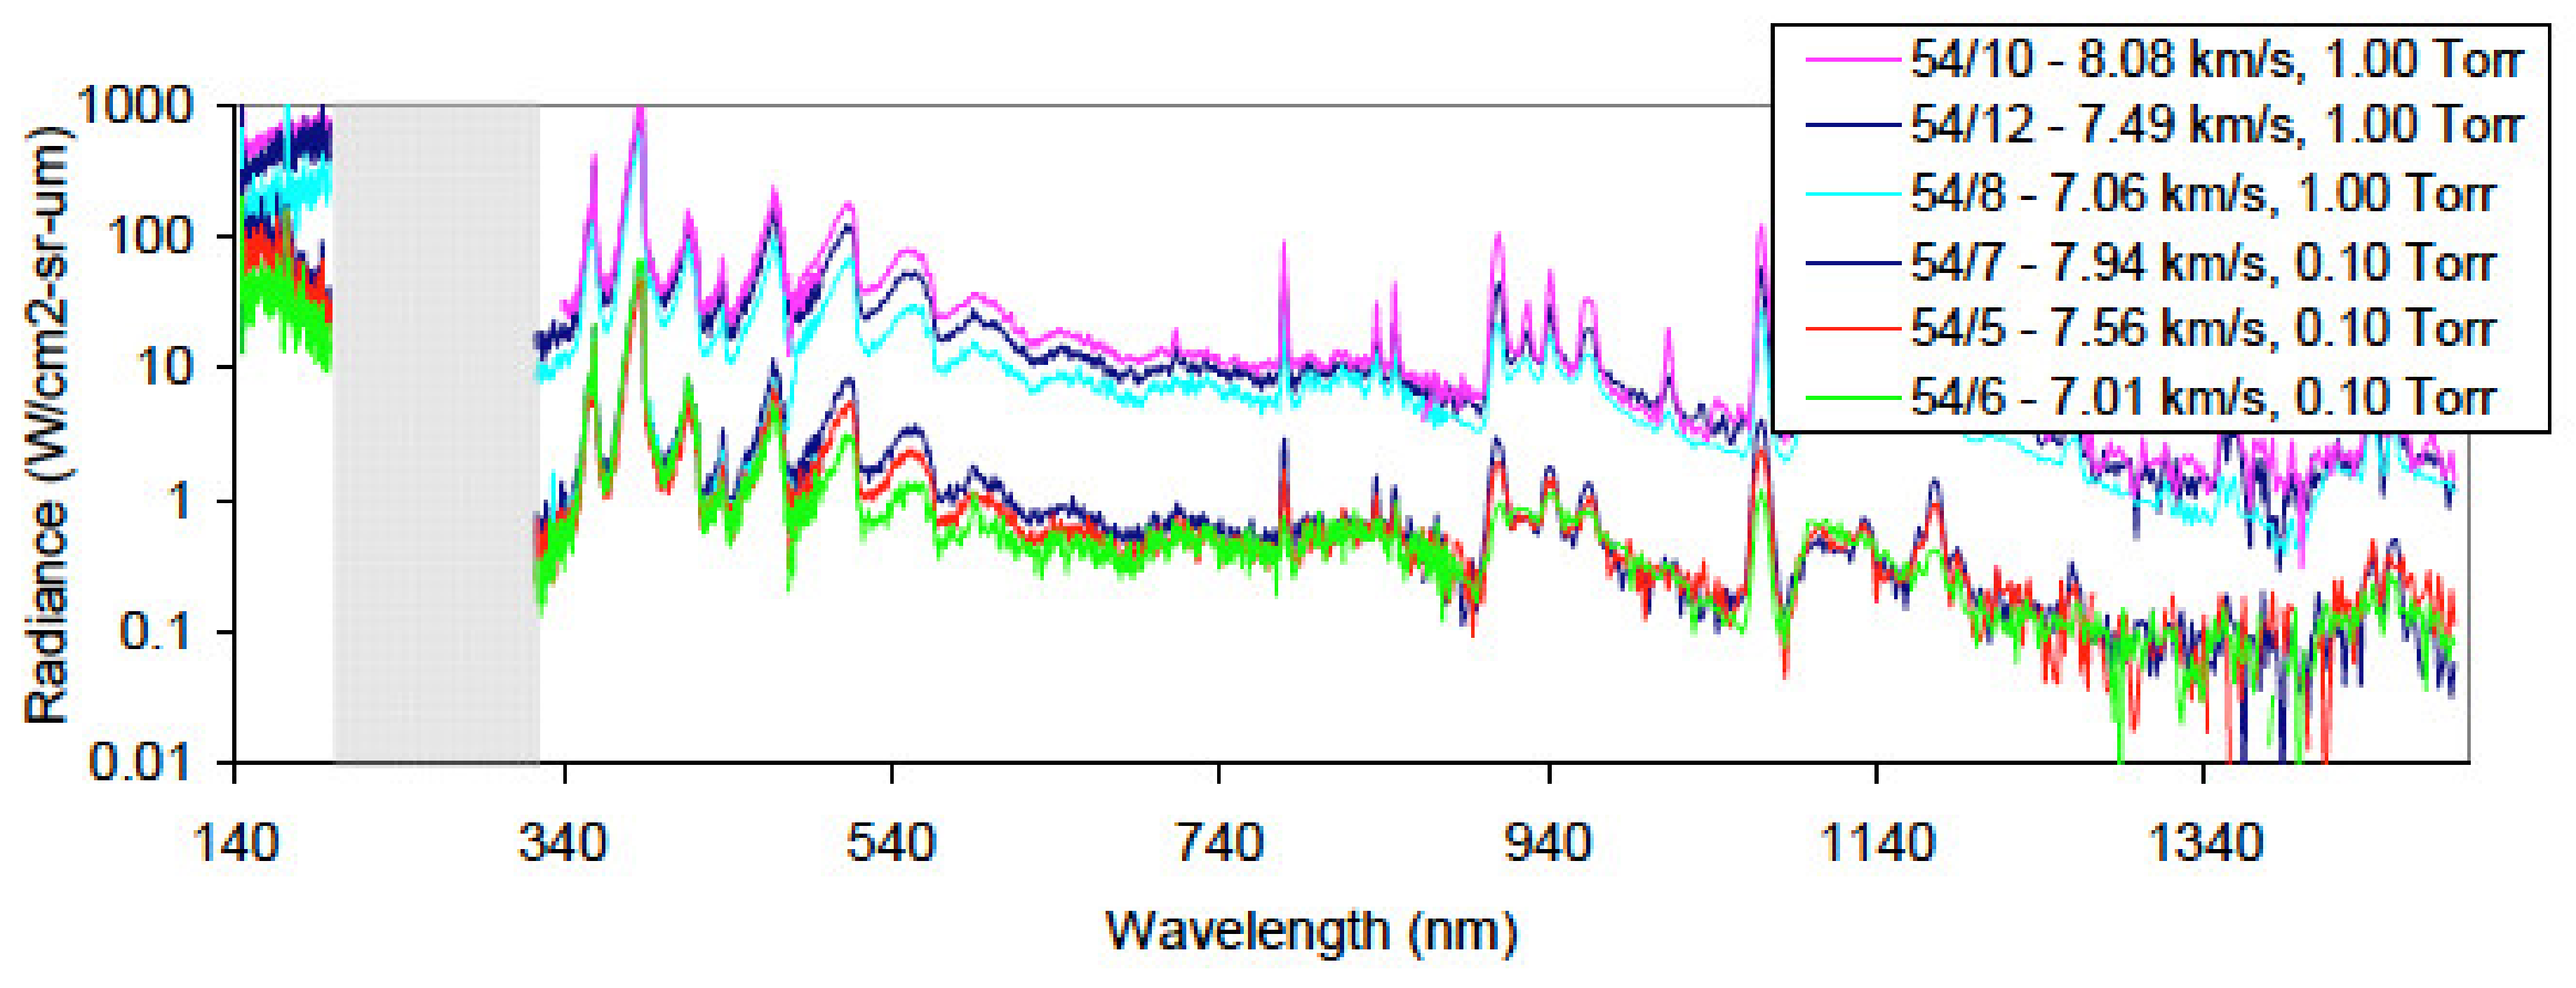
The Test Case 2 of the European Radiation Working Group has been also run in EAST [25]. Test Case nominal conditions are a nominal Mars atmosphere with 96% of CO2 and 4% of N2, velocities of 7, 7.5, and 8 km/s, and pressures of 0.1 and 1 Torr. Different runs were performed in EAST in these ranges and are reported in Figure 24 with the wavelength ranges covered by the instrumentation. The colour correspond to the data quality: yellow = low, dark green = medium, bright green = high. Measurements were performed from VUV to mid IR. Composite spectra for the nominal conditions of Test Case 2 are plotted in Figure 25 in a log scale. The emitted radiation increases by a factor in between 2 and 3, from 7 to 8 km/s, has highlighted in the same figure. As a consequence, if for most of the probe entries performed so far, radiation was not the key issue for the TPS design, this will not be the case if the aerocapture of a probe has to be performed.
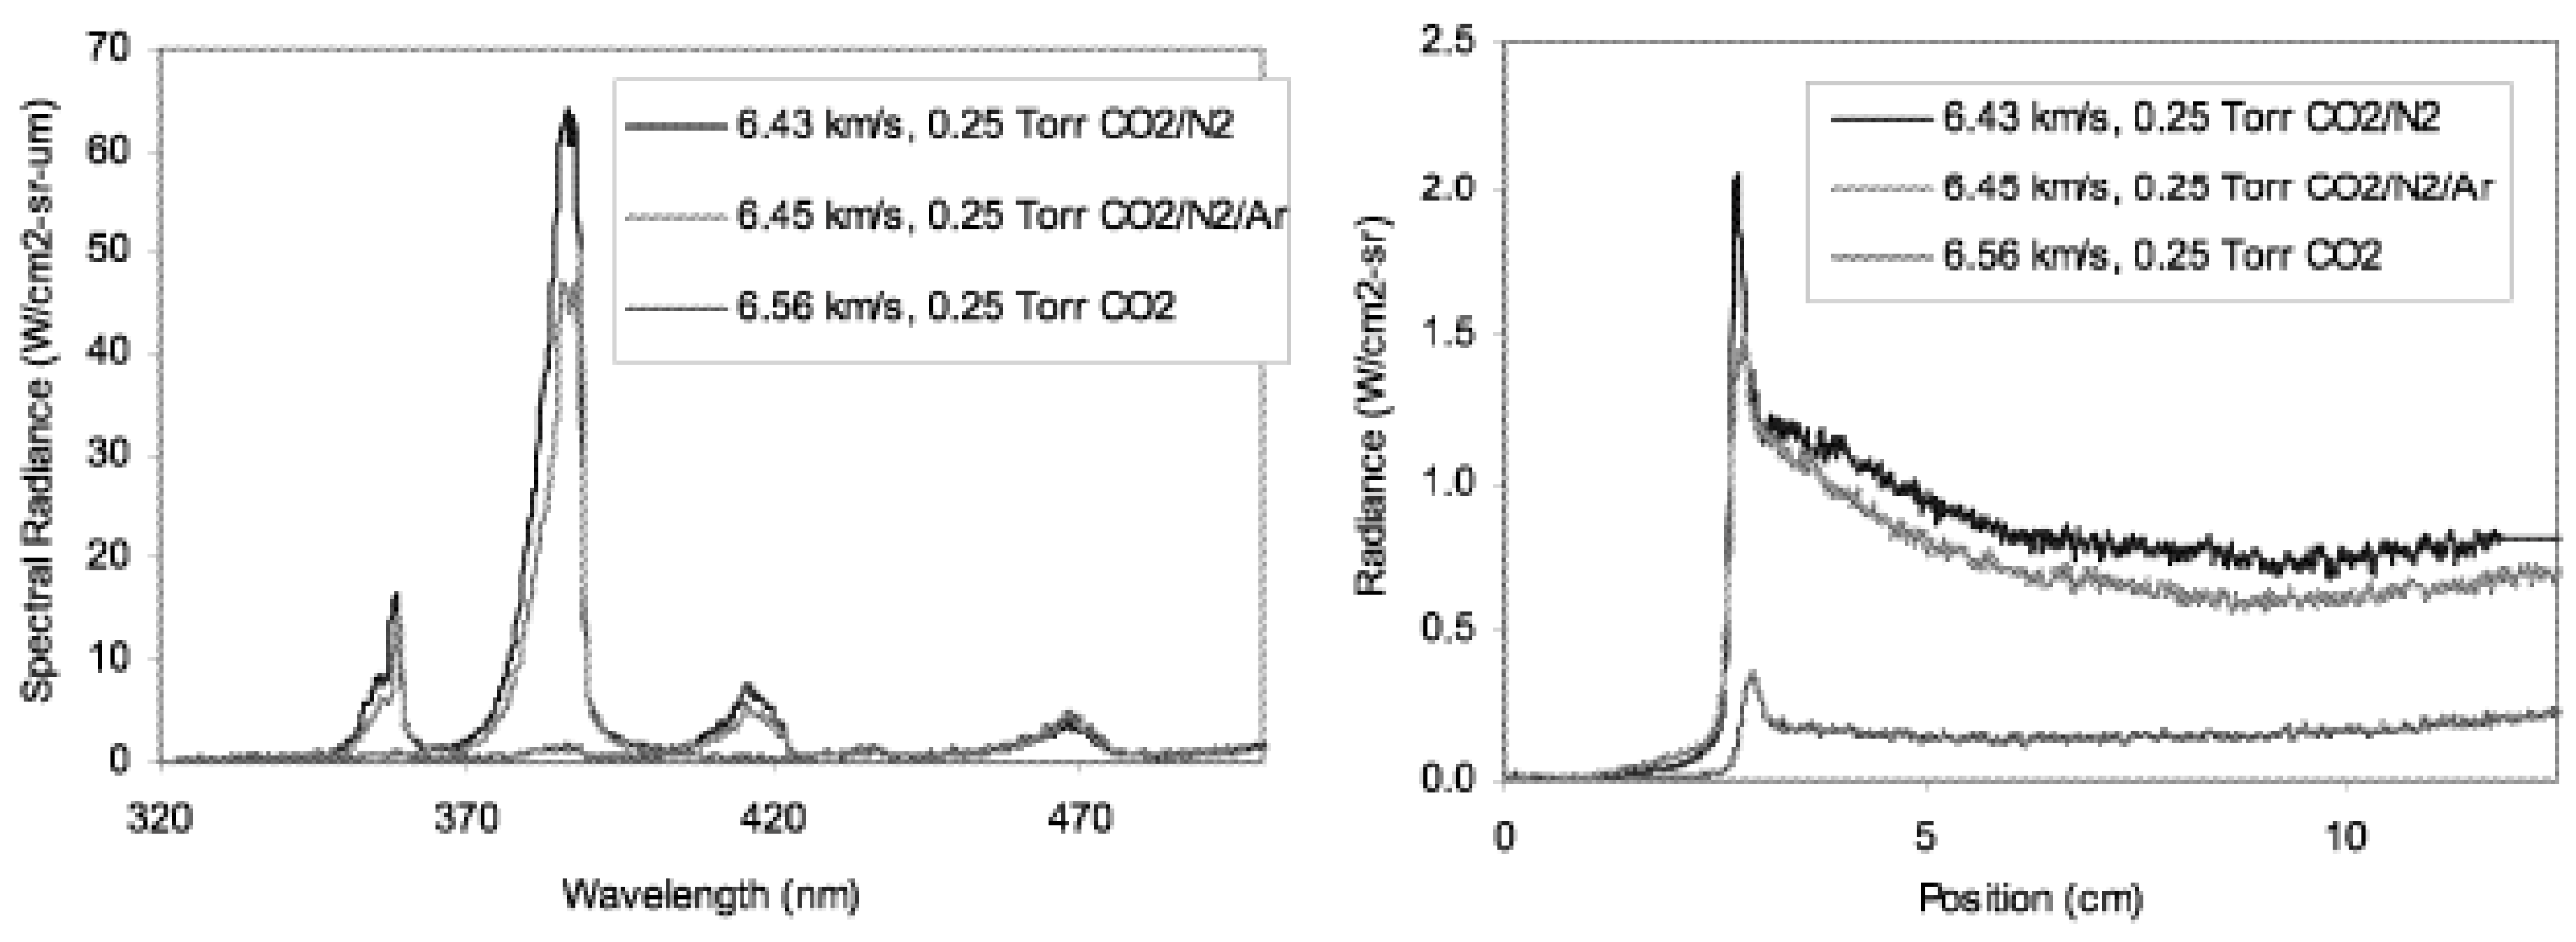
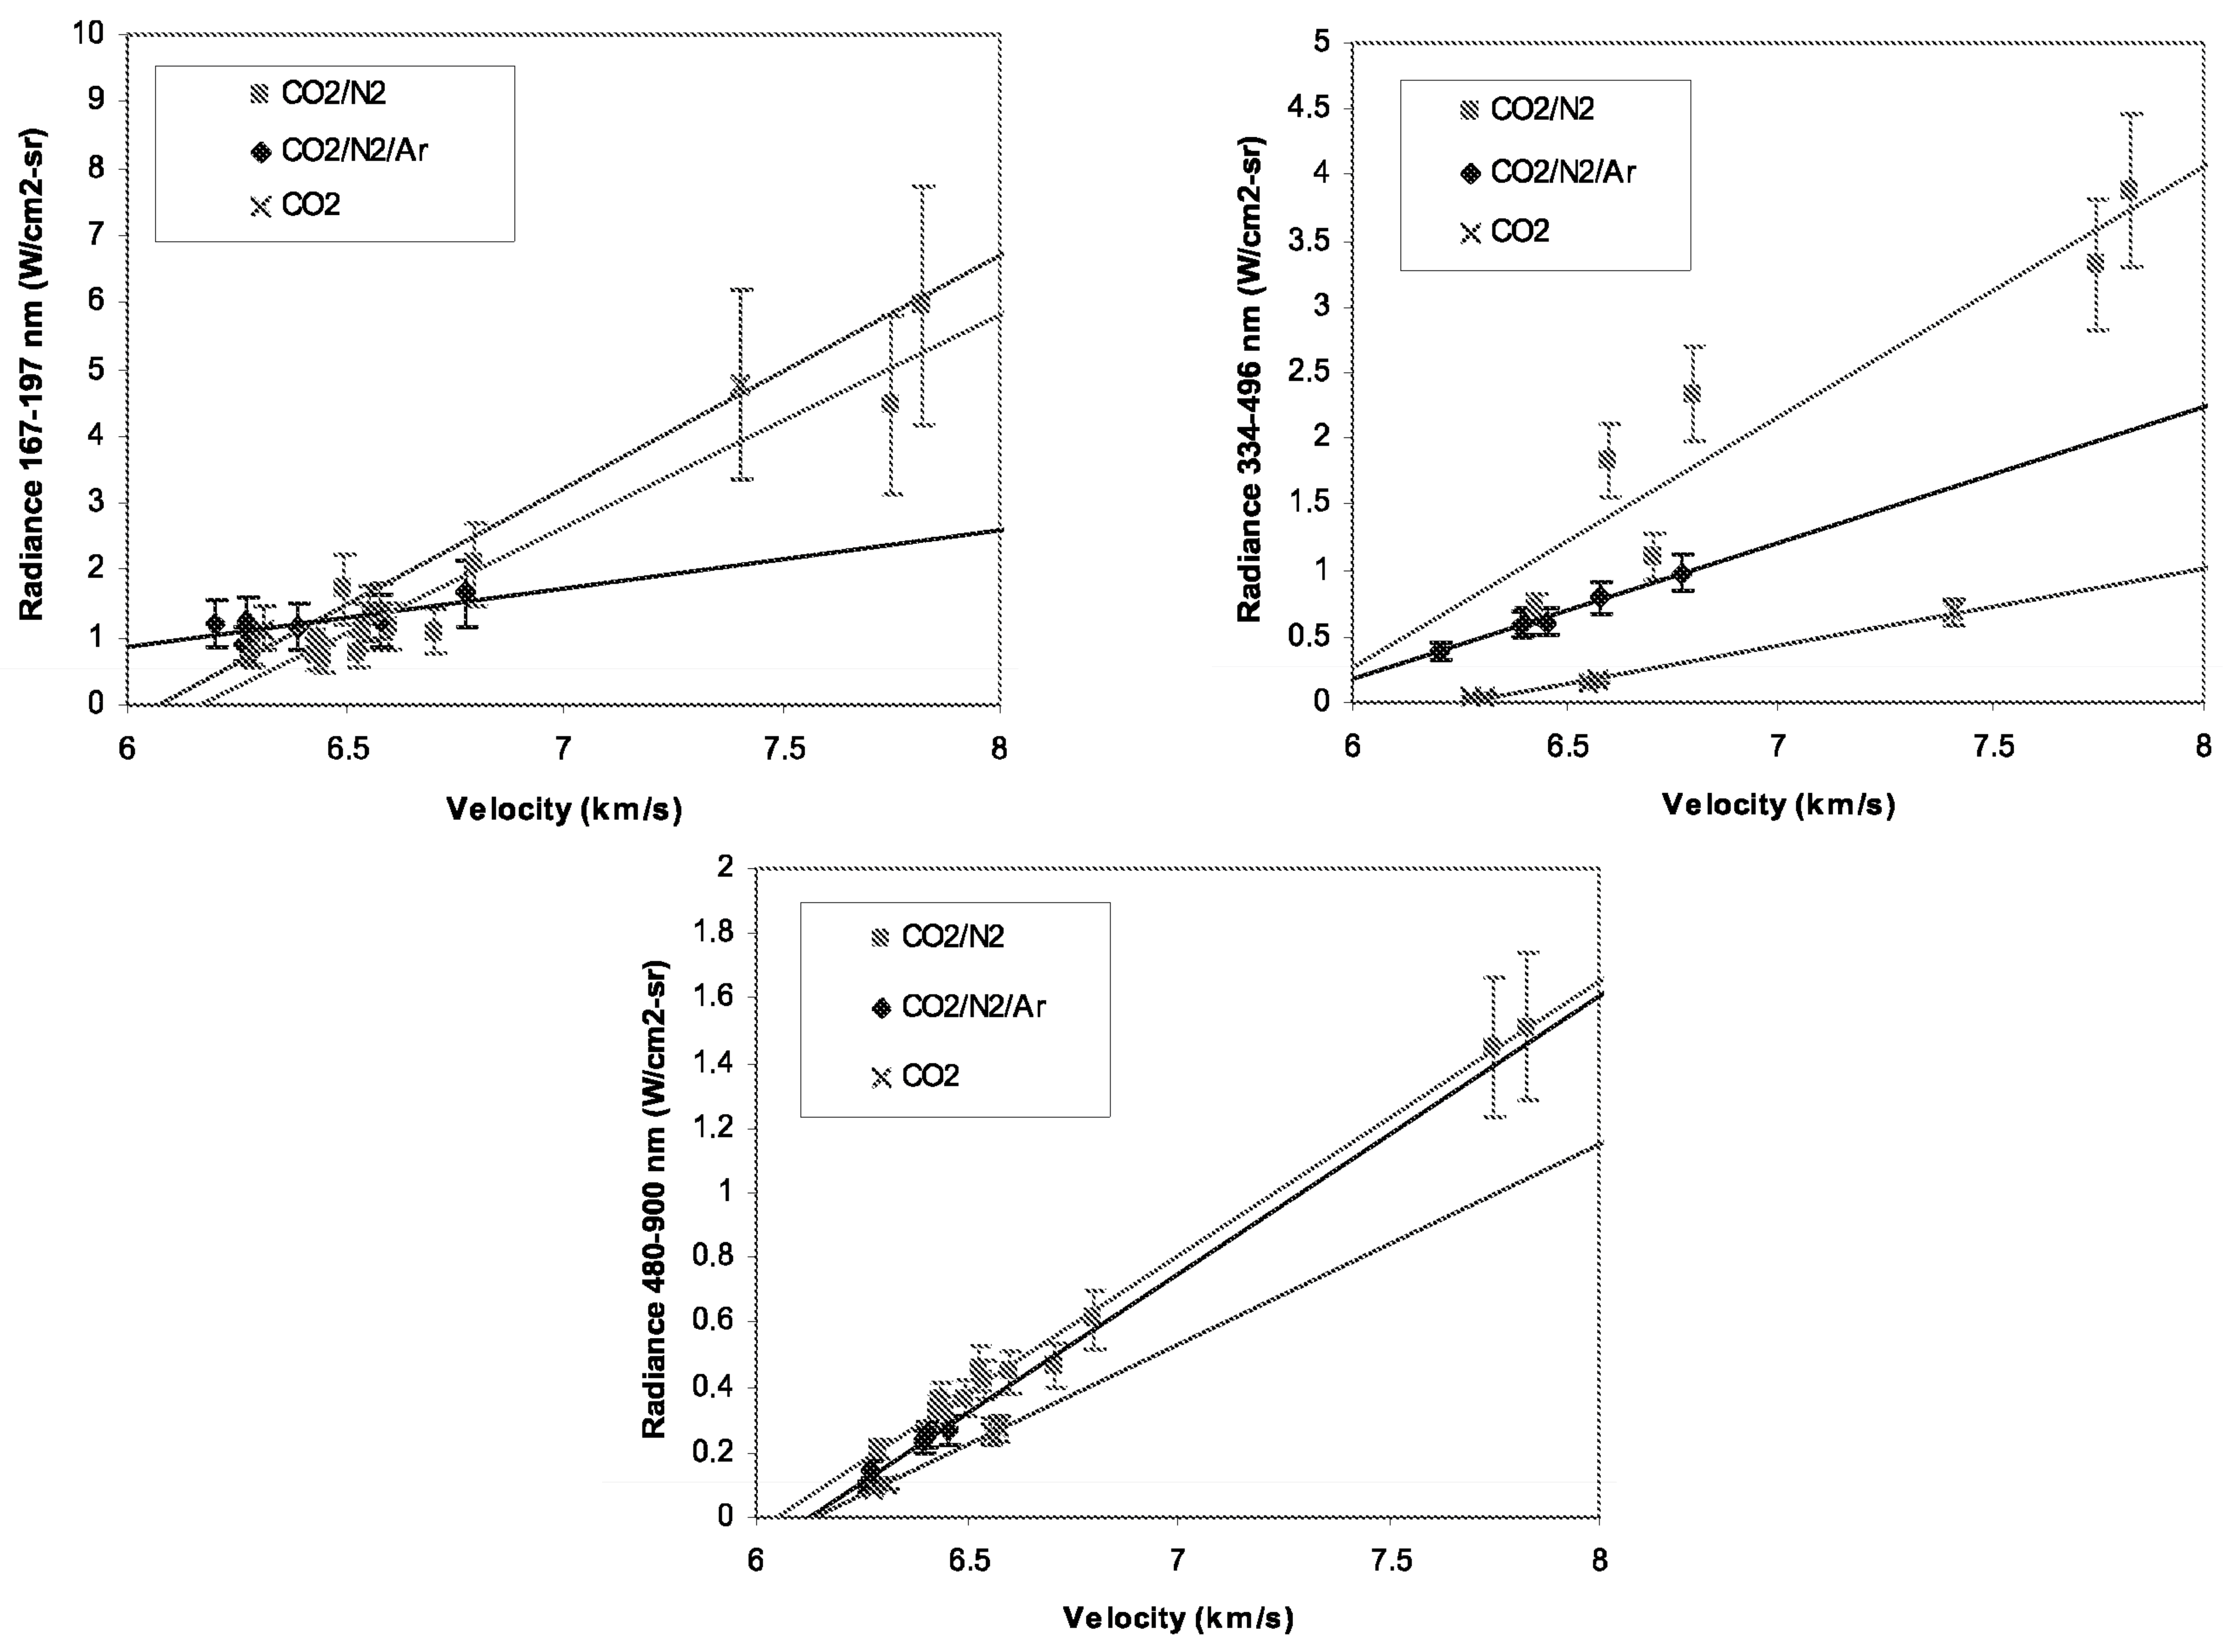
More recently, Cruden et al. [26] have investigated different Mars-like mixtures in order to assess the radiance in CO2/N2/Ar systems. Shock tube tests were carried out for different mixtures: pure CO2, 96:4 CO2/N2, and 95.8/2.7/1.5 CO2/N2/Ar per mole. Tests were clustered around velocities and pressure of 6.5 km and 0.25 Torr, and 7 km/s and 0.1 Torr. Spectral range from VUV to mid IR has been covered and special care was given to CO (4+) and CN violet radiation. Measurements proved a low sensitivity of radiation to the presence of N2 except for CN Violet. Analysis of CN relaxation time has been performed using the CN Violet relaxation measurement, it has been found to be weakly dependent on the mixture composition. Some results are shown in Figure 26, for the spectral radiation in the CN Violet and as function of position at 6.5 km/s and 0.25 Torr, this for the three mixtures. Figure 27 summarizes the contribution to the radiation of the different bands (VUV, UV, and VIS-IR) for the different mixtures as function of velocity. The experimental data were also compared against the predictions performed with HARA non-equilibrium radiation code [27] in [28].
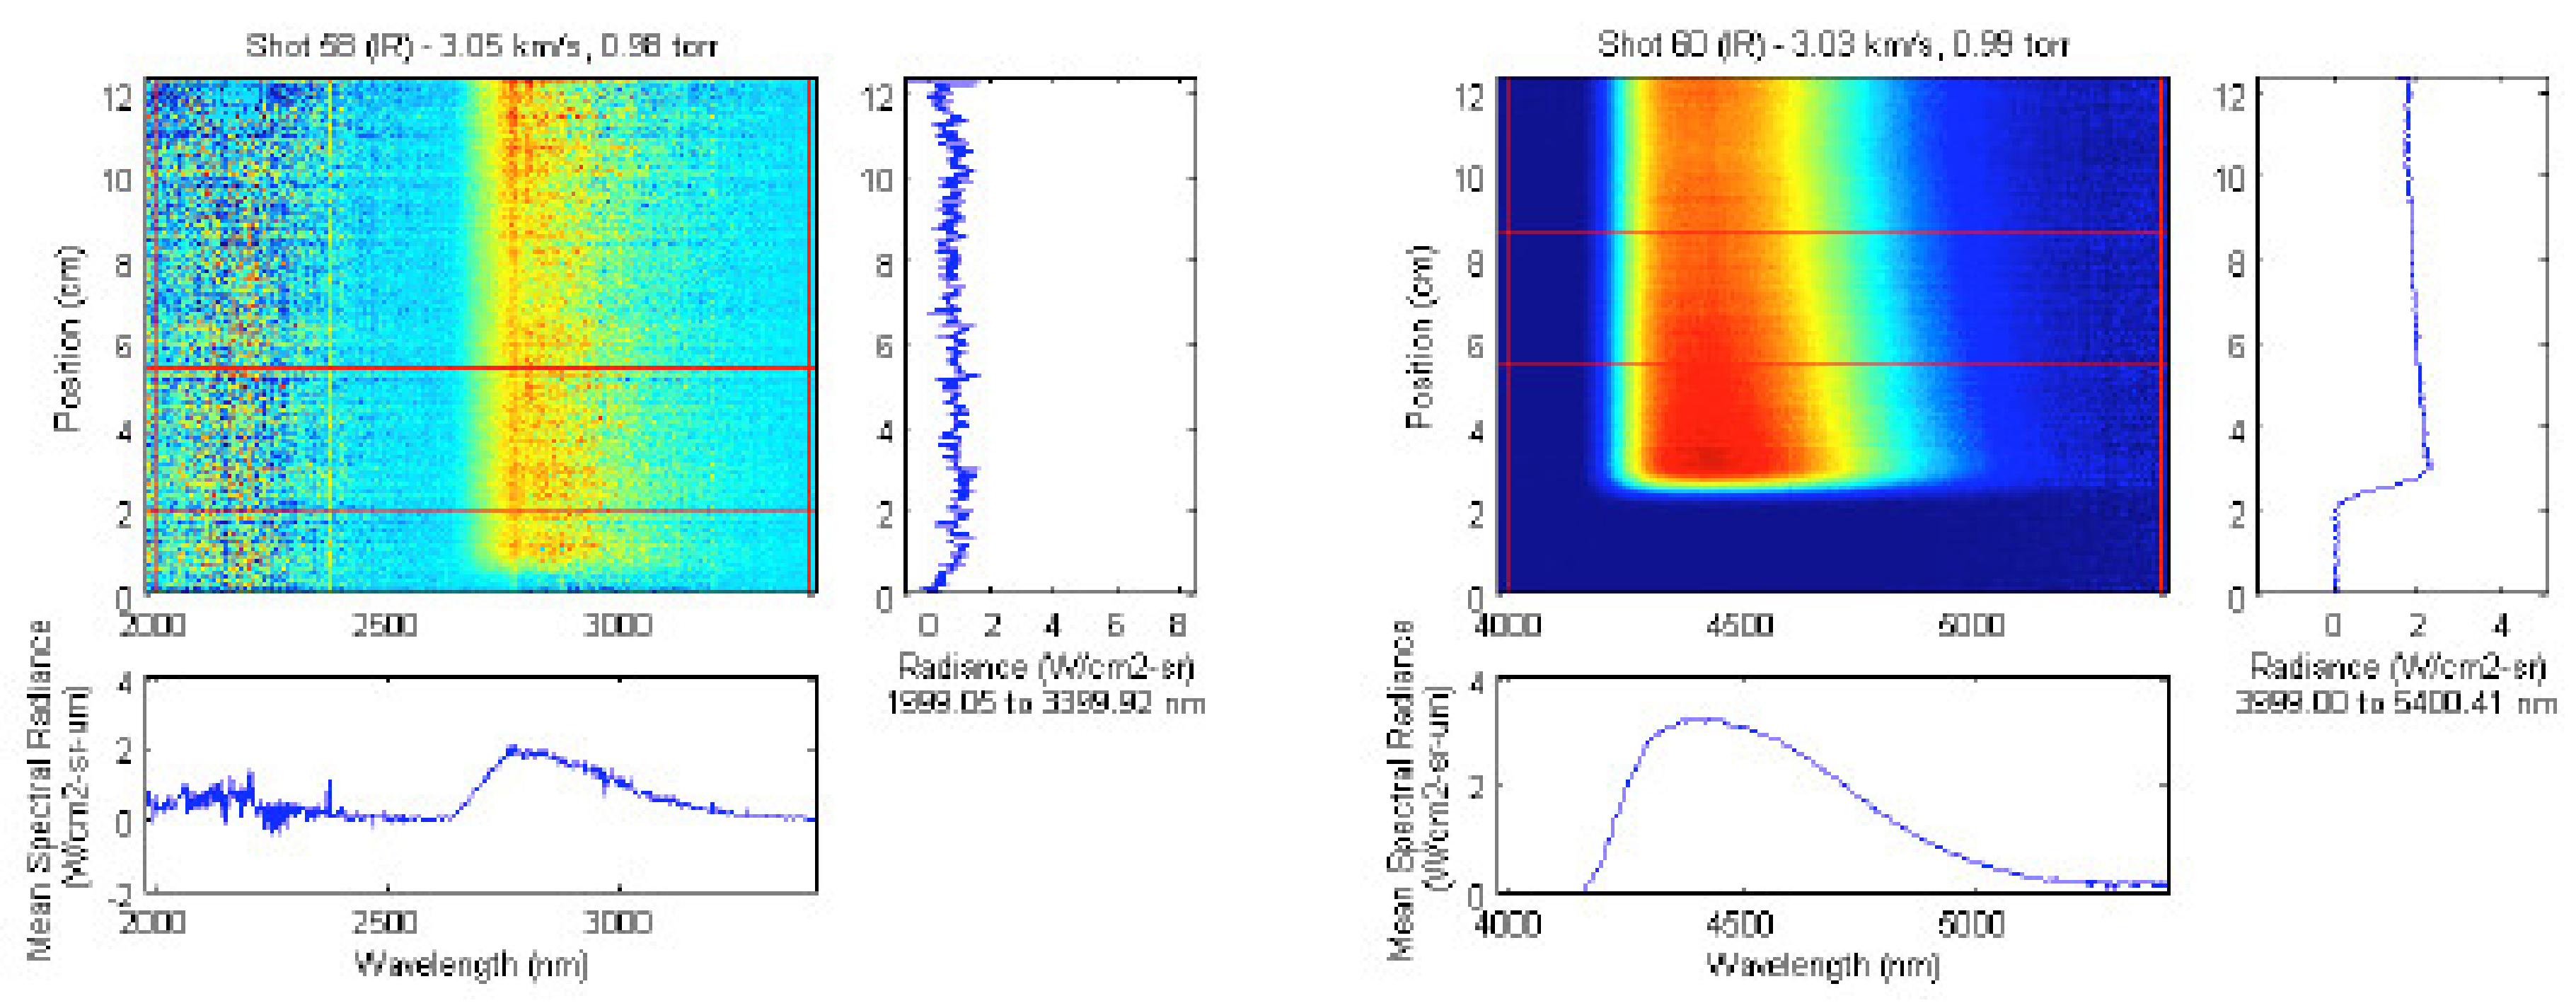
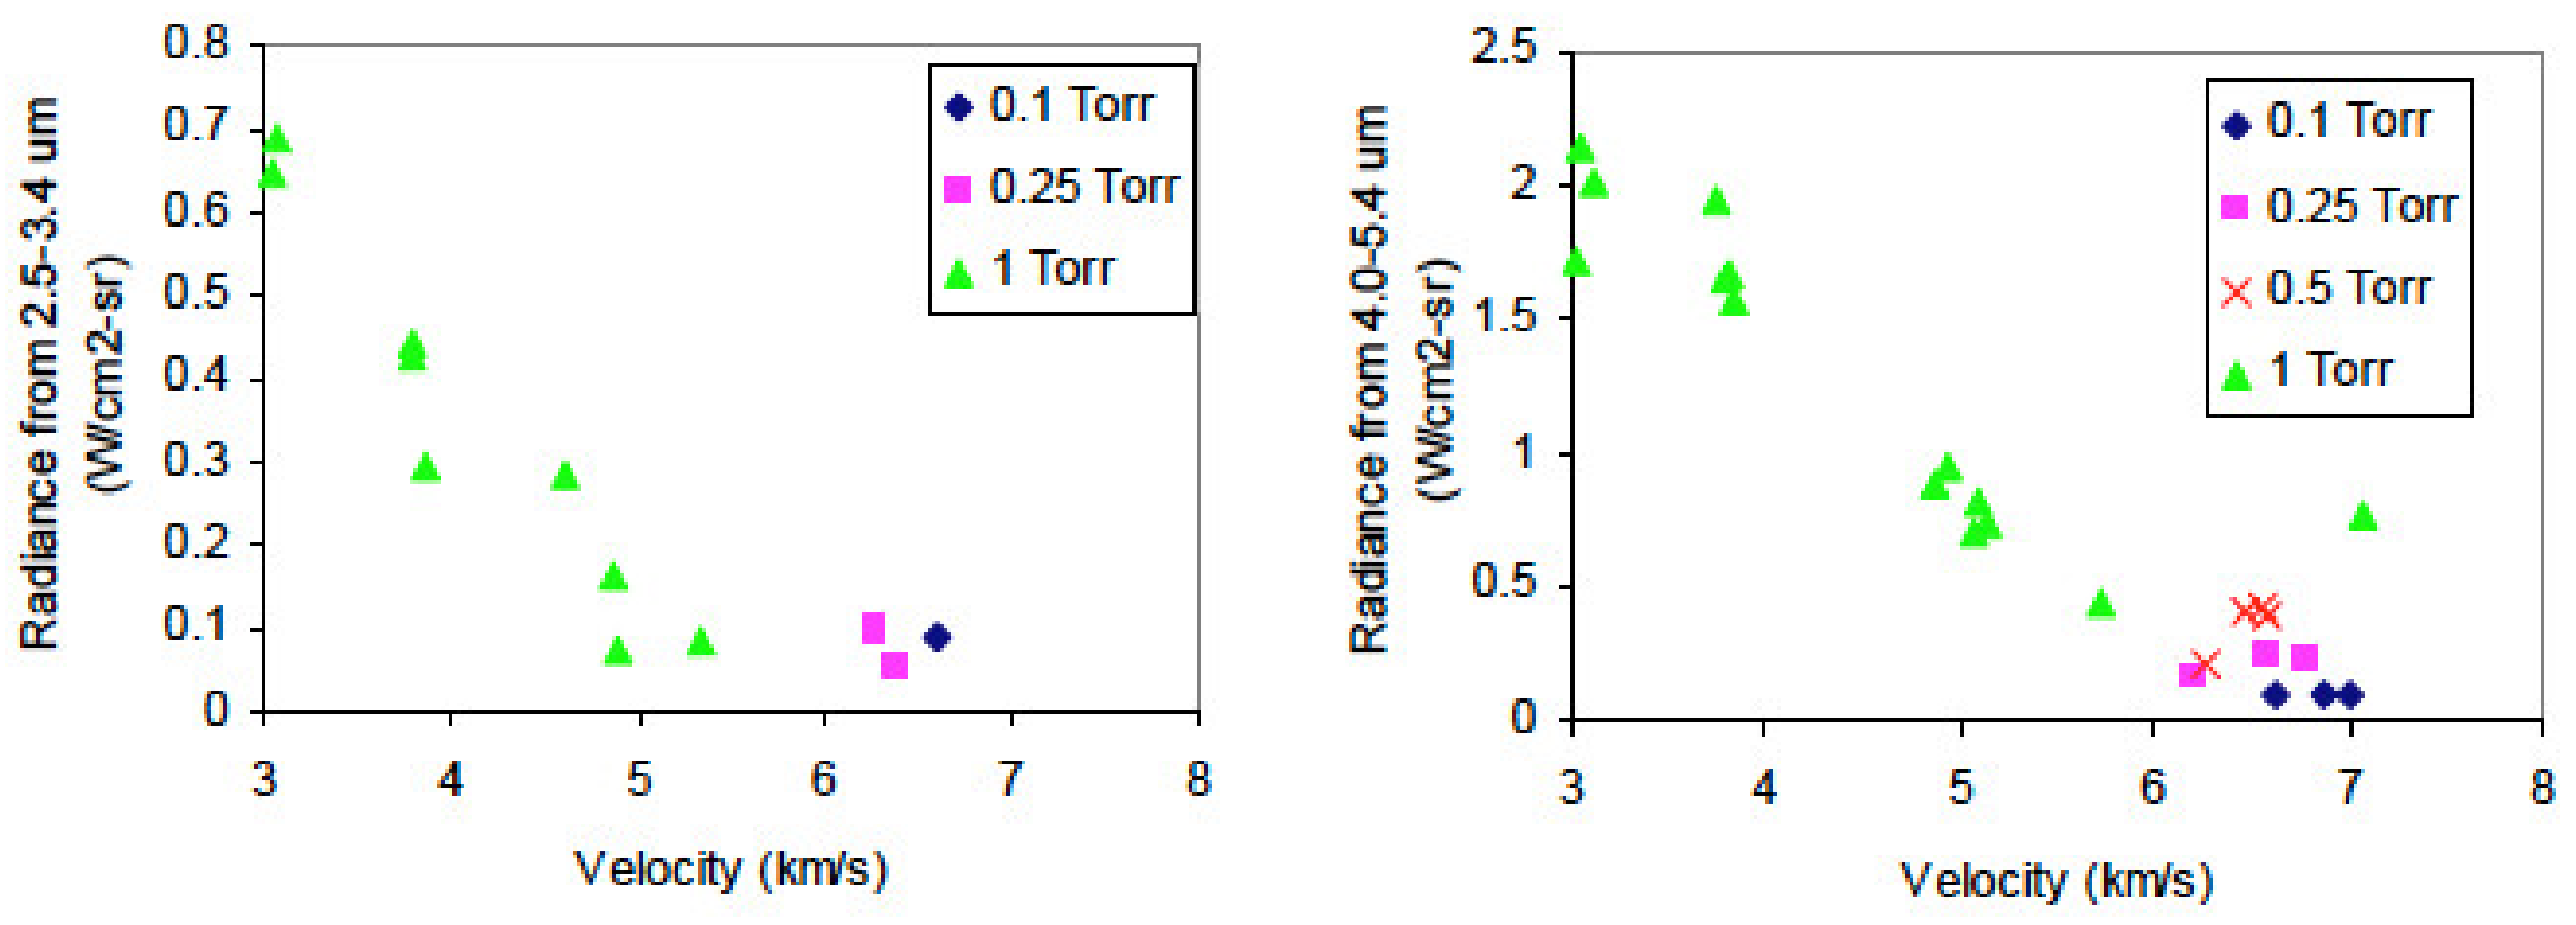
Another recent contribution [29] has been more focused on mid-IR radiation that was investigated in EAST from 3 to 7.5 km/s and pressures from 0.2 to 1 Torr. Infrared radiation was found to be the highest at low velocity (3 km/s) and was decreasing with the velocity; the corresponding test conditions are summarized in Figure 28. Some data obtained for the 2700 nm and 4300 nm bands are reported hereafter. Figure 29 shows the spatial and spectral data at 3 km/s and 1 Torr in pure CO2 for the 2700 and 4300 nm bands. Figure 30 summarized the results obtained for the IR bands in terms of radiation heating as function of the shock velocity.
5.2. JAXA
Several test campaigns with CO2 flows have been carried out in JAXA HVST shock-tube and HVET expansion tube [4]. First efforts [30,31,32] were dedicated to high velocity Mars entry, characteristic of a Mars aerocapture, later on, lower velocities [33] were investigated. First results [30] were obtained for pure CO2 at velocities of 7.1 and 7.3 km/s and pressure of 200 Pa. Radiation measurements were performed from VUV to NIR region, some of the data are plotted in Figure 31. In the same study, the C2 Swan band was also investigated, and obtained data shown apparently an equilibrium state. In NIR region, atomic lines for carbon and oxygen were observed (see Figure 31).
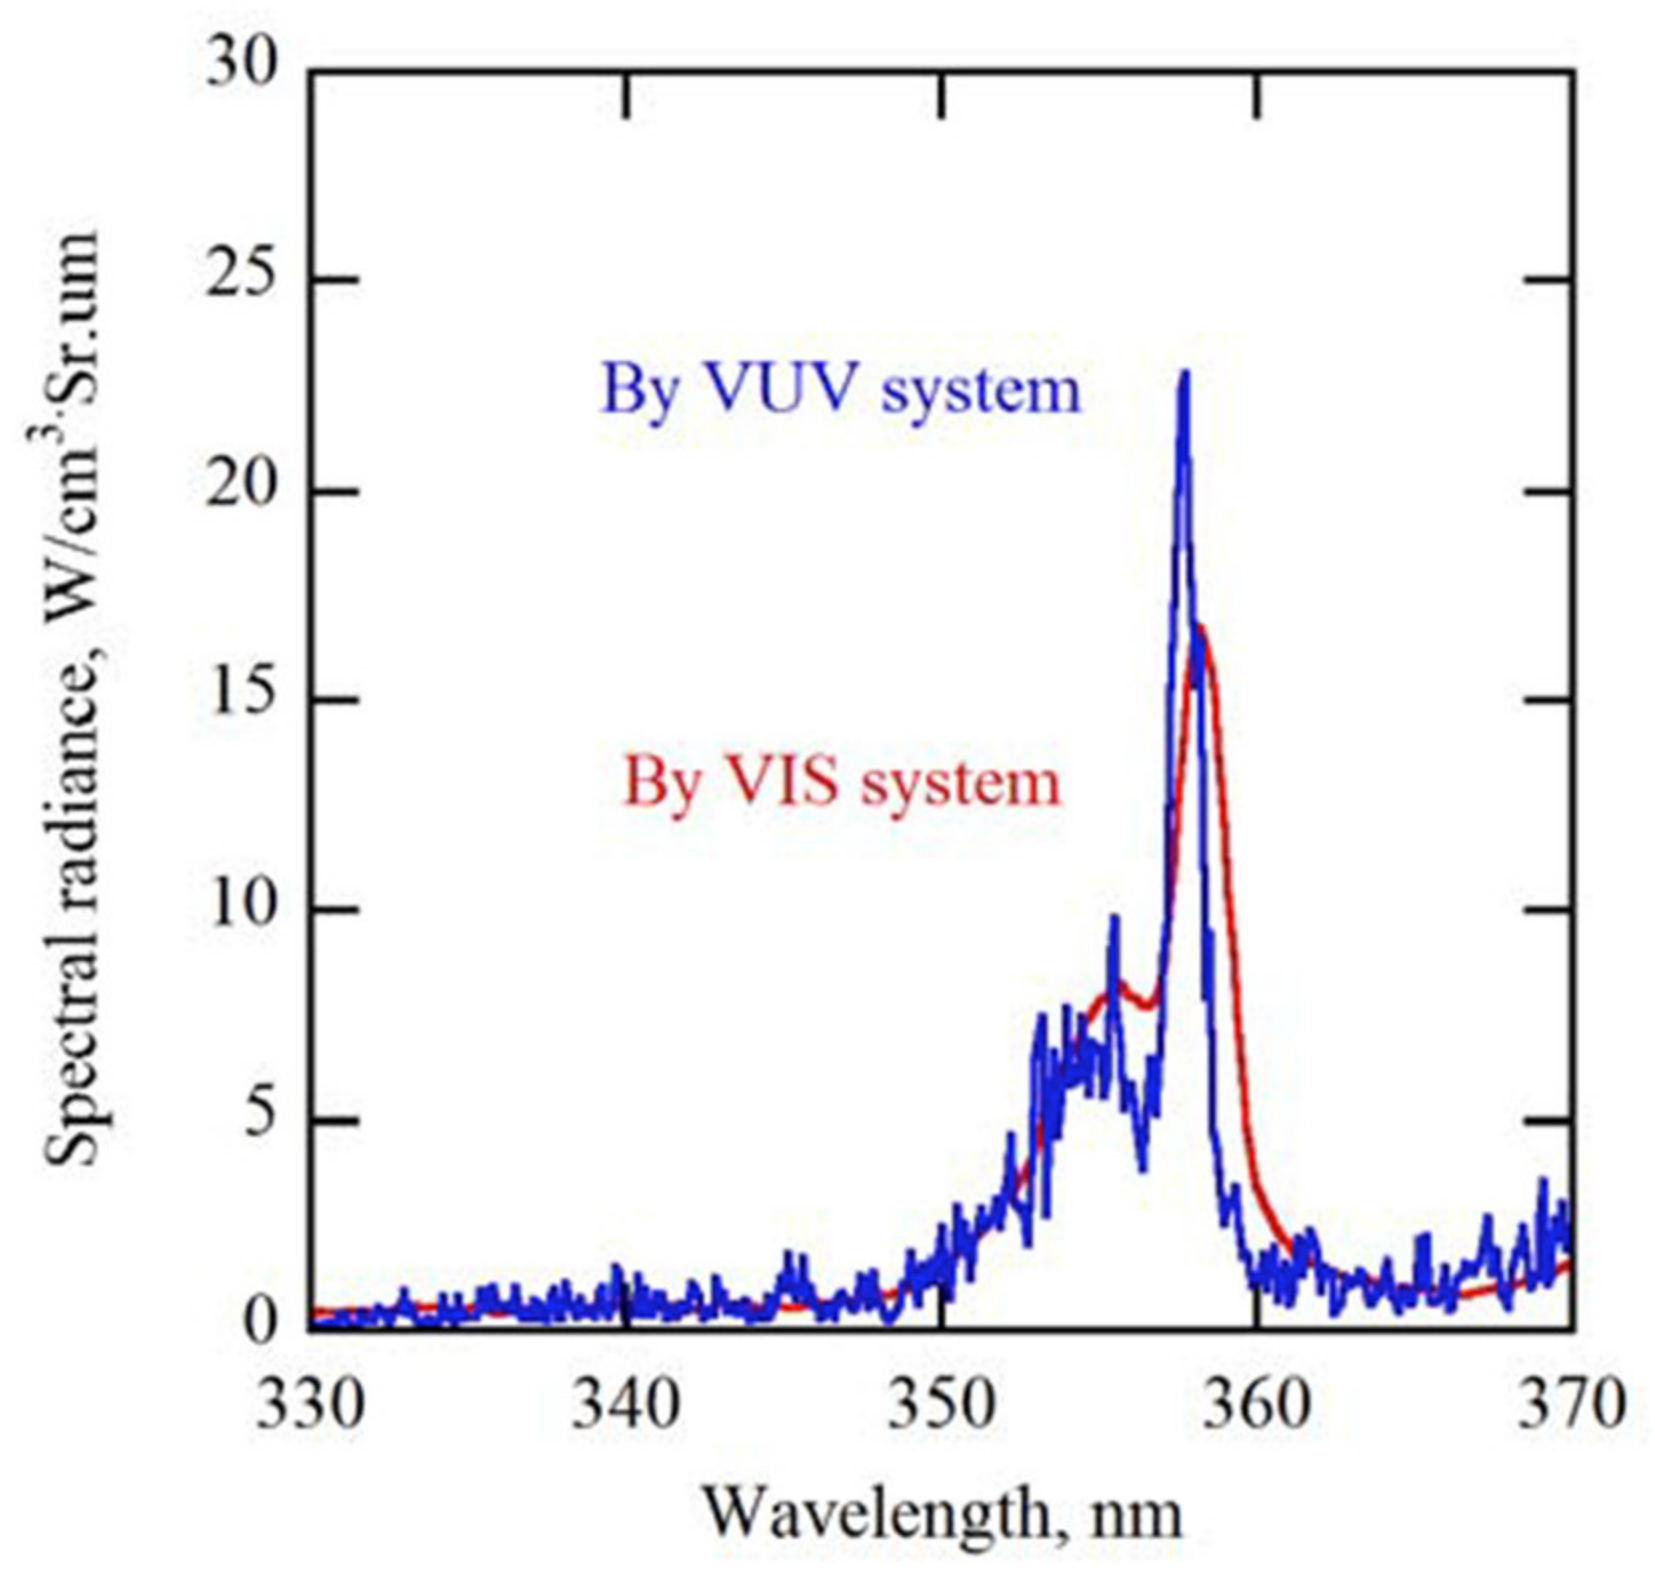
Mars atmosphere with 96% of CO2 and 4% of N2 for high velocities was studied in [31]. Tests were performed at 7 km/s and 8.5 km/s for pressures of 1 and 0.1 Torr respectively. Radiation measurements were carried out from VUV to NIR focusing on CO(4+), CN Violet, and C2 Swan systems using two spectrometers. Results obtained using the different measurement systems have been compared; corresponding results for CN violet are shown in Figure 32.
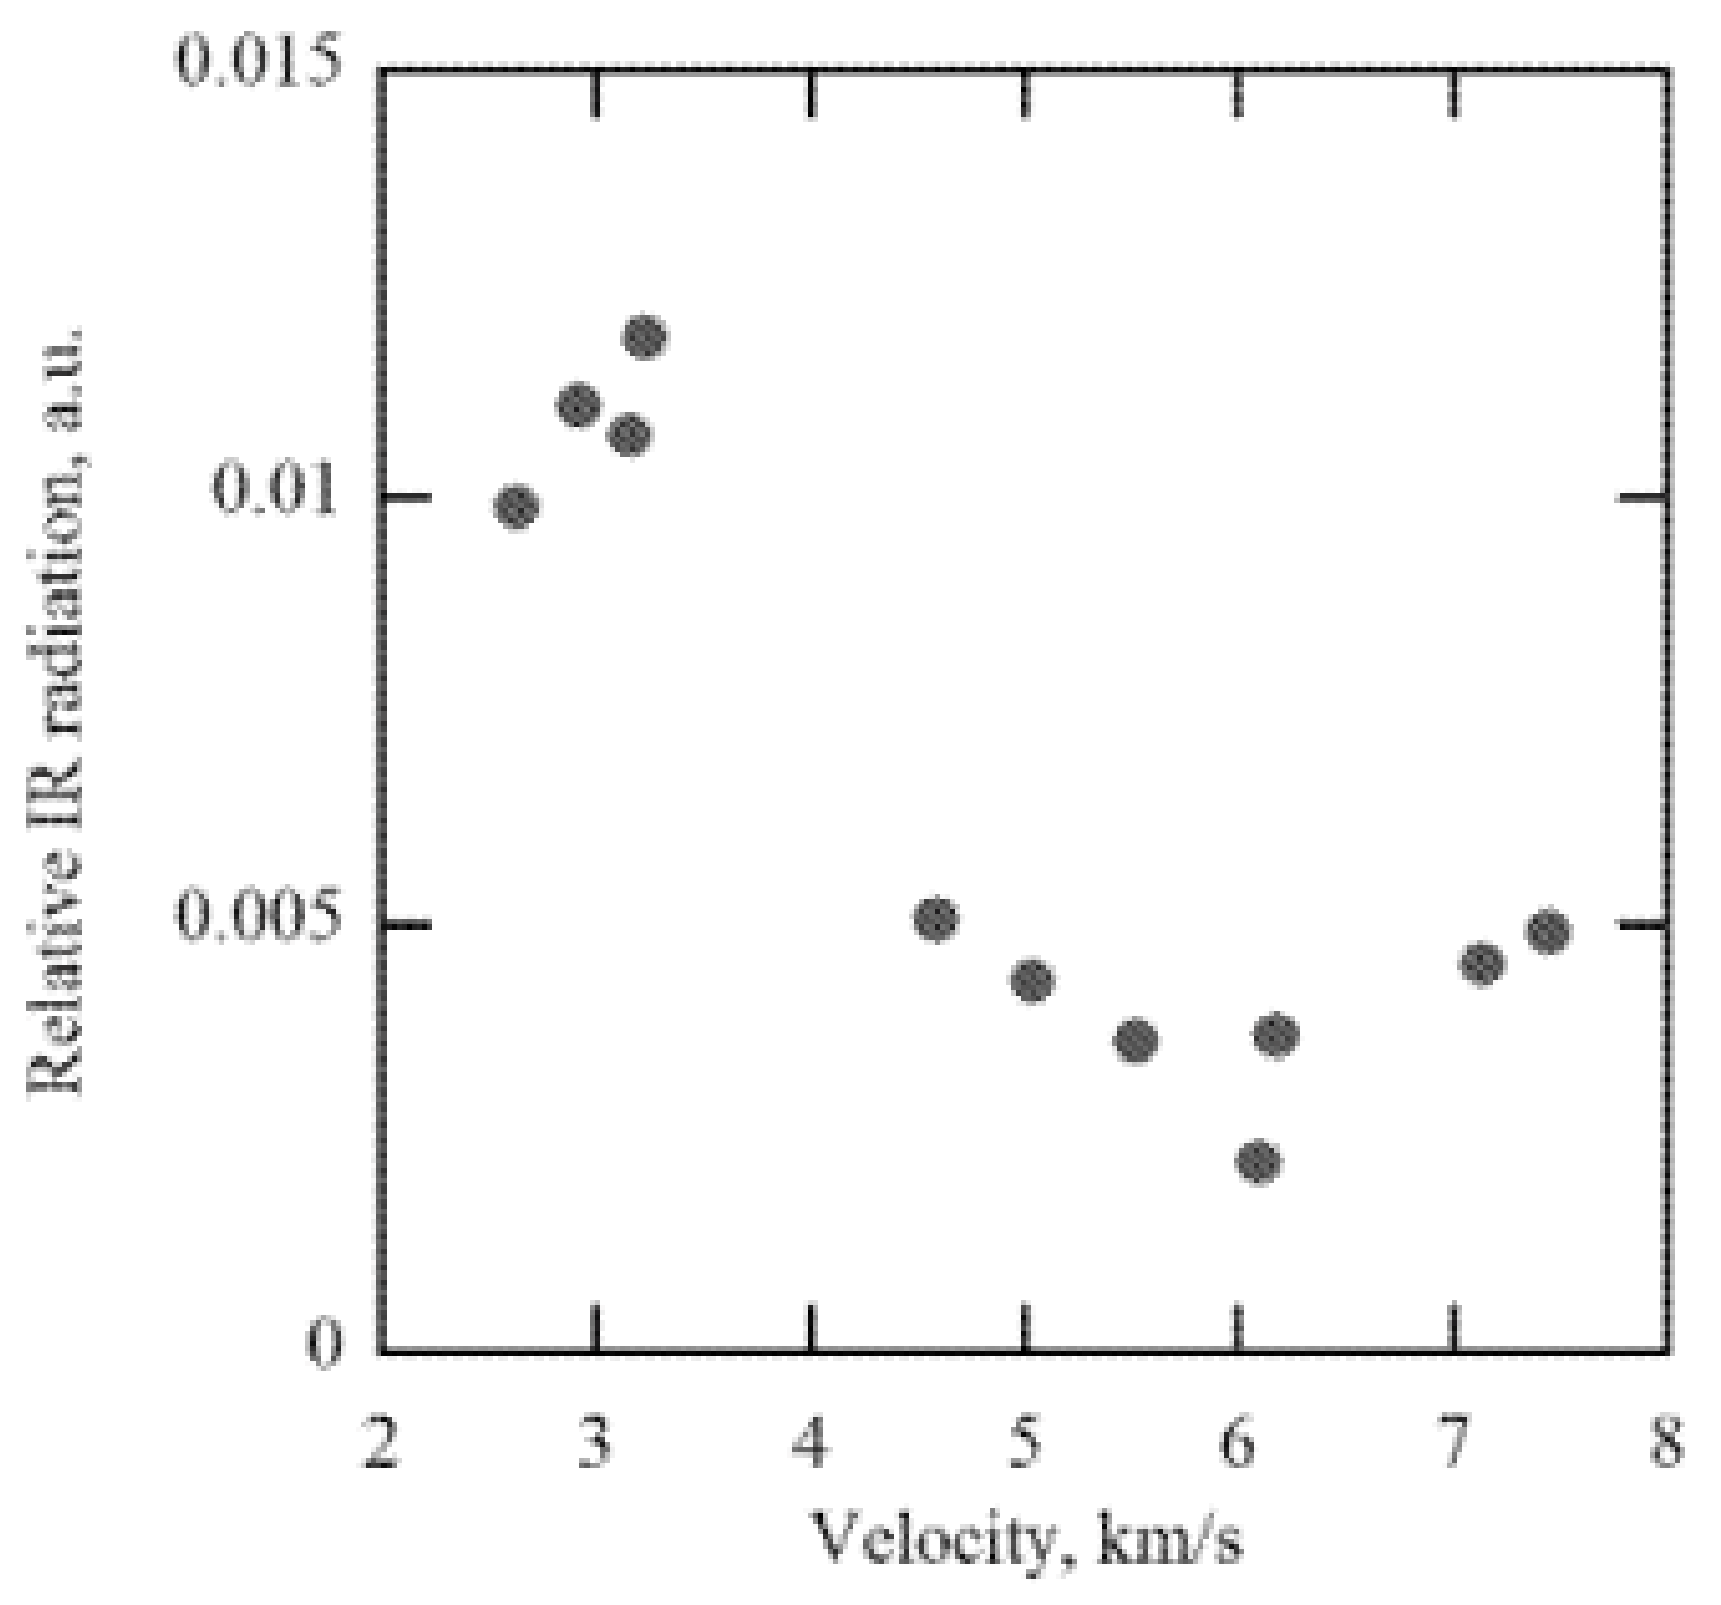
Infrared radiation has been extensively investigated in [32] in which experiments were conducted from 2.5 to 7.5 km/s and a pressure of 1 Torr. Measurements were focused on radiation intensity, this last was found to be high at low velocity and to decrease up to 6 km/s, after this minimum, radiation intensity was increasing with the velocity; this is summarized in Figure 33.
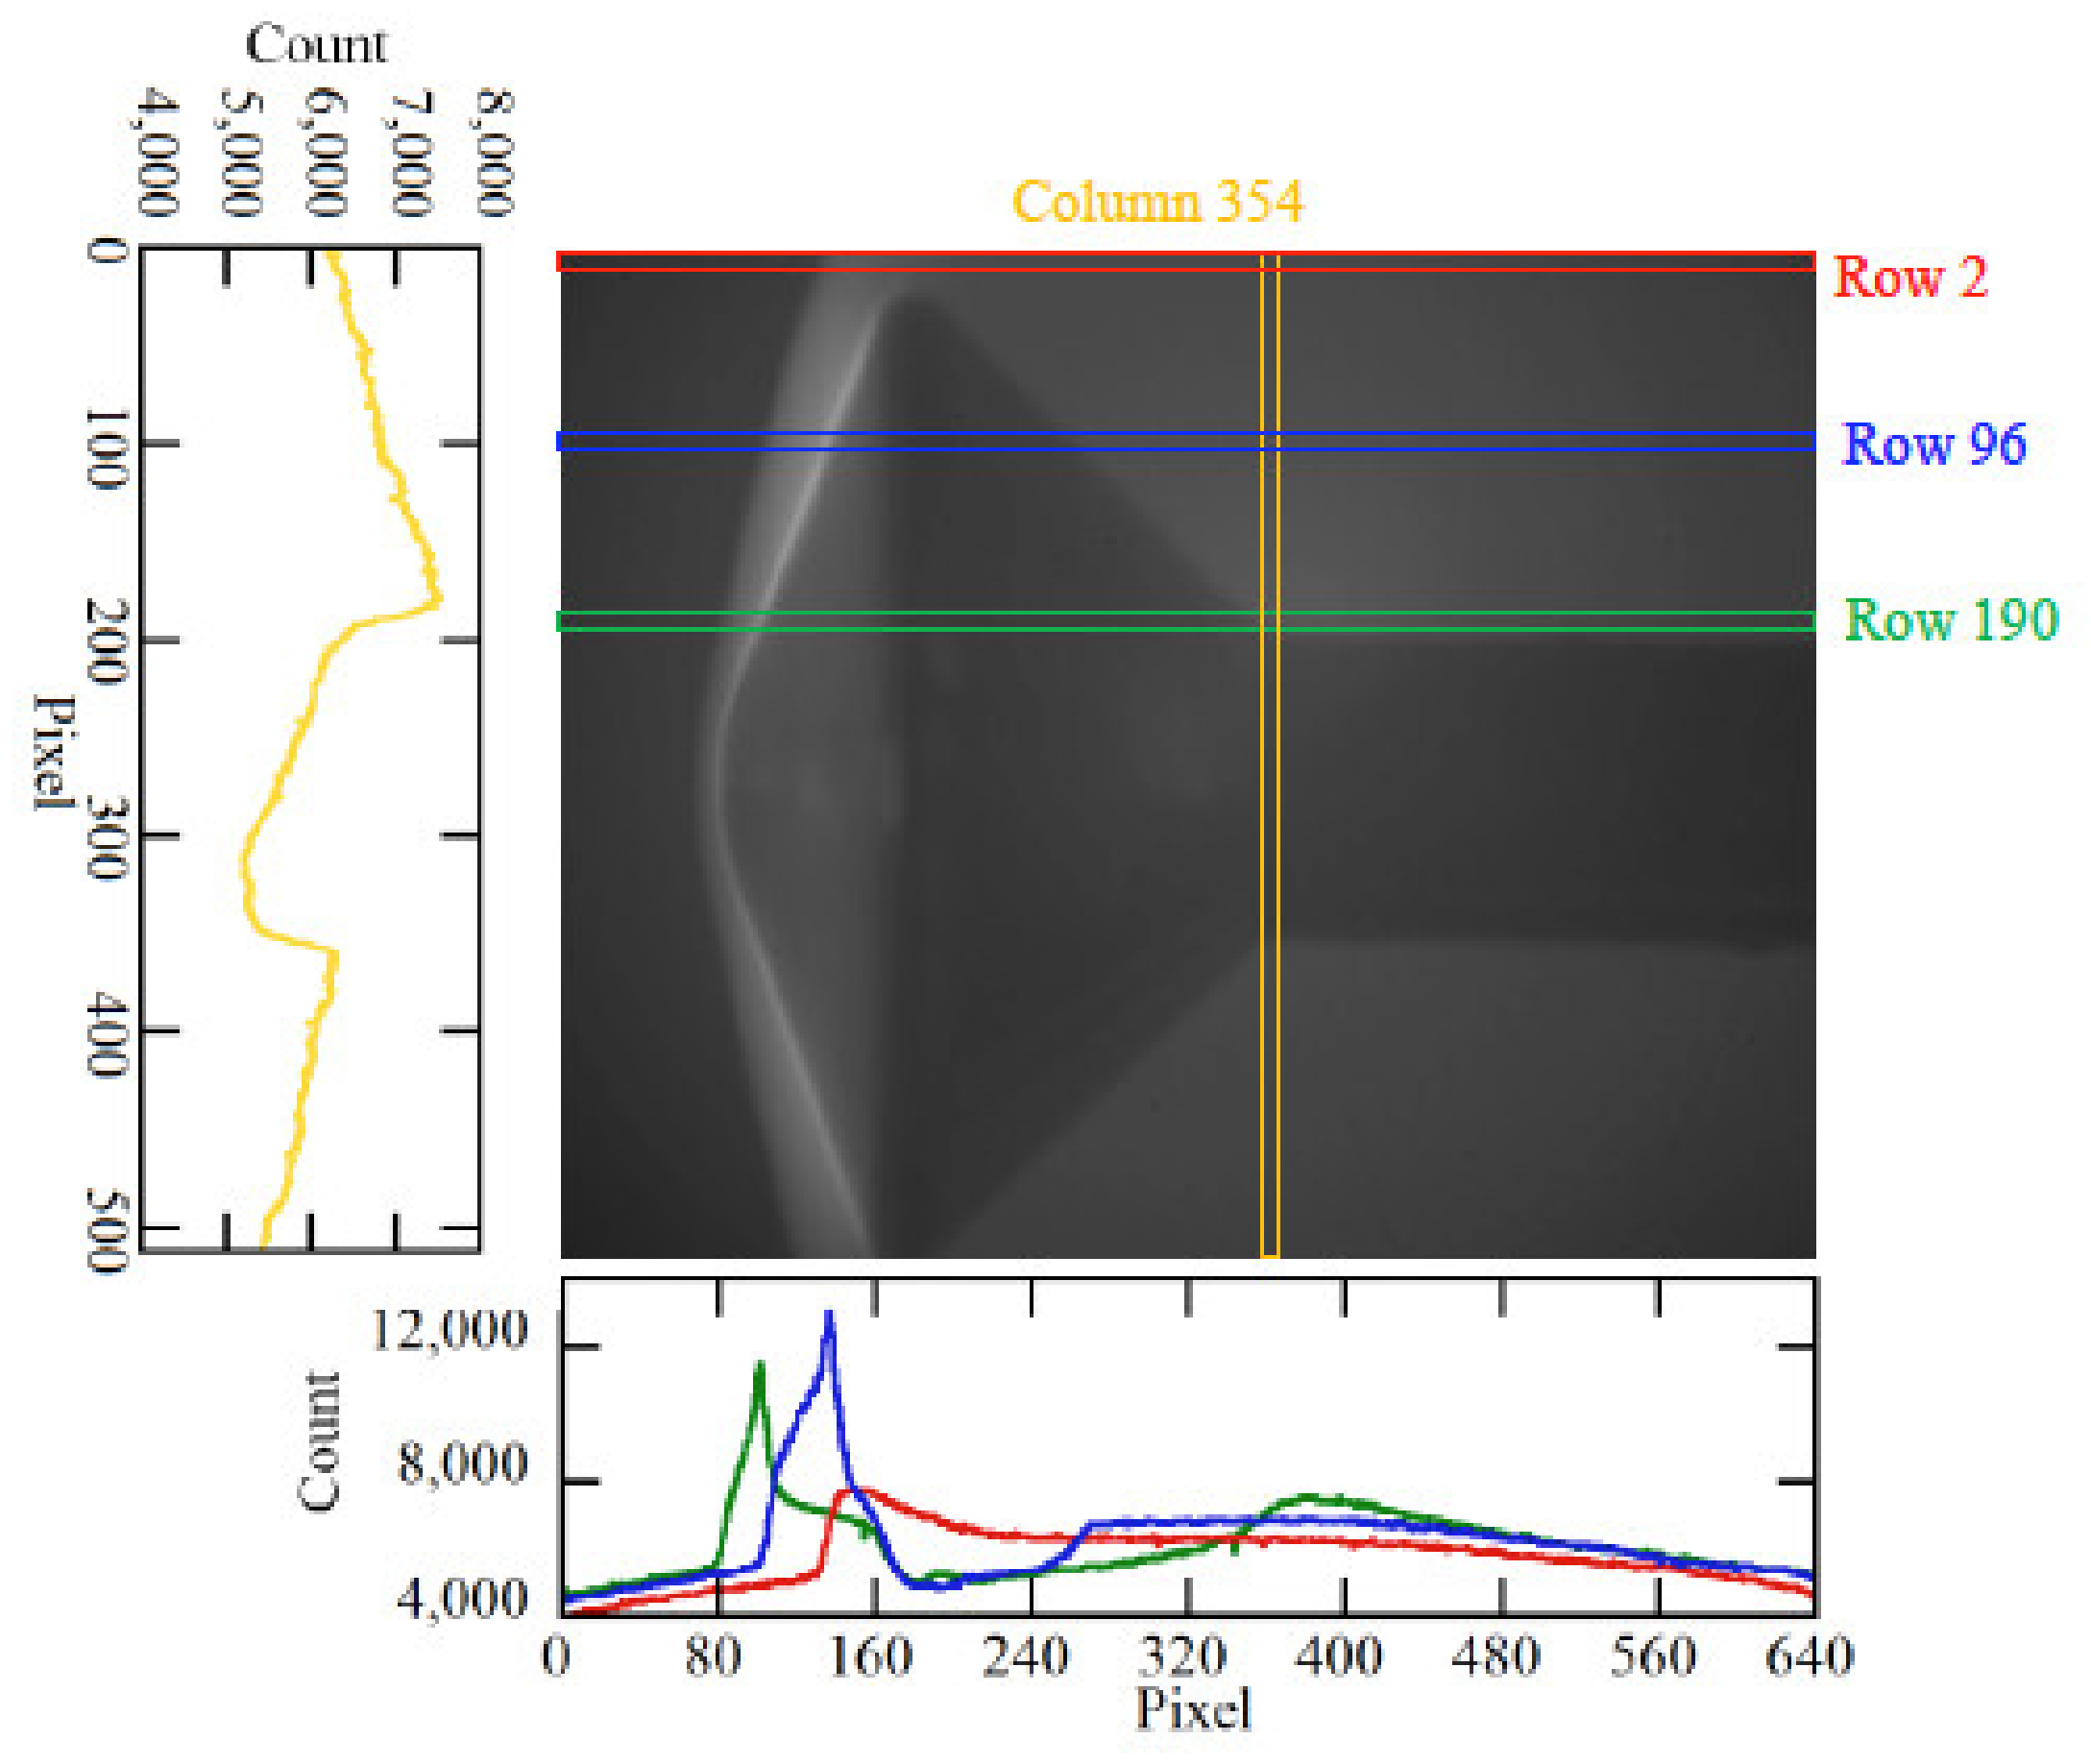
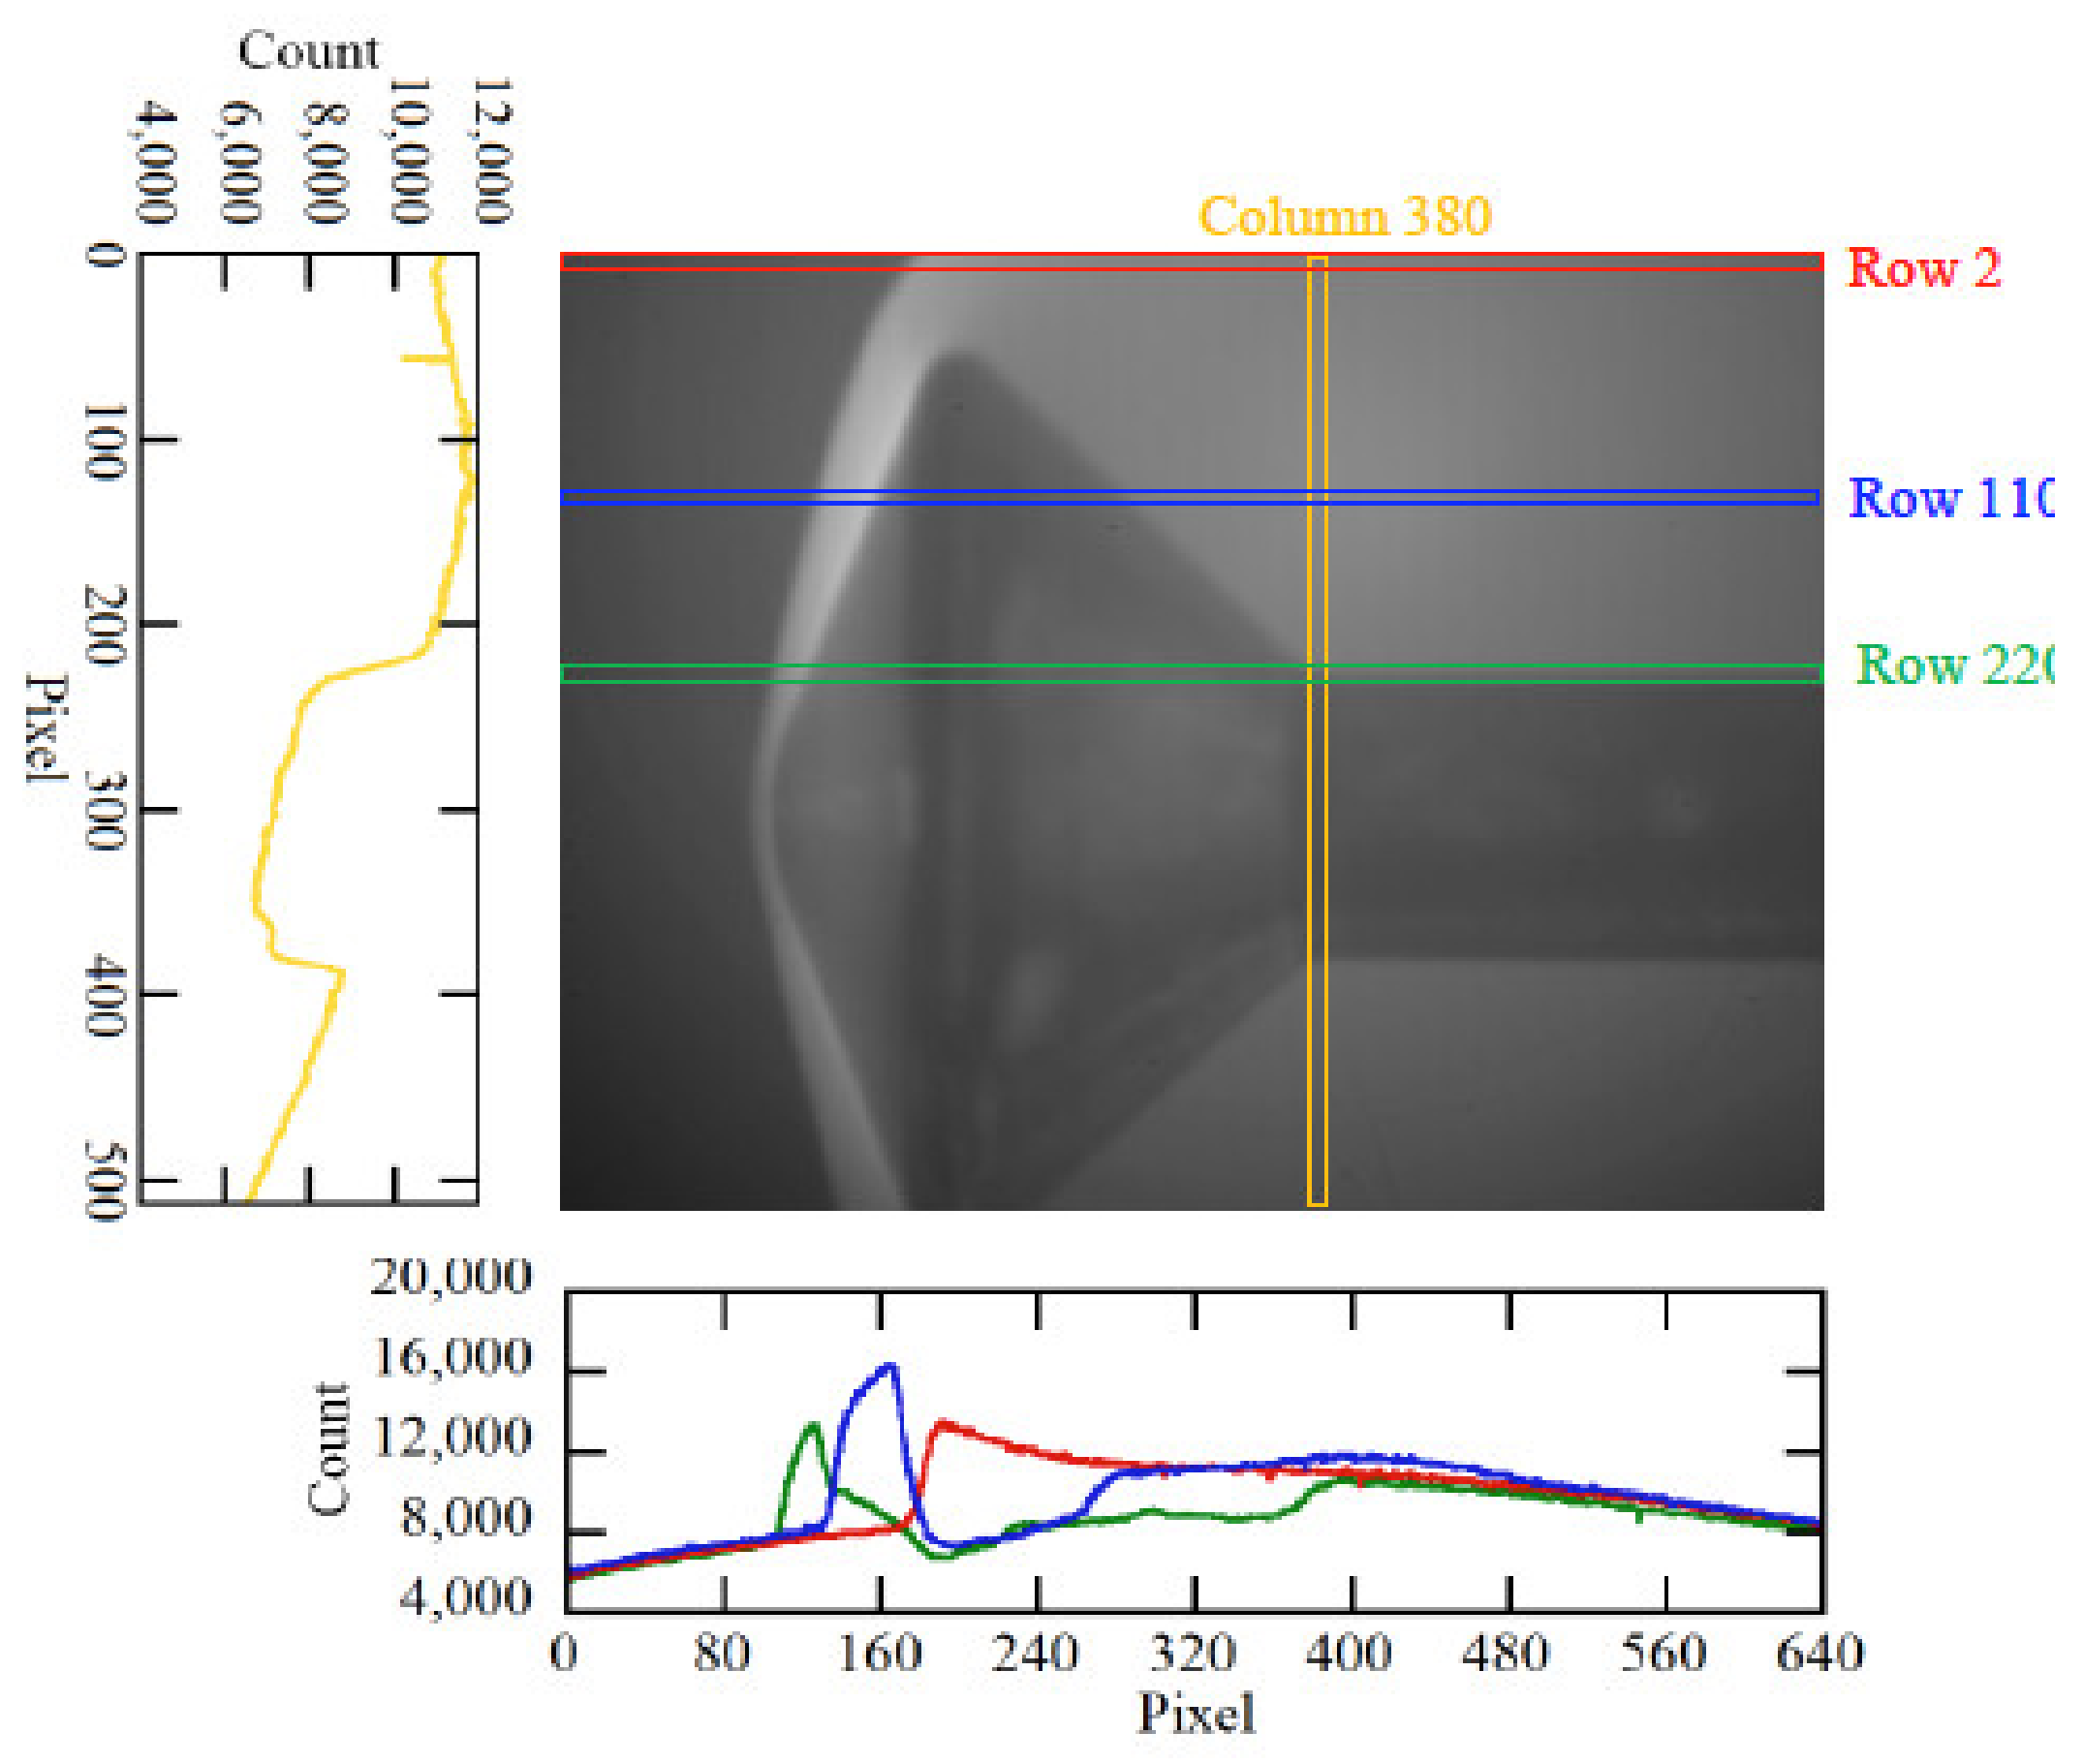
The most recent test campaign [33] carried out by JAXA for CO2 radiation has been performed in the HVET expansion tube. Tests were carried out for pure CO2 at velocities of 7.6 and 5.5 km/s, and pressures of 0.075 and 0.15 Torr (10 and 20 Pa) respectively. A blunt body model was inserted within the flow during the experiments. Spatial distribution of VIS and IR radiation was studied using high-speed imaging systems; corresponding results are shown in Figure 34 and Figure 35. IR radiation spectra were also obtained with and without the model, however, according to the authors [30], effects of chemical freezing in the expansion tube require a more comprehensive investigation for a more refined assessment of the results.
5.3. X2
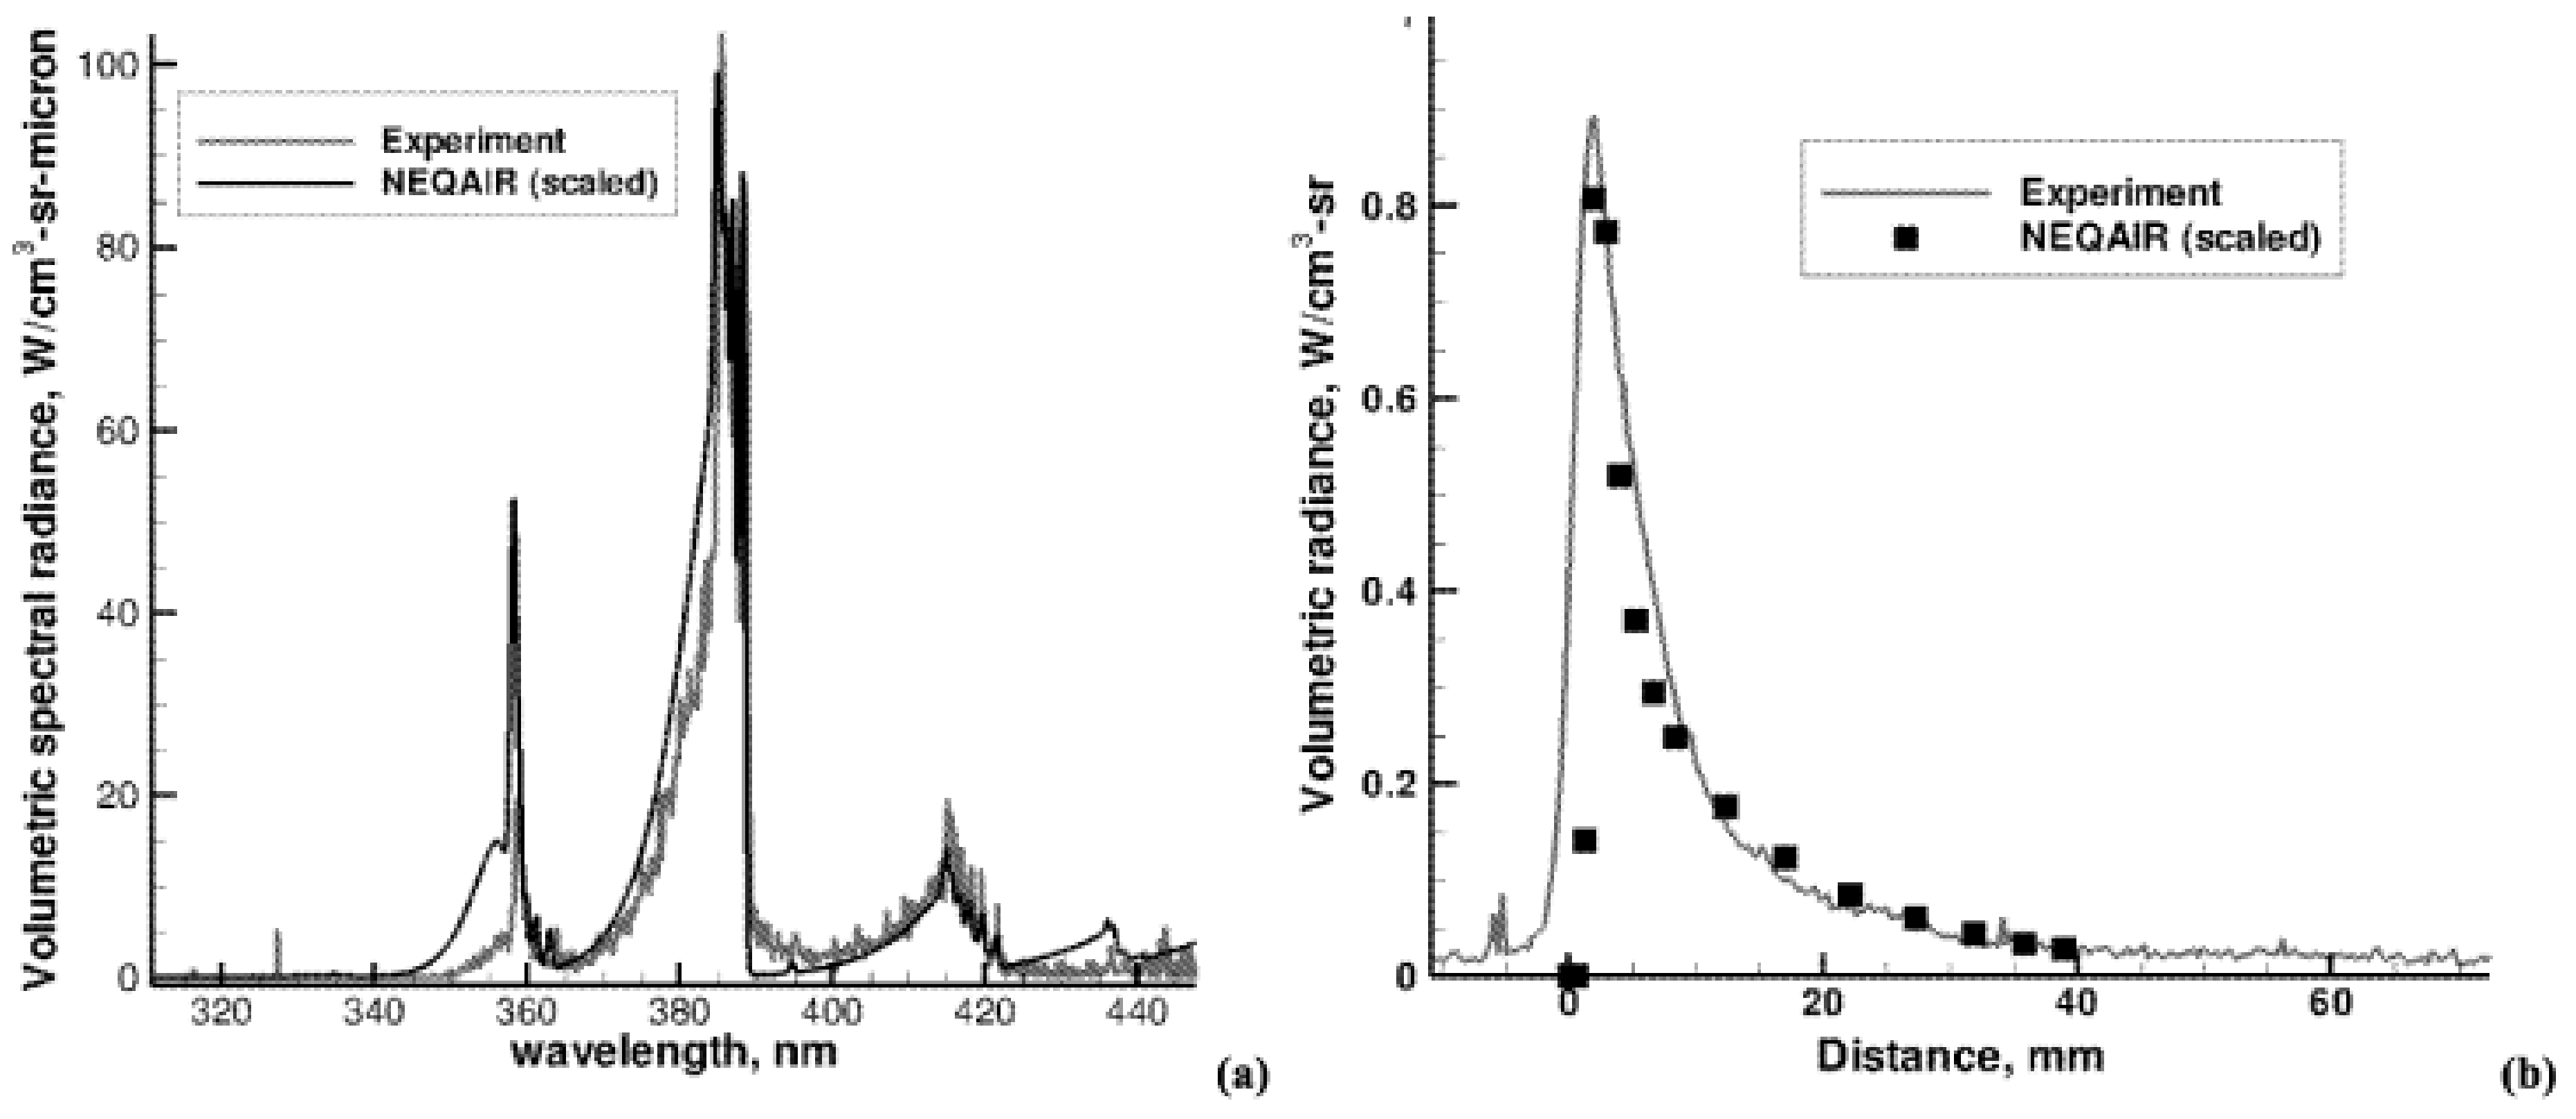
Different test campaigns [34,35,36,37] have been carried out at the University of Queensland, in the X2 expansion tube, dedicated to radiation measurements into Mars mixture atmosphere. In [34,35] tests have been performed for a Mars atmosphere (96% CO2, 4% N2), at a shock speed of 8.6 km/s, and a free stream pressure of 0.1 Torr. Test data have been numerically reconstructed using NEQAIR and comparisons between numerical predictions and experimental data can be seen in Figure 36. Radiation measurements were focused on CN violet band system.
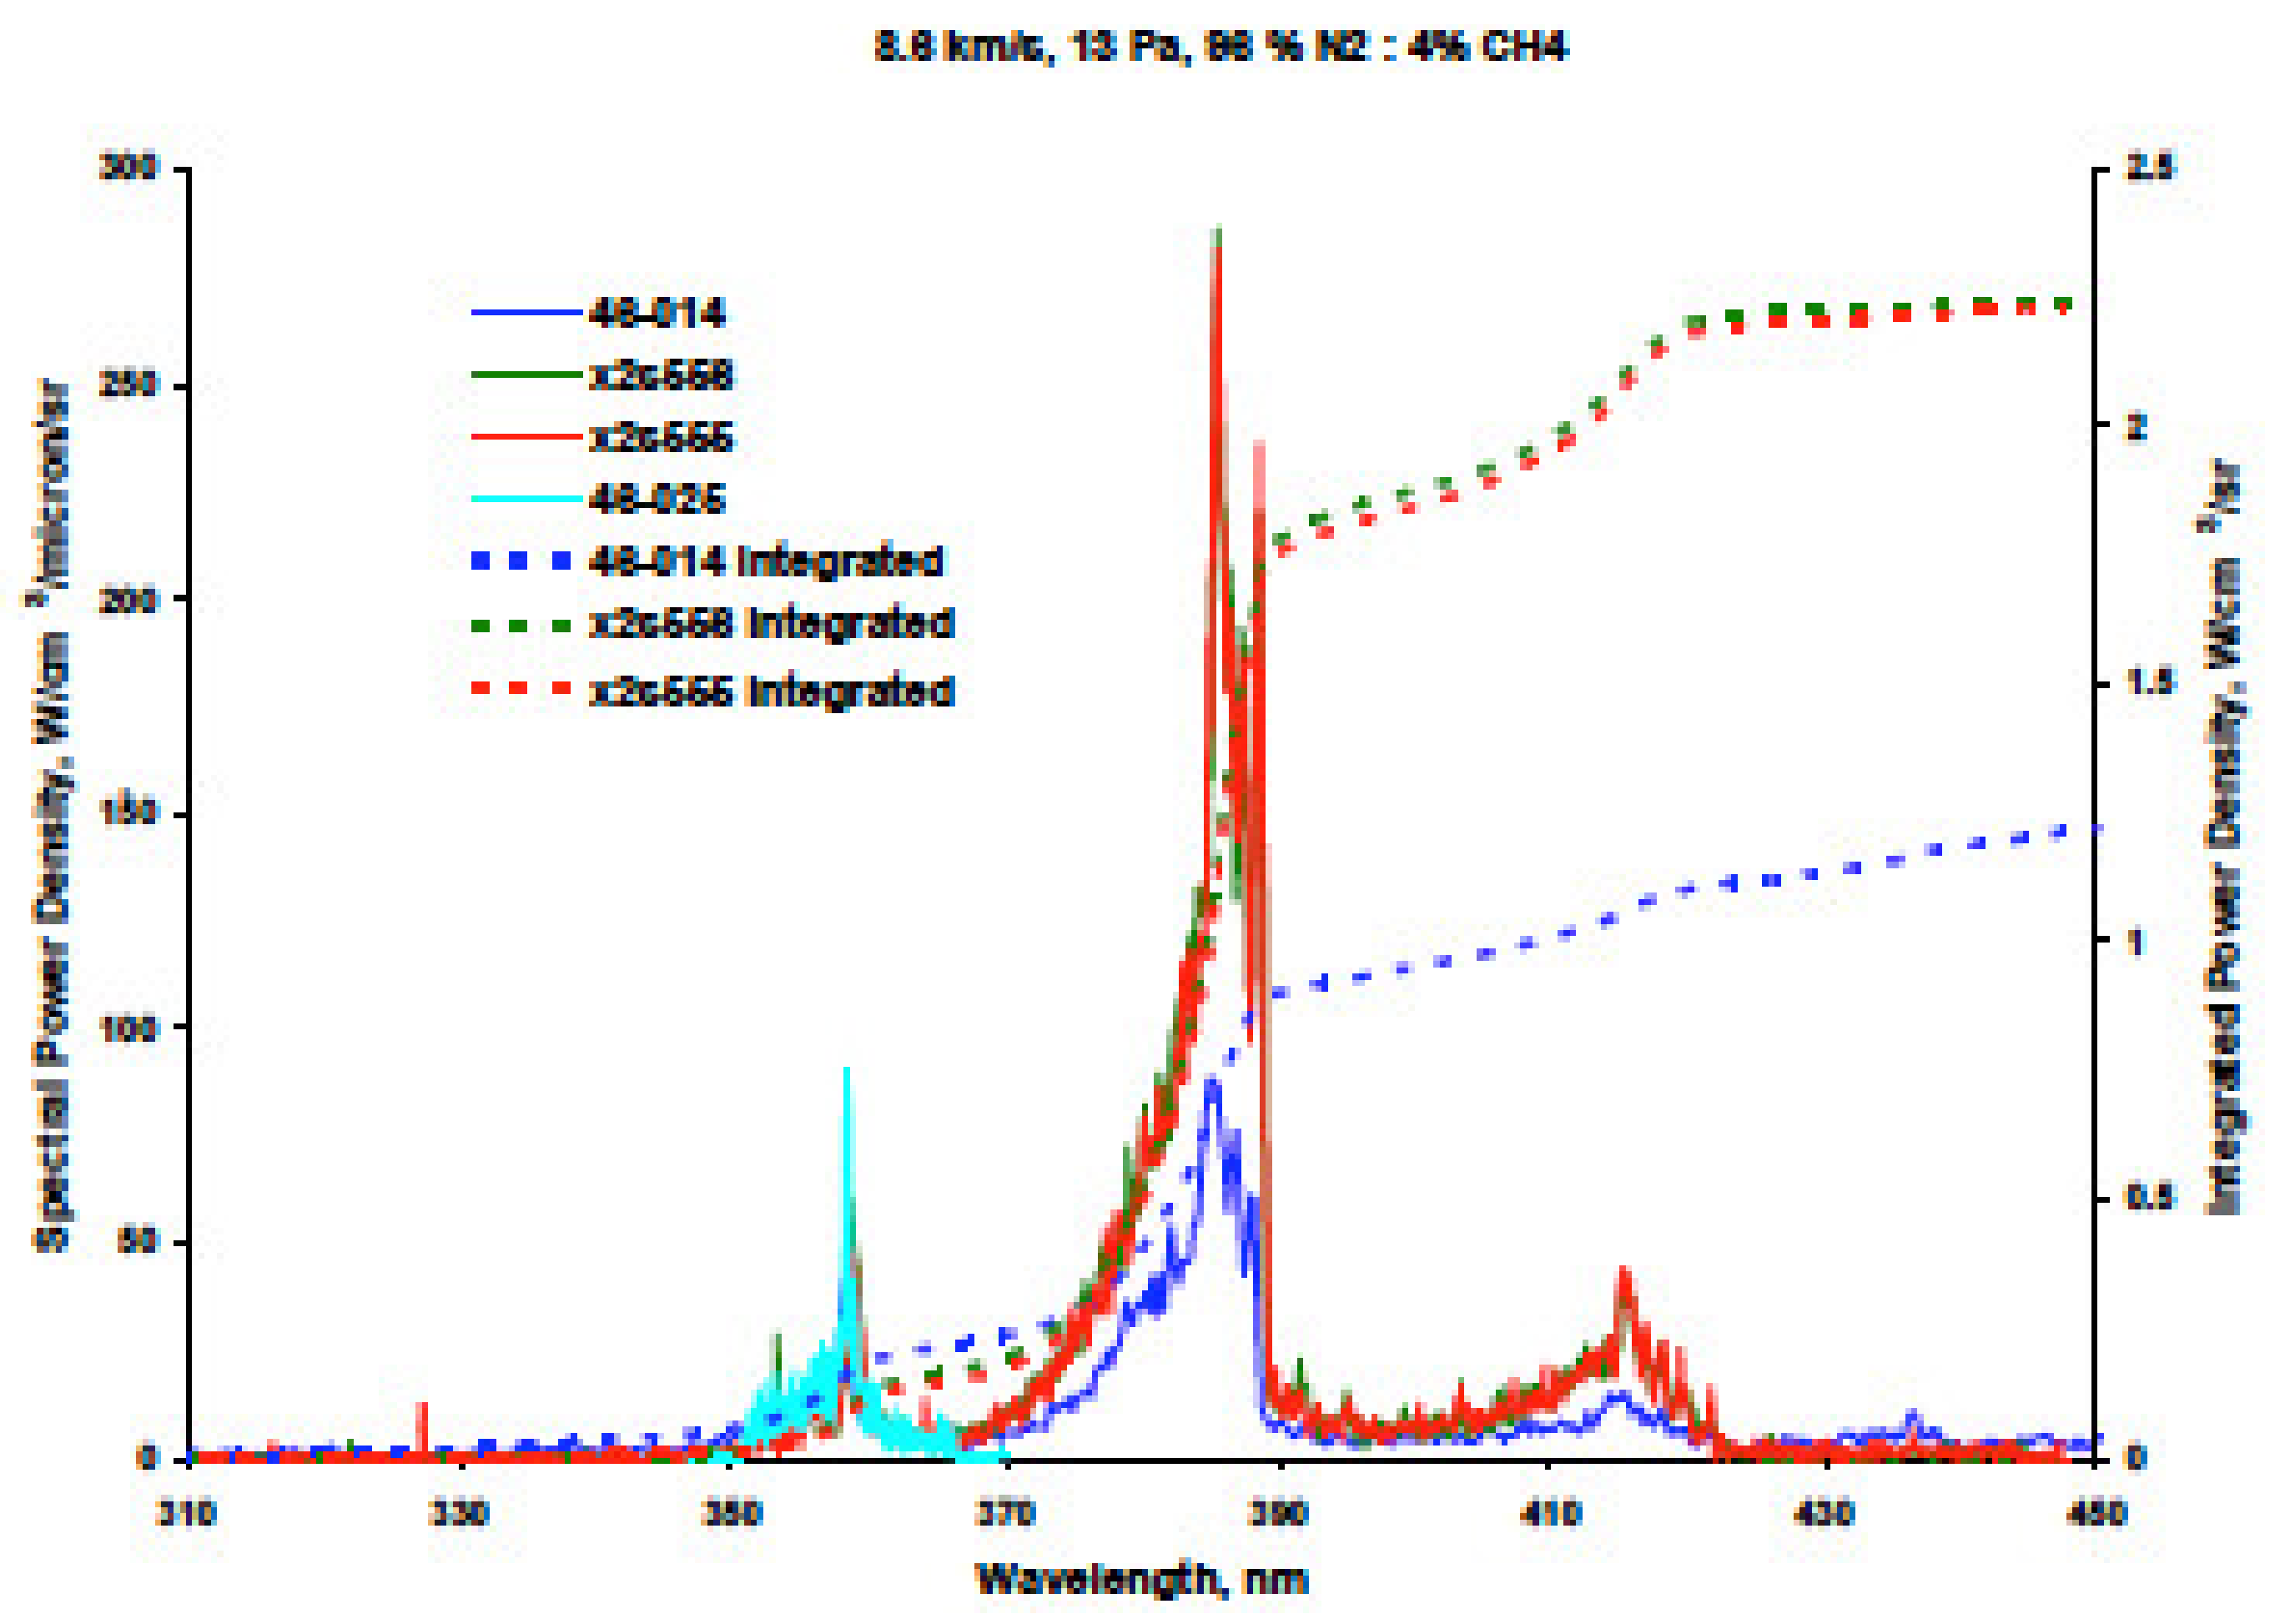
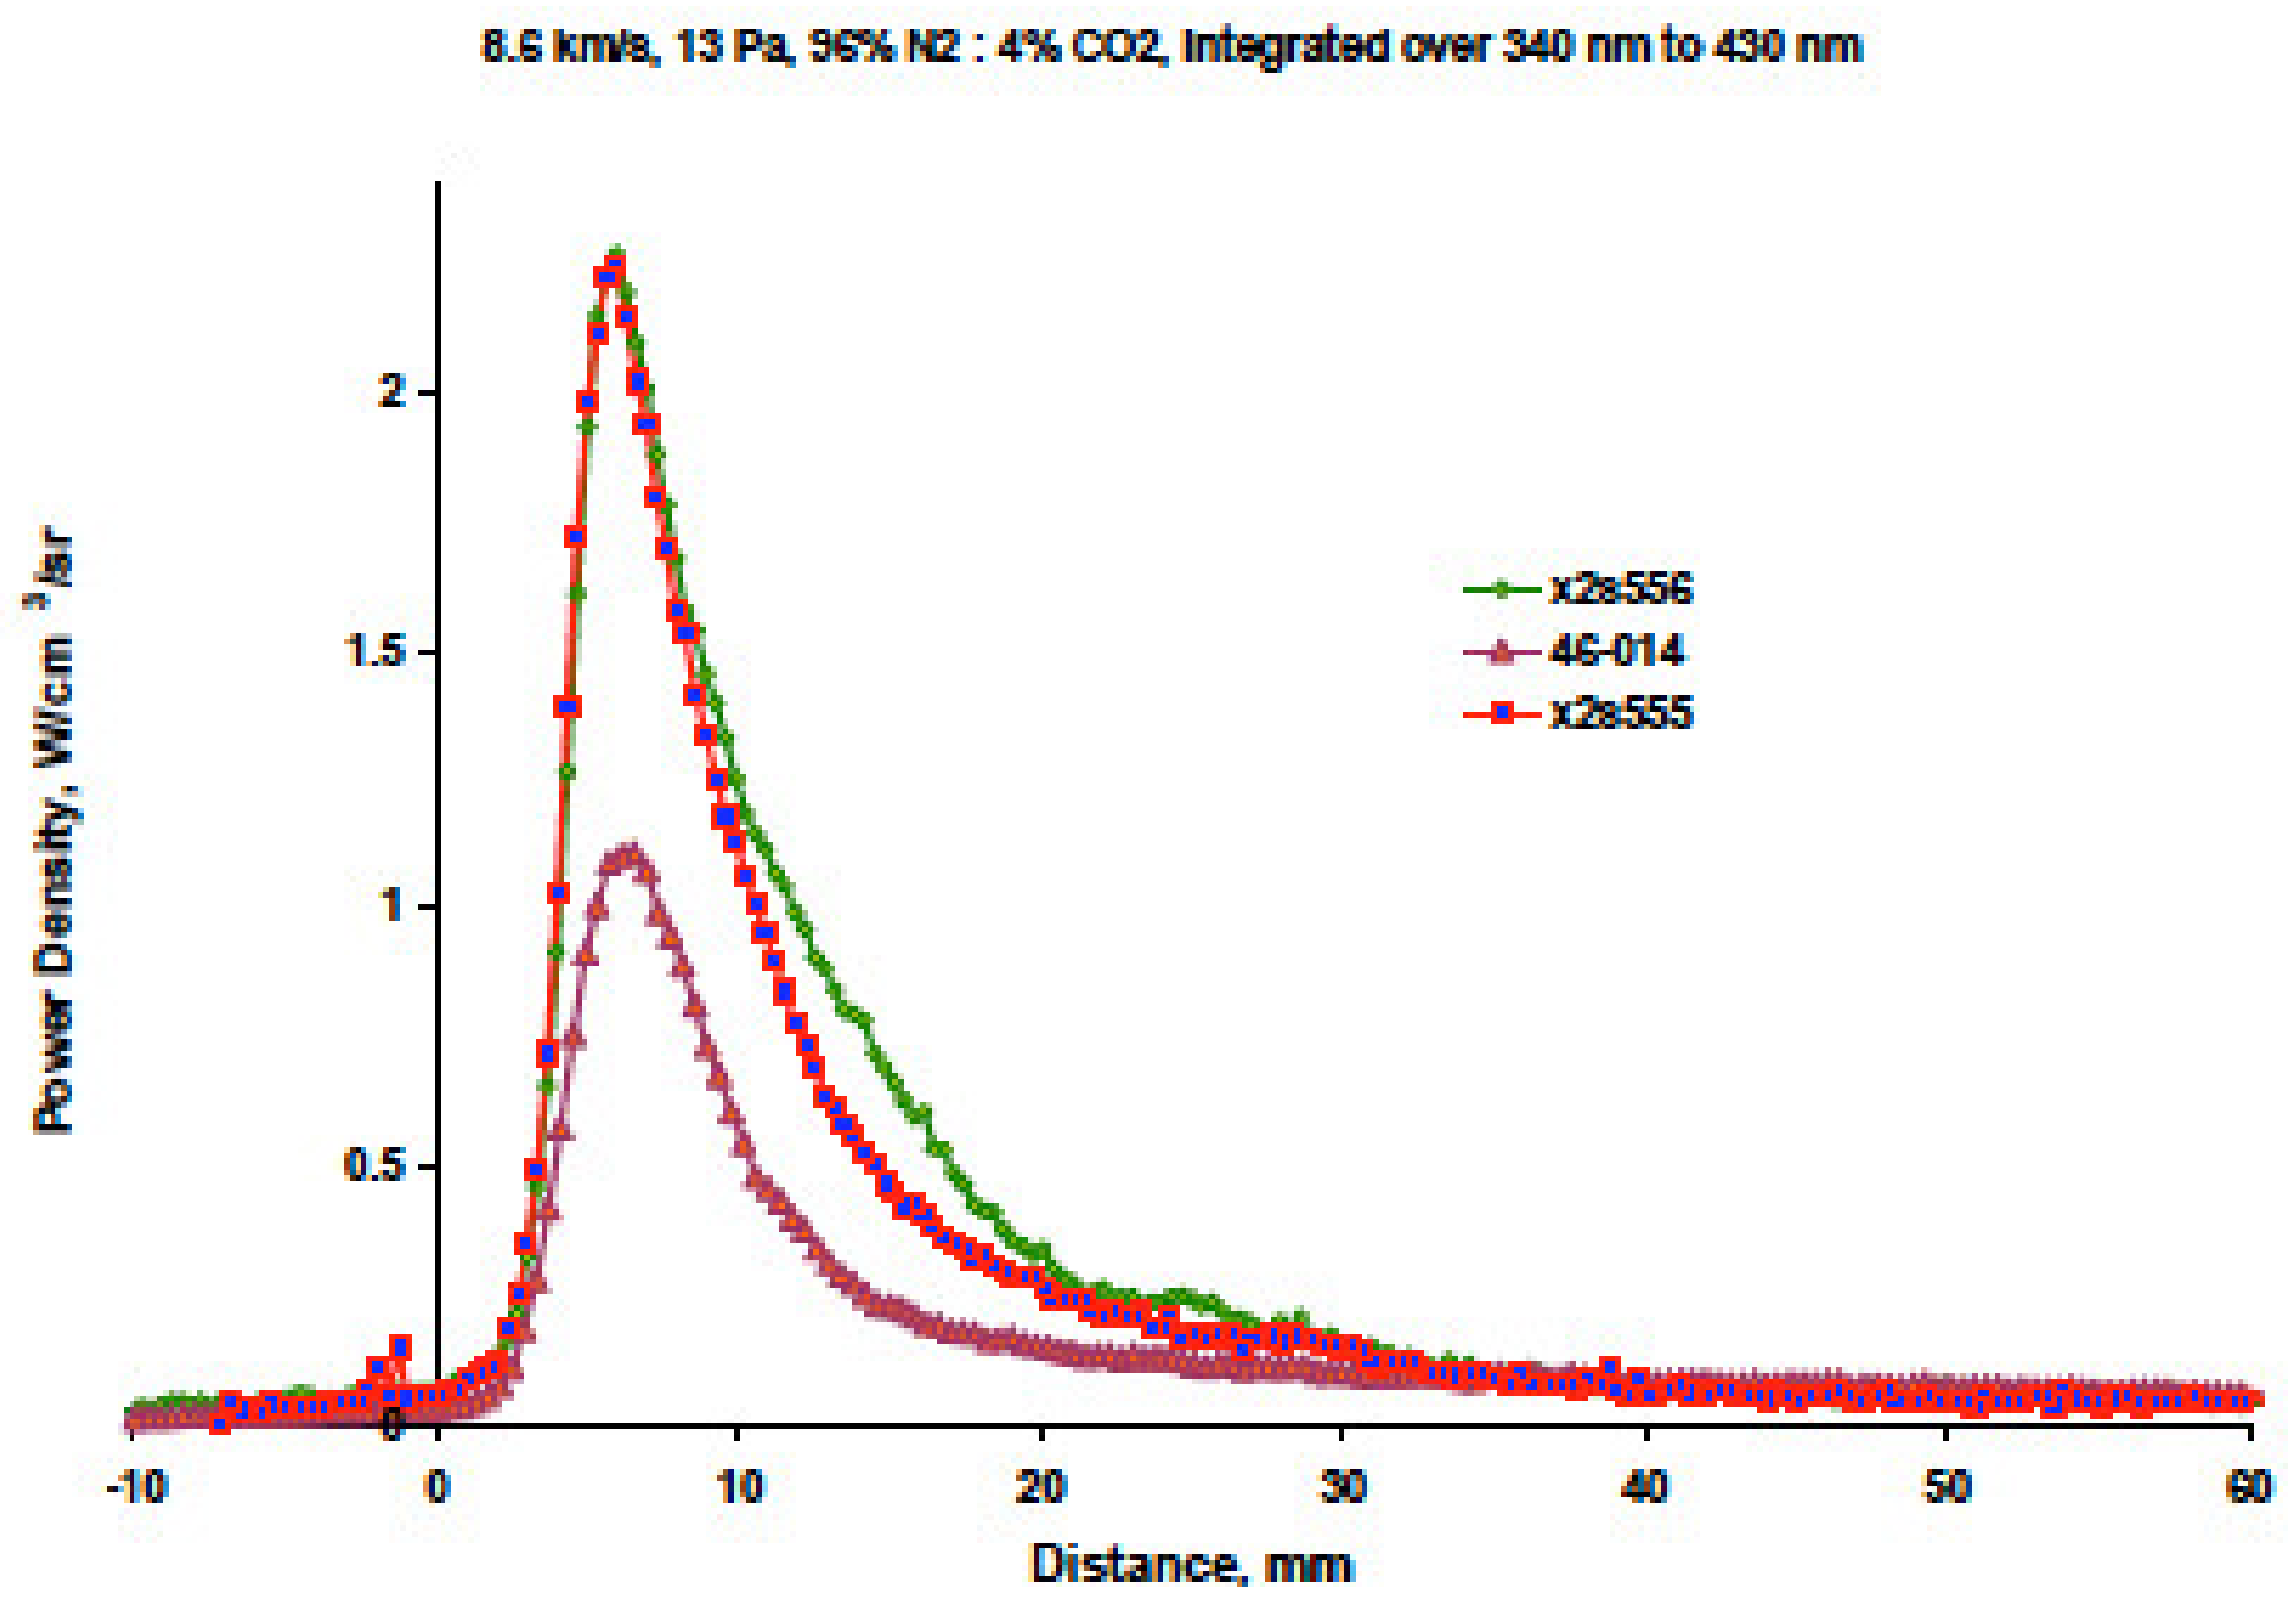
Experimental results obtained for close conditions (same pressure and shock velocity of 8.7 km/s) have been compared with EAST data [34]. This is displayed in Figure 37 for the spectral wavelength radiance and in Figure 38 for the power density.
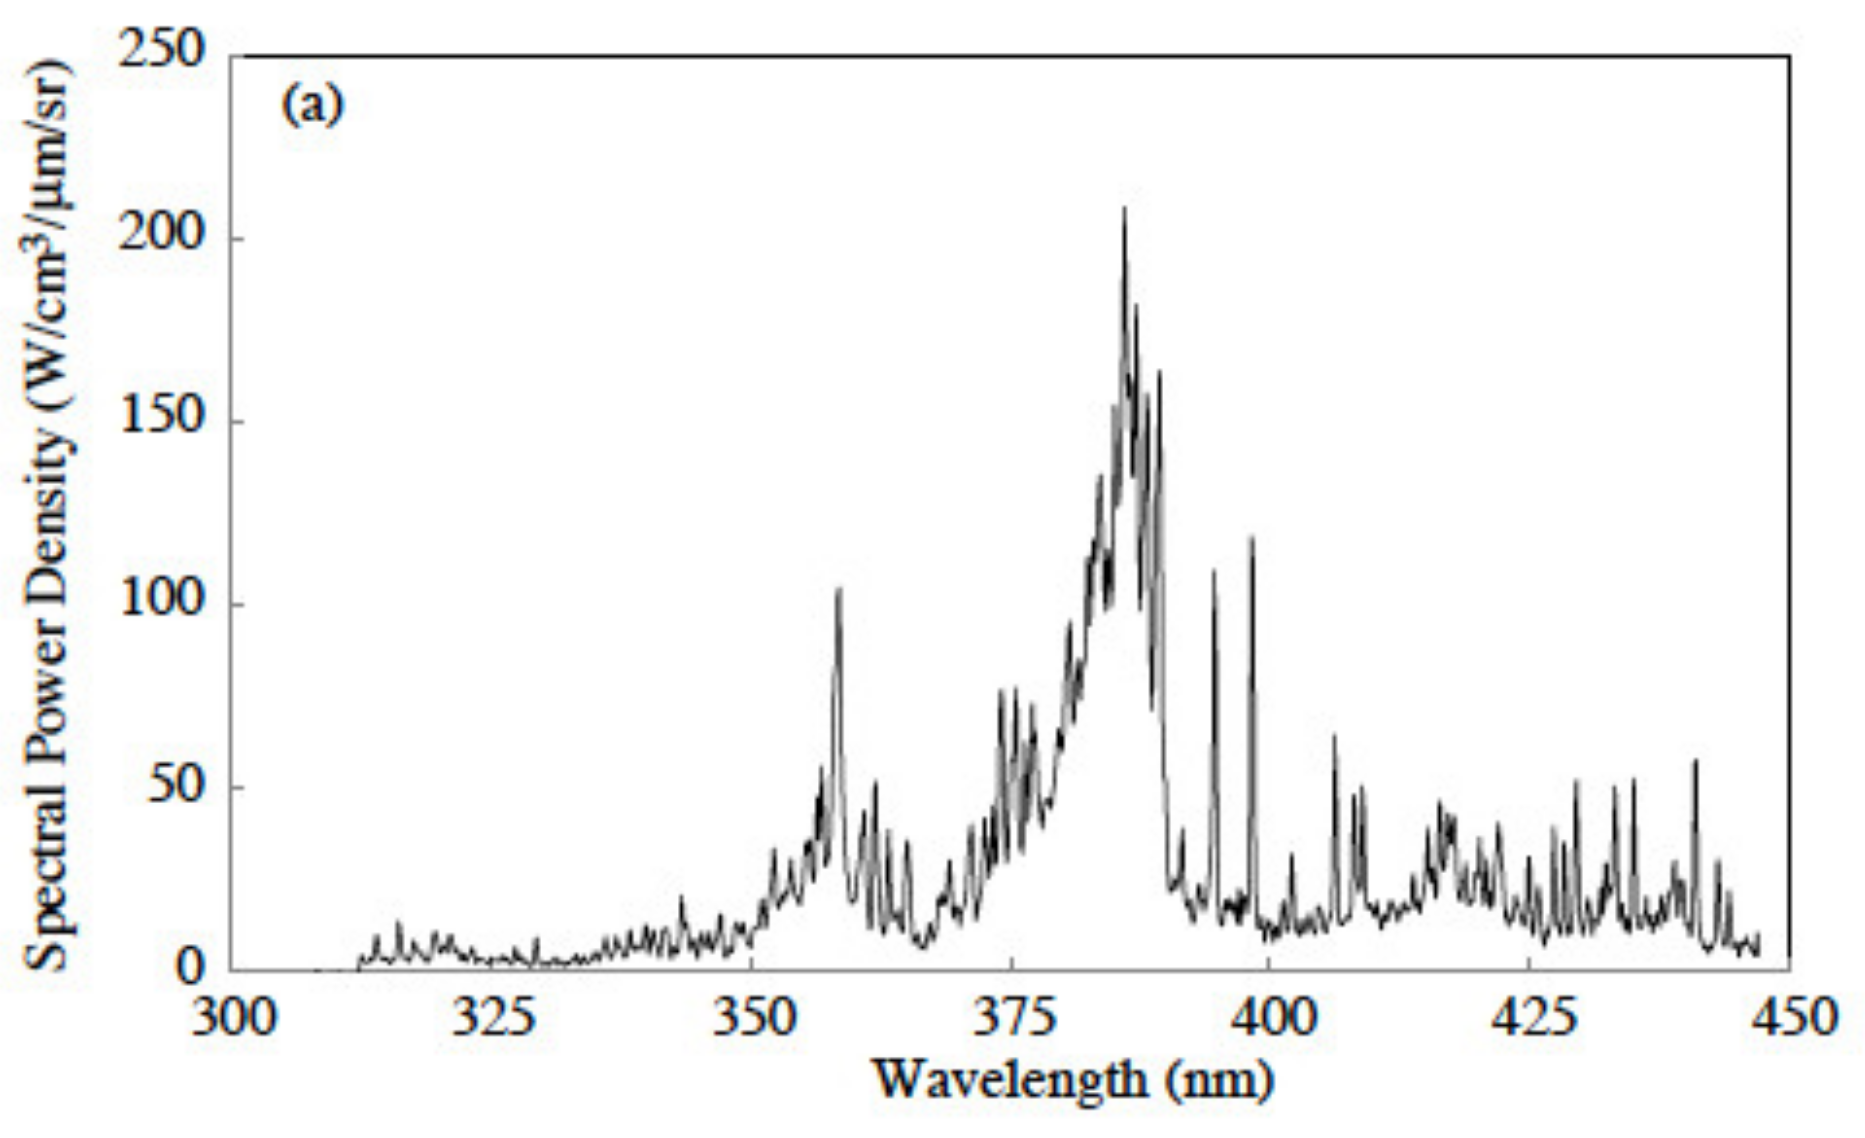
Other similar conditions with a shock velocity higher than 8 km/s have been investigated in [37]. Test conditions are reported in Table 2 and corresponding results in Figure 39. Measurements were again concentrated on the CN violet system.
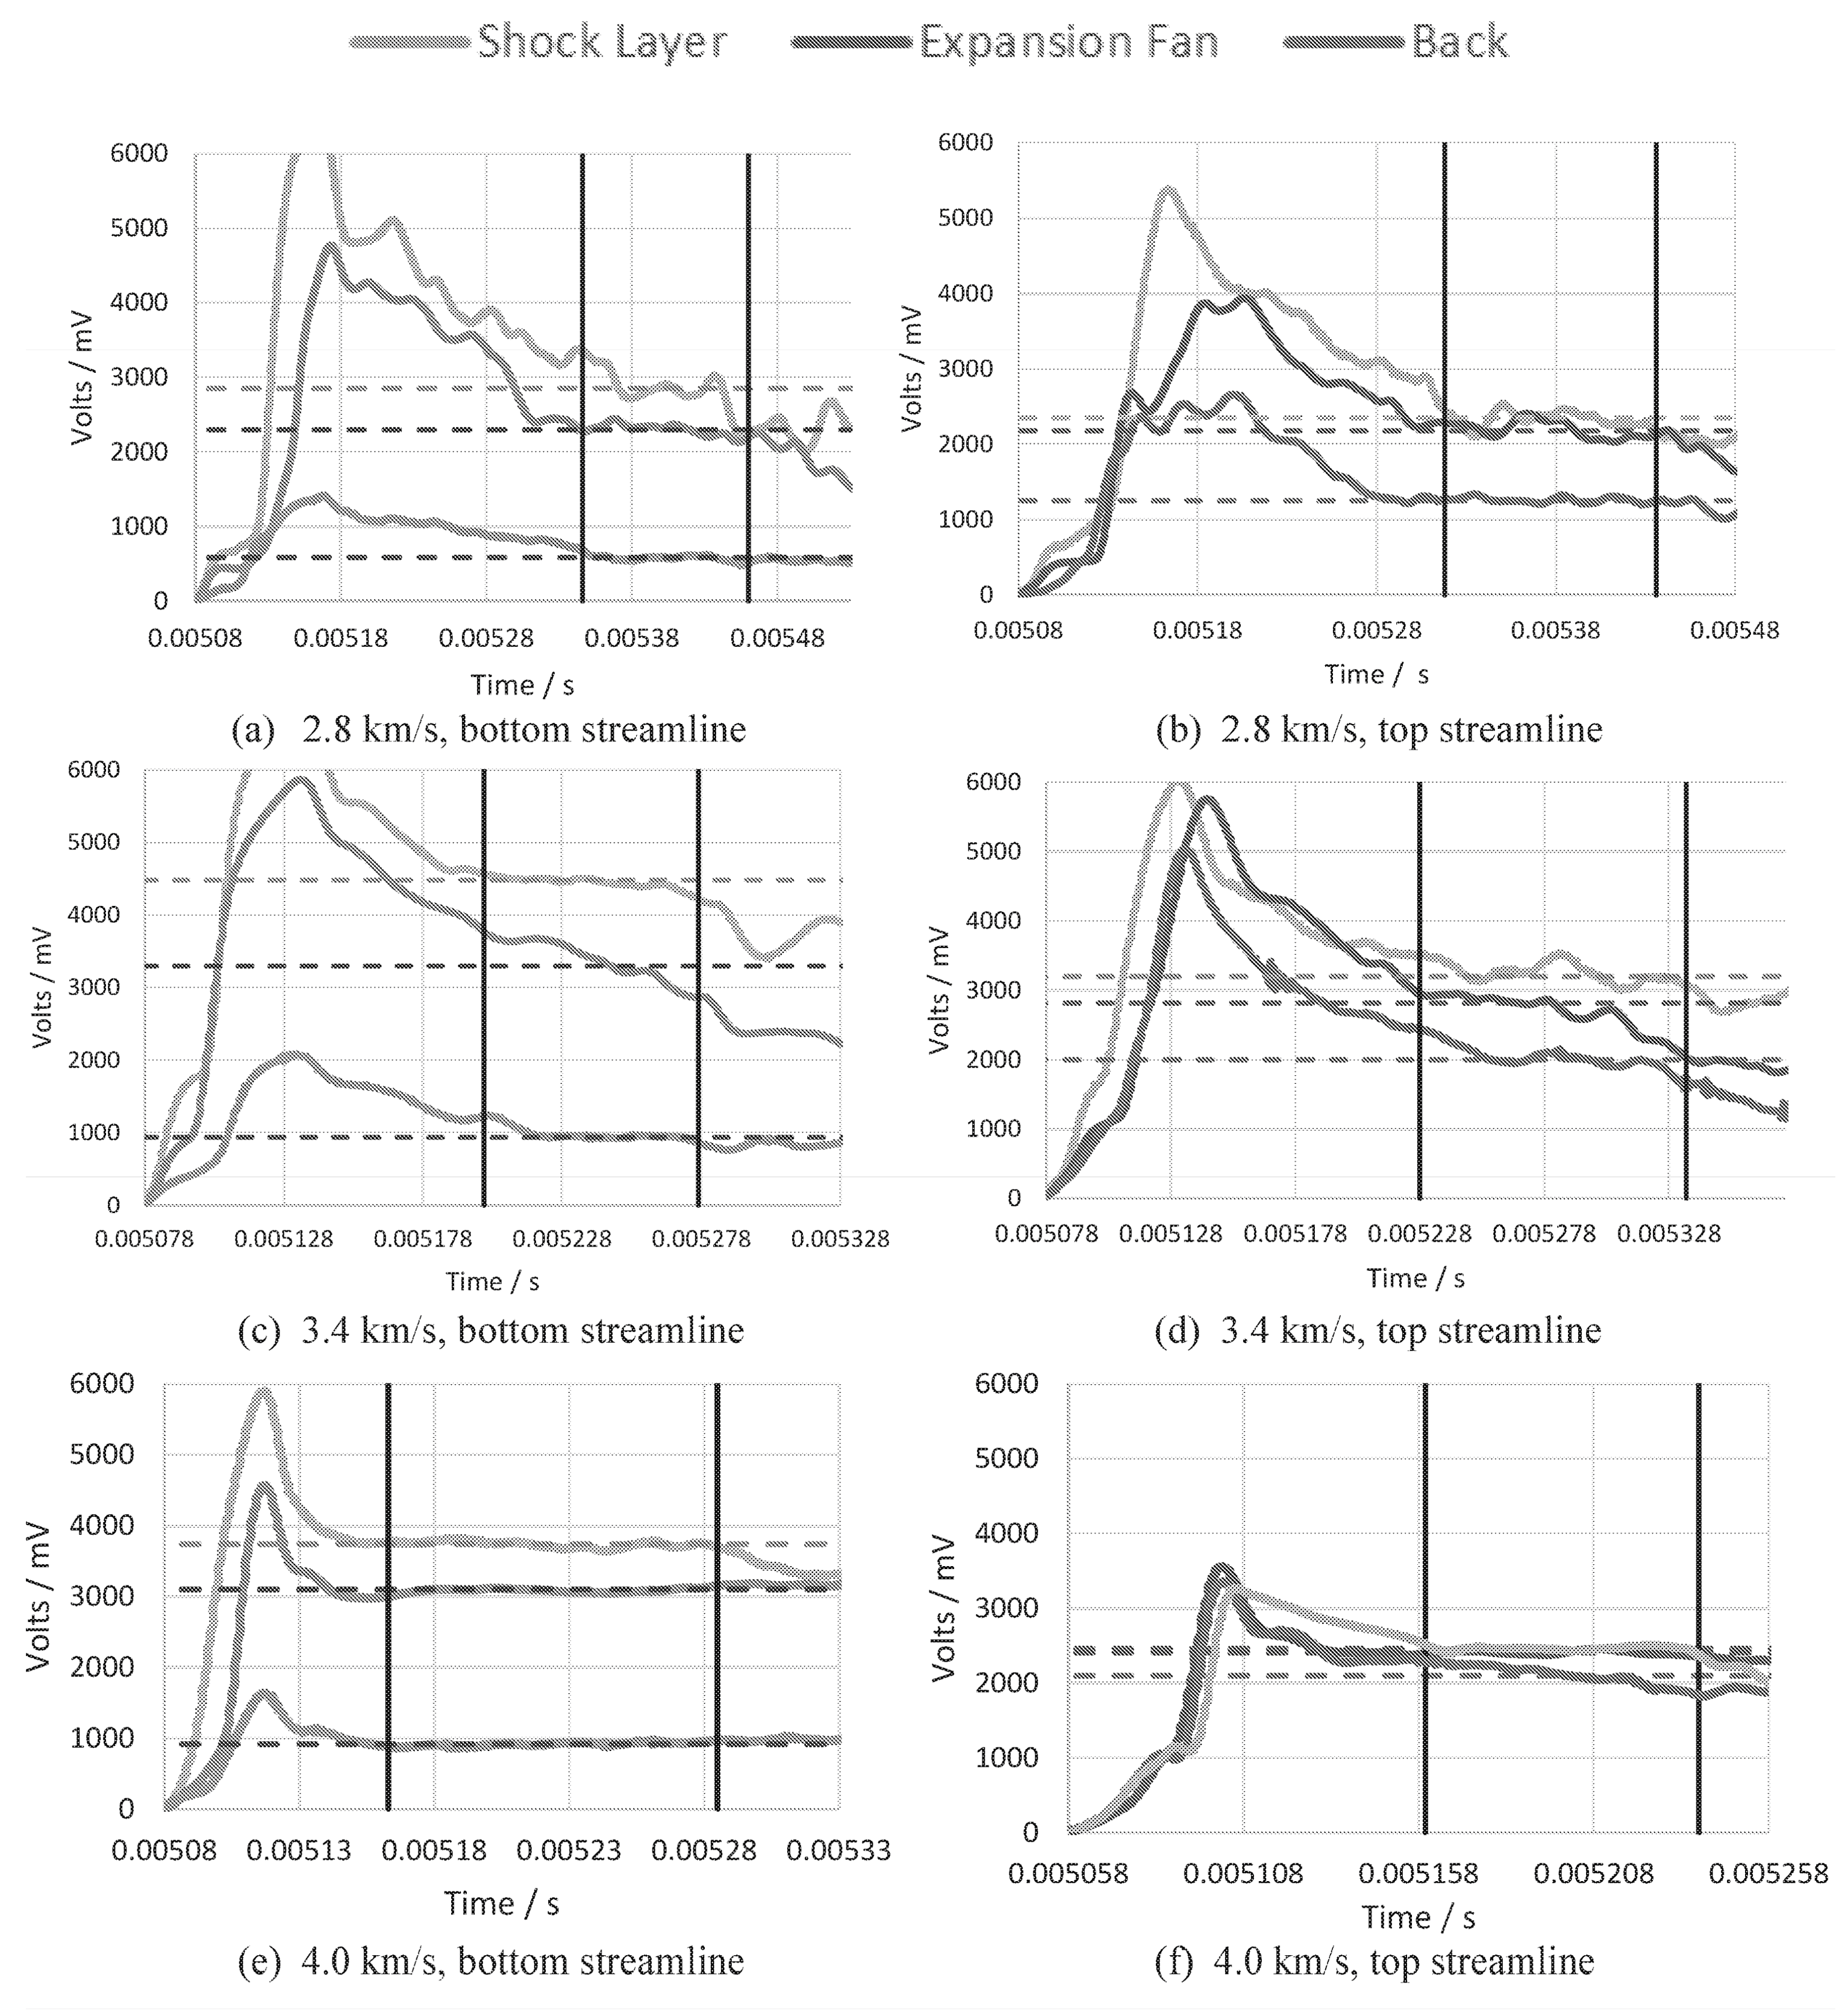
In [36] tests have been performed at freestream velocities of 2.8, 3.4, and 4 km/s, and spectroscopy measurements focused on CO2 radiation at 4300 nm. The test campaign was performed for studying the NASA MSL mission. The objective was to investigate the afterbody radiating expanding flow, since afterbody radiation is an issue at these velocities. As a consequence, pure CO2 was used for the test, since afterbody radiation is mostly produced by CO2. Test conditions are summarized in Table 3, temporally resolved radiation measurements in Figure 40. Comparisons were performed against numerical calculations performed with NEQAIR for CO2 band radiance.
5.4. Data from Other Facilities
Several datasets obtaines in different facilities, mostly shock-tube and plasma torches, have been included in this survey. Details for most of these ground tests can be found in [4].
5.4.1. ADST
ADST is a high enthalpy shock-tube [4] located at TSAGI near Moscow. Some tests related to Mars entry were performed in the frame of ISTC project [38]. A test campaign was performed for the following conditions:
- Pressure of 0.2 Torr;
- Mixture of 70 % [CO2] and 30 % [N2];
- Velocity from 6 up to 9 km/s.
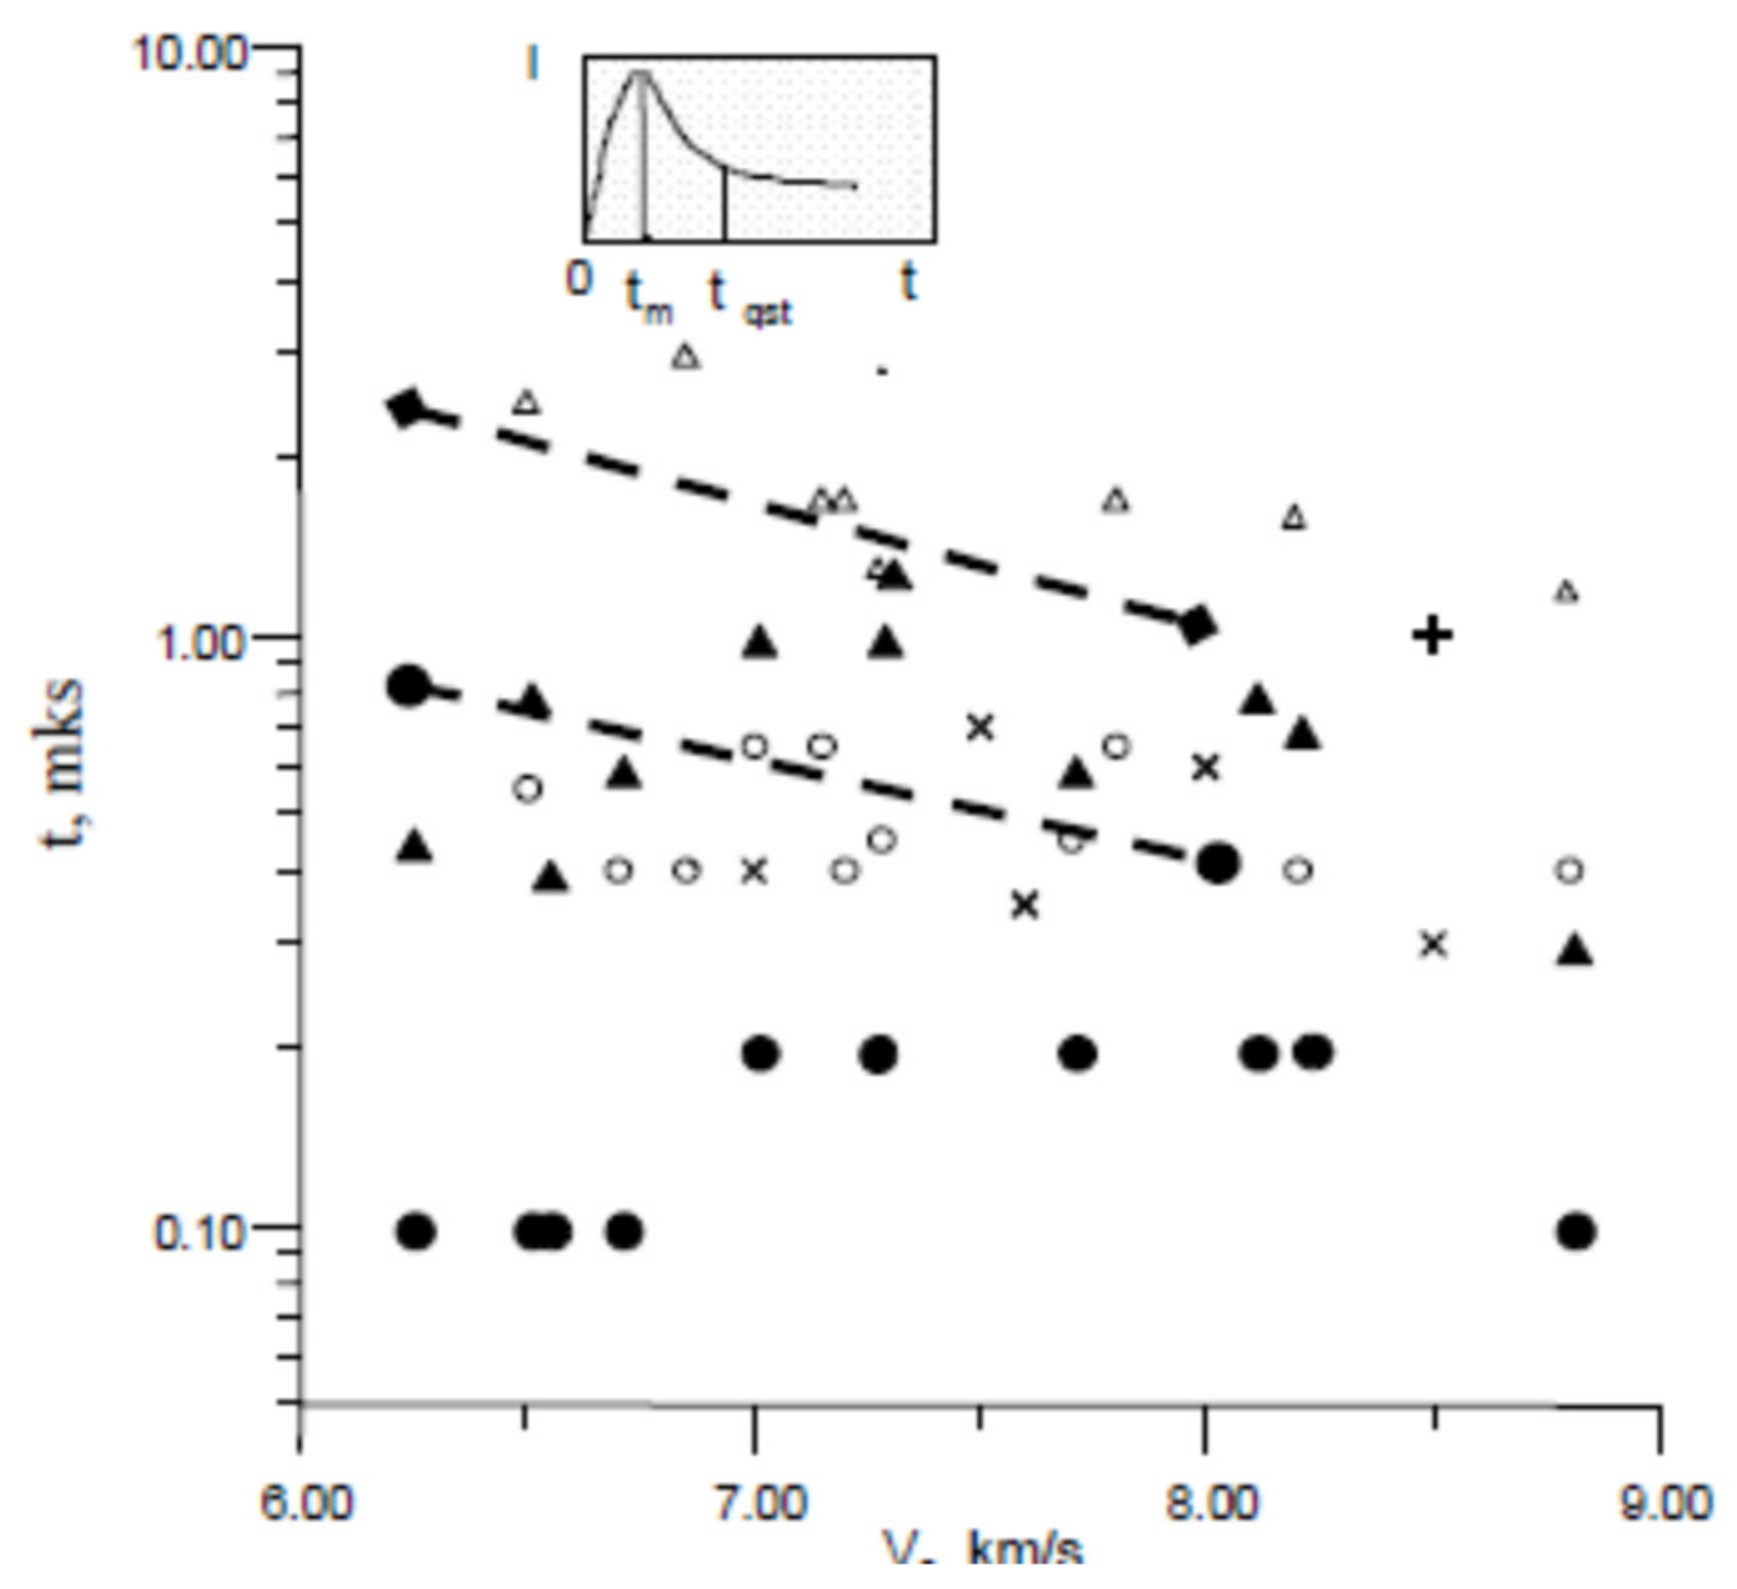
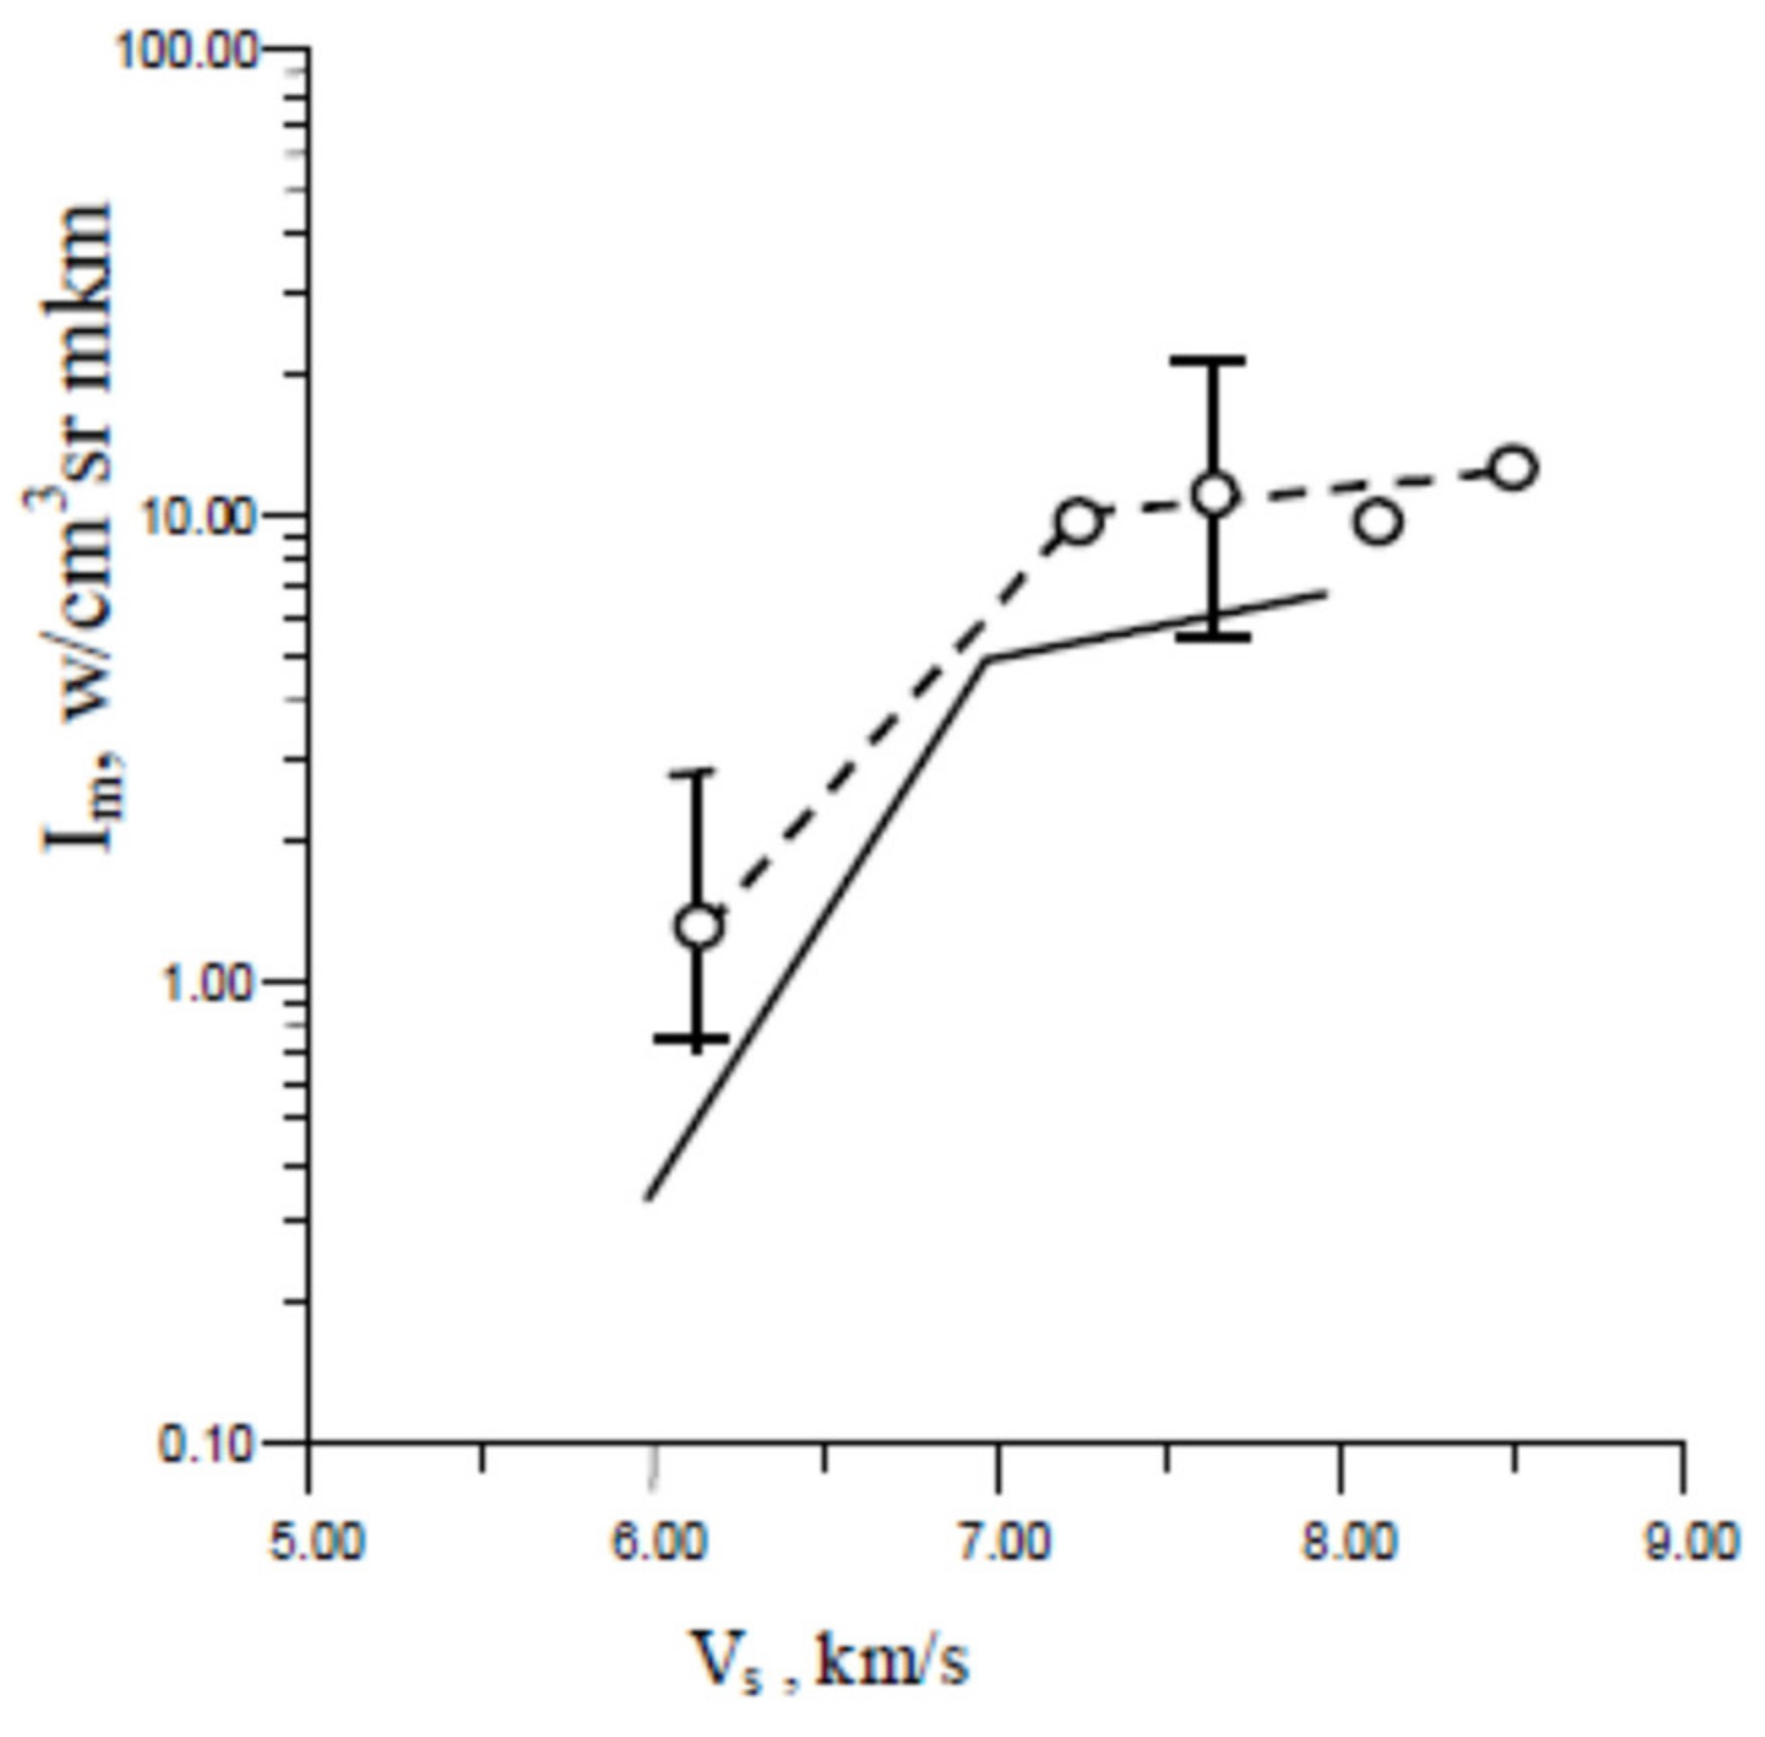
Measurements were performed for the absolute intensity of the main radiative components such as CO(4+) and CN(violet). Figure 41 shows the time-response characteristics of the non-equilibrium radiation peak as function of velocity, for CO(4+) radiation at a wavelength of 200 nm and the bands system CN (violet) radiation measured in ADST. In this figure, tm denotes the time for which the maximum radiation is reached, while tqst is the characteristic non-equilibrium radiation peak duration), this figure shows also similar measurements taken from [39]. The peak radiation intensity of CO(4+) measured in ADST compared against calculated values is plotted as function as shock velocity in Figure 42.
5.4.2. CORIA ICP Torch
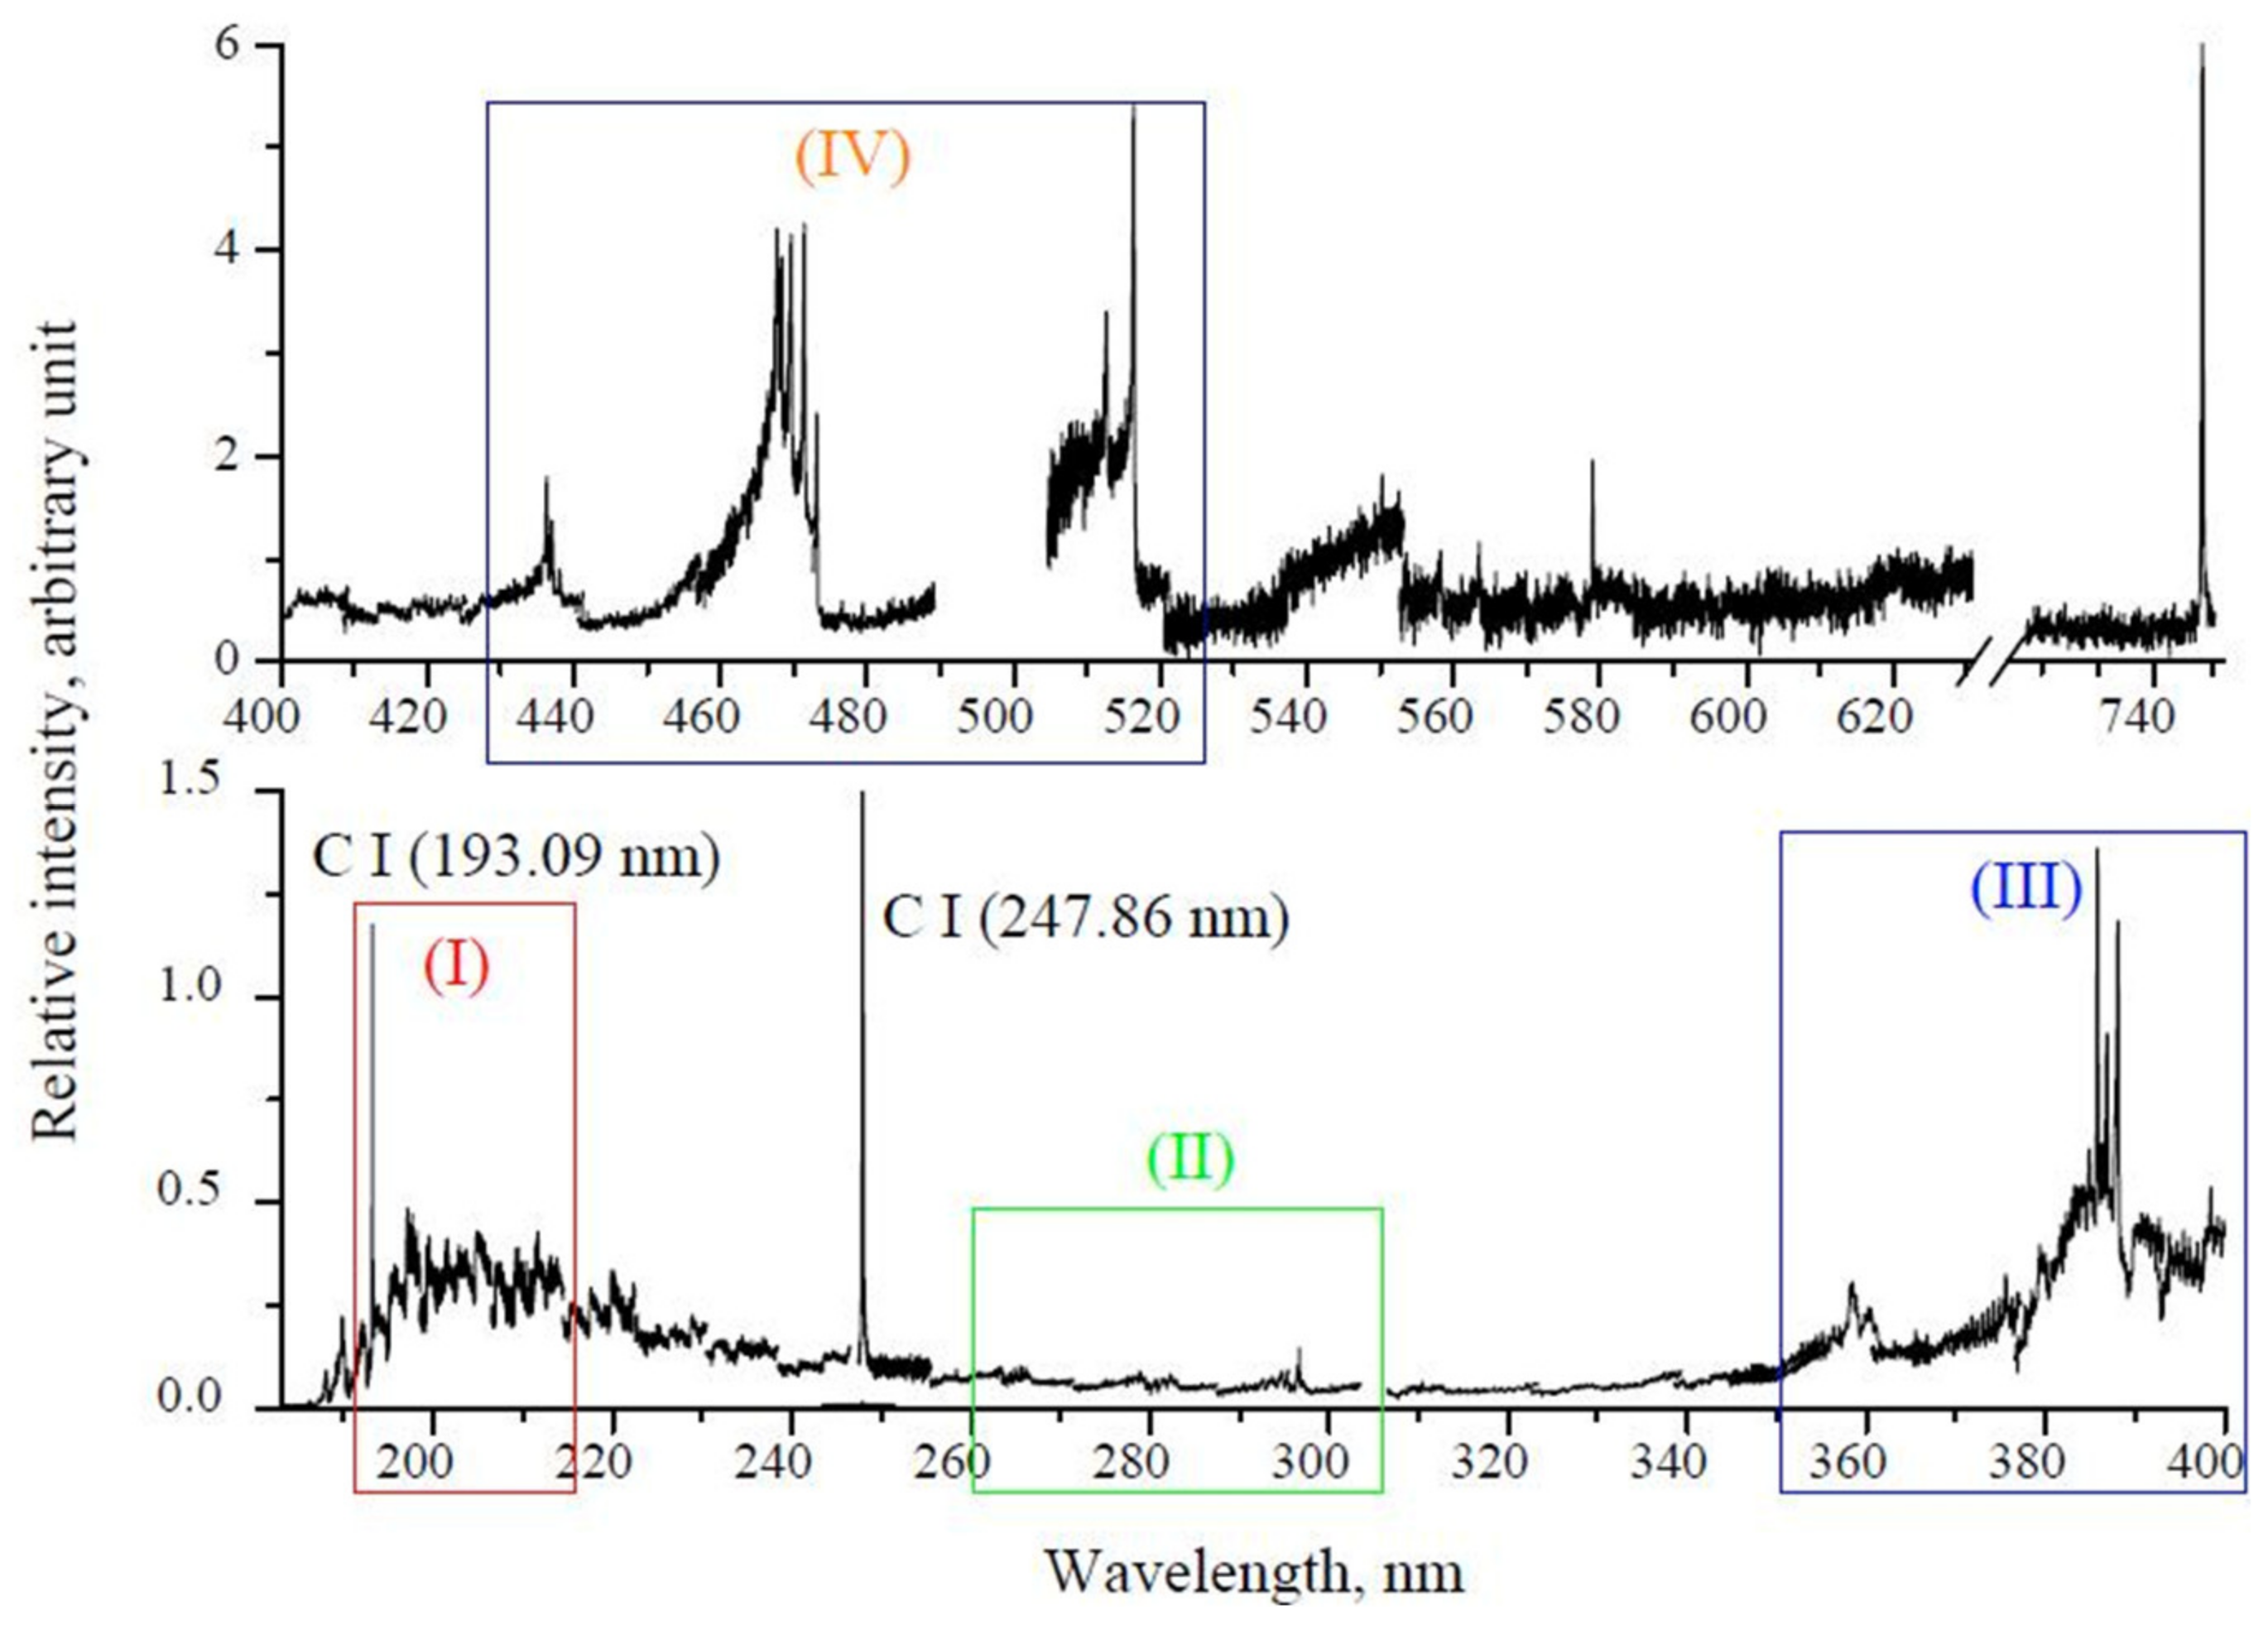
At least two test campaigns with pure CO2 have been performed in the CORIA (laboratory CNRS located near Rouen en France) ICP torch for subsonic flow conditions [40,41]. Pressure and specific test enthalpy were respectively of 38 mbar and 25 MJ/kg in [40] and 90 mbar and 8.5 MJ/kg in [41], More details on the measurements are available on this last study. Observed spectrum for the first test conditions [40] is reported in Figure 43. The spectrum can be divided in 4 parts: In the VUV range (part I), the contribution of CO(4+) is well identified, while in part II, the CO(3+) system is present. C2 Deslandres-d’Azambuja system is shown in part III, and C2 Swan in part IV. Some atomic lines for carbon can be also identified, as well as some radiation from CN. This last is present due to the introduction of air during the test for pressure control purpose.
5.4.3. ICARE PHEDRA Facility
PHEDRA ICARE facility (former SR5 at CNRS Orléans in France) is an arc-jet dedicated to the investigation of low-density flows. Several studies [42,43] have been conducted to investigate Mars plasma flows.
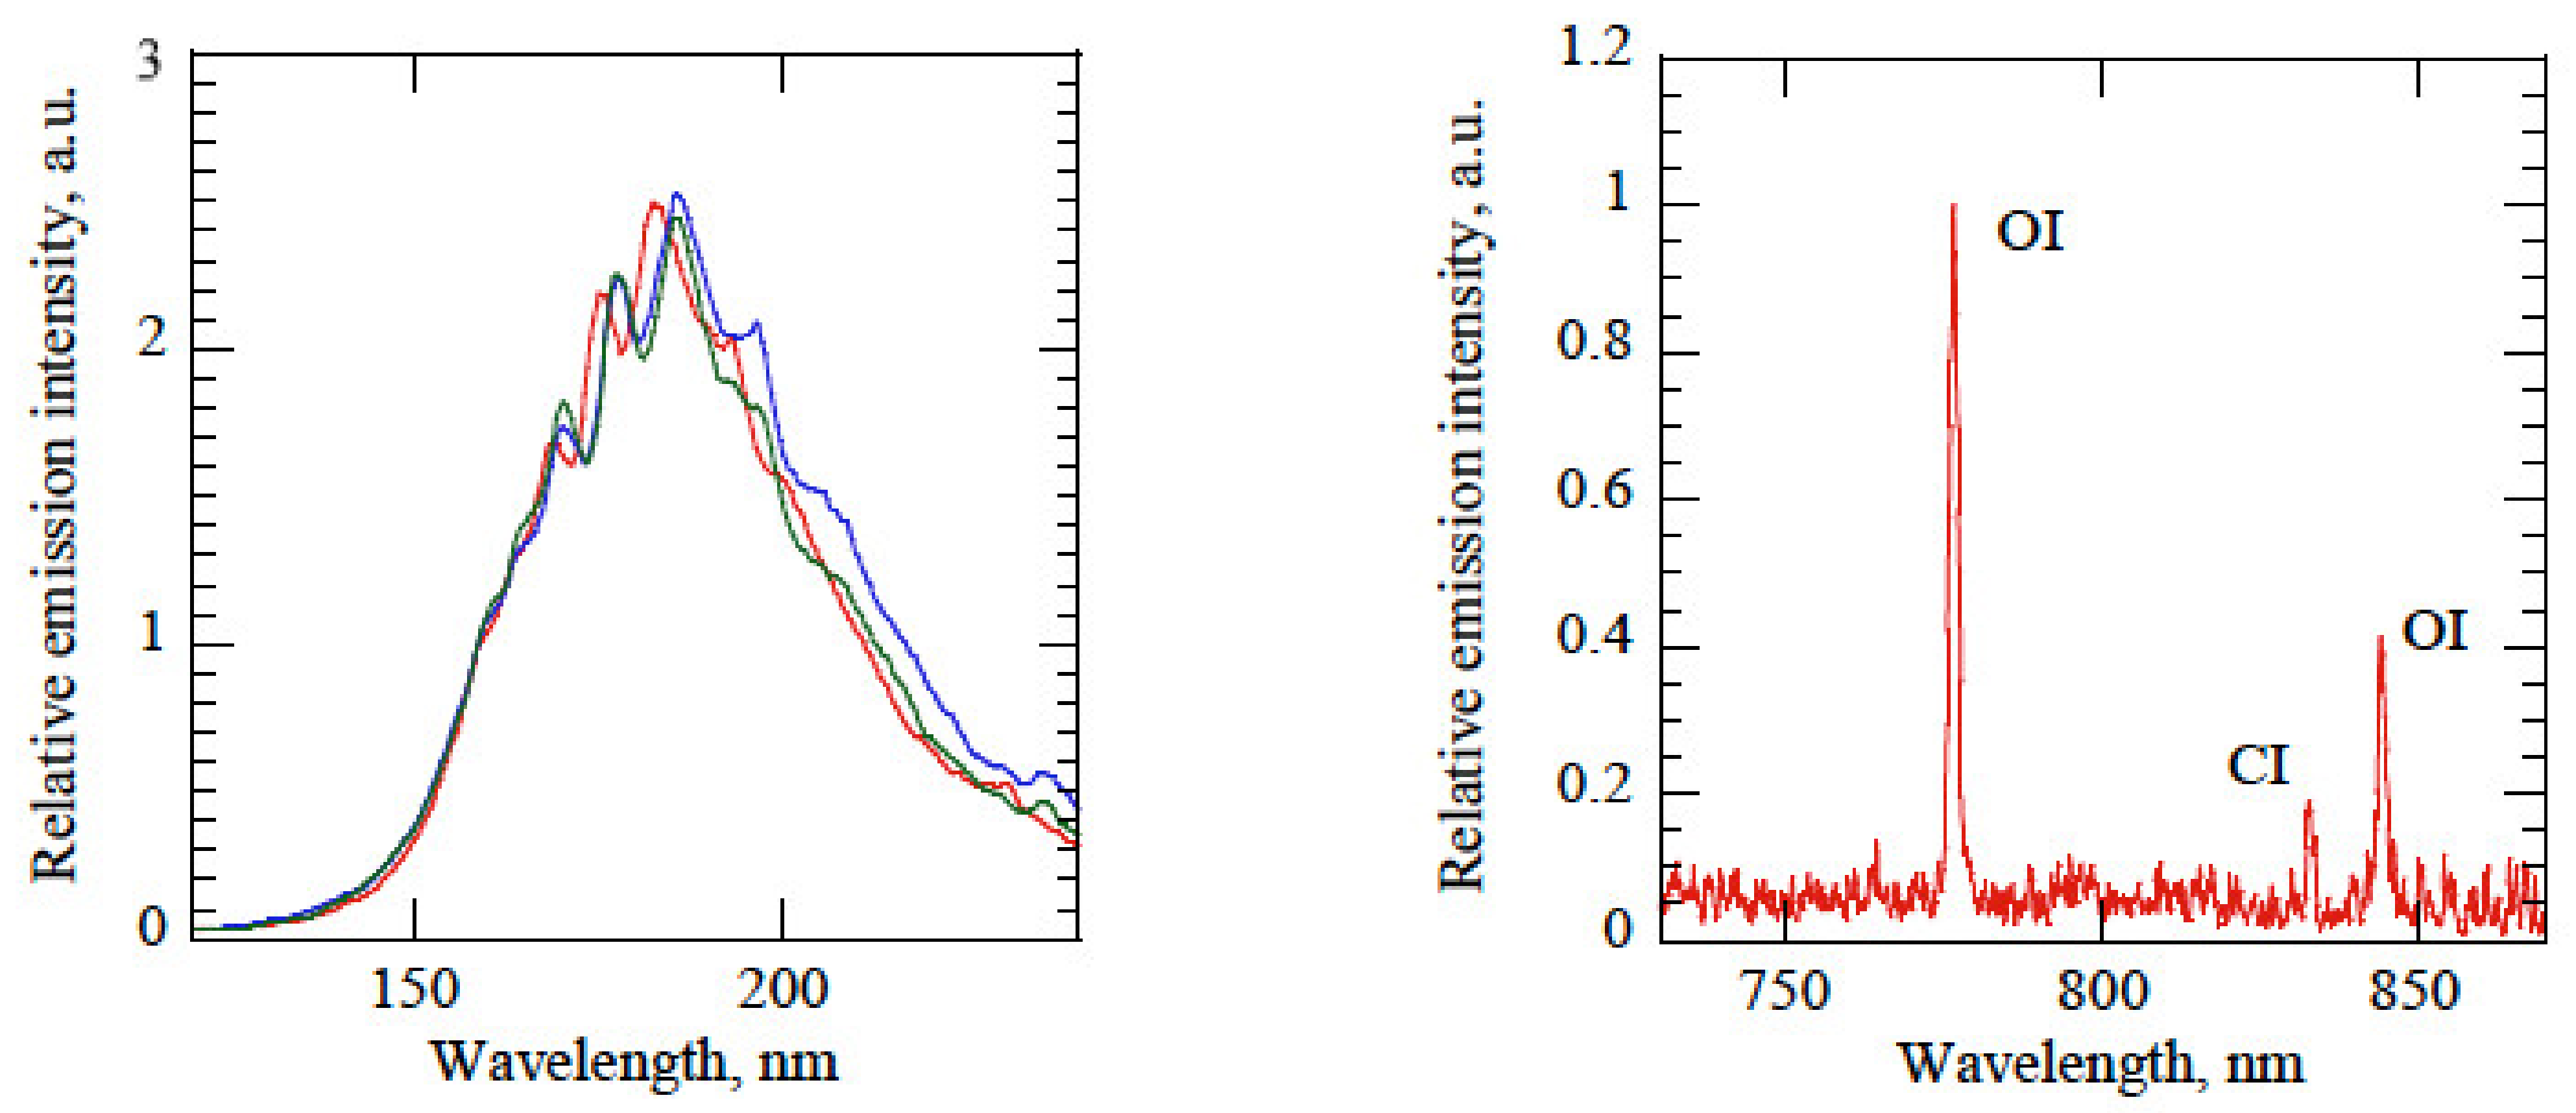
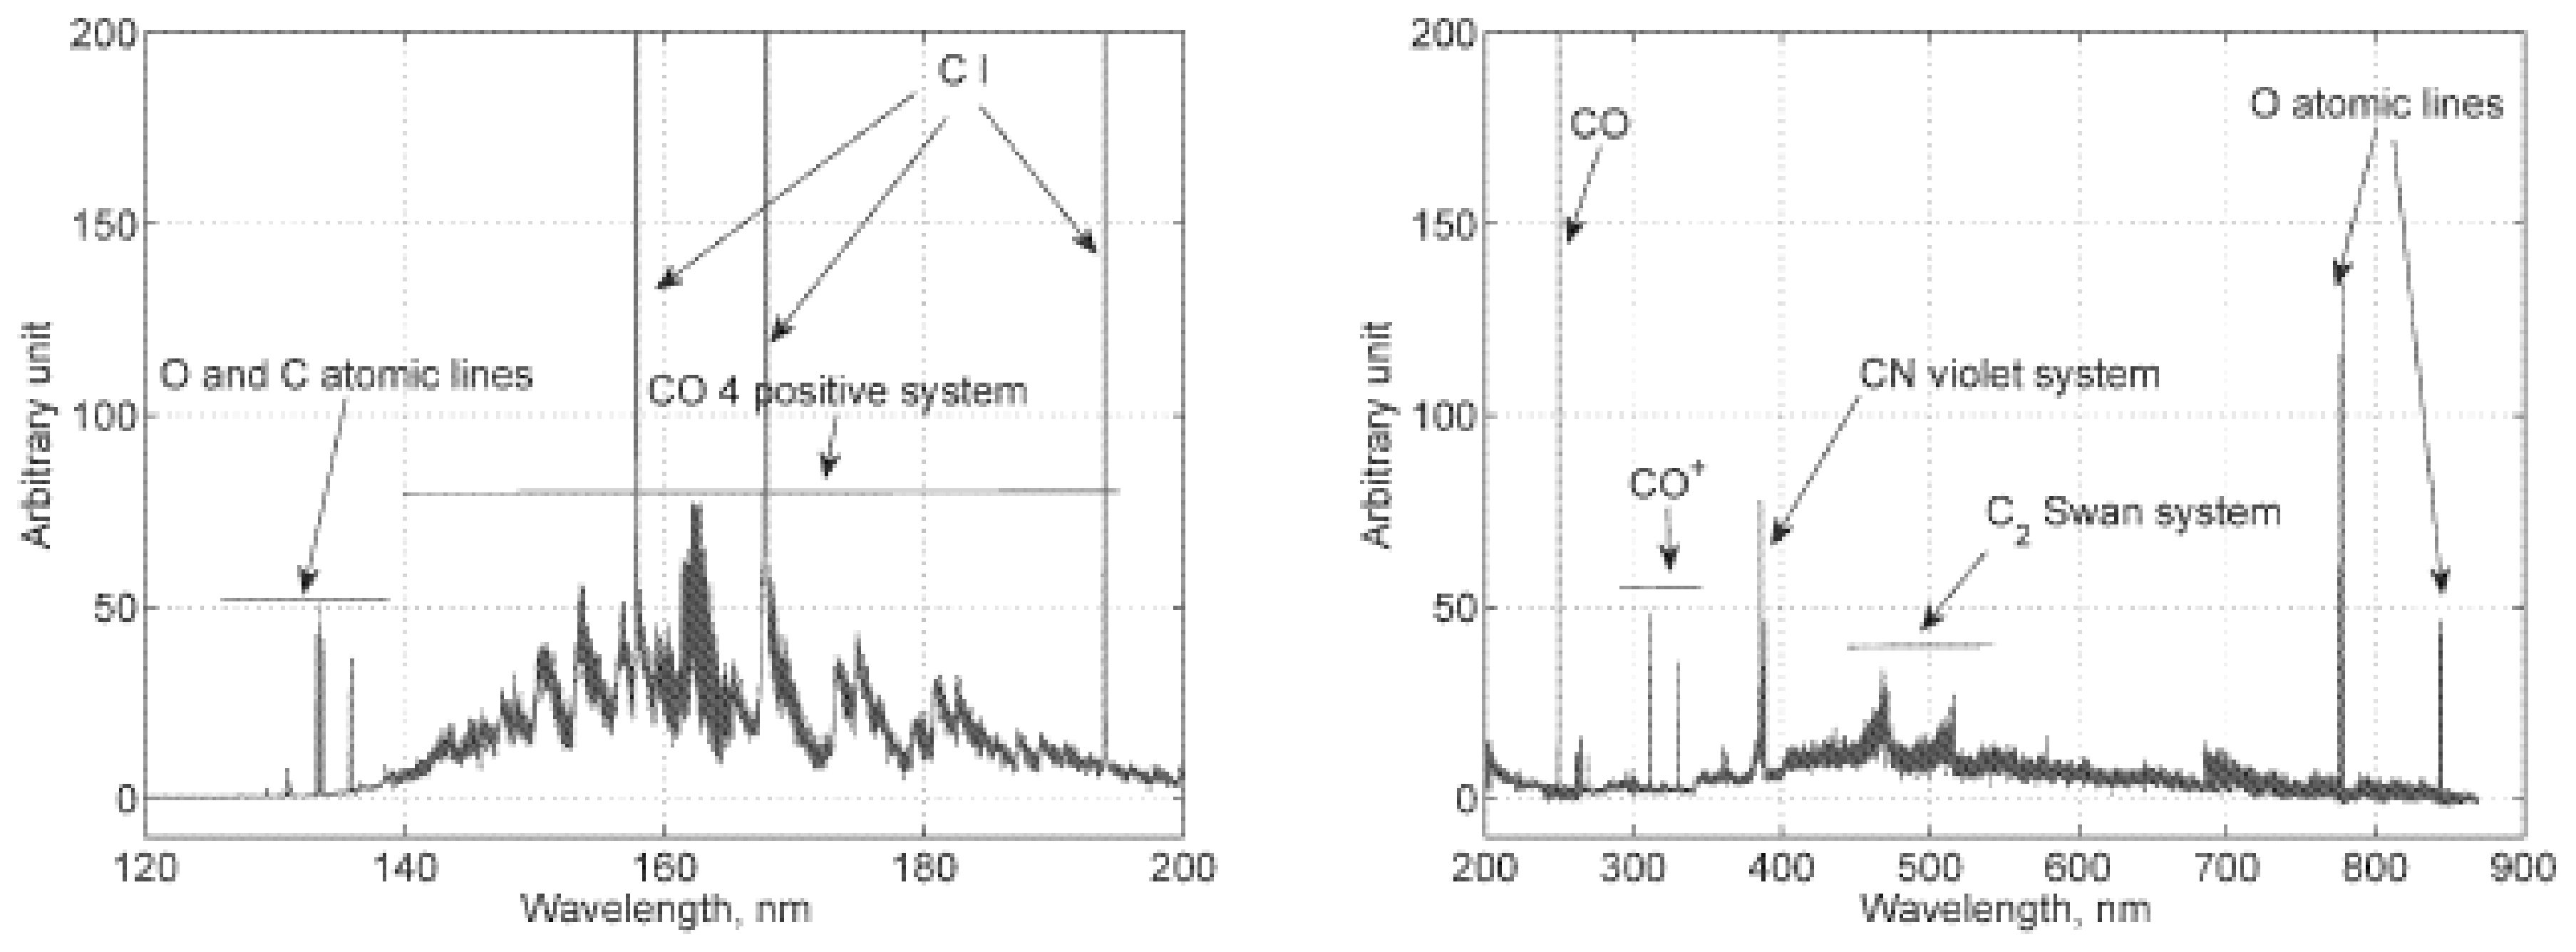
Recently, a test campaign [43] has been conducted in this ground test for measuring Mars plasma radiation from 110 nm to 900 nm. Tests have been performed with a 97% CO2–3% N2 mixture, at enthalpies in between 4.16 and 35 MJ/kg. Chamber static pressure was in between 2.9 and 5.3 Pa. The emission spectra obtained are shown in Figure 44, in the left part for the VUV region, in the right part for the UV, VIS, and NIR. CO(4+) system, C2 Swan and CN Violet systems can be identified, as well as molecular lines for CO+ and CO, and atomic lines for O and C. However, the conditions, in term of flow enthalpy and pressure, for which these spectra have been obtained, are not documented in [43].
5.4.4. KAIST
KAIST shock-tube [4,44], located in South-Korea, can be used in reflected mode, a velocity of 3.45 km/s producing a reflected shock temperature corresponding to a Mars entry velocity of 6.4 km/s can be obtained for N2–CO mixture as achieved in [44]. This shock-tube has been used for radiation studies in N2–CO mixture [44]. The wavelength region observed in these experiments covers the entire emission band of the CN violet system.
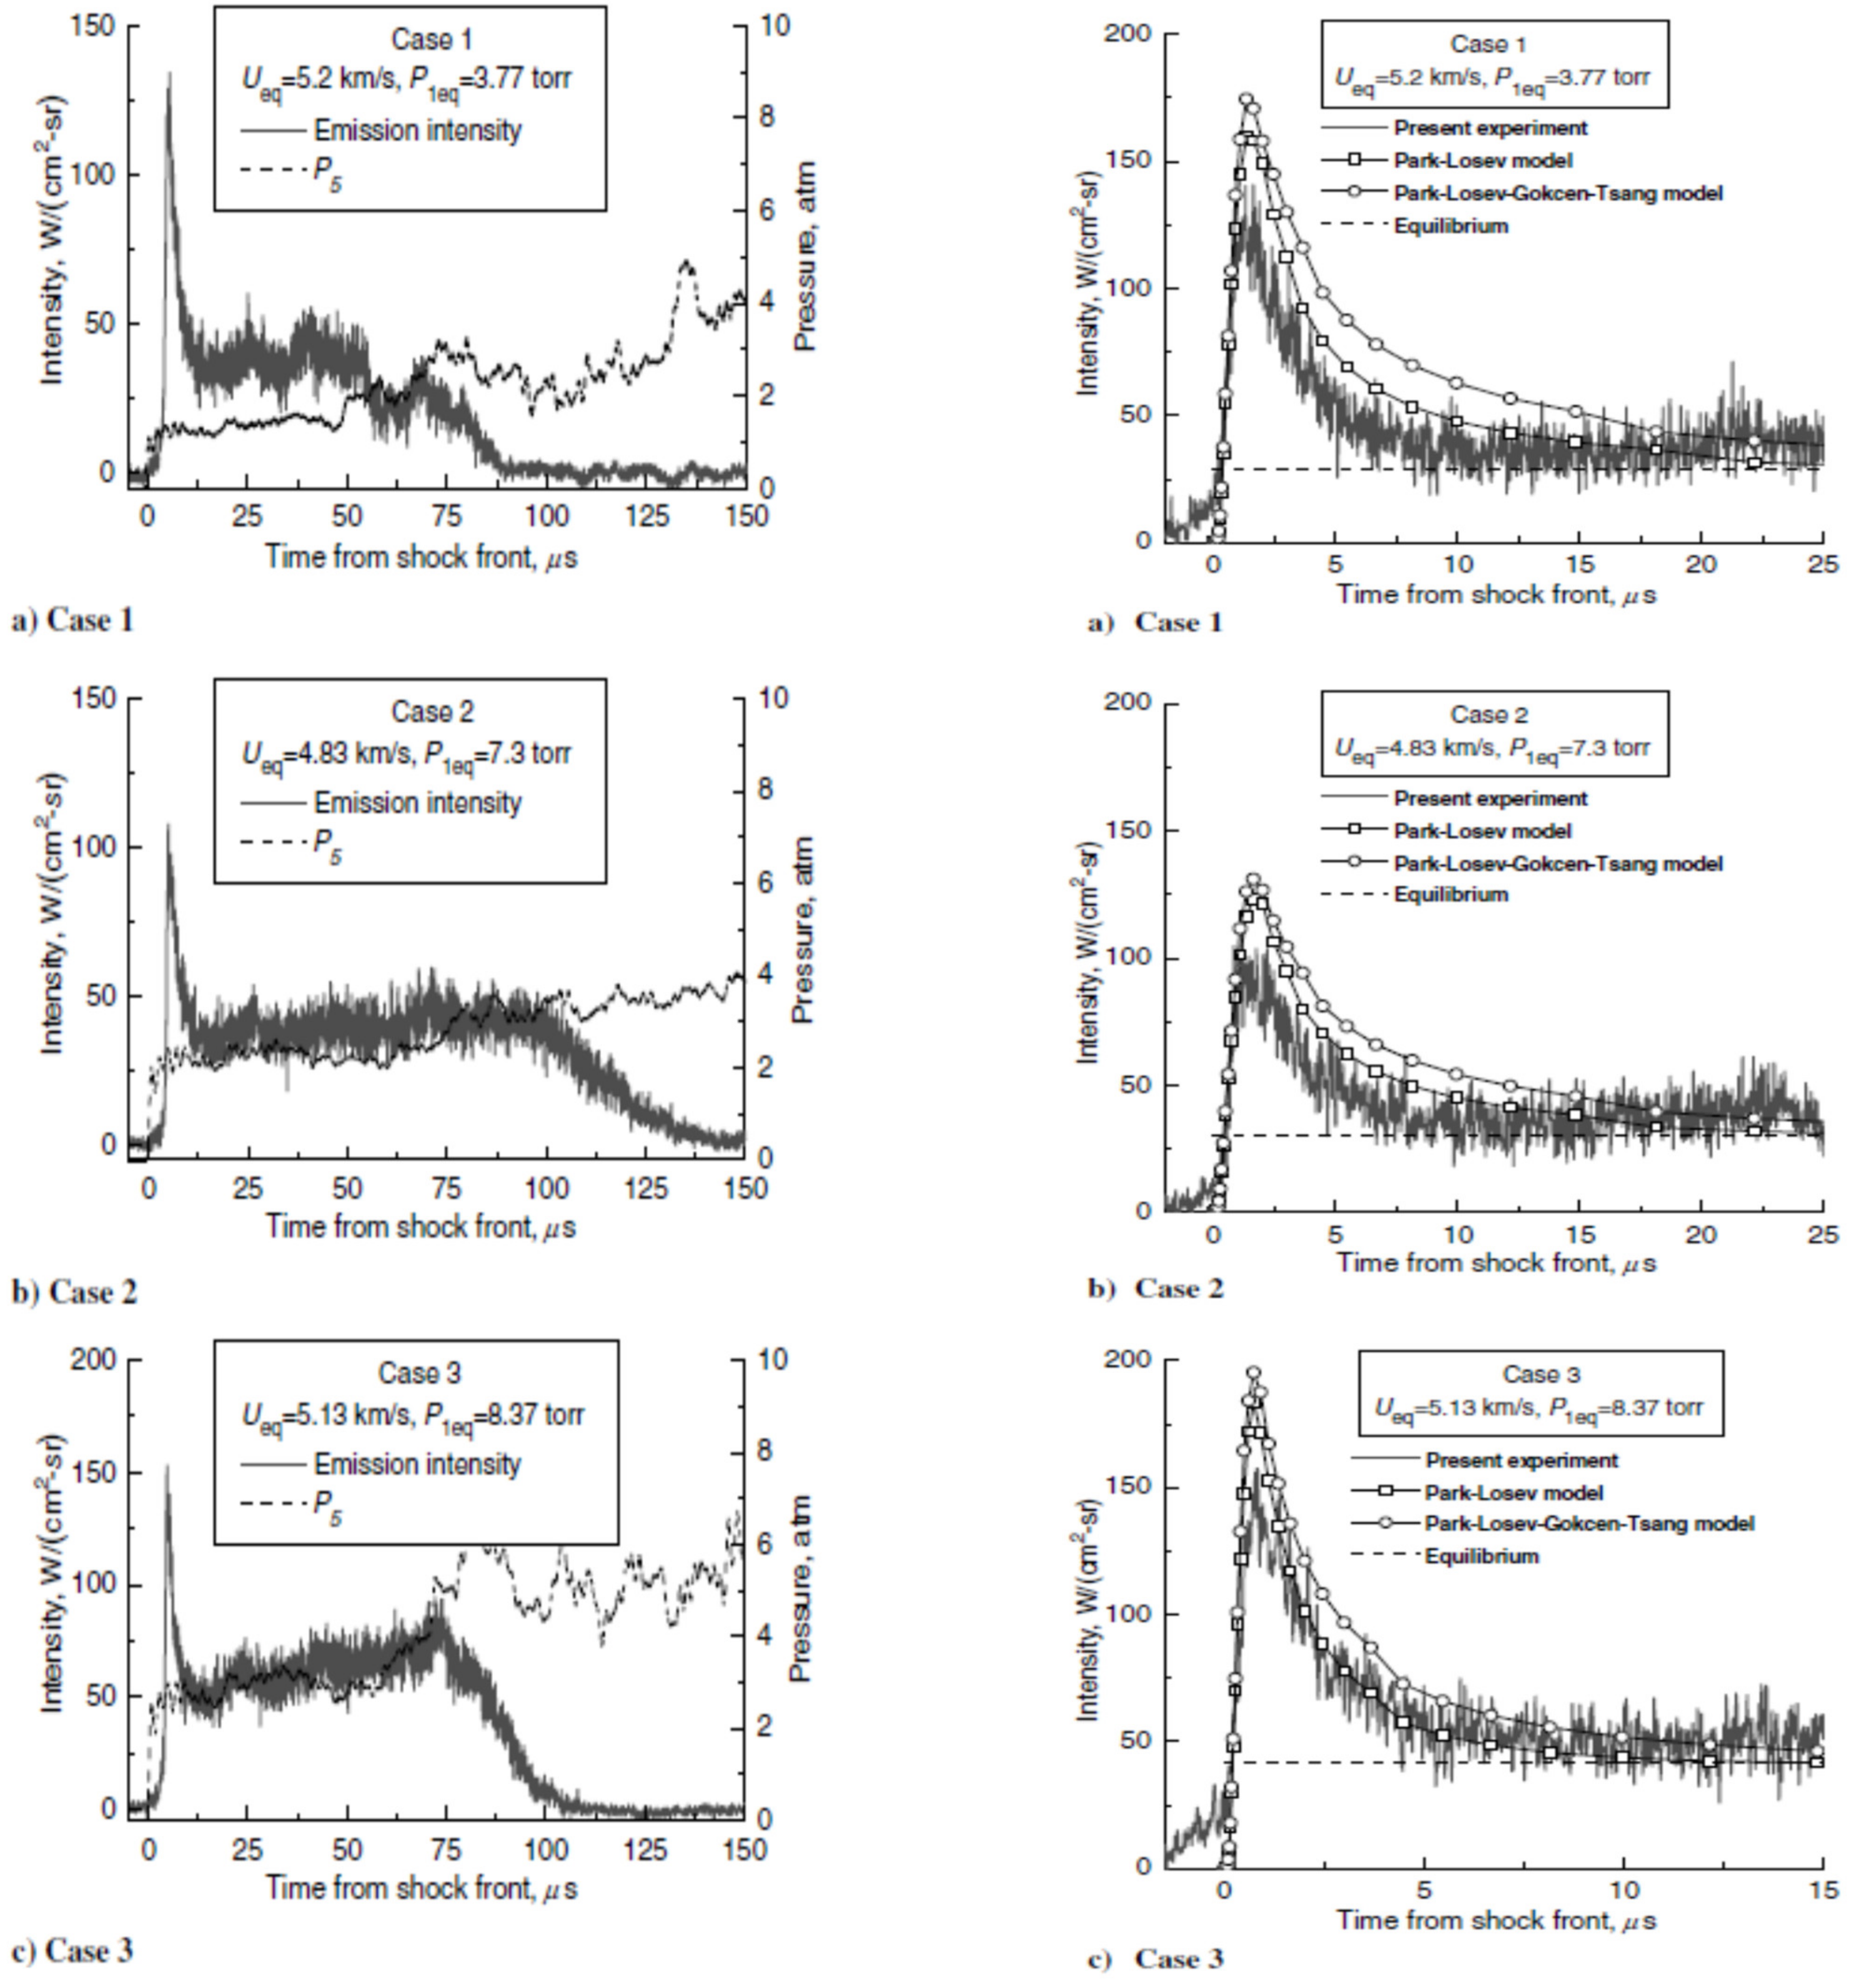
The chemical process of CN formation in a CO-N2 mixture with 78% of CO and 22% of N2, has been studied through temporally resolved intensity measurement of CN violet radiation in the reflected shock region of the shock tube [44]. The test conditions are reported in Table 4. Peq and Veq denoted the equivalent pressure and velocity obtained in reflected mode.
The measured radiation emission intensity and pressure behind the reflected shock are shown in the left part of Figure 45. In the right part of the figure the experimental results are compared with the calculations obtained with several chemical kinetics models for the three different cases. As shown in the figure, the emission intensity reaches a near-equilibrium value at 15 μs for all cases. The models overpredict the intensity at the non-equilibrium peak for all cases.
5.4.5. LAEPT ICP Torch
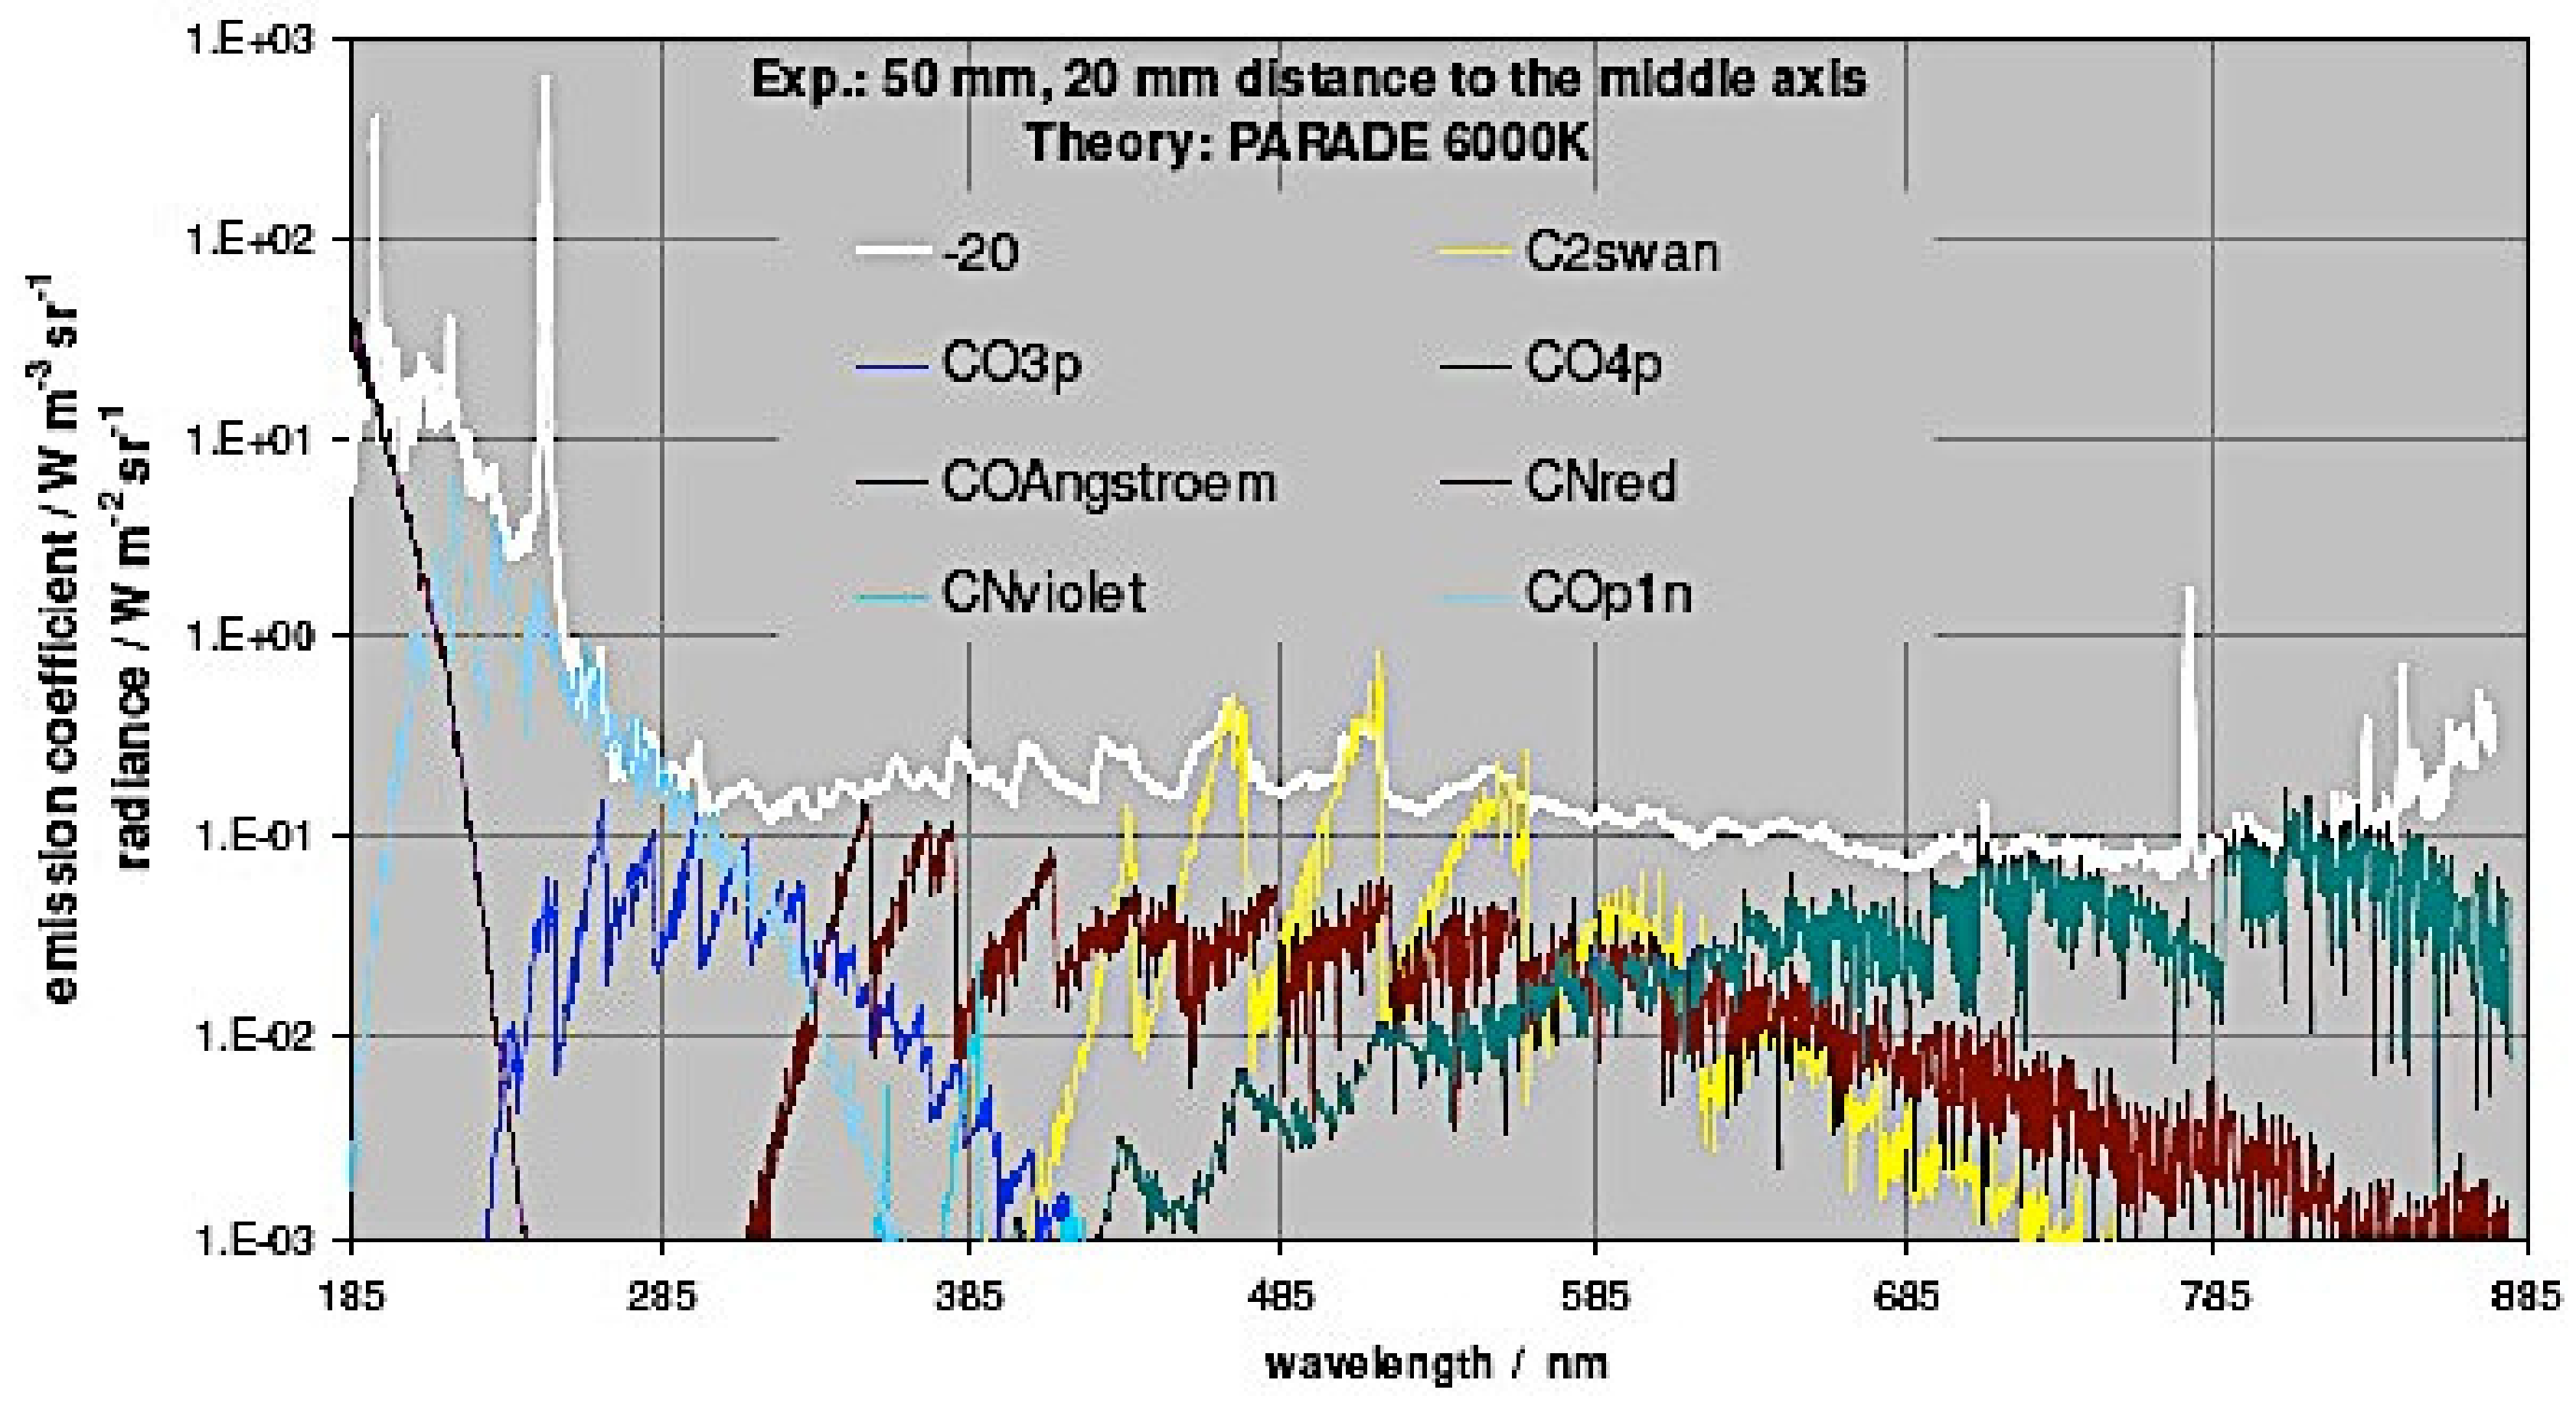
Several test campaigns [45,46] have been conducted in the LAEPT ICP torch at the University of Clermont-Ferrand (France) for investigating CO2 plasma emission. Experimental data have been obtained for a pressure of 950 hPa and a 97%-3% CO2-N2 mixture. Experimental data have been obtained for a pressure of 950 hPa and a 97%-3% CO2-N2 mixture. A temperature of 6000 K was estimated on the plasma jet axis using numerical fitting of emission spectra with the line-by-line code SPARTAN [47]. Emission spectra are shown in Figure 46, CN Violet emission is predominant while C2 emission is very weak, radiation from CN Red, NO and N2+(1-) is not observed. Atomic lines from C and O are present.
5.4.6. LENS
The LENS-XX (located at CUBRC in Buffalo, United-States) expansion tube has a large measurement equipment [48], and has already provided valuable radiation data for Earth high-speed re-entry. For the NASA CEV project a large number of shots have been performed for Lunar return conditions [49] and data were collected from VUV to near infrared. The facility has been also used for investigating CO2 flows around a blunt-body [50] for laminar and turbulent conditions, with and without dissociation and radiation but no spectral data was found to be available in the literature in relation with this study.
5.4.7. Moscow State University
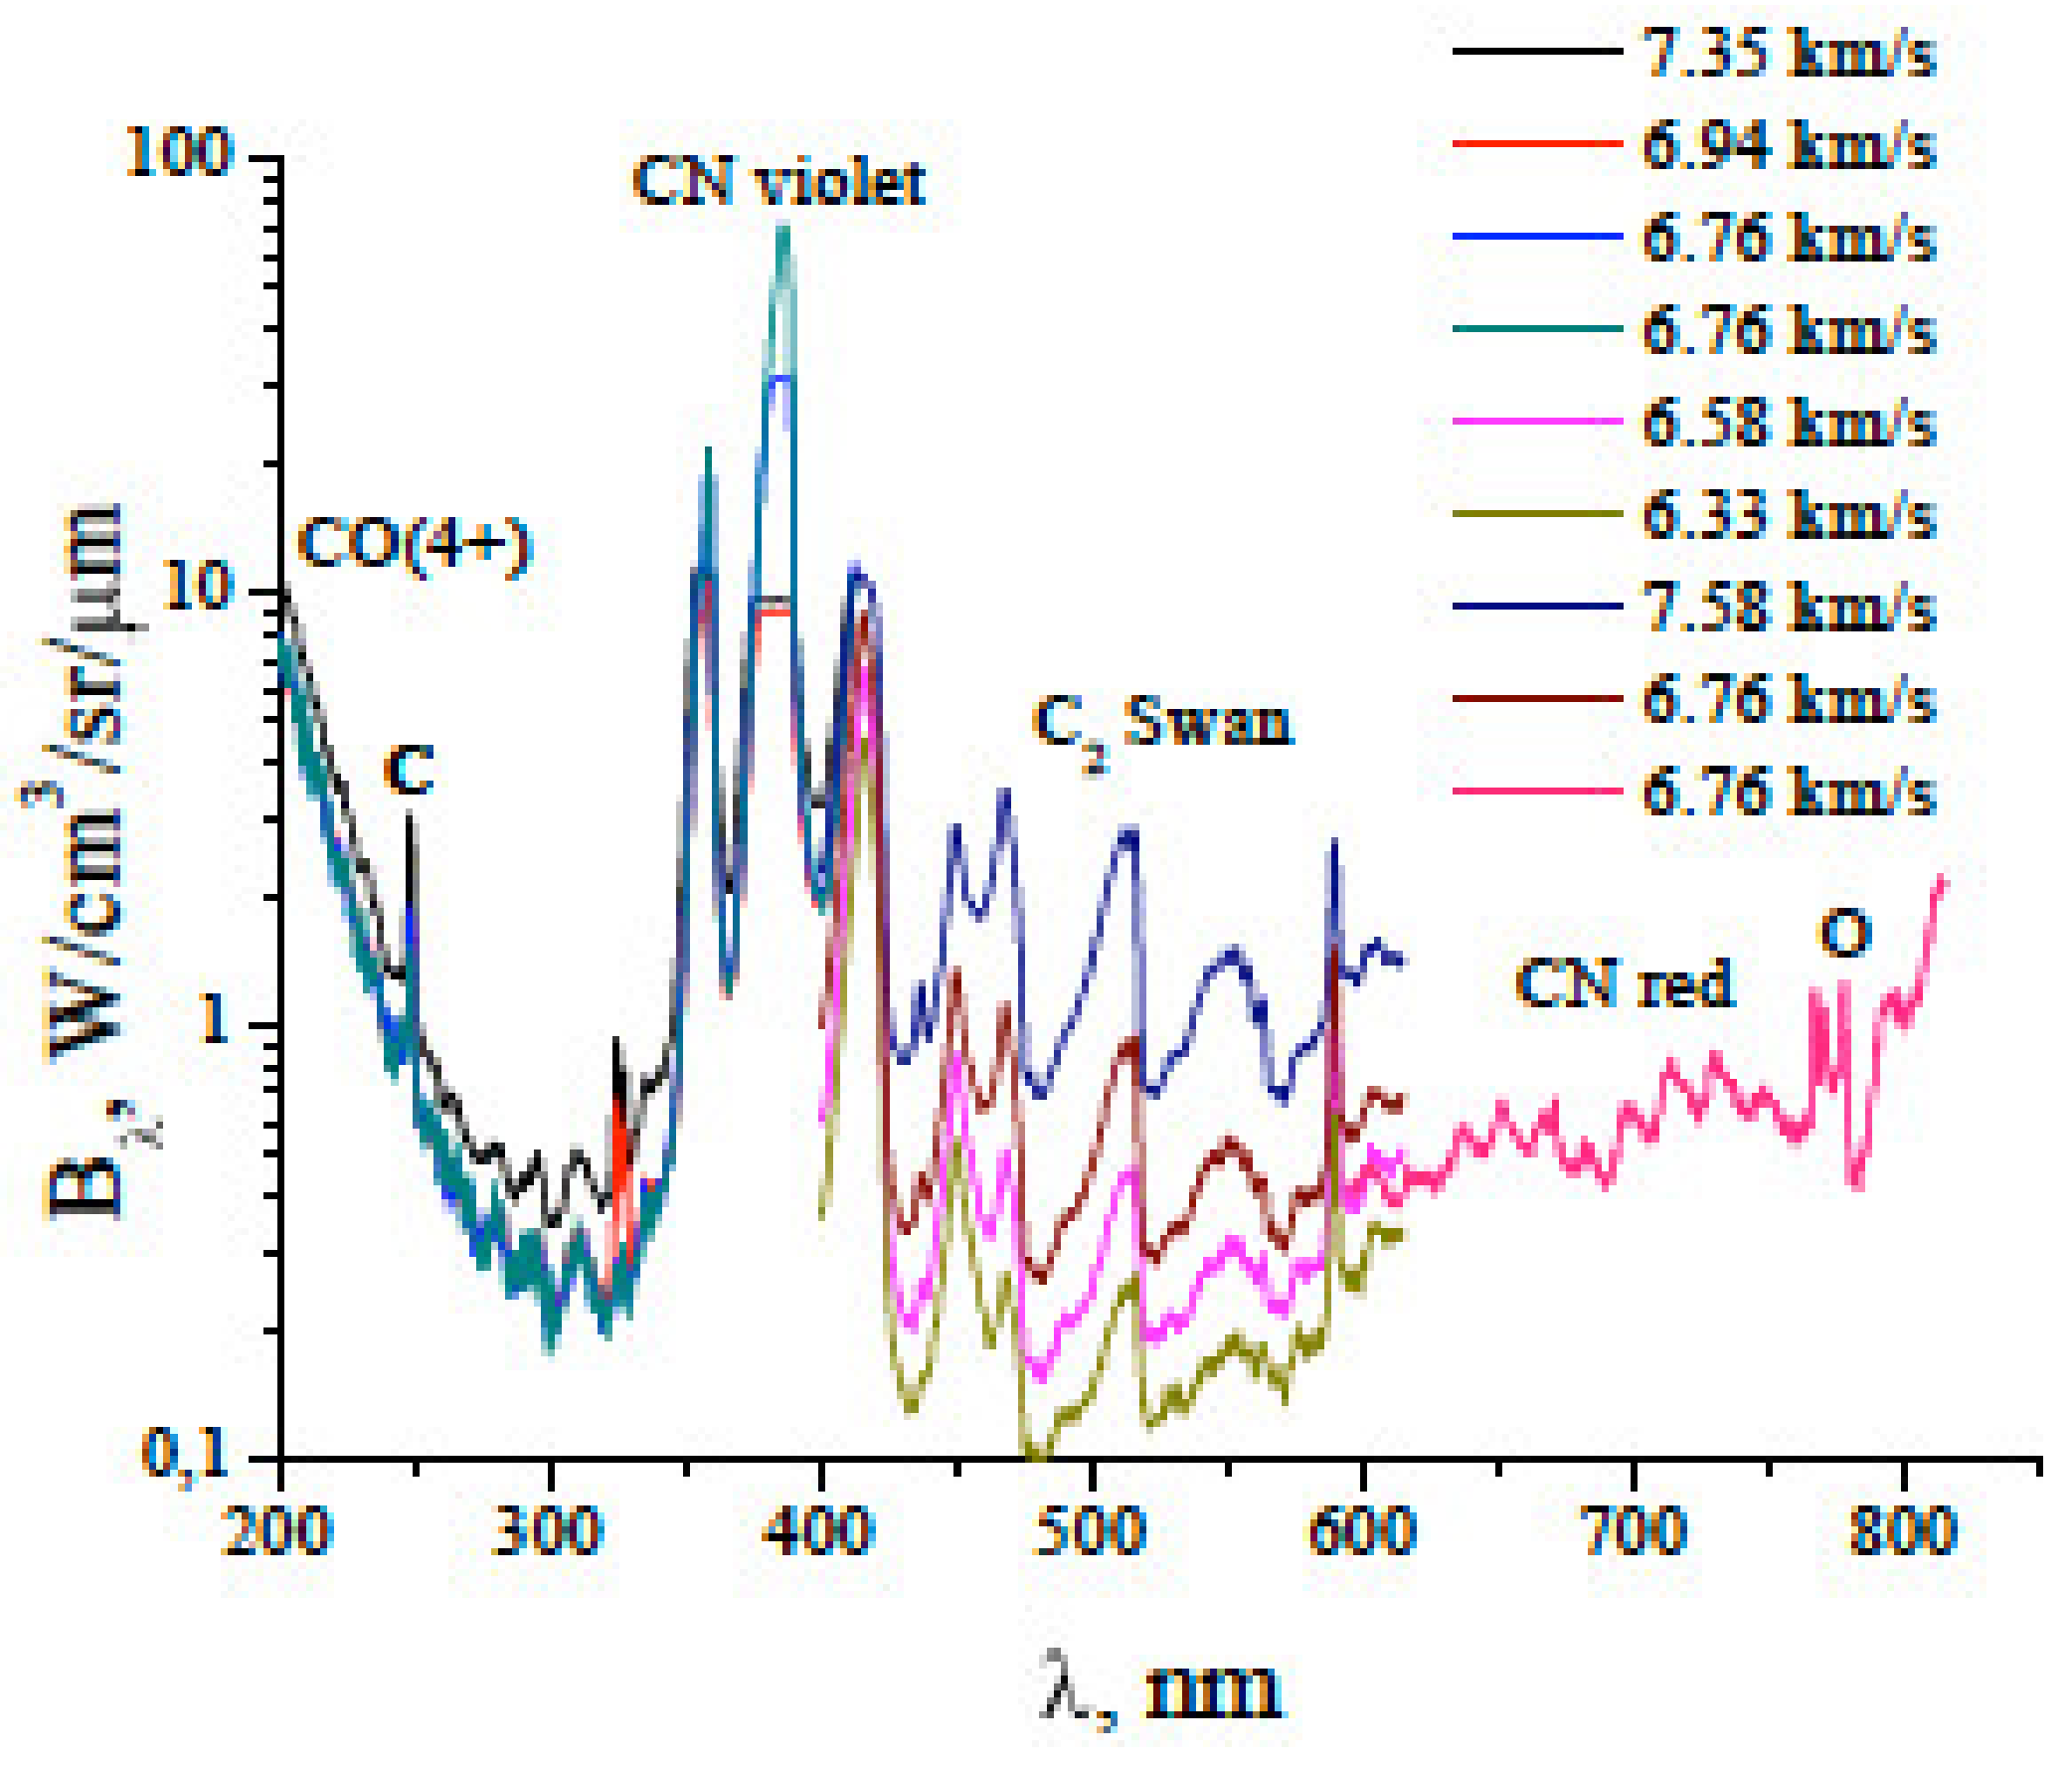
A double diaphragm shock-tube is available at the Moscow State University (MSU). CO2-N2 mixture (70%-30%) at high velocity has been investigated by Kozlov et al. [51]. Two test conditions have been studied, at shock speeds of 4.6–5.8 km/s and 1 Torr (133 Pa), and 6.3–7.6 km/s and 0.3 Torr (40 Pa). Spectroscopic measurements were focused on 200–850 nm wavelength range. For both conditions, molecular radiation of CN Violet, NO, and CO was observed. C2 Swan emission was only observed for velocities higher than 6.3 km/s, and atomic oxygen triplet only at shock speeds higher than 6 km/s. Figure 47 displays the experimental data obtained at 0.3 Torr, this highlights the presence of CO(4+) and CN Violet systems at the high velocities. Some of the tests have been numerically reconstructed in [5], the predictions were able to reproduce the experimental trends and were in the experimental margins of accuracy.
5.4.8. TCM2
Test campaigns related to Mars entry have been conducted in TCM2 in the frame of ESA TRP activities [52,53], and of the Ph. D. thesis of D. Ramjaun [54]. This facility was a free piston shock-tube located in Marseilles (France). Some of the conditions are reported in Table 5. This facility has been extensively used for radiation and thermo-chemistry studies related to Earth, Mars and Titan entries. It has provided the major part of the results produced in Western Europe on these topics until its closure.
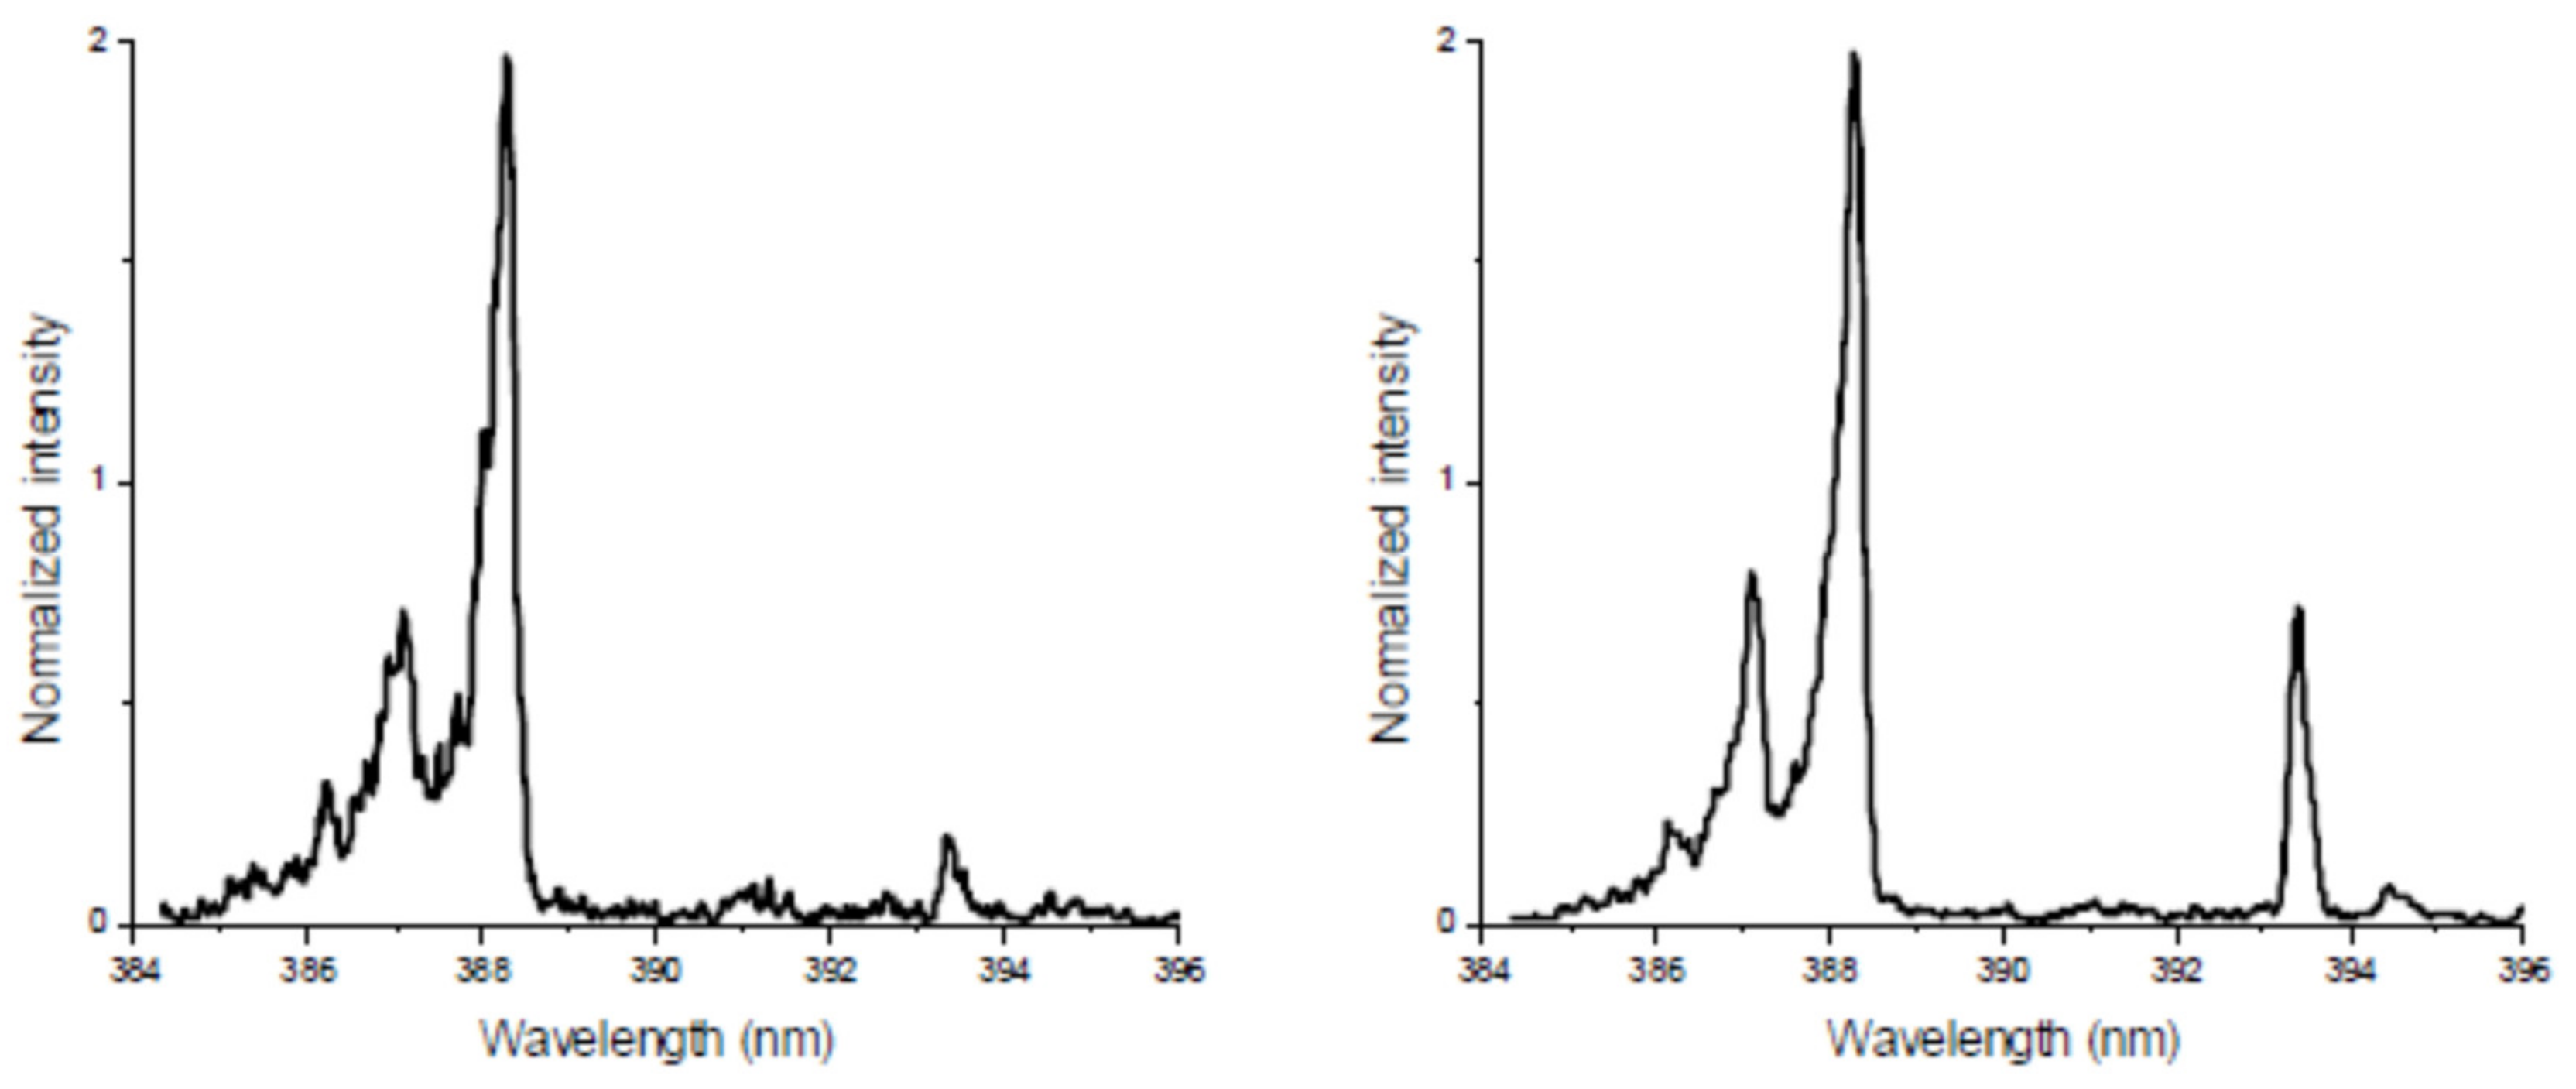
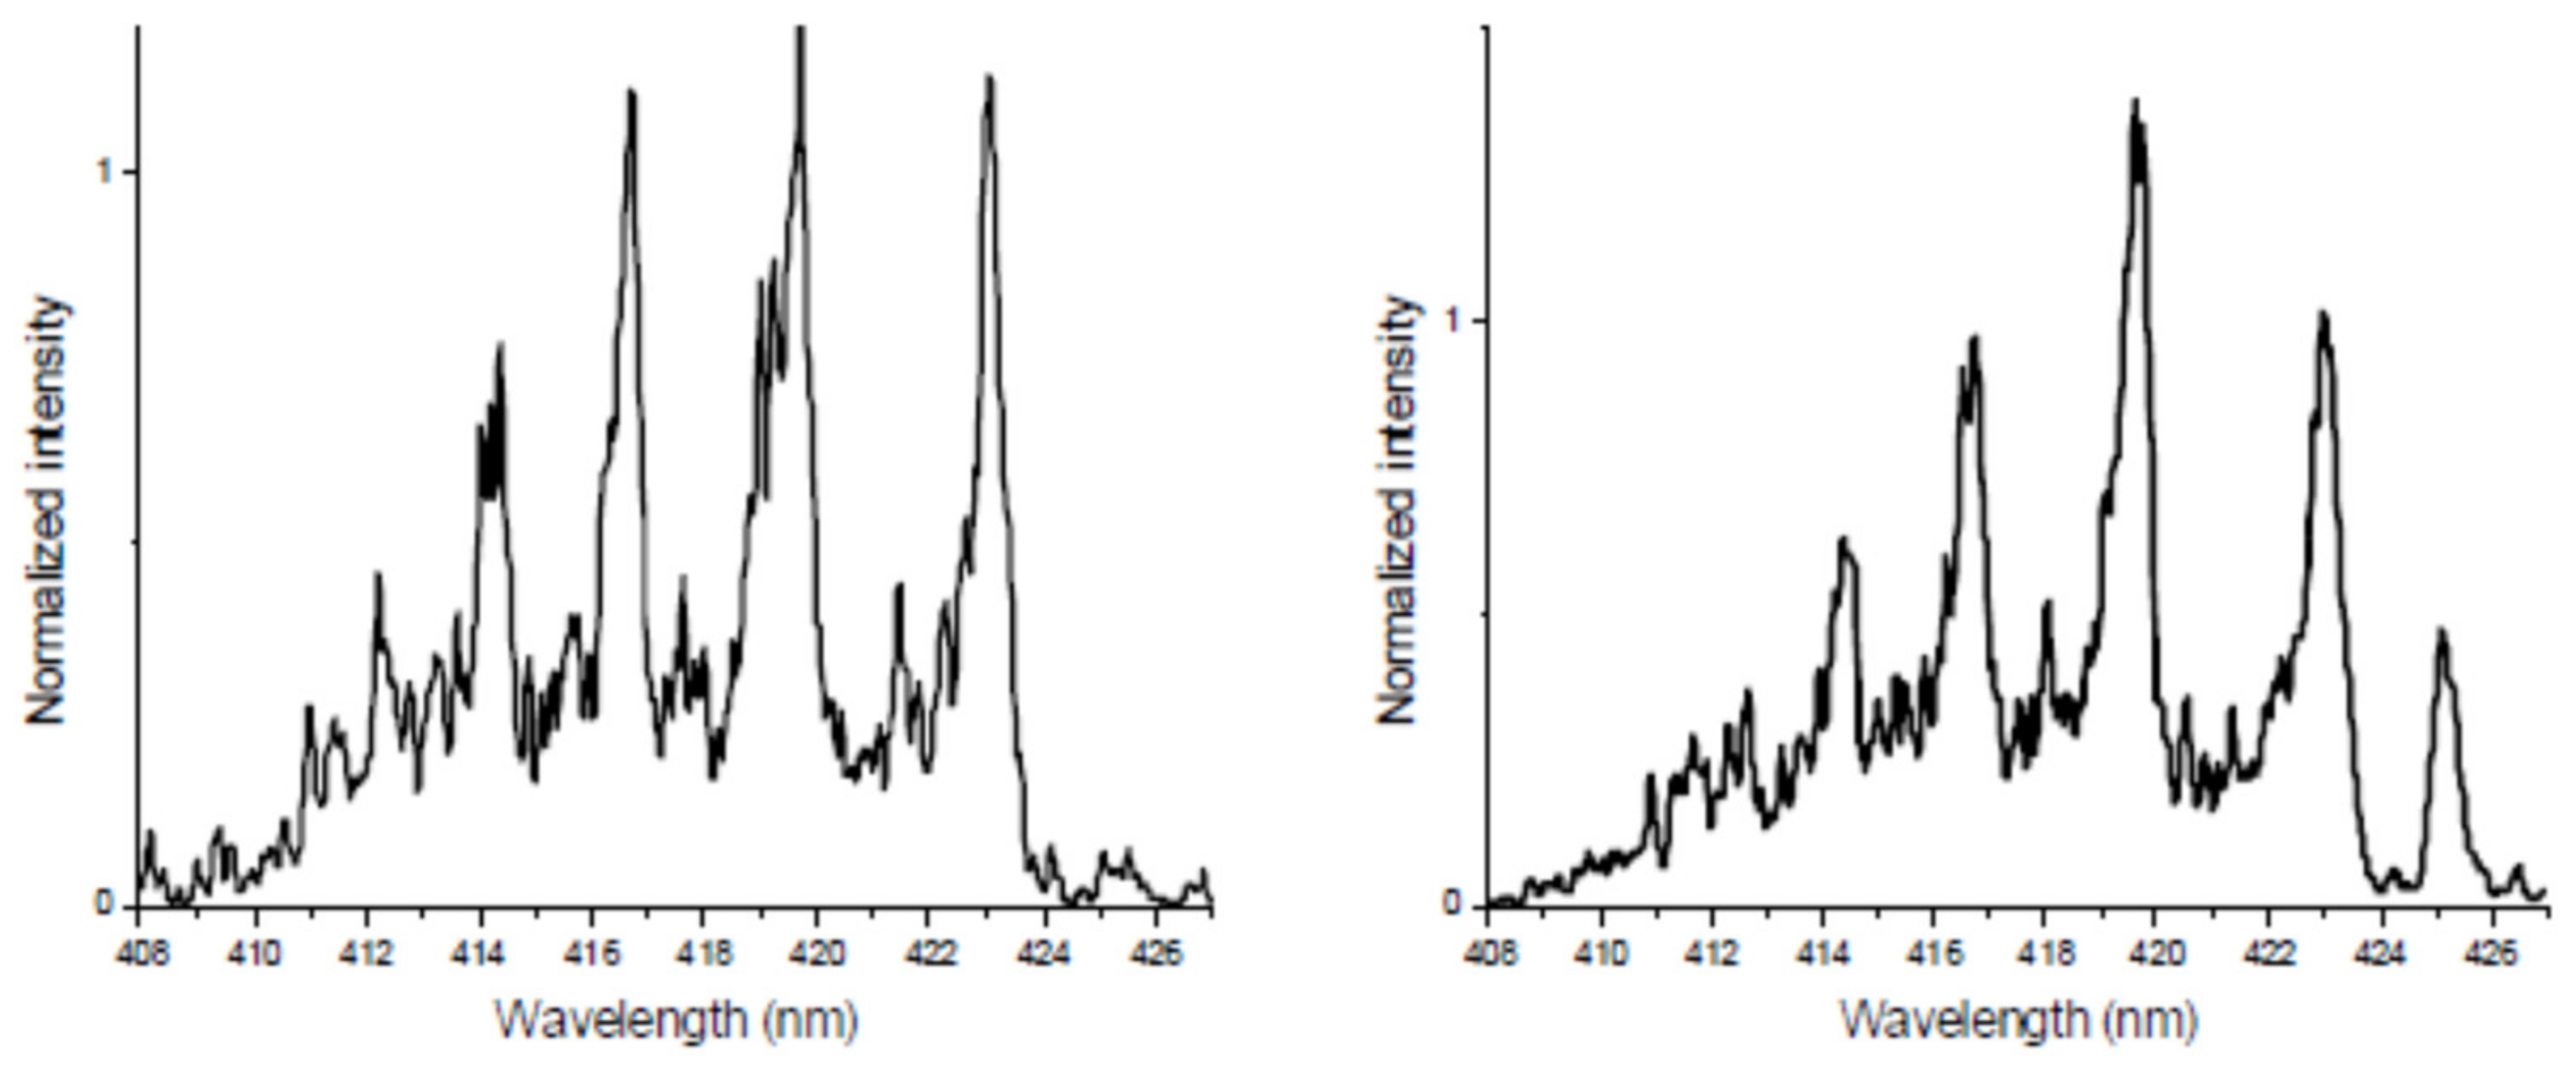
Tests carried out in the frame of [52] cover a pressure range from 0.75 up to 82.7 Torr (100 up to 1100 Pa), and a velocity range from 4.3 up to 6.25 km/s. Available data with radiation spectra of CN Violet and CO Angström systems, temperature measurements were obtained in [52] for the Cases 3 and 4 of Table 5. The objective of this study was to investigate CN violet system that was expected to be the main radiator in the near UV and visible wavelength range (although CO(4+) is the largest radiator overall) and it was observed for its Δv = 0 and Δv = −1 bands. CO Angström was also expected to take a non-negligible part of the radiation emission.
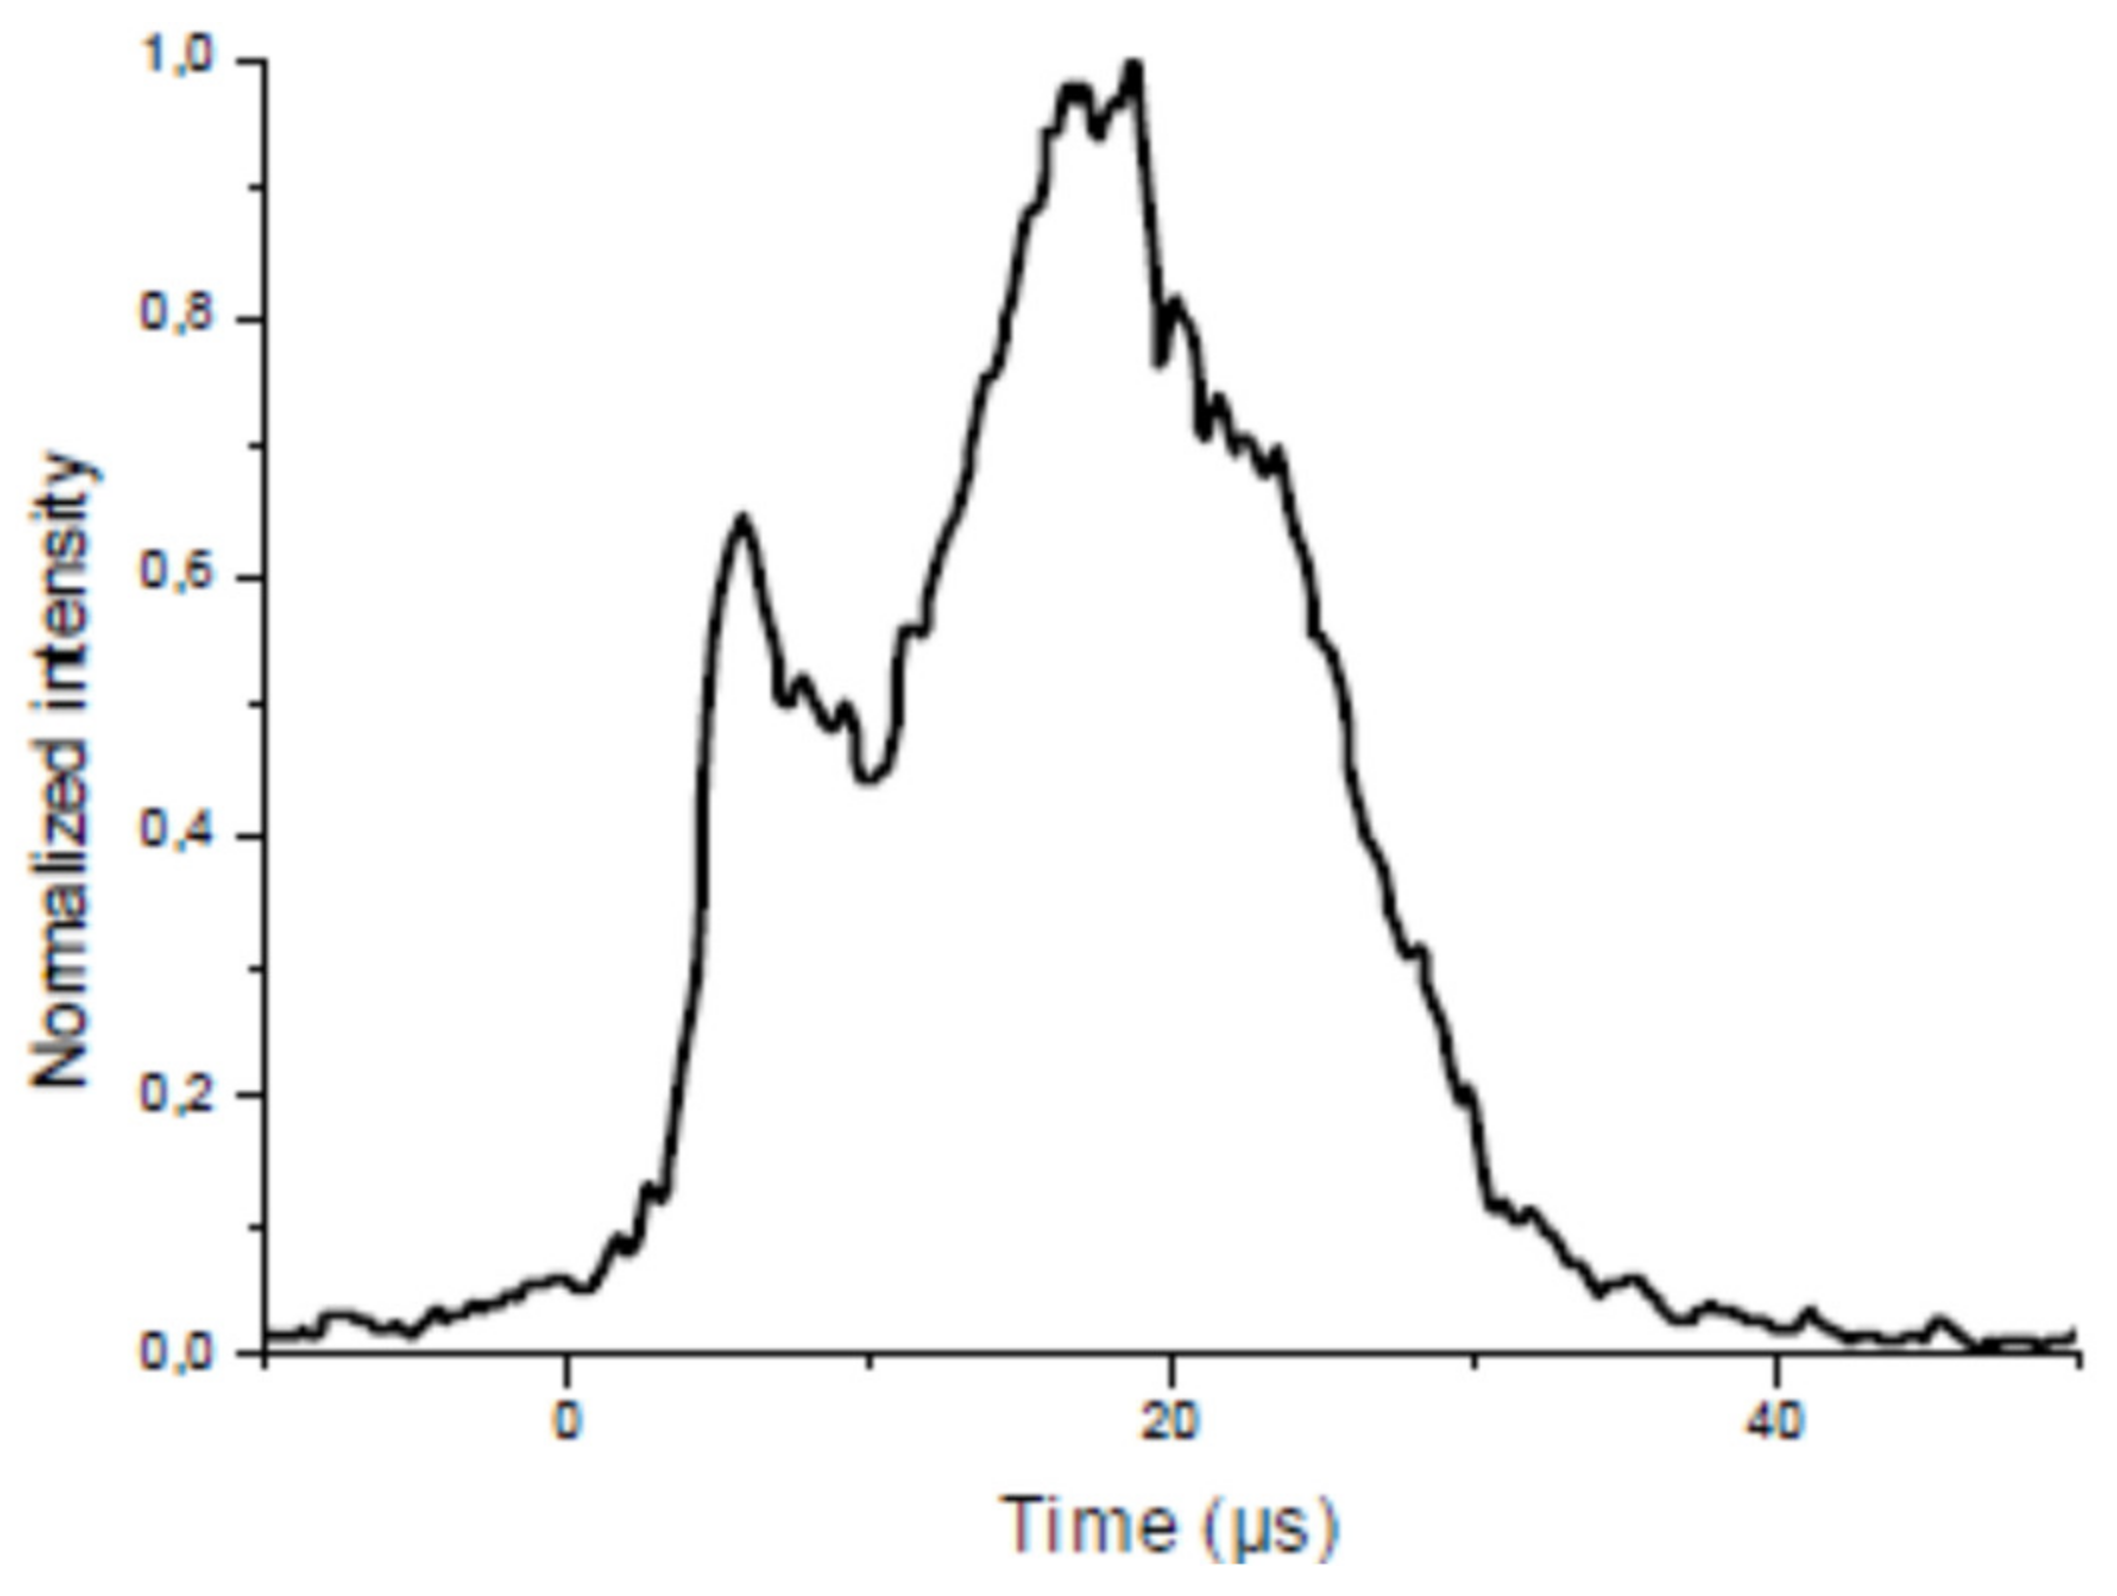
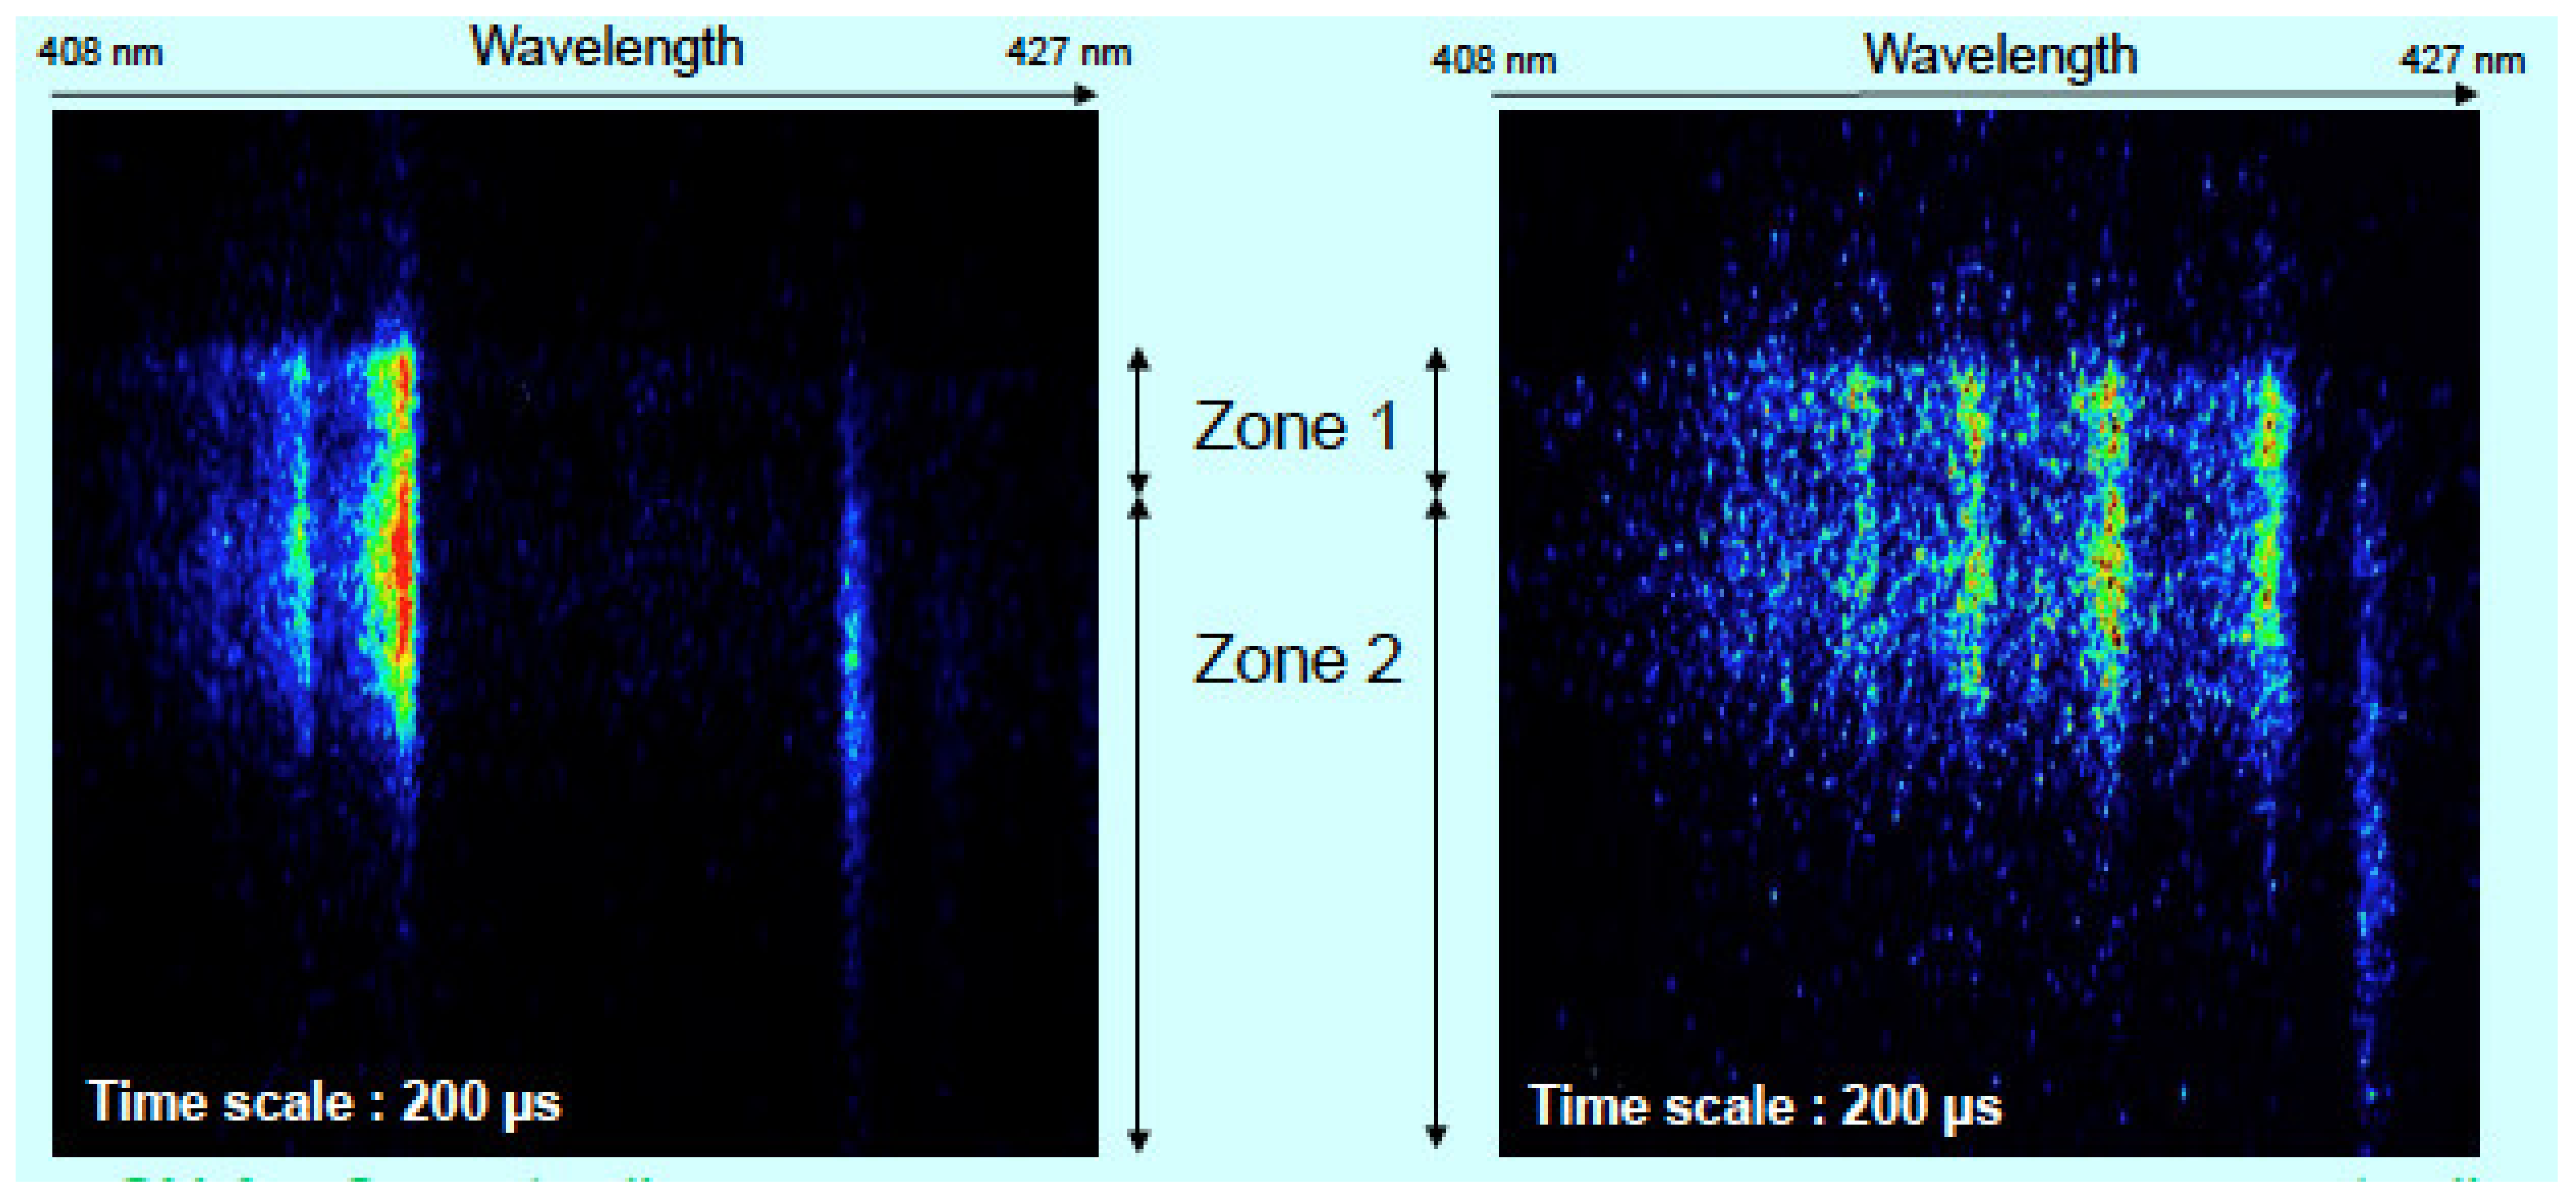
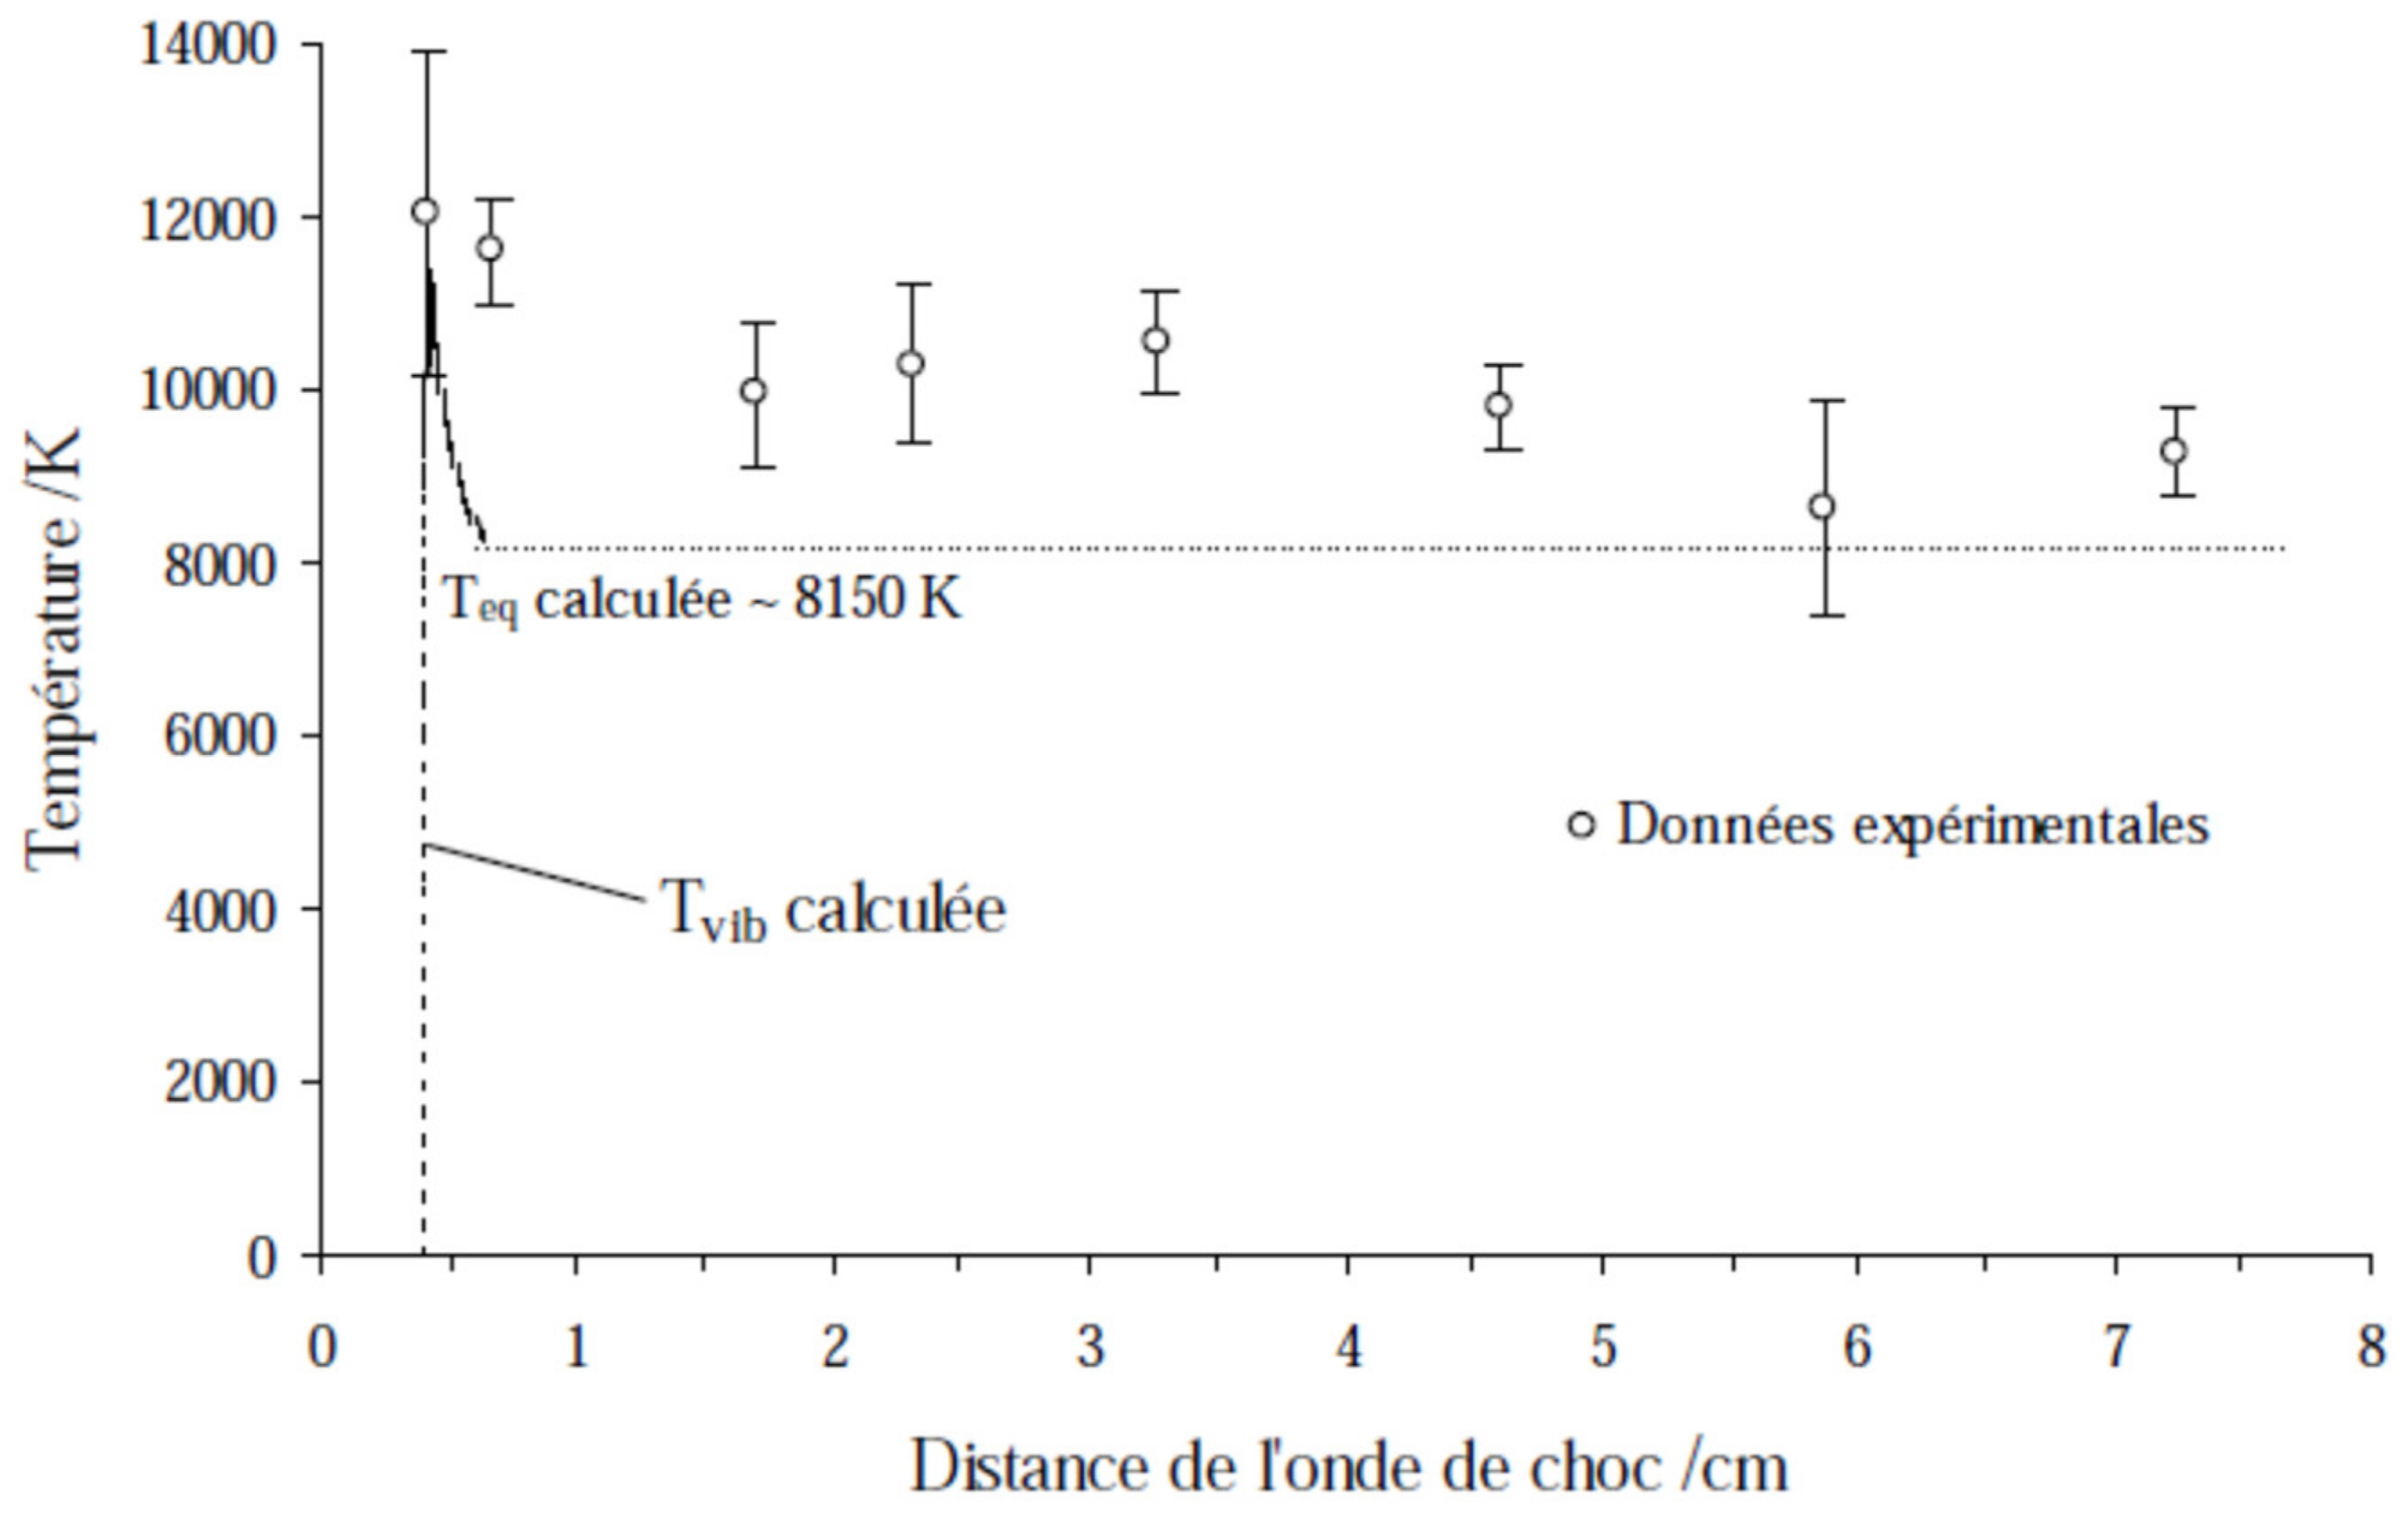
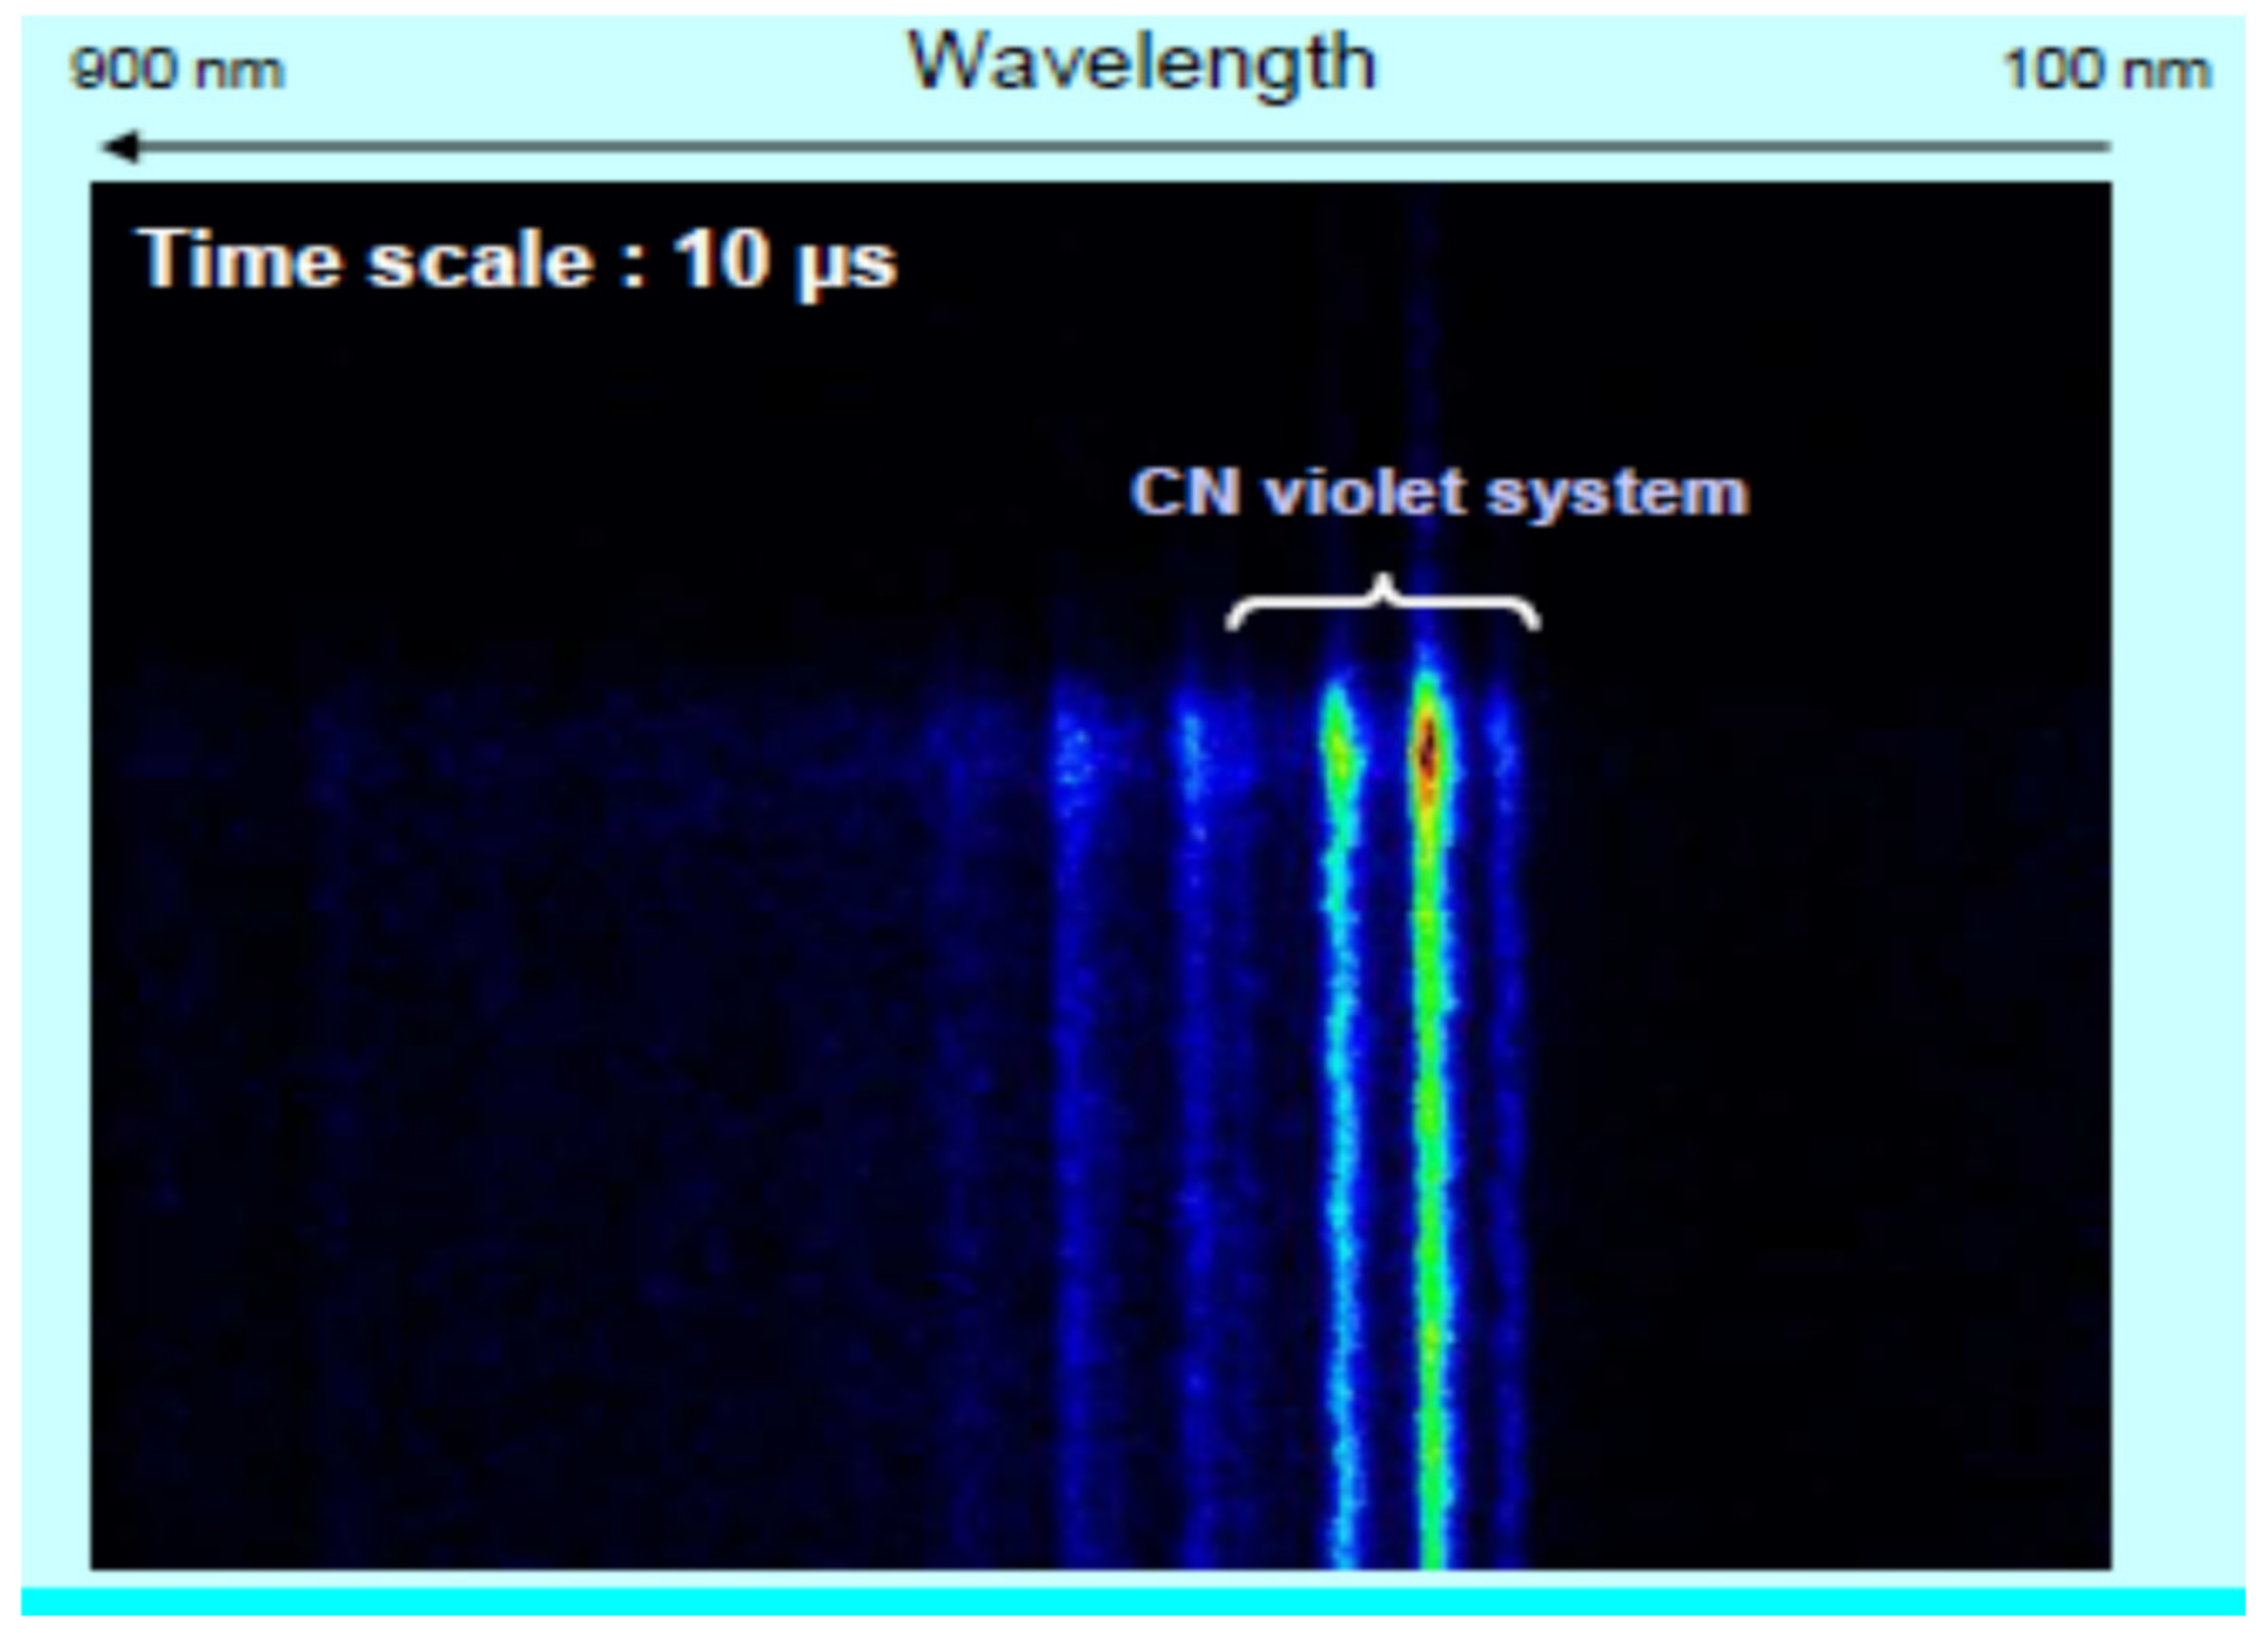
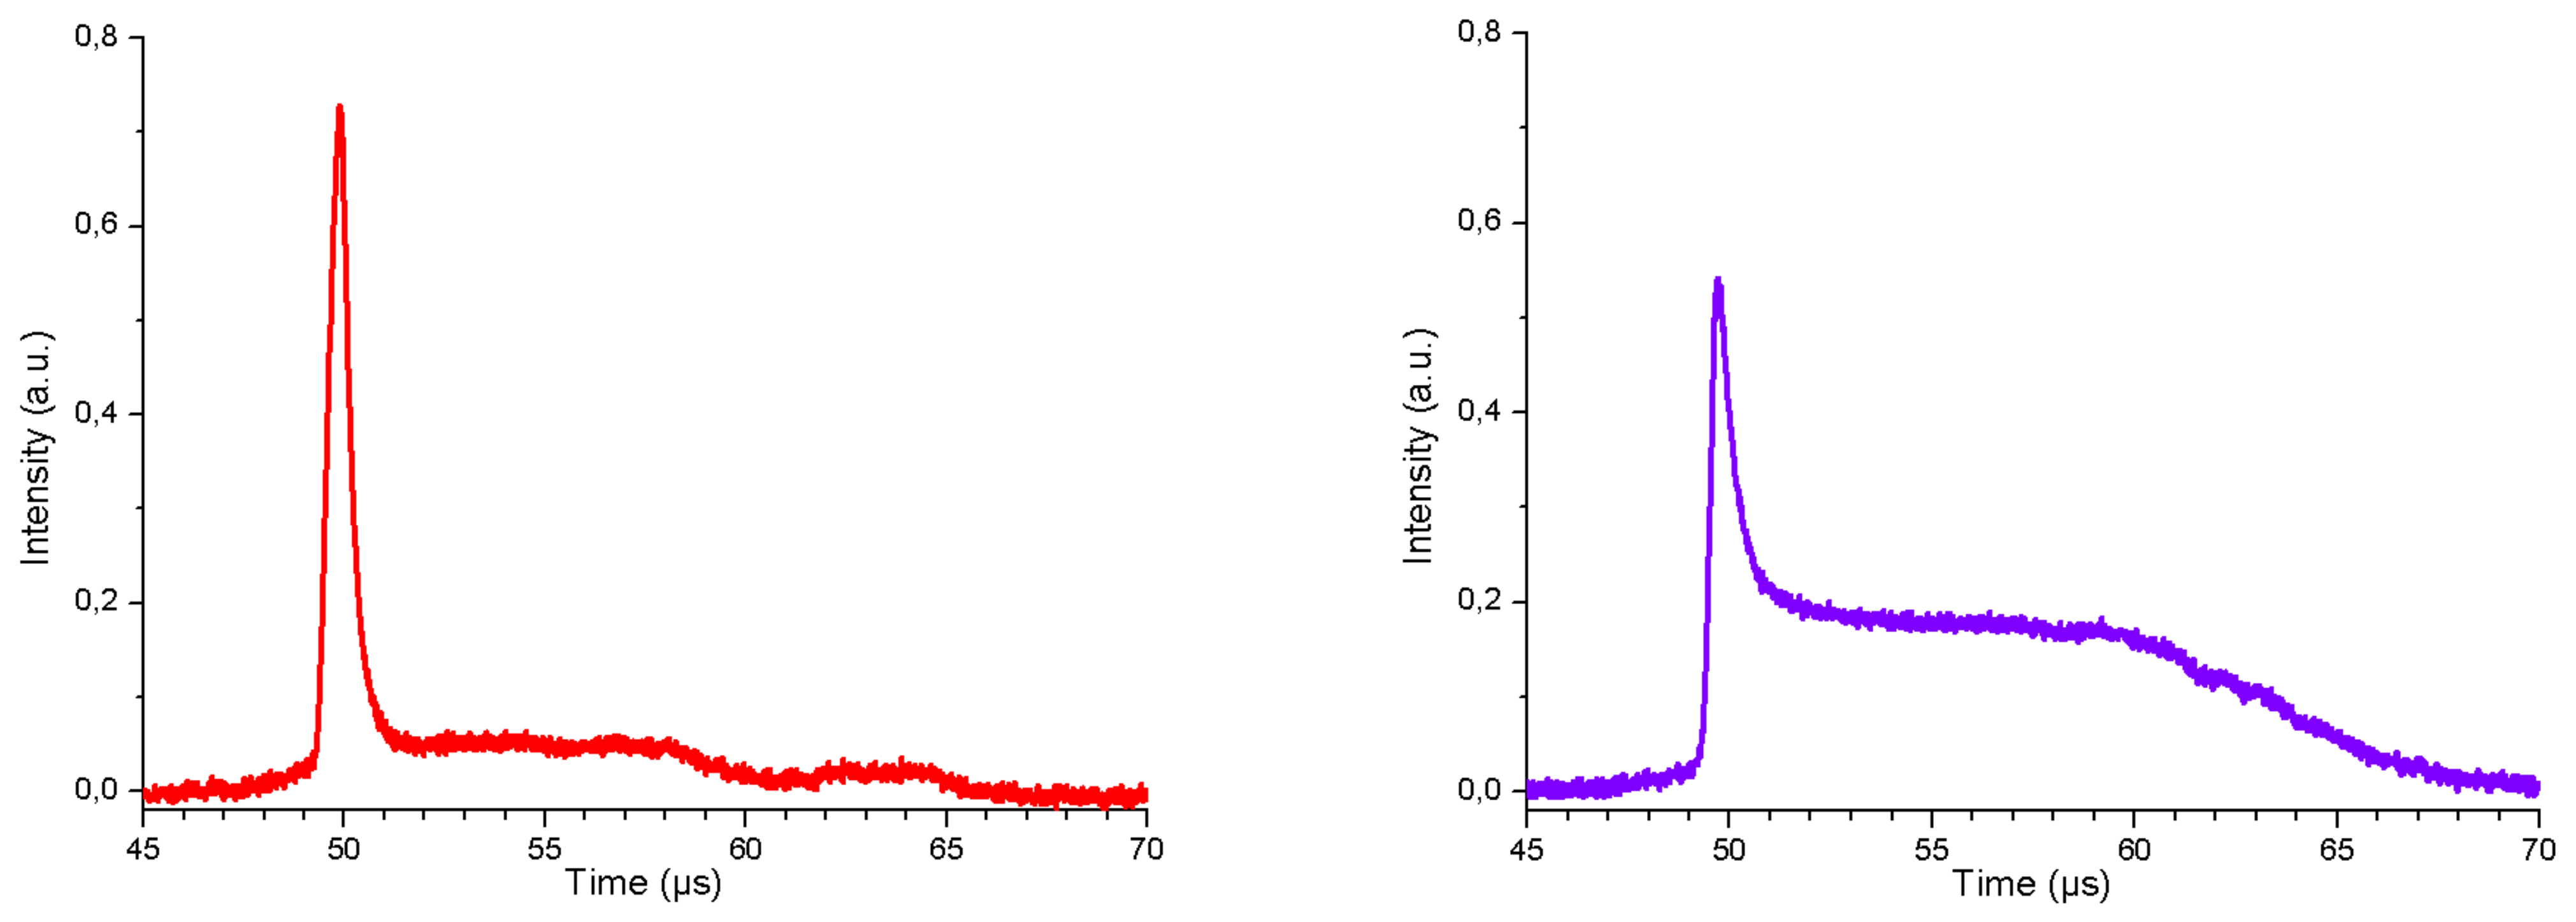
Time profile for CN violet is plotted in Figure 48, while the spectra of radiation intensity as function of wavelength for Δv = 0 and Δv = −1 bands are shown in Figure 49 and Figure 50 respectively. Two areas (Zones 1 and 2 as shown in Figure 51) had to be taken into account separately for the spectral study. The temperatures are different between these two zones due to the difference in radiation intensity. For Case 3 (of Table 5), in Zone 1, vibrational and rotational temperatures were 2100 and 6000 K respectively, while their values are 2500 and 5500 K in Zone 2 [52]. The use of a broadband spectrometer showed that, the CO Angström emission was very weak compared to CN violet emission in the experimental conditions retained for the study. Recording CO Angström emission was made by sending more light in the streak system and then by decreasing the spectral resolution of the measurements. According to [52], these reasons explain why the spectra analysis was difficult (due to the lack of resolution), however the time evolution extracted from the image shows, as for CN violet, two successive excitations. This trend has not been found for similar tests in other facilities, this could be due to possible contamination from Ca, since Figure 49 (Right) exhibits a strong emission in the vicinity of 393.5 nm, consistent with emission from Ca+.
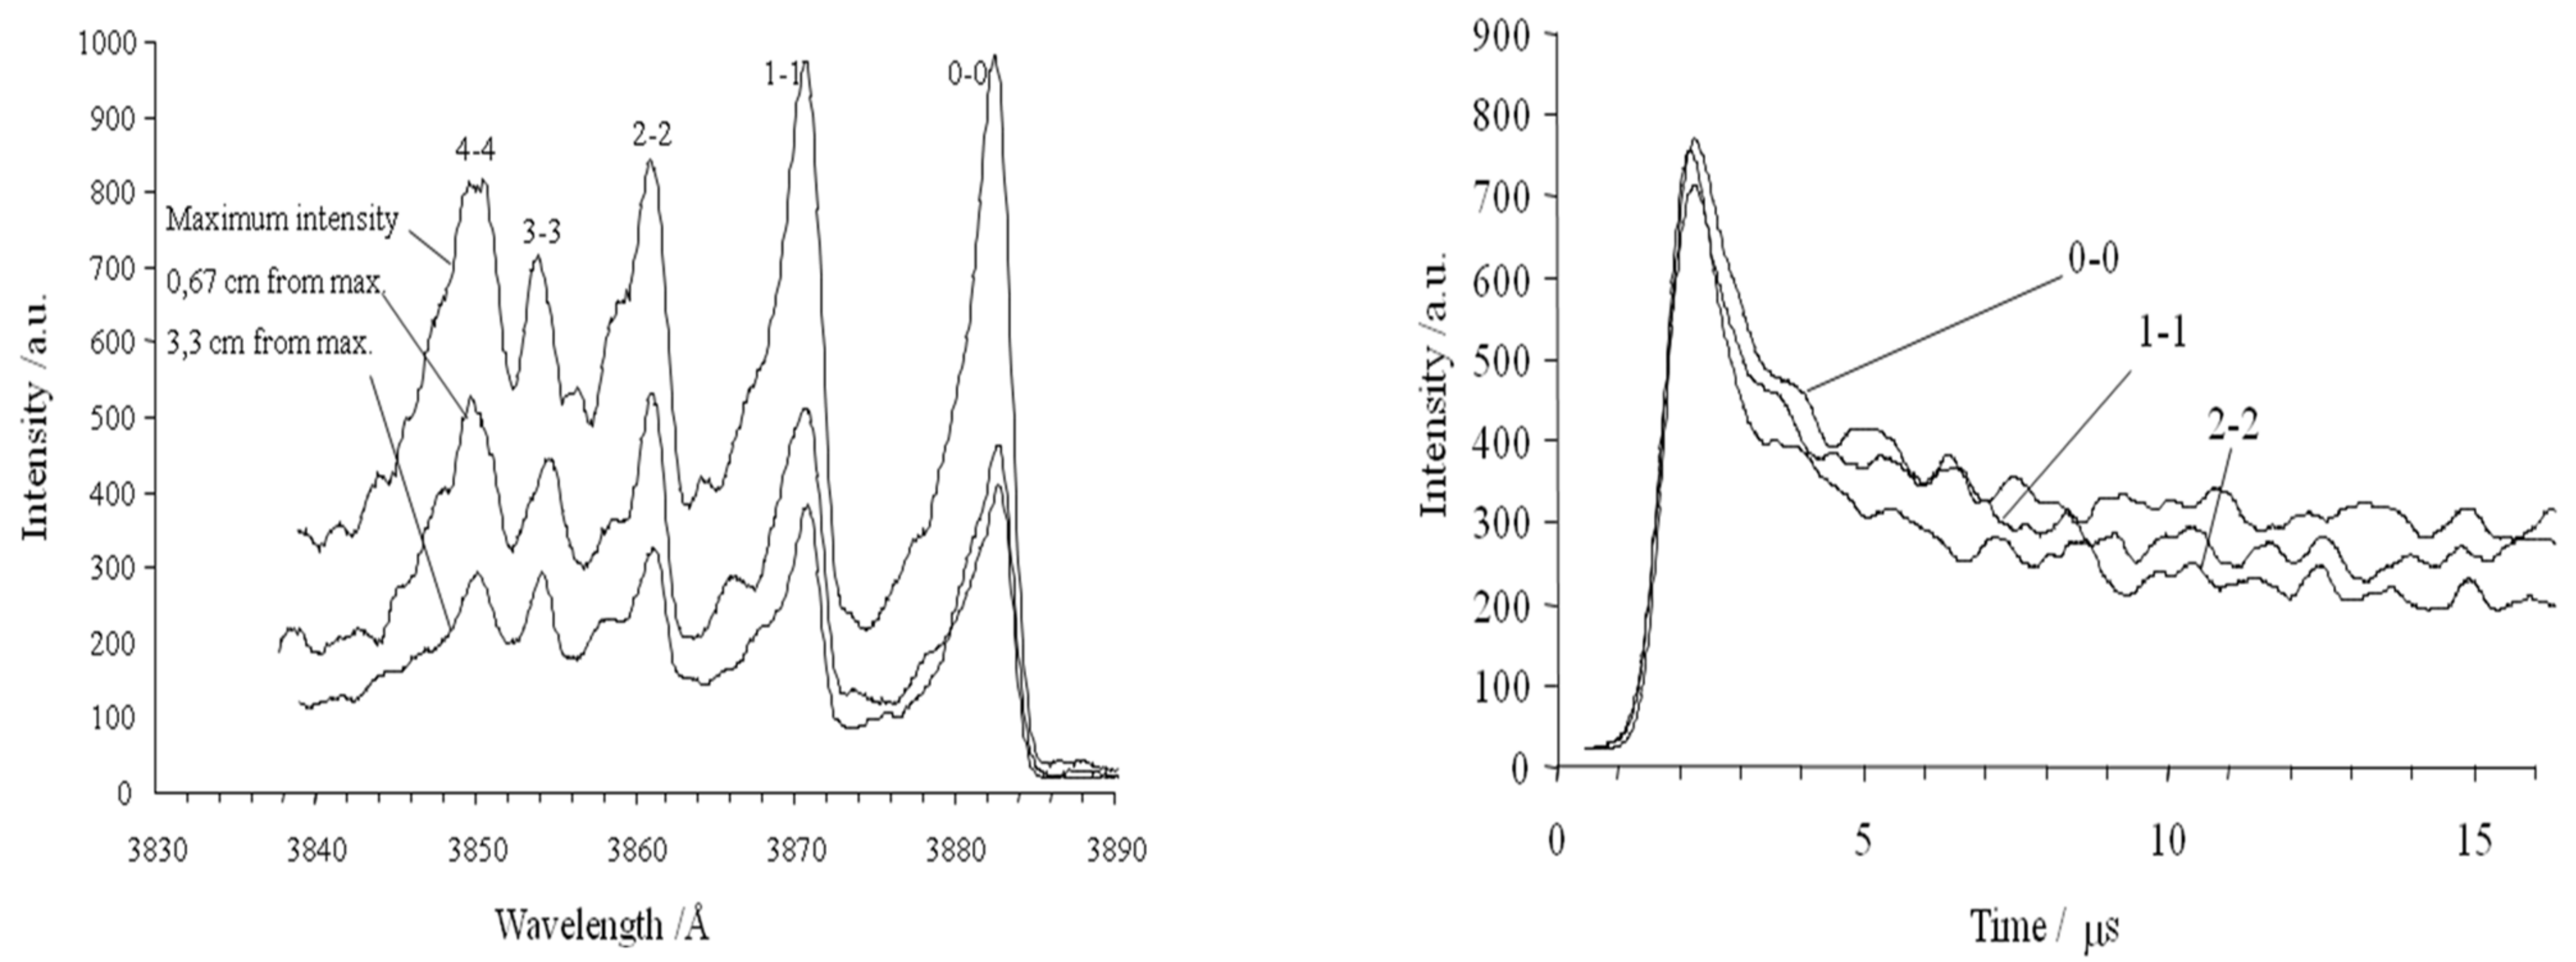
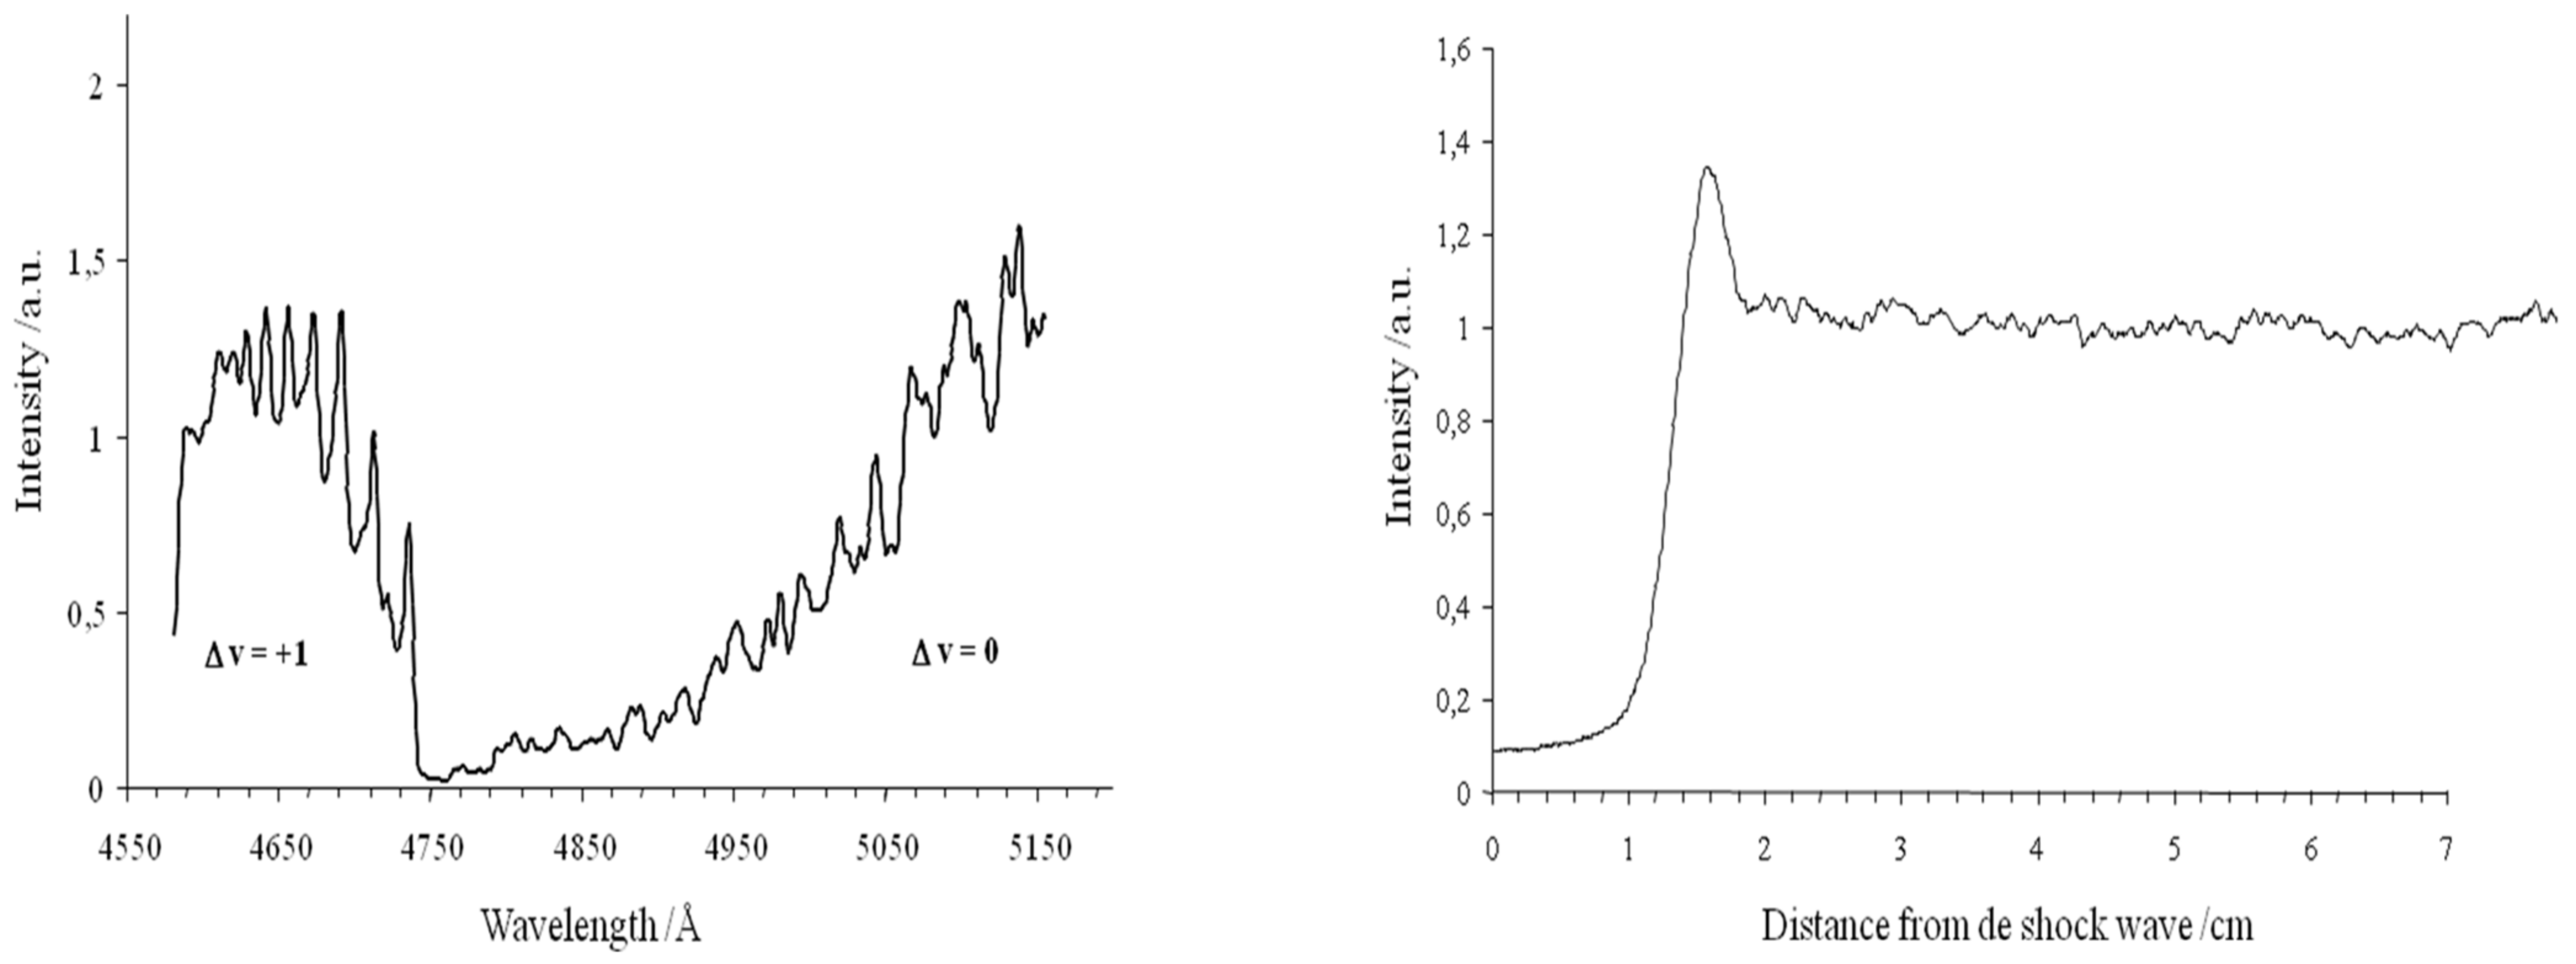
For this study [52], time average temperatures were measured. If rotational temperatures were high enough (about 6000 K), vibrational temperatures were only estimated at about 2500 K. For Case 1 of Table 5, spectra of CN violet and time profile of emission intensity [54] shown in Figure 52 are available. The vibrational temperature has been also measured for Case 1 of Table 5 [54] and corresponding results are plotted in Figure 53. For the Case 2 with pure CO the objective was to investigate the C2 Swan bands. Available spectra and time profile of emission intensity are shown in Figure 54.
5.4.9. MIPT VUT-1
In the frame of ESA TRP activities, test campaigns have been carried out in VUT-1 shock-tube (located in Moscow) at MIPT [52,55] for Mars-like atmosphere. Other campaigns were conducted in the same facility in the frame of the ISTC programme [56]. For ESA activities, tests were conducted for the conditions resumed in Table 6. Several mixtures have been investigated they are listed hereafter:
- 90% Ar, 9.7% CO2, 0.3% N2;
- 50% Ar, 48.5% CO2, 1.5% N2;
- 50% Ar, 49% CO, 1% N2;
- 97% CO2, 3% N2;
- 98% CO, 2% N2;
- 70% CO, 30% N2.

Table 6.
Tests carried out in VUT-1 for Mars entry.
| Case | Velocity (km/s) | Pressure (Torr) | Mixture |
|---|---|---|---|
| 1 | 6.27 | 1.59 | 30% [N2], 70% [CO2] |
| 2 | 6 | 1.42 | 48.5% [CO2], 1.5% [N2], 50% [Ar] |
| 3 | 7.49 | 0.1 | 0.3% [N2], 9.7% [CO2] 90% [Ar] |
| 4 | 7.06 | 0.6 | 3% [N2], 97% [CO2] |
| 5 | 6.5 | 1.32 | 30% [N2], 70% [CO] |
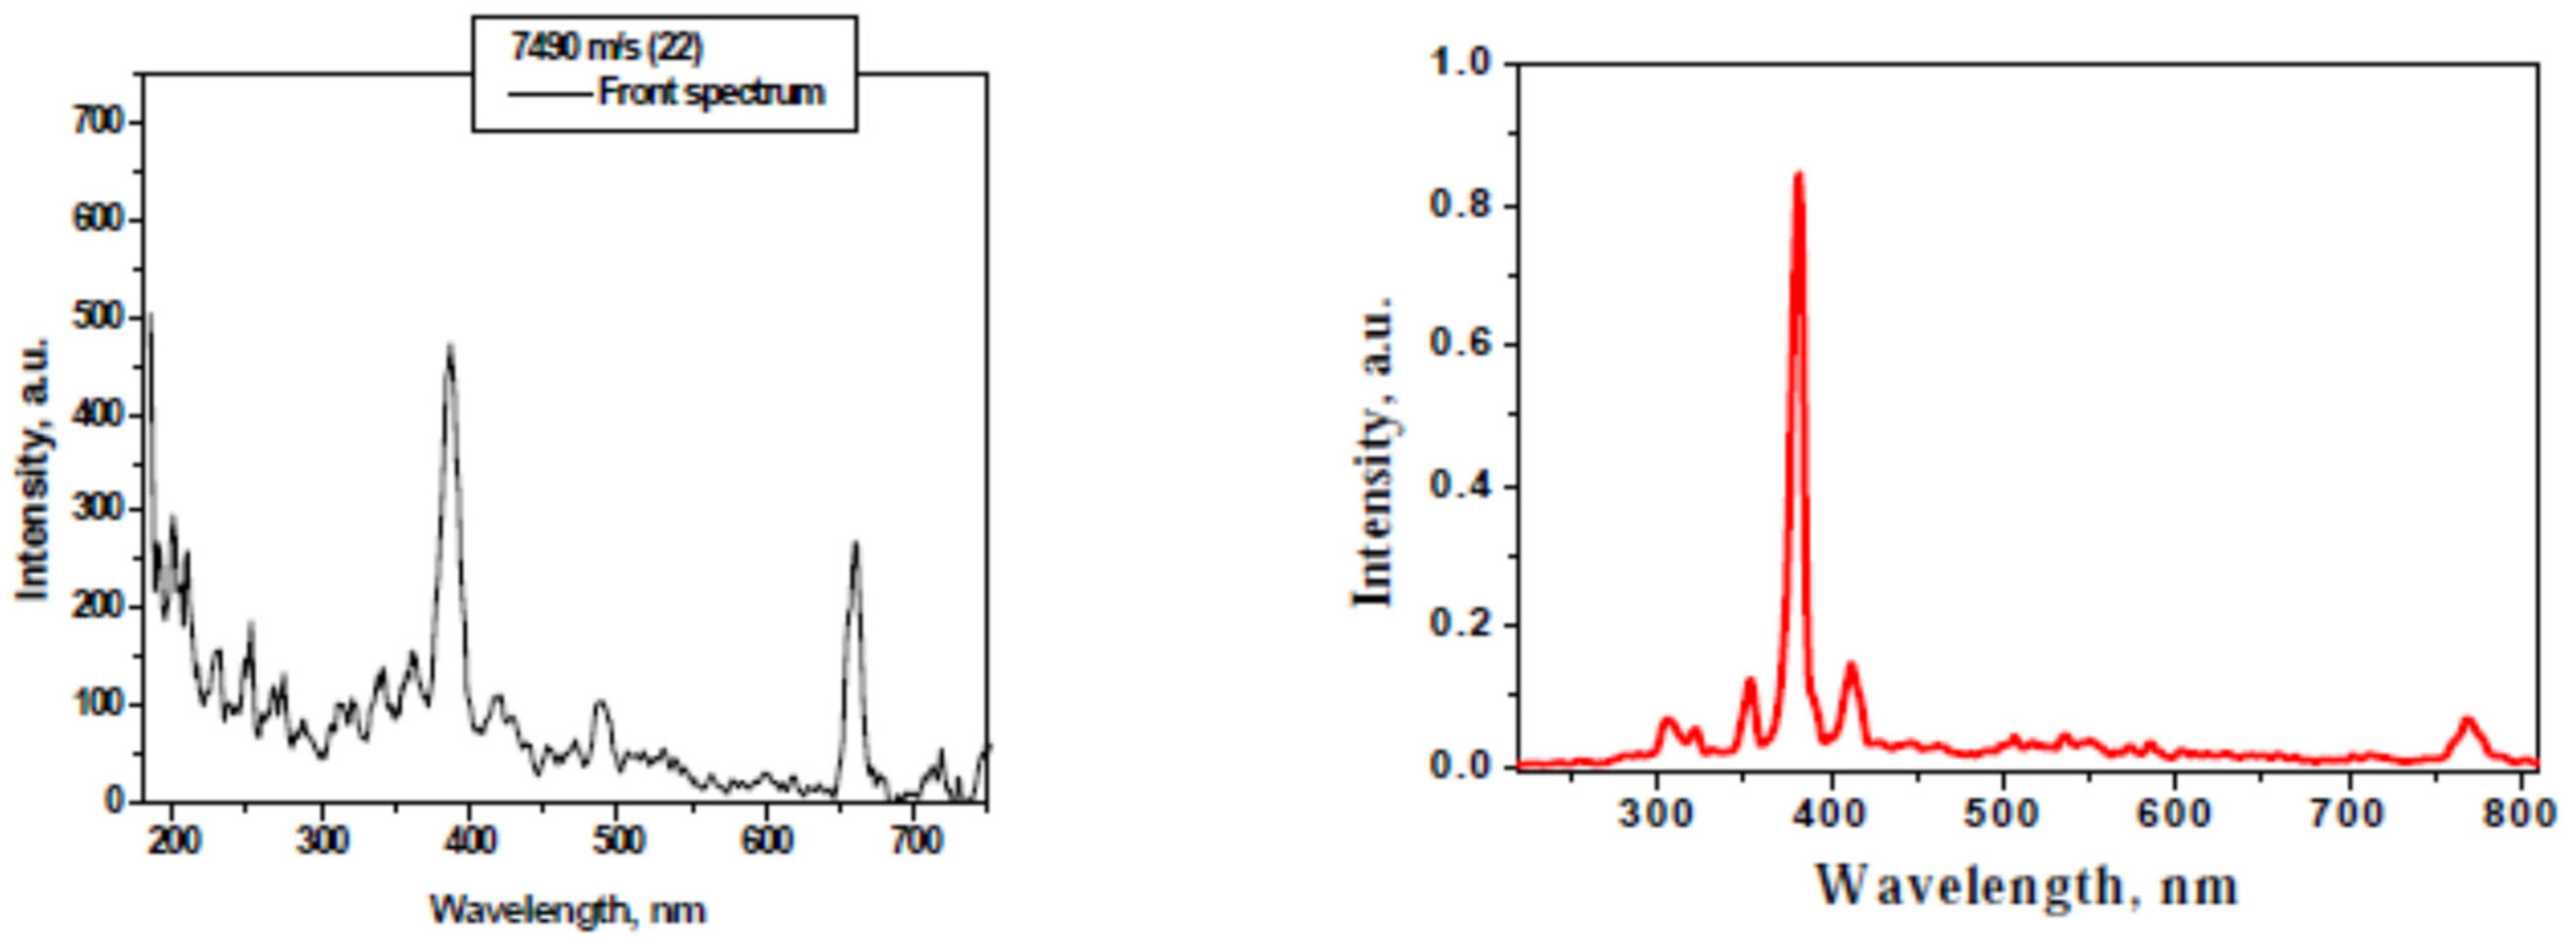
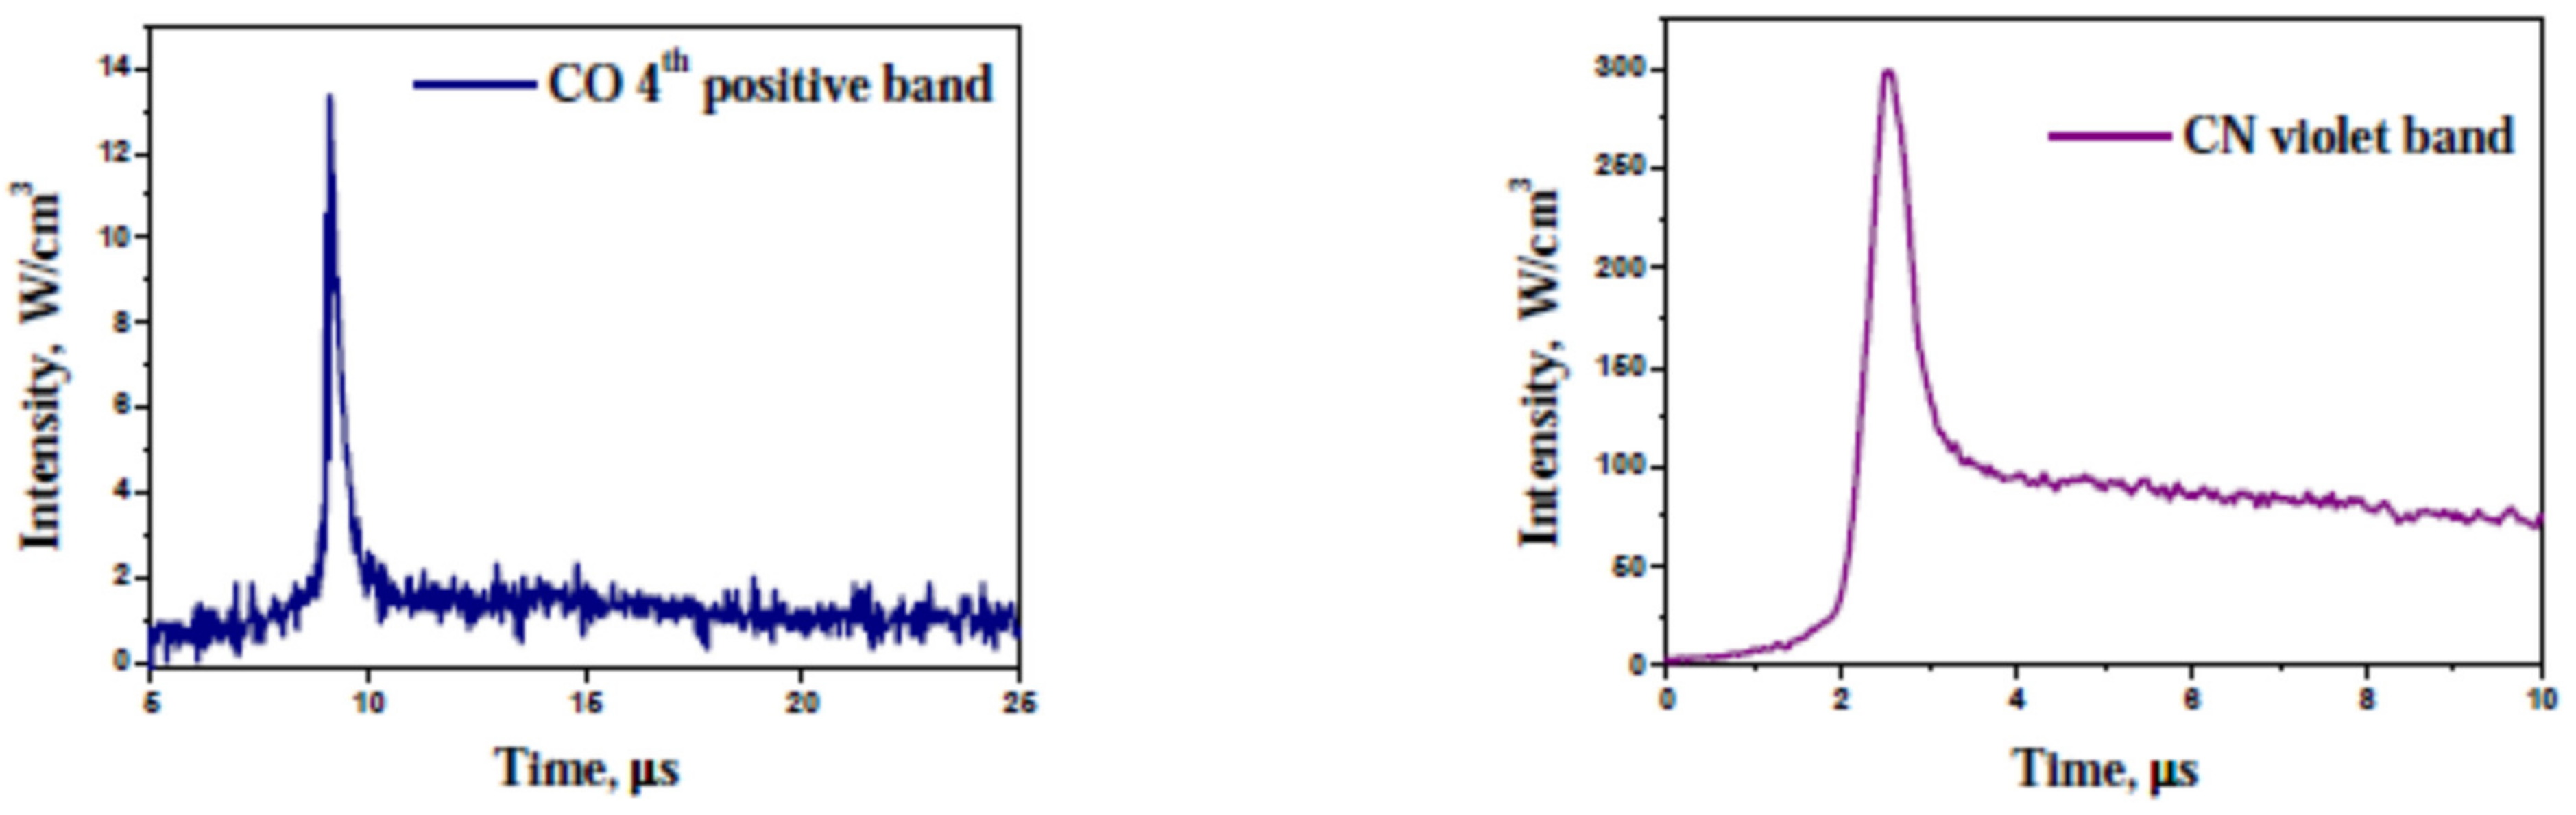
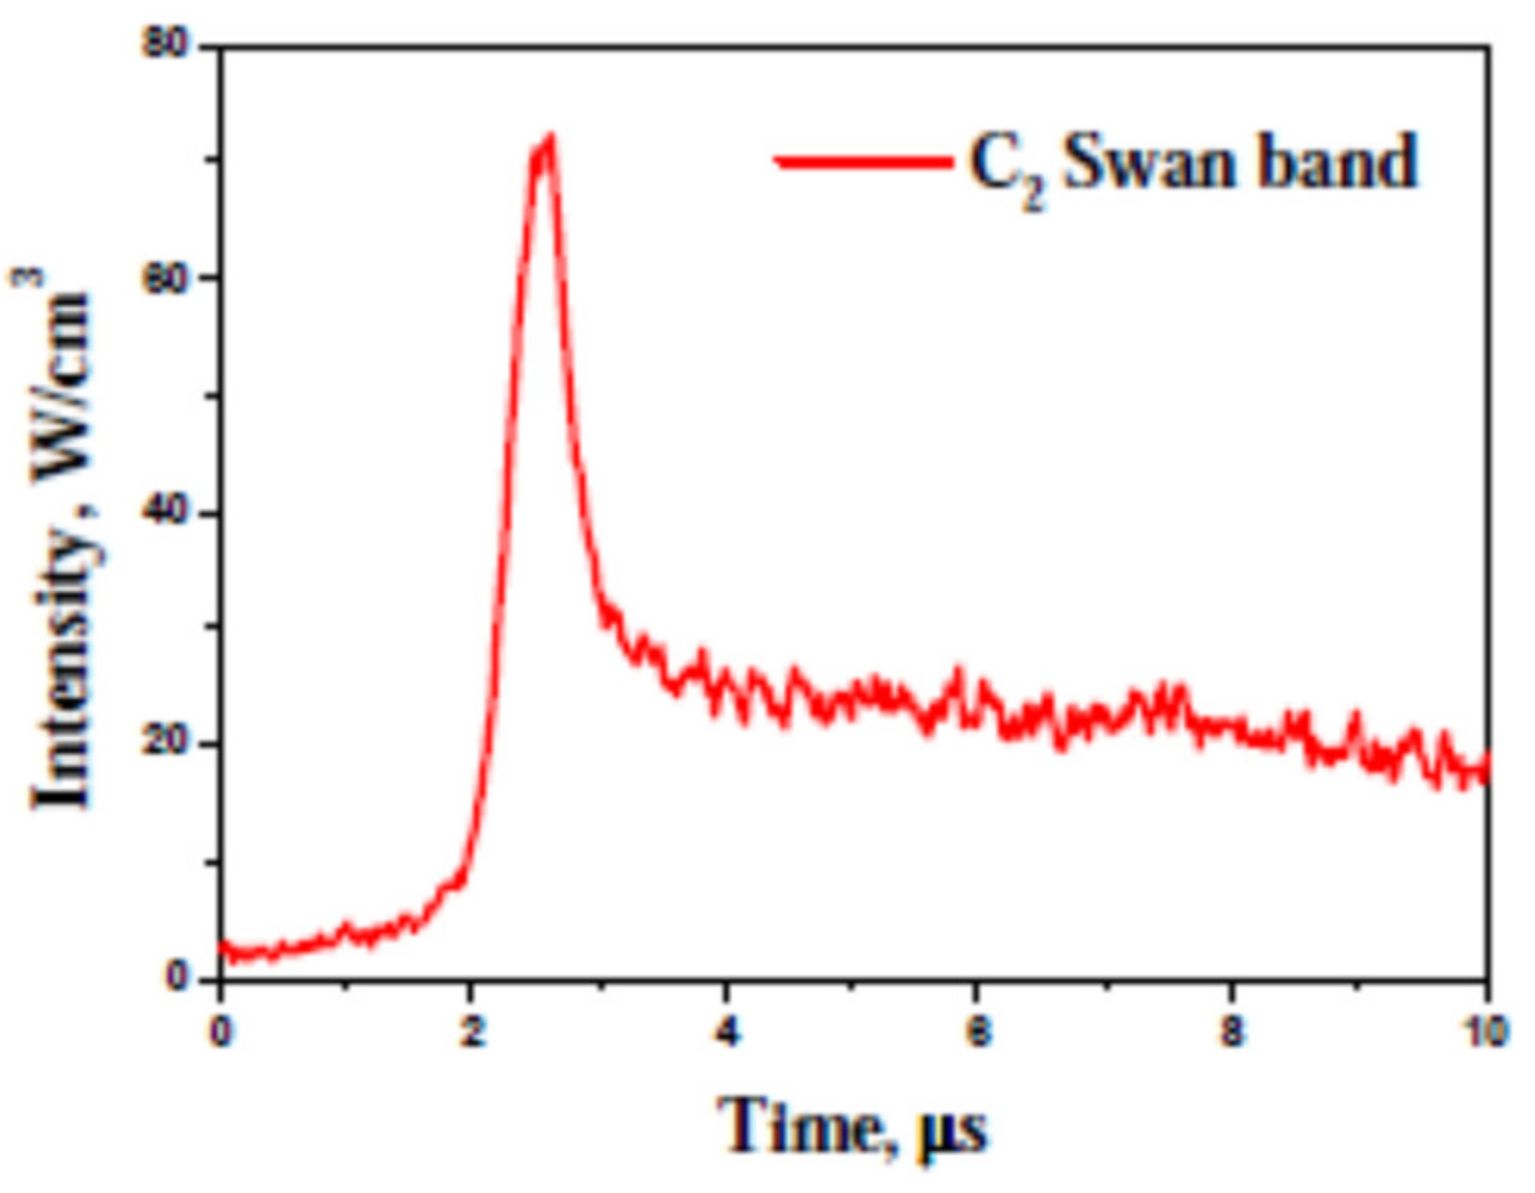
Most of these different campaigns was focused on investigating radiation into Mars atmosphere for CO(4+), CN violet, and C2 Swan systems. Some of the results obtained are displayed in the following figures. A streak image obtained for the Case 1 of Table 6 is shown in Figure 55. The emission intensities obtained for Case 2 of Table 6 for CO(4+) and CN violet bands are plotted in Figure 56. Emission intensity at the shock front for Cases 3 and 4 of Table 6 as function as the wavelength is shown in Figure 57. Intensity as function as time for CO(4+), CN violet and C2 Swan bands for Case 5 of Table 6 are plotted in Figure 58 and Figure 59.
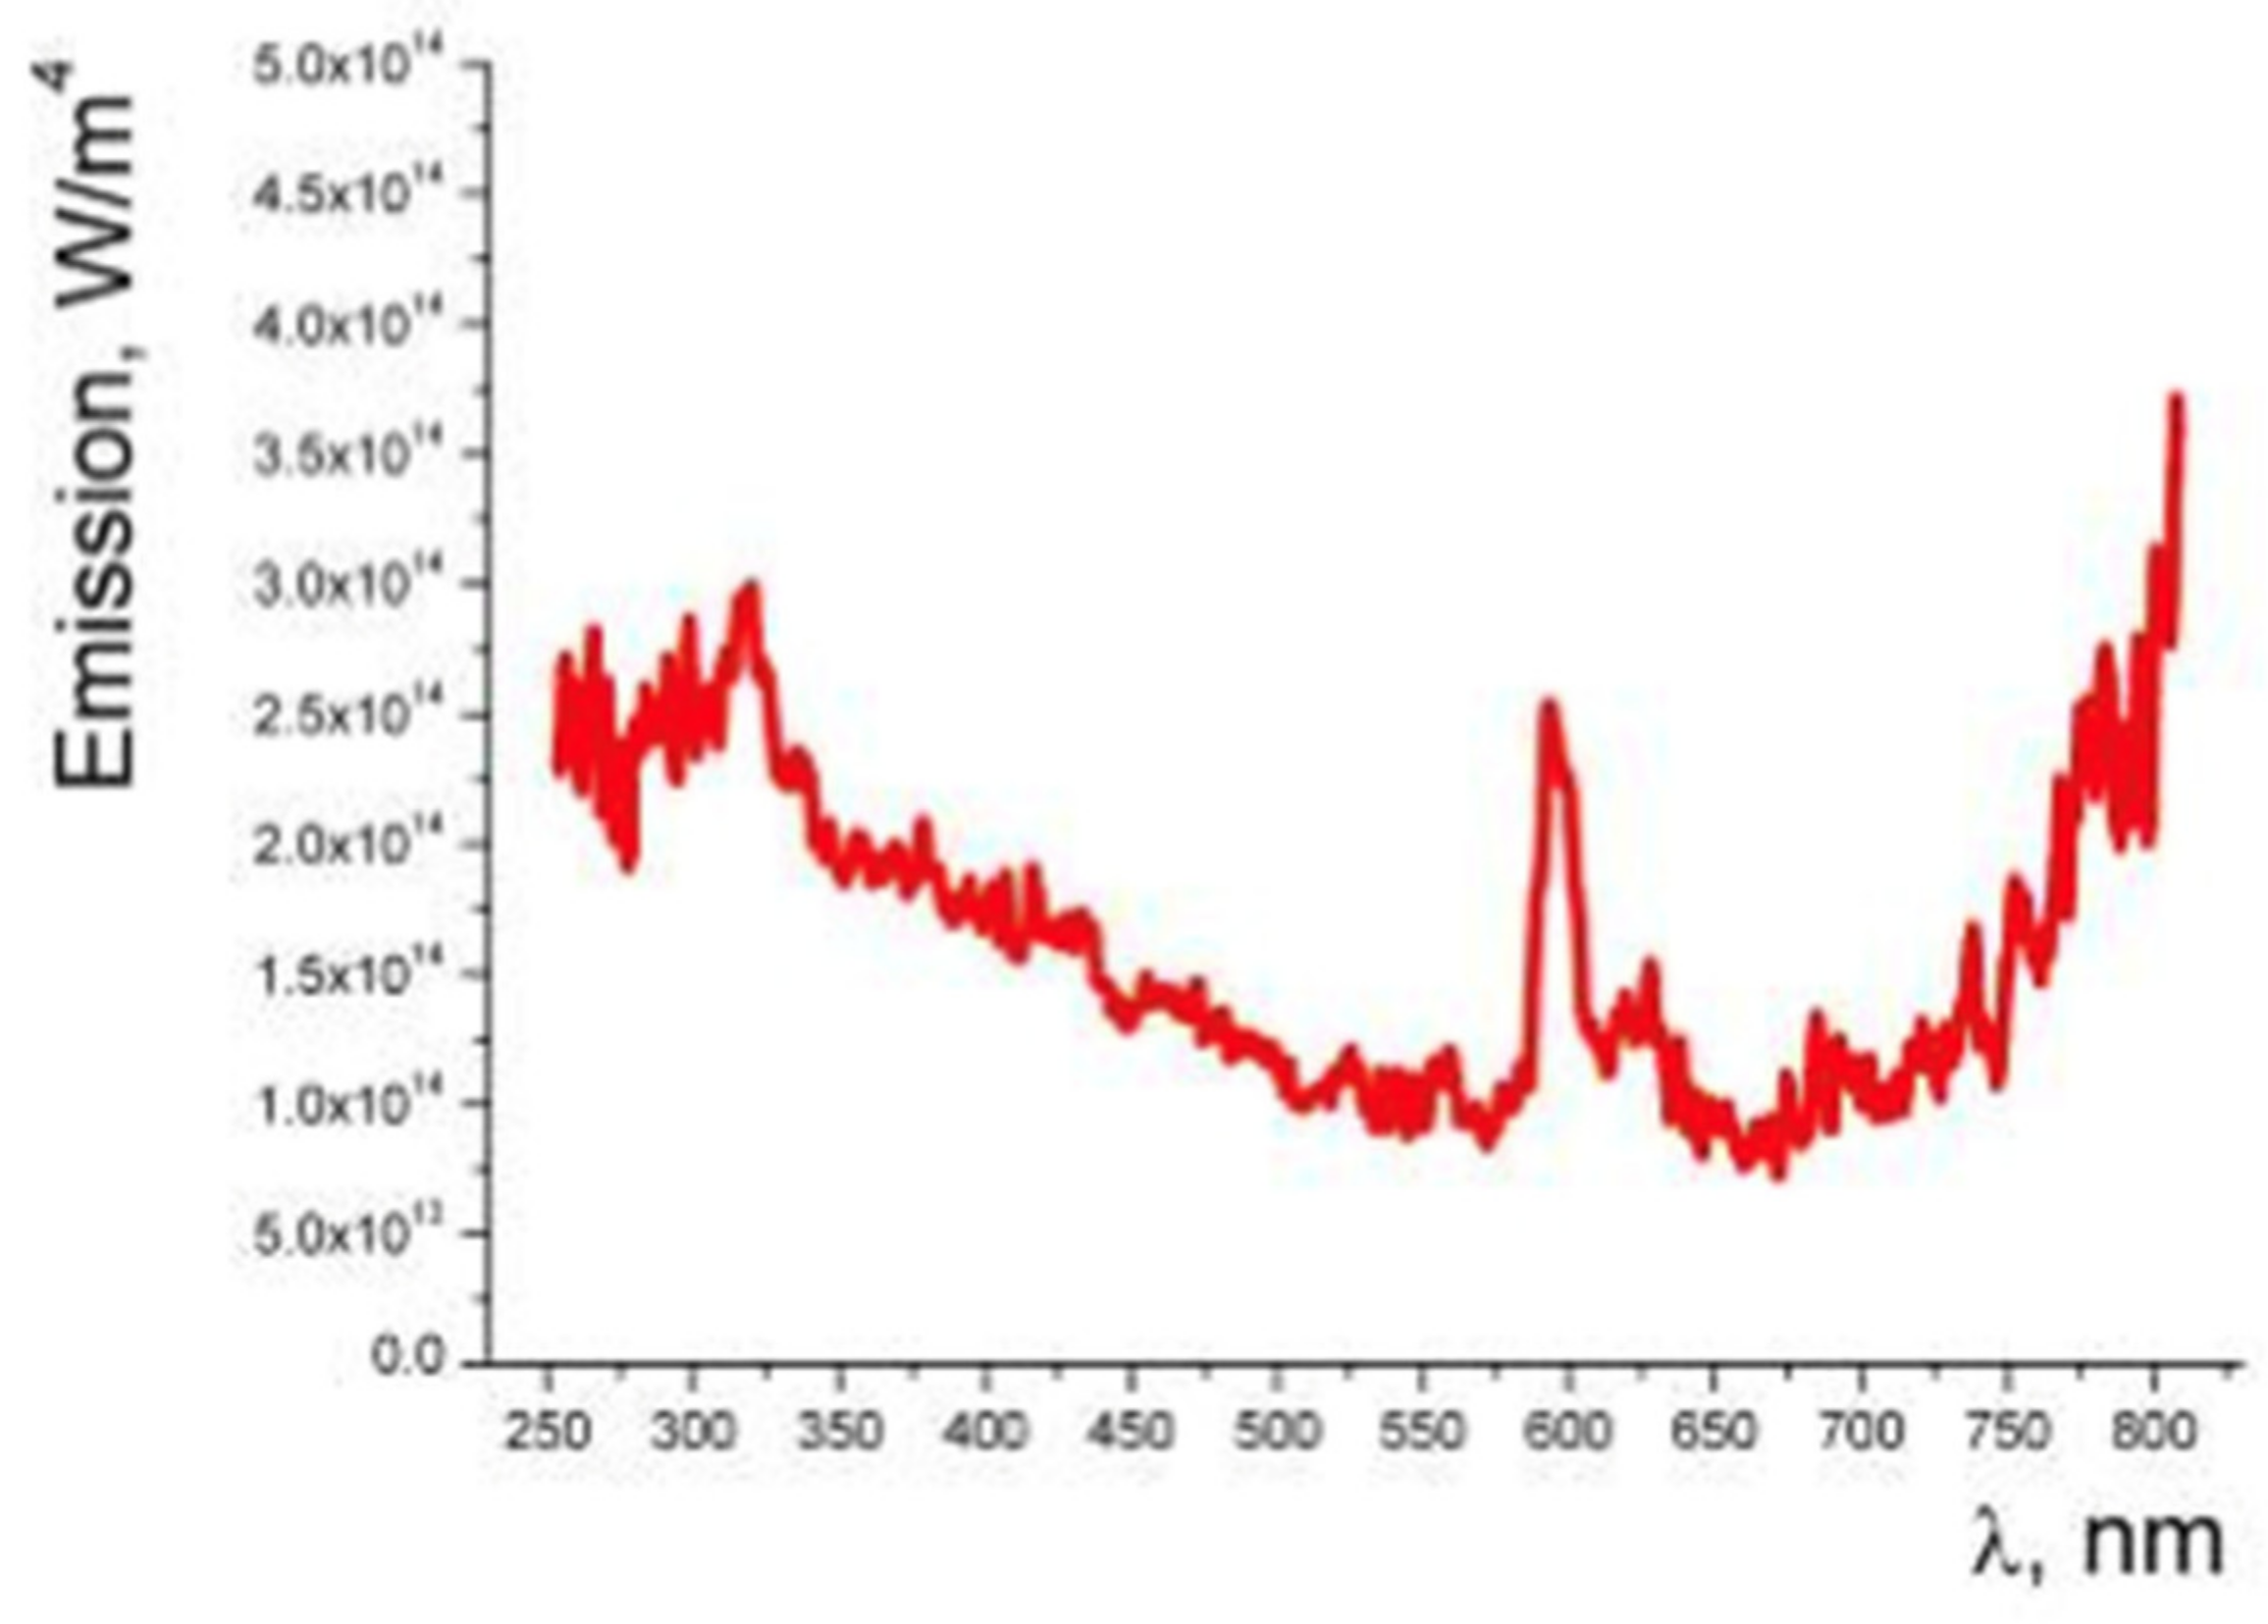
Another series of shock-tube tests [6] were performed in VUT-1 and pure CO2 for a velocity range from 4 to 5.7 km/s, and for pressures from 100 to 1000 Pa. Both absorption and emission measurements were carried out from 230 to 810 nm has shown in Figure 60, during the same test campaign electron density was also measured using a microwave diagnostic technique.
5.4.10. IRS PWK3
PWK-3 PWK-3 [57] is a plasma inductive wind-tunnel available at IRS (University of Stuttgart). Available instrumentation and laser techniques available for characterizing CO2 plasma flows such as TALIF technique are described in [58]. A test campaign was performed in PWK-3 for Mars flow enthalpies of 10, 15, and 20 MJ/kg in the frame of ESA TRP activities [58]. Emission spectroscopy measurements were carried out during these tests for UV and visible ranges, from 175 to 880 nm. Atomic lines for carbon and oxygen were clearly observed as well as molecular emission from C2 Swan, CO+(1-) and CO(3+), as highlighted in Figure 61, in which the numerical reconstruction with PARADE [8,9] is also reported. It has to be noted that the numerical reconstruction was performed before the upgrade of the CO2 radiation database done in [8,9]. Latest works [59] reported on this software are related to identification of number densities, dissociation, and description of relevant temperatures.
6. Synthesis
The experimental results obtained from propulsion studies focuses on plume radiation. If some data covers the IR range, they are obtained at high-pressure levels, much higher than those encountered during the high altitude part of planetary entries when radiation can be important. However, some aspects of these studies such as measurement techniques and instrumentation are relevant for future test campaigns to be carried out in shock-tubes of expansion tubes. As a consequence, future developments of experimental approaches in this area shall be surveyed for assessing their interest for future shock-tube campaigns.
The ground test results obtained for Venus entry conditions are resumed in Table 7 (see also Figure 7), in which the test conditions, facility, dataset available and references are reported. All datasets have been collected in EAST shock-tube. Results have been obtained for three different conditions and covers VUV to NIR wavelengths. For the time being, in Europe, there is no other way, that their numerical reconstruction, to check these data sets. The facilities in which similar conditions can be run are X2 in Australia, and HVST in Japan, such results obtained in these facilities for similar conditions would be of high interest for improving our knowledge on radiation during Venus entry.
A large number of experimental test campaigns has been focused on radiation measurements for Mars entry. Shock-tube facility maps for KAIST, EAST, X2, TCM2, and VUT-1 (MIPT), TC2 test conditions, and different tests carried out in these facilities are reported in Figure 16. The test conditions run in several facilities for which the most detailed results can be found in the literature are listed in Table 8. An emphasis has been put on conditions for which VUV and/or IR measurements have been performed. For some test conditions, spectra are not available, however they have been included in the list since other measurements providing some data of interest such as, temperature, electron density, and radiative heating, are available, and can relevant for some cross-checks. As far as VUV and IR data are considered, the most attractive datasets have been obtained in EAST, X2, and HVET.
For most of the conditions resumed in Table 8, a Mars atmosphere has been considered, however for some tests performed in TCM2, and VUT-1, the Mars atmosphere composition was not always respected, with different proportions in CO2 and N2 or the addition of Argon. The tests carried out in KAIST shock-tube were done using a CO-N2 atmosphere.
Several test campaigns have been performed recently, in Europe, for investigating radiation in plasma torch for CO2-N2 mixtures. Since, during several years, there was no large shock-tube facility available in Europe fitting for exploration missions [4] such test campaigns were the only way for investigating radiation in plasma flows. The test conditions and available results obtained for Mars like mixture are resumed in Table 9. Datasets cover the VUV up to the NIR, and have been collected for different enthalpies and pressures. These studies have been very important for the European radiation community. Such studies have allowed maintaining European capabilities for radiation in relation to planetary entry, and have sustained the development of instrumentation and measurement techniques.
7. Potential Plans for ESTHER Test Campaigns
The collected datasets of this survey might be of interest for future ESTHER test campaign for comparisons and checking. They are also relevant for the new T6 tunnel recently commissioned at Oxford University [60]. This facility could be run until shock velocities of 20 km/s, and will be of interest for future exploration missions. The presence of these two major facilities in Europe will be an asset to foster experimental activities and synergy between research teams.
The duplication of some of the test conditions already run in similar shock velocities and reported in Table 7 for Venus conditions and in Table 8 for Mars conditions tests shall present a high interest for future test campaigns to be conducted in ESTHER
Comparisons between the radiation data obtained in EAST and X2 have also been performed in [34] for 0.1 Torr and 8.5 km/s, and a Mars atmosphere composed of 96% of CO2 and 4% of N2. It has to be also noted that X2 results have been compared against data obtained in EAST and HVST for Mars entry conditions in [61,62]. Since crosschecks between these datasets are already available, the experimental investigation of the corresponding flow conditions shall be a priority for ESTHER.
In the perspective of comparisons, the test campaign to be conducted in ESTHER shall be focused on the following points:
- Conditions already run in the frame of ESA activities in VUT-1 and TCM2;
- Test conditions already cross-checked in X2, EAST, and HVST;
- Test conditions for which VUV and NIR radiative spectra are available;
- Run Test Case 2 conditions.
8. Conclusions
A survey of the available results for CO2 radiation data in ground facilities has been carried out. Experimental data obtained for propulsion applications have been considered, though, most of the efforts have been concentrated on the tests performed in shock-tubes and expansion tubes, for Mars and Venus entries. Results obtained for propulsion purpose did not show a strong interest for future shock-tube campaigns; however, future results from ESTHER could be of interest for propulsion. Additionally, the instrumentation and measurement techniques existing or to be developed in this field could benefit to future shock-tube development.
The emphasis has been put on VUV and NIR available datasets since dedicated instrumentation is going to be implemented in ESTHER for such wavelength ranges. A large number of datasets are available, particularly for Mars entry, this for a several facilities. A synthesis has been attempted in order to provide a first selection of the most attractive test conditions, to be run in ESTHER. This shall allow future comparisons with ESTHER results as soon as they are available.
Funding
This research received no external funding.
Institutional Review Board Statement
Not applicable.
Informed Consent Statement
Not applicable.
Data Availability Statement
Data sharing not applicable to this article. No new data were created or analyzed in this study.
Acknowledgments
The research leading to these results has been partially supported by Fluid Gravity Engineering and Instituto Superior Tecnico of Lisbon under European Space Agency TRP on Characterization of Radiation for High-Speed Entry.
Conflicts of Interest
The author declare no conflict of interest.
References
- Martinez, R. Shock Layer Radiation Measurements for Mars and Venus Entry Conditions in an Electric Arc Shock Tube. Master’s Thesis, San José State University, San Jose, CA, USA, December 2010. Available online: https://scholarworks.sjsu.edu/etd_theses/3875 (accessed on 20 November 2020). [CrossRef]
- Saito, T. Calibration and characterization of UV/VUV detectors. In Proceedings of the STCE (Solar-Terrestrial Centre of Excellence) Seminar, Bruxelles, Belgium, 24 September 2009. [Google Scholar]
- Reynier, P. Survey of aerodynamics and aerothermodynamics efforts carried out in the frame of Mars exploration projects. Prog. Aerosp. Sci. 2014, 70, 1–27. [Google Scholar] [CrossRef]
- Reynier, P. Survey of high-enthalpy shock facilities in the perspective of radiation and chemical kinetics investigations. Prog. Aerosp. Sci. 2016, 85, 1–32. [Google Scholar] [CrossRef]
- Dikalyuk, A.S.; Surzhikov, S.T.; Kozlov, P.V.; Shatalov, O.P.; Romanenko, Y.V. Nonequilibrium spectral radiation behind the shock waves in Martian and Earth atmospheres. In Proceedings of the 44th AIAA Thermophysics Conference, San Diego, CA, USA, 24–27 June 2013. [Google Scholar]
- Beck, J. CFD Validation in a CO2 Environment; Synthesis Report CR12/08; Fluid Gravity Engineering Ltd.: Emsworth, UK, 2008. [Google Scholar]
- Reynier, P.; Beck, J.; Bouilly, J.-M.; Chikhaoui, A.; Dudeck, M.; Herdrich, G.; Kosarev, I.; Da Lino Silva, M.; Marraffa, L.; Menecier, S.; et al. Validation of aerothermal chemistry models for re-entry applications: Synthesis of experimental achievements. In Proceedings of the 8th European Symposium on Aerothermodynamics for Space Vehicles, Lisbon, Portugal, 2–6 March 2015. [Google Scholar]
- Löhle, S.; Lein, S.; Eichhorn, C.; Herdrich, G.; Winter, M. Spectroscopic Investigation of an Inductively Heated CO2 Plasma for Mars entry simulation. J. Tech. Phys. Q. 2009, 50, 233–246. [Google Scholar]
- Liebhart, H.; Bauder, U.; Herdrich, G.; Fasoulas, S.; Röser, H.-P. Numerical Modeling of Radiative and convective heat flux for entry flights in CO2 containing atmospheres, AIAA-2012-3195. In Proceedings of the 43rd AIAA Thermophysics Conference, New Orleans, LA, USA, 25–28 June 2012. [Google Scholar]
- Available online: http://esther.ist.utl.pt/pages/ESTHER_brochure.pdf (accessed on 16 January 2020).
- Sventitskiy, A.; Mundt, C. Simulation of the infrared emission from nonscattering aircraft engine exhaust plumes using statistical narrowband models in conjubction with model parameters based on the modern spectroscopic data, AIAA Paper 2012-3315. In Proceedings of the 43rd AIAA Thermophysics Conference, New Orleans, LA, USA, 25–28 June 2012. [Google Scholar]
- Mazouffre, S.; Pawelec, E. Metastable oxygen atom velocity and temperature in supersonic CO2 plasma expansions. J. Phys. D Appl. Phys. 2009, 42, 015203. [Google Scholar] [CrossRef]
- Nie, W.; Feng, S.; Xie, Q.; Duan, L.; Zhuang, F. Numerical simulation of liquid rocket exhaust plume radiation, AIAA Paper 2007-4413. In Proceedings of the 39th AIAA Thermophysics Conference, Miami, FL, USA, 25–28 June 2007. [Google Scholar]
- Blunck, D.L.; Gore, J.P. Study of narrowband radiation intensity measurements from subsonic exhaust plumes. J. Propuls. Power 2011, 27, 227–235. [Google Scholar] [CrossRef]
- Higgins, C.; Watts, D.; Smithson, T.; Fournier, P.; Ringuette, S.; Coxhill, I. Characterizing the infrared signature of a liquid propellant engine plume, AIAA Paper 2016-4976. In Proceedings of the 52th AIAA Joint Propulsion Conference, Salt Lake City, UT, USA, 25–27 July 2016. [Google Scholar]
- Packan, D.M.; Gessman, R.J.; Pierrot, L.; Laux, C.O.; Kruger, C.H. Measurement and modeling of OH, NO, and CO2 infrared radiation in a low temperature air plama, AIAA Paper 99-3605. In Proceedings of the 30th Plasmadynamic and Lasers Conference, Norfolk, VA, USA, 28 June–1 July 1999. [Google Scholar]
- Cruden, B.A.; Prabhu, D.; Martinez, R. Absolute radiation measurement in Venus and Mars entry conditions. J. Spacecr. Rockets 2012, 49, 1069–1079. [Google Scholar] [CrossRef]
- Cruden, B.A.; Prabhu, D.; Martinez, R.; Le, H.; Bose, D.; Grinstead, J.H. Absolute radiation measurement in Venus and Mars entry conditions, AIAA Paper 2010-4508. In Proceedings of the 10th AIAA Joint Thermophysics and Heat Transfer Conference, Chicago, IL, USA, 28 June–1 July 2010. [Google Scholar]
- Whiting, E.; Park, C.; Liu, Y.; Arnold, J.; Paterson, J. NEQAIR96, Nonequilibrium and Equilibrium Radiative Transport and Spectra Program: User Manual; NASA RP-1389; NASA Ames Research Center: Moffett Field, CA, USA, 1996.
- Cruden, B. Absolute radiation measurements in Earth and Mars entry conditions, STO-AVT-218. In Proceedings of the Radiation and Gas-Surface Interaction Phenomena in High-Speed Re-Entry, University of Illinois, Urbana-Champaign, IL, USA, 7–9 April 2014. [Google Scholar]
- Boubert, P.; Bultel, A.; Annaloro, J.; Cruden, B.A.; McIntyre, T.; Fujita, K. Radiation of high temperature gases: TC2-M5 Definition of shock tunnel test cases for gas radiation prediction in Mars–like atmosphere. In Proceedings of the 6th International Workshop on Radiation and High Temperature Gases in Atmospheric Entry, Saint Andrews, UK, 24–28 November 2014. [Google Scholar]
- Potter, D. Numerical prediction of nonequilibrium radiative emission from shock heated CO2-N2, ESA SP-714. In Proceedings of the 5th International Workshop on Radiation and High Temperature Gases in Atmospheric Entry, Barcelona, Spain, 16–19 October 2012. [Google Scholar]
- Grinstead, J.H.; Wright, M.J.; Bogdanoff, D.W.; Allen, G.A. Shock radiation measurements for Mars aerocapture radiative heating analysis. J. Thermophys. Heat Transf. 2009, 23, 249–255. [Google Scholar] [CrossRef]
- Bose, D.; Grinstead, J.H.; Bogdanoff, D.W.; Wright, M.J. Shock layer radiation measurements and analysis for Mars entry. In Proceedings of the 3rd International Workshop on Radiation of High Temperature Gases in Atmospheric Entry (ESA SP-667, Jan. 2009), Heraklion, Greece, 20 September–3 October 2008. [Google Scholar]
- Cruden, B. Recent progress in entry radiation measurements in the NASA Ames Electric Arc Shock Tube facility, ESA SP-714. In Proceedings of the 5th International Workshop on Radiation of High Temperature Gases in Atmospheric Entry, Barcelona, Spain, 16–19 October 2012. [Google Scholar]
- Cruden, A.B.; Brandis, A.M.; Prabhu, D.K. Compositional dependence of radiance in CO2/N2/Ar systems, AIAA Paper 2013-2502. In Proceedings of the 44th AIAA Thermophysics Conference, San Diego, CA, USA, 24–27 June 2013. [Google Scholar]
- Johnston, C.O.; Hollis, B.R.; Sutton, K. Spectrum modeling for air shock-layer radiation at Lunar return conditions. J. Spacecr. Rockets 2008, 45, 865–878. [Google Scholar] [CrossRef]
- Johnston, C.; Brandis, A.; Panesi, M.; Sutton, K.; Prabhu, D. Shock layer radiation modeling and uncertainty for Mars entry, AIAA Paper 2012-2866. In Proceedings of the 43rd AIAA Thermophysics Conference, New Orleans, LA, USA, 25–28 June 2012. [Google Scholar]
- Cruden, B.A.; Prabhu, D.K.; Brandis, A.M. Measurements and characterization of mid-wave infrared radiation in CO2 shocks, AIAA Paper 2014-2962. In Proceedings of the 11th Joint Thermophysics and Heat Transfer Conference, Atlanta, GA, USA, 16–20 June 2014. [Google Scholar]
- Takayanagi, H.; Fujita, K. Radiation measurements from carbon dioxide from VUV to IR region, AIAA Paper 2011-3631. In Proceedings of the 42nd AIAA Thermophysics Conference, Honolulu, HI, USA, 27–30 June 2011. [Google Scholar]
- Takayanagi, H.; Fujita, K. Absolute radiation measurements behind strong shock wave in carbon dioxide flow for Mars aerocapture missions, AIAA Paper 2012-2744. In Proceedings of the 43rd AIAA Thermophysics Conference, New Orleans, LA, USA, 25–28 June 2012. [Google Scholar]
- Takayanagi, H.; Fujita, K. Infrared radiation measurements behind strong shock wave in Mars simulant gas for aerocapture missions, AIAA Paper 2013-2504. In Proceedings of the 44th AIAA Thermophysics Conference, San Diego, GA, USA, 24–27 June 2013. [Google Scholar]
- Takayanagi, H.; Nomura, S.; Lemal, A.; Fujita, K. Measurements of nonequilibrium carbon dioxide infrared radiation in an expansion tube, AIAA Paper 2017-1369. In Proceedings of the 55th AIAA Aerospace Sciences Meeting, Grapewine, TX, USA, 9–13 January 2017. [Google Scholar]
- Brandis, A.; McIntyre, T.; Morgan, R.; Jacobs, P. Overview of radiation measurements on the X2 facility at the University of Queensland, ESA SP-667. In Proceedings of the 3rd International Workshop on Radiation of High Temperature Gases in Atmospheric Entry, Heraklion, Greece, 30 September–3 October 2008. [Google Scholar]
- Palmer, G.; Prabhu, D.; Brandis, A.; McIntyre, T.J. Simulation of radiation measurements taken in the X2 facility for Mars and Titan gas mixtures, AIAA Paper 2011-3768. In Proceedings of the 42nd AIAA Thermophysics Conference, Honolulu, HI, USA, 27–30 June 2011. [Google Scholar]
- Gu, S.; Morgan, R.G.; McIntyre, T.J. Study of afterbody radiation during Mars entry in an expansion tube; AIAA Paper 2017-0212. In Proceedings of the AIAA SciTech Forum, Grapevine, TX, USA, 9–13 January 2017. [Google Scholar]
- McIntyre, T.J.; Eichmann, T.N.; Jacobs, C.; Potter, D.; McGilvray, M.; Jacobs, P.; Morgan, R. Shock tube and expansion tunnel measurements of high temperature radiating flows, ESA SP-689. In Proceedings of the 4th International Workshop on Radiation of High Temperature Gases in Atmospheric Entry, Lausanne, Switzerland, 12–15 October 2010. [Google Scholar]
- Chernyi, G.G.; Losev, S.A. Problems of Aerothermoballistics, Radiation Gasdynamics, Heat and Mass Transfer for Planet Sample Return Missions; Final Project Technical Report of ISTC N1549-00; Research Institute of Mechanics: Moscow, Russia, 2003. [Google Scholar]
- Thomas, G.M.; Ménard, W.A. Experimental Measurements of Nonequilibrium and Equilibrium Radiation from Planetary Atmospheres. AIAA J. 1966, 4, 227–237. [Google Scholar] [CrossRef]
- Brémare, N.; Hyun, S.Y.; Studer, D.; Boubert, P.; Vervish, P. Radiation and chemistry of CO2 and air inductive plasmas as freejets and interaction with samples, AIAA Paper 2011-3624. In Proceedings of the 42nd AIAA Thermophysics Conference, Honolulu, HI, USA, 27–30 June 2011. [Google Scholar]
- Brémare, N.; Boubert, P. New ICP experimental conditions for the study of air and CO2 pasma radiation, ESA SP-714. In Proceedings of the 5th International Workshop on Radiation of High Temperature Gases in Atmospheric Entry, Barcelona, Spain, 16–19 October 2012. [Google Scholar]
- Lino Da Silva, M. Simulation des Propriétés Radiatives du Plasma Entourant un Véhicule Traversant une Atmosphère Planétaire à Vitesse Hypersonique—Application à la Planète Mars. Ph.D. Thesis, Université d’Orléans, Orléans, France, 9 December 2004. [Google Scholar]
- Lago, V. Radiation measurements in low pressure high enthalpy flows from VUV and near IR region, AIAA Paper 2015-3516. In Proceedings of the 20th AIAA International Space Planes and Hypersonic Systems and Technologies Conference, Glasgow, UK, 6–9 July 2015. [Google Scholar]
- Lee, E.-S.; Park, C.; Chang, K.-S. Shock tube determination of CN formation rate in a C0-N2 mixture. J. Thermophys. Heat Transf. 2007, 21, 50–56. [Google Scholar] [CrossRef]
- Vacher, D.; Lino Da Silva, M.; André, P.; Faure, G.; Dudeck, M. Radiation from an equilibrium CO2-N2 plasma in the 250-850 nm spectral region: 1. Experiment. Plasma Sources Sci. Technol. 2008, 17, 035012. [Google Scholar] [CrossRef]
- Löhle, S.; Vacher, D.; Menecier, S.; Dudeck, M.; Liebhart, H.; Marynowski, T.; Herdrich, G.; Fasoulas, S.; André, P. Measurement campaigns on Mars entry plasmas using ICP torches. Characterization by emission spectroscopy and probe techniques, ESA SP-689. In Proceedings of the 4th International Workshop on Radiation of High Temperature Gases in Atmospheric Entry, Lausanne, Switzerland, 12–15 October 2010. [Google Scholar]
- Lino da Silva, M.; Dudeck, M. A line-by-line spectroscopic code for the simulation of plasma radiation during planetary entries: The SESAM code, AIAA Paper 2004-2157. In Proceedings of the 35th AIAA Plasmadynamics and Lasers Conference, Portland, OR, USA, 28 June–July 2004. [Google Scholar]
- Parker, R.; MacLean, M.; Holden, M.; Wakeman, T. Shock front radiation studies at CUBRC, AIAA Paper 2010-1370. In Proceedings of the 48th AIAA Aerospace Meeting, Orlando, FL, USA, 4–7 January 2010. [Google Scholar]
- Parker, R.; Dufrene, A.; Holden, M.; Wakeman, T. Shock front emission measurements at 10 km/s, AIAA Paper 2011-715. In Proceedings of the 49th AIAA Aerospace Sciences Meeting, Orlando, FL, USA, 4–7 January 2011. [Google Scholar]
- Hollis, B.R.; Prabhu, D.K.; MacLean, M.; Dufrene, A. Blunt-body aerothermodynamic database from high-enthalpy carbon-dioxide testing in an expansion tunnel. J. Thermophys. Heat Transf. 2017, 31, 712–731. [Google Scholar] [CrossRef]
- Kozlov, P.V.; Romanenko, Y.V.; Shatalov, O.P. Radiation intensity measurement in simulated Martian atmospheres on the double diaphragm shock tube, ESA SP-689. In Proceedings of the 4th International Workshop on Radiation of High Temperature Gases in Atmospheric Entry, Lausanne, Switzerland, 12–15 October 2010. [Google Scholar]
- Chikhaoui, A.; Boubert, P.; Rond, C.; Félio, J.-M. Shock Tube Aerochemistry Measurement Techniques: Development of High Entry Velocity Chemical Kinetics Models; AURORA E30; IUSTI: Marseille, France, 2006. [Google Scholar]
- Boubert, P.; Rond, C. Nonequilibrium Radiation in Shocked Martian Mixtures. J. Thermophys. Heat Transf. 2010, 24, 40–49. [Google Scholar] [CrossRef]
- Ramjaun, D. Cinétique des Radicaux Libres à L’aval D’ondes de Choc dans des Atmosphères Planétaires: Expérimentation en Tube à Choc. Ph.D. Thesis, Université de Provence, Marseille, France, 1998. [Google Scholar] [CrossRef]
- Anokhin, E.M.; Ivanova, T.; Starikovskii, A.Y. Strong shock waves in CO2:N2:Ar mixtures, ESA SP-629. Proceedings of 2nd Int. Workshop on Radiation of High Temperature Gases in Atmospheric Entry, Rome, Italy, 6–8 September 2006. [Google Scholar]
- Anokhin, E.M.; Ivanova, T.Y.; Koudriavtsev, N.N.; Starikovskii, A.Y. Non equilibrium radiation investigation behind the strong shock waves in CO2:N2:Ar mixtures, AIAA Paper 2005-792. Proceedings of 43rd AIAA Aerospace Sciences Meeting and Exhibit-Meeting Papers, Reno, NV, USA, 10–13 January 2005. [Google Scholar]
- Herdrich, G.; Marynowski, T.; Dropmann, M.; Fasoulas, S. Atmospheric Entry Simulation Capabilities of the IRS Plasma Wind Tunnel PWK3 for Mars and Venus. Appl. Phys. Res. 2012, 4, 144–156. [Google Scholar] [CrossRef] [Green Version]
- Marynowski, T.; Löhle, S.; Fasoulas, S. Two-photon laser-induced fluorescence investigation of CO2 plasmas for Mars entry. J. Thermophys. Heat Transf. 2014, 28, 394–400. [Google Scholar] [CrossRef]
- Burghaus, H.; Herdrich, G.; Fasoulas, S. Derivation of Species Distribution in Inductively Heated CO2 Plasma via Automated Spectral Fitting. Vac. J. 2021, 184, 109901. [Google Scholar] [CrossRef]
- Collen, P.L.; Doherty, L.J.; McGilvray, M.; Naved, I.; Morgan, R.G.; Gildfind, D.E. Commissioning of the T6 Stalker tunnel, AIAA Paper 2019-1941. In Proceedings of the AIAA SciTech Forum, San Diego, GA, USA, 7–11 January 2019. [Google Scholar]
- Brandis, A.M. Validation of shock layer radiation: Perspectives for Test Cases, ESA SP-714. In Proceedings of the 5th International Workshop on Radiation and High Temperature Gases in Atmospheric Entry, Barcelona, Spain, 16–19 October 2012. [Google Scholar]
- Brandis, A.M.; Morgan, R.G.; McIntyre, T.J.; Jacobs, P.A. Nonequilibrium radiation intensity measurements in simulated Titan atmospheres. J. Thermophys. Heat Transf. 2010, 24, 291–300. [Google Scholar] [CrossRef]
Figure 1.
Sketch of ESTHER shock-tube (credit IST).

Figure 2.
Set-up for investigating radiation in exhaust plumes (from [14]).
Figure 2.
Set-up for investigating radiation in exhaust plumes (from [14]).

Figure 3.
Infrared radiation intensity measurements in a plume (Mach 0.28, exit temperature 800 K): (a–d) instantaneous (elapsed time of 12 ms); (e) averaged. (from [14]).
Figure 3.
Infrared radiation intensity measurements in a plume (Mach 0.28, exit temperature 800 K): (a–d) instantaneous (elapsed time of 12 ms); (e) averaged. (from [14]).

Figure 4.
Plume spectral intensity in the 2000–5000 cm−1 range (from [15]).
Figure 4.
Plume spectral intensity in the 2000–5000 cm−1 range (from [15]).

Figure 5.
Measured IR spectrum at 1 atm and 3400 K (from [16]).
Figure 5.
Measured IR spectrum at 1 atm and 3400 K (from [16]).

Figure 6.
Experimental arrangement for CO2 expansion flows (from [12]).
Figure 6.
Experimental arrangement for CO2 expansion flows (from [12]).

Figure 7.
Summary of tests carried out in EAST for Mars ad Venus entries from 2008 to 2012 [17].
Figure 7.
Summary of tests carried out in EAST for Mars ad Venus entries from 2008 to 2012 [17].

Figure 8.
Rotational temperature for CN and C2 systems (from [1]).
Figure 8.
Rotational temperature for CN and C2 systems (from [1]).

Figure 9.
Mars and Venus spectra obtained in [1].
Figure 9.
Mars and Venus spectra obtained in [1].

Figure 10.
Contributions to the different spectral regions to the total radiance for different Mars (96% CO2, 4% N2) and Venus (96.5% CO2, 3.5% N2) entry conditions [17].
Figure 10.
Contributions to the different spectral regions to the total radiance for different Mars (96% CO2, 4% N2) and Venus (96.5% CO2, 3.5% N2) entry conditions [17].

Figure 11.
Rotational temperature for Venus and Mars conditions [17].
Figure 11.
Rotational temperature for Venus and Mars conditions [17].

Figure 12.
Comparison between EAST data and NEQAIR for Venus entry at 1 Torr and 9.5 km/s [17].
Figure 12.
Comparison between EAST data and NEQAIR for Venus entry at 1 Torr and 9.5 km/s [17].

Figure 13.
Comparison between EAST data and NEQAIR for Venus at 0.5 Torr: a) VUV spectrum at 11.4 km/s; b) VIS-NIR spectrum at 10.5 km/s; c) NIR spectrum at 11.4 km/s [17].
Figure 13.
Comparison between EAST data and NEQAIR for Venus at 0.5 Torr: a) VUV spectrum at 11.4 km/s; b) VIS-NIR spectrum at 10.5 km/s; c) NIR spectrum at 11.4 km/s [17].

Figure 14.
Integrated radiance from carbon lines (193 and 248 nm) and oxygen triplet (777 nm) (EAST experimental data as solid points; NEQAIR calculations as lines) [17].
Figure 14.
Integrated radiance from carbon lines (193 and 248 nm) and oxygen triplet (777 nm) (EAST experimental data as solid points; NEQAIR calculations as lines) [17].

Figure 15.
Equilibrium radiation spectra and total radiative flux (dashed lines) for Earth, Venus and Mars entry conditions [20].
Figure 15.
Equilibrium radiation spectra and total radiative flux (dashed lines) for Earth, Venus and Mars entry conditions [20].

Figure 16.
TC2 test conditions and facilities maps [22].
Figure 16.
TC2 test conditions and facilities maps [22].

Figure 17.
Emission spectrum for a Mars atmosphere (96% CO2, 4% N2) at 13.3 Pa and a shock velocity of 8.6 km/s (from [23]).
Figure 17.
Emission spectrum for a Mars atmosphere (96% CO2, 4% N2) at 13.3 Pa and a shock velocity of 8.6 km/s (from [23]).

Figure 18.
VUV part of the radiance spectrum for Mars at 0.1 Torr (13.3 Pa) and 8.6 km/s (from [23]).
Figure 18.
VUV part of the radiance spectrum for Mars at 0.1 Torr (13.3 Pa) and 8.6 km/s (from [23]).

Figure 19.
Predicted spectrum and wavelength coverage for the different shots using three spectrographs (from [24]).
Figure 19.
Predicted spectrum and wavelength coverage for the different shots using three spectrographs (from [24]).

Figure 20.
Comparison between NEQAIR calculations and EAST data in the UV range, at shock velocity of 8.55 km/s and a pressure of 0.1 Torr. The dotted curves are the cumulated intensity: measured in red and computed in blue (from [24]).
Figure 20.
Comparison between NEQAIR calculations and EAST data in the UV range, at shock velocity of 8.55 km/s and a pressure of 0.1 Torr. The dotted curves are the cumulated intensity: measured in red and computed in blue (from [24]).

Figure 21.
Comparison between NEQAIR calculations and EAST data in the NIR range at 0.1 Torr and a shock velocity of 8.55 km/s. The dotted curves are the cumulated intensity: measured in red and computed in blue (from [24]).
Figure 21.
Comparison between NEQAIR calculations and EAST data in the NIR range at 0.1 Torr and a shock velocity of 8.55 km/s. The dotted curves are the cumulated intensity: measured in red and computed in blue (from [24]).

Figure 22.
Comparison between NEQAIR calculations and EAST data in the VUV range at 0.1 Torr and a shock velocity of 8.63 km/s. The dotted curves are the cumulated intensity: measured in red and computed in blue (from [24]).
Figure 22.
Comparison between NEQAIR calculations and EAST data in the VUV range at 0.1 Torr and a shock velocity of 8.63 km/s. The dotted curves are the cumulated intensity: measured in red and computed in blue (from [24]).

Figure 23.
Comparison between NEQAIR calculations and EAST data in the VIS at 0.1 Torr and a shock velocity of 9 km/s. The dotted curves are the cumulated radiative intensity: measured in red and computed in blue (from [24]).
Figure 23.
Comparison between NEQAIR calculations and EAST data in the VIS at 0.1 Torr and a shock velocity of 9 km/s. The dotted curves are the cumulated radiative intensity: measured in red and computed in blue (from [24]).

Figure 24.
Spectral ranges covered during EAST tests (bottom 1 Torr, top 0.1 Torr (from [25]).
Figure 24.
Spectral ranges covered during EAST tests (bottom 1 Torr, top 0.1 Torr (from [25]).

Figure 25.
Composite spectra for TC 2 nominal conditions (from [25]).
Figure 25.
Composite spectra for TC 2 nominal conditions (from [25]).

Figure 26.
EAST data for different mixtures: Left: Spectral radiation; Right: Radiation as function of position (from [26]).
Figure 26.
EAST data for different mixtures: Left: Spectral radiation; Right: Radiation as function of position (from [26]).

Figure 27.
Steady state radiation for three Mars mixtures (pure CO2, 96:4 CO2/N2, and 95.7:2.7:1.6 CO2/N2/Ar) at 0.25 Torr: Top left: 167–197 nm, Top right: 334–496 nm, Bottom: 480–900 nm (from [26]).
Figure 27.
Steady state radiation for three Mars mixtures (pure CO2, 96:4 CO2/N2, and 95.7:2.7:1.6 CO2/N2/Ar) at 0.25 Torr: Top left: 167–197 nm, Top right: 334–496 nm, Bottom: 480–900 nm (from [26]).

Figure 28.
Summary of test conditions for which IR radiation was investigated in EAST with selected Mars entry trajectories (from [29]).
Figure 28.
Summary of test conditions for which IR radiation was investigated in EAST with selected Mars entry trajectories (from [29]).

Figure 29.
Spectral and spatial radiation measurements at 3 km/s and 1 Torr in pure CO2 (left: 2700 nm band, right 4300 nm band) (from [29]).
Figure 29.
Spectral and spatial radiation measurements at 3 km/s and 1 Torr in pure CO2 (left: 2700 nm band, right 4300 nm band) (from [29]).

Figure 30.
Radiation behind the shock for Mars entry conditions, at different velocities and pressures (left: 2700 nm band, right 4300 nm band) (from [29]).
Figure 30.
Radiation behind the shock for Mars entry conditions, at different velocities and pressures (left: 2700 nm band, right 4300 nm band) (from [29]).

Figure 31.
Left: Emission spectrum in VUV for the different runs at 7.1 and 7.3 km/s. Right: Emission spectrum in near region at 7.1 km/s and 200 Pa (from [30]).
Figure 31.
Left: Emission spectrum in VUV for the different runs at 7.1 and 7.3 km/s. Right: Emission spectrum in near region at 7.1 km/s and 200 Pa (from [30]).

Figure 32.
Comparison of the measured CN violet bands in UV region obtained using VUV and VIS spectrometers (from [31]).
Figure 32.
Comparison of the measured CN violet bands in UV region obtained using VUV and VIS spectrometers (from [31]).

Figure 33.
Infrared radiation intensity as function of shock velocity measured in HVST (from [32]).
Figure 33.
Infrared radiation intensity as function of shock velocity measured in HVST (from [32]).

Figure 34.
Spatial distribution of IR radiation intensity at 7.6 km/s (from [33]).
Figure 34.
Spatial distribution of IR radiation intensity at 7.6 km/s (from [33]).

Figure 35.
Spatial distribution of IR radiation intensity at 5.5 km/s (from [33]).
Figure 35.
Spatial distribution of IR radiation intensity at 5.5 km/s (from [33]).

Figure 36.
Comparison of NEQAIR calculations and X2 test data: (a) volumetric spectral radiance between 310 and 450 nm; (b) volumetric radiance along stagnation line (from [34]).
Figure 36.
Comparison of NEQAIR calculations and X2 test data: (a) volumetric spectral radiance between 310 and 450 nm; (b) volumetric radiance along stagnation line (from [34]).

Figure 37.
Wavelength comparison between EAST and X2 for Mars conditions (datasets from X2 are started by x2 in the legend) (from [34]).
Figure 37.
Wavelength comparison between EAST and X2 for Mars conditions (datasets from X2 are started by x2 in the legend) (from [34]).

Figure 38.
Power density comparison between EAST and X2 for Mars conditions and 0.1 Torr (datasets from X2 are those with the name starts by x2 in the legend) (from [34]).
Figure 38.
Power density comparison between EAST and X2 for Mars conditions and 0.1 Torr (datasets from X2 are those with the name starts by x2 in the legend) (from [34]).

Figure 39.
Spectral power density for Mars gas expansion tube study (from [37]).
Figure 39.
Spectral power density for Mars gas expansion tube study (from [37]).

Figure 40.
Time-dependent radiation measurements (from [36]).
Figure 40.
Time-dependent radiation measurements (from [36]).

Figure 41.
Measured and calculated time-response characteristics of the non-equilibrium radiation peak CO(4+) and CN(violet) behind shock wave versus velocity. (1) measurements ●–tm (time to reach radiation maximum during a shot) for CO(4+); ▲–tqst () for CO(4+); Δ–tqst (characteristic time for non-equilibrium radiation peak duration) for CN(violet); ○–tm for CN(violet); X from [39]. (2) calculations: curves–tm for CN(violet), –tqst for CN(violet) (from [38]).

Figure 42.
Peak values of radiation intensity (Im) of CO(4+) behind the shock-wave as function of velocity: Curve–calculation, ○–measured radiation intensity (from [38]).
Figure 42.
Peak values of radiation intensity (Im) of CO(4+) behind the shock-wave as function of velocity: Curve–calculation, ○–measured radiation intensity (from [38]).

Figure 43.
Spectrum of pure CO2 from VUV to VIS in ICP CORIA torch (from [40]).
Figure 43.
Spectrum of pure CO2 from VUV to VIS in ICP CORIA torch (from [40]).

Figure 44.
Radiation systems and lines in PHEDRA (from [43]).
Figure 44.
Radiation systems and lines in PHEDRA (from [43]).

Figure 45.
Left: Measured intensity and pressure behind the reflected shock. Right: Comparisons of numerical results with measurements (from [44]).
Figure 45.
Left: Measured intensity and pressure behind the reflected shock. Right: Comparisons of numerical results with measurements (from [44]).

Figure 46.
Emission spectrum of a CO2 plasma in the LAEPT ICP torch (from [45]).
Figure 46.
Emission spectrum of a CO2 plasma in the LAEPT ICP torch (from [45]).

Figure 47.
Spectral power densities for a pressure of 0.3 Torr (from [51]).
Figure 47.
Spectral power densities for a pressure of 0.3 Torr (from [51]).


Figure 49.
Spectrum of CN violet Δv = 0 (Case 3 of Table 5): Left: zone 1; Right: zone 2 (from [52]).

Figure 50.
Spectrum of CN violet Δv = −1 (Case 4 of Table 5): Left: Zone 1; Right: Zone 2 (from [52]).

Figure 51.
Zones 1 and 2 considered in TCM2 for radiation study (from [52]).
Figure 51.
Zones 1 and 2 considered in TCM2 for radiation study (from [52]).

Figure 52.
Left: Spectrum of CN violet Δv = 0. Right: Time profile of CN violet Δv = 0 for the Case 1of Table 5 (from [54]).

Figure 53.
Experimental and predicted vibrational temperature for Case 1 of Table 5 as function as shock distance (from [54]).

Figure 54.
Left: Spectrum of C2 for Swan bands (Δv = 0 and Δv = +1) for Case 2 of Table 5–Right: Time profile of C2 for Swan bands (Δv = 0 and Δv = +1) for same conditions (from [54]).


Figure 56.
Emission intensity as function as time for Case 2 of Table 6: Left CO(4+) 156–154 nm; Right: CN(violet) 381–389 nm (from [55]).

Figure 57.
Emission intensity at the shock front for Cases 3 (left) and 4 (right) of Table 6 (from [55]).


Figure 60.
Tests performed in VUT-1: Emission spectrum obtained for 4050 m/s and 11.1 Torr [6].
Figure 60.
Tests performed in VUT-1: Emission spectrum obtained for 4050 m/s and 11.1 Torr [6].

Figure 61.
Emission spectra (in white) in PWK-3 at 21 MJ/kg and PARADE calculations with contributions from different systems [6].
Figure 61.
Emission spectra (in white) in PWK-3 at 21 MJ/kg and PARADE calculations with contributions from different systems [6].

Table 1.
Venus entry conditions investigated for VUV data measurements (1 Torr = 133 Pa).
| Pressure (Torr) | Velocity (km/s) | Reference |
|---|---|---|
| 0.5 | 11.4 | [1,15,17] |
| 0.5 | 10.6 | [1,15,17] |
| 1 | 9.5 | [1,15,17] |
Table 2.
Test in X2 for a Mars-like mixture (96% CO2, 4% N2): Calculated free stream conditions in [37].
Table 2.
Test in X2 for a Mars-like mixture (96% CO2, 4% N2): Calculated free stream conditions in [37].
| Velocity (km/s) | 8.5 |
| Density (kg/m3) | 1.79 × 10⁻³ |
| Temperature (K) | 1060 |
| Enthalpy (MJ/kg) | 36 |
| Mach number | 12.8 |
Table 3.
Estimated X2 freestream conditions for MSL project [36].
Table 3.
Estimated X2 freestream conditions for MSL project [36].
| V (m/s) | P (Torr) | T (K) | c (m/s) | Tv (K) | CO2 (mole fraction) |
|---|---|---|---|---|---|
| 2877 | 2.7 | 1191 | 507 | 2358 | 0.92 |
| 3484 | 2.7 | 1378 | 560 | 2758 | 0.76 |
| 4077 | 1.13 | 1281 | 543 | 2815 | 0.73 |
Table 4.
Test conditions run in KAIST shock-tube [44].
Table 4.
Test conditions run in KAIST shock-tube [44].
| Run | Pressure (Torr) | Velocity (km/s) | Peq (Torr) | Veq (km/s) |
|---|---|---|---|---|
| 1 | 1.3 | 3.45 | 3.77 | 5.2 |
| 2 | 2.6 | 3.2 | 7.3 | 4.83 |
| 3 | 2.6 | 3.4 | 8.37 | 5.13 |
Table 5.
Tests carried out in TCM2 for Mars entry.
| Case | Velocity (km/s) | Pressure (Torr) | Mixture |
|---|---|---|---|
| 1 | 5.8 | 1.47 | 30% [N2], 70% [CO2] |
| 2 | 5.2 | 4.06 | 100% [CO] |
| 3 | 6.17 | 1.8 | 70% [N2], 30% [CO2] |
| 4 | 6.25 | 1.68 | 70% [N2], 30% [CO2] |
Table 7.
Venus entry conditions investigated with shock-tube experiments.
| Pressure (Torr) | Velocity (km/s) | Facility | Data | Reference |
|---|---|---|---|---|
| 0.5 | 11.4 | EAST | VUV to IR | [1,17,18] |
| 0.5 | 10.6 | EAST | VUV to IR | [1,17,18] |
| 1 | 9.5 | EAST | VUV to IR | [1,17,18] |
Table 8.
Mars entry conditions investigated with shock facilities (shock-tubes, expansion tubes) experiments, with CO2-N2 mixtures (for KAIST CO-N2) related to Mars entry. In bold Test Case 2 (of Radiation Working Group) conditions.
Table 8.
Mars entry conditions investigated with shock facilities (shock-tubes, expansion tubes) experiments, with CO2-N2 mixtures (for KAIST CO-N2) related to Mars entry. In bold Test Case 2 (of Radiation Working Group) conditions.
| Pressure (Torr) | Velocity (km/s) | Facility | Spectra | Reference |
|---|---|---|---|---|
| 0.2 | 6–9 | ADST | - | [39] |
| 0.1 | 8.6 | EASTX2 | VUV to NIRUV-VIS | [23,25,34,35] |
| 0.1 | 8.3–9 | EAST | VUV to IR | [24] |
| 0.1 | 7–7.5–8 | EAST | VUV to IR | [25,26] |
| 1 | 7–7.5–8 | EAST | VUV to IR | [25] |
| 0.25 | 6.5 | EAST | VUV to IR | [26] |
| 0.2–1 | 3–7.5 | EAST | IR | [29] |
| 0.075 | 7.6 | HVET | VIS-IR | [33] |
| 0.15 | 5.5 | HVET | VIS-IR | [33] |
| 1.5 | 7.3–7.5 | HVST | VUV to NIR | [33] |
| 1 | 7 | HVST | VUV to NIR | [31] |
| 0.1 | 8.5 | HVST | VUV to NIR | [31] |
| 1 | 2.5–8 | HVST | IR | [32] |
| 3.77 | 5.2 | KAIST | - | [44] |
| 7.3 | 4.83 | KAIST | - | [44] |
| 8.37 | 5.13 | KAIST | - | [44] |
| 0.3 | 6.3–7.6 | MSU | UV-VIS | [51] |
| 1 | 4.6–5.8 | MSU | UV-VIS | [51] |
| 1.47 | 5.8 | TCM2 | UV | [54] |
| 1.68 | 6.25 | TCM2 | UV | [52] |
| 1.8 | 6.17 | TCM2 | UV | [52] |
| 4.06 | 5.2 | TCM2 | VIS | [54] |
| 0.1 | 7.49 | VUT-1 | VUV-VIS | [55] |
| 0.6 | 7.06 | VUT-1 | VUV-VIS | [55] |
| 1.32 | 6.5 | VUT-1 | VUV-VIS | [55] |
| 1.42 | 6 | VUT-1 | VUV-UV | [52] |
| 1.59 | 6.27 | VUT-1 | - | [52] |
| 8.5 | - | X2 | UV-VIS | [37] |
| 0.1 | 8.7 | X2 | UV-VIS | [34] |
| 1.13 | 4 | X2 | IR | [36] |
| 2.7 | 3.5 | X2 | IR | [36] |
| 2.7 | 2.9 | X2 | IR | [36] |
Table 9.
Test conditions investigated in some European plasma torches.
| Pressure (Pa) | Enthalpy (MJ/kg) | Facility | Data | Mixture |
|---|---|---|---|---|
| 3800 | 25 | CORIA ICP | VUV to VIS | CO2 |
| 9000 | 8.5 | CORIA ICP | VUV to VIS | CO2 |
| 2.9 to 5.3 | 4.16 to 35 | ICARE PHEDRA | VUV to NIR | 97% CO2-3% N2 |
| 130 | 10, 15, and 20 | IRS PWK3 | UV to VIS | CO2 |
| 95,000 | 19 | LAEPT ICP | UV to NIR | 97% CO2-3% N2 |
Publisher’s Note: MDPI stays neutral with regard to jurisdictional claims in published maps and institutional affiliations. |
© 2021 by the author. Licensee MDPI, Basel, Switzerland. This article is an open access article distributed under the terms and conditions of the Creative Commons Attribution (CC BY) license (http://creativecommons.org/licenses/by/4.0/).
Share and Cite
MDPI and ACS Style
Reynier, P. Survey of CO2 Radiation Experimental Data in Relation with Planetary Entry. Galaxies 2021, 9, 15. https://0-doi-org.brum.beds.ac.uk/10.3390/galaxies9010015
AMA Style
Reynier P. Survey of CO2 Radiation Experimental Data in Relation with Planetary Entry. Galaxies. 2021; 9(1):15. https://0-doi-org.brum.beds.ac.uk/10.3390/galaxies9010015
Chicago/Turabian StyleReynier, Philippe. 2021. "Survey of CO2 Radiation Experimental Data in Relation with Planetary Entry" Galaxies 9, no. 1: 15. https://0-doi-org.brum.beds.ac.uk/10.3390/galaxies9010015
Note that from the first issue of 2016, this journal uses article numbers instead of page numbers. See further details here.