Analysis of the Open Cluster NGC 2281


1
Southwest Research Institute, Boulder, CO 80302, USA
2
Sonoita Research Observatory, Sonoita, AZ 85637, USA
*
Author to whom correspondence should be addressed.
Galaxies 2021, 9(1), 7; https://0-doi-org.brum.beds.ac.uk/10.3390/galaxies9010007
Submission received: 29 December 2020
/
Revised: 14 January 2021
/
Accepted: 18 January 2021
/
Published: 21 January 2021
Abstract
: observations of an approximately field centered on the open cluster NGC 2281 and covering more than 400 nights from 2013 to 2018 are presented. The photometric observations were transformed to the standard system using standards from the American Association of Variable Star Observers Photometric All-sky Survey (APASS) DR10 and analyzed with Gaia DR2 parallaxes and proper motions to determine the distance, age, and metallicity of the cluster. The discovery of an eclipsing binary in the field is discussed.
1. Introduction
Modern all-sky surveys are powering rapid changes in our knowledge of astronomical objects. Two surveys that are still incomplete, but nonetheless widely used, are the AAVSO Photometric All Sky Survey (APASS) [1] and the Gaia astrometric/photometric mission [2,3]. APASS is a photometric survey in the Johnson and Sloan Digital Sky Survey passbands, covering the 10th to 17th magnitude range. Gaia is providing parallaxes and proper motions of unprecedented accuracy and number, as well as broadband photometry, over a similar range of magnitudes, making the two surveys quite complementary. While both surveys are still in progress, early data releases have given the community the opportunity to begin using both catalogs, and the response has been enthusiastic. DR10 is the most recent APASS release, and DR2 is the most recent Gaia release. We employ both catalogs in this work.
Open clusters provide valuable tests for stellar evolution theory and Galactic populations. The derived properties of clusters also underpin the fields of galactic and extragalactic astronomy. One of the most important quantities derived from studies of open (and other) clusters is the age of the cluster. Cluster age is determined by fitting theoretical isochrones to the observed color–magnitude diagram, but the process is difficult and the absolute (external) uncertainties in the derived age are typically 20% as seen, for example, in VandenBerg & Stetson [4] although more recent work such as VandenBerg & Denissenkov [5] and Leaman, VandenBerg & Mendel [6] shows that 10% absolute uncertainty is possible. In review, the referee pointed out the important point that the absolute uncertainty is dominated by the isochrones rather than the observations and that the relative uncertainty of age determinations of different clusters using the same isochrones is typically 5%. Clearly, there is still valuable work to be done on these objects.
In preparation for the unique dataset that Gaia would provide and to look for variable stars in clusters, we began a program of photometric monitoring of bright open clusters with small telescopes to improve on the existing observations. There are many bright clusters that have not been observed in decades, some only having observations that pre-date the widespread use of CCD imagers, and thus are limited to the brighter stars of the cluster. Our program has about two dozen open clusters that are observed nightly whenever possible. The target clusters were chosen for their observability with our equipment and their need for more comprehensive observations, rather than astrophysical interests such as age or chemical composition. The observing program has been running for over a decade and most of the clusters have several hundred nights of observations, enabling searches for variable stars.
NGC 2281 was chosen as the first cluster for analysis primarily because we discovered an eclipsing binary in the field early on in the program and were interested in whether it was a cluster member. The cluster is of intermediate-age and the last published photometry is given in Yoshizawa [7] going down to about for cluster members. Earlier photometric datasets were published by Alcaino [8] and Pesch [9]. Proper motion studies of the cluster field were performed by Vasilevskis & Balz [10] and Francic [11]. Herein, we use Gaia parallaxes and proper motions, and provide photometry of cluster members down to .
2. Photometric Observations
In early 2013, NGC 2281 was included in a program at the Sonoita Research Observatory (SRO)to search for variable stars in open clusters. Of particular interest to our group was finding eclipsing binary stars that were members of clusters, since they can provide independent estimates of cluster distances using the Direct Distance Estimation process discussed by Wilson [12].
SRO is a robotic observatory with a 0.5 m f/4 folded Newtonian reflector telescope and a Santa Barabara Instrument Group STL 6303 CCD camera with a variety of photometric filters of which Johnson was used in this project. The robotic operation is performed using the ACP Expert software from DC3 Dreams, Inc. [13]. ACP Expert includes a real-time scheduler that assesses current conditions and decides which target in a database is to be observed [14]. The open clusters in our program are observed once per night whenever possible.
For NGC 2281, two short exposures and two longer exposures were made with each filter, 15 and 60 s in B, and 10 and 45 s in V. The images were calibrated in the traditional way by subtracting master bias and dark images, and flatfielded using master flat images that were created approximately daily. The flatfield images were created using a median combined of five images for each filter. Photometry was then performed using SExtractor [15] and PSFEx [16]. The instrumental magnitudes were then transformed to the standard system using in-frame standards from APASS Data Release 10 catalog [1].
Since the APASS standards are in the frame (typically over 200), the transformation process is simpler than the traditional approach of observing target and standard fields separately. The transformation procedure employed was as follows:
- Select APASS stars in the B and V images that have reasonable catalog errors (≤0.1 mag).
- Perform a least squares fit to observed magnitudes (m) and the catalog magnitudes (M) and colors (C) via the equationwhere , , and are the transformation coefficients.
- Remove observations that have residuals larger than a specified value (≤0.05 mag) and repeat the least squares fit to get the final transformation coefficients.
- Use the transformation coefficients to transform the instrumental magnitudes onto the standard system via Equation (1). Since the transformed color C is not known for non-APASS stars, a trial value is used to compute B and V, the trial value is replaced with the computed (), and then B and V are recomputed. This process is iterated until the value converges.
Depending on its brightness, each star could be measured up to four times per night in each passband, and nightly means of the observations were formed. These nightly means were then searched for variables. For non-variable stars, the nightly means were averaged to produce a catalog of photometry of the stars in the field that could be used to derive the properties of the cluster. Table 1 contains the catalog of observations. On the bright end, the scatter in both the V and B observations was about 0.02 mag. At the faint end (), the scatter in V was about 0.05 mag and the scatter in B was about 0.09 mag.
3. Variable Stars
We employed a variety of techniques designed to identify variables such as the Welch–Stetson index [17], the Lomb–Scargle periodogram [18], the von Neumann ratio [19,20] and the interquartile range [21]. Light curves of stars indicated as variables by any of these methods were inspected manually.
3.1. The Eclipsing Binary GSC 2945:01857
The first variable we discovered was the eclipsing binary GSC 2945:01857 (Gaia DR2 945659684417425536, 2MASS 06470560 + 4054235). The system is detached and the two components have a large difference in surface brightness. Over 1500 measurements each in B and V were analyzed with the Wilson–Devinney (WD) program [12,22,23,24]. Table 2 gives the individual observations. From 15 observations made near the bottom of the secondary eclipse, the () color is and, when combined with the reddening determined in Section 4, we find that for the primary, making it an F5-F8 star.
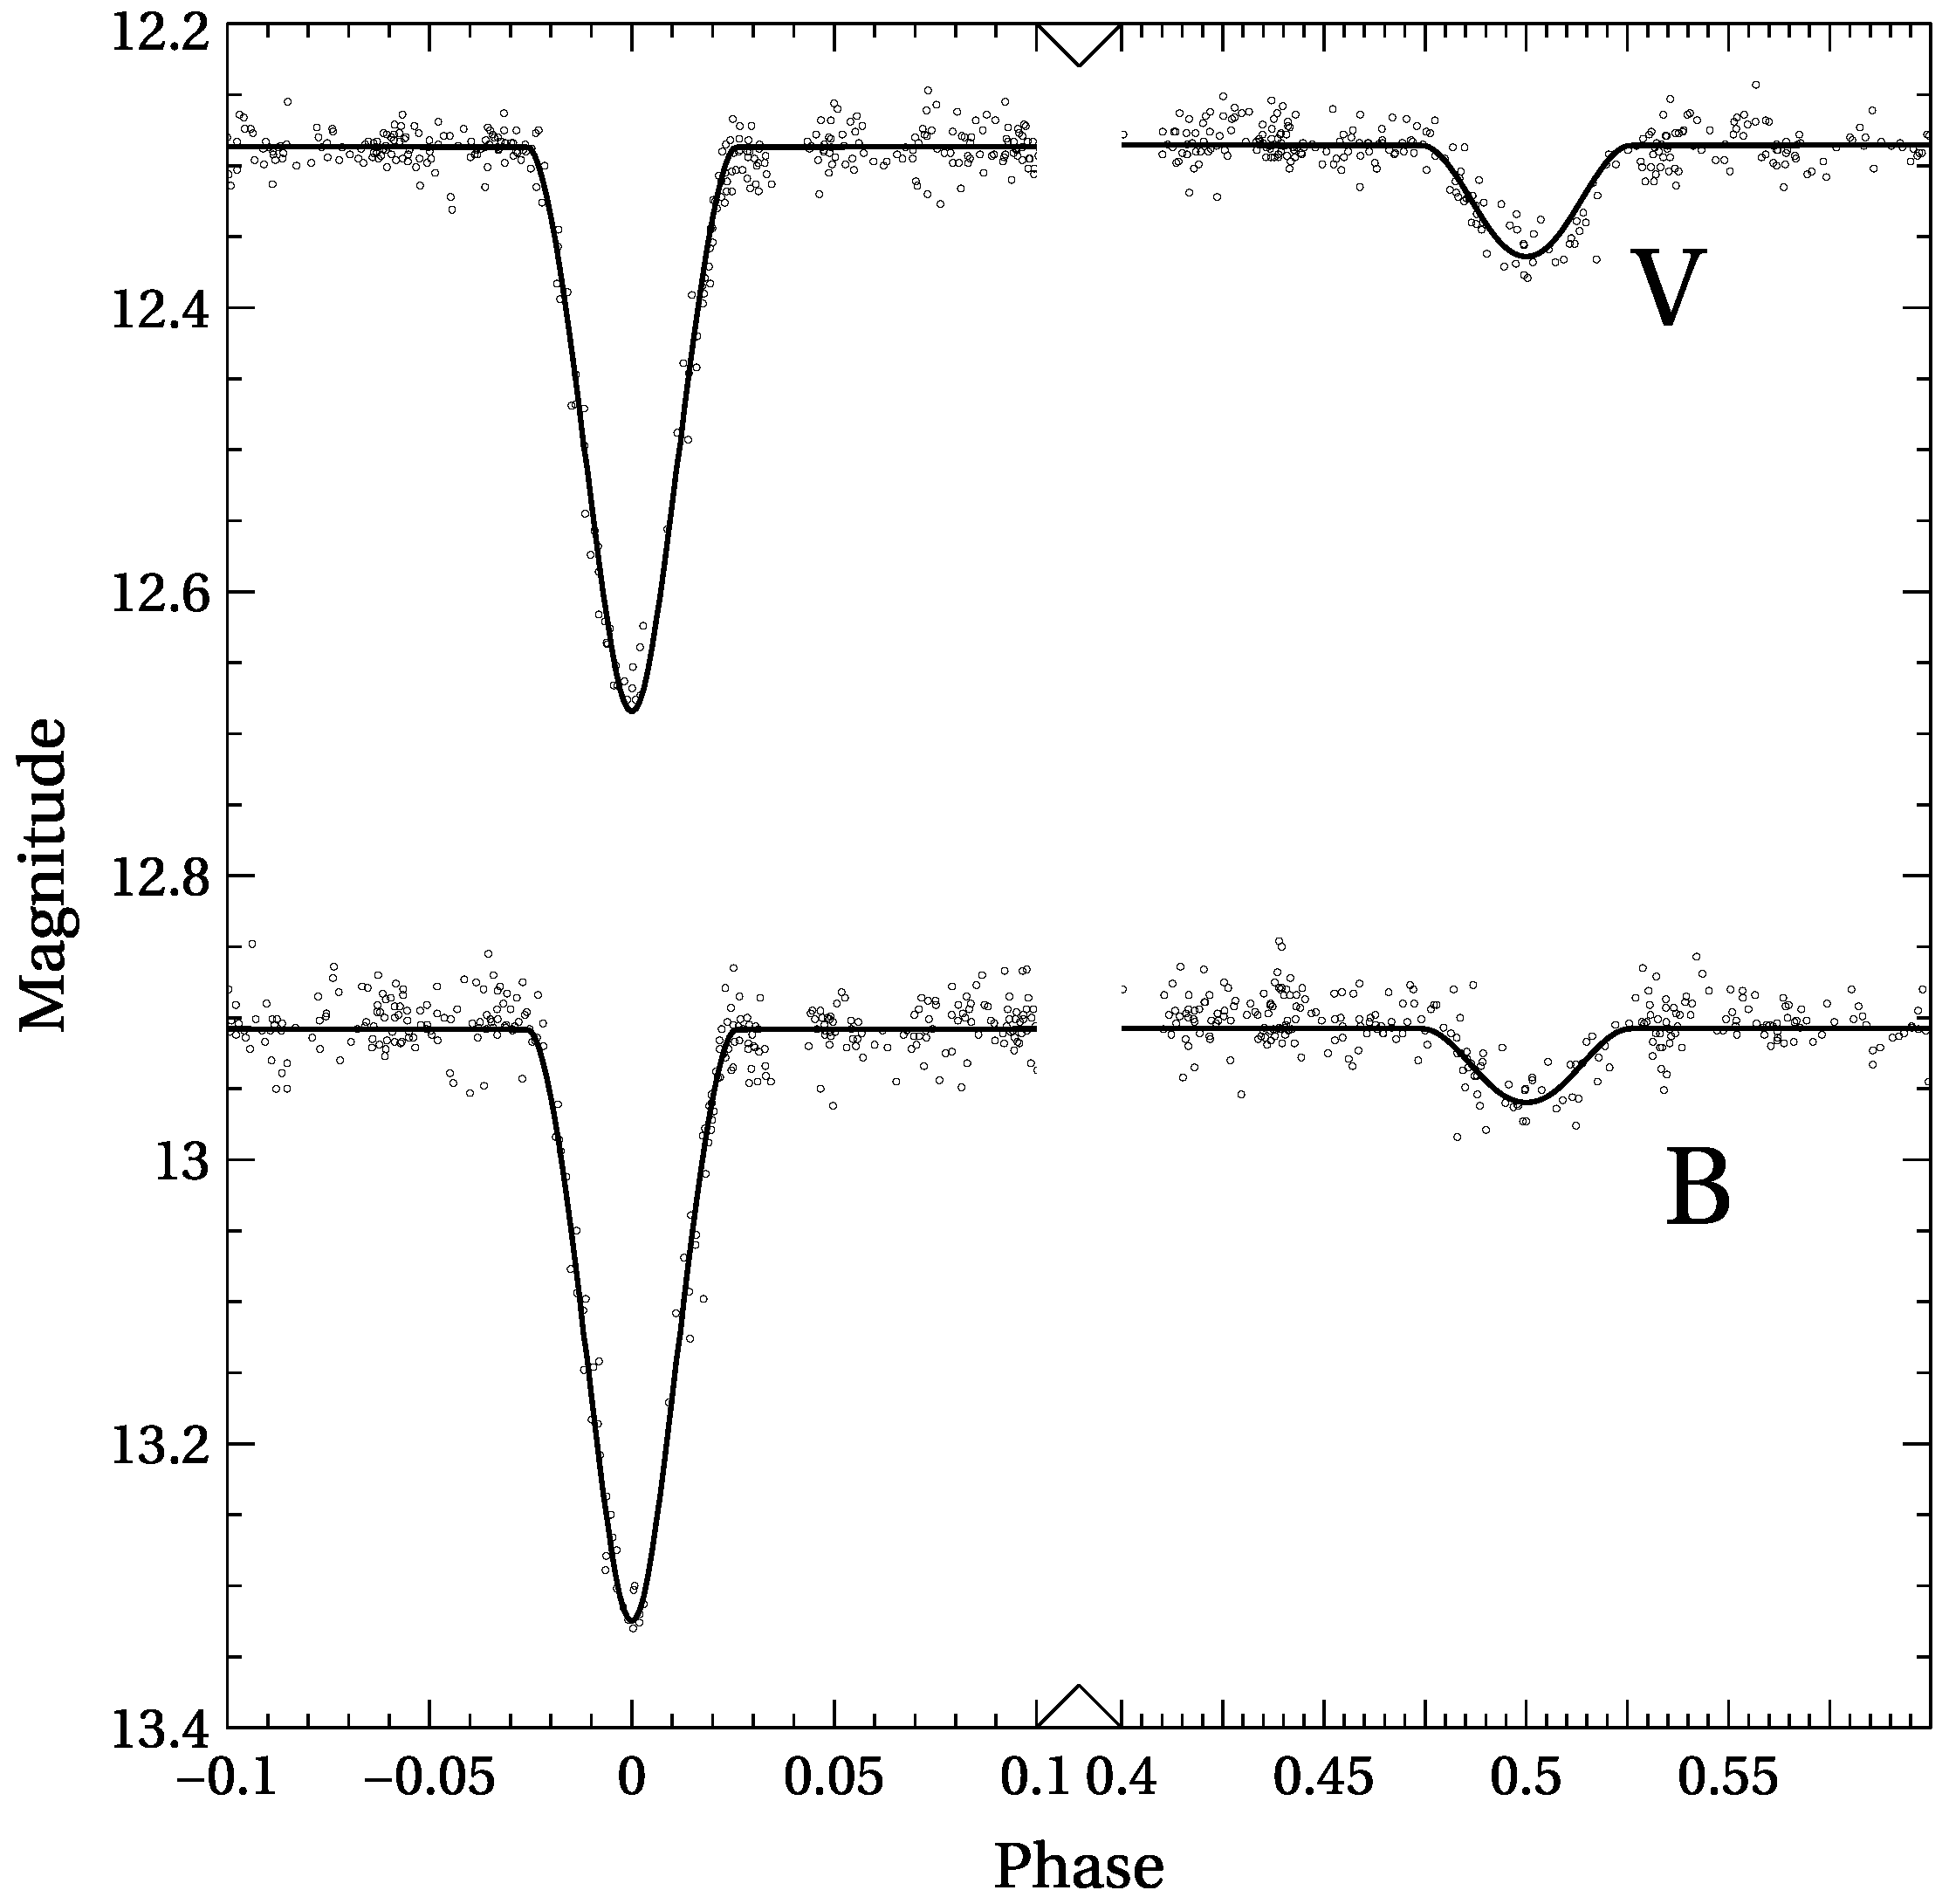
Since the system is detached, and we have no radial velocities, there is no way to determine the mass ratio with any reasonable accuracy from the photometry [25]. However, it is reasonable to assume that the binary components are the main sequence stars, and we can get preliminary estimates of some of the binary properties. The orbit appears to be circular and the inclination is high enough (≈86°) to cause the eclipses to be nearly complete. The ephemeris parameters from our fit are days and . By setting the log of the distance to the system in parsecs at the Gaia value of 2.679, we found that a solution with , , , , , and fit the observations reasonably well, as shown in Figure 1. This solution should be considered very preliminary and only useful for approximate estimates of the component properties until radial velocity observations of the components can be measured and a proper simultaneous solution can be done. Analysis of the Gaia parallaxes and proper motions shows that GSC 2945:01875 has a cluster membership probability of only 18%. In Section 4.3, we discuss the membership probability of the system in more detail.
3.2. GSC 2945:01760
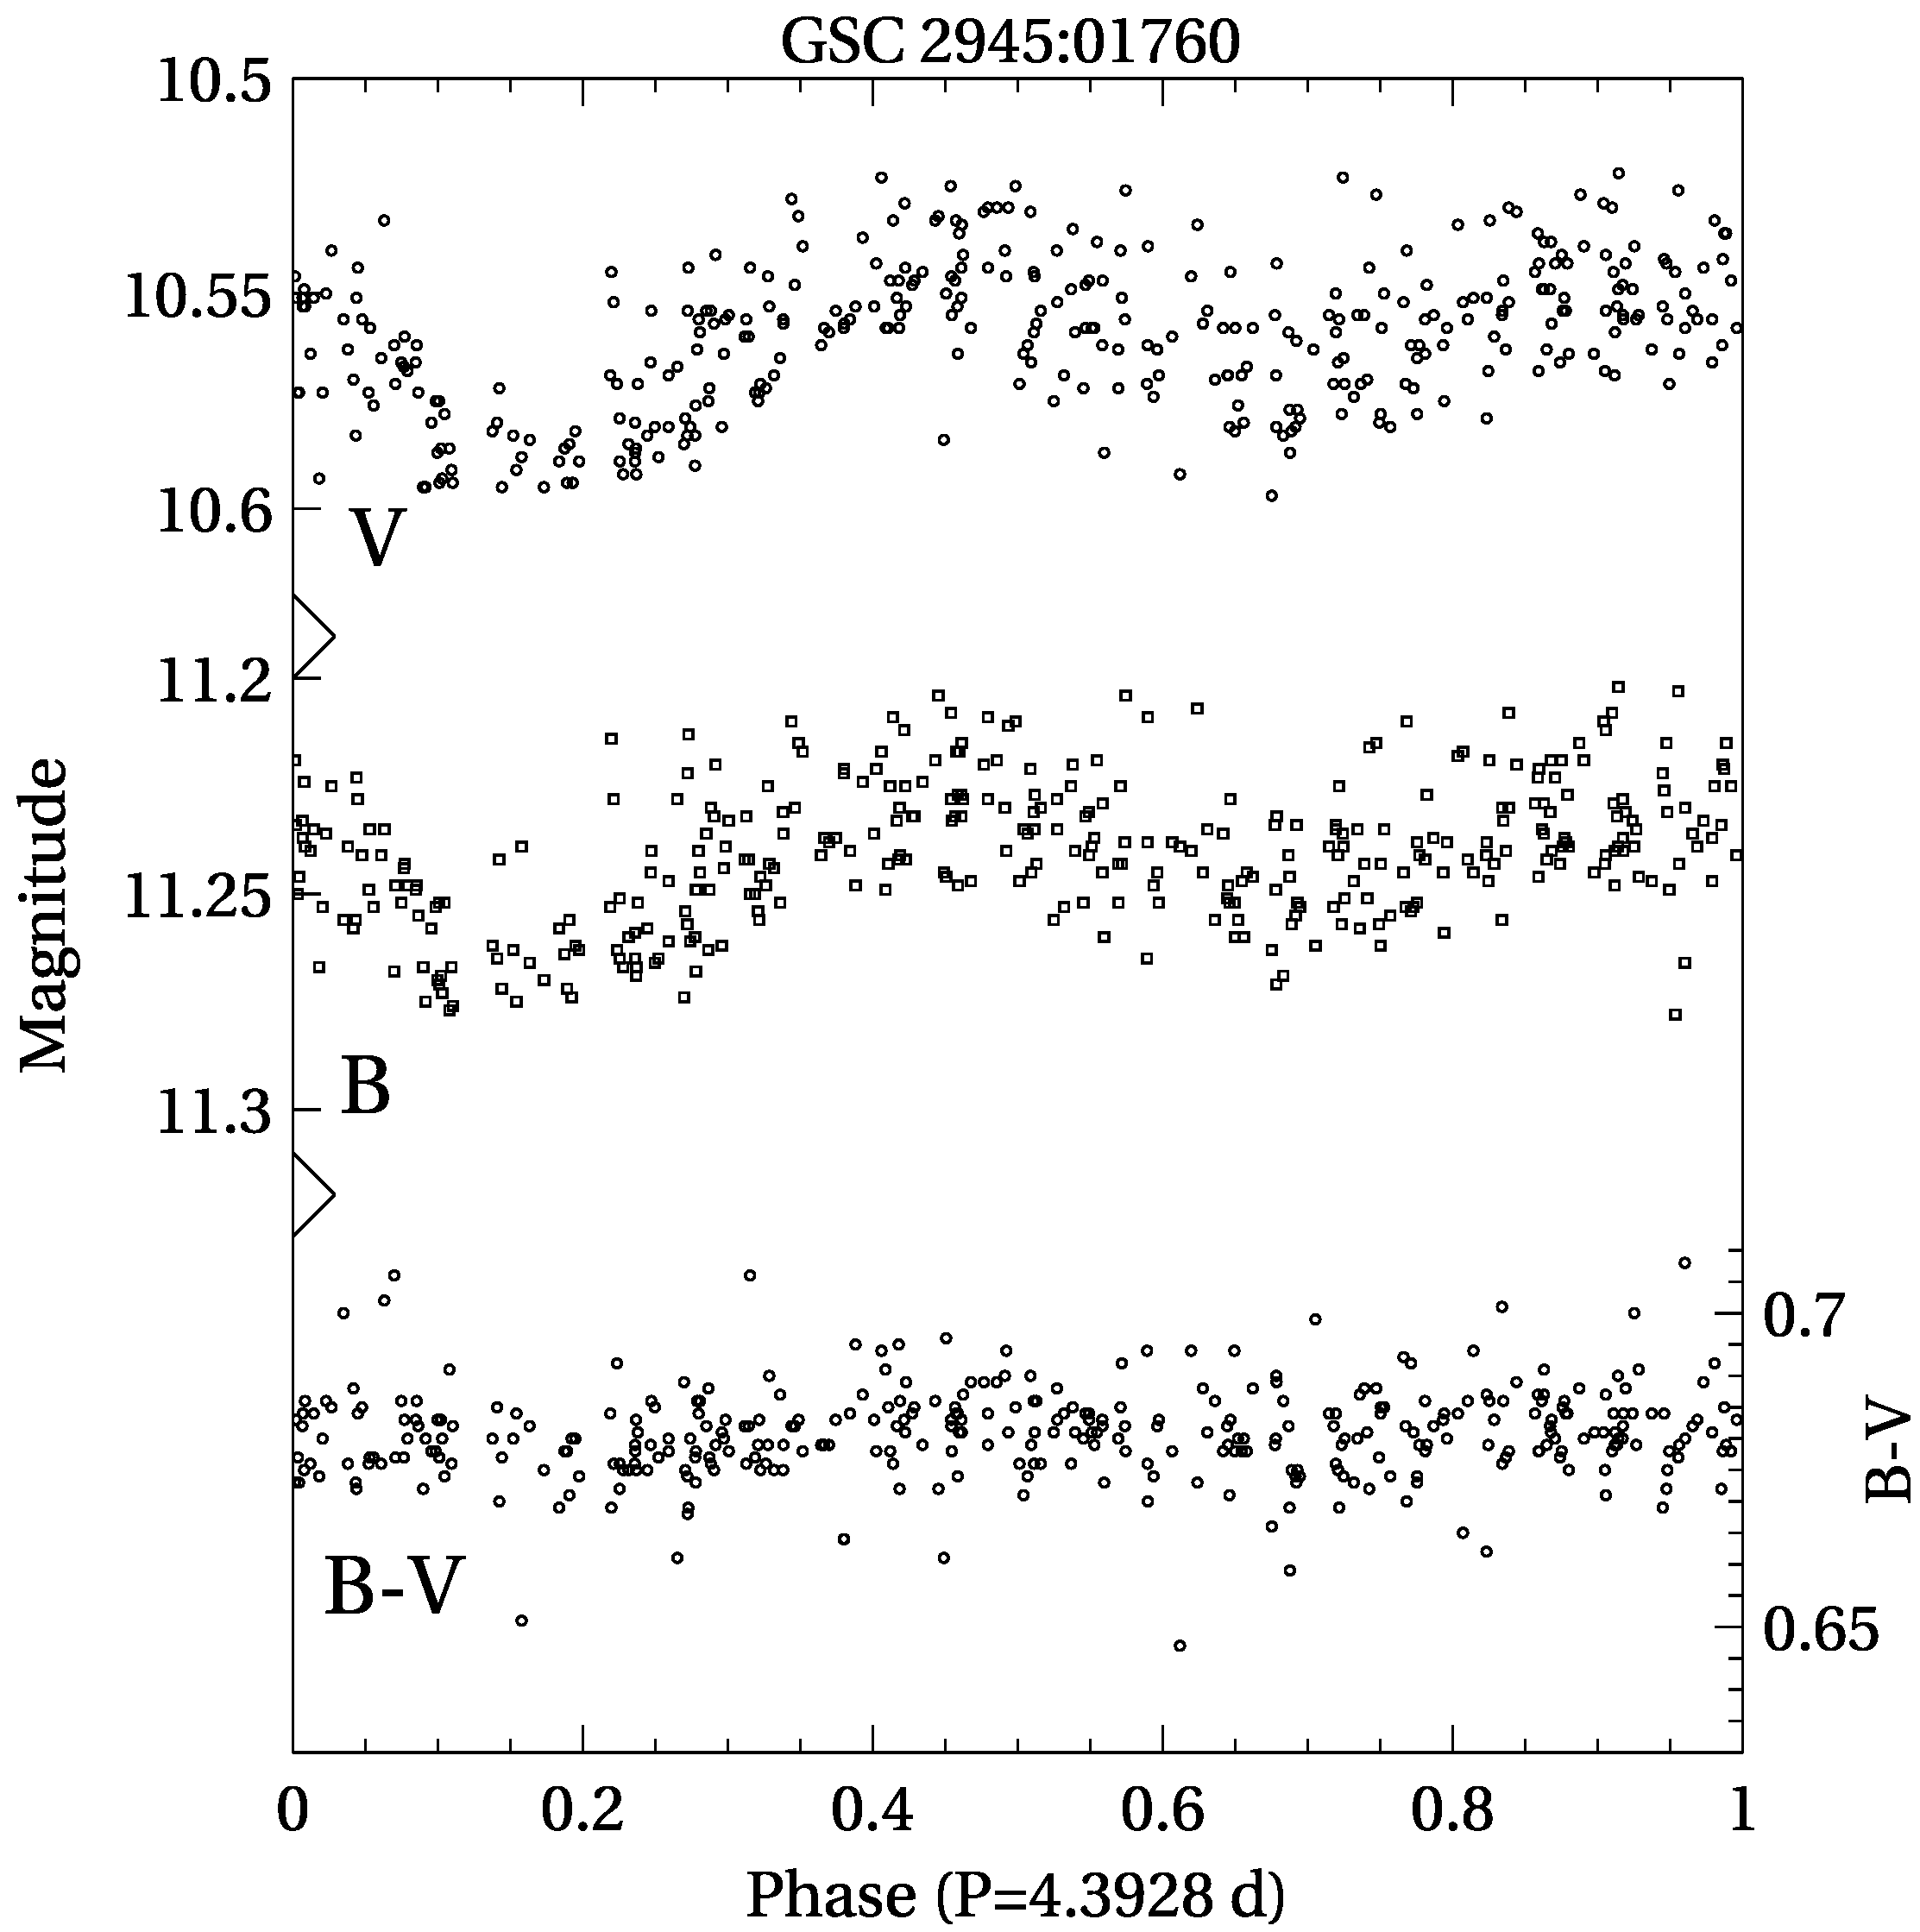
GSC 2945:01760 (Gaia DR2 951462803710363392, 2MASS 06491218 + 4052239) appears to be a low-amplitude ellipsoidal variable with a period of 4.3928 days. With , , and a Gaia distance of about 900 pc, it is clearly not a member of the cluster. There is no discernible color change over the orbital period. Figure 2 shows the phased light and color curves of the system.
4. Cluster Properties
4.1. Membership Probabilities
Traditionally, membership probabilities in clusters have been determined primarily by the analysis of the proper motions of stars in the field. Vasilevskis et al. [26] describe a now commonly used approach of assuming that cluster and field (i.e., non-member) star proper motion distributions can be modeled by distinct bivariate functions, and , respectively, such that the cluster membership probability of a star is given by
Vasilevskis & Balz [10] applied a slightly modified version of this approach to the NGC 2281 field and measured relative proper motions of 127 stars brighter than photographic magnitude 13. They found that 56 of those stars were likely cluster members. Proper motions from Gaia DR2 are more precise than the Vasilevskis & Balz [10] values and are available for significantly fainter stars () in the field. Clearly, even a traditional proper motion analysis using the Gaia data would be a huge improvement over the existing analysis, but Gaia provides another valuable measurement for each star that greatly strengthens the determination of cluster membership probability: the parallax.
Accurate parallaxes provide an additional constraint on the determination of cluster membership. With proper motions, the constraint applied is that the member stars have similar motions in the plane of the sky. With accurate parallaxes, the stars are also required to have similar distances. It should be noted that once accurate radial velocities for a large number of stars in the field are available from Gaia, they too could be used to strengthen membership probability calculations.
To determine membership probabilities, a Python program using the scikit-learn machine learning library in the Astropy package [27] was written to apply a Gaussian mixture model, in particular, the scikit-learn BayesianGaussianMixture object; to all of the stars in the field, we observed that have proper motion values mas yr 8 mas yr, 5 mas yrmas yr, a parallax greater than 1.0 mas (i.e., a distance less than 1000 pc), and parallaxes with errors of 10% or less. There are 547 stars with these properties. Two mixture components (representing cluster stars and field stars) were used and the covariance type was set to “full”, meaning that each component has its own general covariance matrix. The weight concentration prior type was set to “dirichlet_distribution”. We also used the GaussianMixture object and found results very similar to using the BayesianGaussianMixture object. This is not surprising, given we only used two mixture components.
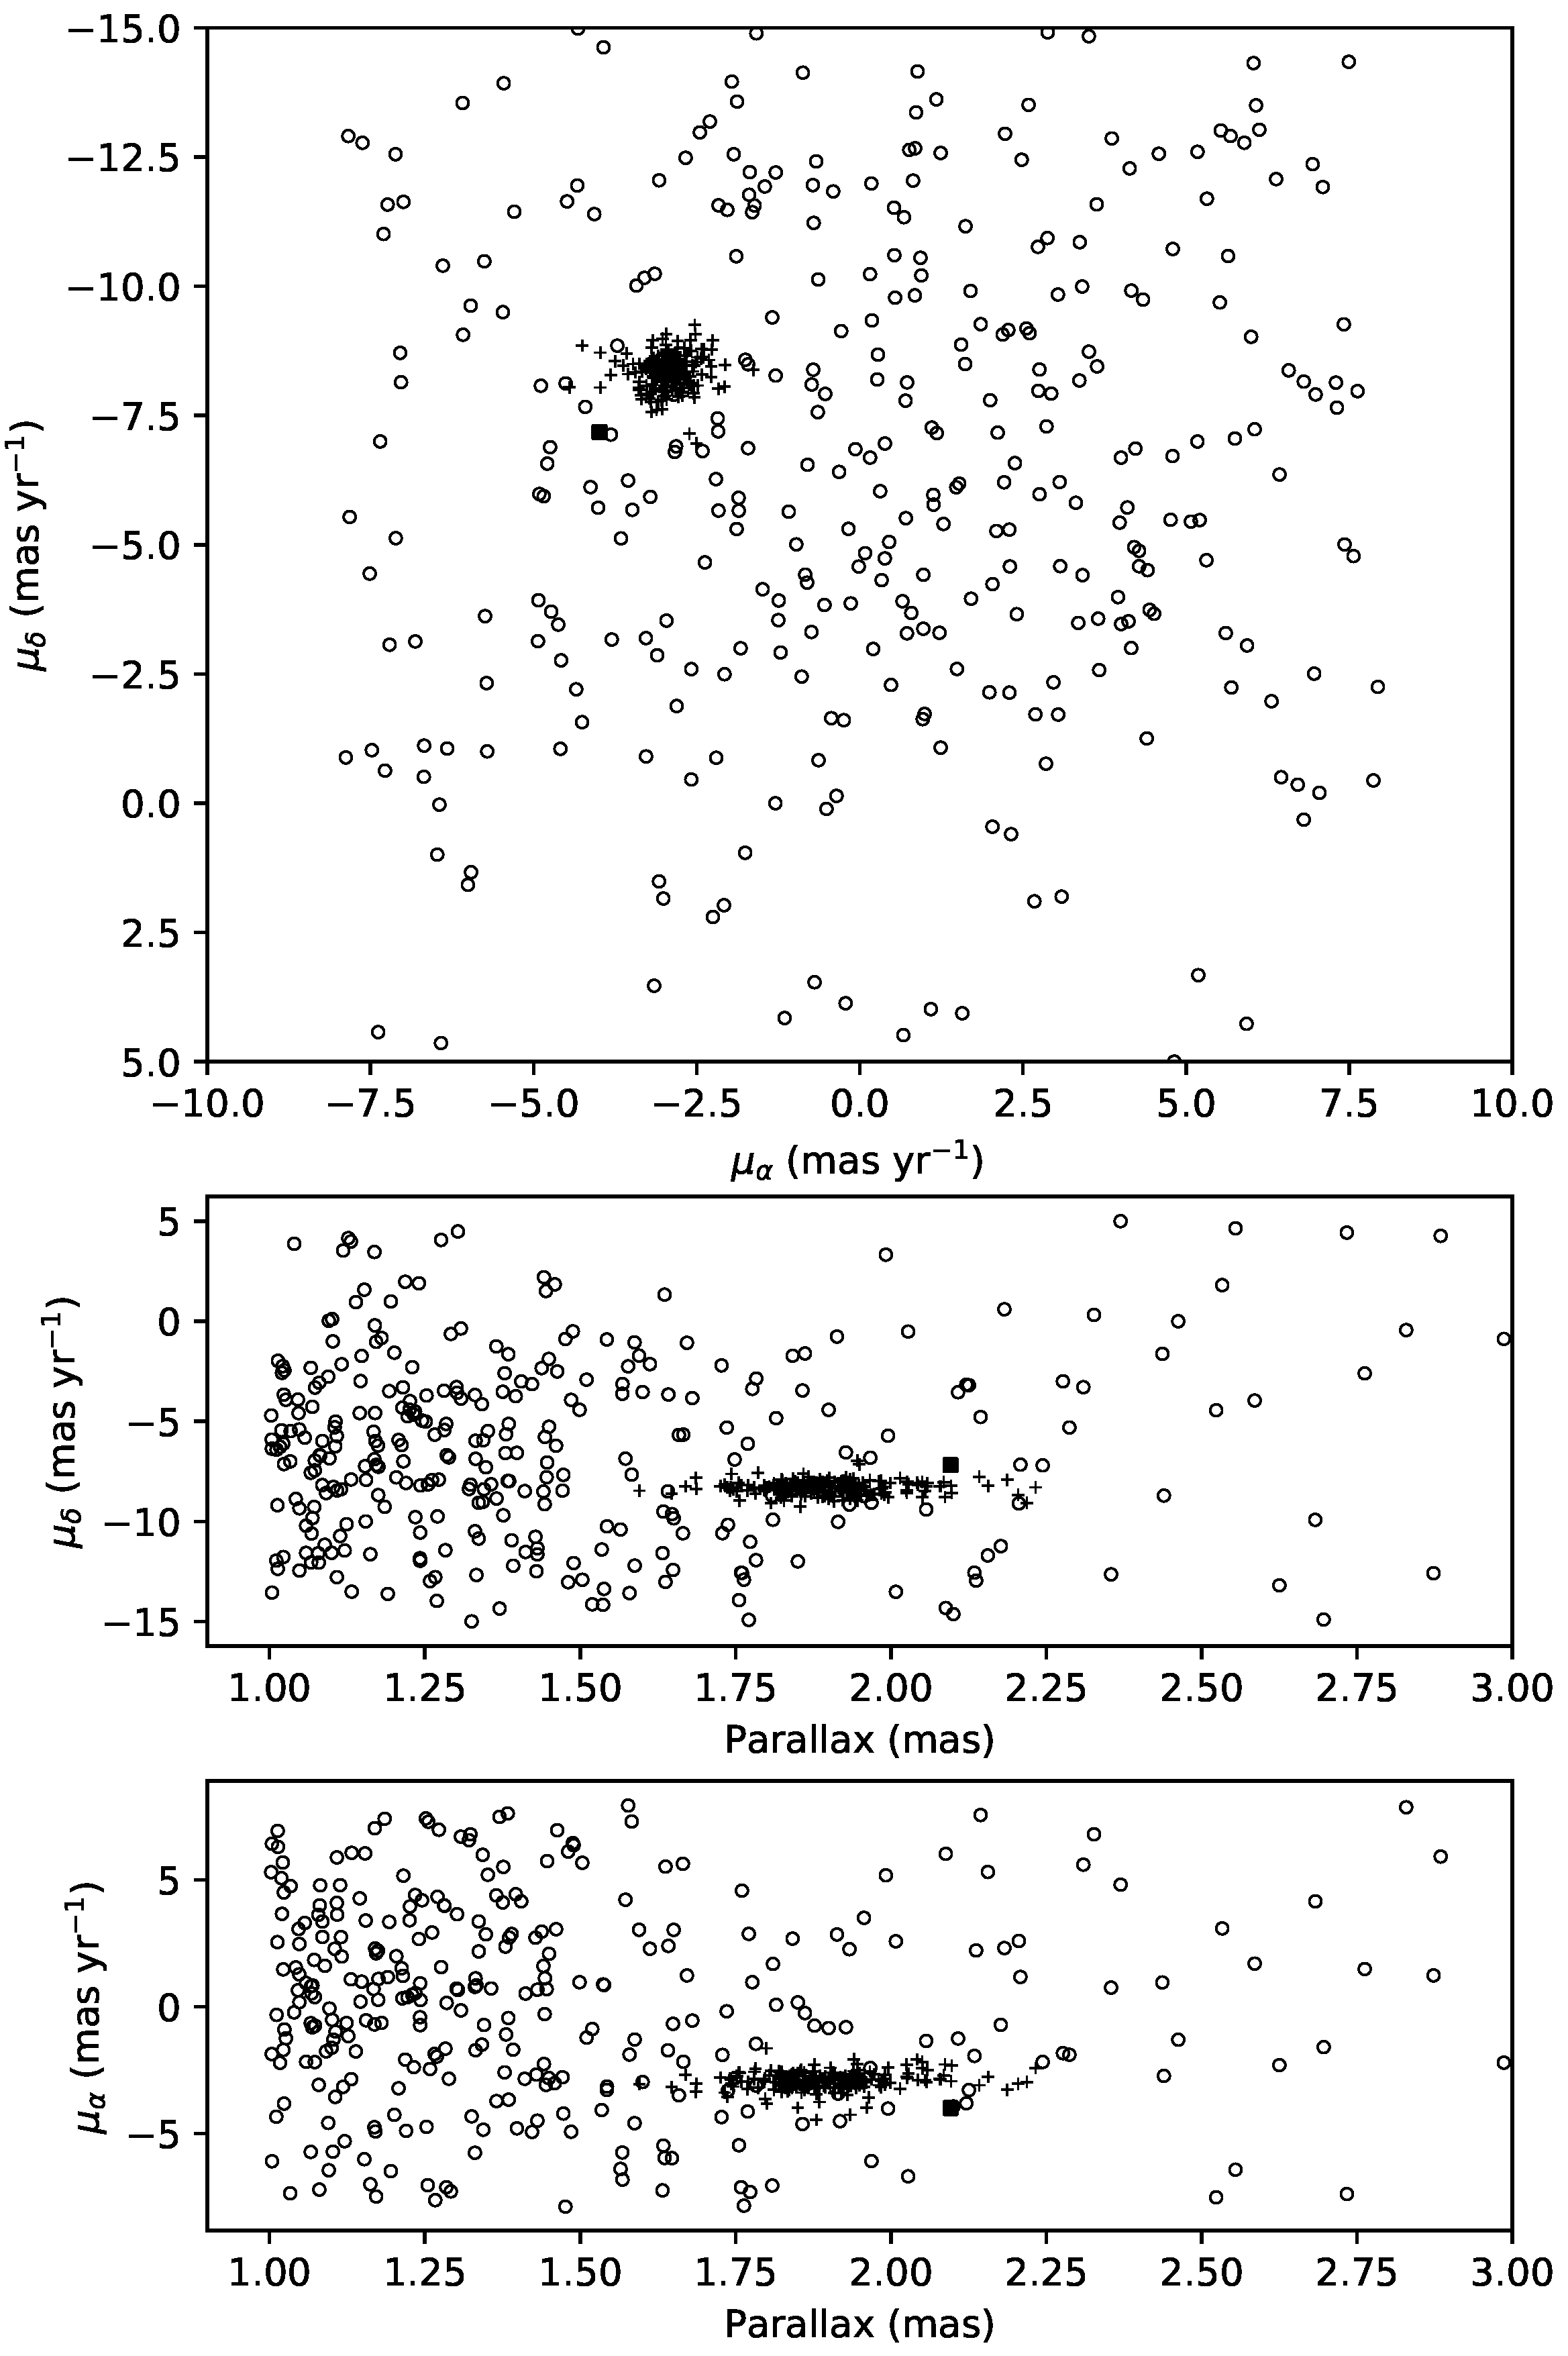
The resulting fit predicts that 334 stars have less than a 50% chance of being a cluster member, with the vast majority of those (324) having less than a 1% membership probability. This leaves 213 stars having membership probabilities greater than 50%, and, of those, 205 have membership probabilities greater than 90%. Table 3 shows the astrometric quantities for the cluster from the fit. Figure 3 shows the locations of members and non-members in our solution.
With only 14 out of 547 stars having membership probabilities between 10% and 90%, the Gaia data for the NGC 2281 field can strongly differentiate cluster and field stars as seen in Figure 4. Figure 5 shows the color–magnitude diagram with the 362 stars for which we were able to measure reliable photometry.
4.2. Distance and Age
Our fit, based on Gaia parallaxes, yields a distance of pc to the cluster. Previous estimates of the distance were made using (visual) fits to the zero-age main sequence in the H-R diagram. As these were visual fits, the authors typically did not provide error estimates for the distances. Pesch [9], using , estimated the distance to be 500 pc. Alcaino [8] estimated a distance of 480 pc and . Yoshizawa [7] found a distance of 457 pc, using and estimated that the distance error might be based partly on the fact that his V photometry was fainter than both the Pesch [9] and the Alcaino [8] photometry by about . Francic [11] determined a distance of 443 pc, while Kharchenko, et al. [27] used the All-Sky Compiled Catalogue of 2.5 Million Stars [28] to determine a distance of 570 pc. Gao [29] presents a detailed analysis of the Gaia DR2 data to derive a distance of 522 ± 12 pc, in excellent agreement with our value.
Assuming there are no systematic errors in the Gaia parallaxes, our distance estimates, based primarily on those parallaxes, should be significantly more reliable than the older estimates based on subjective fitting of the main sequence location in the H-R diagram. Given the small distance to the cluster, the systematic errors would be expected to be negligible [30].
In addition to strengthening the membership probability fit, having an accurate distance from Gaia also greatly improves the isochrone fitting process. By fixing the distance, we can reduce the number of adjusted parameters in that process to age, chemical composition, and reddening, and eliminate uncertainties in the fit due to correlations between the distance and other parameters.
Fitting isochrones from stellar models is not a straightforward process in the usual sense of fitting models to observations, where residuals are computed and minimized so that they fall relatively evenly on both sides of the fitted function. An obvious illustration of this problem for isochrone fitting is the widening of the main sequence by binaries that can be brighter than single stars by up to 0.75 mag. Since isochrones represent the evolutionary end points of single stars at a given age, they do not model the widened main sequence in the observed H-R diagram. The traditional approach of fitting isochrones by eye is to ignore the binaries and fit the isochrone to the hot side of the main sequence distribution.
Wilson & Hurley [31] describe a method of getting impersonal parameters from H-R diagrams by using the areal density of points as the observable quantity. Wilson [32] discusses further work on this approach and remaining issues for application to observed clusters. Their method has several advantages over the traditional approach, such as including the binary stars as a natural part of the fitting process. Our approach to fitting the age, chemical composition, and reddening parameters reduces some of the guesswork of the traditional method but is not a fully impersonal fitting approach like the areal density method. The essence of our method is to allow the computer to mimic the “fit by eye” approach and requires a reliable indicator of the goodness of fit. Traditionally, the fit of the isochrone to the hot side of the main sequence and the fit in the turn-off region are used to find the best isochrone. We focus on these regions and define the isochrone by creating a LineString object from the Python Shapely package. Shapely is widely used for geographic information systems tasks but can be used for a wide variety of problems involving planar features. A LineString representing an isochrone is created using the ((),) points from the isochrone table and represents connected linear splines between them. A wide variety of things can be computed for a LineString, but the important ones for our isochrone fitting process are the minimum distance from a point (e.g., the location in the H-R diagram of a cluster star) and the LineString (i.e., the isochrone) and the coordinates of the point on the LineString at the minimum distance.
We use the sum of the minimum distance (SMD) for each observed cluster star to the isochrone as the basis for the goodness of fit. To achieve good fits, however, weights need to be applied to the minimum distances. To deal with the issue of binary main sequence stars, we give higher weight to main sequence stars that are on the hotter side of isochrone, and we denote this weight by . (SMD values for stars on the cooler side of the main sequence are given unit weight.) This has the effect of forcing the isochrone to fit the single stars on the main sequence. We also give a higher weight for the stars in the turnoff region, denoted by . This allows the fitting process to be sensitive to the less numerous but nonetheless very important stars in the turnoff region. The weights are subjective but can be tuned to define a good fit to both the main sequence and turnoff regions. In the case of our NGC 2281 data, we found that increasing the weight of stars on the hotter side of the isochrone by a factor of three, and stars in the turnoff region by a factor of five, gave good results. Application of this method to other data sets might find these weights to be different. A second set of weights, based on the errors in the () observations, is also applied. This weight is computed as the reciprocal of the B and V errors added in quadrature. These ()* weights are then scaled to a maximum of 1 and the SMD is computed as the product of the raw SMD, the () weight, and the main sequence weight or turnoff weight as appropriate.
With goodness of fit now defined, isochrones of a variety of ages and chemical compositions, reddened by a range of values, can now be compared to the observed data, which we limited to cluster members brighter than . We used the PARSEC version 1.2S tracks [33] from the Padova site (http://stev.oapd.inaf.it/cgi-bin/cmd) to form our isochrones. We note that we did not fit the two post-AGB cluster members because these isochrones do not yet implement post-AGB tracks. Metal fraction (Z) was varied from 0.01 to 0.034 in steps of 0.001. The values ran from 8.0 to 9.0 in steps of 0.01. was varied from 0.0 to 0.127 in 0.001 steps. The upper limit on the reddening was taken from the Schlafly & Finkbeiner [34] maps as provided by the NASA/IPAC Infrared Science Archive (https://irsa.ipac.caltech.edu/applications/DUST/). The SMD was then calculated for all combinations (about ) of Z, , and and sorted to reveal the combinations that gave the lowest values of the sum.
If the SMD is an effective measure of the goodness of fit, the parameter combinations that give the lowest values should cluster around a small region of parameter space. In the case of the NGC 2281 data, this is indeed what happens. Using and , the top two parameter combinations had identical Z (0.02) and (8.80) and the values were 0.122 and 0.123. The difference in the SMD for those two parameter sets was less than 0.1%. If we select the parameter combinations that have an SMD variation of 1%, we find that these are the top 50 sets of parameters. The top 622 sets of parameters have an SMD variation of 5%.
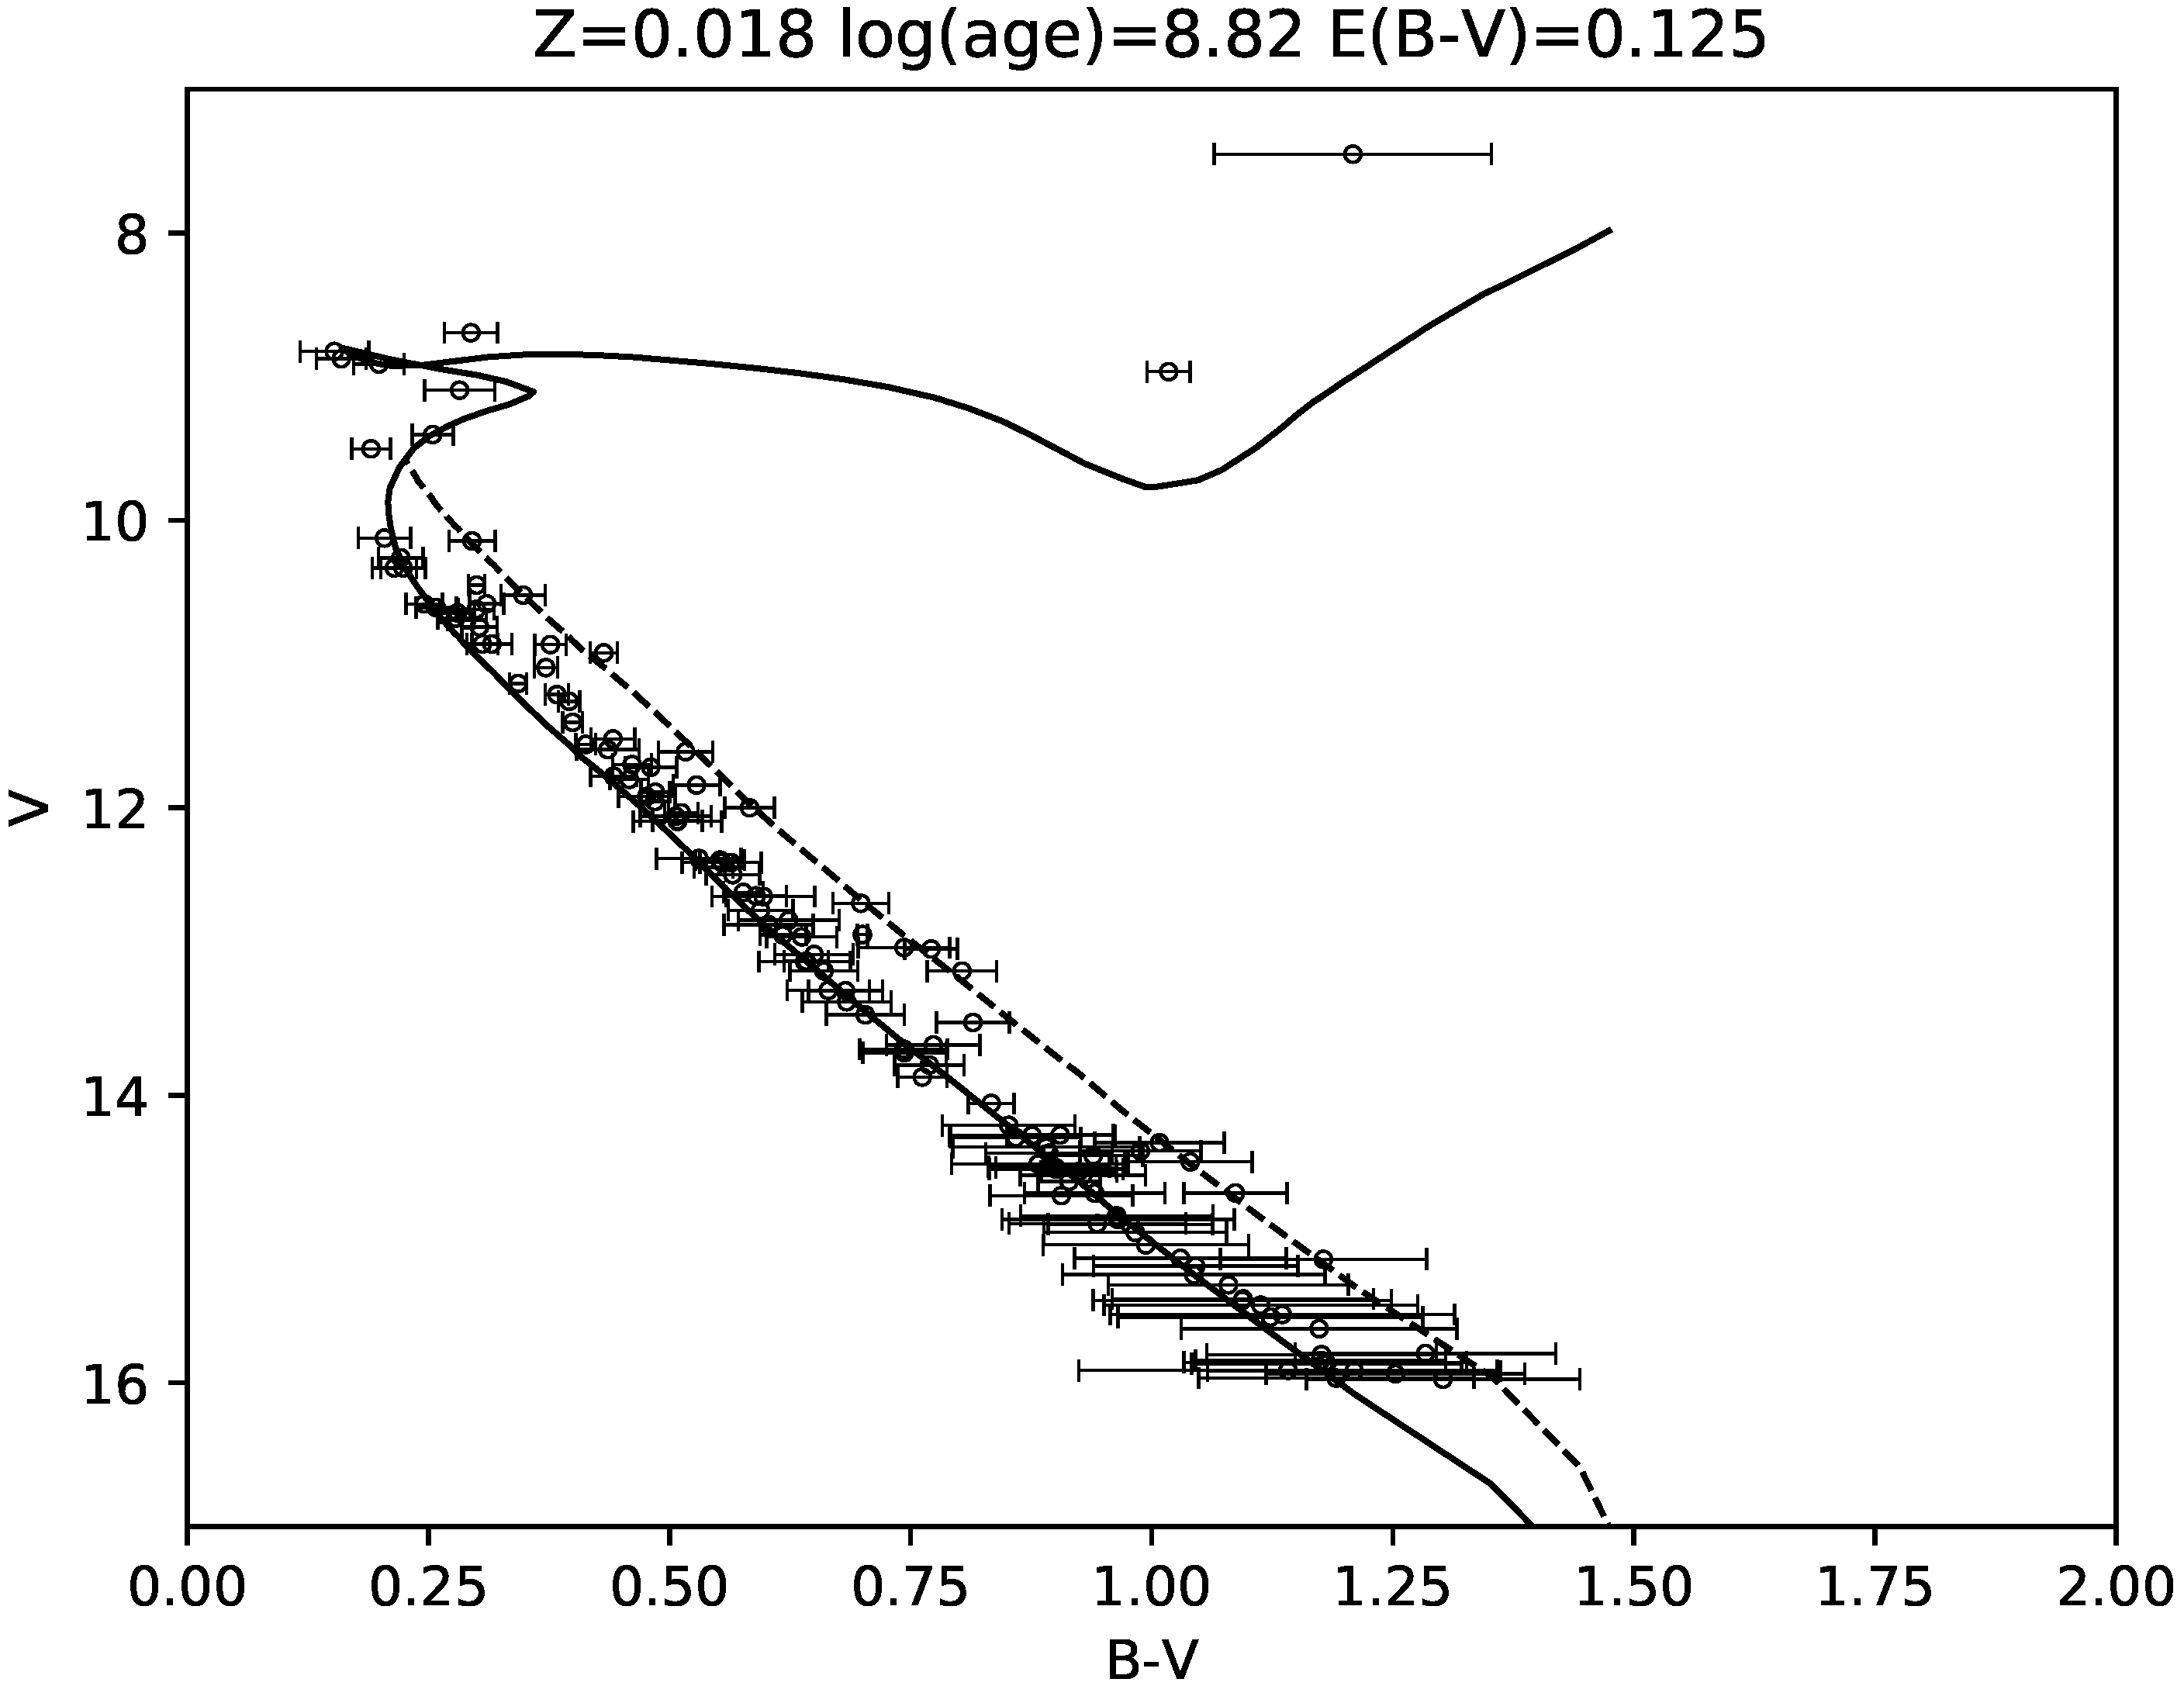
To see how the subjective weighting might vary the results, we also performed the fitting process with and . The results were encouraging, with the parameter values being nearly identical in the 5% SMD variation case. Table 4 gives the mean and standard deviation of the parameters for each of these cases, and illustrates the small spread of parameter values around the lowest SMD values. Figure 6 shows the best fit for the and case and Figure 7 shows the best fit for the and case.
4.3. Membership and Importance of GSC 2945:01857
The fit to the distances and proper motions gives GSC 2945:01857 a membership probability of only 18%. The Gaia parallax of 2.096 ± 0.061, which gives a distance of pc, is within the range of values for previously identified cluster members (see Figure 4), but it is definitely in the (nearby) wing of the distribution. The proper motions are also consistent with the cluster values but also in the wings. Thus, the astrometric quantities of the binary are close to the cluster values, but not close enough to make a strong case for membership. However, Lindegren, et al. [30] point out that the Gaia DR2 solution employs a single-star model for the derivation of the astrometric quantities and that the orbital and photometric variability of unresolved binaries “may bias the astrometric parameters for such sources.” If, as is often the case for close binaries like GSC 2945:01857, the system turns out to have a third component that could also introduce biases in the single-star solution model of DR2, and future refinement of the Gaia data might indicate a higher membership probability. However, the strongest argument against membership may be the photometry. The light curve solution, again preliminary, indicates that the secondary contributes about 10% of the system light in V at quadrature. The location of the system in the color–magnitude diagram (Figure 5) requires that the binary be about 0.5 mag brighter than a single star, in contrast to the value of 0.1 mag from the light curve solution.
In a detached binary with partial eclipses, the ratio of the radii of the stars is not strongly constrained. However, if GSC 2945:01857 is a cluster member, the components must be main sequence stars, and the large difference in the eclipse depths strongly constrains the ratio of surface brightness, and, since the orbit is circular, the ratio of the surface temperatures. This circumstance makes it difficult to find a combination of main sequence stars that has the required ratio of surface temperatures from the light curves and the flux ratio required by the location of the system in the color–magnitude diagram. Speculation on more exotic explanations (e.g., rapid rotation of the primary star, or multiple populations) would not carry much weight without further study.
Based on the current data, the case for GSC 2945:01857 being a member of NGC 2281 is weak, but it is worthy of further study, particularly radial velocity observations. If radial velocities can be measured for the components, a simultaneous light-velocity solution would give a good check on the Gaia distance and on possible systematics at play in the Gaia DR2 data for binary stars in the cluster, of which the color–magnitude diagram appears to reveal many.
5. Conclusions
Our photometry, calibrated using APASS standards, combined with Gaia DR2 proper motions and distances has allowed us to determine the distance, age, and metallicity of the open cluster NGC 2281. Fitting the Gaia parallax and proper motion data, we find that the distance to the cluster is pc. The two best isochrone fits have log(age) values of 8.80 and 8.82, and metallicity values of 0.02 and 0.018. The reddening values are 0.123 and 0.125 mag, and compare well with the value of mag obtained by Glaspey [35] from the spectroscopy of 14 cluster members. GSC 2945:01857 is a newly discovered eclipsing binary with a 3.9 day period, but the astrometric data currently give it only an 18% probability of being a cluster member. Future Gaia data and processing, along with radial velocities could alter that membership probability.
Supplementary Materials
The following are available online at https://0-www-mdpi-com.brum.beds.ac.uk/2075-4434/9/1/7/s1.
Author Contributions
Individual contributions to this work are as follows: conceptualization, D.T., J.G., and W.R.C.J.; methodology, D.T.; software, D.T.; validation, D.T.; formal analysis, D.T.; investigation, D.T., J.G., and W.R.C.J.; resources, J.G. and D.T.; data curation, D.T.; writing—original draft preparation, D.T.; writing—review and editing, D.T., J.G., and W.R.C.J.; visualization, D.T.; supervision, D.T.; project administration, D.T.; funding acquisition, None. All authors have read and agreed to the published version of the manuscript.
Funding
This research received no external funding.
Data Availability Statement
The photometry used in this study are available in the Supplementary Data Files. The APASS standards are available from the AAVSO web site at https://www.aavso.org/apass. The Gaia data are available at https://www.cosmos.esa.int/web/gaia/dr2.
Acknowledgments
This research was made possible through the use of the AAVSO Photometric All-Sky Survey (APASS), funded by the Robert Martin Ayers Sciences Fund and NSF AST-1412587. This work has made use of data from the European Space Agency (ESA) mission Gaia (https://www.cosmos.esa.int/gaia), processed by the Gaia Data Processing and Analysis Consortium (DPAC, https://www.cosmos.esa.int/web/gaia/dpac/consortium). Funding for the DPAC has been provided by national institutions, in particular the institutions participating in the Gaia Multilateral Agreement.
Conflicts of Interest
The authors declare no conflict of interest.
Abbreviations
The following abbreviations are used in this manuscript:
| AAVSO | American Association of Variable Star Observers |
| APASS | AAVSO Photometric All-Sky Survey |
References
- Henden, A.A.; Levine, S.; Terrell, D.; Welch, D.L.; Kloppenborg, B.K. APASS Data Release 10. Manuscript in Preparation.
- Brown, A.G.; Vallenari, A.; Prusti, T.; De Bruijne, J.H.; Mignard, F.; Drimmel, R.; Babusiaux, C.; Bailer-Jones, C.A.; Bastian, U.; Biermann, M.; et al. Gaia Data Release 1. Summary of the astrometric, photometric, and survey properties. Astron. Astrophys. 2016, 595, A2. [Google Scholar]
- Prusti, T.; De Bruijne, J.H.; Brown, A.G.; Vallenari, A.; Babusiaux, C.; Bailer-Jones, C.A.; Bastian, U.; Biermann, M.; Evans, D.W.; Eyer, L.; et al. The Gaia Mission. Astron. Astrophys. 2016, 595, A1. [Google Scholar]
- VandenBerg, D.A.; Stetson, P.B. On the Old Open Clusters M67 and NGC 188: Convective Core Overshooting, Color-Temperature Relations, Distances, and Ages. Publ. Astron. Soc. Pac. 2004, 116, 997–1011. [Google Scholar] [CrossRef]
- VandenBerg, D.A.; Denissenkov, P.A. Constraints on the Distance Moduli, Helium and Metal Abundances, and Ages of Globular Clusters from their RR Lyrae and Non-variable Horizontal-branch Stars. III. M55 and NGC 6362. Astrophys. J. 2018, 862, 72–100. [Google Scholar] [CrossRef] [Green Version]
- Leaman, R.; VandenBerg, D.A.; Mendel, J.T. The bifurcated age-metallicity relation of Milky Way globular clusters and its implications for the accretion history of the galaxy. Mon. Not. R. Astron. Soc. 2013, 436, 122–135. [Google Scholar] [CrossRef] [Green Version]
- Yoshizawa, M. Study of the intermediate-age galactic cluster NGC 2281. I. UBV photoelectric observations, binary frequency, and the luminosity function of bright members. Publ. Astron. Soc. Jpn. 1978, 30, 123–138. [Google Scholar]
- Alcaino, G. The Galactic Cluster NGC 2281. Astrophys. J. 1967, 147, 112–116. [Google Scholar] [CrossRef]
- Pesch, P. Photometric and Objective Prism Observations in Three Galactic Clusters. Astrophys. J. 1961, 134, 602–611. [Google Scholar] [CrossRef]
- Vasilevskis, S.; Balz, A.G.A. Relative proper motions of stars in the region of the open cluster NGC 2281. Astron. J. 1959, 64, 170–174. [Google Scholar] [CrossRef]
- Francic, S.P. Mass Function for Eight Nearby Galactic Clusters. Astron. J. 1989, 98, 888–925. [Google Scholar] [CrossRef]
- Wilson, R.E. Eclipsing Binary Solutions in Physical Units and Direct Distance Estimation. Astrophys. J. 2008, 672, 575–589. [Google Scholar] [CrossRef]
- Denny, R. A Web-Remote/Robotic/Scheduled Astronomical Data Acquisition System. In Proceedings of the Conference Telescopes from Afar, Waikoloa Beach, HI, USA, 28 February–3 March 2011. [Google Scholar]
- Denny, R. Dispatch Scheduling of Automated Telescopes. In Proceedings of the Society for Astronomical Sciences 23rd Annual Symposium on Telescope Science, Big Bear, CA, USA, 26–27 May 2004. [Google Scholar]
- Bertin, E.; Arnouts, S. SExtractor: Software for source extraction. Astron. Astrophys. Suppl. 1996, 117, 393–404. [Google Scholar] [CrossRef]
- Bertin, E. Automated Morphometry with SExtractor and PSFEx. In Proceedings of the Astronomical Data Analysis Software and Systems XX, Boston, MA, USA, 7–11 November 2010; Volume 442, pp. 435–438. [Google Scholar]
- Welch, D.L.; Stetson, P.B. Robust Variable Star Detection Techniques Suitable for Automated searches: New Results for NGC 1866. Astron. J. 1993, 105, 1813–1821. [Google Scholar] [CrossRef]
- Scargle, J. Studies in astronomical time series analysis. II. Statistical aspects of spectral analysis of unevenly spaced data. Astrophys. J. 1982, 263, 835–853. [Google Scholar] [CrossRef]
- von Neumann, J. Distribution of the Ratio of the Mean Square Successive Difference to the Variance. Ann. Math. Stat. 1941, 12, 367–395. [Google Scholar] [CrossRef]
- von Neumann, J. A Further Remark Concerning the Distribution of the Ratio of the Mean Square Successive Difference to the Variance. Ann. Math. Stat. 1942, 13, 86–88. [Google Scholar] [CrossRef]
- Kim, D.-W.; Protopapas, P.; Bailer-Jones, C.A.L.; Byun, Y.-I.; Chang, S.-W.; Marquette, J.-B.; Shin, M.-S. The EPOCH Project. I. Periodic variable stars in the EROS-2 LMC database. Astron. Astrophys. 2014, 566, A43. [Google Scholar] [CrossRef] [Green Version]
- Wilson, R.E.; Devinney, E.J. Realization of Accurate Close-Binary Light Curves: Application to MR Cygni. Astrophys. J. 1971, 166, 605–619. [Google Scholar] [CrossRef]
- Wilson, R.E. Eccentric orbit generalization and simultaneous solution of binary star light and velocity curves. Astrophys. J. 1979, 234, 1054–1066. [Google Scholar] [CrossRef]
- Wilson, R.E. Accuracy and Efficiency in the Binary Star Reflection Effect. Astrophys. J. 1990, 356, 613–622. [Google Scholar] [CrossRef]
- Terrell, D.; Wilson, R.E. Photometric Mass Ratios of Eclipsing Binary Stars. Astrophys. Space Sci. 2005, 296, 221–230. [Google Scholar] [CrossRef]
- Vasilevskis, S.; Klemola, A.; Preston, G. Relative proper motions of stars in the region of the open cluster NGC 6633. Astron. J. 1958, 63, 387–395. [Google Scholar] [CrossRef]
- Kharchenko, N.V.; Piskunov, A.E.; Röser, S.; Schilbach, E.; Scholz, R.-D. Astrophysical parameters of Galactic open clusters. Astron. Astrophys. 2005, 438, 1163–1173. [Google Scholar] [CrossRef] [Green Version]
- Kharchenko, N.V. All-sky compiled catalogue of 2.5 million stars. Kinemat. Phys. Celest. Bodies 2001, 17, 409–423. [Google Scholar]
- Gao, X.-H. Membership and fundamental parameters of the intermediate-age open clusters NGC 2281 and NGC 2539 based on Gaia-DR2. Publ. Astron. Soc. Jpn. 2019, 71, 62. [Google Scholar] [CrossRef]
- Lindegren, L.; Hernández, J.; Bombrun, A.; Klioner, S.; Bastian, U.; Ramos-Lerate, M.; De Torres, A.; Steidelmüller, H.; Stephenson, C.; Hobbs, D.; et al. Gaia Data Release 2: The astrometric solution. Astron. Astrophys. 2018, 616, A2. [Google Scholar] [CrossRef] [Green Version]
- Wilson, R.E.; Hurley, J.R. Impersonal parameters from Hertzsprung-Russell diagrams. Mon. Not. R. Astron. Soc. 2003, 344, 1175–1186. [Google Scholar] [CrossRef]
- Wilson, R.E. Improving CMD Areal Density Analysis: Algorithms and Strategies. J. Astron. Space Sci. 2014, 31, 121–130. [Google Scholar] [CrossRef]
- Bressan, A.; Marigo, P.; Giradi, L.; Salasnich, B.; Dal Cero, C.; Rubele, S.; Nanni, A. PARSEC: Stellar tracks and isochrones with the PAdova and TRieste Stellar Evolution Code. Mon. Not. R. Astron. Soc. 2012, 427, 127–145. [Google Scholar] [CrossRef] [Green Version]
- Schlafly, E.F.; Finkbeiner, D.P. Measuring Reddening with Sloan Digital Sky Survey Stellar Spectra and Recalibrating SFD. Astrophys. J. 2011, 737, 103. [Google Scholar] [CrossRef]
- Glaspey, J.W. A spectroscopic study of the open cluster NGC 2281. Publ. Astron. Soc. Pac. 1987, 99, 1089–1092. [Google Scholar] [CrossRef]
Figure 1.
Observed and computed light curves around the eclipses of GSC 2945:01857 in the B and V passbands.
Figure 1.
Observed and computed light curves around the eclipses of GSC 2945:01857 in the B and V passbands.

Figure 2.
B, V, and () light curves of GSC 2945:01760 phased with a period of 4.3928 days and arbitrary zeropoint.
Figure 2.
B, V, and () light curves of GSC 2945:01760 phased with a period of 4.3928 days and arbitrary zeropoint.

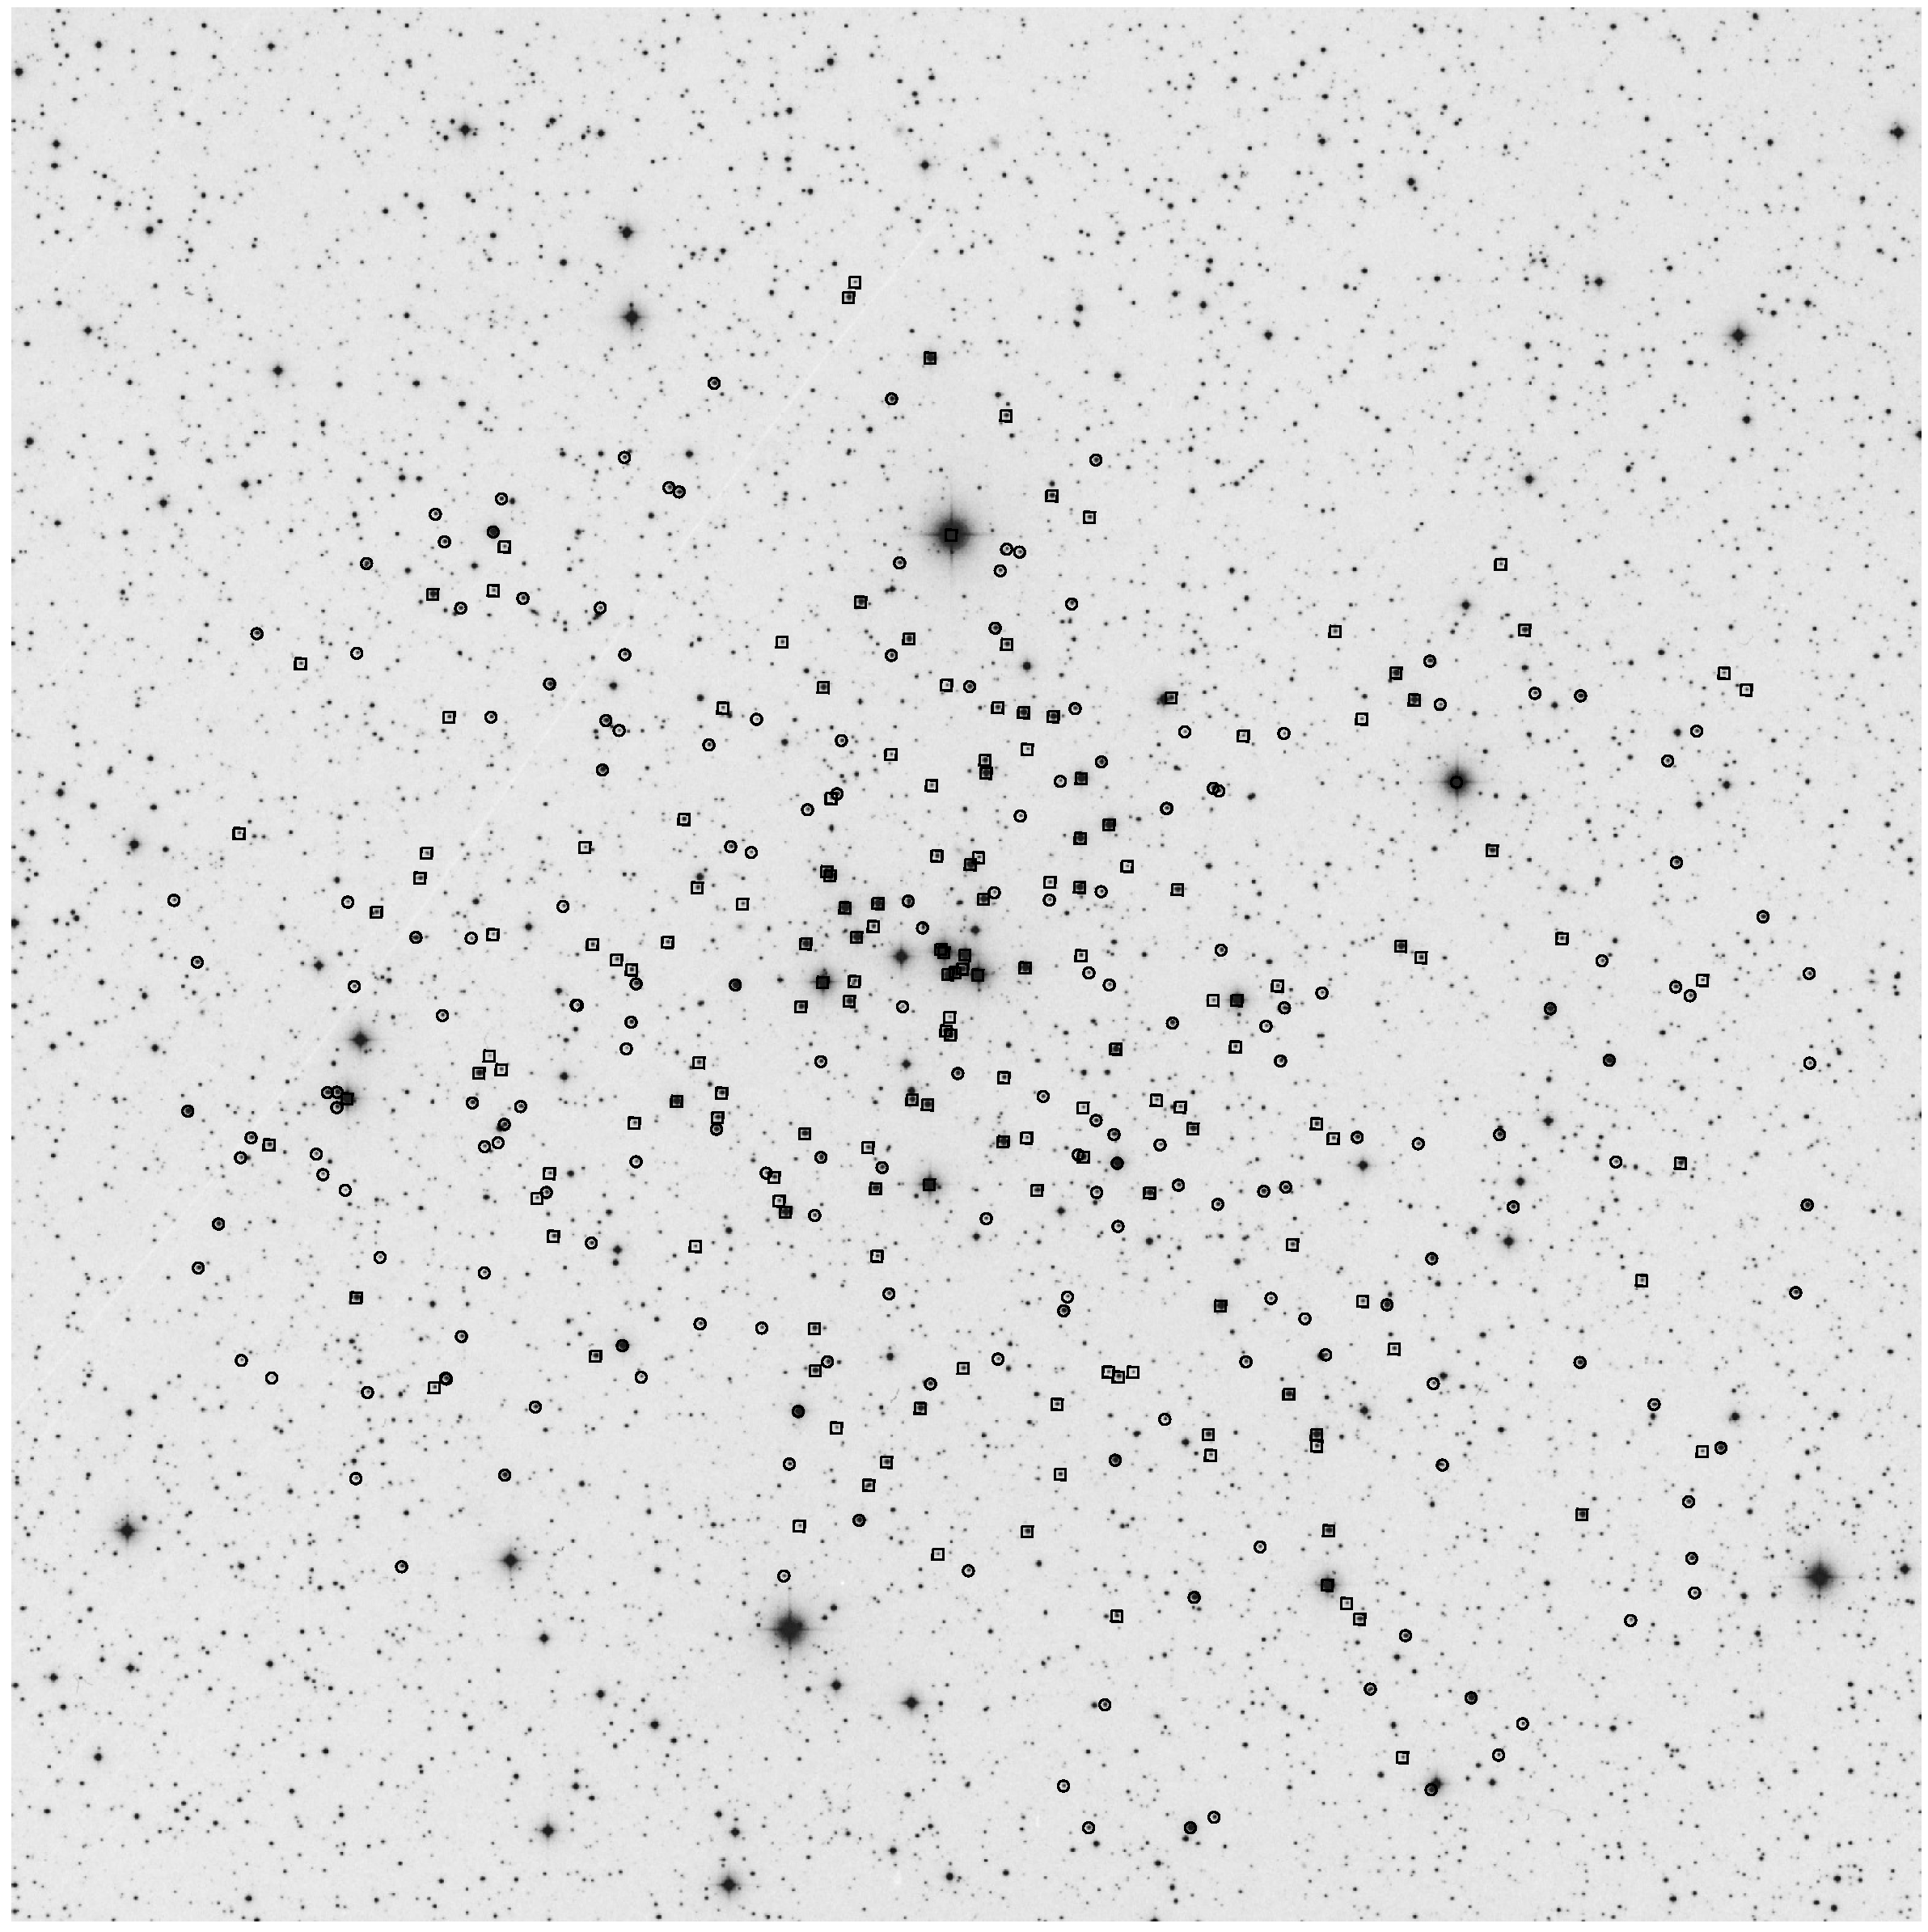
Figure 3.
A Digital Sky Survey field centered on NGC 2281 with north up and east to the left. Squares mark probable members and circles mark probable non-members that fit the selection criteria described in the text. Note that this field was not entirely covered by our observations.
Figure 3.
A Digital Sky Survey field centered on NGC 2281 with north up and east to the left. Squares mark probable members and circles mark probable non-members that fit the selection criteria described in the text. Note that this field was not entirely covered by our observations.

Figure 4.
Cluster (plus signs) and field (circles) stars in various planes of distance and proper motion space. The filled square marks the location of the eclipsing binary GSC 2945:01857.
Figure 4.
Cluster (plus signs) and field (circles) stars in various planes of distance and proper motion space. The filled square marks the location of the eclipsing binary GSC 2945:01857.

Figure 5.
Color–magnitude diagram of the field. Cluster members are plotted as circles and non-members as plus signs. The square marks the location of the eclipsing binary GSC 2945:01857.
Figure 5.
Color–magnitude diagram of the field. Cluster members are plotted as circles and non-members as plus signs. The square marks the location of the eclipsing binary GSC 2945:01857.

Figure 6.
Best isochrone fit for the and weights case. The dashed curve represents the bright edge of the binary main sequence, i.e., the single star main sequence brightened by 0.75 mag.
Figure 6.
Best isochrone fit for the and weights case. The dashed curve represents the bright edge of the binary main sequence, i.e., the single star main sequence brightened by 0.75 mag.

Figure 7.
Best isochrone fit for the and weights case.


Table 1.
photometry of the NGC 2281 field.
| Gaia DR2 ID | R.A. | Dec. | B | V | |||||
|---|---|---|---|---|---|---|---|---|---|
| 951676899239237632 | 102.090500 | 41.302285 | 8.661 | 0.073 | 7.452 | 0.124 | 0.998 | 14 | 14 |
| 945679509986190848 | 101.734608 | 41.180515 | 9.496 | 0.023 | 8.328 | 0.021 | 0.000 | 316 | 301 |
| 951480155378231424 | 102.170191 | 41.066461 | 8.989 | 0.021 | 8.695 | 0.018 | 0.992 | 299 | 316 |
| 951468163829512192 | 102.496837 | 40.997471 | 8.977 | 0.028 | 8.825 | 0.021 | 0.998 | 314 | 298 |
| 951481083091175808 | 102.086839 | 41.084098 | 9.036 | 0.022 | 8.876 | 0.014 | 0.998 | 285 | 268 |
A portion of the data are shown here to illustrate the format of the Supplementary File containing all data. is the cluster membership probability.
Table 2.
Photometry of GSC 2945:01857.
| HJD | B | HJD | V |
|---|---|---|---|
| 2,456,305.76174 | 12.900 | 2,456,305.76042 | 12.285 |
| 2,456,305.77159 | 12.900 | 2,456,305.77382 | 12.286 |
| 2,456,305.78881 | 12.894 | 2,456,305.78782 | 12.288 |
| 2,456,305.79812 | 12.888 | 2,456,305.79917 | 12.278 |
| 2,456,307.79320 | 12.902 | 2,456,307.79177 | 12.278 |
Table S2 is published in its entirety in the Supplementary File. A portion is shown here for guidance regarding its form and content.
Table 3.
The cluster astrometric quantities from the fit to the Gaia data.
| Quantity | Value |
|---|---|
| (mas) | 1.89 ± 0.11 |
| (mas yr) | −2.92 ± 0.43 |
| (mas yr) | −8.32 ± 0.41 |
Table 4.
Best isochrone fits.
| Z | E(B-V) | SMD | N | |
|---|---|---|---|---|
| and =5 | ||||
| 8.80 | 0.02 | 0.123 | 1.0 | 1 |
| 8.808 ± 0.012 | 0.02 ± 0.0 | 0.118 ± 0.005 | 1.01 | 50 |
| 8.819 ± 0.018 | 0.021 ± 0.001 | 0.103 ± 0.013 | 1.05 | 622 |
| and =5 | ||||
| 8.82 | 0.018 | 0.125 | 1.0 | 1 |
| 8.816 ± 0.005 | 0.018 ± 0.0 | 0.123 ± 0.002 | 1.01 | 15 |
| 8.823 ± 0.018 | 0.020 ± 0.001 | 0.103 ± 0.014 | 1.05 | 349 |
1 Age unit is years. 2 The SMD column gives the ratio of the SMD value of the worst-fit parameter set to that of the best solution. 3 N represents the number of parameter sets used to form the statistics (i.e., the N best sets). For N > 1, the mean and standard deviation of theparameter values from the N parameter sets is given.
Publisher’s Note: MDPI stays neutral with regard to jurisdictional claims in published maps and institutional affiliations. |
© 2021 by the authors. Licensee MDPI, Basel, Switzerland. This article is an open access article distributed under the terms and conditions of the Creative Commons Attribution (CC BY) license (http://creativecommons.org/licenses/by/4.0/).
Share and Cite
MDPI and ACS Style
Terrell, D.; Gross, J.; Cooney, W.R., Jr. Analysis of the Open Cluster NGC 2281. Galaxies 2021, 9, 7. https://0-doi-org.brum.beds.ac.uk/10.3390/galaxies9010007
AMA Style
Terrell D, Gross J, Cooney WR Jr. Analysis of the Open Cluster NGC 2281. Galaxies. 2021; 9(1):7. https://0-doi-org.brum.beds.ac.uk/10.3390/galaxies9010007
Chicago/Turabian StyleTerrell, Dirk, John Gross, and Walter R. Cooney, Jr. 2021. "Analysis of the Open Cluster NGC 2281" Galaxies 9, no. 1: 7. https://0-doi-org.brum.beds.ac.uk/10.3390/galaxies9010007
Note that from the first issue of 2016, this journal uses article numbers instead of page numbers. See further details here.