
SS 433 Optical Flares: A New Analysis Reveals Their Origin in L2 Overflow Episodes

Department of Physics, University of Oxford, Keble Road, Oxford OX1 3RH, UK
Galaxies 2021, 9(3), 46; https://0-doi-org.brum.beds.ac.uk/10.3390/galaxies9030046
Submission received: 19 April 2021
/
Revised: 17 June 2021
/
Accepted: 18 June 2021
/
Published: 22 June 2021
(This article belongs to the Collection A Trip across the Universe: Our Present Knowledge and Future Perspectives)
Abstract
:The microquasar SS 433 exhibits in H intermittent flares. A sequence of observations made in 2004 showed flaring Doppler shifted to both the red and the blue simultaneously. The mean shifts varied from day to day, following the orbital phase of the compact object. At the time, this behaviour was interpreted as indicating an origin in the outer rim of the accretion disk. A new analysis of these old data, presented in this paper, shows that the flares are not eclipsed by the Companion that eclipses the photosphere surrounding the compact object. They are therefore not intermittent sightings of an accretion disk. The alternative explanation is plasma expelled through the point, following the phase of the orbit as it invades the space beyond the system. That space has been mapped with comparatively recent GRAVITY observations of a similar flare in Br, indeed revealing a strong rotation component.
1. Introduction
The Galactic microquasar SS 433 is famous as an example of super-Eddington mass transfer, but with most of the mass lost by the Companion ejected in the form of polar winds. A small fraction takes the form of two jets with speeds of ~0.26 c. The optical emission spectra show lines from the precessing jets and, in addition, so-called stationary lines with speeds of a few hundred to a few thousand . When the system is quiet, the dominant sources are the polar winds and a circumbinary disk. There are intermittent periods of optical flaring, particularly prominent in Balmer H, when high speed wings appear to both the red and the blue, with speeds exceeding ~500 . This paper is to do with the origin of these flares, which must surely be related to the transfer of mass from the donor star to the compact object in this binary system. General reviews are to be found in [1,2]. All these details are of particular interest because SS 433 would be classified as an Ultra-Luminous X-ray source were we looking down its throat [3], and the emission spectra of those ULX with optical counterparts are very like those of SS 433 [4].
A sequence of spectra of SS 433, taken almost nightly in 2004, showed the onset of an optical flare, with daily variations looking like H radiation from an edge-on disk, rotating at speeds ~600 . (Other flare data in Hα, Hβ, and Brγ show the same pattern with similar speeds; see Appendix A.) The radius of a corresponding accretion orbit would lie deep within the photosphere surrounding the compact object. This new analysis of the 2004 sequence employs the continuum background, hitherto largely ignored, and reveals no evidence of changes in the photosphere with the onset of flaring. It also shows that the flare material is not eclipsed to any extent by the Companion and so cannot lie deep within the photosphere, which is eclipsed.
The 2004 Hα flares cannot then originate in the accretion disk, yet their Doppler shifts follow the orbital phase of the compact object; a pair of lines reddest when the compact object is receding. The flare material must escape the system and yet remember the phase of the compact object. The weakest region through which material can escape is the point, and this point, lying on a straight line joining the centers of the compact object and the Companion, rotates with the same angular velocity as the compact object. Thus, this new analysis indicates a flare origin predominantly in episodic overflow from the Companion, through the point. The recent (2019) GRAVITY observations in Brγ [5] revealed material far outside the system, with rotational speeds of up to or exceeding ~600 .
Among early observations of the microquasar SS 433 with the GRAVITY instrument, which takes spectra in the near infrared as a function of angular position on the sky, is an episode revealing Brγ rotational speeds of several hundred km , more or less in the plane of the orbit of the binary and at radii of several times the binary separation A, Figure 3 of [5]. That figure suggests measured speeds of ~500 at radii ~A and ~200 at radii ~5 A. These are very rough figures; fits in [5] yield supposedly orbital speeds of ~100 km at radii of ~10 A and ~1000 km at ~A. Both sets of numbers are at least superficially consistent with a circumbinary disk, but the contained mass would have to be ~400 for a specific angular momentum of 1000 .
However, the circumbinary disk of SS 433 orbits the system with a speed of ~240 at a radius of <2 A [6] and is long lasting and very stable; the interior mass is ~40 [6,7]. The masses of the compact object and its companion are, respectively, 15 and 21 , their ratio q ~ 0.7 and A is 5.4. For these numbers, the specific angular momentum of material in the circumbinary disk is , to be compared with that of the point—448 A. (The latter number depends on the orbital velocity of the compact object, taken here to be 176 ± 13.)
The authors of [5] suggest that their observations are of super-Kepler material, either ejection of the circumbinary ring or perhaps from eruptions in the core of the accreting material. The high specific angular momentum presents a problem for core eruptions—it is surely too small a moment arm. On the other hand, material leaking out of the Roche lobe of the compact object through the point would share its specific angular momentum—448 A. Any additional gravitational torquing might increase this to ~500 A. It is therefore natural to ask if the 2004 sequence of Hα flaring can cast further light on the origin, given that an accretion disk is ruled out. This new analysis links optical flares in Hα with the GRAVITY flaring and a common origin: expulsion through the point, because the rotational phase of the 2004 flares follow the orbital phase of the compact object.
Section 2.1 summarises the 2004 data on flares in Hα and their interpretation in terms of glimpses of the accretion disk. Section 2.2 discusses the eclipse phenomena, using a proxy for photometric data. Section 3 shows that the flares do not affect the photosphere and that photospheric eclipses during flare episodes look just like those during quiescence. Section 4 summarises the evidence against accretion disk flares, and Section 5 the evidence for excretion as an important source.
2. Optical Flares in Hα
Optical flares occur in SS 433 at irregular intervals and for irregular periods of time. A characteristic feature is the appearance of spectral line splitting by ~±600 (an extreme example from 1980 data [8] reaches ~±1000 ), which may last for a number of days [9,10]; see also [11]. The sequence of observations made in 2004 [9,10] was interpreted as glimpses of the outer regions of the accretion disk [9]. This new analysis shows that interpretation to be wrong. The flares must be attributed to bursts of a wind or mass ejections of some kind, hopefully capable of accounting for the fast rotating and radially distant sources in the GRAVITY Brγ observations [5].
Stimulated by the data of [5], I have re-examined the supposed accretion disk data, primarily those of Hα in [9], looking for any indication so far not considered that might fix for these data an origin either in an accretion disk or alternatively in ejected super-Kepler material not bound within the system. Accreting material moving at in Kepler orbits would have to be within 0.1 A of the compact object; it emerges that the flare material is not eclipsed and radiates outside of the system.
2.1. Stationary Lines and a Summary of the H Data
The optical spectra of SS 433 contain emission lines radiated by the relativistic jets and lines radiated from matter moving much more slowly within and close to the system: the stationary lines. Some of these lines originate at the photosphere surrounding the compact object. He II 4685 traces the orbital motion of the compact object through a component that is eclipsed by the Companion; a pair of C II emission lines are likewise eclipsed [12]. The motion of these emission lines is phased correctly relative to eclipses. The vast majority of emission lines are not eclipsed, being formed outside of the system in the circumbinary disk or above and below the orbital plane in polar winds. Predominant are hydrogen lines H and the He I lines at 6678, 7065 [13]; similar phenomena are encountered in the infrared [11,14]. Lines radiated from the circumbinary disk move, if at all, only as a result of the relative intensities of the red and blue shifted components oscillating. All these features are clear when SS 433 is optically quiescent, but much less so during an optical flare. The principal feature of an optical flare is the appearance of red and blue shifted components (particularly studied in Hα separated by Doppler speeds of between 1000 and 2000 .
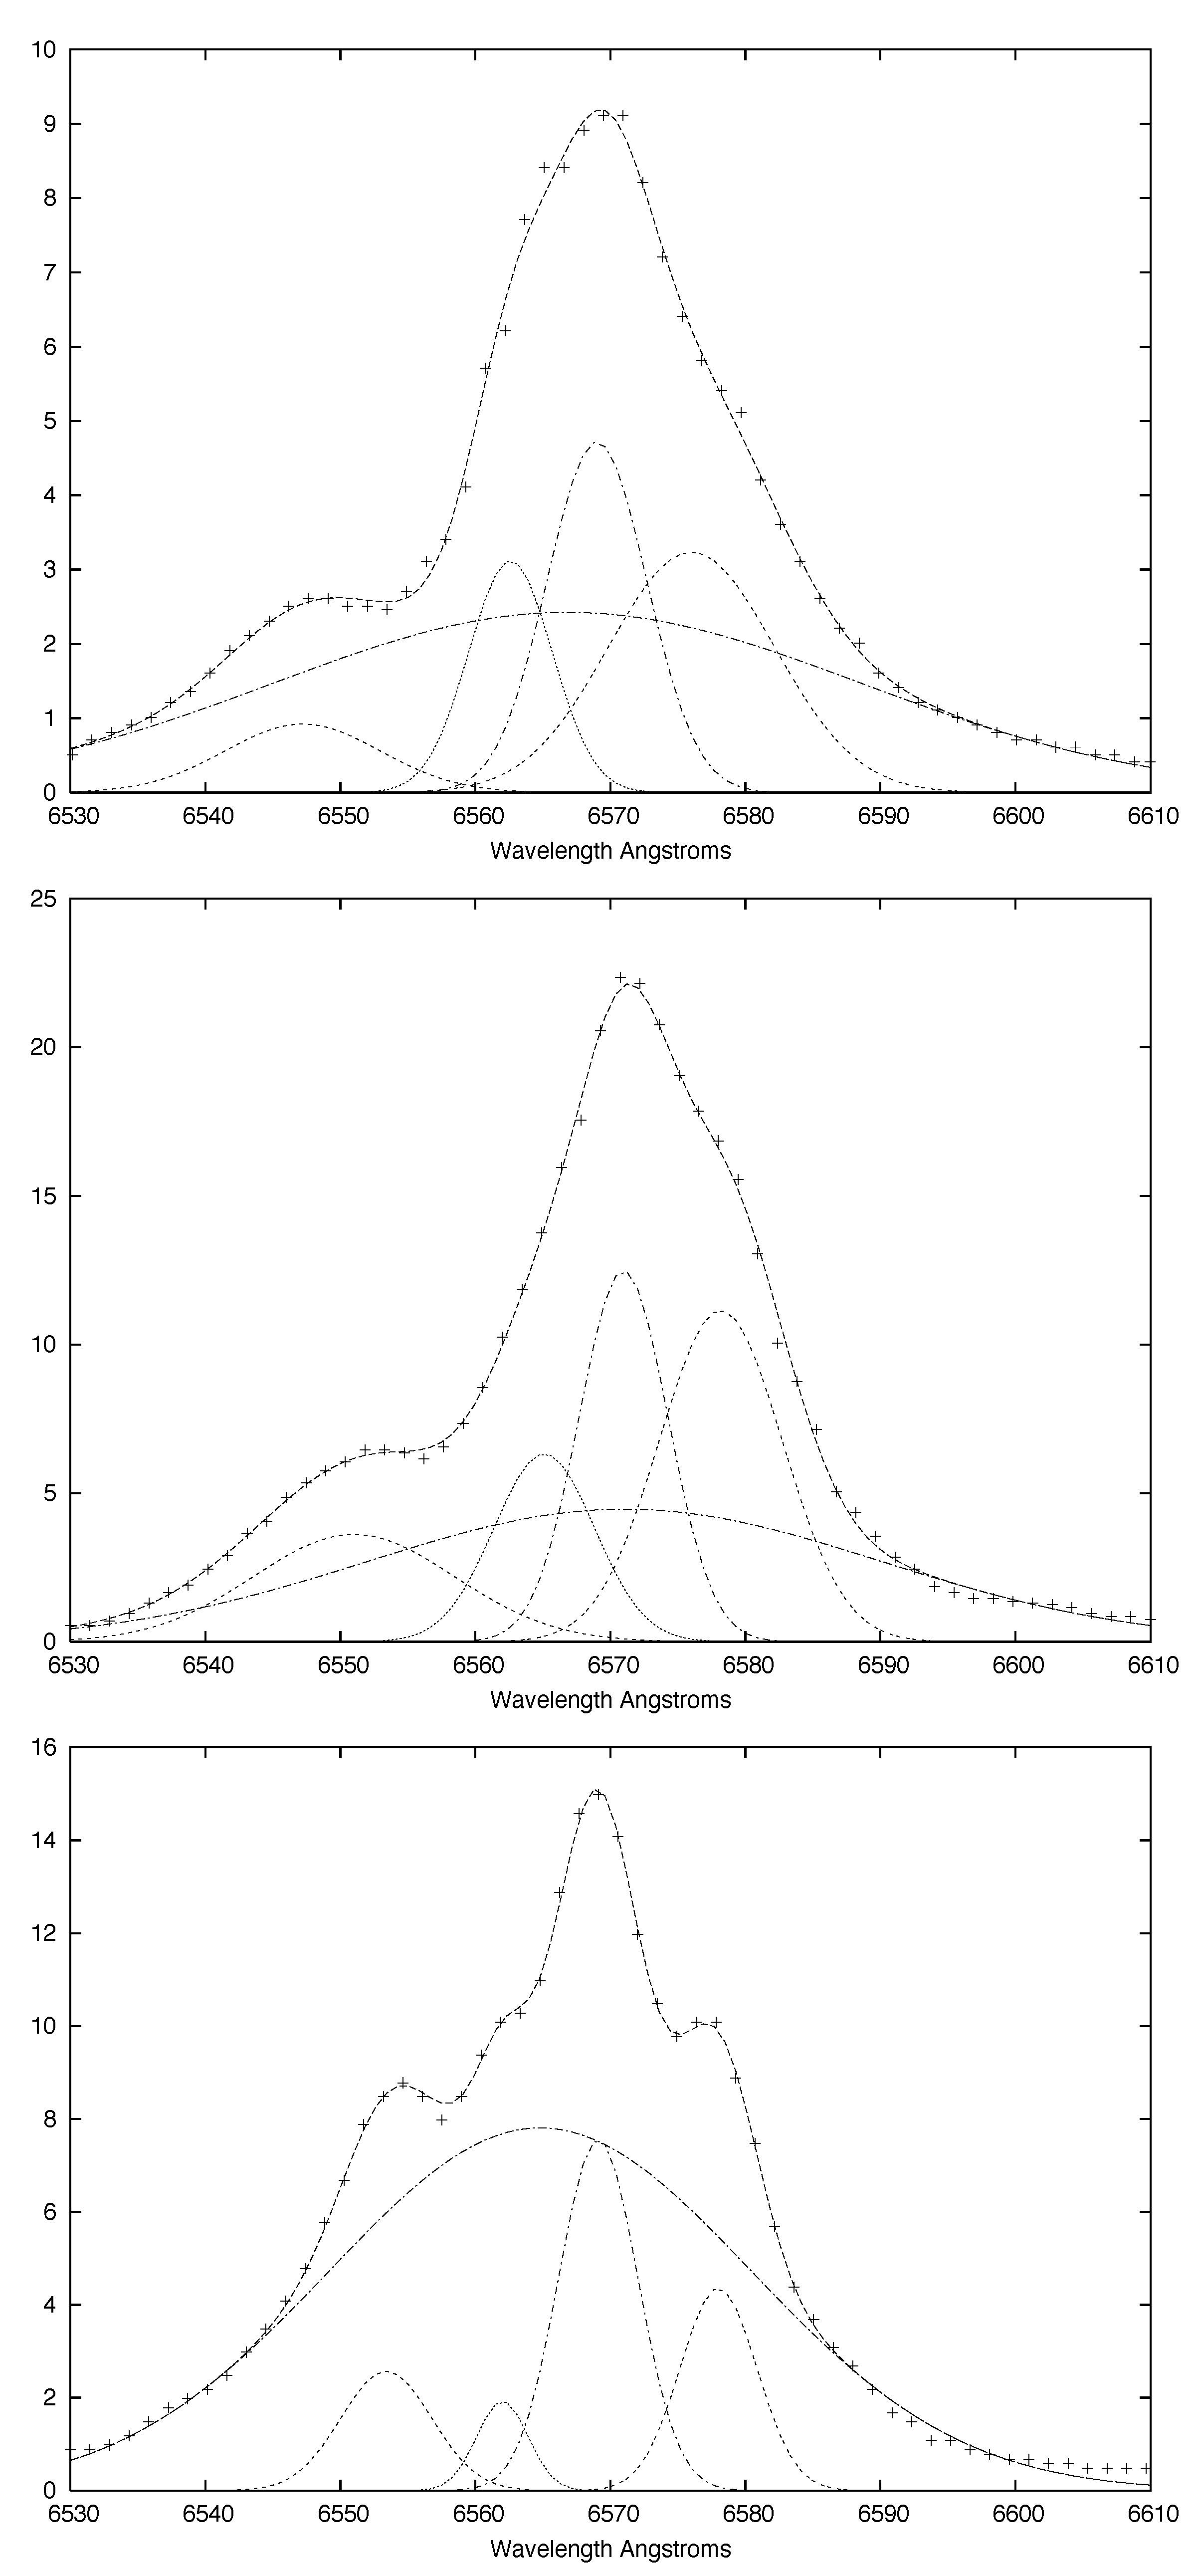
The most systematically complete set of data is that displayed in [13], primarily in H and He I emission lines, spectra taken most nights between Julian Day 2,453,000 + 245 and + 310. The stationary lines were quiescent between JD 2,453,000 + 245 and + 287; analysis revealed the circumbinary disk and the polar winds from the environs of the compact object are sufficient to account for the spectra. From +287 the flare commenced; the data discussed in [9] and [10] are from the same set as those displayed in [13]. The stationary lines became much broader; as the disk turned more edge on, absorption troughs occurred. Over the period of observation the separation of the red and blue flare components in H increased from ~1000 to ~1400 . These red and blue components (see Figure 1) together traced out the motion of the compact object, with some precision over the first orbital half period; Figure 2.
The relationship became less precise as time evolved but retained some memory; the He I data are confounded by the moving jet lines during this latter period. The obvious (and erroneous) interpretation was that these Hα flare components constitute glimpses of the accretion disk of the compact object, appearing as a result of a burst of accretion or, if accretion be continuous, of a parting of the clouds. The details are given in [9] and the observations placed in a wider context in [10]. It is of course the way in which the widely separated Hα components swing together, following or remembering the motion of the compact object, that suggested an accretion disk rim orbiting at 600 as their origin. After flareup, the compact object and its environs are eclipsed by the Companion on days +294 and +307; on neither occasion are either of the extreme components of Hα eclipsed [9]. If these components originate from material in a Kepler orbit about the compact object, of mass ~[6,7], the radius of that orbit must be ~0.07 A. If receding and approaching material at this radius and orbiting perpendicular to the jets are not eclipsed on day +307, then the absence of these eclipses would imply that, if the flaring is the result of glimpses of the rim of an accretion disk, then the radius of the companion is a < 0.25 A [9], provided the orbit is adhering to the Goranskii ephemeris [15]; this is as far as eclipse data were pursued in [9].
2.2. Eclipses and Proxy Photometry
The radius of the Roche lobe of the donor is ~0.4 A, and it is expected that the donor will fill or over fill this lobe, with stable transfer of material. It was therefore surprising to find in [9], a value of a < 0.25 A. In order to search for further evidence for or against an accretion disk origin, it is relevant to search the data of [13] for indications of how well the system followed the Goranskii ephemeris and how readily eclipses of these Hα components could be avoided if the Companion does in fact fill its Roche lobe.
In the first instance, I concentrated on the absence of any eclipses of the red and blue flare components. The data of [13] cover eclipses of the compact object at approximately, days + 254, 268 and 281 before the flare and then days + 294 and 307, well after the onset of the flaring activity. The orbital phases (according to the Goranskii ephemeris) of the spectra closest to eclipse are, respectively, 0.97, 0.04, 0.035, 0.03 and 0.02.
The eclipse timetable is based on photometry, and it is well known that in the V band the eclipse lasts over 2 days and at minimum the partially eclipsed signal has dropped by a factor of about 2. This suggests that the photosphere surrounding the compact object, not completely eclipsed, must have a similar radius to that of the (eclipsing) Companion and that these radii are ~A/2 rather than A/4. It is therefore of some significance to check on the extent to which the system deviates from the Goranskii ephemeris. The data of [13] are not photometric, but neither are they devoid of relevant information; there exists a proxy for photometry, in the following sense. The line spectra in [13] have been normalised to the local continuum (see Figure 3) and so any line that is relatively stable and not eclipsed doubles in (normalised) height as the compact object passes through eclipse. Up to day +281, most spectral lines are formed in jets, the circumbinary disk or the winds above the accretion disk and show no sign of the disturbances accompanying the later flaring. Thus the normalised line intensities in jets and in stationary Hα and He I emission more or less double in height over a period of a couple of days—this is visible in Figure 2 of [13]—and this happens in the right place for the first three eclipses. Thereafter, flaring makes the jet intensities and flaring stationary lines less reliable for this technique, although the effect is certainly present, even in the red and blue flare components, (see Figure 1 and Figure 4). The most reliable signal after day + 281 is in fact to be found in O I 8446 , a line that is strong and split and shows no traces of flaring effects, being formed primarily in the circumbinary disk.
The O I 8446 spectra from the data set of [13] have not been published; a single example is shown in Figure 2 of [16] (for day + 274). I gave some discussion of these spectra (and their very different characteristics from those of O I 7772 ) in [17]. I find that the data (Figure 4, middle panel) are adequate to conclude that the system eclipses were following the Goranskii ephemeris to within ~0.03 orbital periods, 0.4 days.
The question then arising is how easily the supposed accretion disk lines could evade eclipse if the radius of the companion is in fact a more plausible 0.4–0.5 A. A simple extension of the argument used in Section 4 of [9] shows that if the radius of the companion were ~0.4 A, then (pointlike) red and blue extremes would be simultaneously visible if the observations on +294 and +307 differed from the Goranskii ephemeris by ~0.03 orbital periods; if the radius were as great as 0.5 A by ~0.05. However, a postulated thin disk abutting the photosphere is more plausible and much more constrained by eclipse data. When the photosphere is represented as a disk on the sky of radius ~0.1 A, because of the orbital tilt, it would not be eclipsed at all if a/A ; the perceived separation at conjunction is ~0.2 A. For a/A0.3, the interval between first and last contact in the eclipse would be 1.5 days and full eclipse reached. For an eclipse that only obscured half of the photospheric disk, a/A , the interval between first and last contact would be a single day.
Both before and after the onset of the flare eclipses last roughly the same length of time, and that time is over 2 days; see Figure 4. It is also the case that the spectral shape of the continuum exhibits no change during and after the onset of the flare (Figure 4). I regard these pieces of evidence as the strongest against my naïve interpretation of the data in [9]. The lack of eclipses of the extreme features and the duration of eclipses of the photosphere show that the H flares do not originate in Keplerian orbits about the compact object. These aspects are discussed in more detail below.
3. The Photosphere of the Accretion Region
It was suggested in [9] that the appearance and disappearance of optical flaring might be associated with episodes of overflow from the Roche lobe of the Companion feeding the accretion disk via the point, or perhaps with some unspecified clouds breaking to reveal it. Such phenomena would be expected to affect the photosphere of the accretion region surrounding the compact object. The photosphere has a radius of very roughly 0.5 A and is responsible for the continuum underlying the line spectra; if the line elements flaring in the visible and infrared are generated in a typical accretion disk they would have to be formed deep within the photosphere surrounding the accreting region. As more data have accumulated over the years, this has seemed increasingly unlikely. In the light of the results of [5], I have examined such data in [13] as exist on the state of the photosphere, both before and after the flaring outburst commencing at approximately day +287. In the absence of photometric data (other than the proxy employed in this paper), all that can be said about the eclipse episodes is that both before and after the outburst those data are consistent with eclipses lasting the same length of time (over 2 days between first and last contact) and cutting out about half of the continuum radiation from the photosphere (see Figure 4). The eclipses last far too long for a photosphere of radius a/A. The spectral shape of the continuum (an example is to be found in Figure 3, taken from [18]) also does not change with the onset of flaring.
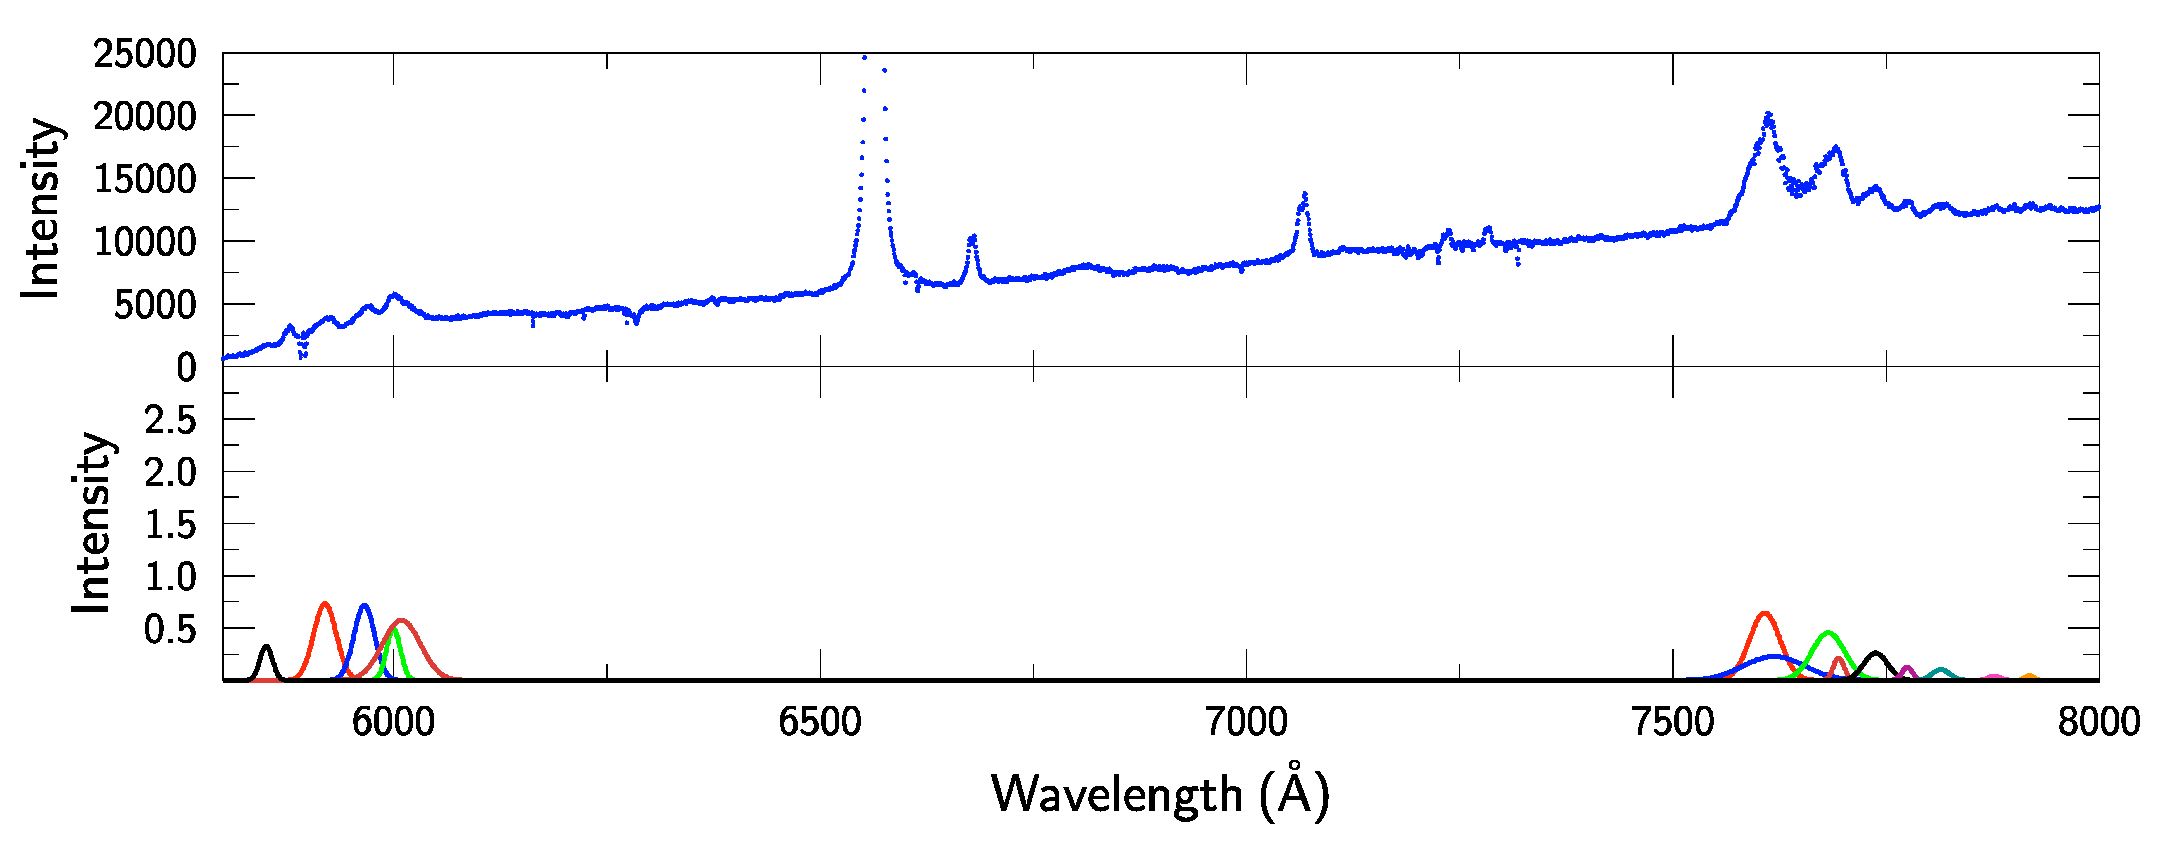
The continuum intensity rises rather linearly with wavelength, such that the intensity at 6500 divided by the intensity at 8000 is 0.47. Similar data for other days have not been published, but I have access to them. Every day between +245 and +321 for which there are data shows a shape consistent with that same index, Figure 4.
4. Evidence against Emission Line Spectra from Accretion Disk Orbits
Material orbiting the compact object at ~700 would have to be at a radius less than ~0.1 A, much less than the rough estimate for the photospheric radius of ~0.5 A. In the absence of breaches in the photosphere, it hardly seems possible that H line spectra are formed or could survive passage through an intact photosphere; a thin accretion disk radiating in Hwould have to be feeding into the photosphere.
There being no signs of disturbance or obscuration of the photosphere during flaring in the line spectra, the implication is that the flare spectra are formed in a chromosphere external to the photosphere—a low density shell or a component of wind perhaps. The rotating and expanding shell proposed by GRAVITY [5] might be an example, in which case the chromosphere is external to the system.
Whatever the true nature of the source may be, there seems to be strong evidence the line spectra are not formed deep within the photosphere, despite the pair of components to the red and blue tracking the phase of the compact object, just as radiation from a classic accretion disk would, if not immersed in a photosphere. Radiation from an equatorial wind, launched at ~1000 more or less in the plane of the orbit, could potentially match the spectral observations, but would not provide the apparent rotation elements of GRAVITY, where red and blue flare elements are on opposite sides of the system. The problem remains: how could the material observed by GRAVITY pick up angular momentum about the binary system if it is as much as ~1000 A ?
Curiously, there does seem to be a single episode of photospheric obscuration. This is of significance for two reasons. First, this obscuration does not affect the extreme red and blue flare components—further evidence that they do not originate deep within the radius of the photosphere. Over the few days +300 to +304, inclusive, the normalised intensities in both H and O I 8446 vary in a way very similar to eclipse by the Companion, but these days are between two successive eclipses. The observed photospheric intensity appears to have dropped and recovered over this short period. This might be due to clouds drifting across the line of sight from the photosphere. Secondly, the jets vanished on day +302 and did not reappear until day +306 [10,18]. The possibility of a link between a rare cloud and switching off the jets is of interest.
5. The Source of the Flares
Attributing the flare red and blue components of the H and Br to a source local to the compact object suffers the objection that it would seem not to be able to account for fast rotating material far out from the system, observed with GRAVITY, but the strong arguments related to the photosphere are valid, even without GRAVITY. The strongest argument in favour is that the H lines remember the orbital phase of the compact object quite well.
There is a potential explanation that can reconcile these conflicting elements and certain other issues. If the Companion fills or overfills its Roche lobe, material will spill out through the point, such a localised source sharing the orbital phase of the compact object at an initial radius from the centre of mass of SS 433 of 1.22 A. The speed of the L2 point is 368, possibly as high as 400 km, and the specific angular momentum is 448A, possibly as high as 487A km . It seems safe to conclude that the asymptotic specific angular momentum of material leaving the point could be as much as A × 500 . (For comparison, the specific angular momentum of the compact object is 101 .) In the data analysed in [9], the early stages of flaring are characterised by flare speeds ~±500 and orbital motion very close to that of the compact object, reasonably accounted for by material spilling through . As time goes on, the flare speeds increase and the phase drifts. These data never reach speeds of ~1000 but such extremes do exist, for example, [8], and are unlikely to be produced by spilling out through . Equatorial winds from the neighbourhood of the compact object could account for the speeds; it is not clear how high specific angular momentum might be achieved. It may be relevant that after JD +291 the speed of the wind assigned to the disk doubles—to ~1200 [10]. The data in [9] suggest that high speed wind components might blend with spillage as time goes on.
6. Discussion
Most of the material accreted to the compact object is expelled from the system in the high speed polar winds [1]. There is direct evidence [7] that, at most, only a small fraction leaves through , feeding the flares and replenishing (but not disturbing [17]) the circumbinary disk. Ejection of this small fraction promises to explain both the GRAVITY results [5], on one hand, and the way the flare lines follow the motion of the compact object [9] on the other. Material leaving the point tangentially at speeds greater than the local escape velocity will look like a spiral in a snapshot taken normal to the orbital plane. This pattern rotates with time; in any one observation, material viewed approaching (blue) is thus compared with material receding (red) at different speed and on the opposite side of the system; the pattern cycles from orbit to orbit as the spiral rotates. This scenario was originally discussed in considerable detail in [19] and Fabrika’s prescient paper dealing specifically with SS 433 [20]. A more recent paper is [21]. Further, the features of several other data sets fit well into this picture (see Appendix A), and the intermittent flaring might be a consequence of mass ejections from the Companion flooding the outer Roche lobe. The precise variation of the mean velocity of course depends on details. (An example is discussed in [22].)
There are half a dozen examples of ULX that have optical counterparts, mostly within the Local Group. They have optical spectra very like SS 433 [4] but they are far away, and the prospect of getting anywhere near the kind of data needed to pin down the origin of the flares in SS 433 is remote. It is not even safe to suppose overflow as the usual case. A system of much greater mass would have a classic accretion disk and would not be super-accreting—the accretor would be an intermediate mass black hole.
Two important problems remain. First, it is not clear to me whether the GRAVITY observations as reported in [5] could be consistent with the specific angular momentum ~500 , rather than as suggested by the fits made in [5], ~1000. If not, the second problem arises: how does this material, possibly originating in an equatorial wind from the compact object, acquire such excessively high angular momentum about the binary system of SS 433?
7. Conclusions
Despite flaring outbursts retaining memories of the motion of the compact object, they do not correspond to glimpses of the rim of a classic accretion disk. The flaring material is ejected from the system and is probably dominated by plasma expelled through . This is unlikely to be a great surprise to anyone, but it has not been demonstrated in any earlier work and is relevant to [7] (because the value of q there extracted depends on the mass loss through . The intermitent nature of these outbursts even suggests the Companion is prone to mass ejections.
Funding
This research received no external funding.
Conflicts of Interest
The author declares no conflict of interests.
Appendix A
Here I discuss briefly three other data sets that are relevant. The first consists of a number of spectra taken in the infrared during a single orbit [11], and shows features very similar to the latter period in [13], as analysed in [23]. The Br line is complex; analysed as a superposition of Gaussian profiles it reveals high speed wind and two pairs of much narrower components. One corresponds to the circumbinary disk with an orbital speed of ~250 km , the pair of more extreme components are offset by ~. This pair was interpreted in [11] as from the accretion disk of the compact object and it was suggested that perhaps it was visible in the infrared but only intermittently in the red. However, the ten or so spectra spread over a complete orbit show no memory whatsoever of the motion of the compact object. On the other hand, the extreme blue component is absent in the single spectrum taken marginally before eclipse.
The second set of spectra relevant to these notes consists of five taken in the H and K bands, intermittently in 2014 and 2015. The relevant material is displayed in Figures 1 and 7 of [14], profiles of emission lines in the Brackett sequence. They are mentioned here because these lines are much narrower than the Br sequence in [11]. The latter required fast components; the Br sequence in [14] do not contain them [23] but are readily explained by lines from a wind and lines from the circumbinary disk, just like the H lines in the first part of the sequence in [13], see also [23]. Even in the far infrared the hydrogen flare emission lines appear only intermittently.
Finally, a sequence of parasitic observations covering the Balmer H and H emission lines covered a large part of a precession period intermittently. No more than a few spectra were taken during any single orbit. Throughout this sequence both H and H displayed high speed components to both the red and the blue. The displacements varied from ~500 to ~1000 , Figure 3 of [24]. There is little prospect of being able to detect any systematic variation with the orbital phase, nor indeed with precessional phase. For present purposes, the significance of these observations is that the displacements to red and to blue can be far from symmetric and can vary substantially from one spectrum to the next, over periods of a few days. Whatever the source may be, it does not have the stability one would look for were it to be a Kepler accretion disk, unless clouds came and went.
References
- Fabrika, S.N. The Jets and Supercritical Accretion Disk in SS433; Cambridge Scientific Publishers Ltd: Cambridge, UK, 2004; Volume 12, pp. 1–152. [Google Scholar]
- Cherepashchuk, A.; Postnov, K.; Molkov, S.; Antokhina, E.; Belinski, A. SS433: A massive X-ray binary in an advanced evolutionary Stage. New Astron. Rev. 2020, 89, 101542. [Google Scholar] [CrossRef]
- Middleton, M.J.; Walton, D.J.; Alston, W.; Dauser, T.; Eikenberry, S.; Jiang, Y.-F.; Fabian, A.C.; Fuerst, F.; Brightman, M.; Marshall, H.; et al. NuSTAR reveals the hidden nature of SS433. arXiv 2019, arXiv:1810.10518v2. [Google Scholar]
- Fabrika, S.N.; Ueda, Y.; Vinokurov, A.; Sholukhova, O.; Shidatsu, M. Supercritical accretion disks in ultraluminous X-ray sources and SS 433. Nat. Phys. 2015, 11, 551–553. [Google Scholar] [CrossRef] [Green Version]
- Waisberg, I.; Dexter, J.; Petrucci, P.-O.; Dubus, G.; Perraut, K. Super-Keplerian equatorial outflows in SS 433. Astron. Astrophys. 2019, 623, A47. [Google Scholar] [CrossRef]
- Bowler, M.G. SS 433: Two robust determinations fix the mass ratio. Astron. Astrophys. 2018, 619, L4. [Google Scholar] [CrossRef]
- Cherepashchuk, A.M.; Postnov, K.A.; Belinski, A.A. On masses of the components in SS433. Mon. Not. R. Astron. Soc. 2018, 479, 4844–4848. [Google Scholar] [CrossRef]
- Dopita, M.A.; Cherepashchuk, A.M. High resolution monitoring of rest Hα in SS 433. Vistas Astron. 1981, 25, 51–59. [Google Scholar] [CrossRef]
- Bowler, M.G. SS 433: The accretion disk revealed in Hα. Astron. Astrophys. 2010, 516, A24. [Google Scholar] [CrossRef]
- Blundell, K.M.; Schmidtobreick, L.; Trushkin, S. SS433’s accretion disc, wind and jets: Before, during and after a major flare. Mon. Not. R. Astron. Soc. 2011, 417, 2401–2410. [Google Scholar] [CrossRef] [Green Version]
- Perez, M.S.; Blundell, K.M. Inflow and outflow from the accretion disc of the microquasar SS 433: UKIRT spectroscopy. Mon. Not. R. Astron. Soc. 2009, 397, 849–856. [Google Scholar] [CrossRef] [Green Version]
- Bowler, M.G. SS 433: C II emission from the disk photosphere. arXiv 2020, arXiv:2009.00589. [Google Scholar]
- Schmidtobreick, L.; Blundell, K. The emission distribution in SS433. Proc. Sci. 2006, 094, 1–5. [Google Scholar]
- Robinson, E.L.; Froning, C.S.; Jaffe, D.T.; Kaplan, K.F.; Kim, H.; Mace, G.N.; Sokal, K.R.; Lee, J.-J. The spectrum of SS 433 in the H and K bands. Astrophys. J. 2017, 841, 79. [Google Scholar] [CrossRef] [Green Version]
- Goranskii, V.P.; Esipov, V.F.; Cherepashchuk, A.M. Optical variability of SS 433 in 1978–1996. Astron. Rep. 1998, 42, 209–228. [Google Scholar]
- Schmidtobreick, L.; Blundell, K. On the binary nature of SS 433. Astrophys. Space Sci. 2006, 304, 271–274. [Google Scholar] [CrossRef]
- Bowler, M.G. SS 433: O I lines and the circumbinary disk. arXiv 2020, arXiv:1512.06885v2. [Google Scholar]
- Blundell, K.M.; Bowler, M.G. Schmidtobreick, L. Fluctuations and symmetry in the speed and directions of the jets of SS 433 on different timescales. Astron. Astrophys. 2007, 474, 903–910. [Google Scholar] [CrossRef] [Green Version]
- Shu, F.H.; Lubow, S.H.; Anderson, L. On the structure of contact binaries. III. Mass and energy flow. Astrophys. J. 1979, 229, 223–241. [Google Scholar] [CrossRef]
- Fabrika, S.N. An extended disc around SS 433. Mon. Not. R. Astron. Soc. 1993, 261, 241–245. [Google Scholar] [CrossRef] [Green Version]
- Pejcha, O.; Metzger, B.D.; Tomida, K. Cool and luminous transients from mass-losing binary stars. Mon. Not. R. Astron. Soc. 2016, 455, 4351–4372. [Google Scholar] [CrossRef] [Green Version]
- Bowler, M.G. Interpretation of observations of the circumbinary disk of SS 433. Astron. Astrophys. 2010, 521, A81. [Google Scholar] [CrossRef]
- Bowler, M.G. The accretion disk of SS 433? arXiv 2017, arXiv:1708.02555. [Google Scholar]
- Perez, M.S.; Blundell, K.M. SS 433’s circumbinary ring and accretion disc viewed through its attenuating disc wind. Mon. Not. R. Astron. Soc. 2010, 408, 2–8. [Google Scholar] [CrossRef] [Green Version]
Figure 1.
Three spectra of Hα taken from [9], after the onset of flaring. The lowest panel is for day + 291, the middle for + 294 and the uppermost + 297. Each is decomposed into five gaussian components, with intensities normalised to the continuum, see Figure 3. The two outermost are flare, the broad central component wind and the remaining pair originate in the circumbinary disk. Day + 294 was an eclipse day; both the blue and the red flares are substantial, having roughly twice the normalised intensity.

Figure 2.
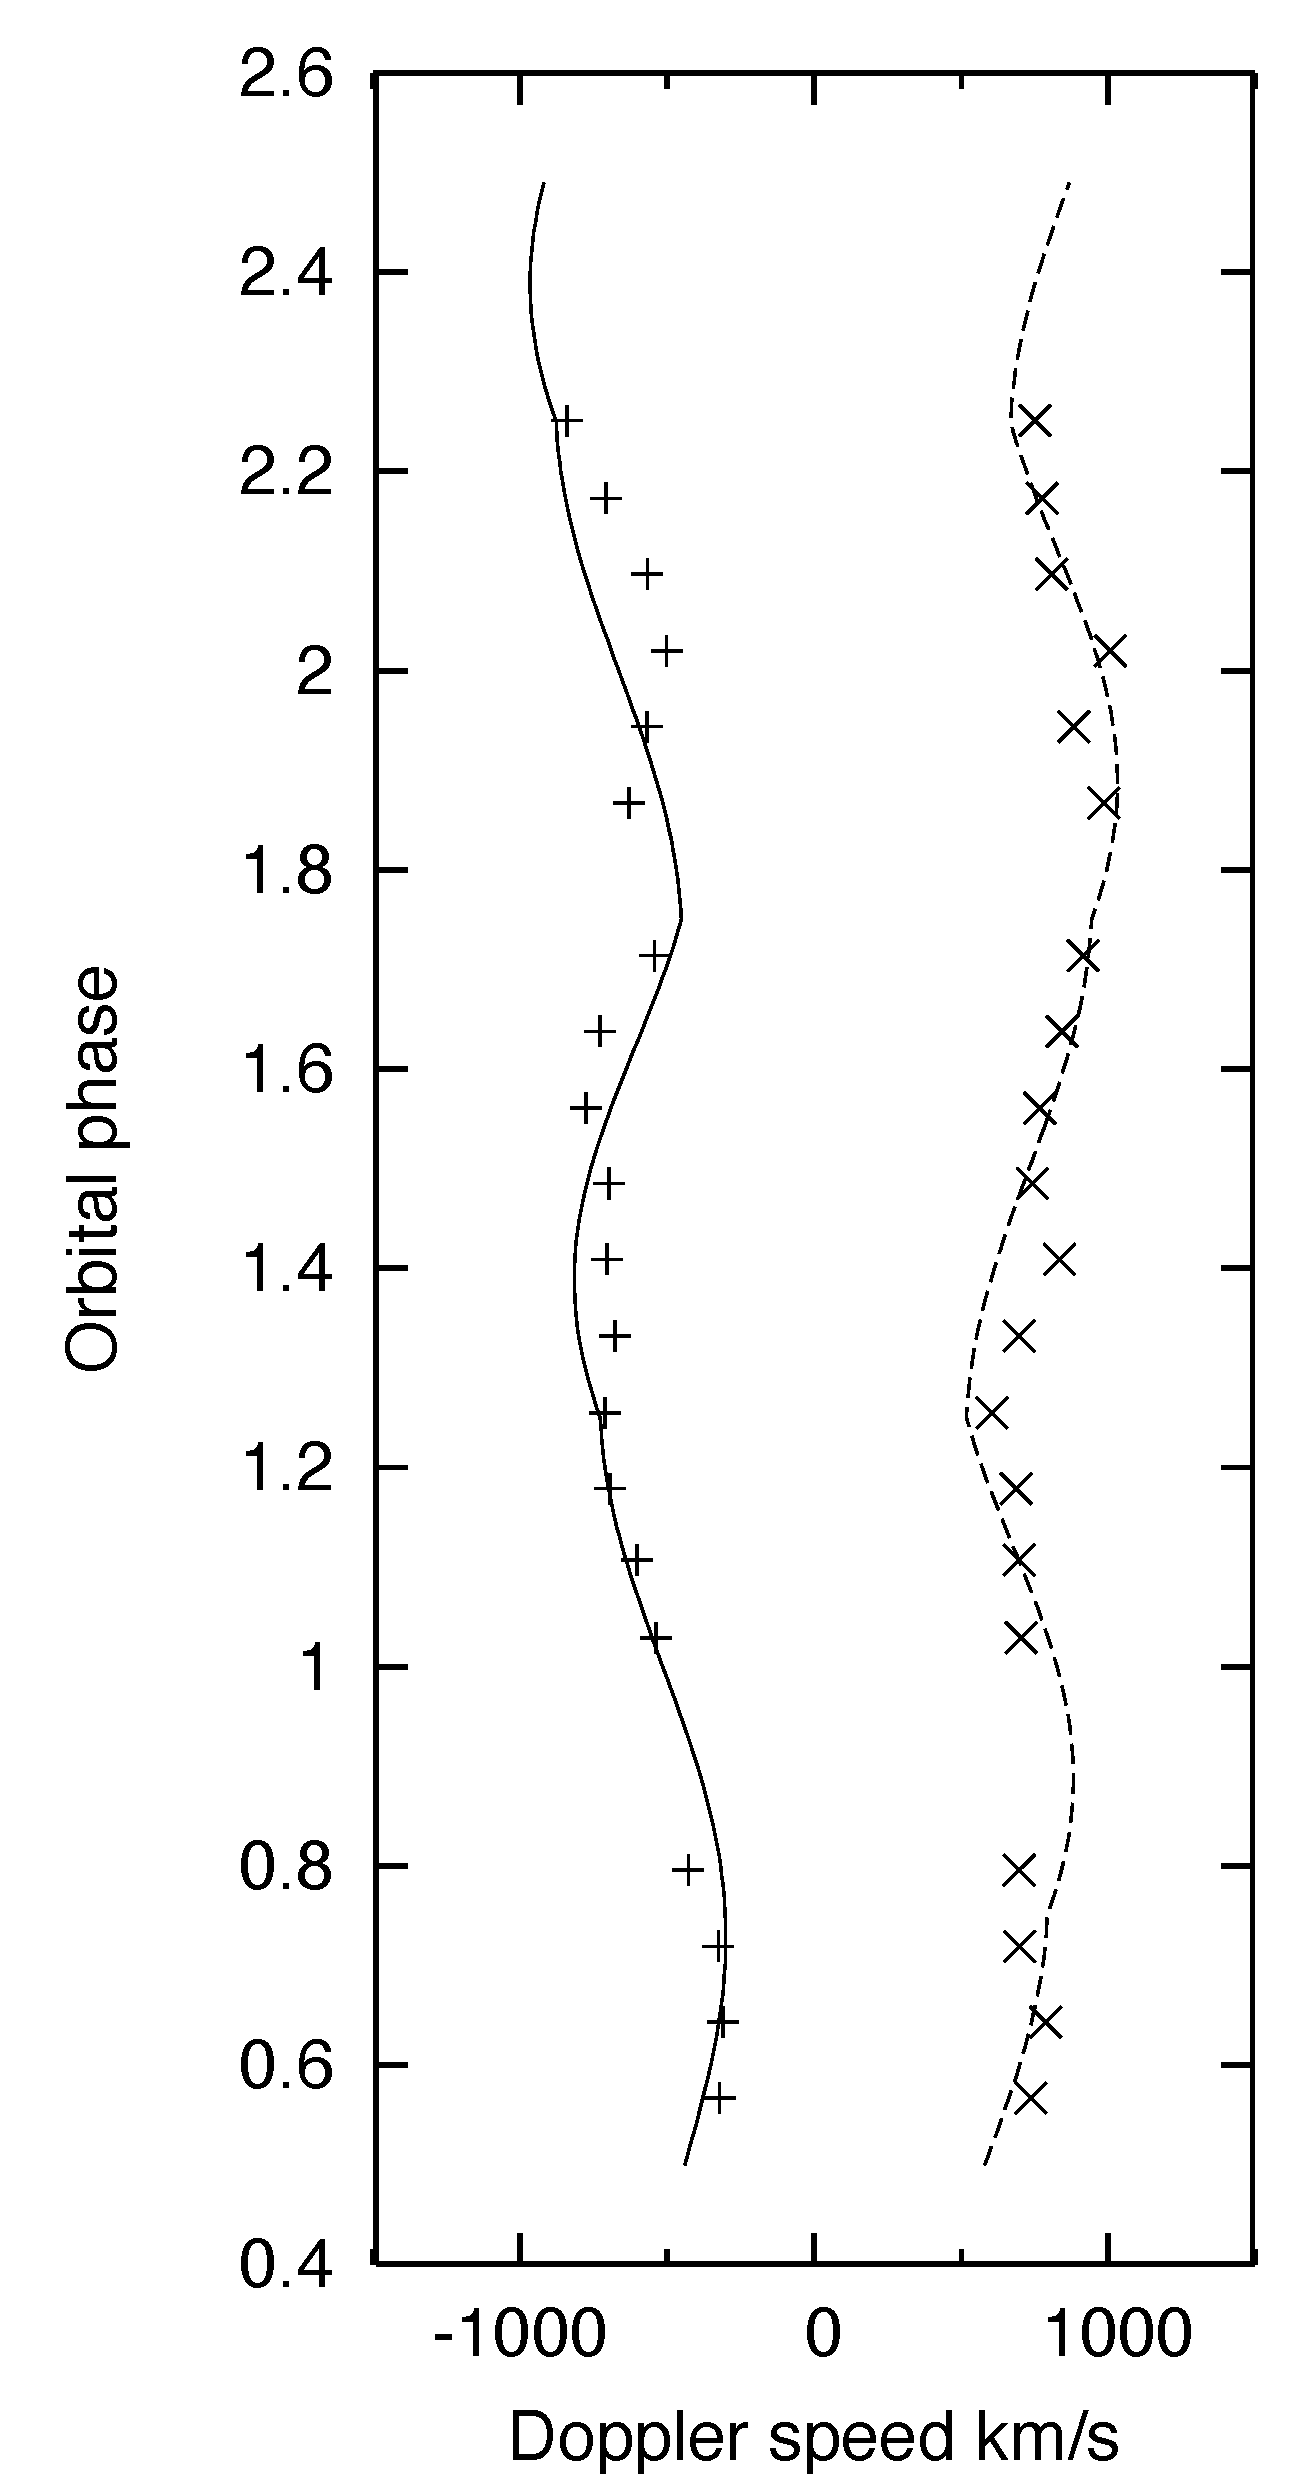
The Doppler shifts of the blue and the red flare components as orbital phase advances (from [9]). This pattern reveals a distinct memory of orbital phase. The superimposed curves assume a source in an accretion disk; the memory could also be caused by expulsion of plasma (see text).
Figure 2.
The Doppler shifts of the blue and the red flare components as orbital phase advances (from [9]). This pattern reveals a distinct memory of orbital phase. The superimposed curves assume a source in an accretion disk; the memory could also be caused by expulsion of plasma (see text).

Figure 3.
The spectrum of SS 433 on day +260. The stationary H and He I lines are very clear, sitting on top of the sloping continuum, for which the ratio of 6500 to 8000 is 0.47. The lower panel shows extracted jet lines.
Figure 3.
The spectrum of SS 433 on day +260. The stationary H and He I lines are very clear, sitting on top of the sloping continuum, for which the ratio of 6500 to 8000 is 0.47. The lower panel shows extracted jet lines.

Figure 4.
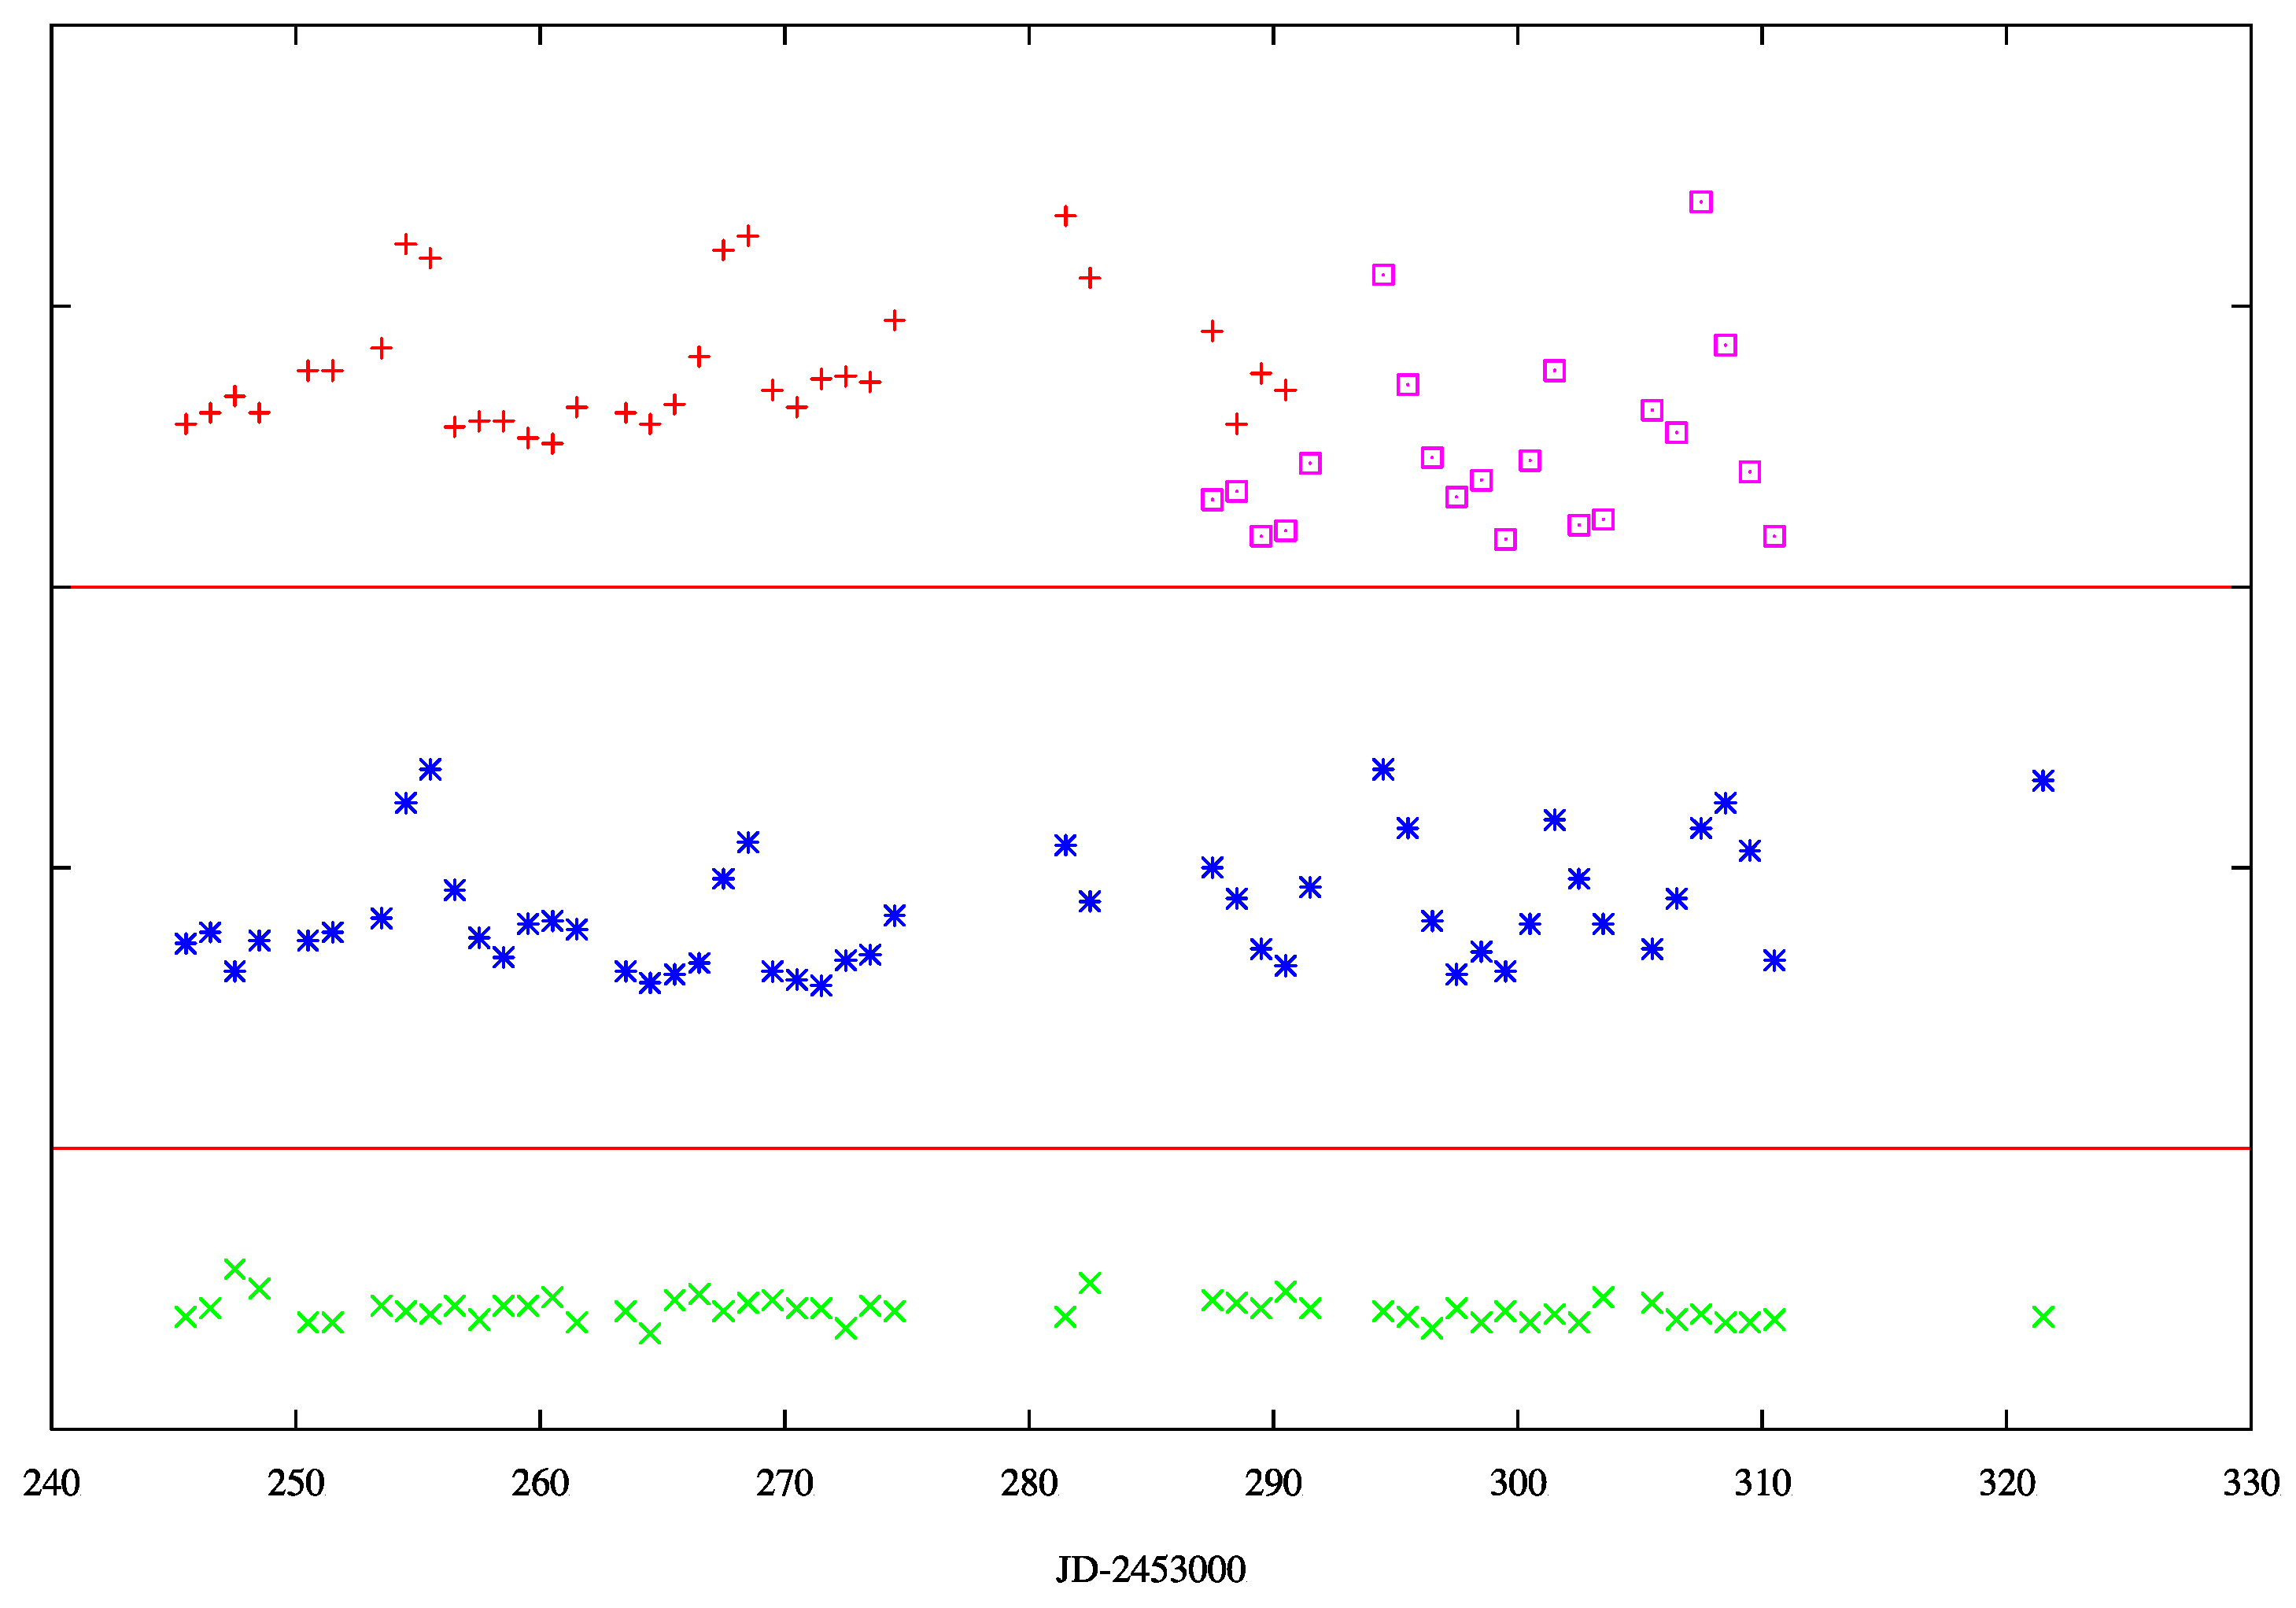
Evidence against flares revealing a source within the photospheric radius. The lowest panel shows the ratio of continuum at 6500 to 8000 ×. There is no significant change after flaring commences at +287. The middle panel shows the ratio of O I 8446 to the local continuum, . This ratio roughly doubles during every eclipse and is certainly not narrower after flaring is initiated; the photosphere is not blown away. The uppermost panel, left, shows the ratio of He I 6678 to local continuum, +. This checks the eclipses against O I, until He I becomes unreliable. On the right of the uppermost panel is the ratio of the red flare component to background continuum,. It doubles when the photosphere is eclipsed (days +294,307), a direct demonstration that the flare is not eclipsed. A single period of photospheric obscuration is centred on day +302.
Figure 4.
Evidence against flares revealing a source within the photospheric radius. The lowest panel shows the ratio of continuum at 6500 to 8000 ×. There is no significant change after flaring commences at +287. The middle panel shows the ratio of O I 8446 to the local continuum, . This ratio roughly doubles during every eclipse and is certainly not narrower after flaring is initiated; the photosphere is not blown away. The uppermost panel, left, shows the ratio of He I 6678 to local continuum, +. This checks the eclipses against O I, until He I becomes unreliable. On the right of the uppermost panel is the ratio of the red flare component to background continuum,. It doubles when the photosphere is eclipsed (days +294,307), a direct demonstration that the flare is not eclipsed. A single period of photospheric obscuration is centred on day +302.

Publisher’s Note: MDPI stays neutral with regard to jurisdictional claims in published maps and institutional affiliations. |
© 2021 by the author. Licensee MDPI, Basel, Switzerland. This article is an open access article distributed under the terms and conditions of the Creative Commons Attribution (CC BY) license (https://creativecommons.org/licenses/by/4.0/).
Share and Cite
MDPI and ACS Style
Bowler, M. SS 433 Optical Flares: A New Analysis Reveals Their Origin in L2 Overflow Episodes. Galaxies 2021, 9, 46. https://0-doi-org.brum.beds.ac.uk/10.3390/galaxies9030046
AMA Style
Bowler M. SS 433 Optical Flares: A New Analysis Reveals Their Origin in L2 Overflow Episodes. Galaxies. 2021; 9(3):46. https://0-doi-org.brum.beds.ac.uk/10.3390/galaxies9030046
Chicago/Turabian StyleBowler, Michael. 2021. "SS 433 Optical Flares: A New Analysis Reveals Their Origin in L2 Overflow Episodes" Galaxies 9, no. 3: 46. https://0-doi-org.brum.beds.ac.uk/10.3390/galaxies9030046
Note that from the first issue of 2016, this journal uses article numbers instead of page numbers. See further details here.