3. Finite Element Formulation
The thermo-mechanical simulation of the clutch is set up and performed in ANSYS Mechanical using the internal scripting language APDL. The basic principle of the simulation setup is based on published preliminary work [
27,
28,
29]. Static-mechanical calculations are coupled with transient-thermal calculations by a sequential process. In the static-mechanical simulation, the deformation of the plates and the pressure distribution on the friction interfaces are first determined. The pressure is an input parameter of the transient thermal simulation. The local heat flux density
is calculated according to the local pressure
and the local sliding velocity
for each element on the friction interfaces according to Equation (1). According to Equation (6), the computed temperature distribution is subsequently used as an input parameter for the mechanical simulation. The total strains are calculated based on the thermal and mechanical strains, and new pressure distribution is determined.
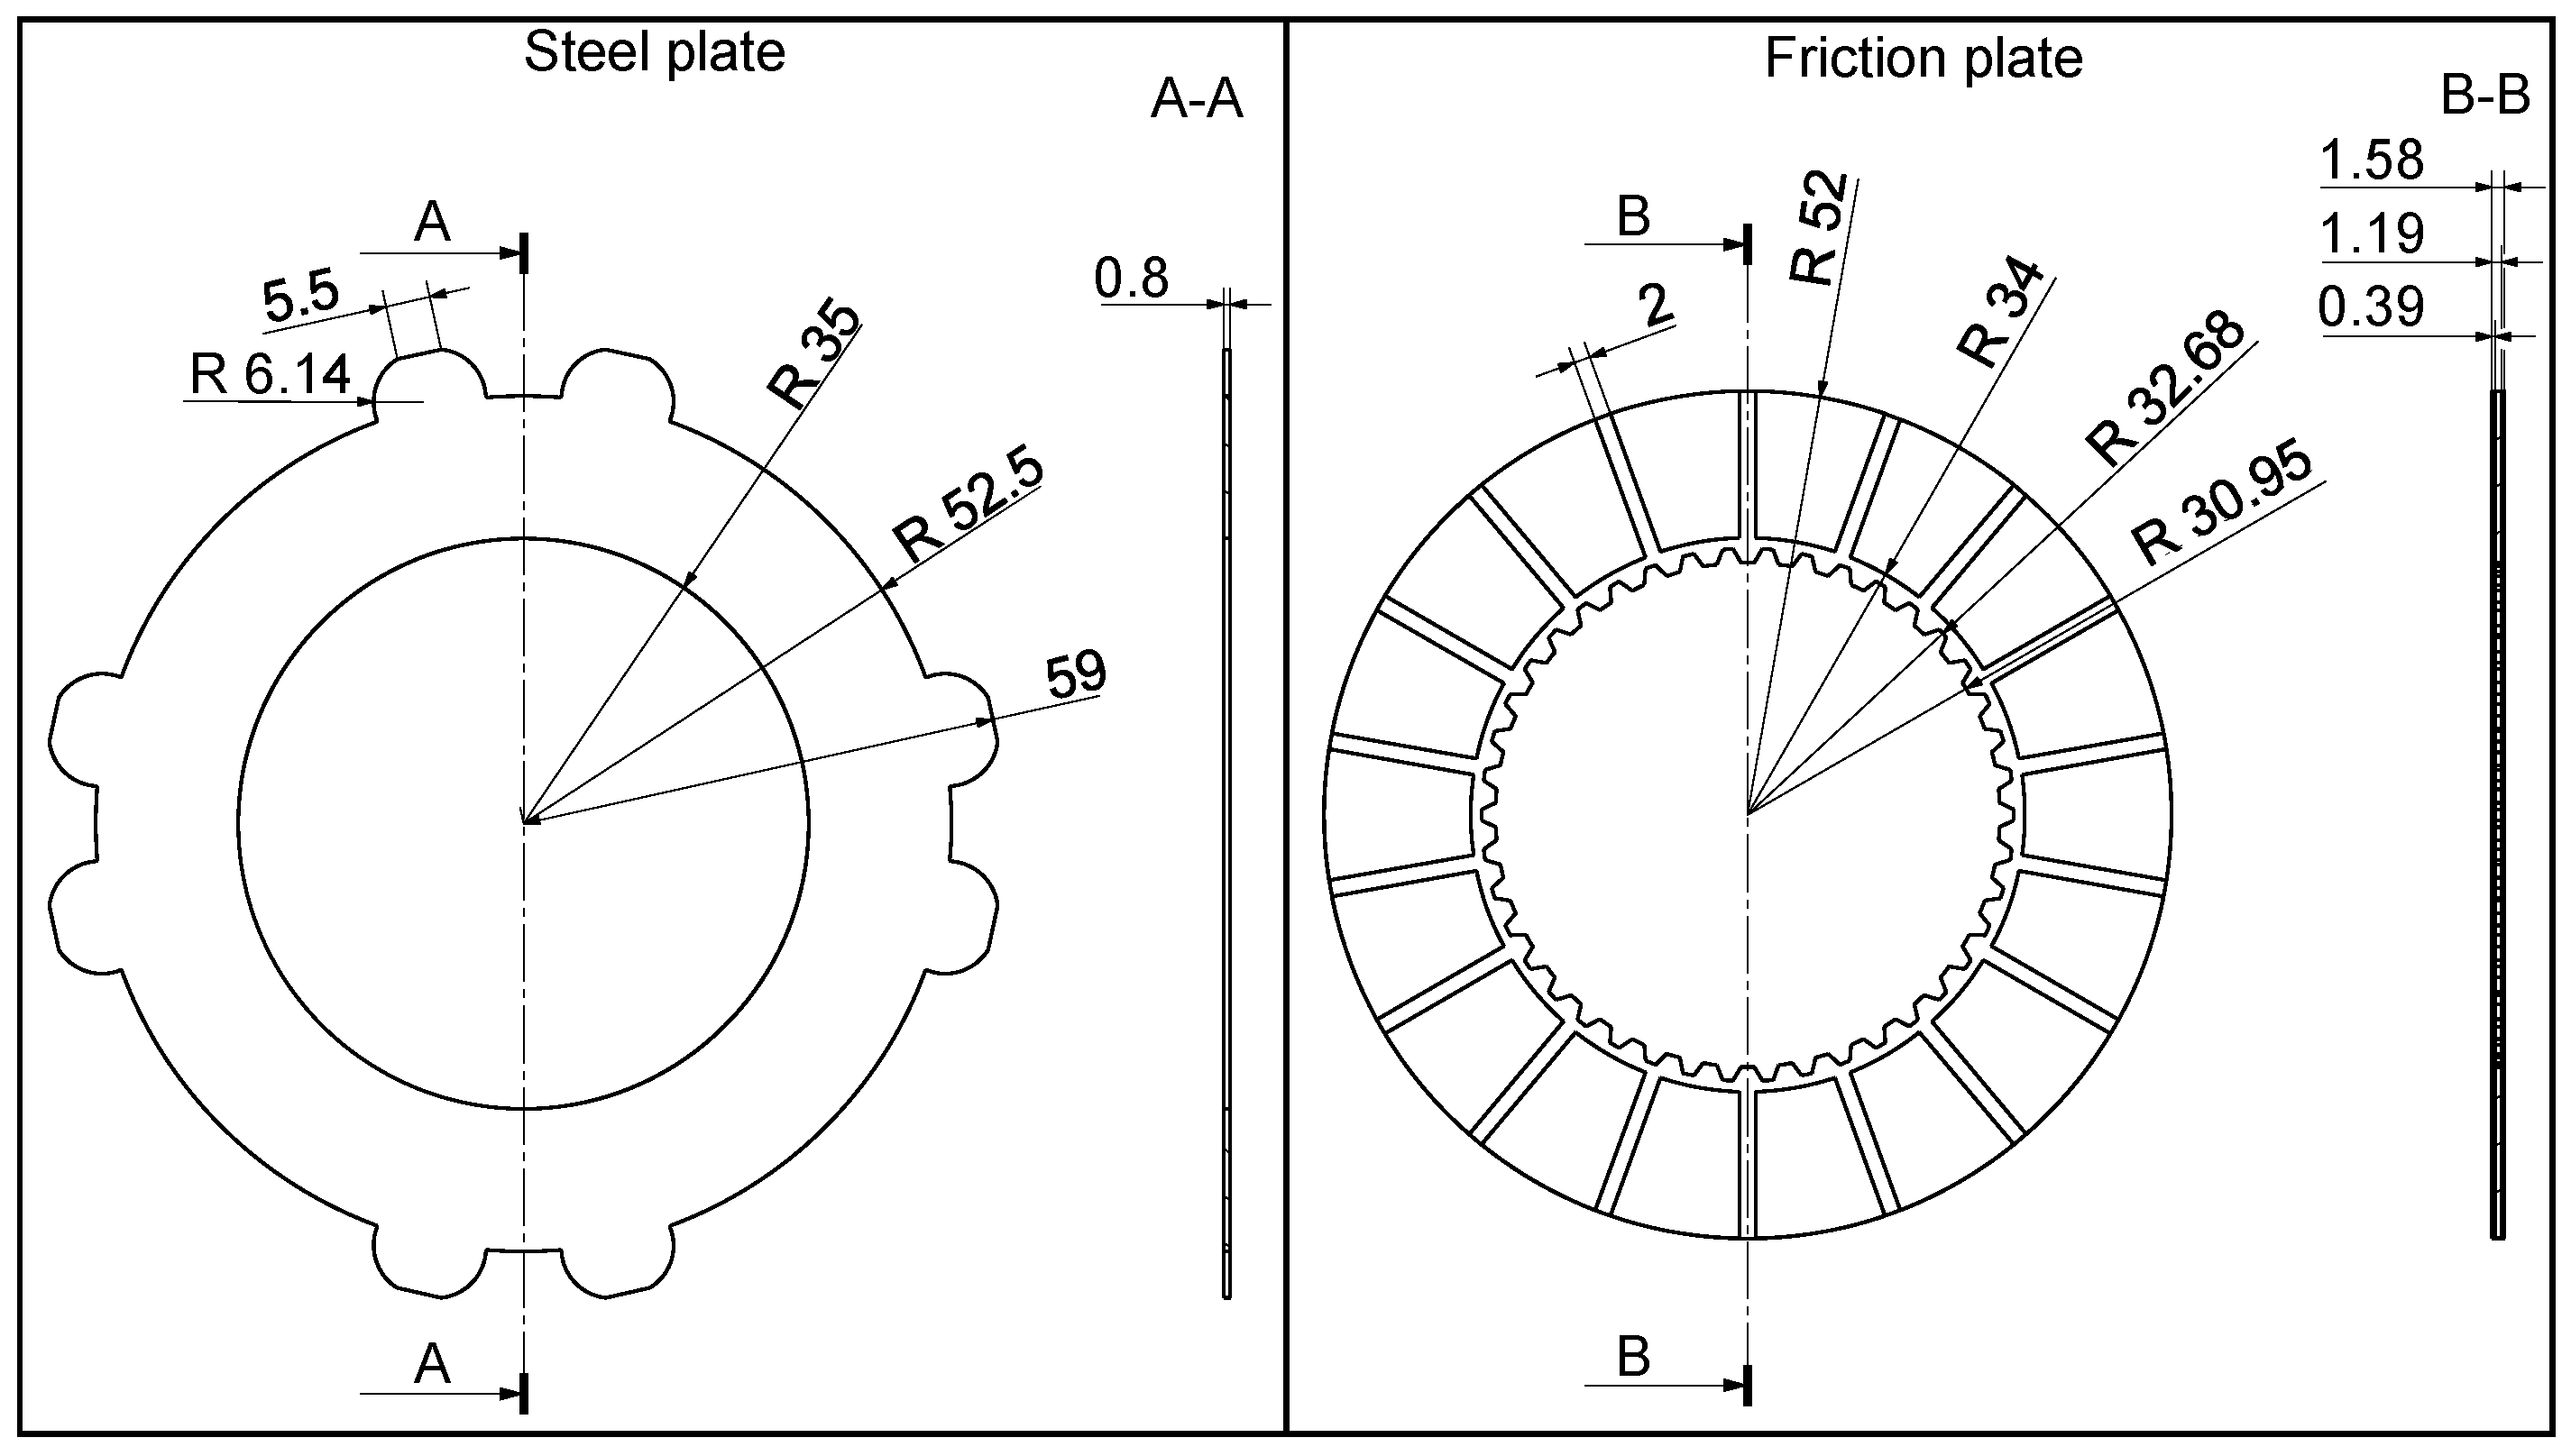
3.1. Geometry
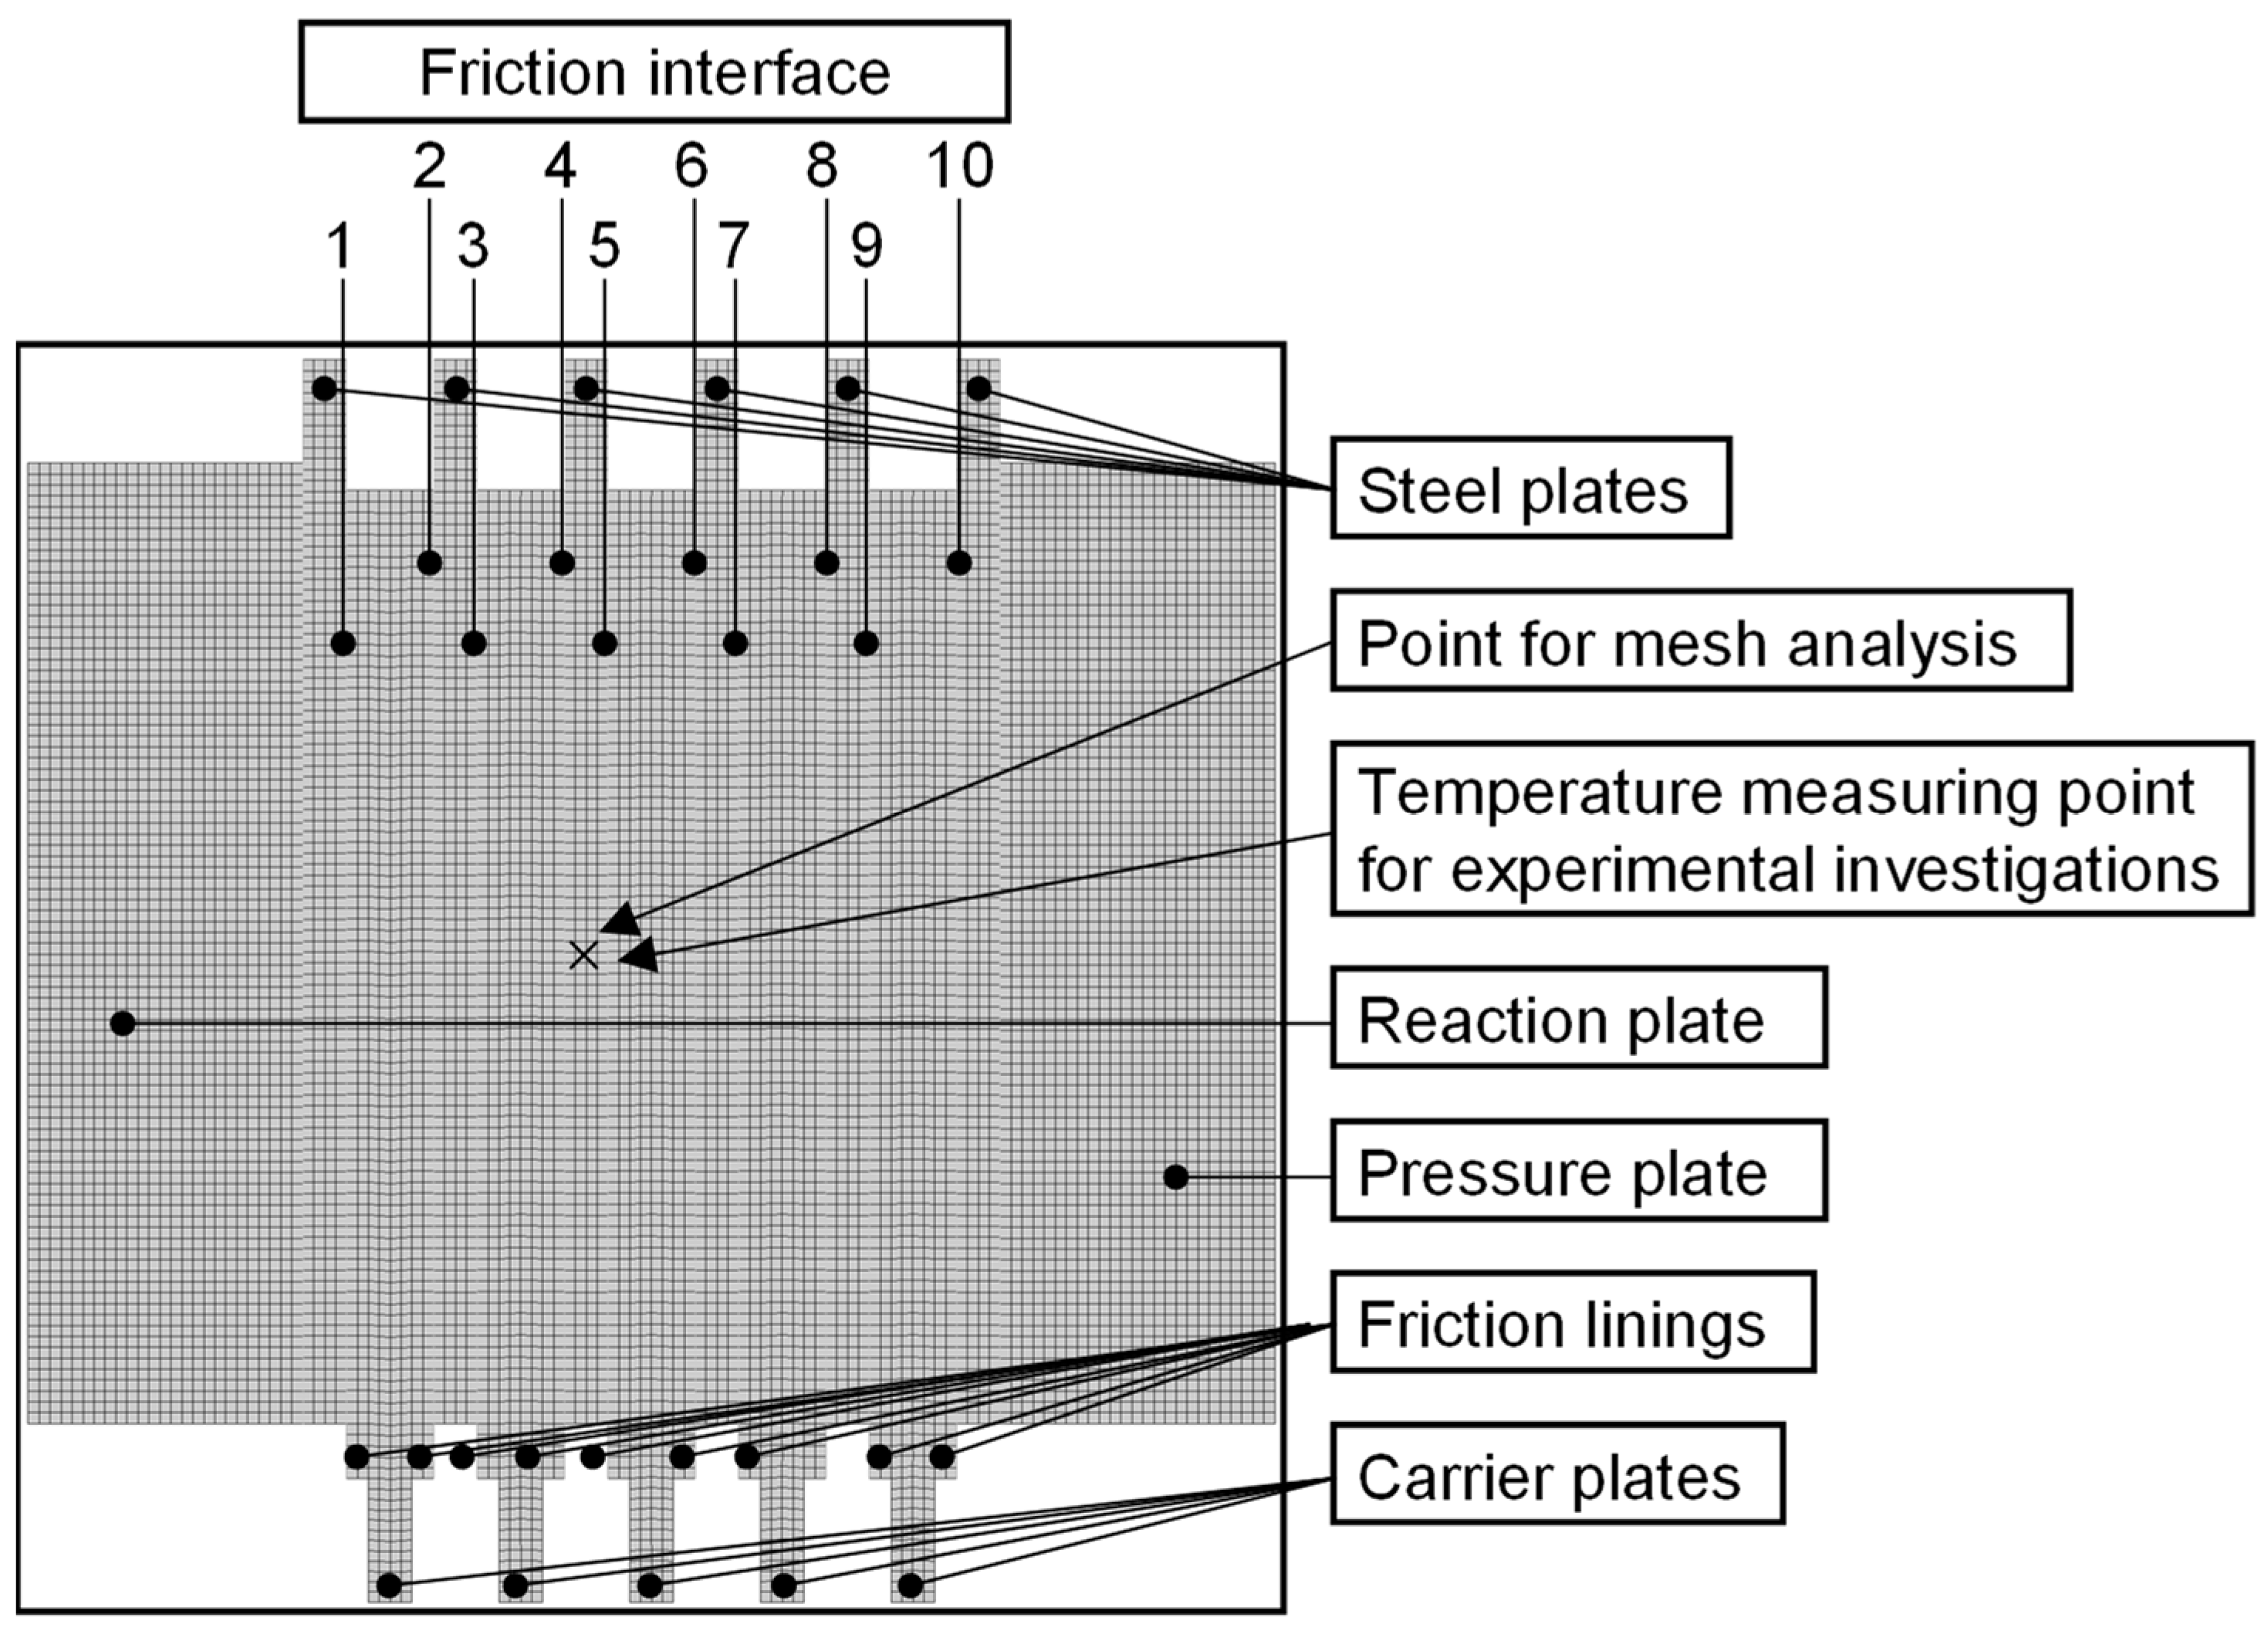
Technical drawing of the parts to be investigated is shown in
Figure 1. The steel plates are designed as outer plates and the friction plates as inner plates.
3.2. Finite Element Method Settings
The area elements PLANE182 (mechanical calculation) and PLANE55 (thermal calculation) with four nodes each are used for the geometry structure. In addition to the area elements, the contact elements must also be evaluated and defined. Therefore, a pair-based contact condition with TARGE169 and CONTA172 elements was chosen. The contact elements overlay the underlying area elements in the simulation model. As contact algorithm the Augmented Lagrangian method is used.
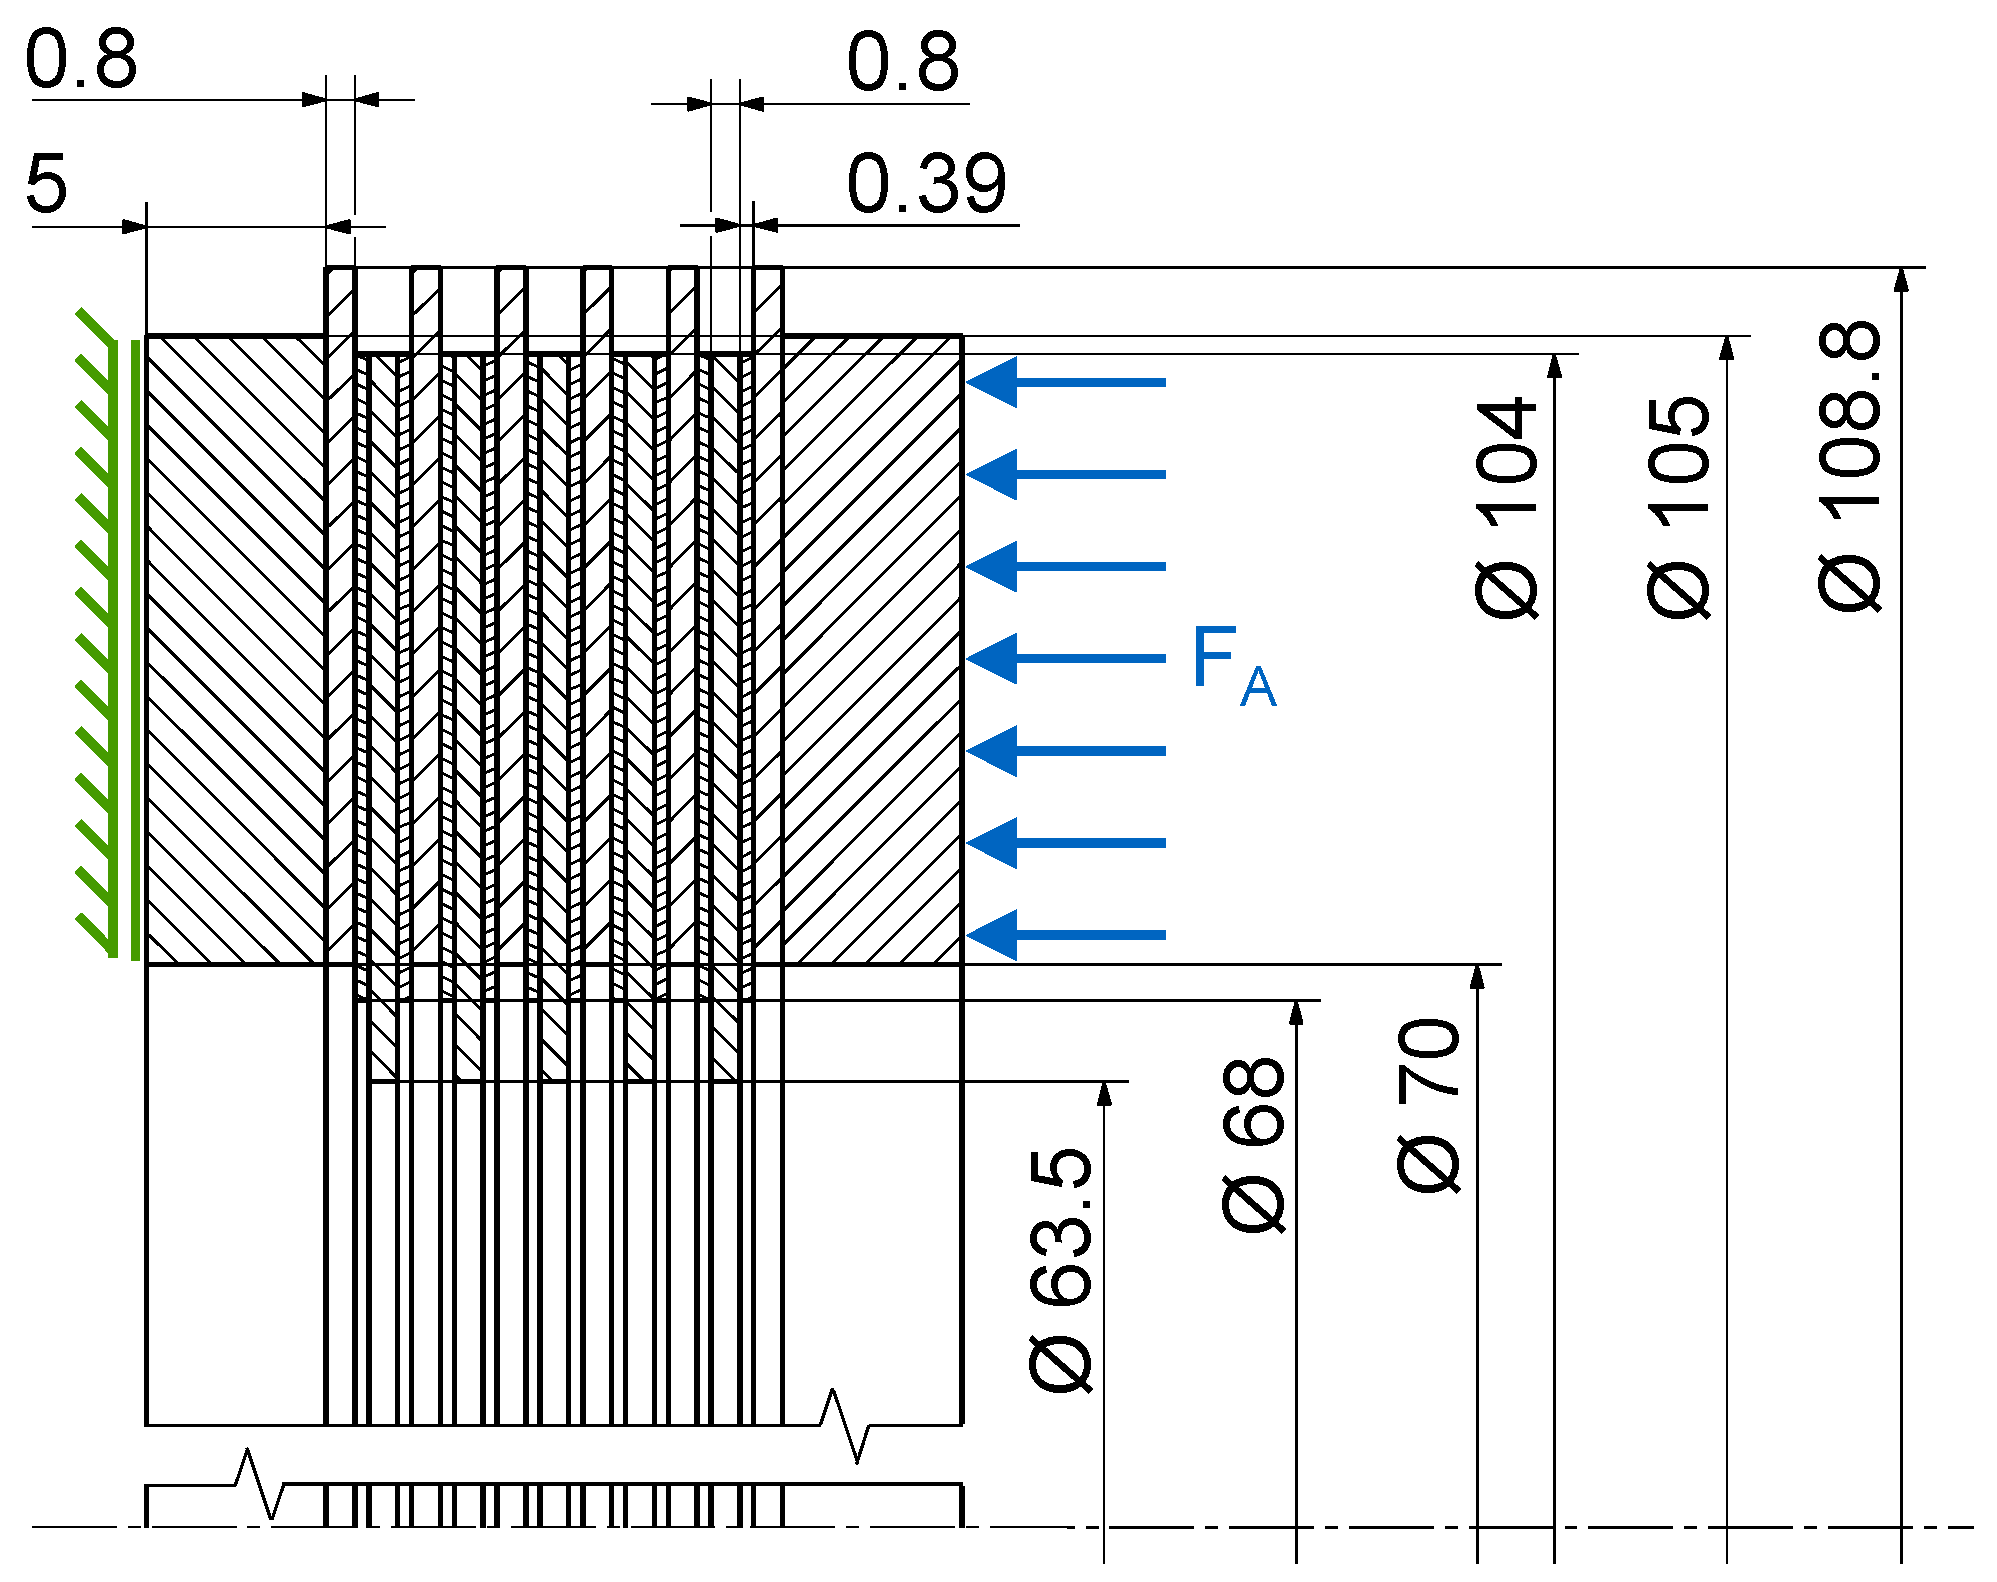
For the simulation, it is necessary to define the Dirichlet and the Neumann boundary conditions for the mechanical and thermal calculations. There are two aspects to the Dirichlet boundary conditions of the mechanical calculations. On the one hand, it is assumed that the left side of the reaction plate, according to
Figure 2, does not allow any displacement in the axial direction. On the other hand, the axial displacement of the right face of the pressure plate, where the axial force is applied, is uniform. For the thermal calculation, it is assumed that the multi-plate clutch already has a temperature of 80 °C at the beginning of the simulation. In addition, passive cooling is implemented through the contact surfaces of the teeth in the circumferential direction and the axial mounting parts. The heat flow rate is calculated according to Equation (9) by taking into account Equation (10), and the following assumptions are made. For the passive cooling studies, all contact partners are made of steel. According to Asif [
23], a predominantly plastic contact behavior is to be assumed in this case. Measurements are taken on the steel plates to determine surface roughness
. Effective arithmetic average slope
represents the slopes of the individual roughnesses in contact. From the study of Tariq [
23] it can be seen that effective arithmetic average slope
is mainly influenced by the effective surface roughness. The dependence is linear. Therefore, in this study,
is determined from the measured values of Dou et al. [
25] by means of interpolation. To calculate the thermal contact conductance, the hardness, which is also required, is measured. Finally, the contact area for heat conduction through the teeth is needed. In the 2D model, the shape of the teeth of the steel plates and the lining carrier plate cannot be reproduced due to the rotational symmetry. Since the lateral surface of the components in the FE model is much larger than the contact surfaces of the teeth to the carriers, this is considered via a dimensionless factor:
Table 1 provides an overview of the values required for the calculation of Equation (10). For the factors
,
, and
, the values of Dou et al. [
25] for a surface roughness
= 0.40 were adopted.
The share of free convection and thermal radiation is about 0.15% each. For this reason, both heat transport mechanisms are neglected in the following.
The thermal Neumann boundary condition is the heat flux rate in the contact elements, which is calculated according to Equation (1). The determination and application of
must be performed individually for each network element. The reason for the element-wise calculation is the relative velocity, which increases with the radial coordinate, as can be seen in
Figure 1.
3.3. Operating Conditions
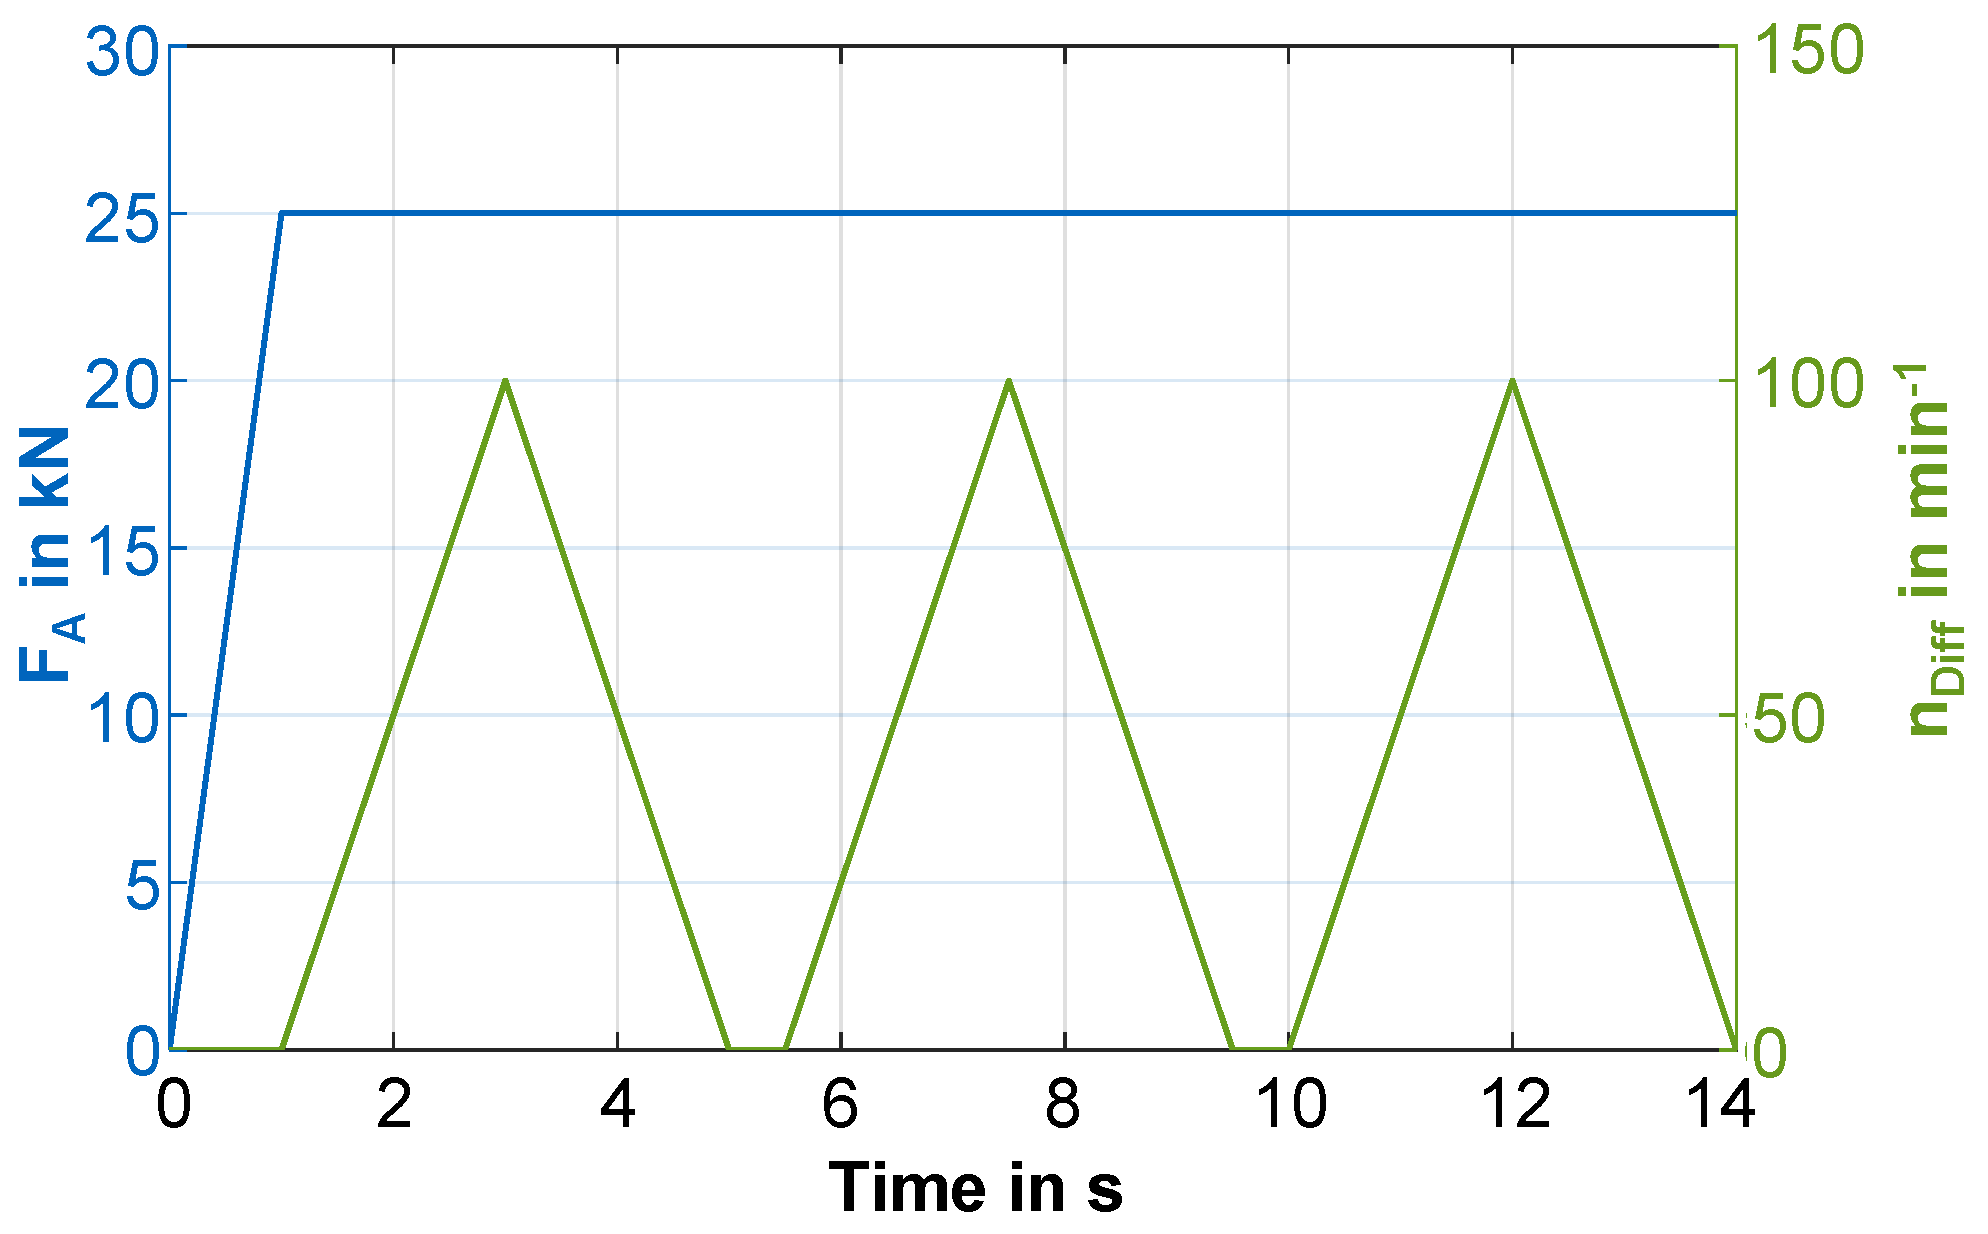
In the following, the load parameters of the clutch, which represent the mechanical Neumann boundary conditions, are explained. The clutch is to be operated under transient slip conditions. After the axial force has been applied, the clutch is repeatedly accelerated, and the differential speed is reduced to zero again. The individual ramps for the build-up and reduction of the differential speeds are each 2 s long. Between the slip phases, there is a pause of 0.5 s.
Figure 3 shows the axial force and differential speed curve with exemplary values.
3.4. Material Properties
In addition to the load parameters, it is also necessary to specify the material properties for the simulation. The outer plates, the lining carrier plates, and the mounting parts are made of steel. The friction linings are paper friction linings consisting of organic blended fabric.
Table 2 lists the used material properties for the simulation model. With the exception of the Young’s modulus, the values are taken from the literature [
30].
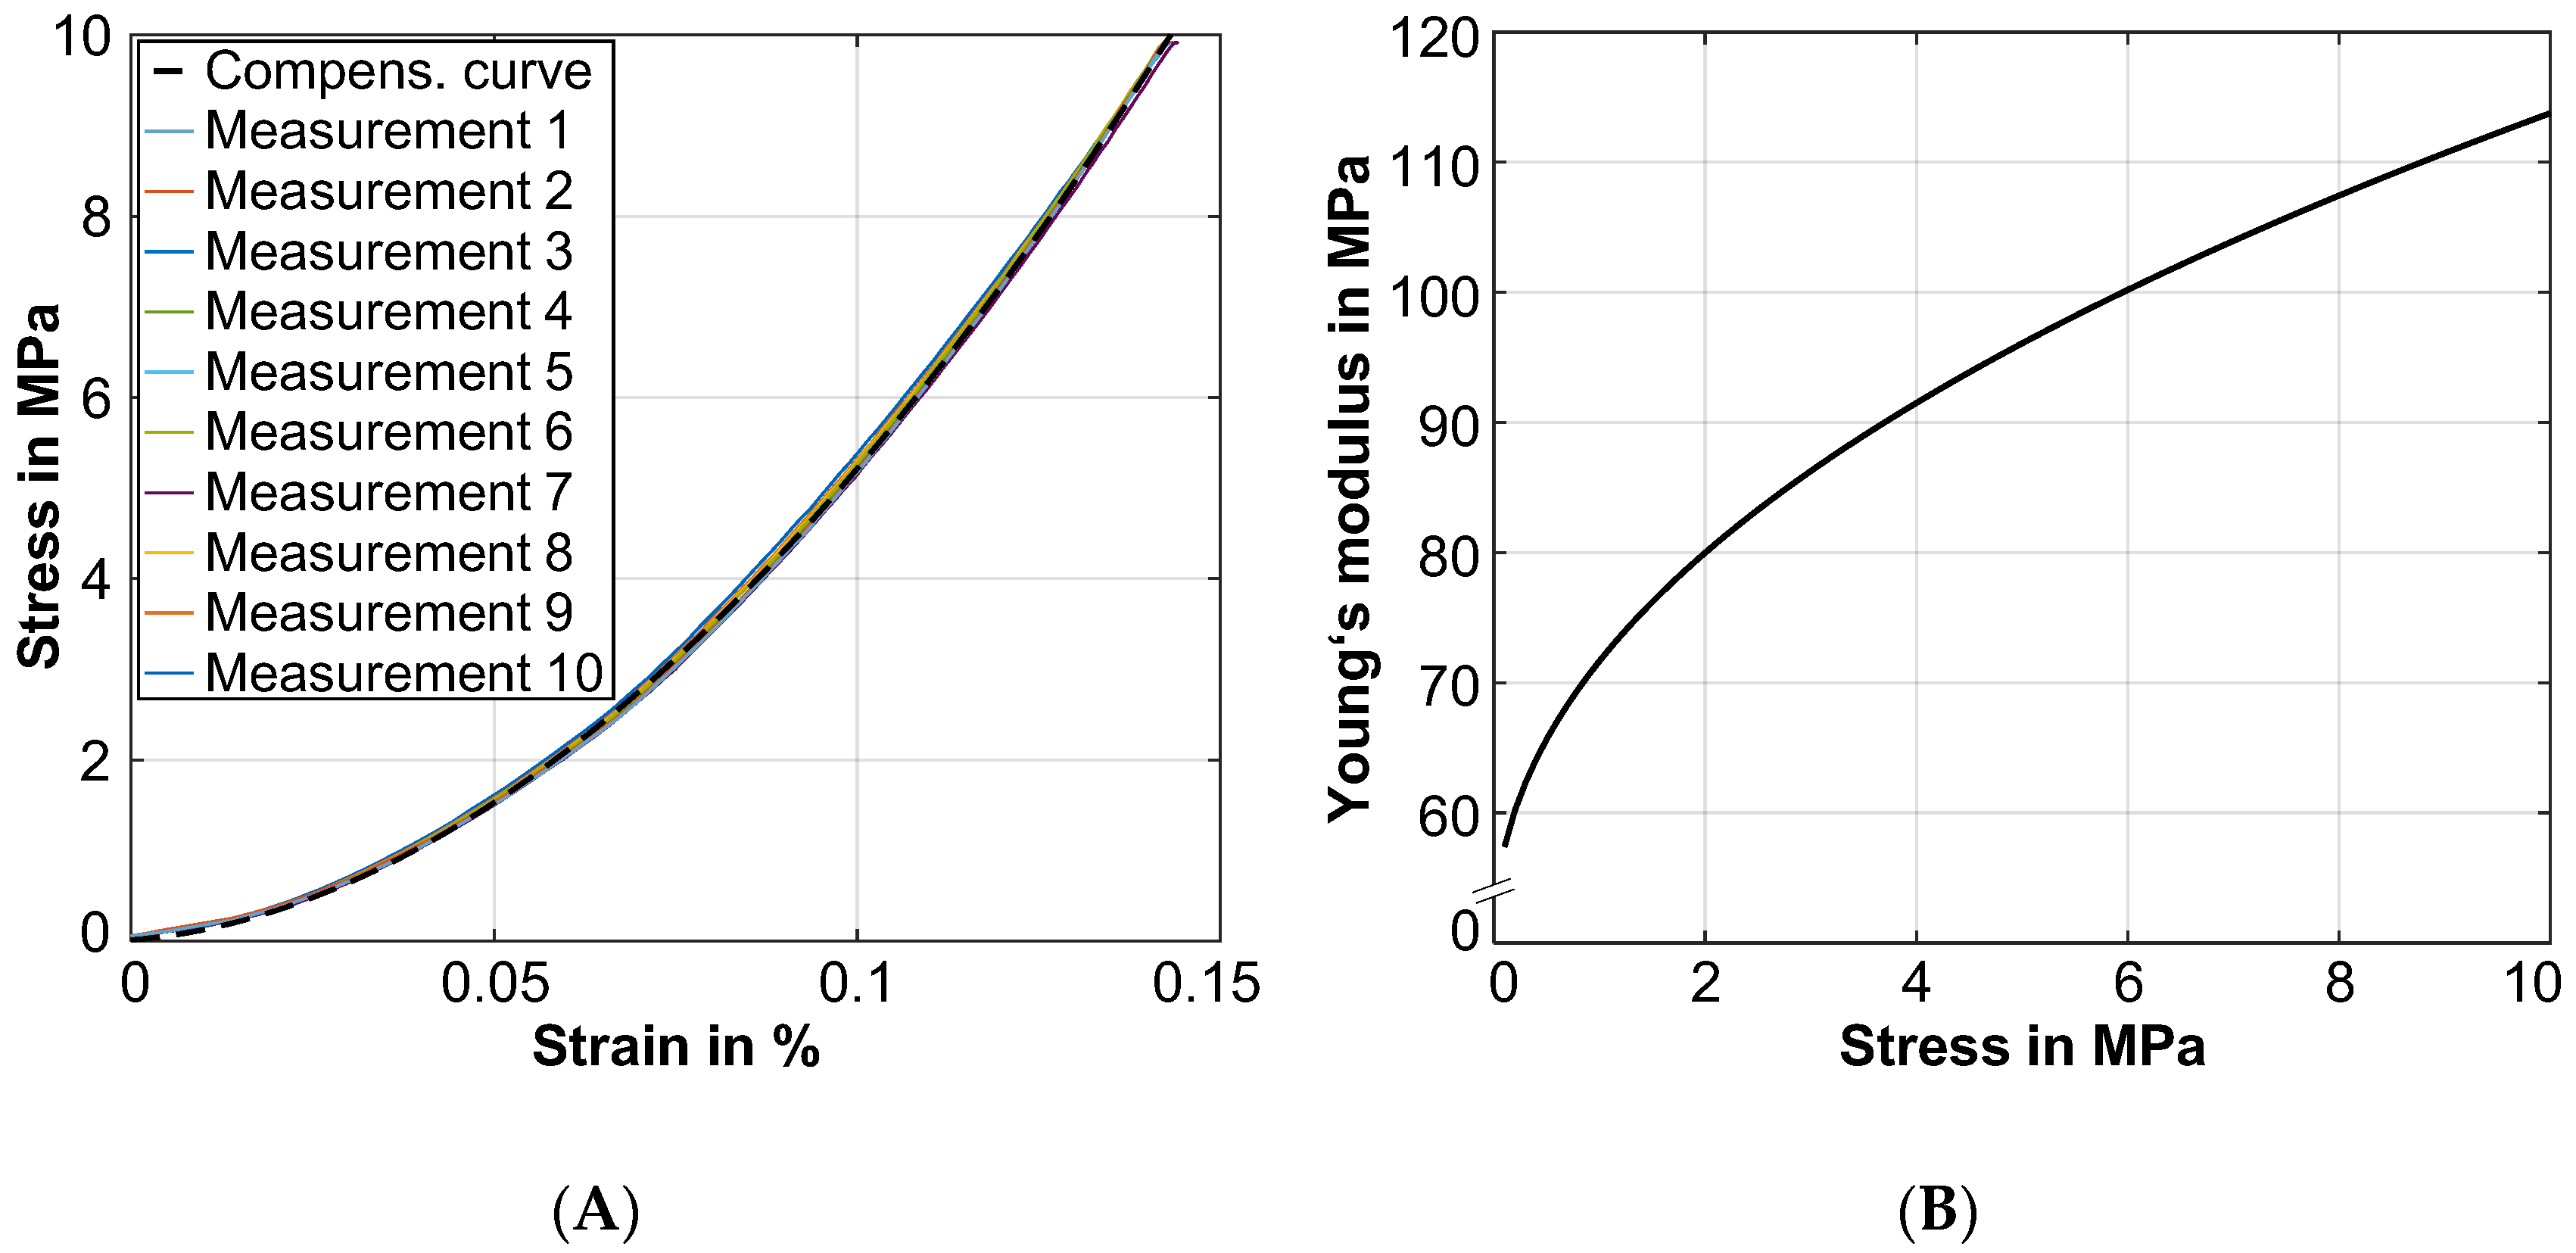
The Young’s modulus of the friction lining is measured. For this purpose, ten compression tests are carried out with a set of plates (six steel plates, five friction plates). The measured data are shown in
Figure 3 on the left. The material behavior is nonlinear. The measured data are described by a compensation curve to determine the Young’s modulus:
The Young’s modulus is the slope of the curve in the stress–strain diagram or, in mathematical terms, the first derivative of stress with respect to strain. The first derivative of Equation (17) is:
Thus, the Young’s modulus of the friction lining can be described as a function of stress. The curve is shown on the right in
Figure 4.
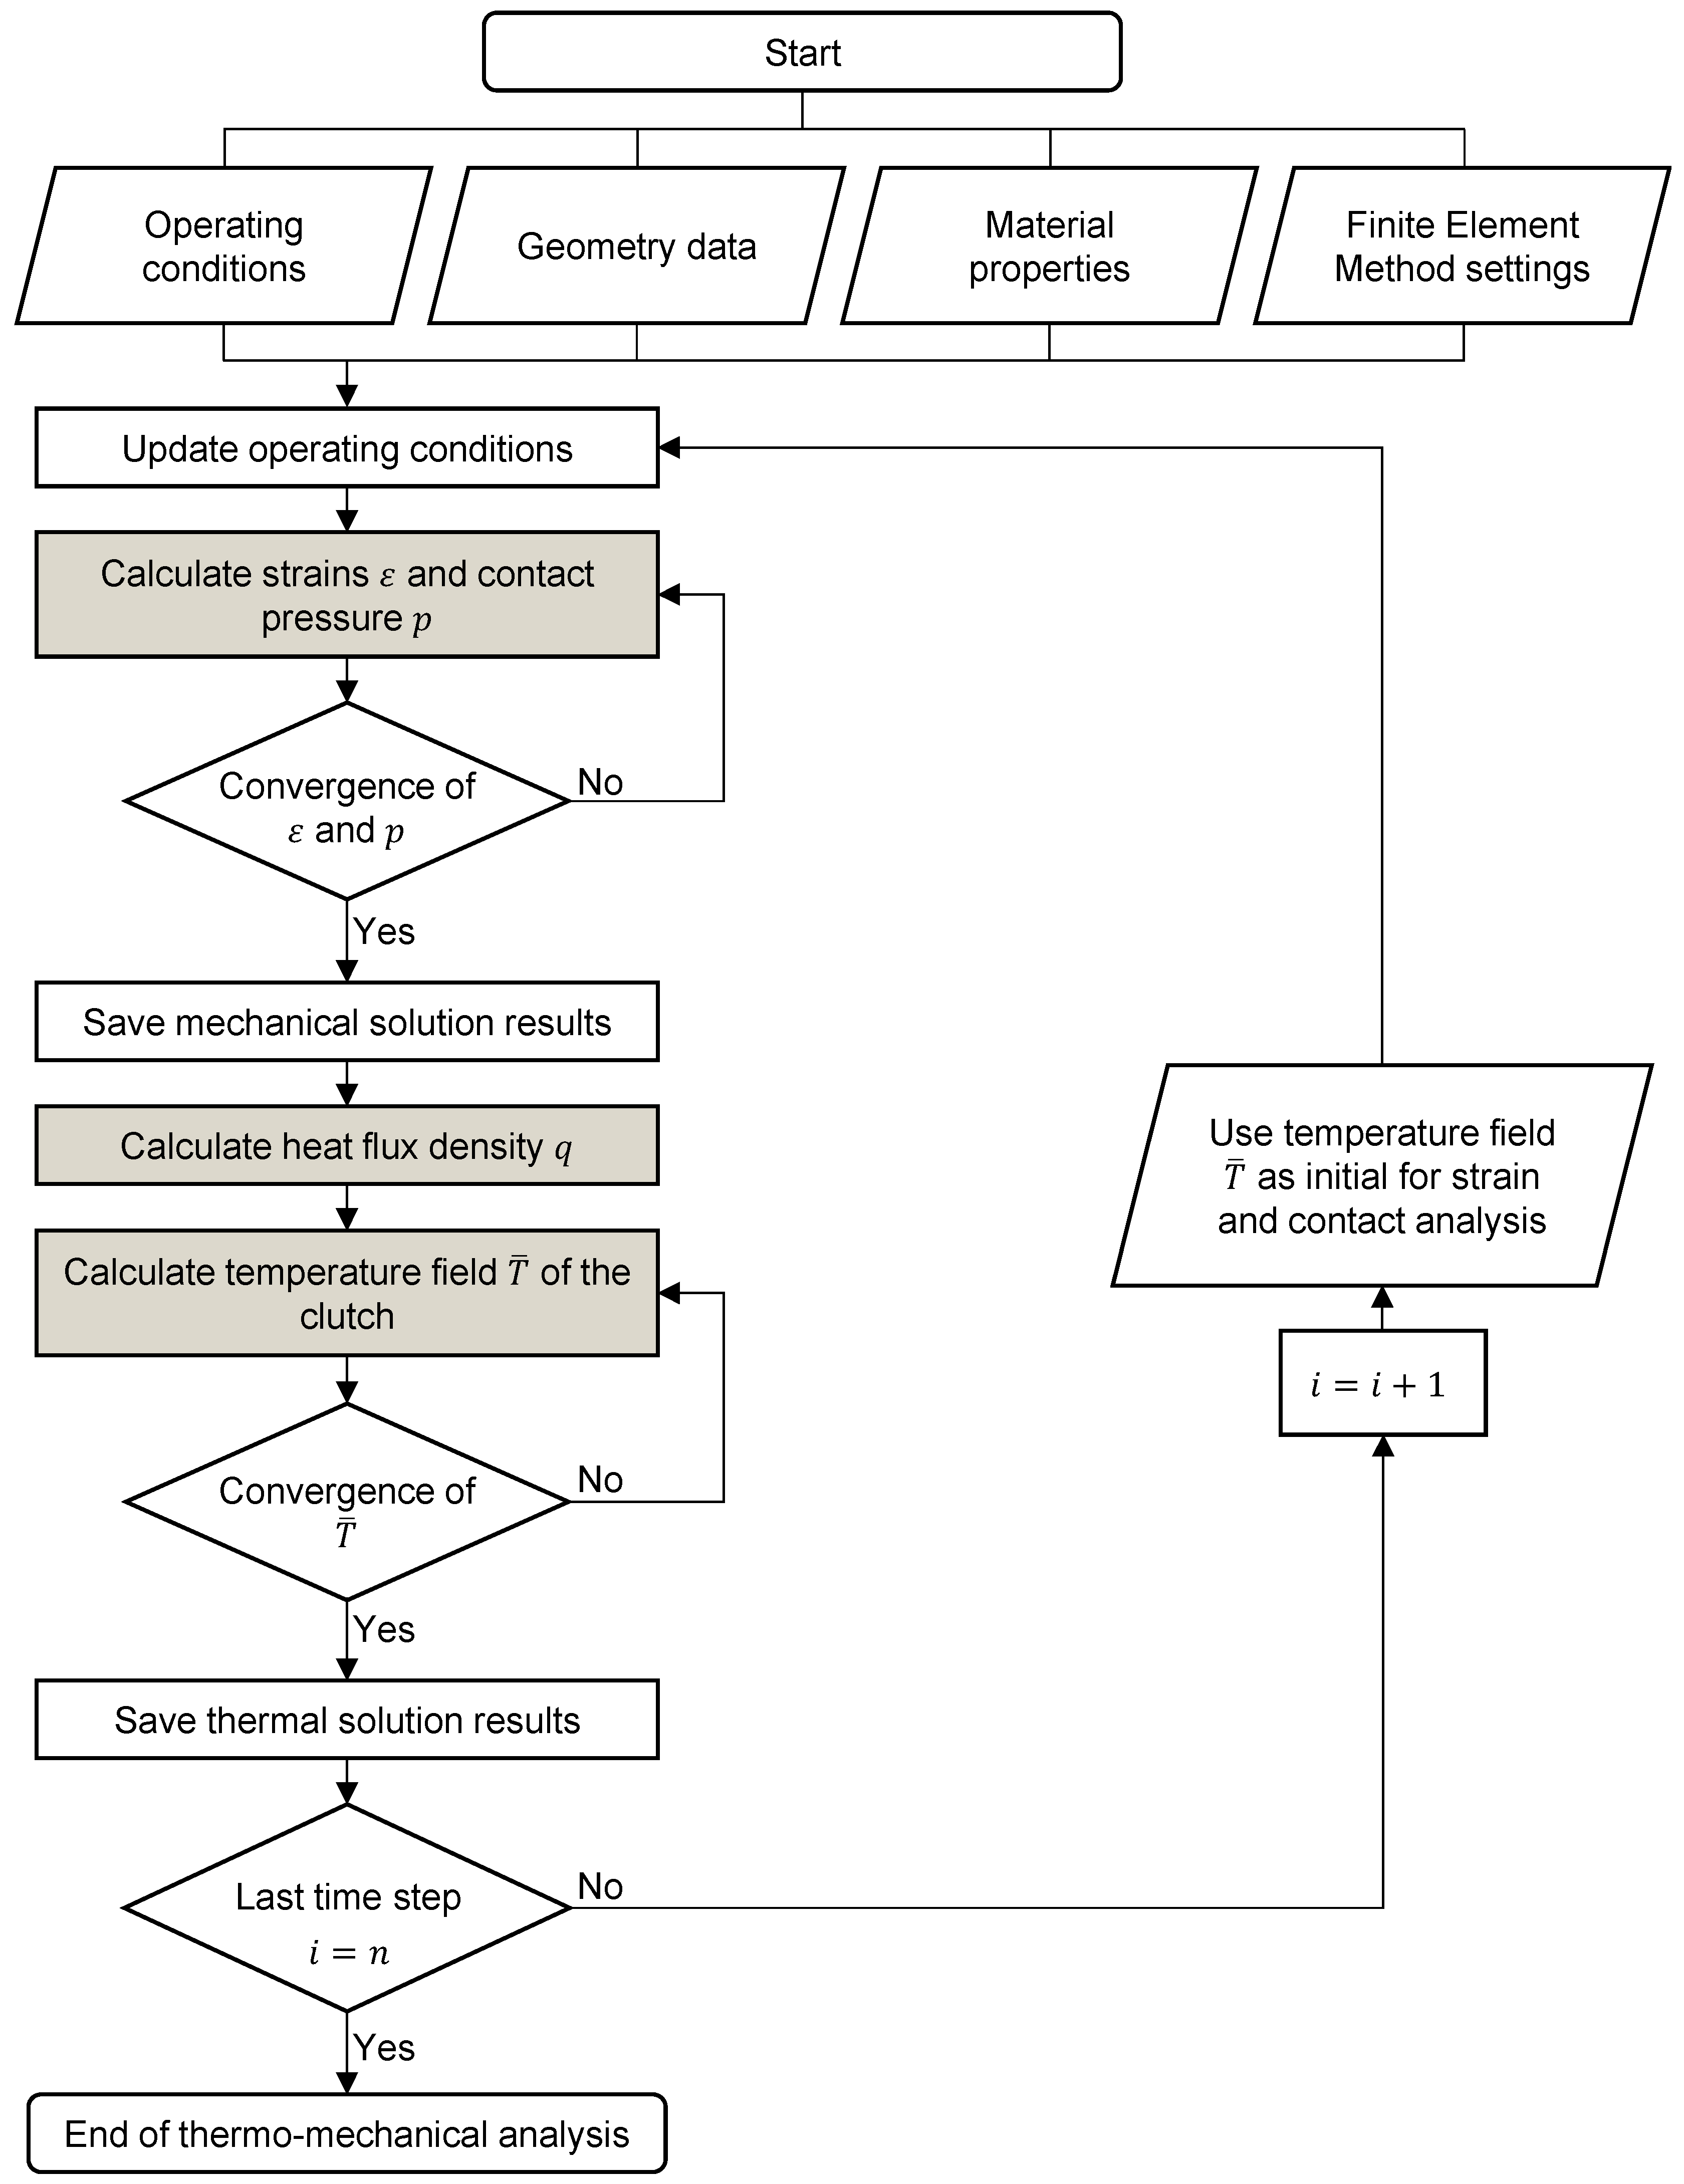
3.5. Simulation Process
The previous sections presented the operating conditions, geometric conditions, material parameters, and simulation settings (element selection, Neumann boundary conditions, Dirichlet boundary conditions). In
Figure 5, the simulation process is visualized again as a flow chart for better understanding. After all necessary parameters for the simulation have been defined, the mechanical calculation starts. The calculated pressures are needed for the calculation of the heat flux density. The heat flux is introduced, and the temperature field of the clutch is determined in the thermal simulation. After completing the sub-steps, a comparison (
) with the number of time steps takes place. For the following calculation step, the thermal analysis results are used as input files for the mechanical calculations.
5. Discussion
Previous studies made clear how important the temperature behavior of the clutch is for the damage behavior [
4,
5]. Simulation models for calculating the temperature distribution for single-disc brakes (Tirovic [
9]) and multi-disc brakes (Wang [
20]) were presented. However, on the one hand, these studies dealt with emergency braking and generally considered only the thermal and not the thermo-mechanical behavior of the clutch or brake. This study presented a thermo-mechanical FE simulation model for multi-disc clutches’ transient slip operating mode.
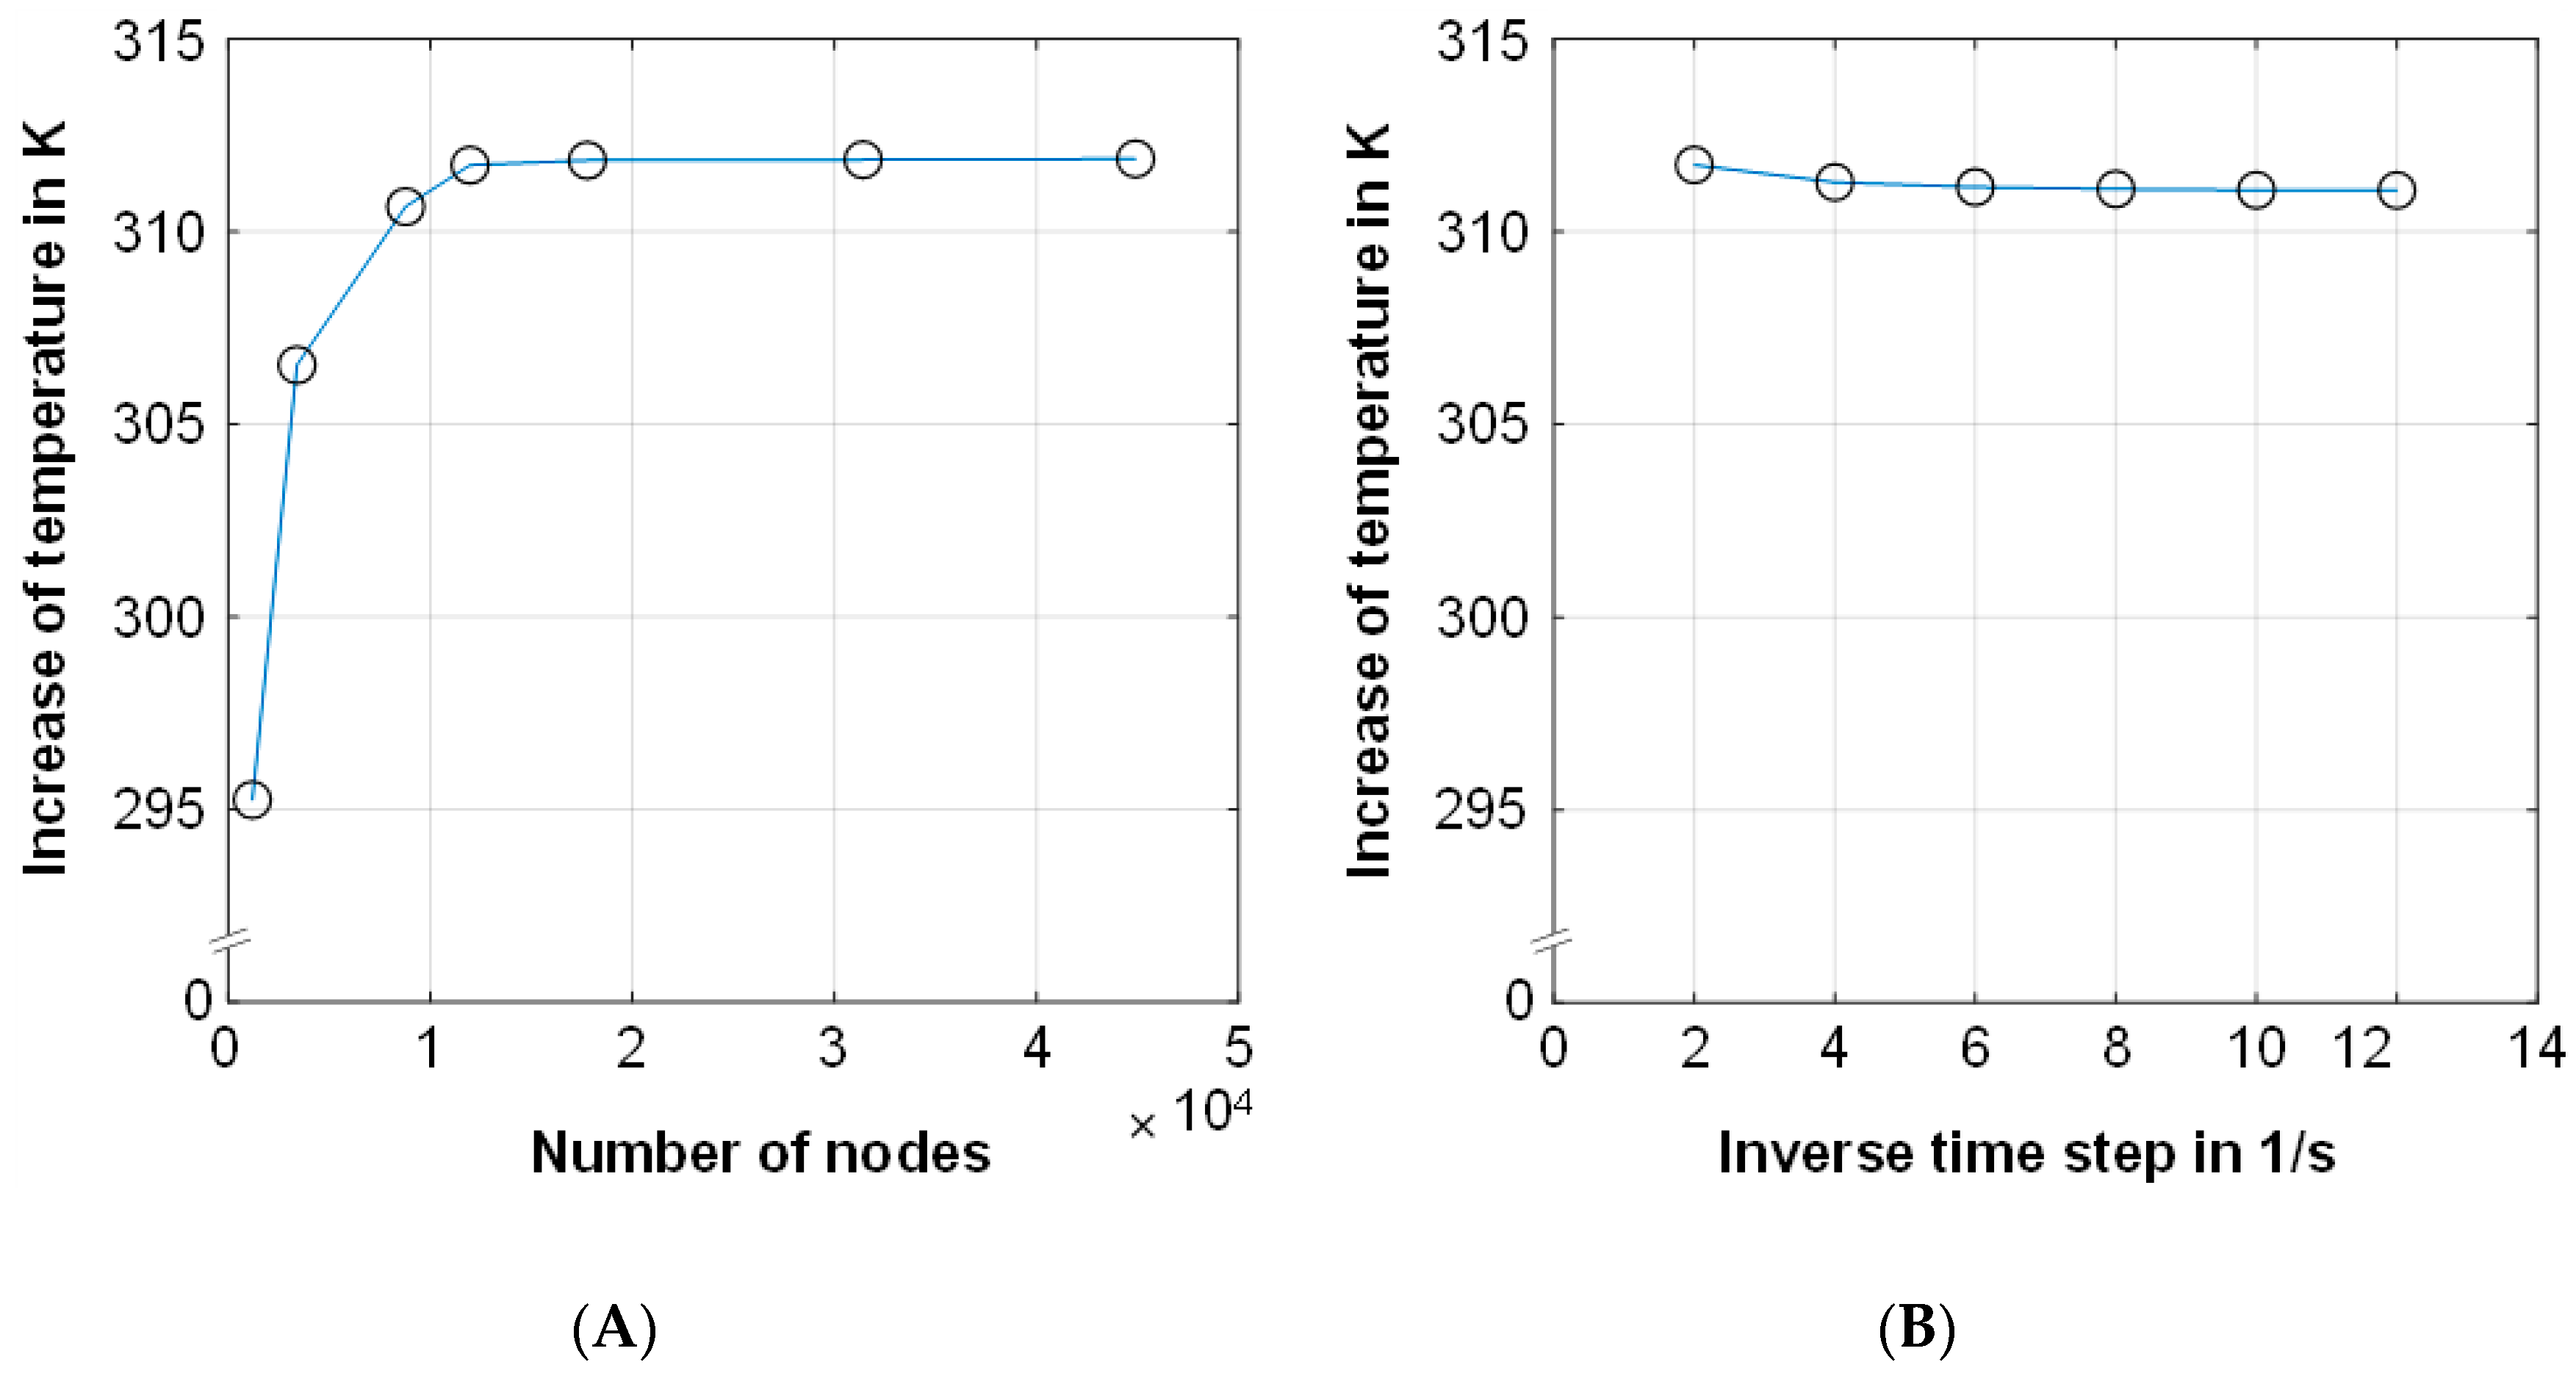
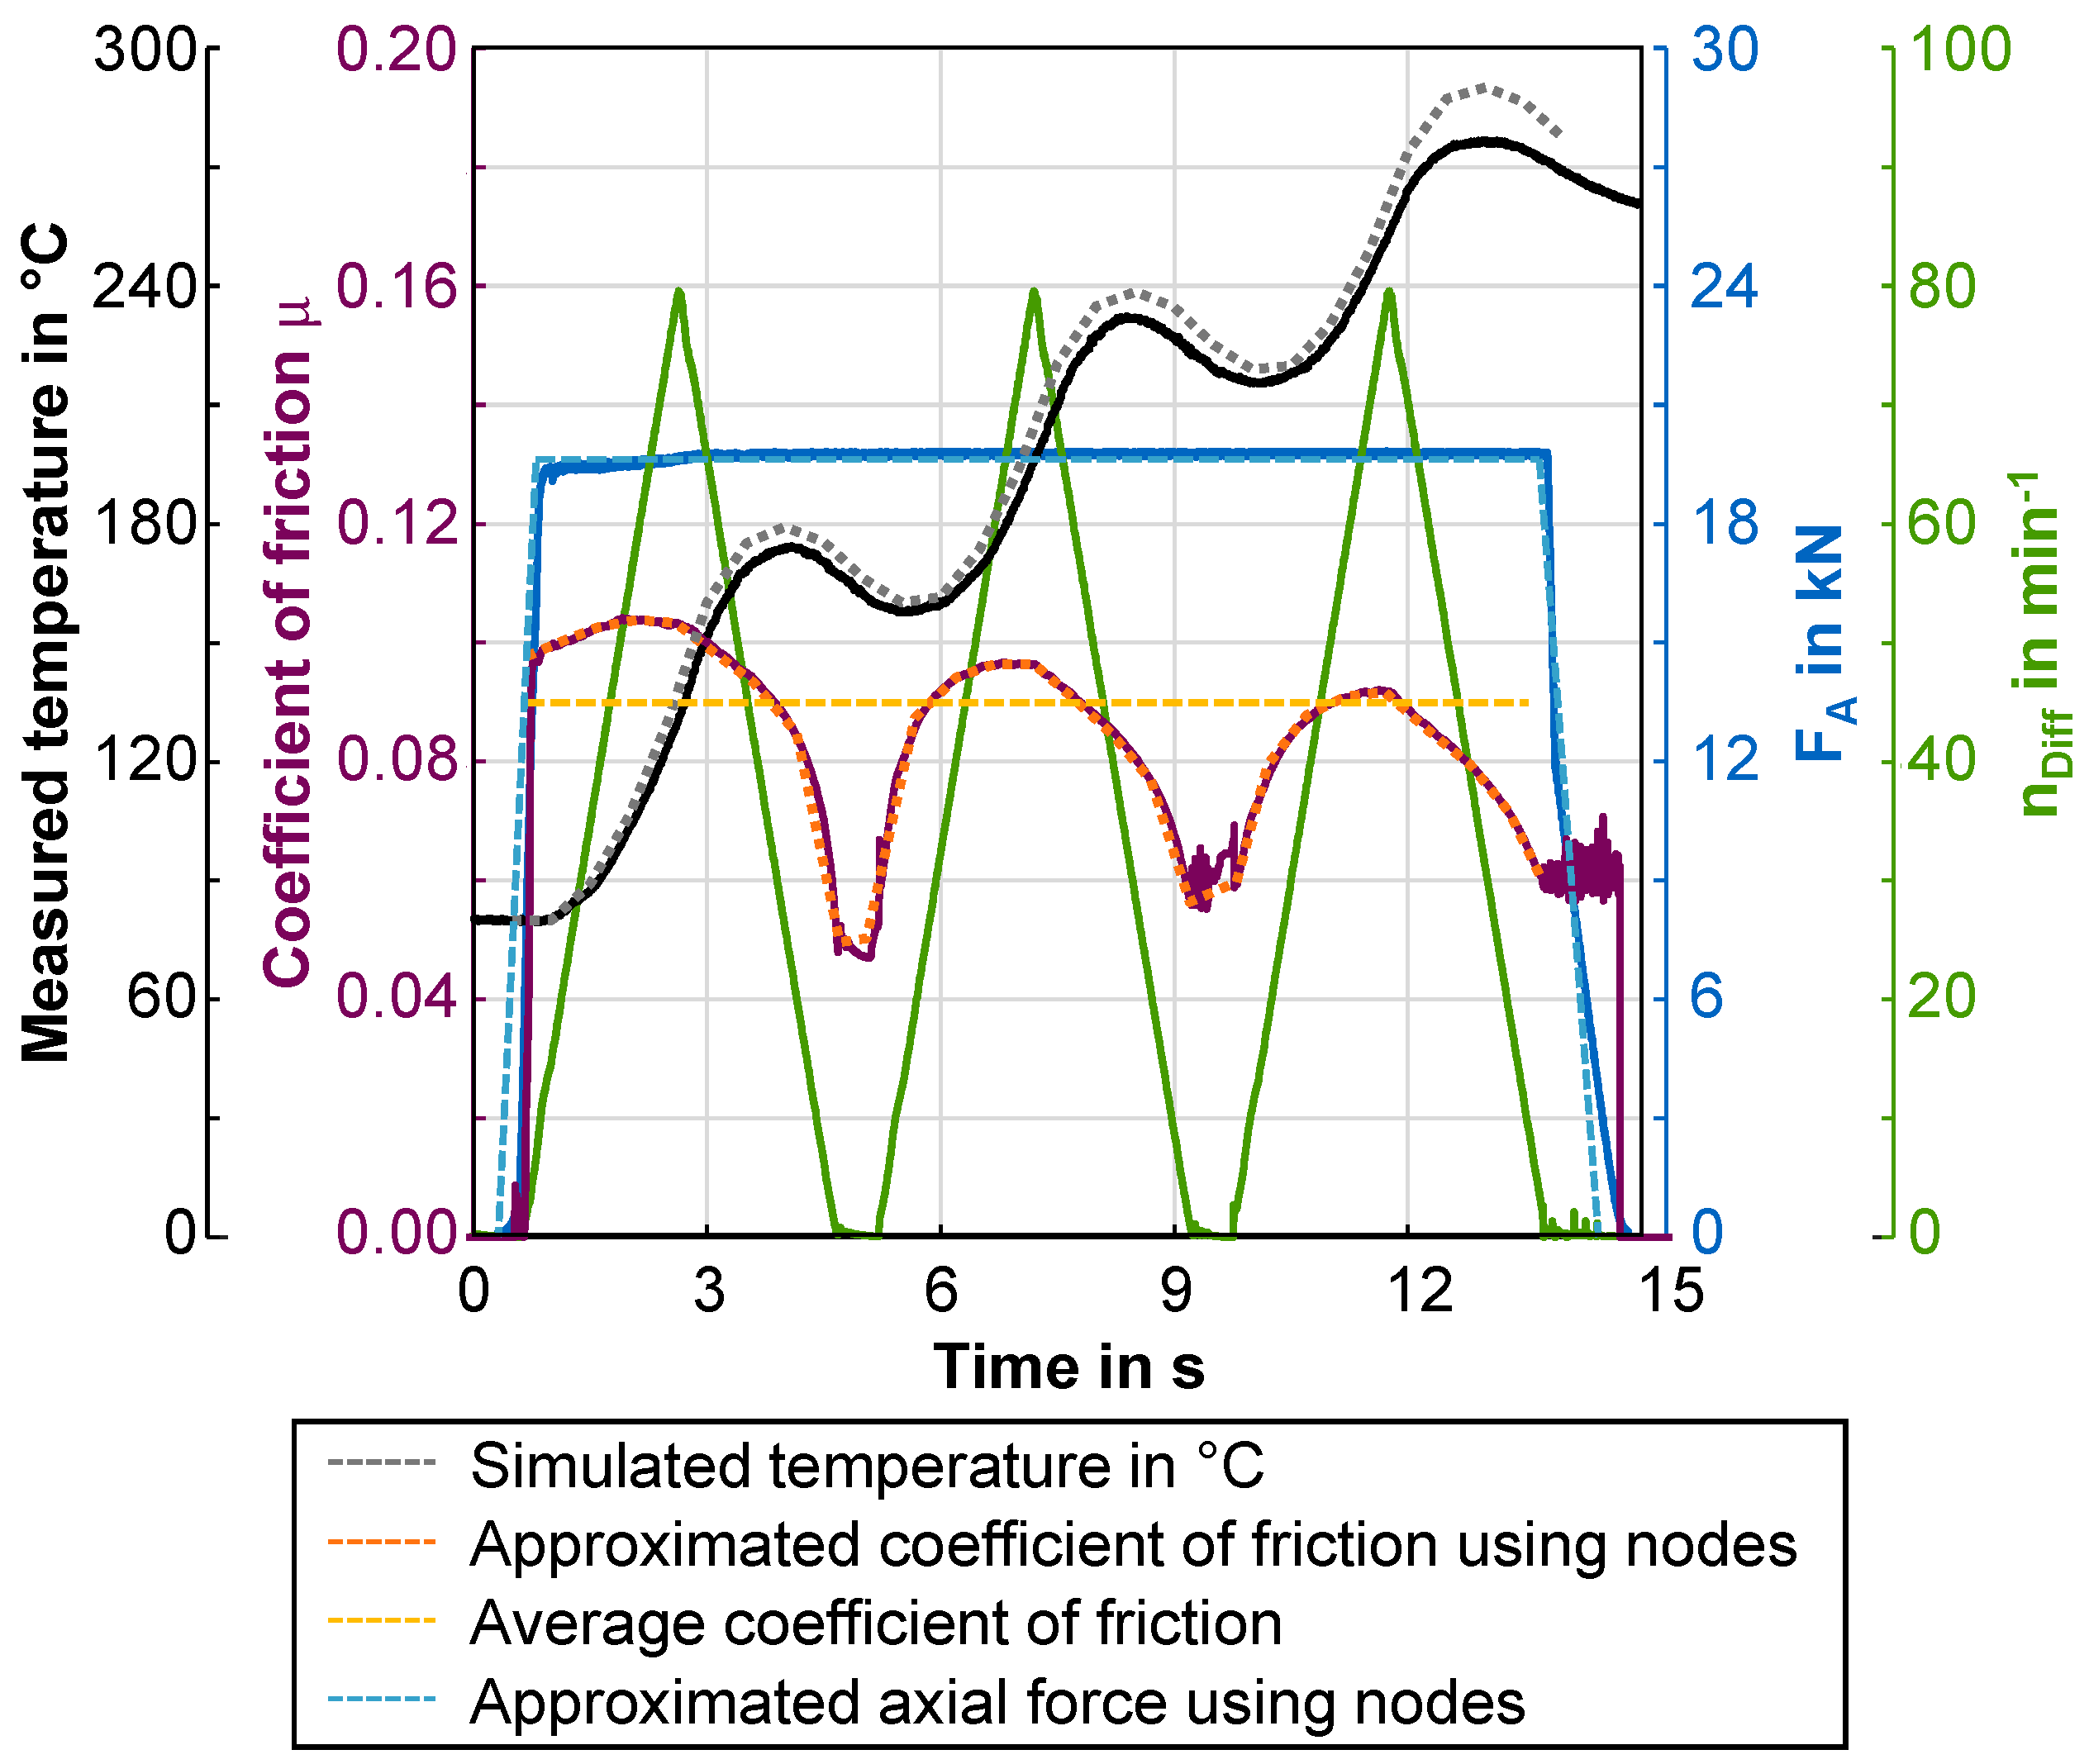
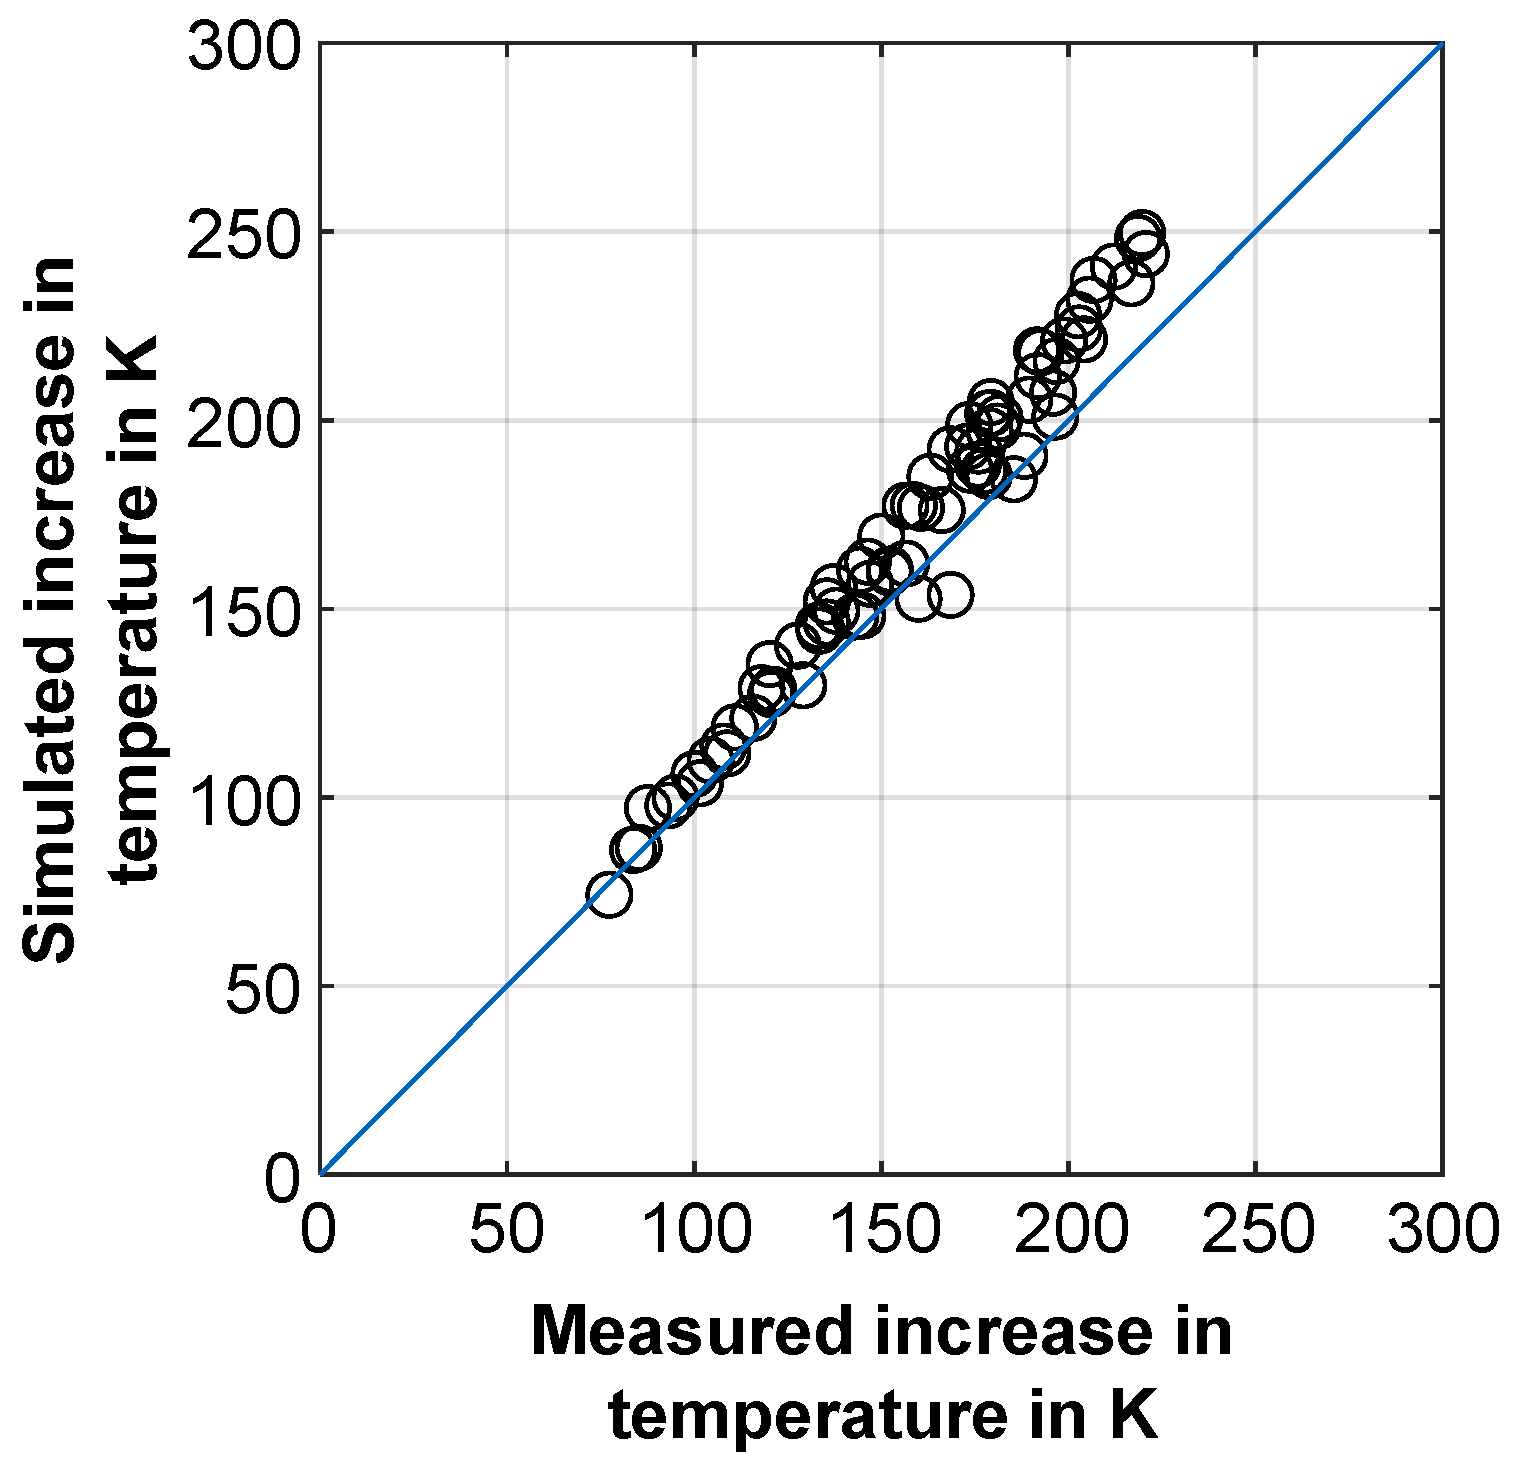
First, a mesh and time-step sensitivity analysis were performed, showing good convergence. These convergence studies ensure that the simulation results were independent of the numerical parameters. A comparison of the simulation results with experimental measurements followed. First, a single slip cycle was simulated very accurately by passing the coefficient of friction over many reference nodes as an input parameter to the simulation. It was found that the simulated temperature tends to be higher than the measured one. In addition, the temperature rise in the simulation is steeper than in the experiment. These observations have also been described many times in the literature [
28,
31]. The reasons for this deviation are poor contact between the sensor and the component despite the use of thermal paste, a manufacturing deviation of the bores for the thermocouple, inaccurate material parameters, and thermo-mechanical deformation of the bore. Subsequently, many different slip cycles were recalculated and compared with the measured data. For each slip cycle, the respective mean value of the measured coefficient of friction was used as an input parameter for the simulation model. Simulated and measured temperatures matched very well. The simulated temperature values are higher than the measured ones at higher temperature levels. In the simulation model, temperature-independent material parameters were used. The difference between simulated and measured values can be explained by temperature-dependent material properties of the steel and friction lining material. The temperature and pressure distributions presented in
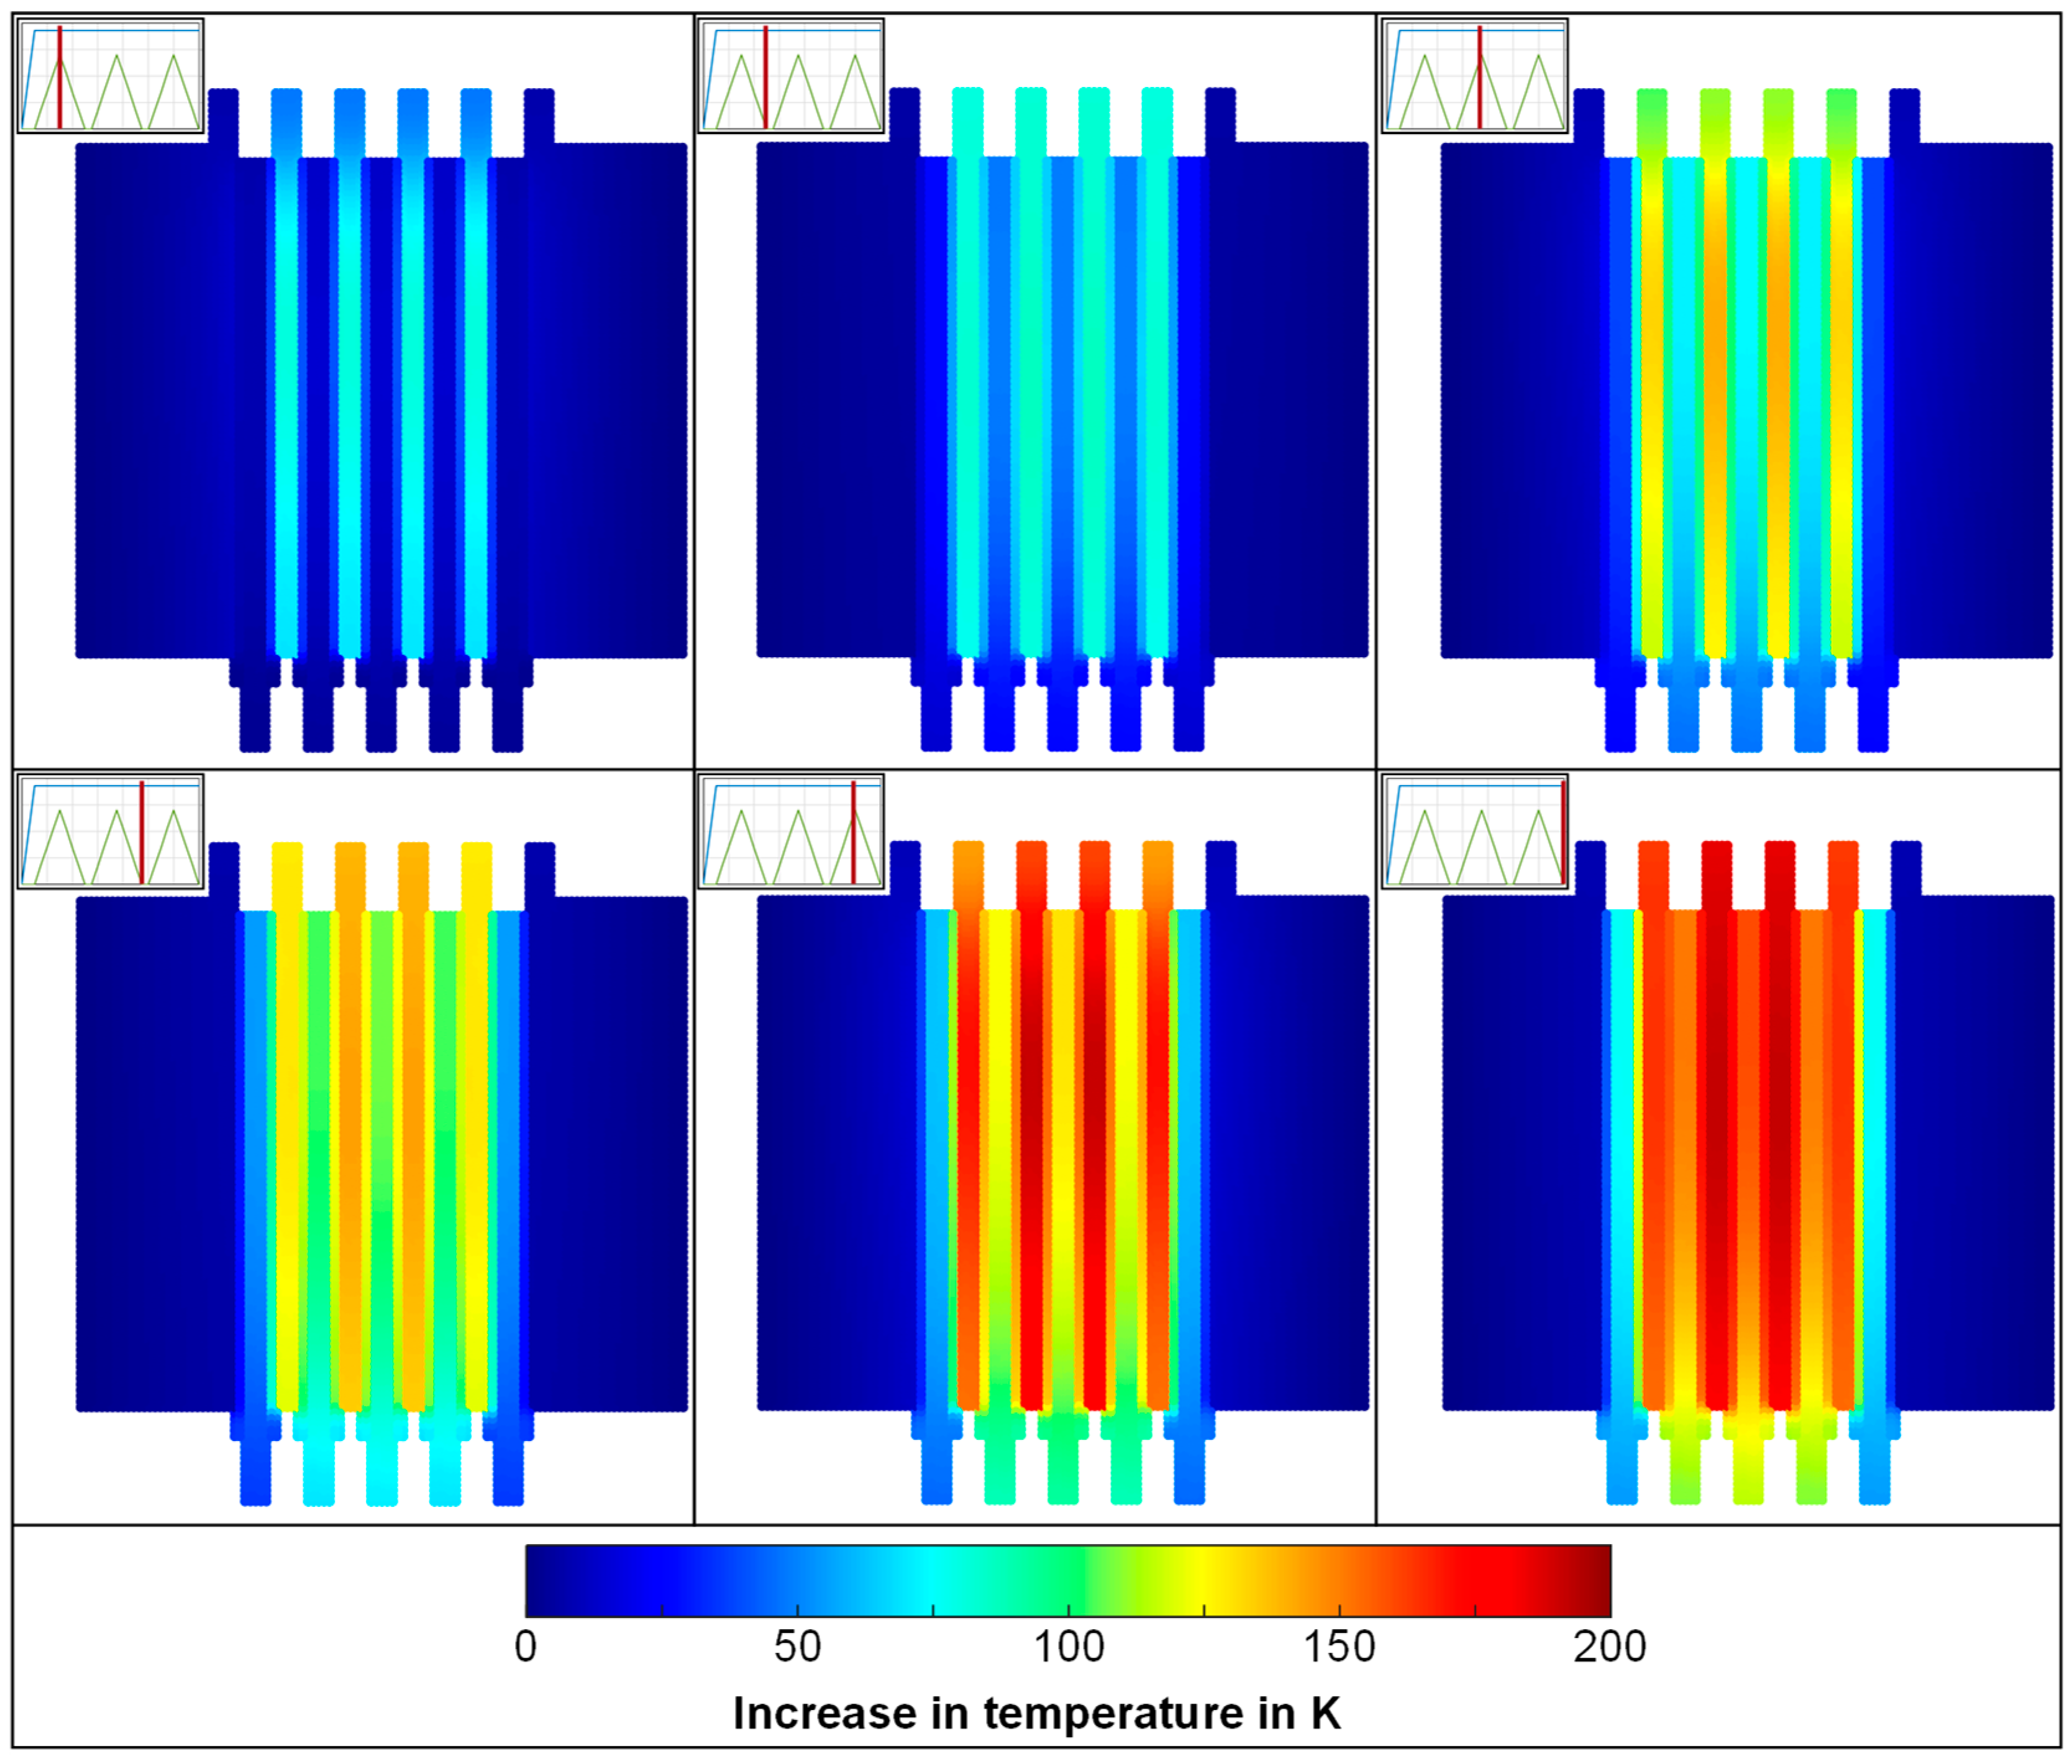
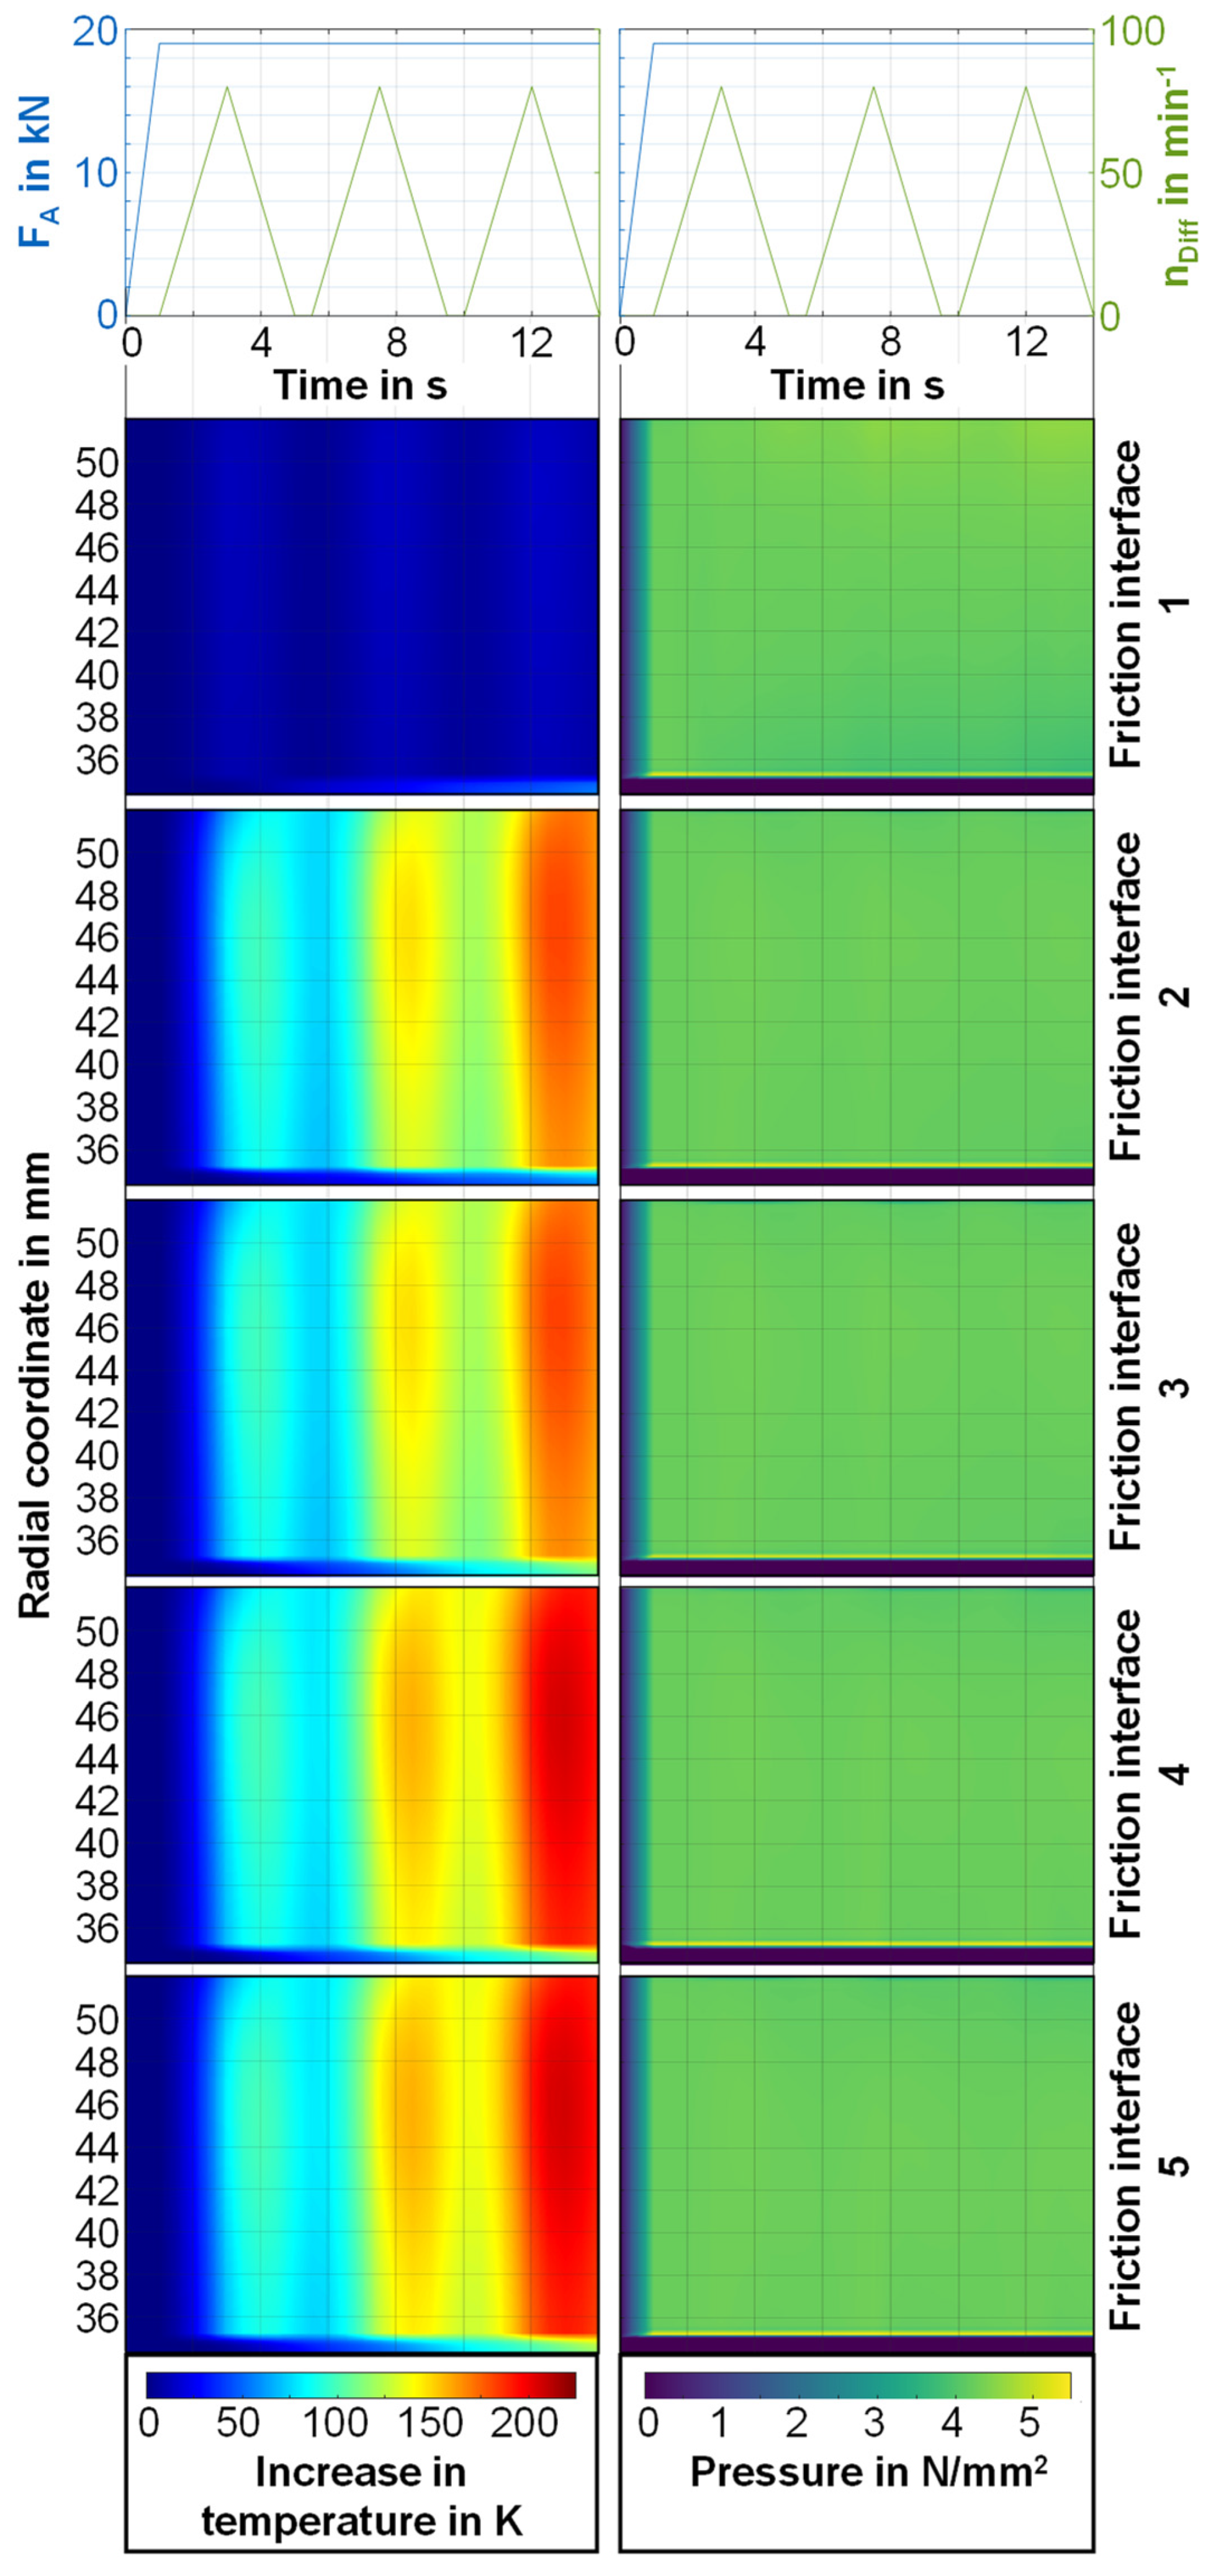
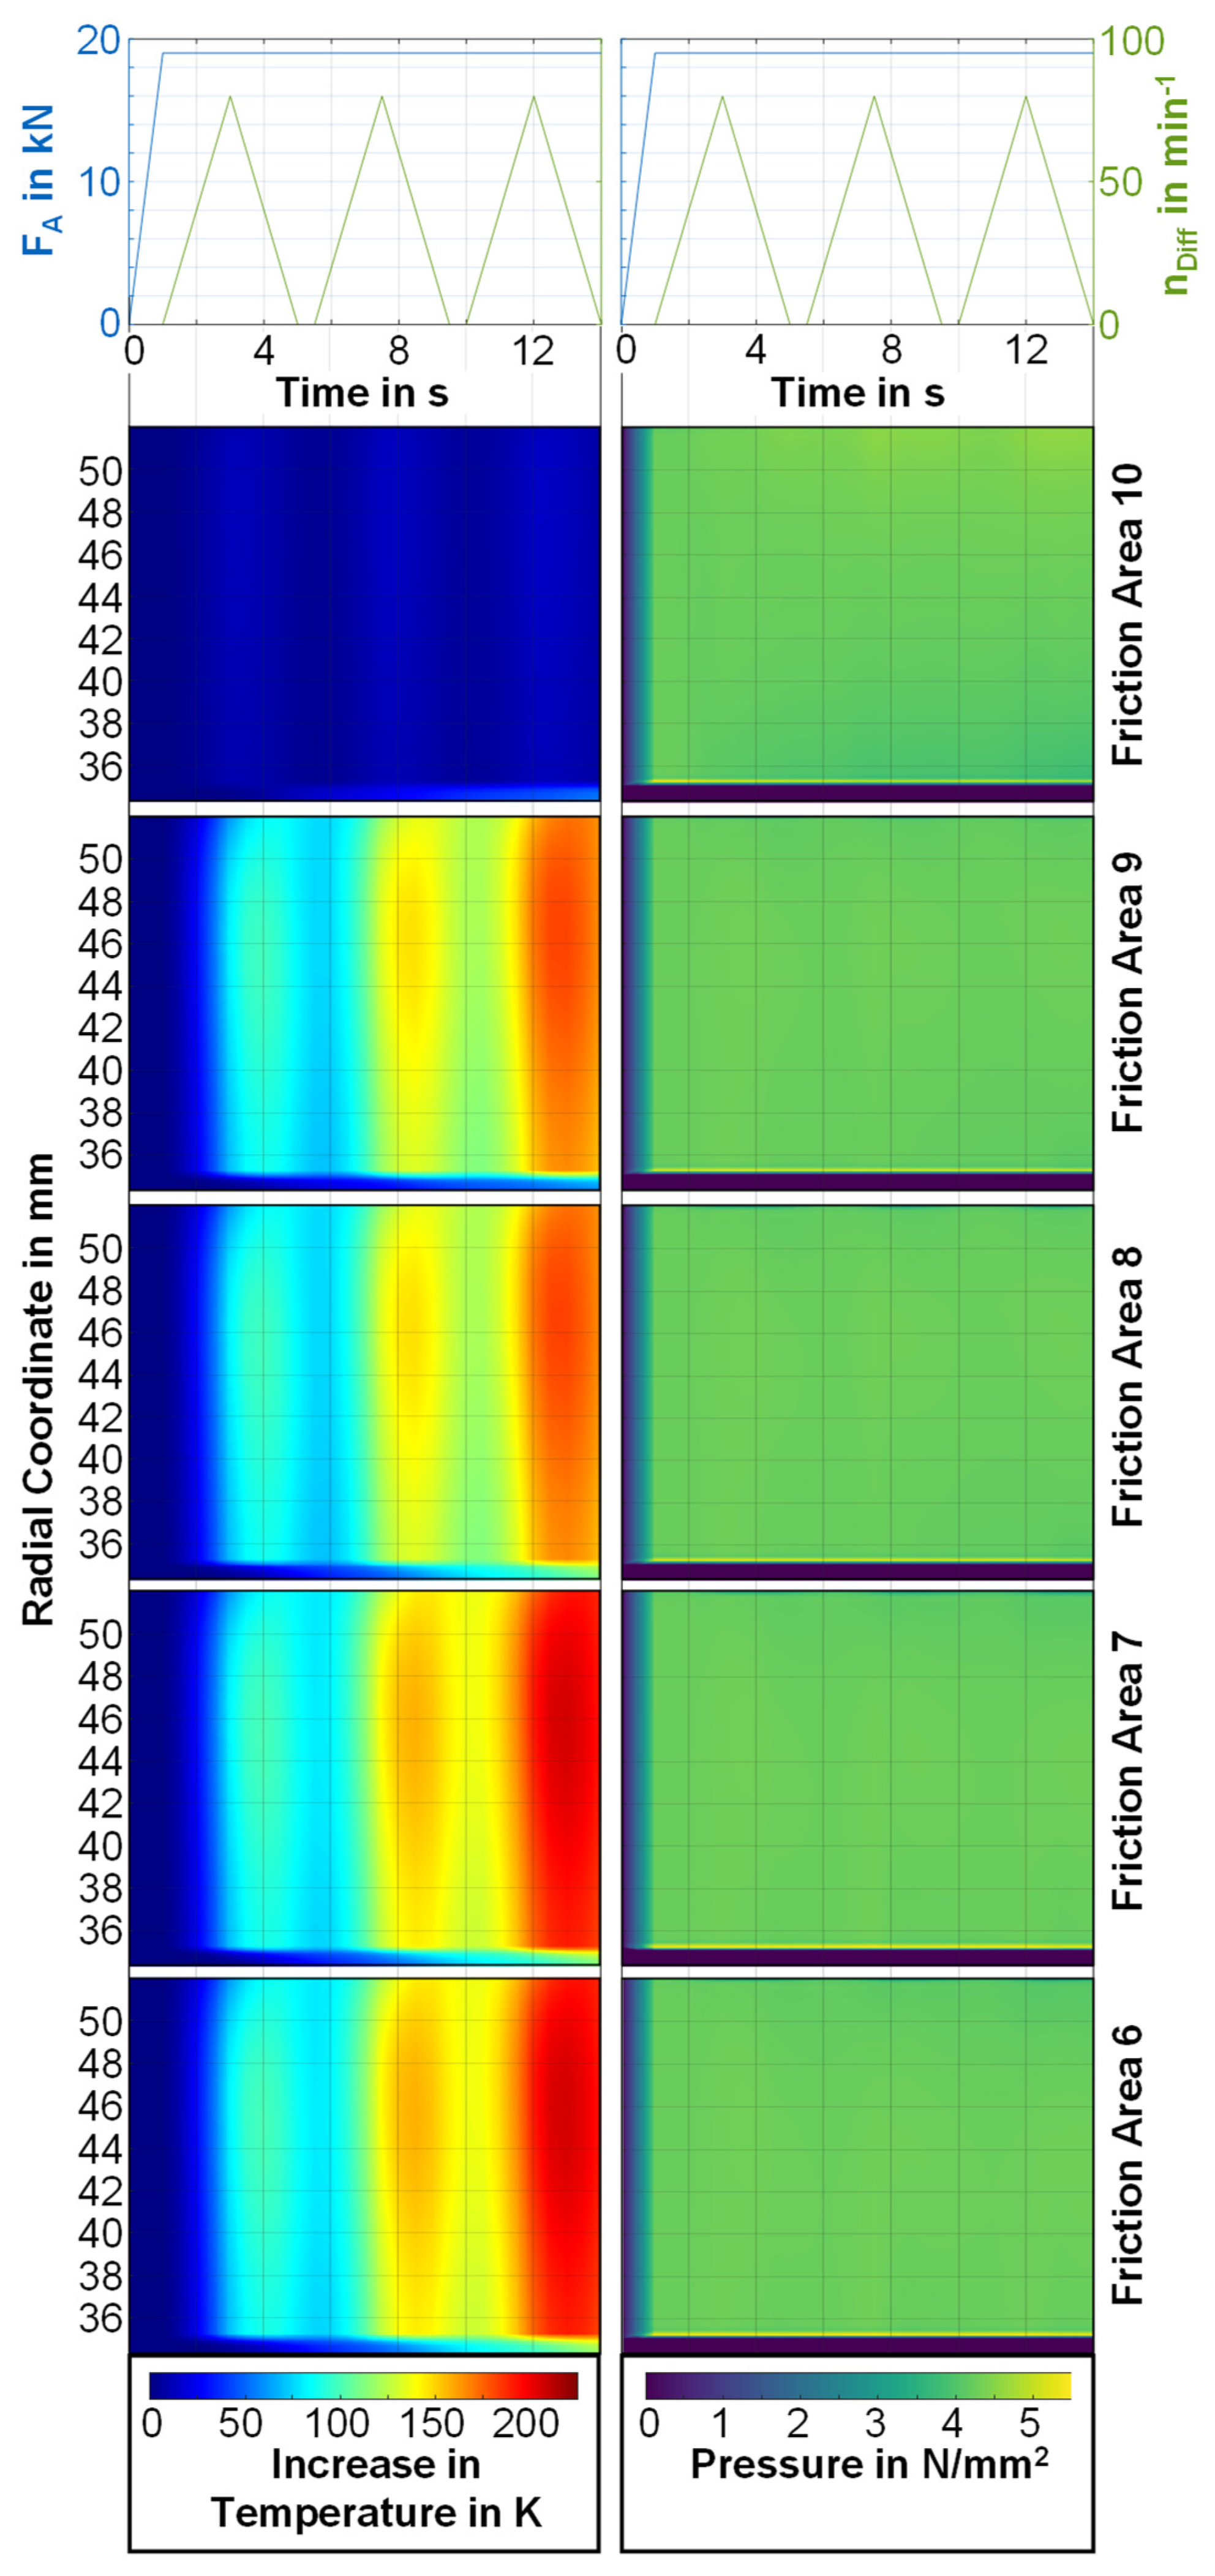
Section 4.3 showed that the clutch heats up most in the axial center. Consideration of thermal conduction to the mounting parts such as the pressure and reaction plate is responsible for cooling the outer plates. The mounting parts have a very large thermal mass and heat up only slightly compared to the plates. Heat exchange occurs with the outer and inner carriers in the radial direction. Hence, the inner and outer diameters of the plates heat up slightly. In addition, it must be taken into account that the thermal mass of the teeth for 2D modeling was added evenly to the outer and inner diameters. The thermal mass of steel plates and lining plates in the simulation model thus corresponds to the thermal mass of the physical components. The results showed higher temperature gradients in the parts in the area of the speed peaks than between the breaks and at low speeds. The high frictional power (see Equation (1)) results in intense heating of the friction interfaces. In the case of low frictional power, temperature equalization occurs due to thermal conduction (see Equation (6)). The thermal conduction between the individual plates is limited by the low thermal conductivity of the friction linings. In the temperature plots of the individual friction surfaces over time (see
Figure 11), the results of the overall plot of the clutch (see
Figure 10) are confirmed. The temperature maximum for each slip phase is reached slightly after the speed maximum. Subsequently, there is a decrease in temperature on the friction surface since thermal conduction (see Equation (6)) outweighs the heat input (see Equation (1)). The pressure distribution is very homogeneous over time for all friction surfaces. Previous studies from the literature showed significant pressure differences in the friction surface radius during the shifting [
10,
20]. The differences can be explained by a lower friction power compared to emergency brakes. Due to the very high sliding speeds (see Equation (1)), the frictional power is high during emergency braking, and thermal conduction takes a subordinate role. The high friction power results in high temperature differences and associated pressure differences that occur through the thermal expansion of the individual materials.
With the simulation model presented, parameter studies can now be carried out and the influence of individual geometry and material parameters on the thermal behavior of the clutch can be evaluated. The following material and geometry parameters are varied in a parameter study and the values are listed in
Table 5:
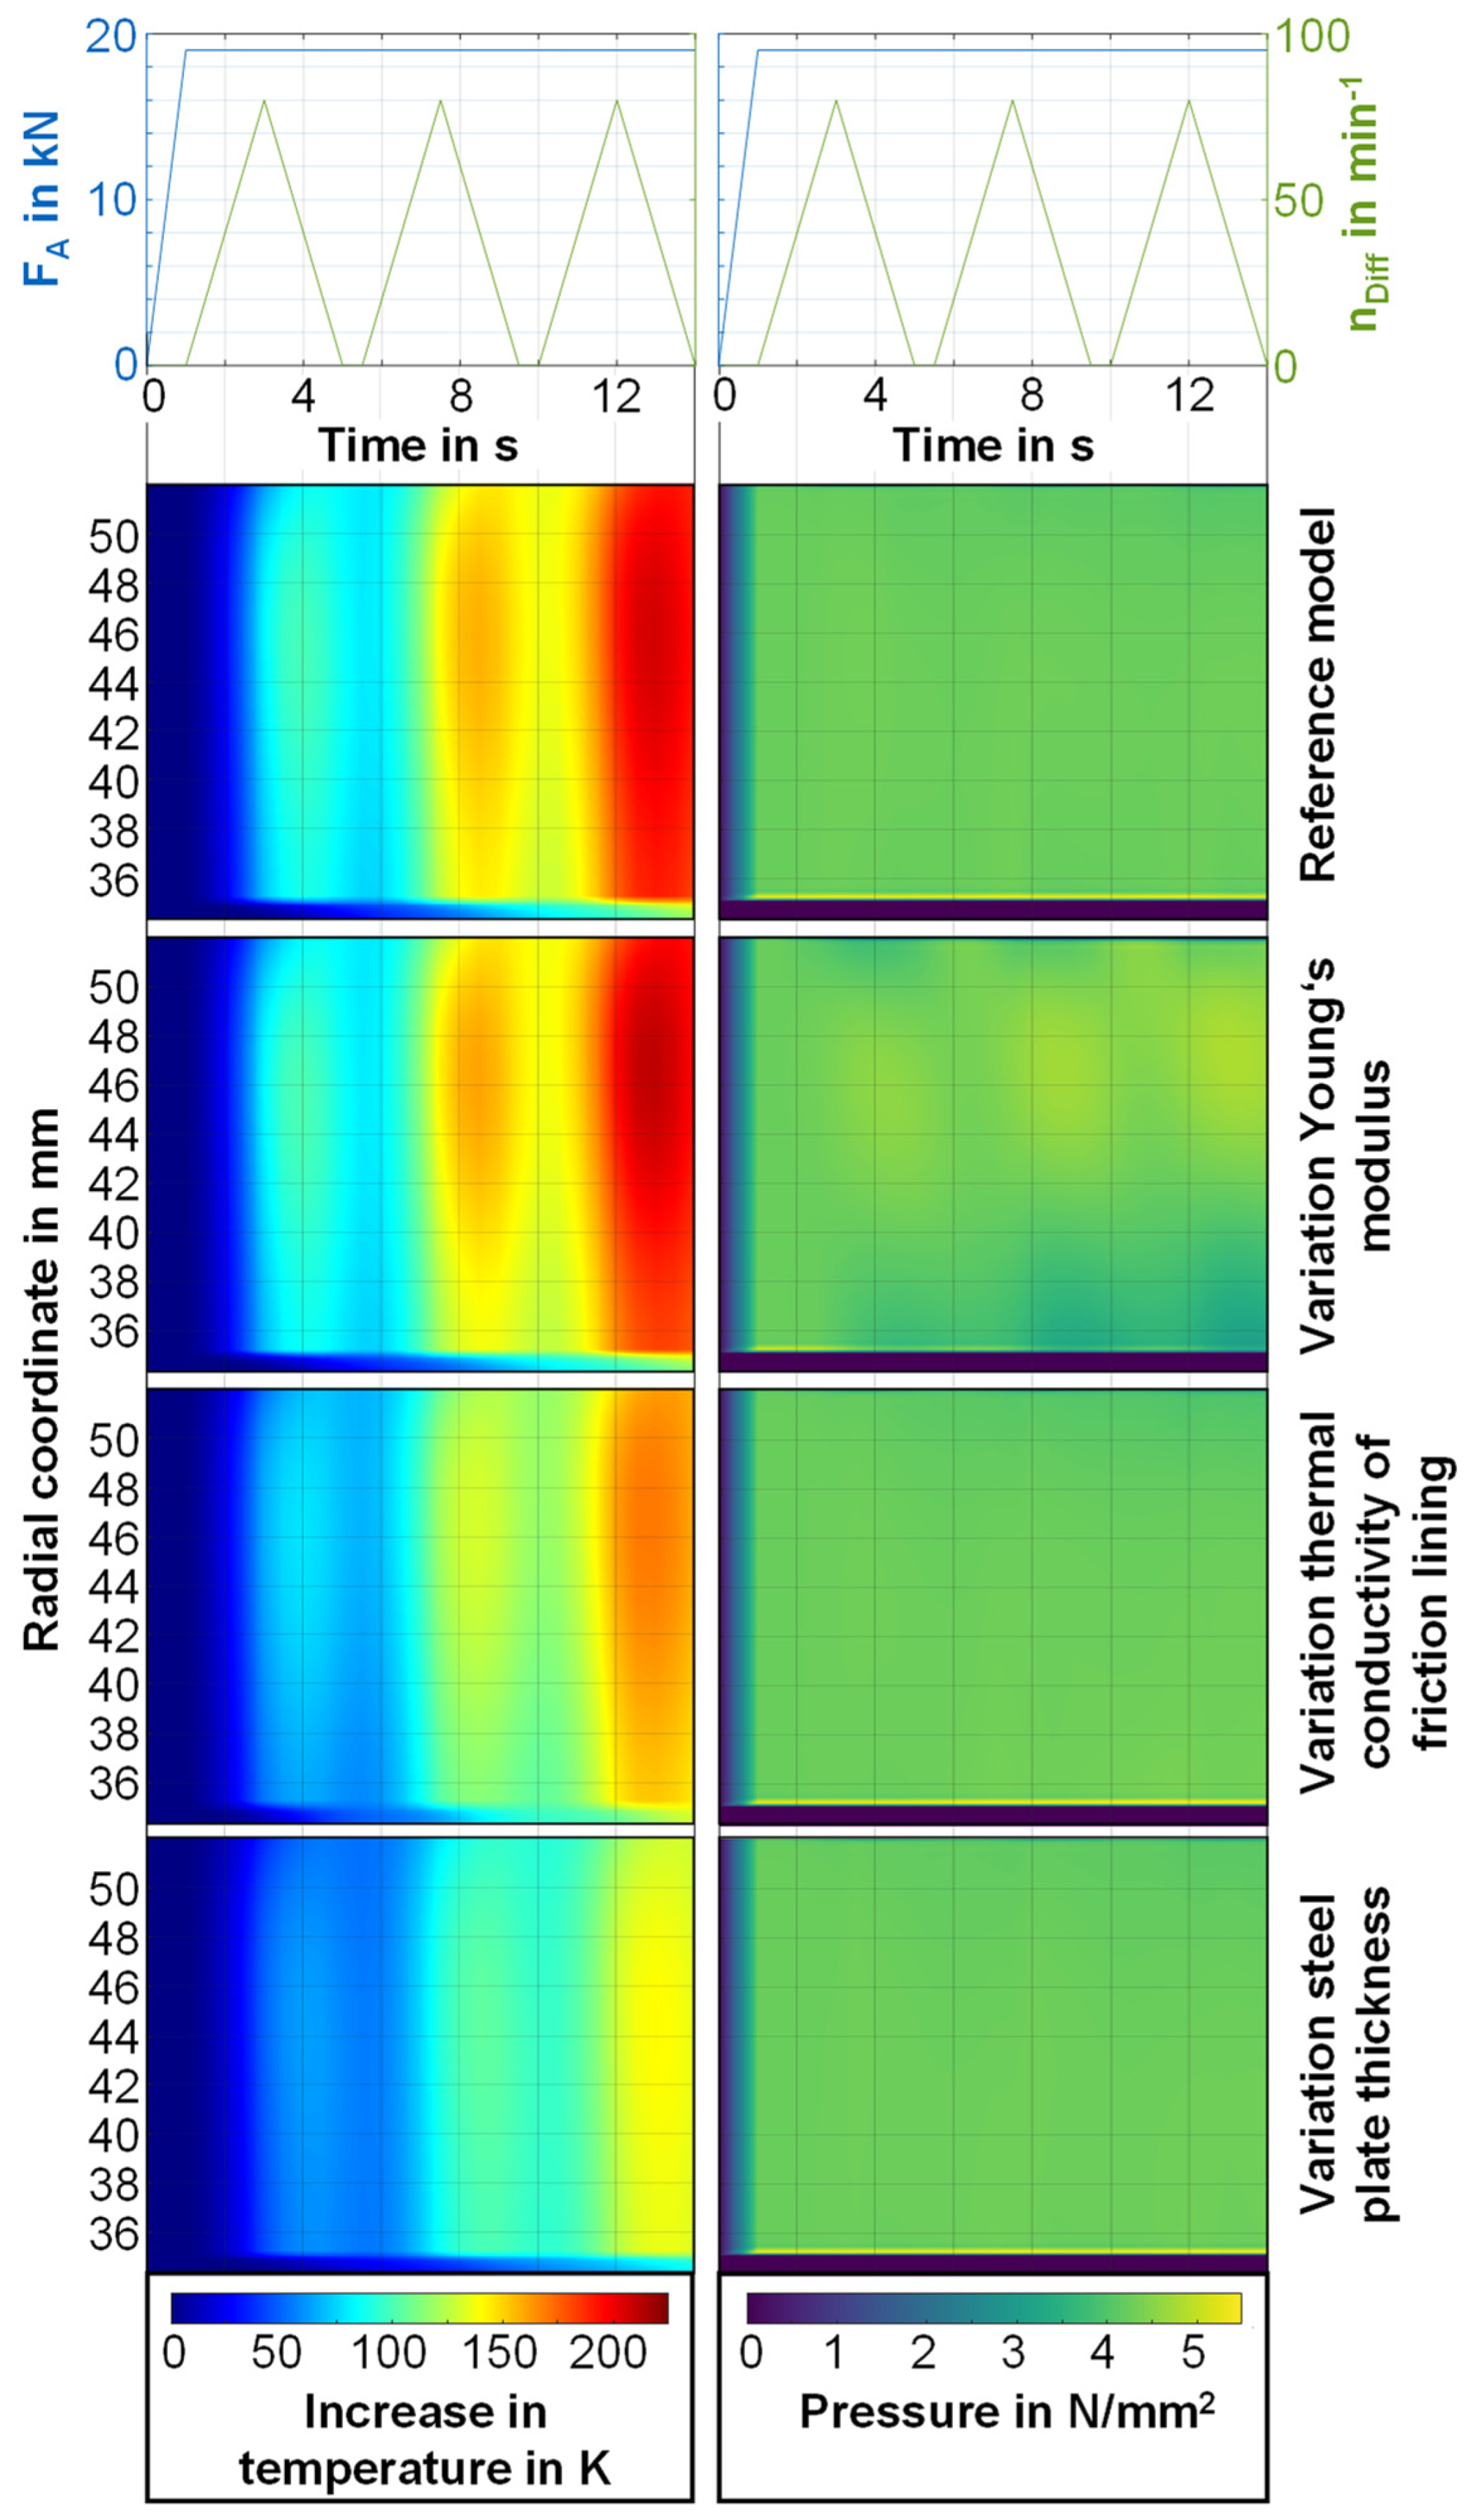
According to
Figure 10 and
Figure 11, the highest temperature of the clutch during a slip cycle is observed in the center. Therefore,
Figure 12 compares the temperature and pressure distribution for the friction interface 5 for the parameter variation. The increase in Young’s modulus by a factor of 10 results in more uneven pressure distribution and a slightly higher temperature. In the radial direction, the pressure increases in the area by around approximately 46 mm and thus rather at the outer diameter. At the same time, the pressure decreases at the inner diameter. The pressure inhomogeneity increases from slip phase to slip phase. The maximum pressure for each slip phase is reached after the respective maximum differential speed. Between the individual slip phases, i.e., during the pauses, the pressure inhomogeneity at the friction interfaces decreases. The temperature behavior corresponds to that of the reference model. The temperatures are at a slightly higher level. A direct correlation between temperature and pressure distribution is shown. In the area of high temperature differences, pressure differences can also be seen. The higher Young’s modulus of the friction lining means that micro geometric differences due to the thermal expansion of the materials are less compensated. The increased pressures simultaneously lead to higher heat flux density (see Equation (1)). Thus, the slightly higher temperatures on the friction interface can be explained. Sabri [
32] describes the influence on temperature and pressure behavior during load shifting of a dry single-disc clutch. The main result is that the contact pressure decreases with a reduction of Young’s modulus of the friction linings. Furthermore, Abdulla [
19] shows that the pressure homogeneity increases as the friction lining thickness increases. The results of this study confirm literature findings and extend them for multi-disc clutches under transient slip conditions. It was shown that Young’s modulus influences pressure behavior even at lower frictional power levels. However, the temperature differences resulting from the variation of Young’s modulus are evaluated as small due to the low frictional power (see Equation (1)).
As the next variation parameter, the thermal conductivity of the friction lining was tripled. In terms of pressure distribution, no differences are apparent compared to the reference model. The temperatures, in turn, are at a lower level and differ by up to 36 K in the temperature maximum. Due to the thermal conductivity of the lining, more heat conduction takes place in the axial direction between the individual plates and the mounting parts. Hence, the mounting parts have a more substantial cooling effect and at the same time, more heat energy is absorbed by the carrier plates of the friction plates compared to the reference model. Similarly, Zhao [
15] showed an influence of the thermal conductivity of the friction lining on the maximum temperature of a multi-plate clutch during load shifting in a simulation model without heat conduction to mounting parts.
As the last parameter, the thickness of the steel plate was doubled. Concerning the pressure distribution, no differences from the reference model are evident. The maximum temperature is 66 K lower than in the reference model. The temperature behavior over time is comparable to that of the reference model, except for the temperature level. These results confirm the simulative results of Zhao [
15] and Abdulla [
19], as well as the experimental results of Zagrodzki [
33], Schneider [
34] and Grötsch [
35], describing an influence of the steel plate thickness on the thermal behavior.
6. Conclusions
A parameterizable two-dimensional FE model was developed to investigate the thermo-mechanical behavior of a multi-disc clutch in transient operation. The pressure and temperature distributions on the friction interfaces were determined. Numerical verification as well as validation with experimental results are very good despite the simplifications in the model. The results show that, in the axial direction, the steel plates in the center of the clutch are heated the most. In the radial direction, the maximum temperatures tend to be at the outer diameter of the friction interface. In a parameter study, the influence of the Young’s modulus of the friction lining, the thermal conductivity of the friction lining, and the steel plate thickness on the temperature and pressure behavior in the clutch is investigated. Even though the Young’s modulus of the friction lining influences the pressure distribution in the friction contact, the temperature behavior is only slightly changed by the variation of the Young’s modulus due to the load case. The thermal conductivity of the lining and the steel plate thickness have a strong influence on the temperature level in the clutch. However, the pressure distribution is very homogeneous despite the temperature change due to variation of thermal conductivity and steel plate thickness, as in the reference model. Since wear affects the pressure behavior [
36], the coefficient of friction [
37,
38], and the tendency to thermoelastic instability [
39,
40], it should be taken into account in future investigations. Other geometric and material specifics such as carrier plate thickness, friction lining thickness, inner and outer diameters of steel and lining plate, heat capacity and density can be varied in future investigations. In addition, the influence of the load parameters (axial force, differential speed) on the temperature and pressure behavior is of interest.


