Numerical and Experimental Analysis of Nonlinear Vibrational Response due to Pressure-Dependent Interface Stiffness


Abstract
:
1. Introduction
2. Materials and Methods
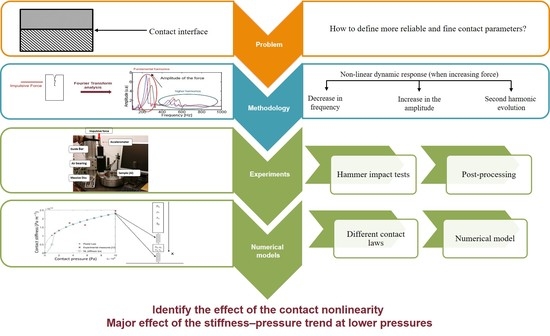
2.1. Description of the Approach
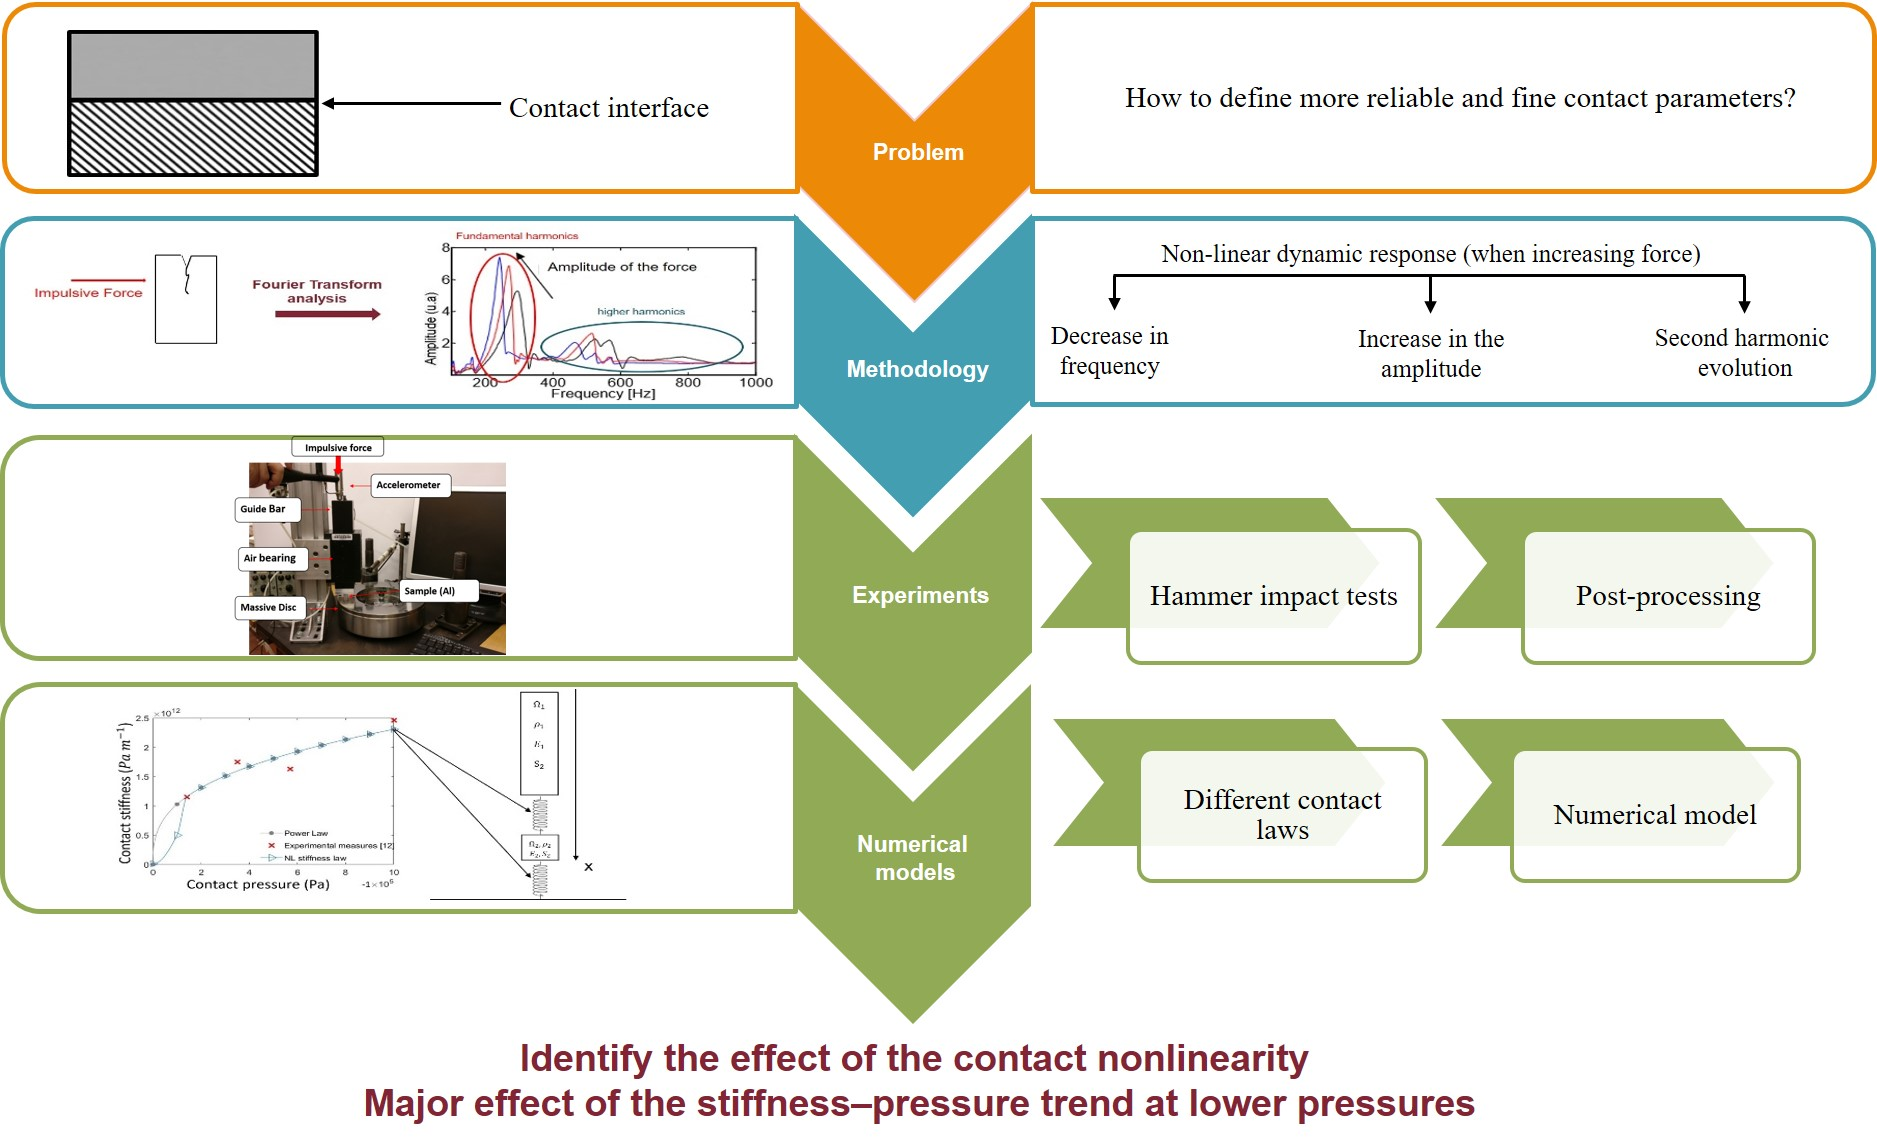
2.2. Experimental Set-up
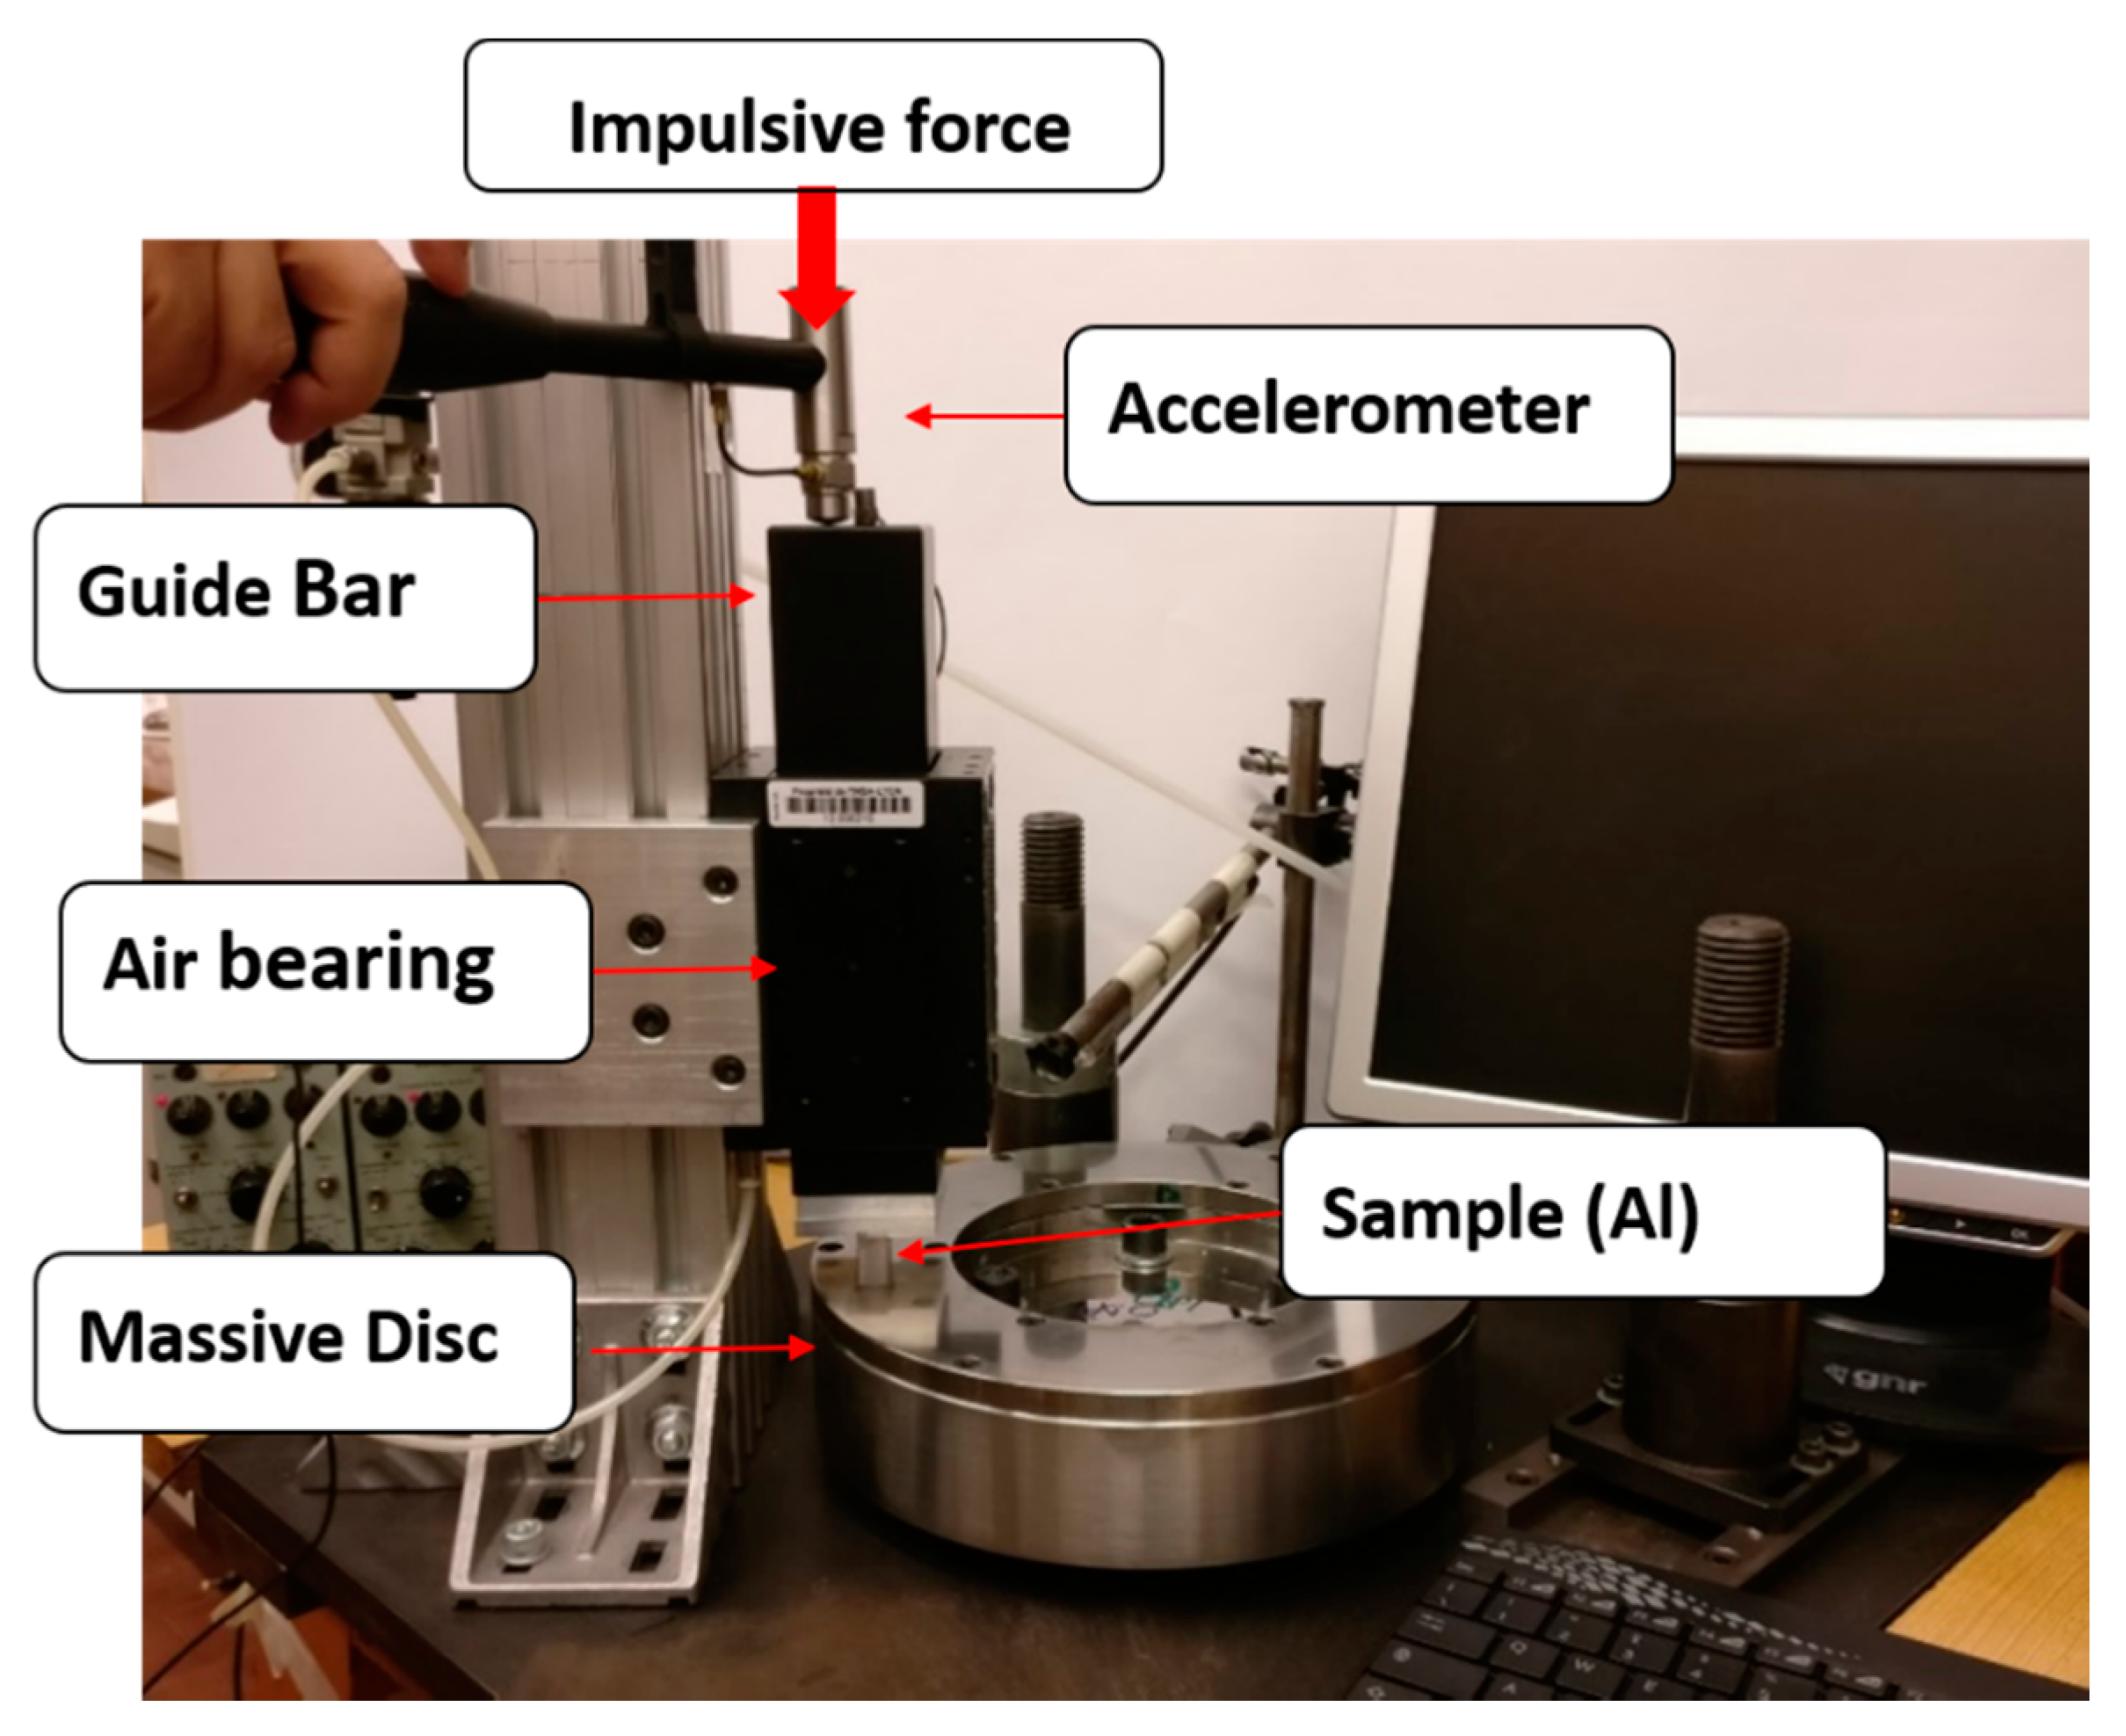
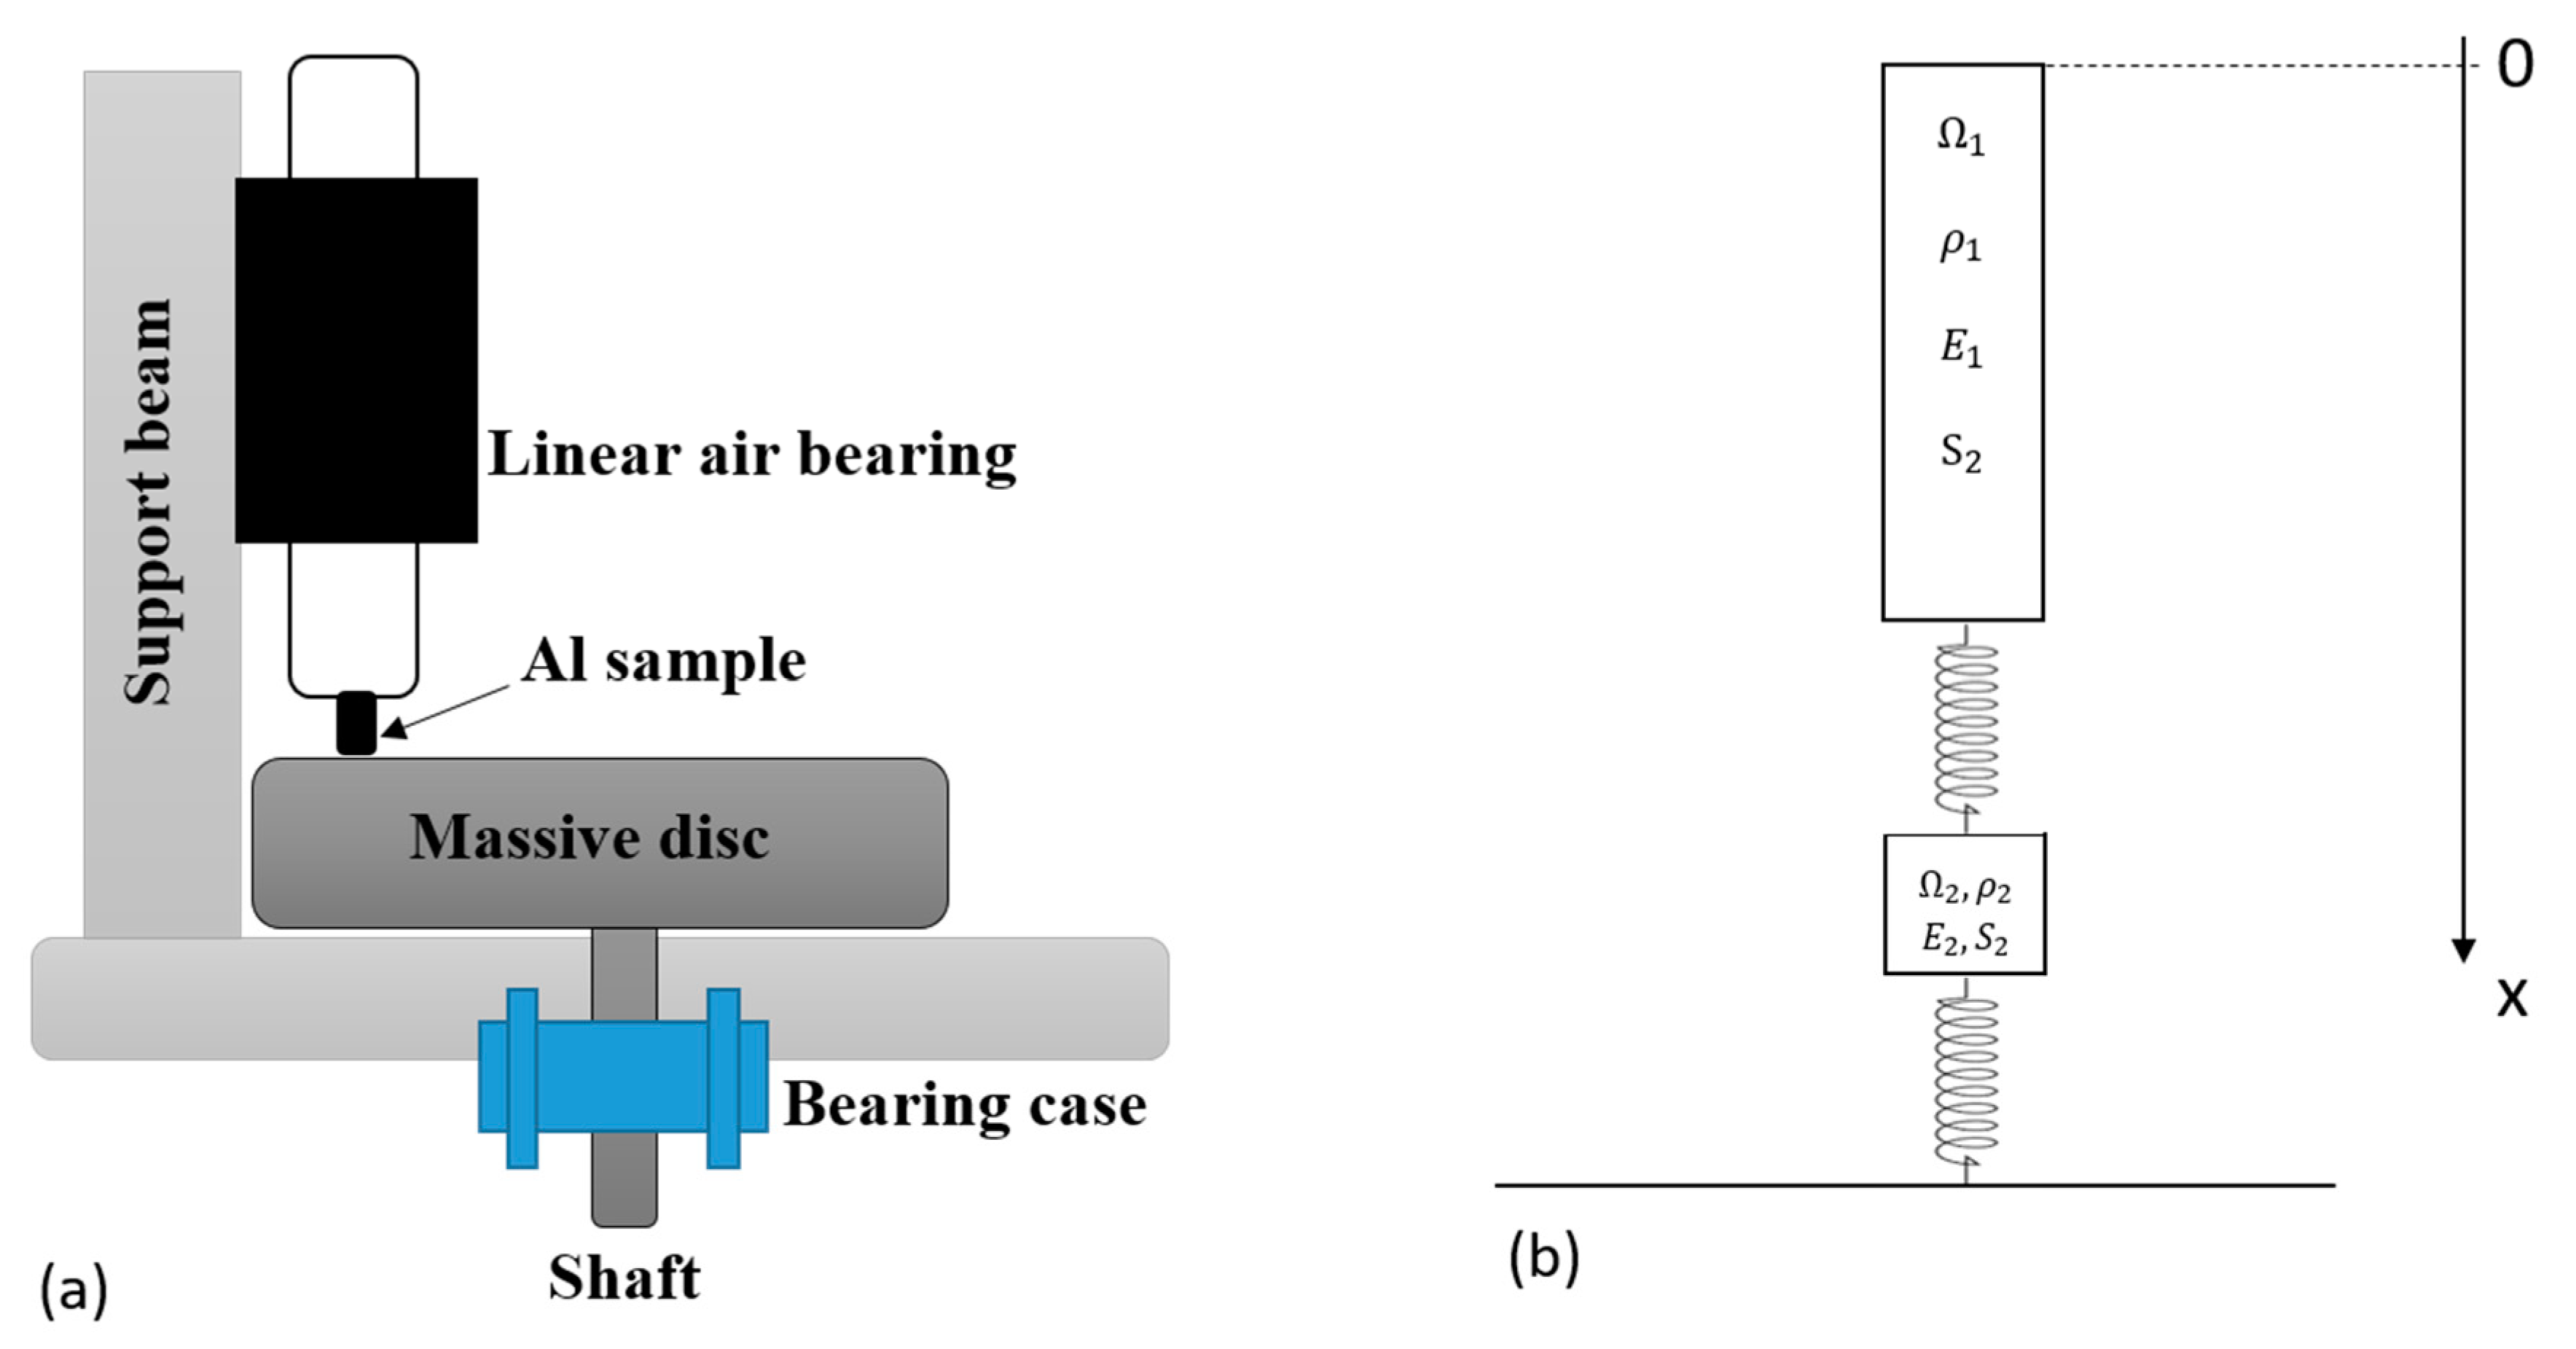
2.3. D Numerical Model
- The dynamic of interest is in the vertical direction, i.e., the numerical model can be reduced to one dimension (1D) (Figure 2b);
- The massive disc in the set-up can be considered as rigid within the frequency range of interest.
- Throughout the analysis, the interface remains in contact. Thus, no dissipation occurs at the interface and damping at the contact is disregarded;
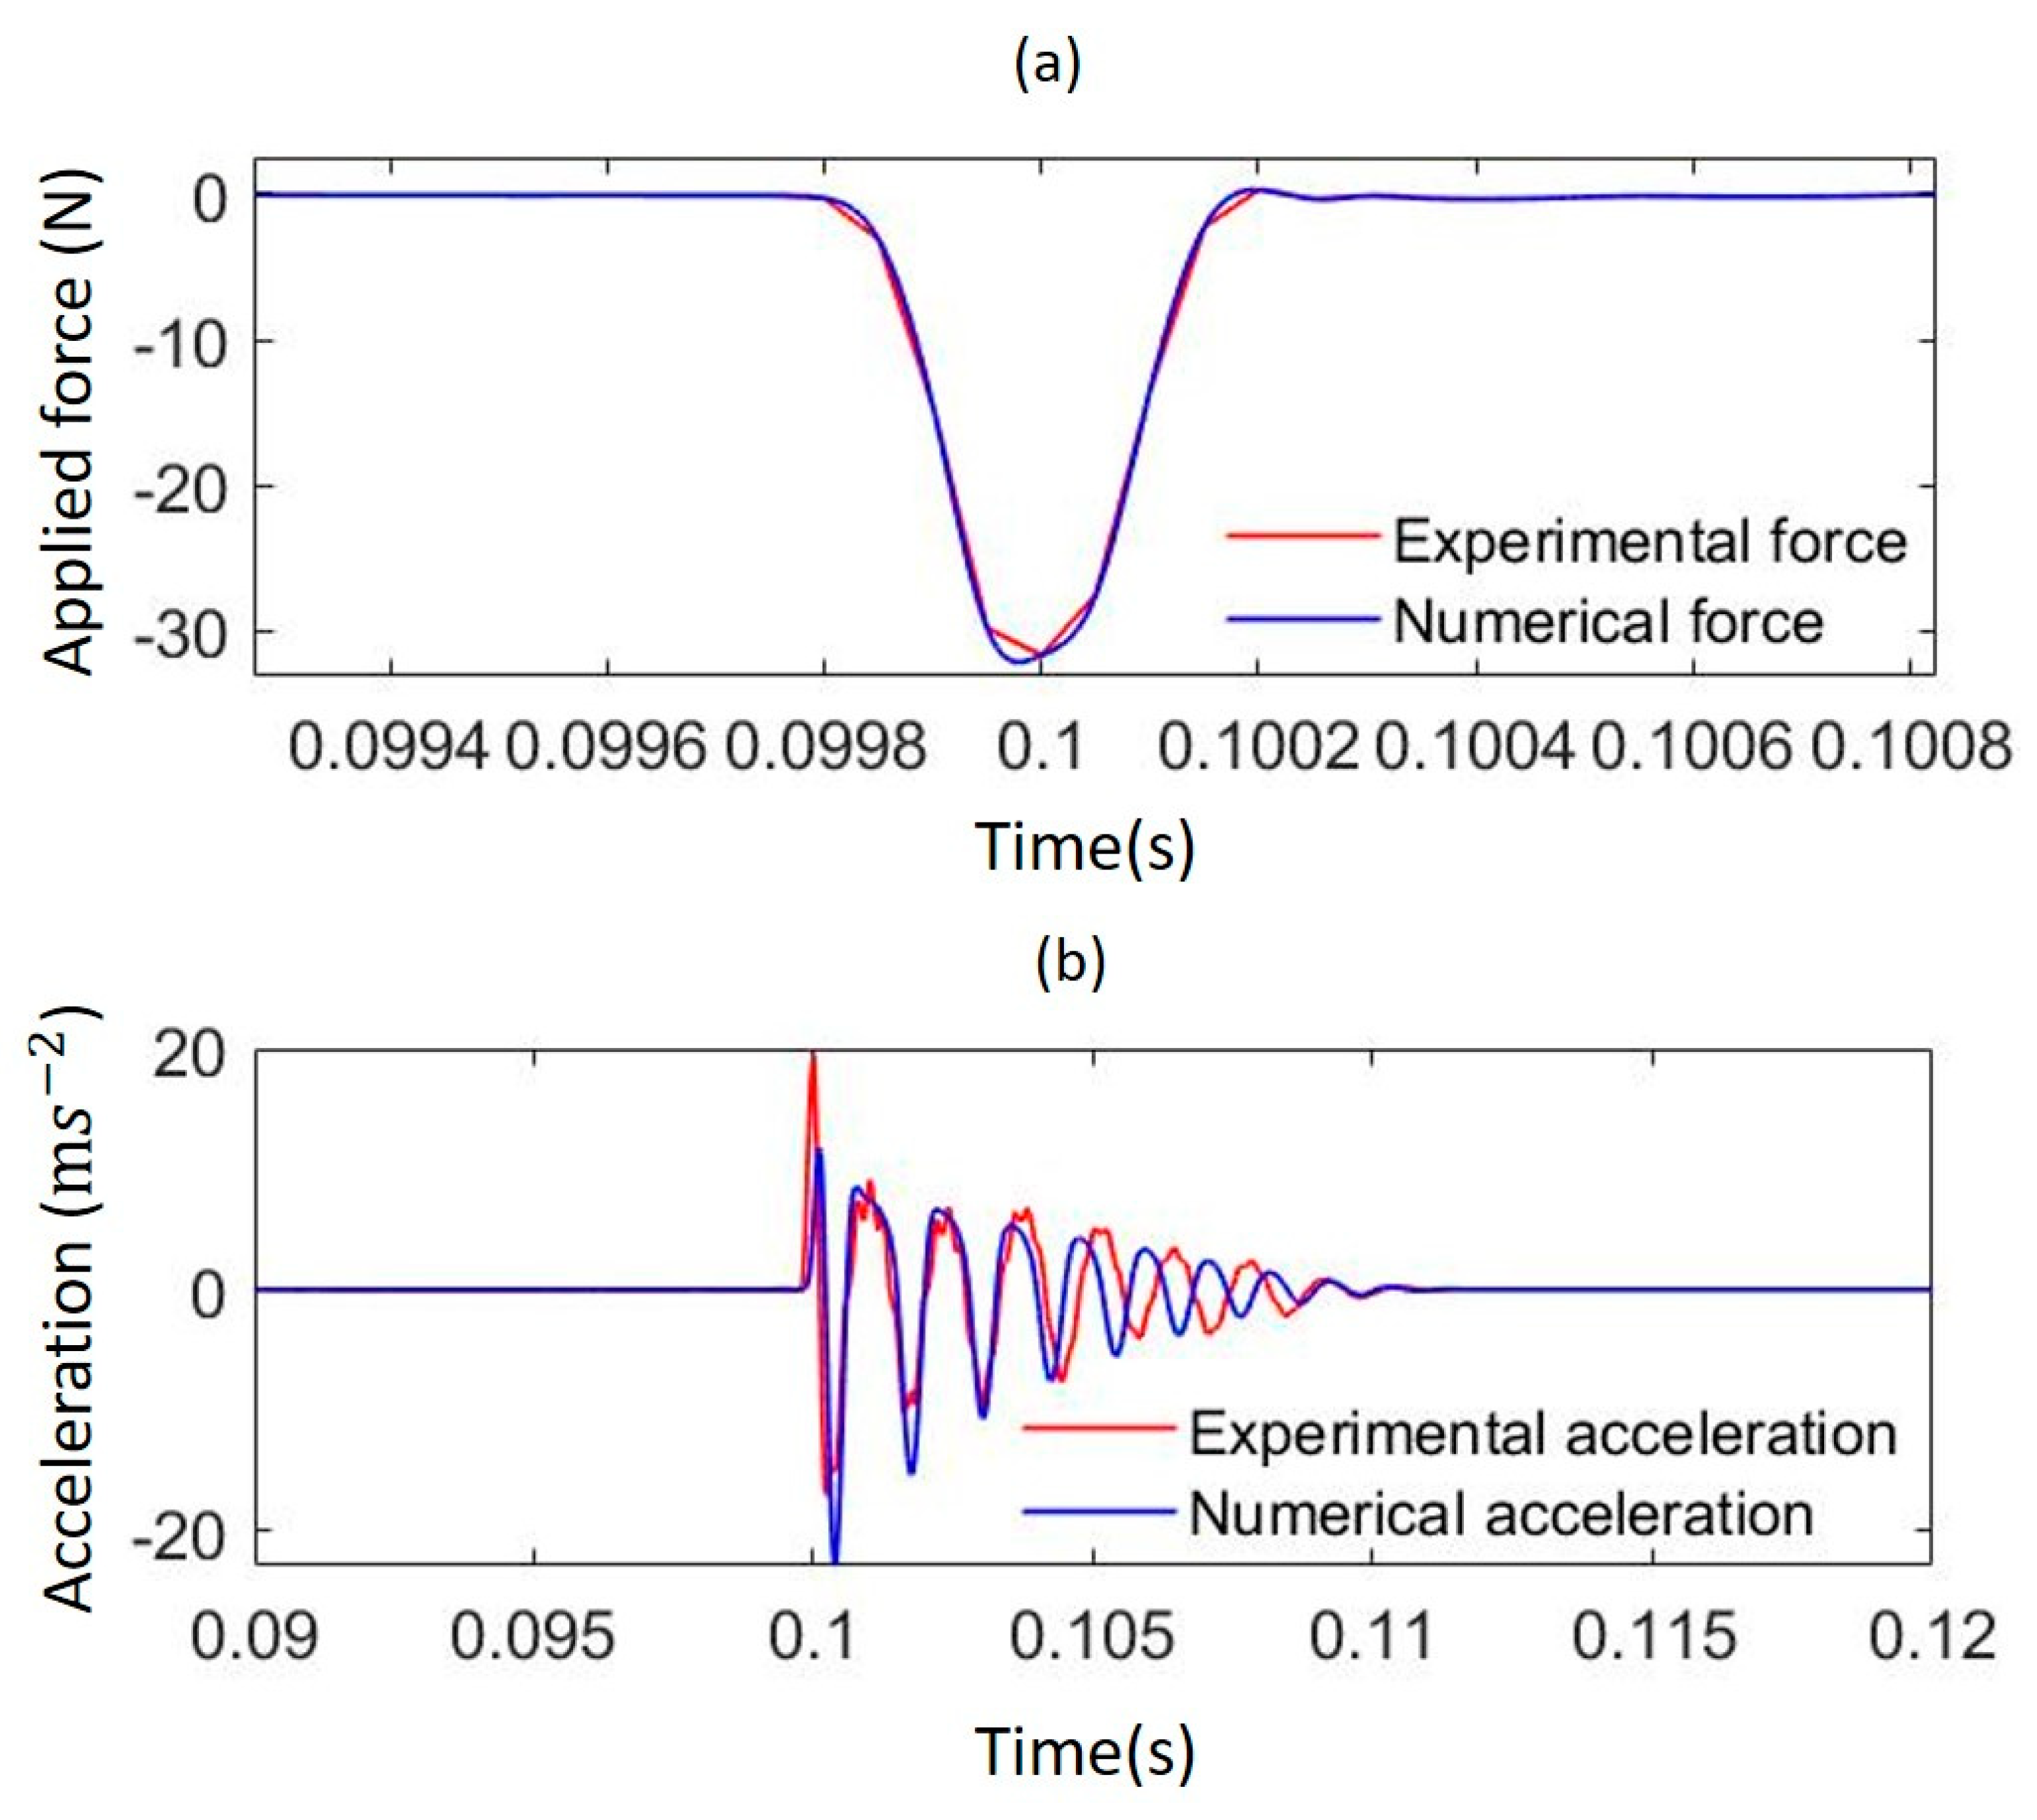
- The impact of the hammer can be modelled by introducing the respective force F into the boundary conditions, measured at the tip of the instrumented hammer:where is the stress at the upper side of the guide bar.
- a.
- Governing equations
- b.
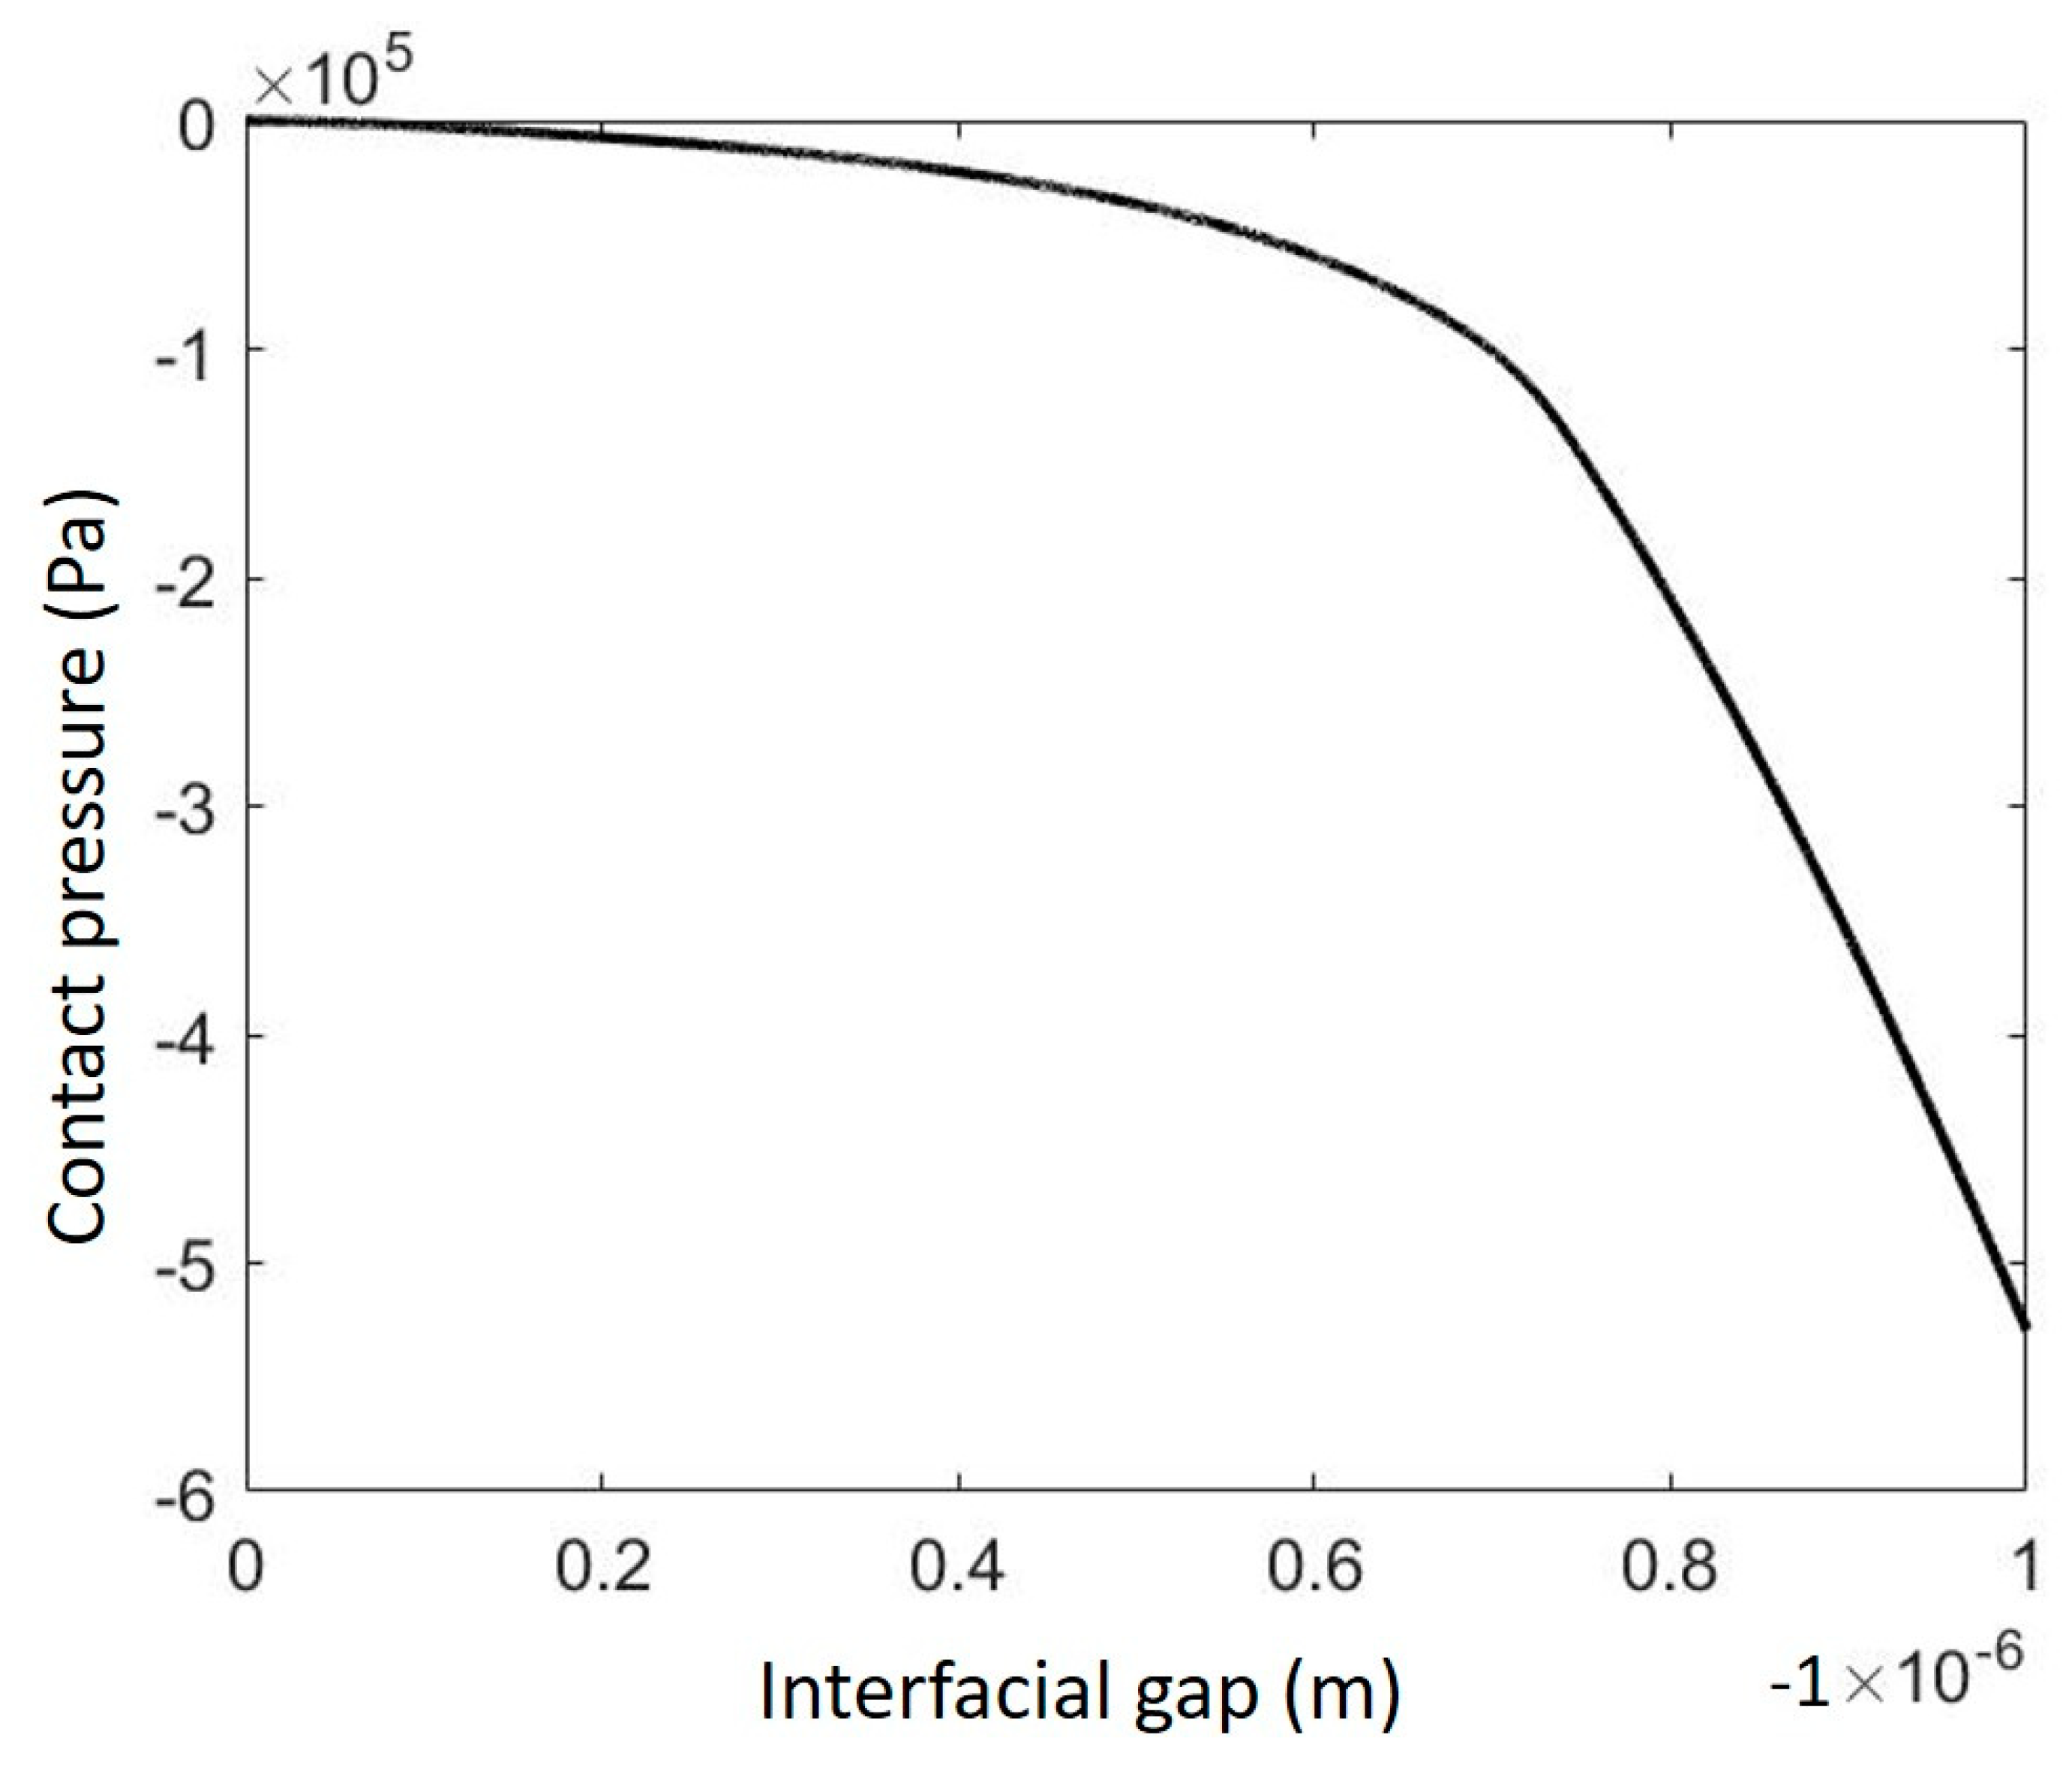
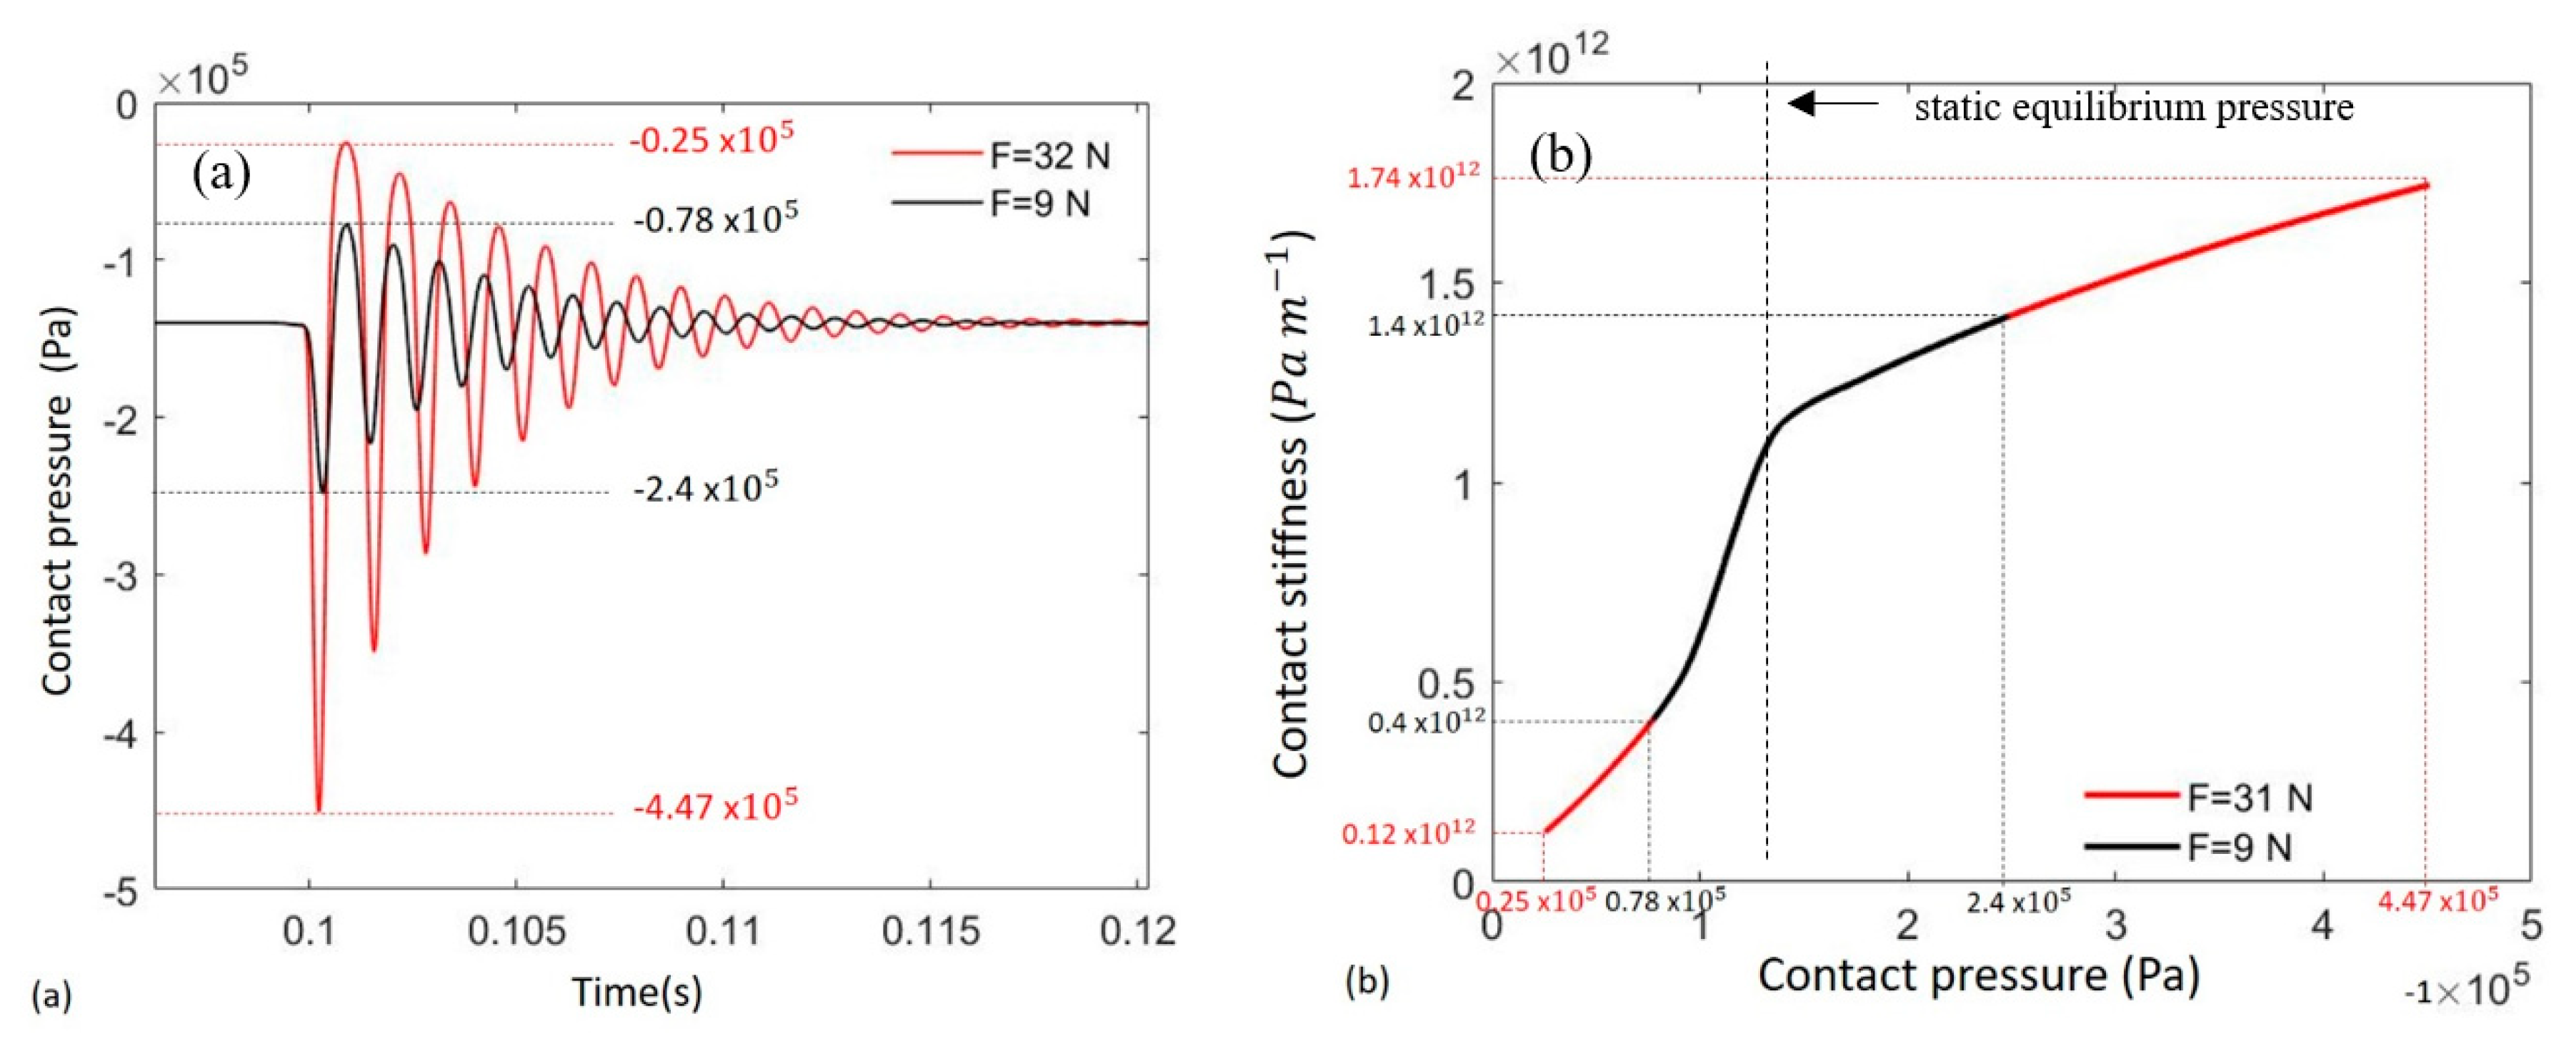
- Contact law
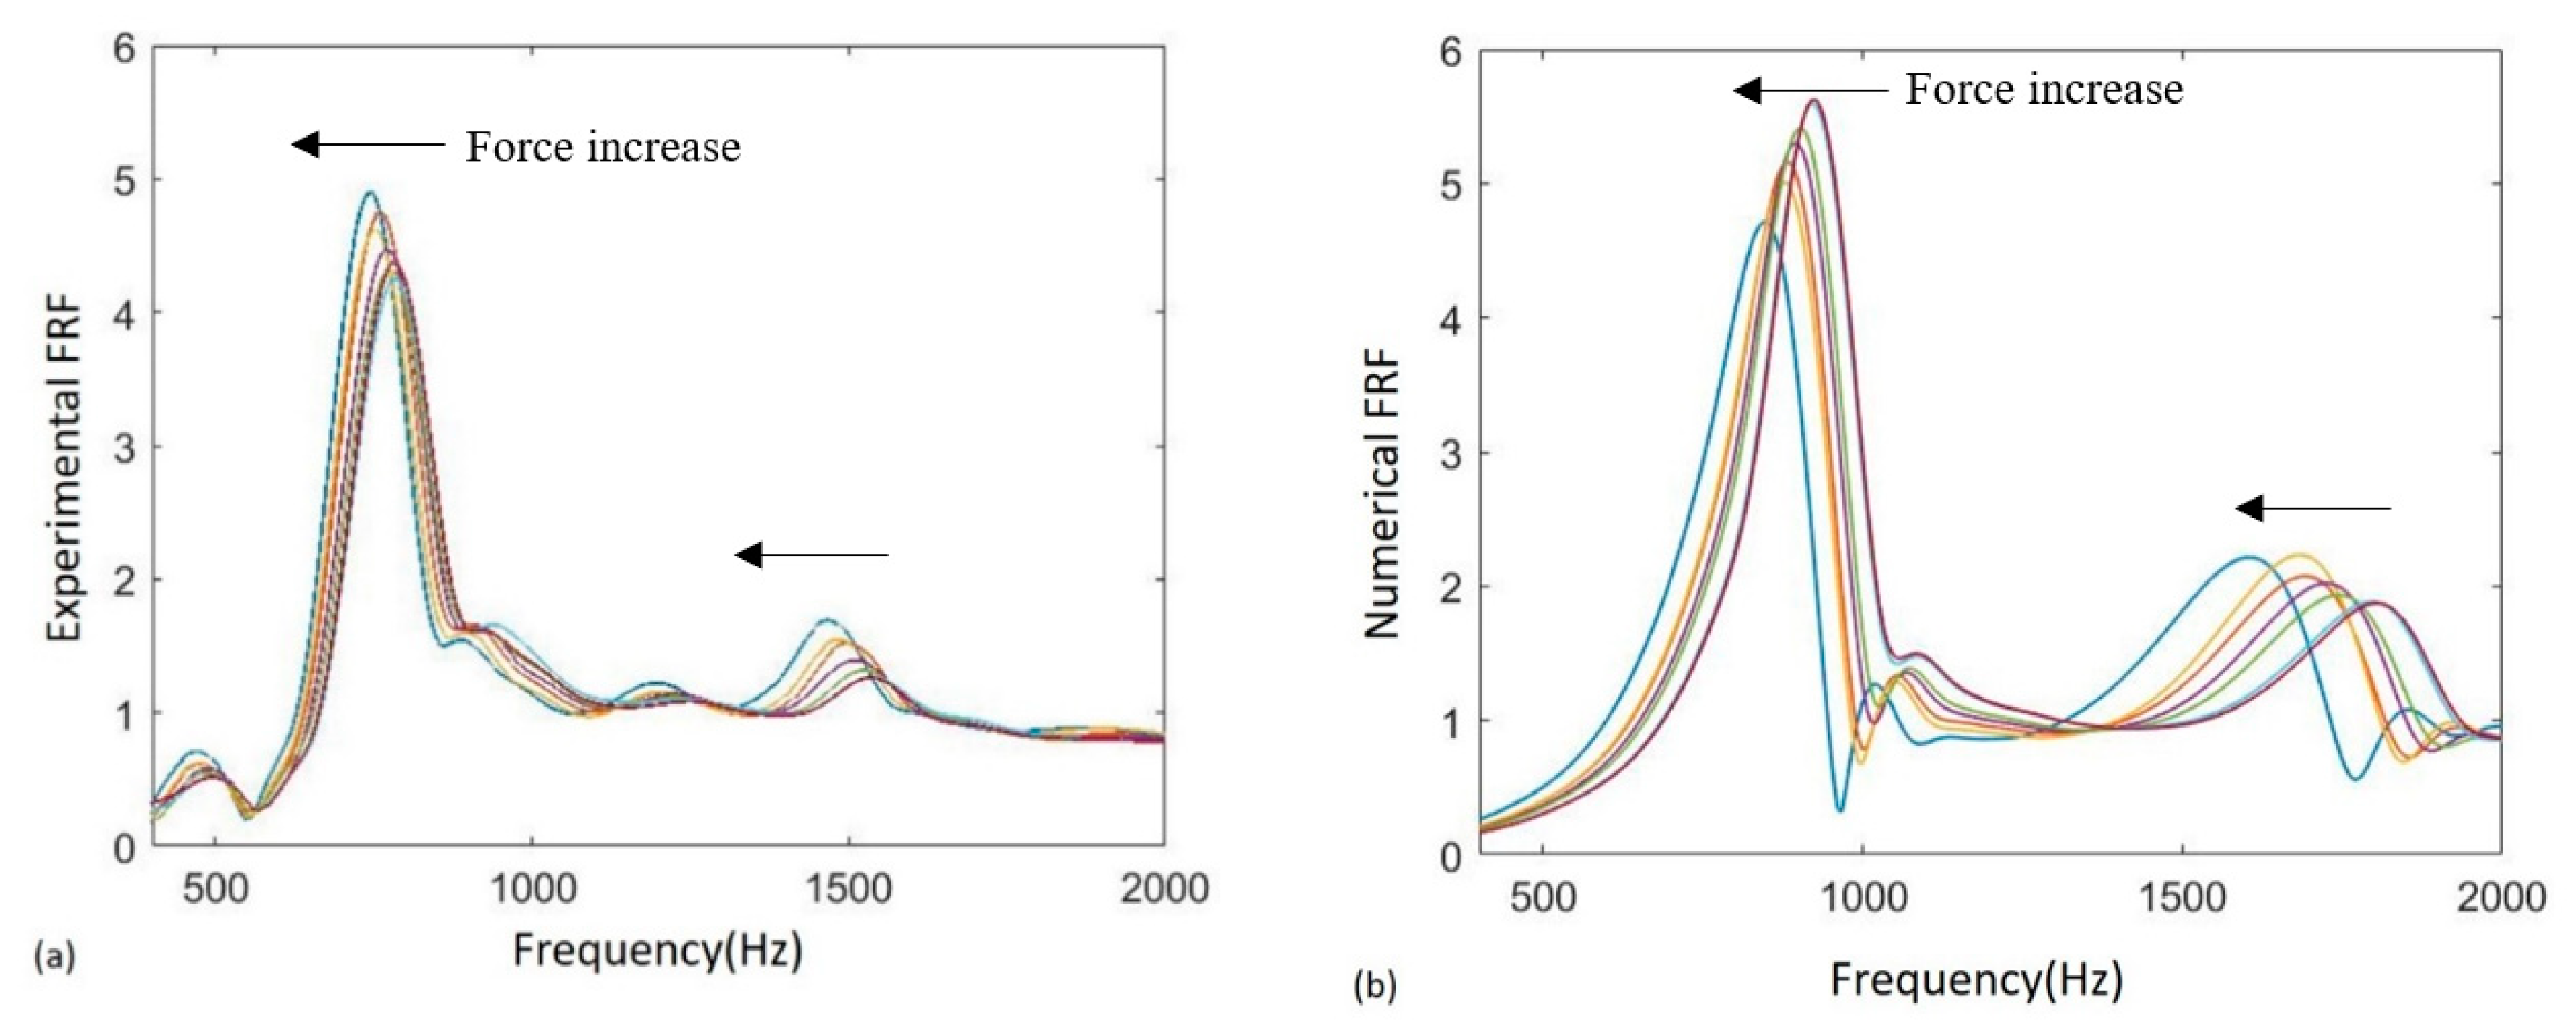
3. Experimental and Numerical Comparison
3.1. Dynamic Response of the Contact System
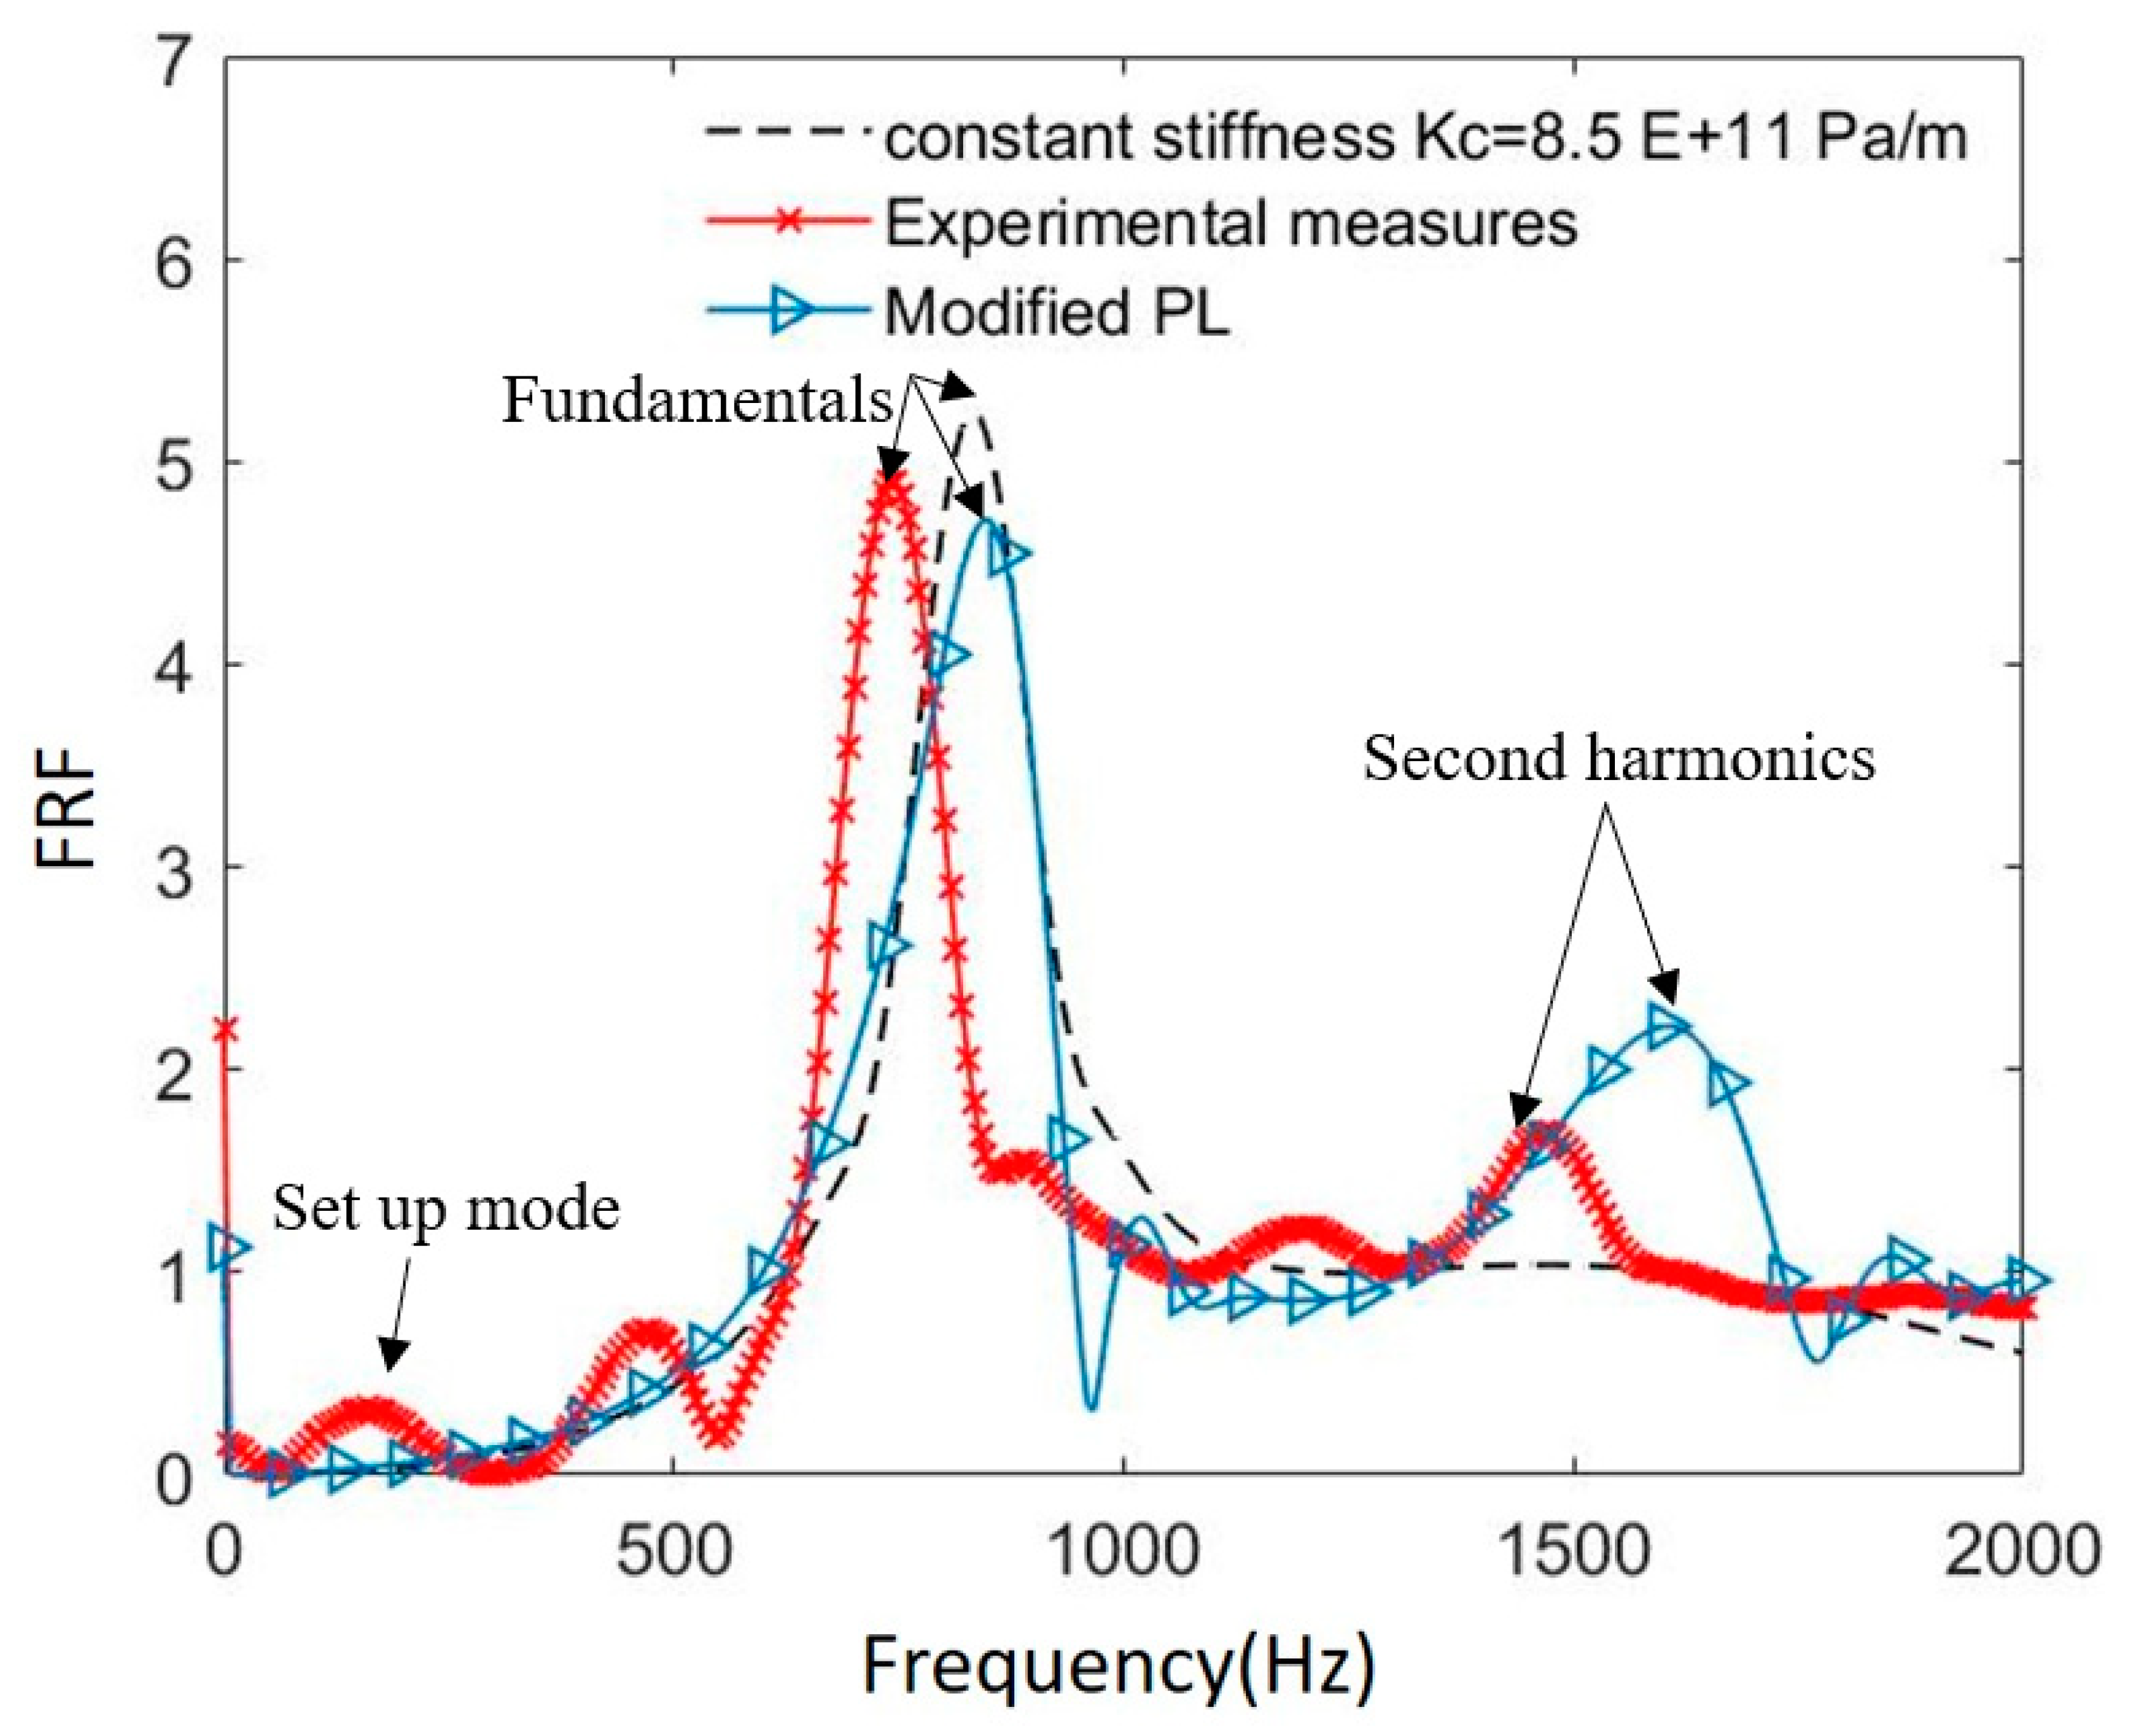
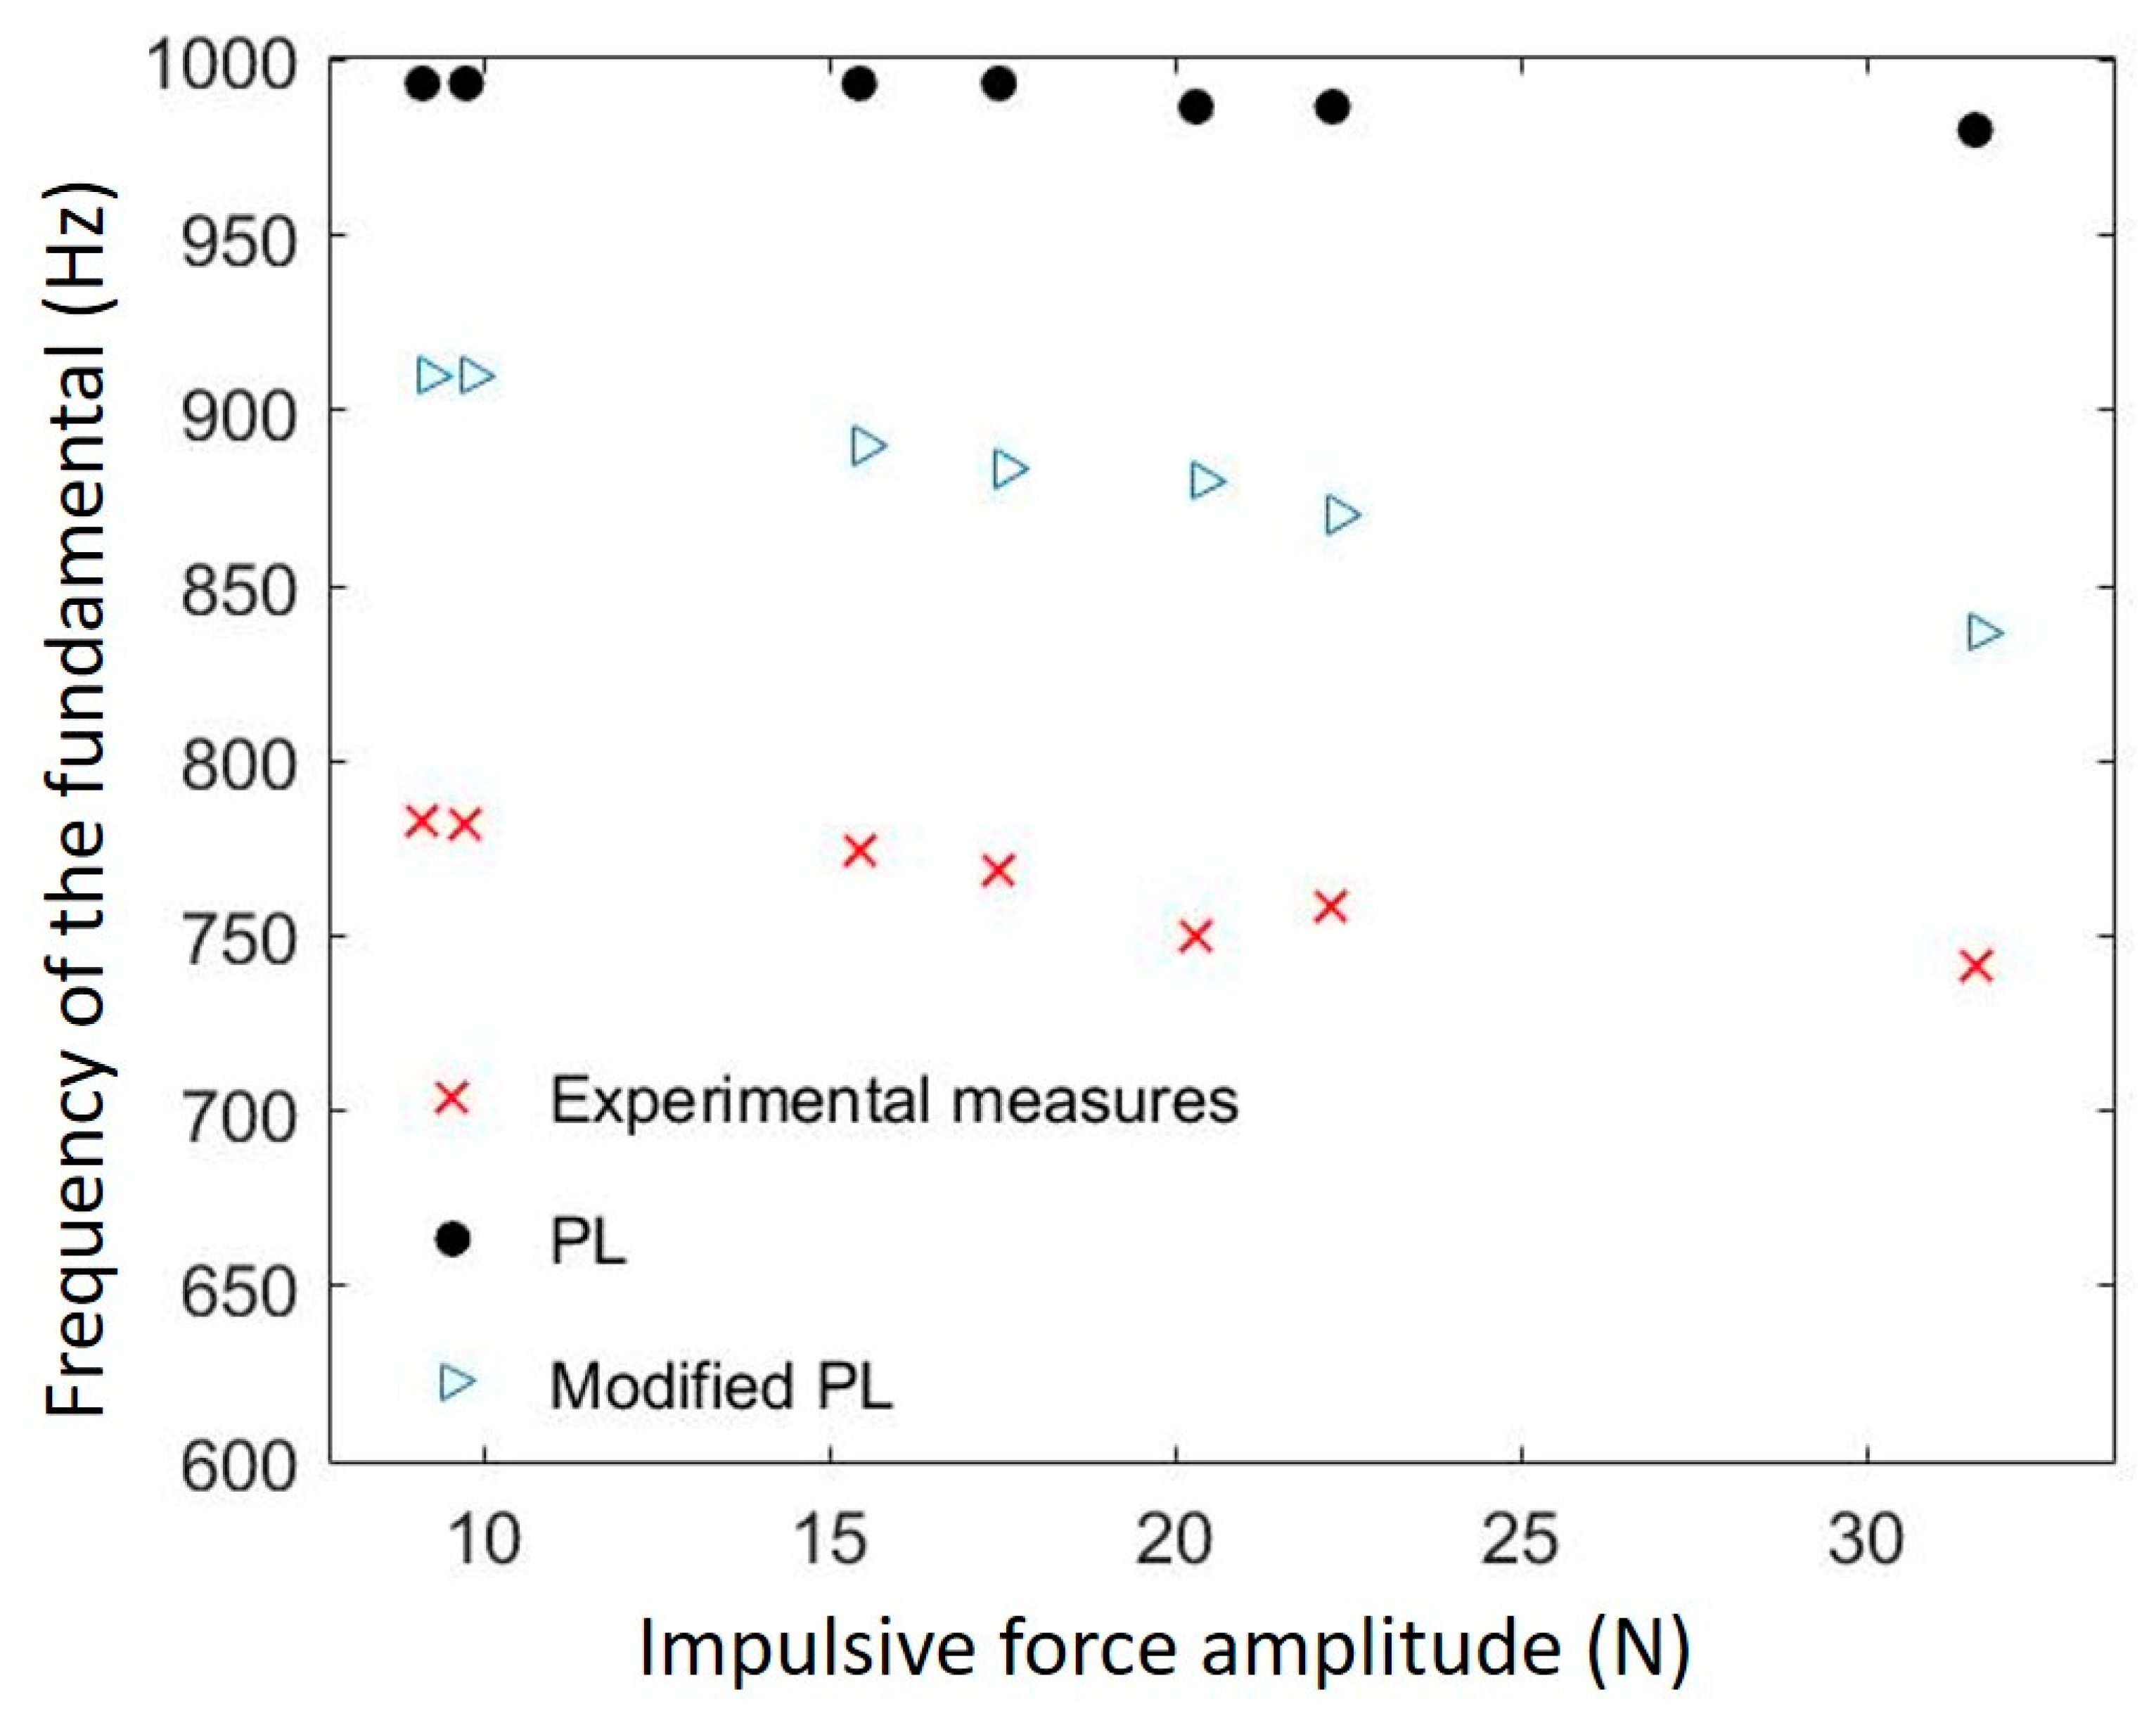
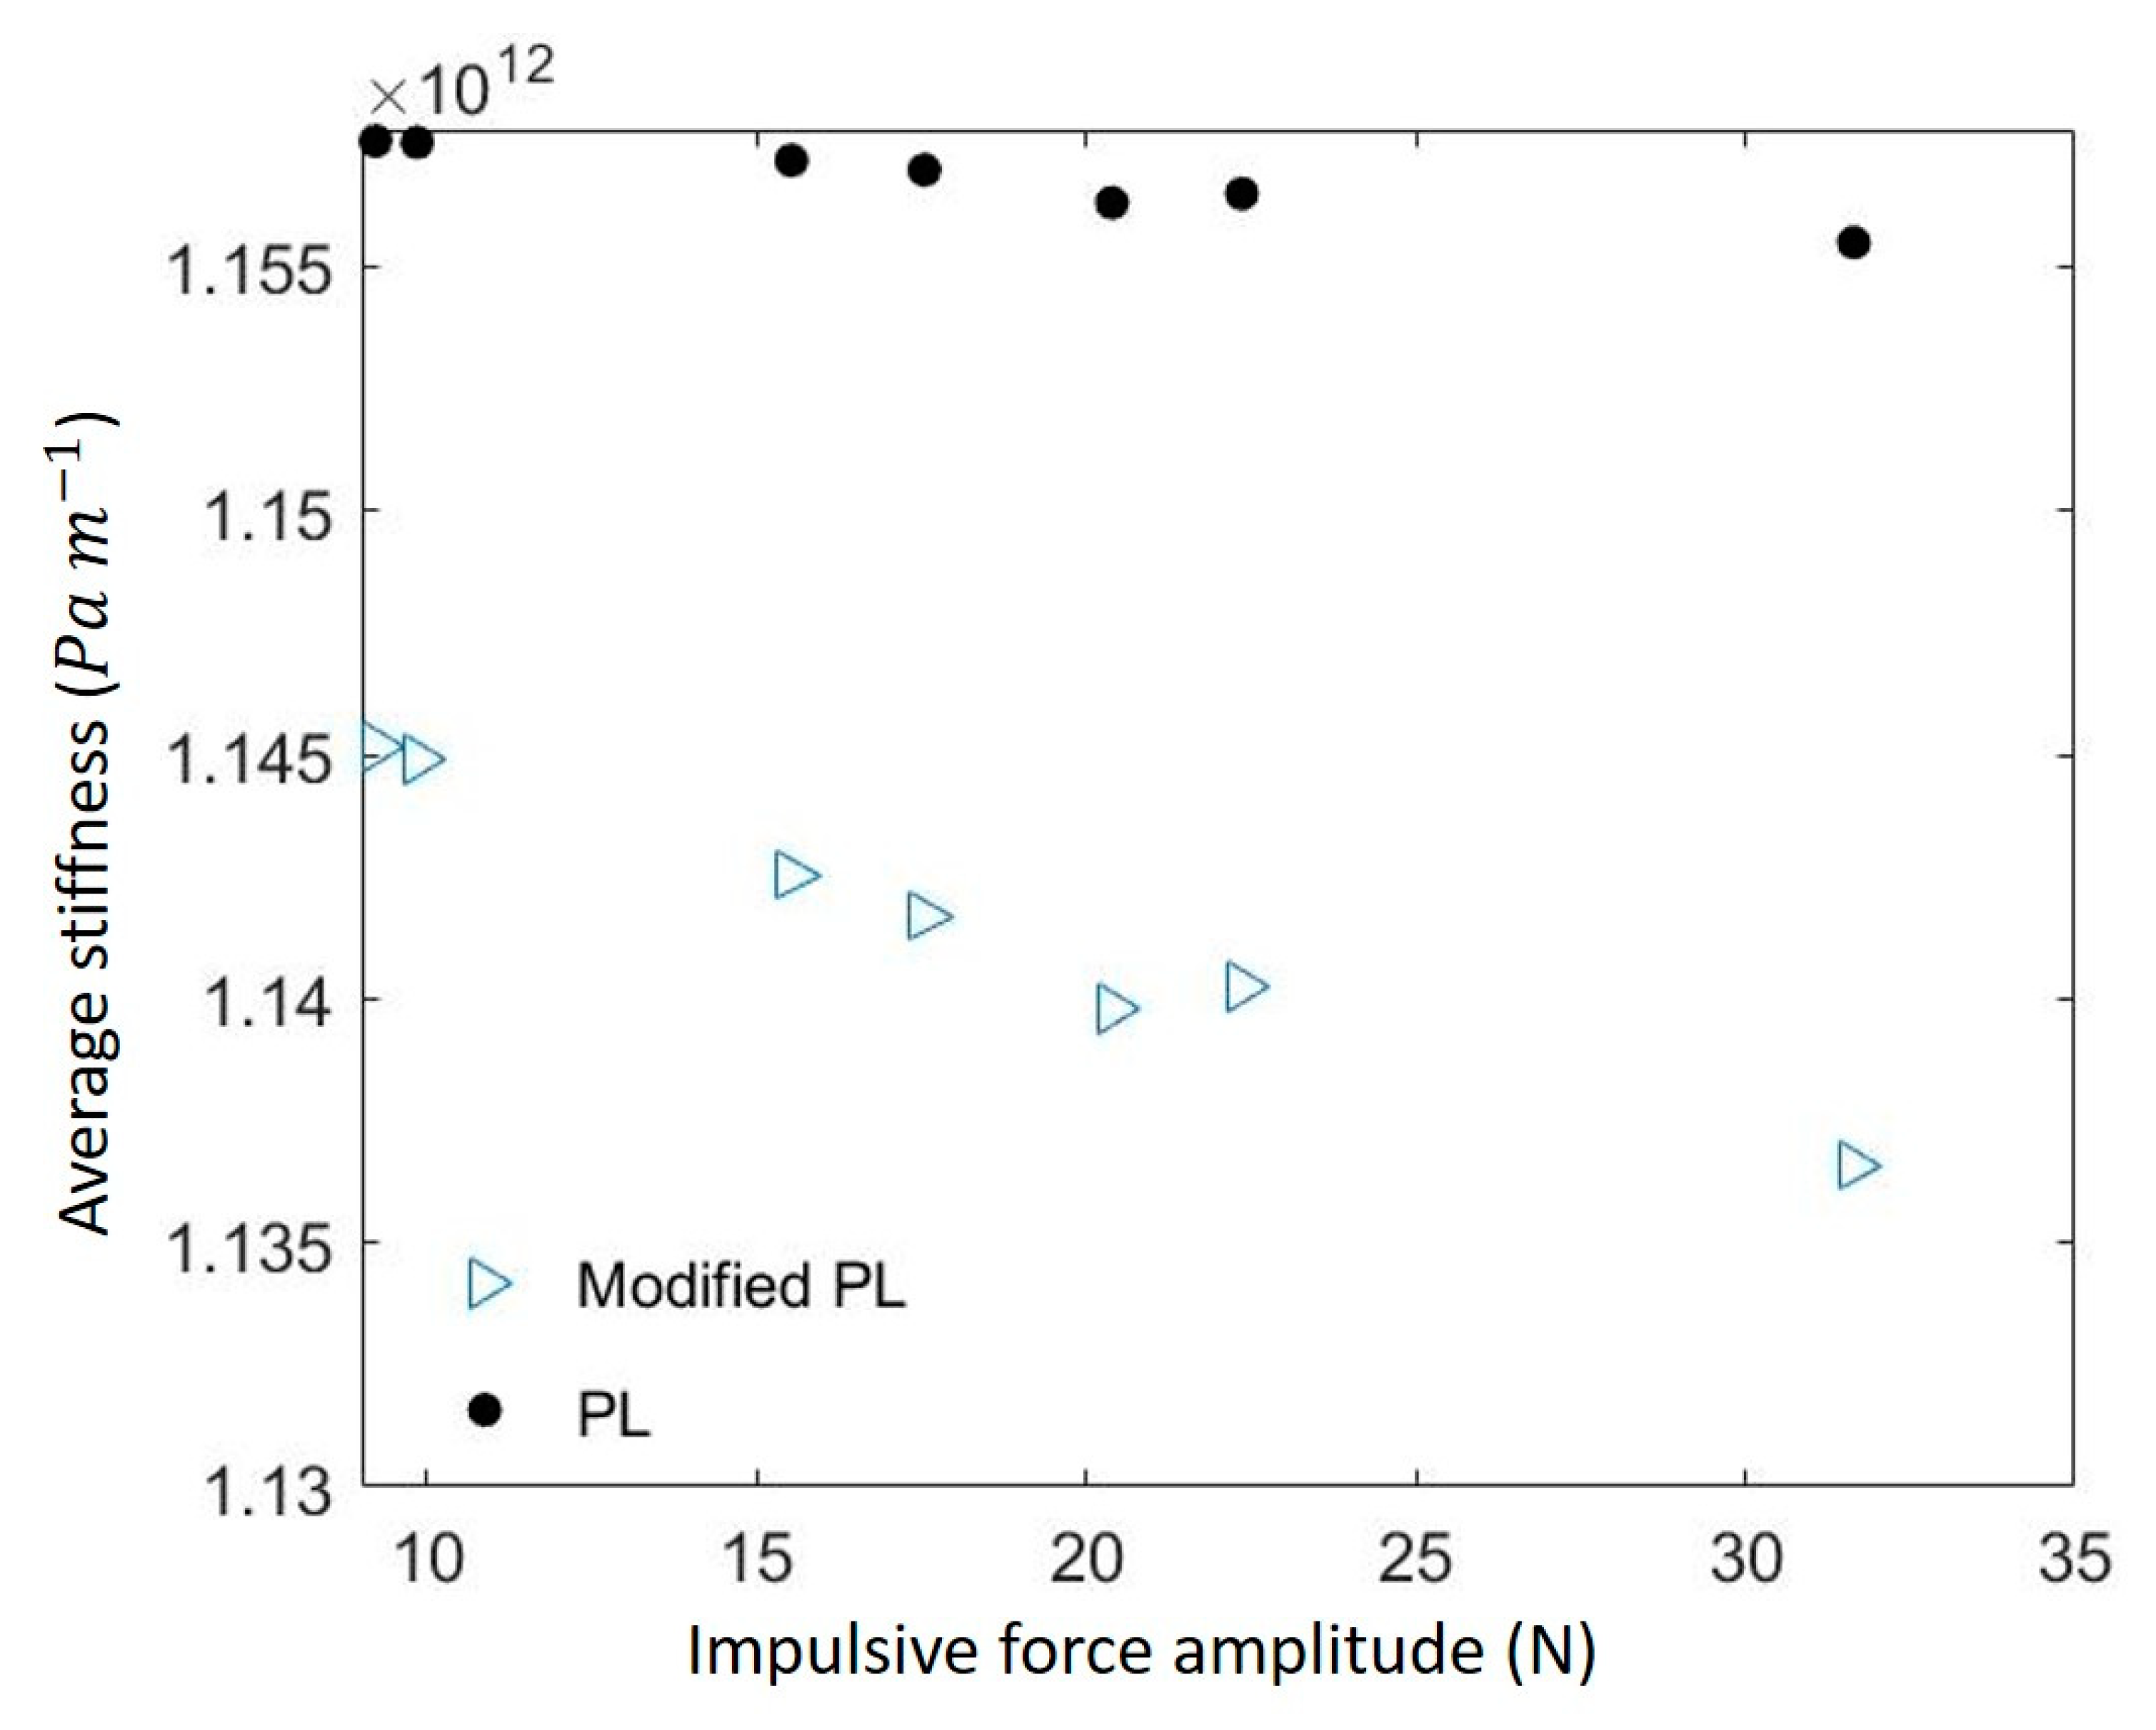
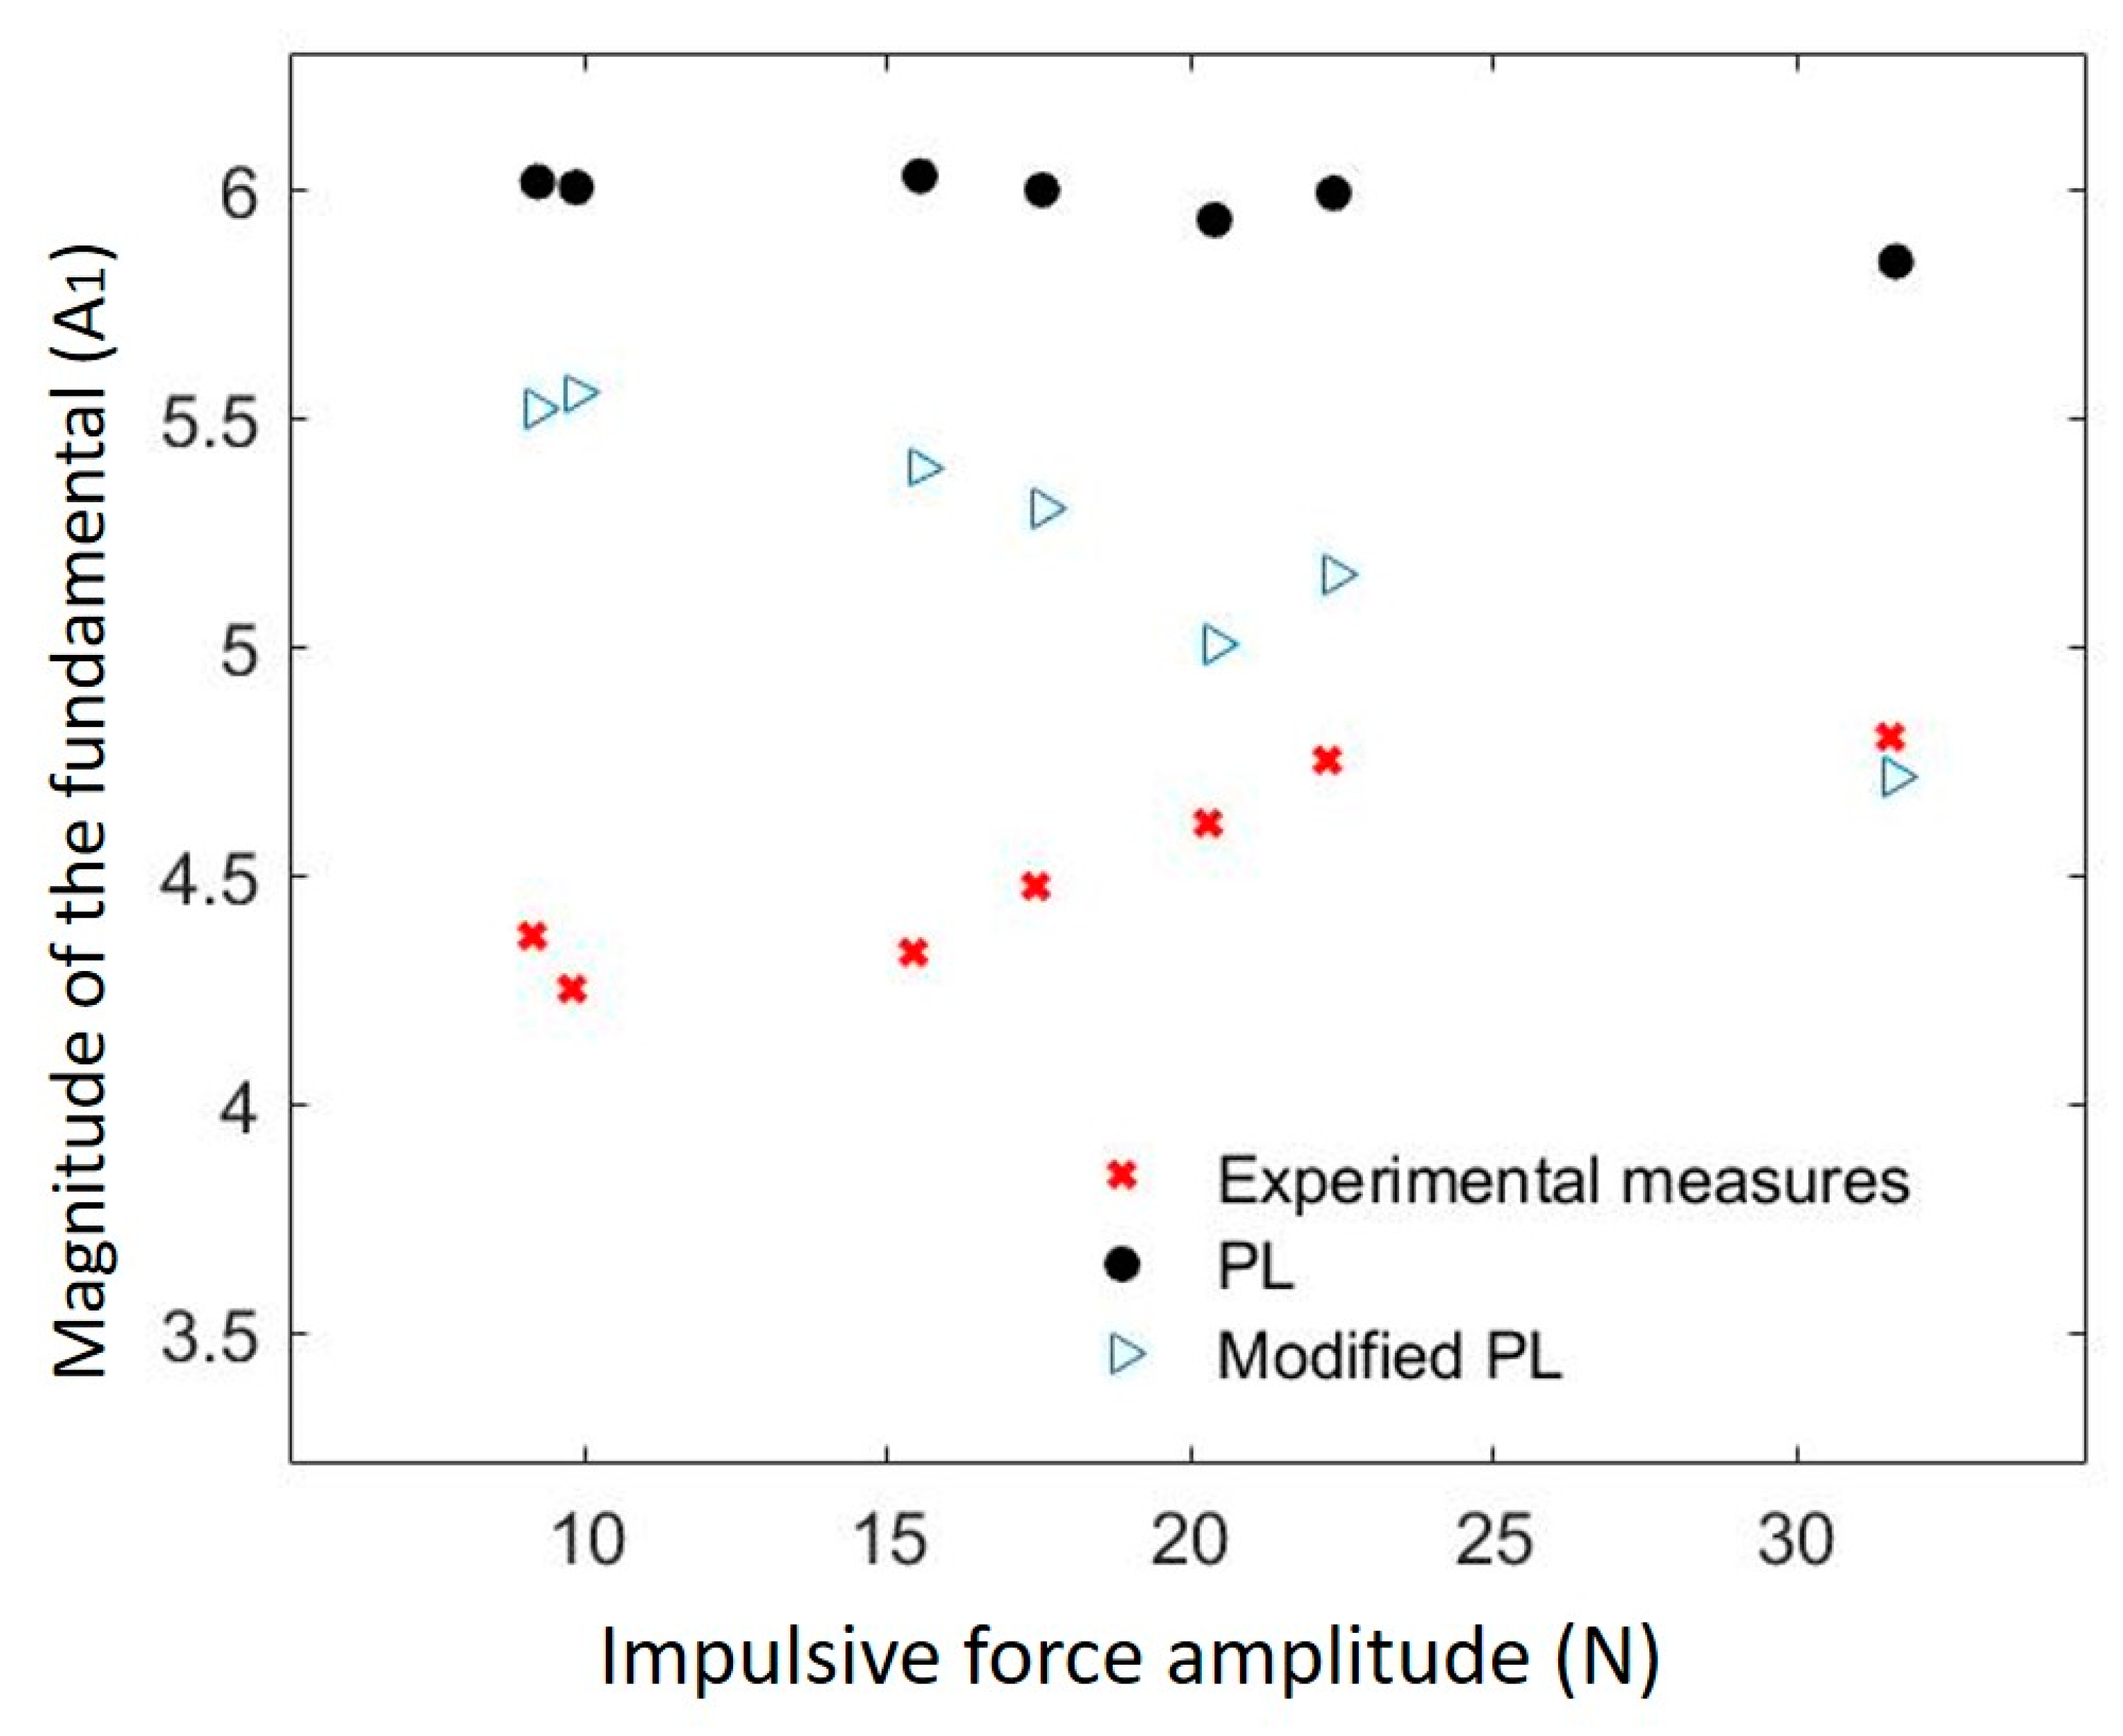
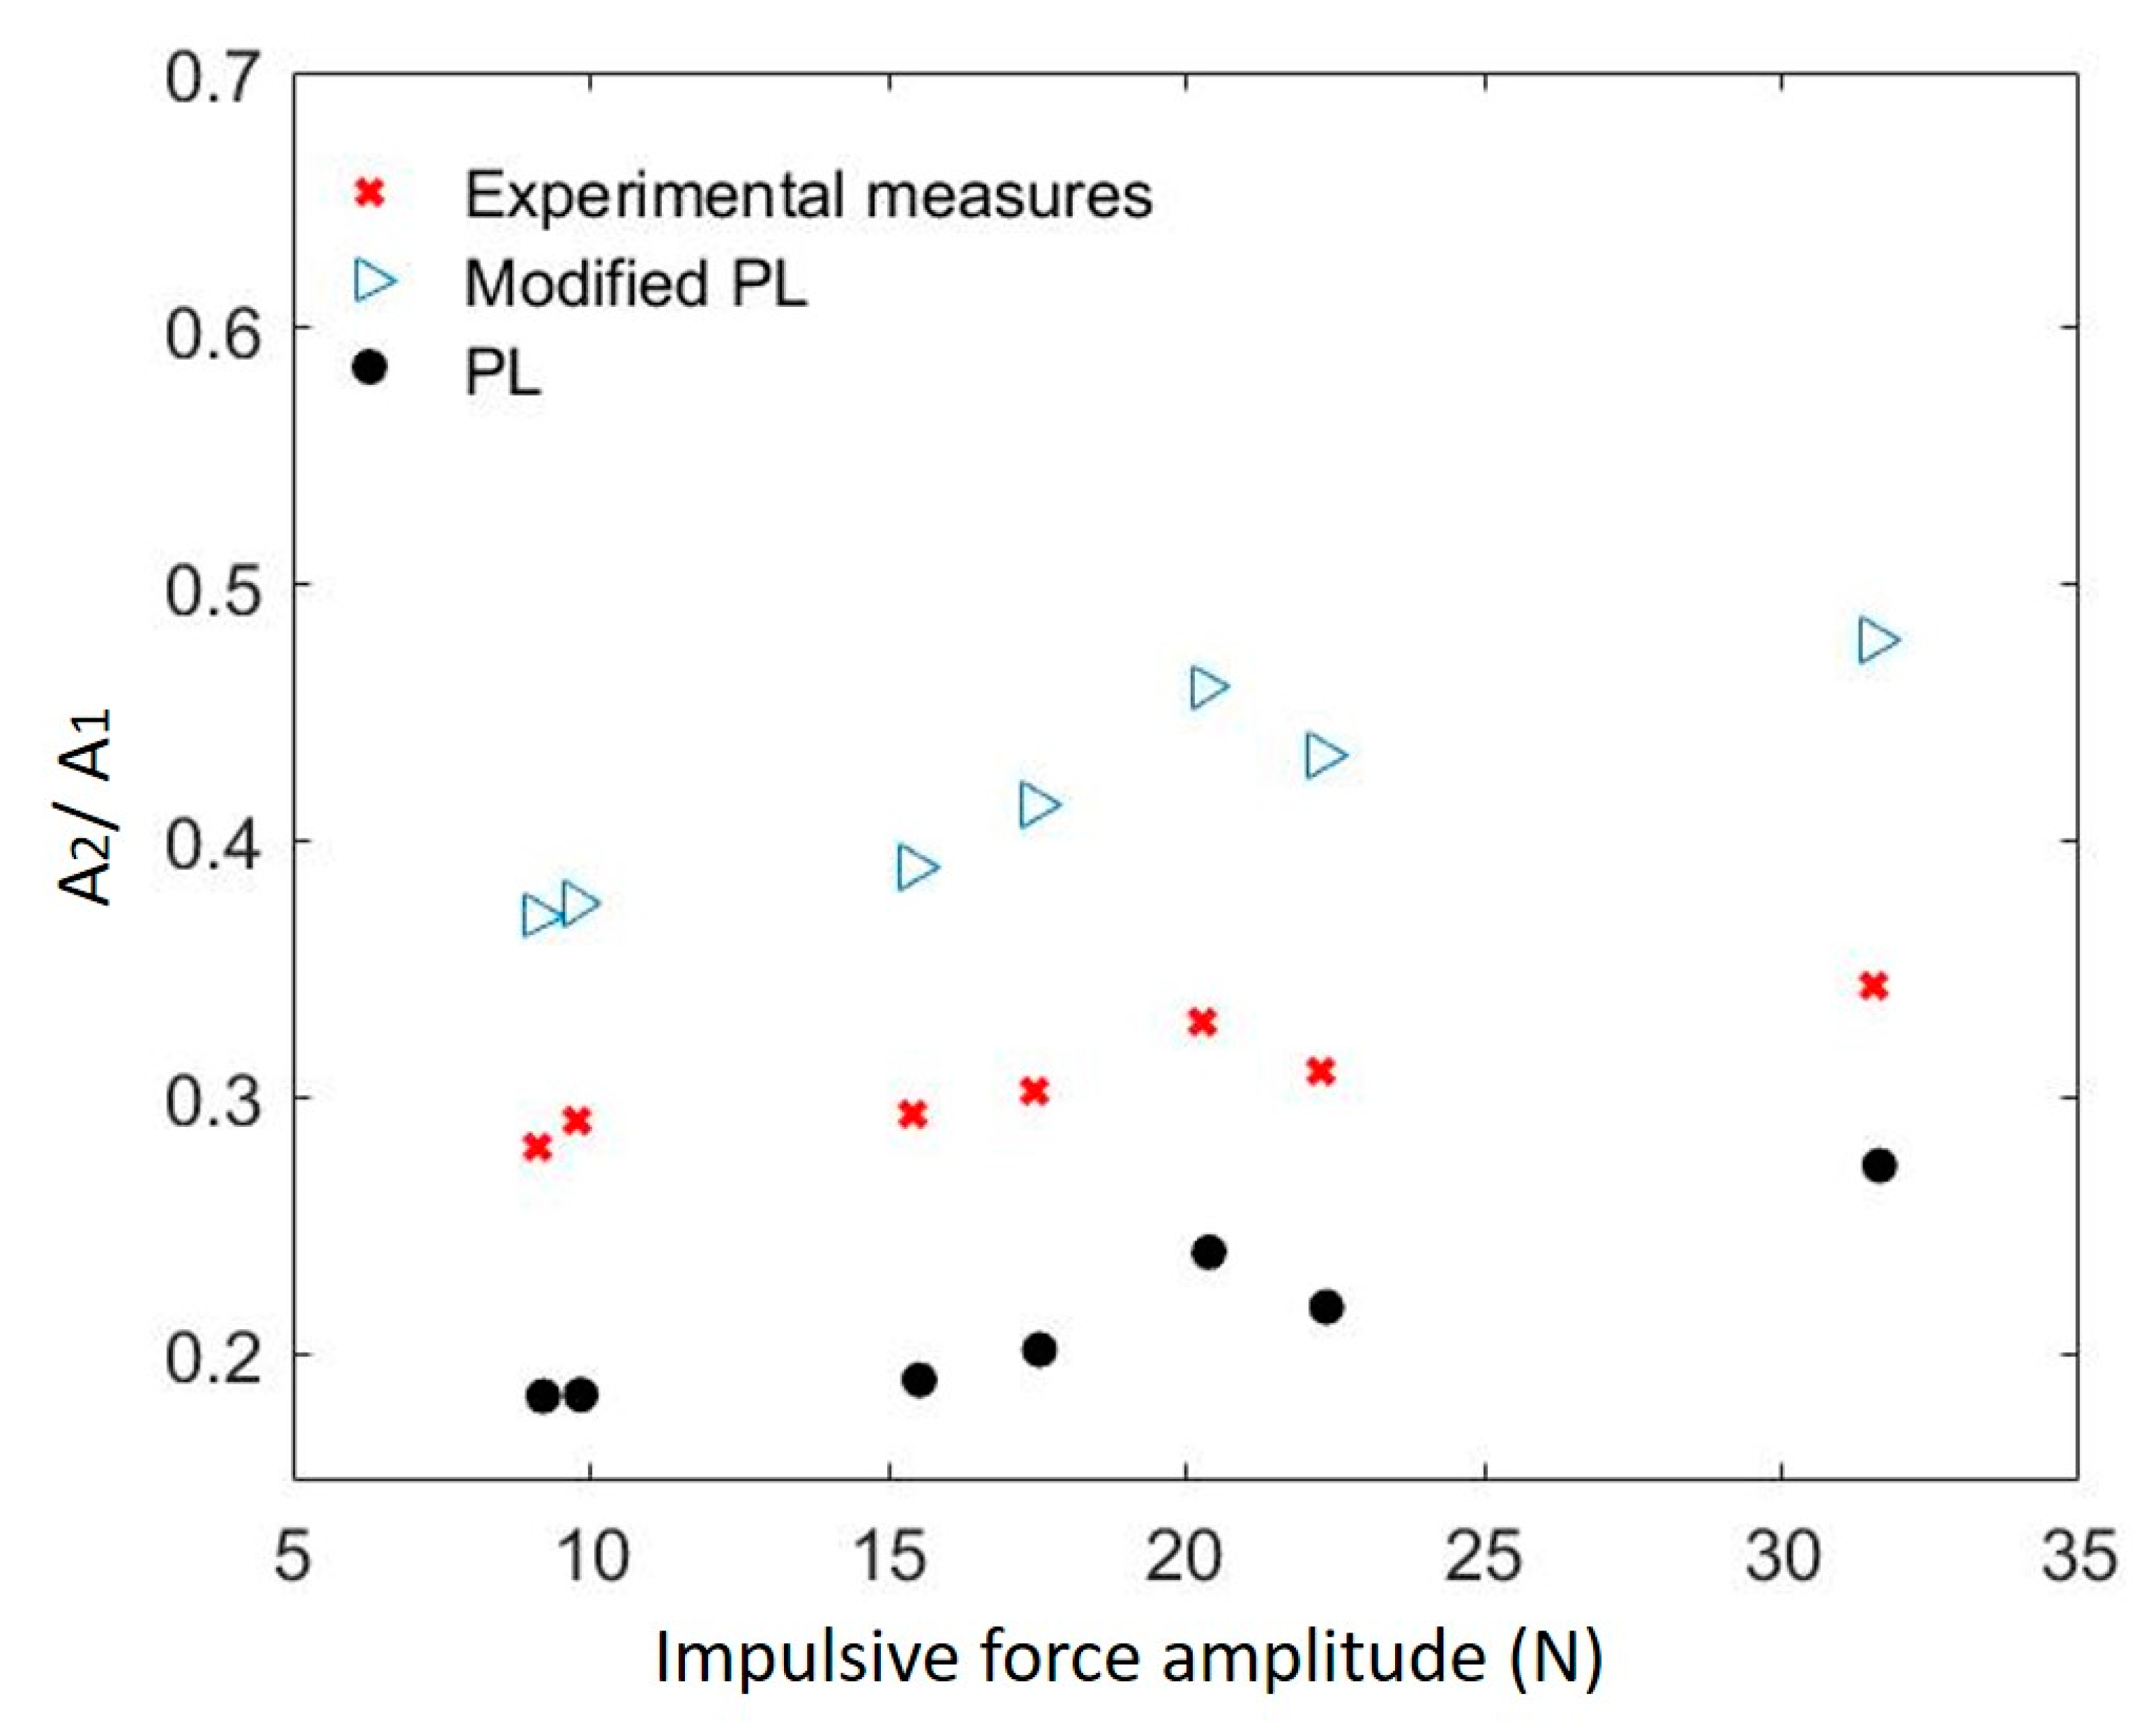
3.2. Nonlinear Response of the Interface
4. Conclusions
Author Contributions
Funding
Conflicts of Interest
References
- Armstrong-Hélouvry, B. Control of Machines with Friction. J. Tribol. 1992, 114, 637. [Google Scholar] [CrossRef] [Green Version]
- Koc, M.; Eray, T.; Sümer, B.; Cerci, N. An active force controlled laparoscopic grasper by using a smart material actuation. Tribol. Int. 2016, 100, 317–327. [Google Scholar] [CrossRef]
- Bhushan, B. Tribology and Mechanics of Magnetic Storage Devices; Springer Science & Business Media: New York, NY, USA, 2012. [Google Scholar]
- Türkmen, D.; Koc, I.M.; Sümer, B. Adhesive Pillar Based Air Levitation System for Contactless Manipulation of Fine Objects. Procedia Eng. 2015, 120, 1124–1127. [Google Scholar] [CrossRef] [Green Version]
- Tonazzi, D.; Massi, F.; Baillet, L.; Brunetti, J.; Berthier, Y. Interaction between contact behaviour and vibrational response for dry contact system. Mech. Syst. Signal Process. 2018, 110, 110–121. [Google Scholar] [CrossRef]
- Shi, X.; Polycarpou, A. Measurement and modeling of normal contact stiffness and contact damping at the meso scale. J. Viration Acoust. 2005, 127, 52–60. [Google Scholar] [CrossRef]
- Johnson, K.L. Contact Mechanics; Cambridge University Press: Cambridge, UK, 1985. [Google Scholar]
- Greenwood, J.A.; Williamson, J.P.B. Contact of nominally flat surfaces. Proc. R. Soc. Lond. 1966, 295, 300–319. [Google Scholar]
- Richardson, J.M. Harmonic Generation at an Unbonded Interface: I.Planar Interface Between Semi-Infinite Elastic Media. Int. J. Eng. Sci. 1979, 17, 73–85. [Google Scholar] [CrossRef]
- Rudenko, V. Nonlinear Acoustic Properties of a Rough Surface Contact and Acoustodiagnostics of a Roughness Height Distribution. Acoust. Phys. 1994, 40, 593–596. [Google Scholar]
- Drinkwater, B.W.; Dwyer-Joyce, R.S.; Cawley, P. A Study of the Interaction Between Ultrasound and a Partially Contacting Solid-Solid Interface. Proc. R. Soc. Lond. 1996, 452, 2613–2628. [Google Scholar]
- Polycarpou, A.; Soom, A. Boundary and Mixed Friction in the Presence of Dynamic Normal Loads. I. System Model. J. Tribol. 1995, 117, 261–266. [Google Scholar] [CrossRef]
- Song, Y.; Hartwigsen, C.; McFarland, D.; Vakakis, A.; Bergman, L. Simulation of dynamics of beam structures with Bolted Joints using adjusted Iwan beam elements. J. Sound Vib. 2004, 273, 249–276. [Google Scholar] [CrossRef]
- Jin, J.; Johnson, P.; Shokouhi, P. An integrated analytical and experimental study of contact acoustic nonlinearity at rough interfaces of fatigue cracks. J. Mech. Phys. Solids 2020, 135, 103769. [Google Scholar] [CrossRef]
- Biwa, S.; Nakajima, S.; Ohno, N. On the acoustic nonlinearity of solid-solid contact with pressure-dependent interface stiffness. J. Appl. Mech. 2004, 71, 508–515. [Google Scholar] [CrossRef]
- Aleshin, V.V.; Papangelo, A. Friction-induced energy losses in mechanical contacts subject to random vibrations. Int. J. Solids Struct. 2020, 190, 148–155. [Google Scholar] [CrossRef]
- Pastewka, L.; Prodanov, N.; Lorenz, B.; Müser, M.H.; Robbins, M.O.; Persson, B.N. Finite-size scaling in the interfacial stiffness of rough elastic contacts. Phys. Rev. E. 2013, 87, 062809. [Google Scholar] [CrossRef] [PubMed] [Green Version]
- Tonazzi, D.; Massi, F.; Salipante, M.; Berthier, Y. Estimation of the normal contact stiffness for frictional interface in sticking and sliding condition. Lubricants 2019, 7, 56. [Google Scholar] [CrossRef] [Green Version]
- Kendall, K.; Tabor, D. An ultrasonic study of the area of contact between stationary and sliding surfaces. Proc. R. Soc. Lond. 1971, 323, 321–340. [Google Scholar]
- Aleshin, V.; Matar, O.B.; van den Abeele, K. Method of memory diagrams for mechanical frictional contacts subject to arbitrary 2D loading. Int. J. Solids Struct. 2015, 60, 84–95. [Google Scholar] [CrossRef]
- Aleshin, V.; Delrue, S.; Trifonov, A.; Matar, O.B.; van den Abeele, K. Two dimensional modeling of elastic wave propagation in solidscontaining cracks with rough surfaces and friction—Part I: Theoretical Background. Ultrasonics 2018, 82, 11–18. [Google Scholar] [CrossRef]
- Aleshin, V.; Delrue, S.; Trifonov, A.; Matar, O.B.; van den Abeele, K. Two dimensional modeling of elastic wave propagation in solidscontaining cracks with rough surfaces and friction—Part II: Numerical implementation. Ultrasonics 2018, 82, 19–30. [Google Scholar] [CrossRef]
- Biwa, S. Second-Harmonic Generation at Contacting Interfaces. In Nonlinear Ultrasonic and Vibro-Acoustical Techniques for Nondestructive Evaluation; Springer: Cham, Germany, 2019; pp. 263–299. [Google Scholar]
- Saidoun; Meziane, A.; Rénier, M.; Bacon, C.; Zhang, F.; Walaszek, H. Influence of contact interface morphology on the nonlinear interaction between a longitudinal wave and a contact interface with friction: A numerical study, submitted to wave motion. Article submitted for publication.
- Van den Abeele, K.A.; Carmeliet, J.; Cate, J.A.T.; Johnson, P.A. Nonlinear elastic wave spectroscopy (NEWS) techniques to discern material damage, Part II: Single-mode nonlinear resonance acoustic spectroscopy. J. Res. Nondestruct. Eval. 2000, 12, 31–42. [Google Scholar] [CrossRef]
- Gonzalez-Valadez, M.; Baltazar, A.; Dwyer-Joyce, R. Study of interfacial stiffness ratio of a rough surface in contact using a spring model. Wear 2010, 268, 373–379. [Google Scholar] [CrossRef] [Green Version]
- Teufelsbauer, H.; Wang, Y.; Chiou, M.; Wu, W. Flow–obstacle interaction in rapid granular avalanches: DEM simulation and comparison with experiment. Granul. Matter 2009, 11, 209–220. [Google Scholar] [CrossRef]
- Blanloeuil, P.; Croxford, A.J.; Meziane, A. Numerical and experimental study of the nonlinear interaction between a shear wave and a frictional interface. J. Acoust. Soc. Am. 2014, 135, 1709–1716. [Google Scholar] [CrossRef]
- Bossy, M.; Gobet, E.; Talay, D. A symmetrized Euler scheme for an efficient approximation of reflected diffusions. J. Appl. Probab. 2004, 41, 877–889. [Google Scholar] [CrossRef] [Green Version]
- Baltazar, A.; Rokhlin, S.I.; Pecorari, C. On the Relationship Between Ultrasonic and Micromechanical Properties of Contacting Rough Surfaces. J. Mech. Phys. Solids 2002, 50, 1397–1416. [Google Scholar] [CrossRef]
- Massi, F.; Berthier, Y. Contact surface topography and system dynamics of brake squeal. Wear 2008, 265, 1784–1792. [Google Scholar] [CrossRef] [Green Version]
- Krolikowski, J.; Szczepek, J. Prediction of Contact Parameters using Ultrasonic Method. Wear 1991, 148, 181–195. [Google Scholar] [CrossRef]
- Asma, F.; Bouazzouni, A. Finite element model updating using FRF measurements. Shock Vib. 2005, 12, 377–388. [Google Scholar] [CrossRef]
- Ciavarella, M.; Papangelo, A. On the sensitivity of adhesion between rough surfaces to asperity height distribution. Phys. Mesomech. 2018, 21, 59–66. [Google Scholar] [CrossRef]
- Papangelo, A.; Hoffmann, N.; Ciavarella, M. Load-separation curves for the contact of self-affine rough surfaces. Sci. Rep. 2017, 7, 6900. [Google Scholar]


| Individual Sample Parameters | Interface Parameter | |||
|---|---|---|---|---|
| Length (m) | Contacting surface () | Young modulus (GPa) | Density (kg) | Roughness (µm) Ra |
| 0.015 | 1.15 × 10⁻⁴ | 71 | 2710 | 1 |
| Length L (m) | Mass m (Kg) | Young’s Modulus E (GPa) | |||
|---|---|---|---|---|---|
| Guide bar () | 0.229 | 1.61 | 71 | 2710 | 1.15 × 10⁻⁴ |
| Sample () | 0.015 | 0.00467 | 71 | 2710 | 1.15 × 10⁻⁴ |
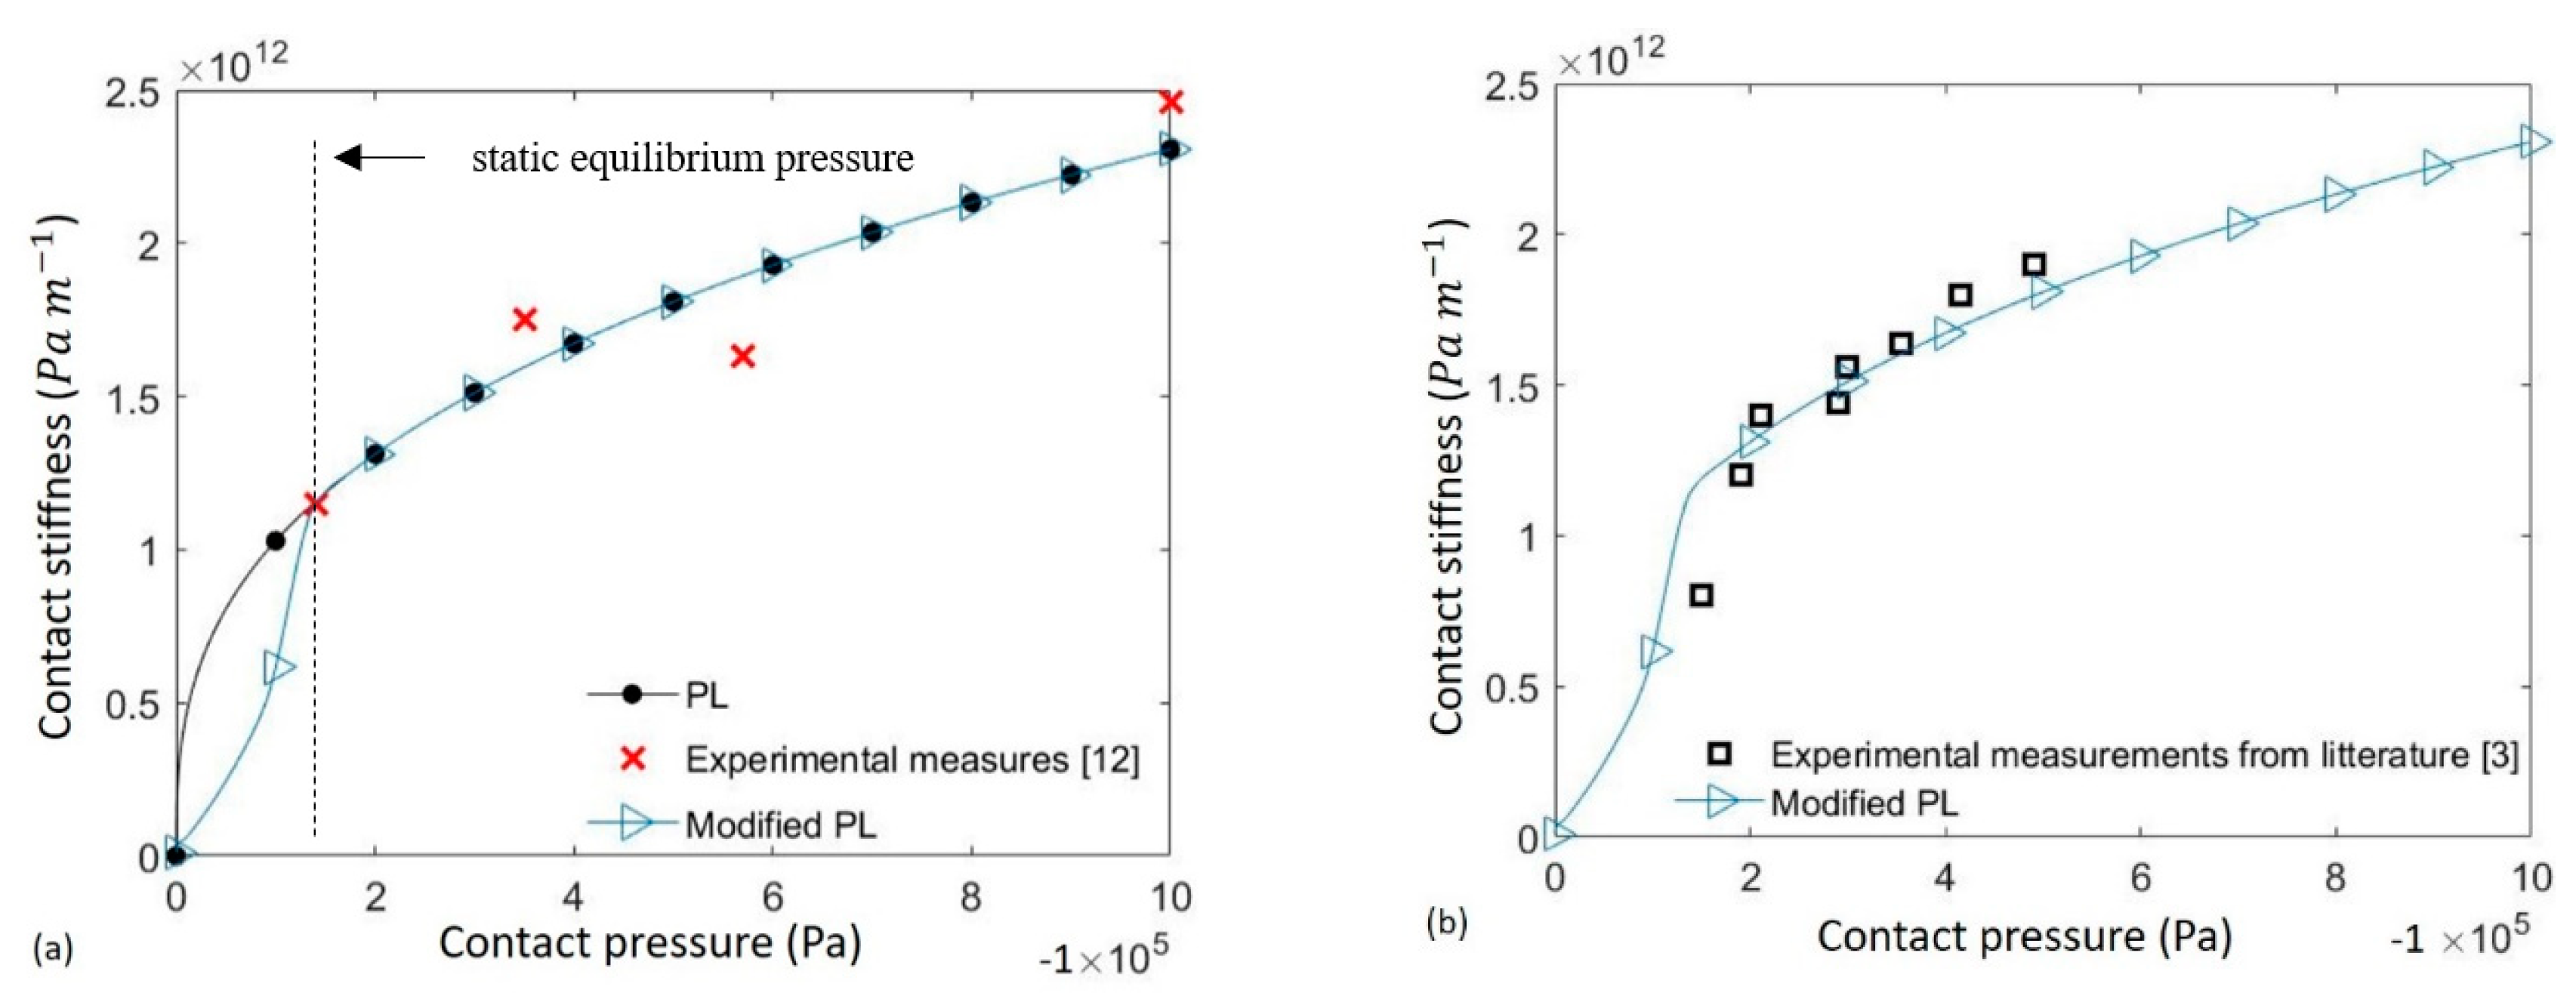
| Aluminium Ra = 1 μm | ||||
|---|---|---|---|---|
| Contact pressure [MPa] | P = 0.14 | P = 0.35 | P = 0.57 | P = 1 |
| Kc [Pa/m] | 1.15 × 10¹² | 1.75 × 10¹² | 1.63 × 10¹² | 2.46 × 10¹² |
© 2020 by the authors. Licensee MDPI, Basel, Switzerland. This article is an open access article distributed under the terms and conditions of the Creative Commons Attribution (CC BY) license (http://creativecommons.org/licenses/by/4.0/).
Share and Cite
Nouira, D.; Tonazzi, D.; Meziane, A.; Baillet, L.; Massi, F. Numerical and Experimental Analysis of Nonlinear Vibrational Response due to Pressure-Dependent Interface Stiffness. Lubricants 2020, 8, 73. https://0-doi-org.brum.beds.ac.uk/10.3390/lubricants8070073
Nouira D, Tonazzi D, Meziane A, Baillet L, Massi F. Numerical and Experimental Analysis of Nonlinear Vibrational Response due to Pressure-Dependent Interface Stiffness. Lubricants. 2020; 8(7):73. https://0-doi-org.brum.beds.ac.uk/10.3390/lubricants8070073
Chicago/Turabian StyleNouira, Dorra, Davide Tonazzi, Anissa Meziane, Laurent Baillet, and Francesco Massi. 2020. "Numerical and Experimental Analysis of Nonlinear Vibrational Response due to Pressure-Dependent Interface Stiffness" Lubricants 8, no. 7: 73. https://0-doi-org.brum.beds.ac.uk/10.3390/lubricants8070073