Testing Grease Consistency

Department of Mechanical and Industrial Engineering, Louisiana State University, Baton Rouge, LA 70803, USA
*
Author to whom correspondence should be addressed.
Lubricants 2021, 9(2), 14; https://0-doi-org.brum.beds.ac.uk/10.3390/lubricants9020014
Submission received: 5 January 2021
/
Revised: 27 January 2021
/
Accepted: 30 January 2021
/
Published: 2 February 2021
(This article belongs to the Special Issue Grease)
Abstract
:Because of the influential role of consistency in selecting a grease for a given application, accurate and meaningful methodologies for its measurements are vitally important. A new method, recently introduced, uses a rheometer to compress a grease sample to evaluate a relative consistency between a fresh and degraded grease; however, the results of this approach compared to a standard penetrometer and other methods of assessing consistency have not been studied. This paper takes a closer look at the relevant parameters involved in the rheometer penetration test and establishes a recommended procedure for its use. The consistency of various greases is then tested using this method and compared to results obtained from yield stress, crossover stress, and cone penetration tests. The results indicate that rheometer penetration may be used to assess the change in consistency for a given grease but should not be used to compare different greases. For this purpose, the crossover stress method is recommended, which is shown to correlate very well with cone penetration while using a simple procedure and allowing the use of a substantially smaller sample. A strong power law correlation between crossover stress and cone penetration was found for all greases tested and is presented in Figure 12.
1. Introduction
The consistency of a lubricating grease is often considered to be its most important rheological property. It generally dictates the suitability of a grease for a particular application. Consistency broadly refers to the firmness of a grease, indicating a grease’s ability to remain in place (resist leakage) within bearings and to form stable channels of lubricant [1]. These channels are important to the functionality of a bearing because they serve as reservoirs from which moving parts draw lubricating fluid over the operational lifetime of a machine [2]. Hence, consistency serves as an important metric for selecting a grease, and the capability to properly quantify this property is of great importance.
The main test to measure grease consistency is the cone penetration test given by ASTM D217 [3]. In this test, a cone is dropped into a grease sample for 5 s and the depth to which the cone penetrates is used as a measure of consistency. This test requires a large sample of grease—approximately 450 grams according to ASTM D217—so the alternative scaled-down tests given by ASTM D1403 [4] are able to provide penetration results with smaller samples. The penetration depth obtained from any of these tests is usually used to assign a grade to a grease for succinctly characterizing its nature to a broad market of consumers.
Using specialized equipment such as a rheometer is becoming increasingly popular for assessing the rheological properties of grease. This apparatus requires a very small sample—less than two grams—and provides quantitative results that can assess grease consistency. It is perhaps even more precise than the cone test with the advantage of requiring a simpler operational procedure while allowing for temperature control. These tests are often used to evaluate a “critical” stress but have also been used as a way of conducting a penetration test [5,6]. The methodology of conducting a penetration test is quite simple, whereas the calculation of critical stresses demands an understanding of viscoelasticity.
A viscoelastic material is one that has properties of both a liquid and a solid. Grease, for instance, can be considered a viscoelastic solid material since it behaves as a solid unless sheared. Once sheared past a critical point, it begins to flow. The quantification of this state is of great interest for characterizing a substance, but the exact definition of this state has been a subject of debate for years [7]. In addition to having different definitions, there are various methods for evaluating this state, including the use of steady flow curves, creep measurements, stress ramps, stress sweeps, and oscillatory tests [8,9]. Nevertheless, in the context of lubricating grease, two distinct points found through oscillatory tests—the yield point and flow point—have come to be popular choices for characterizing a grease.
Oscillatory rheometry involves the analysis of viscoelastic materials by monitoring their stress response to oscillating strain (or vice-versa). The solid-like behavior is characterized by the storage modulus, which describes the ability of a material to store energy through elastic deformation and is in phase with the oscillating input. Alternatively, the liquid-like behavior is characterized by the loss modulus, which describes the ability of a material to lose energy through viscous dissipation and is out of phase with the input. These two parameters both change as the state of stress within material changes, so imposing an increasing stress or strain amplitude (often called an amplitude sweep) in an oscillatory test is often an ideal way of examining viscoelastic behavior. Results of an amplitude sweep can then be used to calculate the yield point and/or flow point.
The yield point, characterized by the yield stress, is considered by many to be the end of the linear viscoelastic range at which the structure begins to be considered damaged. One choice is to define the linear viscoelastic range as the region where the storage modulus is independent of strain. Another choice is to use the end of stress-strain linearity [10] as the yield stress. Due to the recent popularity of the second choice in analyzing grease [9,10,11,12,13,14], it will be used as the definition of yield stress throughout this paper.
The flow point, characterized by the crossover stress, is the point at which the storage modulus and loss modulus cross over each other. Upon commencing an amplitude sweep, the storage modulus will quickly reach a plateau value, but eventually start decreasing. The flow point will be considered the point where the storage modulus decreases enough to cross over the loss modulus, temporarily signifying a material with properties more closely resembling a liquid than a solid. Both this point and the yield point are indications of how “solid” a given material is and are considered properties akin to consistency.
Over time, overall grease consistency can permanently change due to the shear irreversibly breaking the structure, due to oil bleed, leakage, and evaporation, due to contamination, and due to chemical reactions [15]. This change in consistency has been used to track the degree of degradation a grease has undergone [5,16,17]. A sampling of in-service grease in conjunction with a degradation model can be used to estimate the remaining useful life. However, the cone penetration tests given by ASTM D217 and ASTM D1403 require a larger sample of grease than is used for many applications. This means the consistency of an in-service grease cannot be measured with these methods. Therefore, it is advantageous to have alternative consistency tests that allow the use of a small sample of grease. One such test intended for field use is provided in a test kit given by the bearing manufacturer SKF, but the resolution of the results is limited to the grade. Therefore, rheometer tests allowing more precise results and temperature control using a very small sample have a significant value. A closer examination of these tests is the main focus of this paper.
This paper examines common consistency tests in Section 2, takes a closer look at a proposed method for assessing consistency through a rheometer penetration test in Section 3, compares results of these tests to each other in Section 4, presents a discussion of results in Section 5, and gives concluding remarks in Section 6.
2. Examination of Consistency Tests
The most common tests of grease consistency will be overviewed and a discussion of each is provided.
2.1. Cone Penetration Test
The accepted method for testing grease consistency is the cone penetration test given by ASTM D217 [3]. In this test, a cone is dropped into a cup of grease and the depth of penetration is used as a measurement of consistency. This value of penetration is used to assign a grade to a grease from 000 to 6. The National Lubricating Grease Institute (NLGI) defines the ranges of penetration corresponding to the grade as given in Table 1. The values of penetration are given in tenths of a millimeter, often called decimillimeters and abbreviated as dmm.
The grades in this scale are defined so that they span 30 dmm and have gaps of 15 dmm between grades. This leads to some ambiguity in labeling a grease, where many choose to assign half grades. For instance, some would choose to assign a grade of 2.5 to a grease with a worked penetration of 260 dmm.
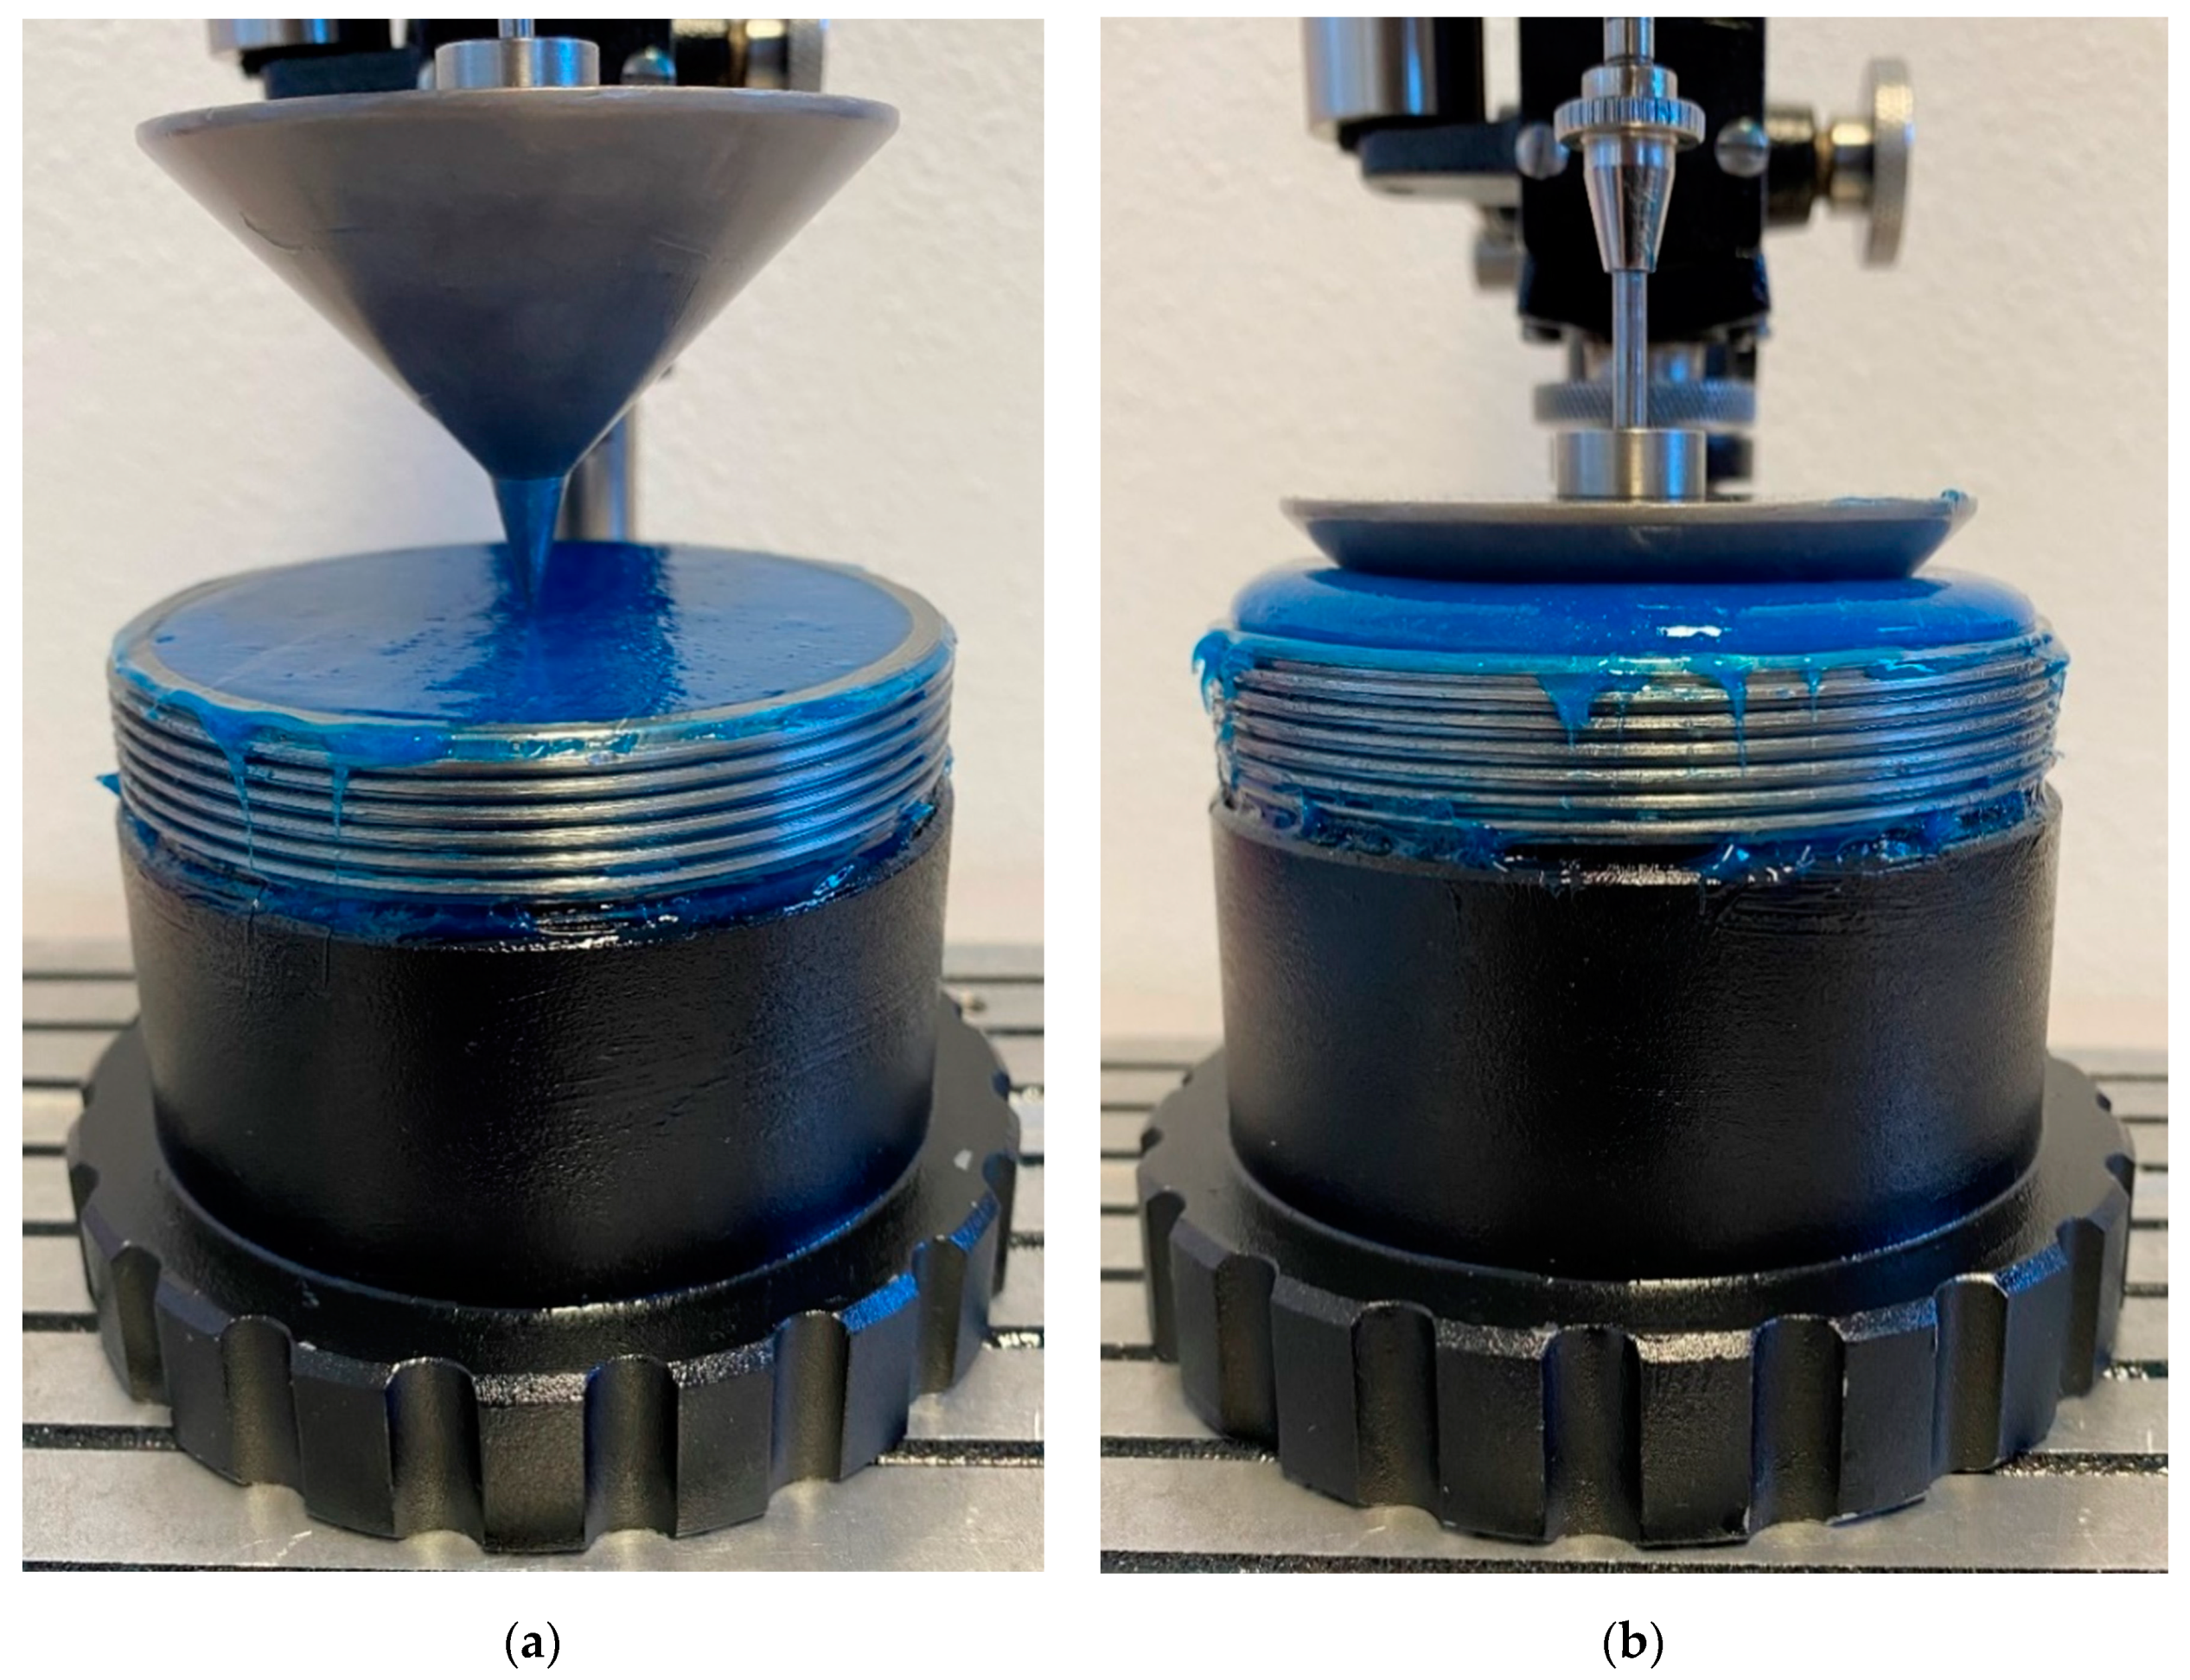
As the cone penetrates deeper into the grease sample, grease begins to lift out of the cup as is demonstrated in Figure 1. As penetration increases, this geometry-dependent behavior begins to influence penetration readings. ASTM D217 indicates that the penetration for soft greases is a function of cup diameter if its penetration is above 265 dmm. However, the grease eventually reaches a point where the complicated nature of the squeezing of grease between the cone and the lip of the cup becomes even more of a determinant of the final penetration value. To account for this, the standard mandates that the cone be perfectly centered when the penetration reading is above 400 dmm.
Not only does the cone penetration test require a substantial quantity of grease, it also demands a skilled operator in order to obtain consistent results. A significant source of error in this test is the presence of pockets of air within the grease sample. This is particularly relevant for measuring the unworked penetration of a grease sample, as loading the sample into the grease cup can easily form large pockets of air. Therefore, having an unskilled operator can cause inconsistent measurements of consistency using the cone penetration method.
2.2. Rheometer Oscillatory Tests
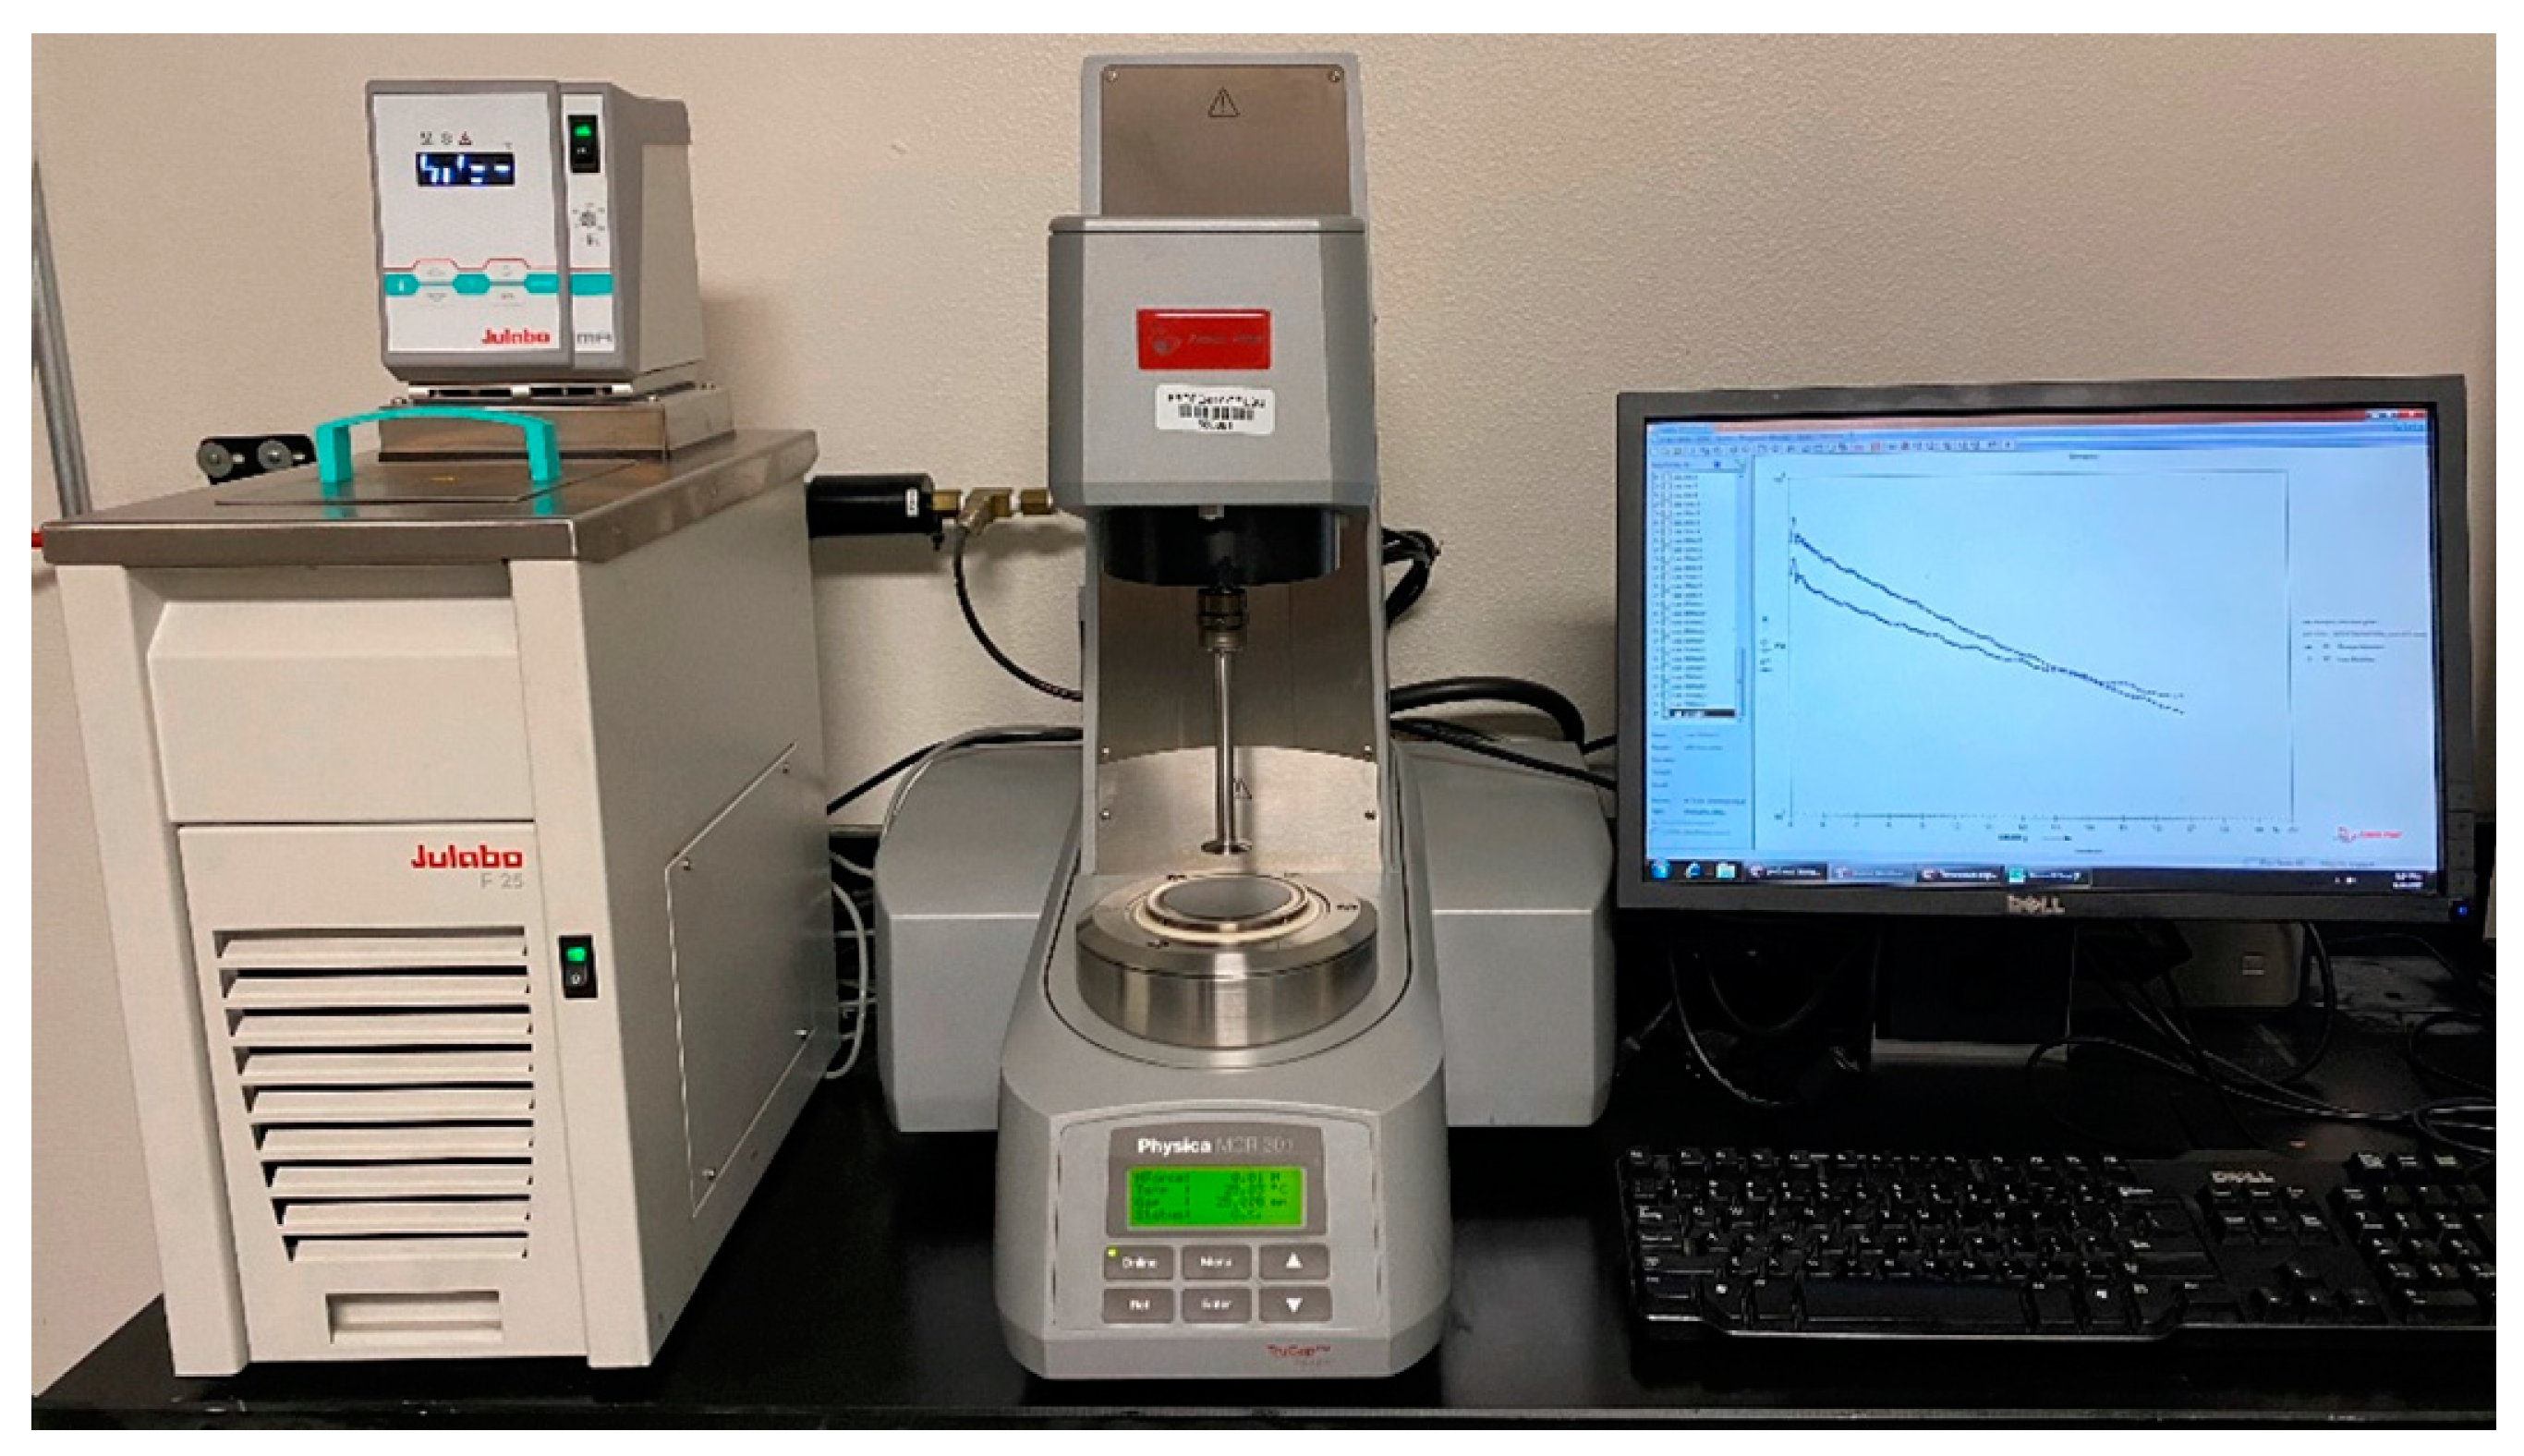
A rheometer—such as the one pictured in Figure 2—has the capacity to perform numerous useful tests to analyze viscoelastic materials. Through oscillatory strain sweep measurements, properties of viscoelastic materials can be found without potential errors from sample fracturing [19] and with minimal sensitivity to gap height and plate roughness [9,10,20]. Two parameters will be investigated here: the yield point—corresponding with the yield stress—and the flow point—corresponding with the crossover stress. The definition set forth by Cyriac et al. [10] will be used for yield stress, where the end of stress-strain linearity measured from an oscillatory amplitude sweep is considered the yield point. For the crossover stress, the first point at which the storage modulus and loss modulus reach the same value will be considered the definition.
When performing these tests, there are many choices for geometry, but parallel-plate geometry is perhaps the most common. In addition, there are many choices of plate diameters, but 25 mm and 50 mm are among the most common. For rheological measurements, a smaller diameter will measure higher stresses than a larger diameter if all other variables are held constant. Therefore, the results obtained from different plate diameters cannot be reliably compared. Nevertheless, a smaller diameter is generally advantageous because it is easier to load the sample, and only a small quantity of the sample is needed despite having slightly reduced testing precision.
Another important consideration for rheometer tests is the sample loading procedure. In fact, different methods of loading a sample can cause errors of up to 30% in some cases [21]. The typical procedure is to apply a sample to the lower and/or upper plate and then lower the top plate to a gap slightly larger than the measurement gap. At this point, a tool is used to clear (trim) all the sample that is not directly between the plates. The top plate is then lowered to the measurement gap and the measurement is performed. A standard procedure is to trim the sample at a gap 5% greater than the measurement gap, but trimming the sample at 2.5% above the measurement gap is also reasonable.
Another consideration is the state of stress within the sample as it is being measured. Upon lowering the top plate, there can be a large resistive force acting on the top plate due to the compression of the sample. This effect is especially pronounced when using a plate with a large diameter. This is generally dealt with in one of three ways: waiting for the sample to relax (relaxation), shearing the sample a small amount (pre-shear), or doing nothing and immediately commencing measurement. For many measurements, this choice is inconsequential. However, in some cases, this can have a significant effect, and this is explored in Section 3 and Section 4.
Overall, performing these measurements requires an operator to learn how to use a rheometer, but the actual treatment of a sample is quite straightforward and far less prone to operator error than the cone penetration test.
2.3. Alternative Penetration Tests
Though the cone penetration tests given by ASTM D217 and ASTM D1403 are the officially recognized penetration tests, there are other penetration tests that can possibly be used to assess grease consistency. Two of the most prominent include the consistency test found within the SKF grease test kit [22] and the rheometer penetration test.
The consistency test provided in the SKF grease test kit is intended for the in-service sampling of grease and needs only a very small sample. This consistency test is an example of a constant-volume squeeze flow [23]. It is done by first applying a cylindrical-shaped sample of grease to a glass plate using a jig. Then, another glass plate is carefully placed above this one and a weight is put atop it. The weight is allowed to cause the grease to spread between the plates for 15 s and the final diameter of the sample is compared to rings on a sheet of paper to determine consistency. This only has the resolution to determine the NLGI grade and relies on the final sample shape being close to circular. In practice, a used grease sample may be quite nonhomogeneous and contaminated, leading to a non-circular spread, which will add difficulty to determining the result.
3. Details of Rheometer Penetration Test
The geometry given by the rheometer penetration test is an example of “imperfect squeeze flow” [23,24], with the geometry having neither a constant area nor constant volume. In this configuration, there is a complicated variable pressure imposed by the fluid squeezed as the gap closes [23]. This leads to some difficulty in deriving analytical equations describing the relationships among parameters, such as displacement, force, area, and velocity. Therefore, these parameters were investigated empirically.
Many variables were identified for the rheometer penetration test, including sample preparation, gap height, penetration time, and normal force imposed. Similar to the oscillatory tests done in a rheometer, the test geometry and sample preparation are key variables that must be arbitrarily chosen. For the same reasons as in the oscillatory tests, it appears that the 25 mm diameter plate configuration is a good choice, and this was used in the previous works mentioned.
All rheometer experiments were conducted using an Anton Paar MCR 301 rheometer at room temperature. Each sample was measured three times and the average value is presented with error bars corresponding to one standard deviation. In most cases, the standard deviation is quite low and error bars are not visible. An overview of the greases used in the experiments is provided in Table 2.
In choosing the gap height, the main constraint is that the ratio of the plate’s radius to gap height should be greater than or equal to 10 to avoid edge effects [25]. The selection of the plate diameter is another important parameter, as results of similar experimentation [24] indicate that there is a complicated dependency of rheological measurements on plate geometry. For these measurements, a 25 mm diameter top plate was selected. This is a common size and can allow for using a small sample of grease while allowing a reasonable gap. In order to satisfy the radius-gap constraint given above for a 25 mm diameter, the gap must be below 1.25 mm. Hence, a 1 mm gap was chosen for the experiments reported in this paper.
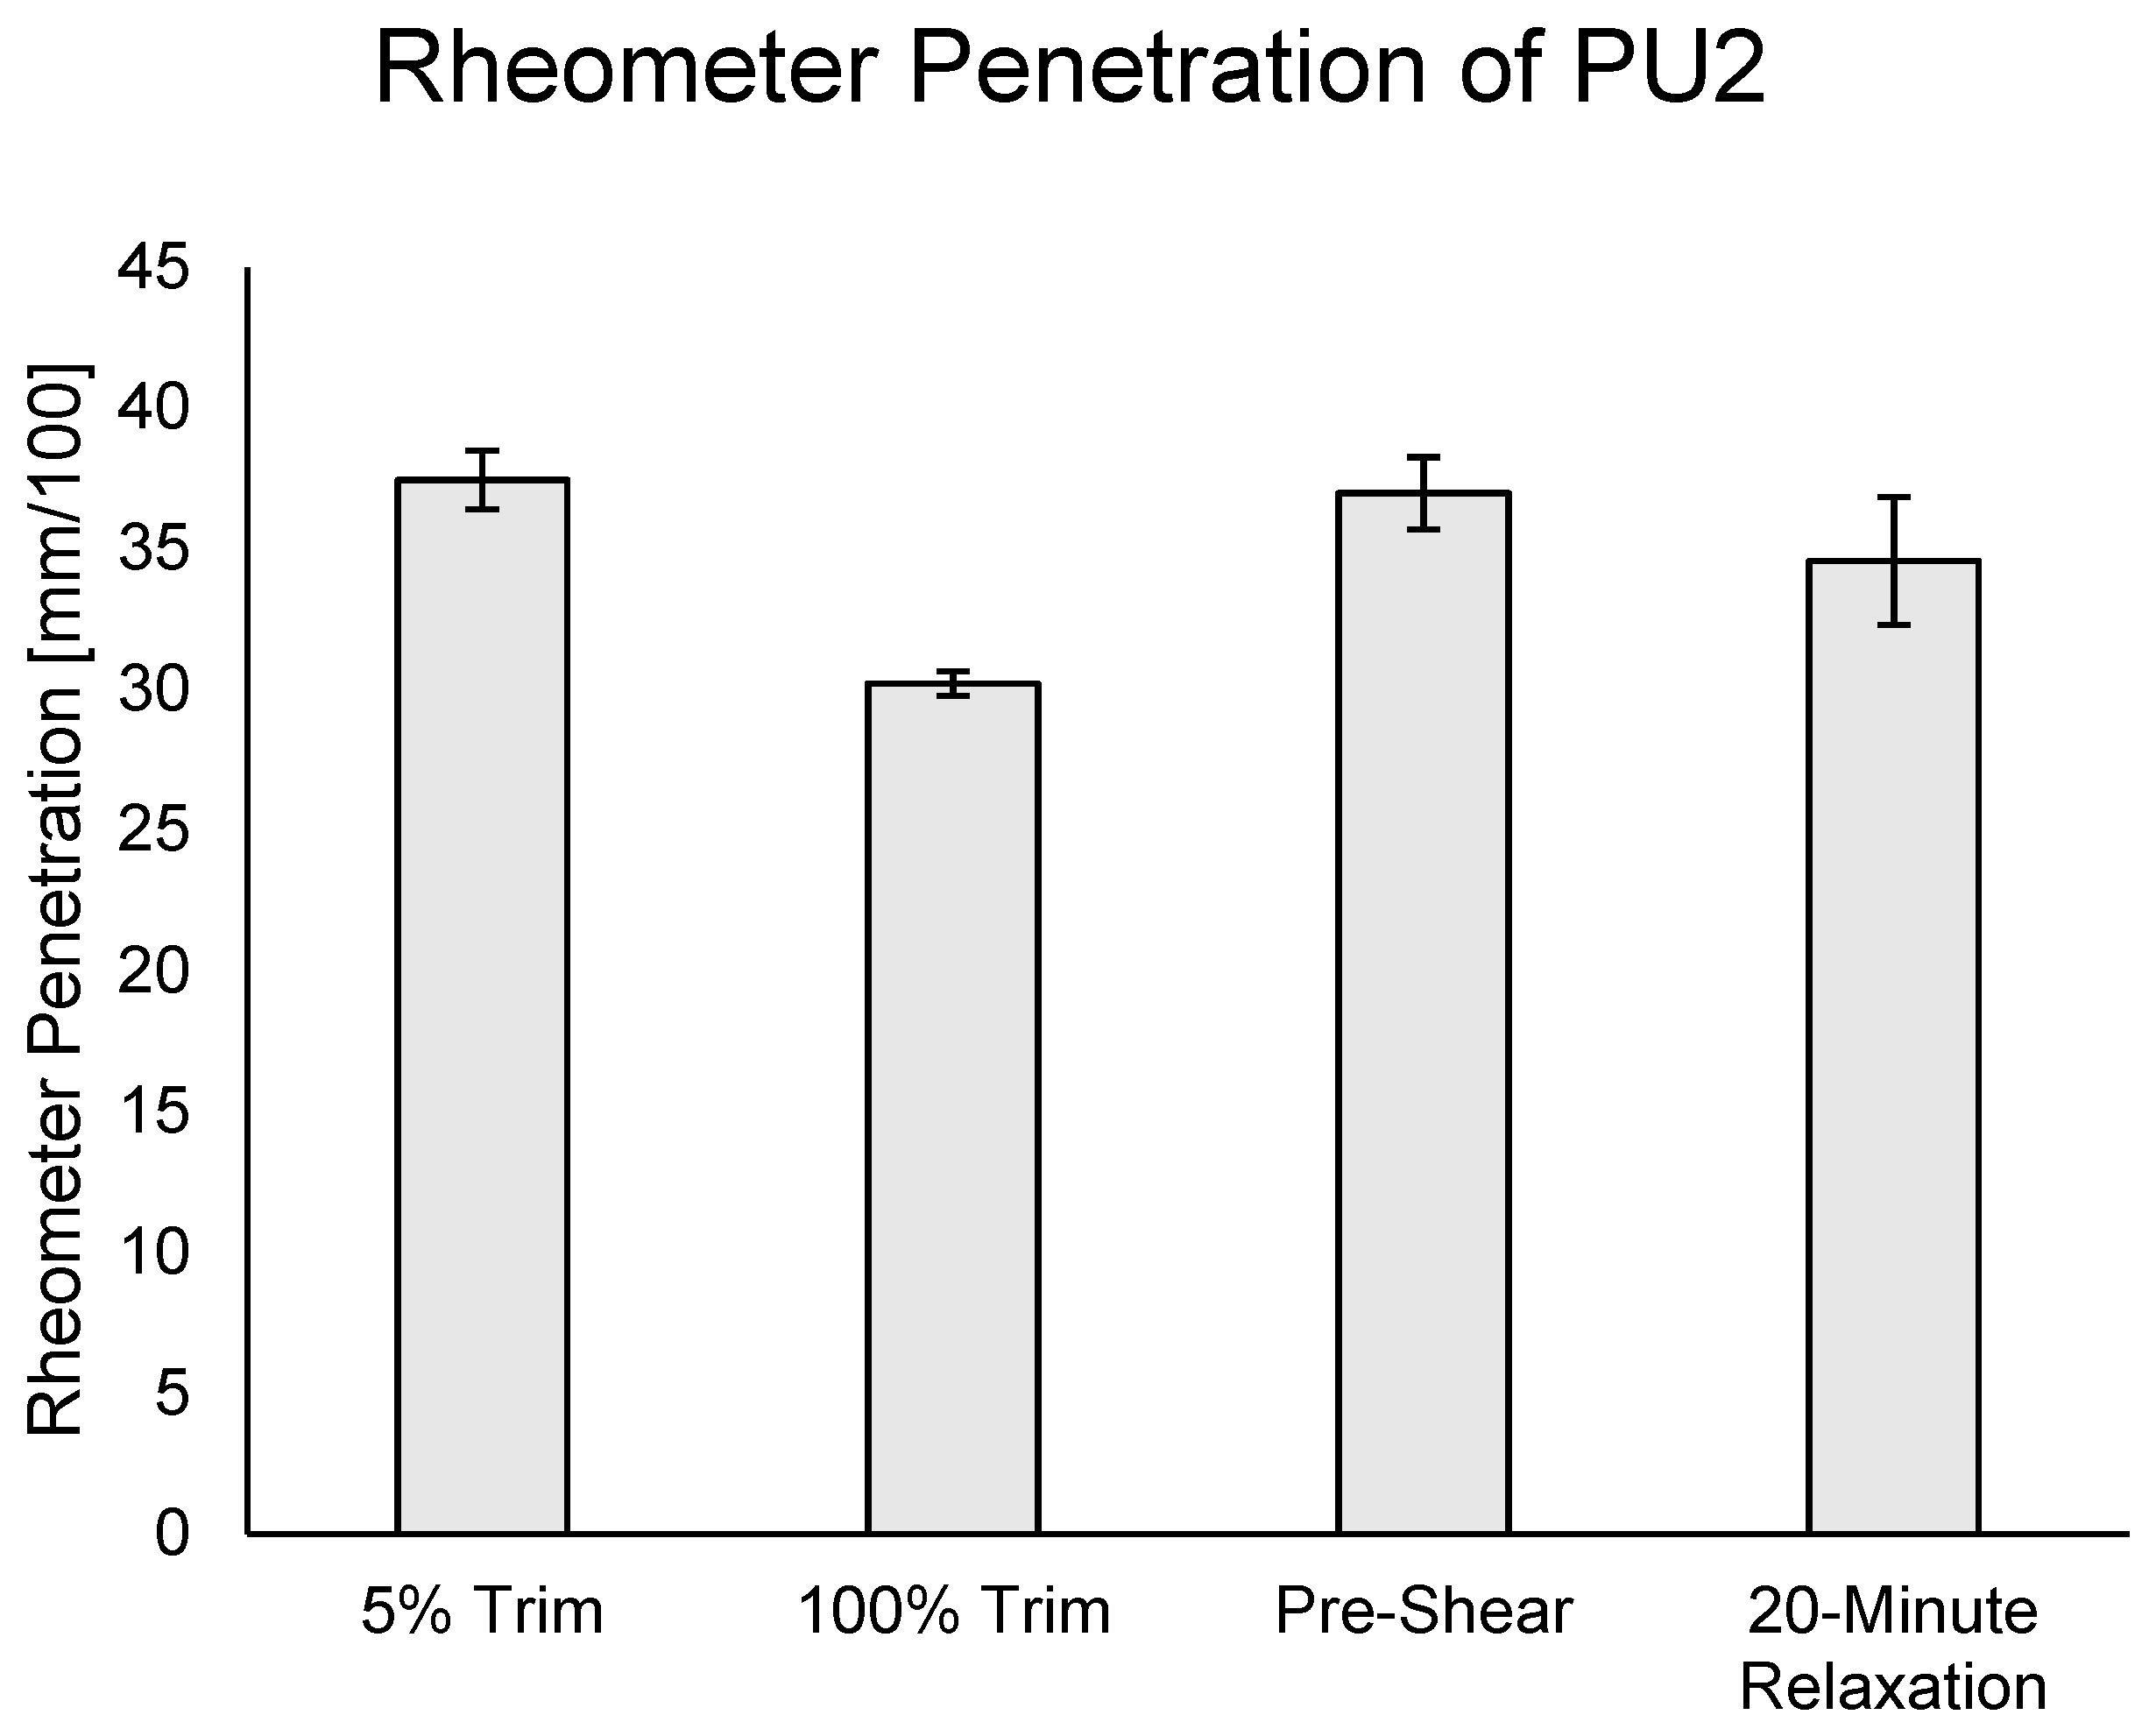
The next thing to be examined is sample preparation. Measurements of the same sample were taken using a standard 5% trim with no pre-shear, a 100% trim without pre-shear, a 5% trim with pre-shear, and a 5% trim with a 20-min relaxation period. Using a 5% trim without pre-shear or a relaxation period means that the top plate is initially lowered to a height 5% above the measurement gap where the sample is trimmed before lowering the top plate to the measurement gap and immediately commencing the measurement. Using a 100% trim means the top plate is initially lowered to twice the measurement gap where the sample is trimmed before lowering the plate and immediately commencing measurement. The 5% trim with pre-shear means the sample was trimmed at 5% above the measurement gap but after the plate was lowered to the measurement gap, a shear rate of 5 s−1 was induced for 5 s before commencing measurement. Finally, the 5% trim with relaxation period means that after trimming the sample at 5% above the measurement gap, the top plate is lowered to the measurement gap and a pause of 20 min is taken before commencing measurement.
Results of the sample preparation investigation are displayed in Figure 3 and show that using pre-shear does not appear to influence the result when compared to the 5% trim. Allowing the sample to relax for 20 min before subjecting it to penetration appeared to slightly decrease the penetration, but also led to a higher standard deviation in this case. Adding 20 min to a 20 s test is also impractical. Nevertheless, the method with the lowest standard deviation of results is the case of the overfilled gap, where the sample was trimmed at 2 mm and immediately subjected to penetration. This method yielded a consistently lower penetration when compared to the 5% trim, which is an expected result when considering the nature of squeezing flow. The repeatability of this method led to its implementation in subsequent measurements.
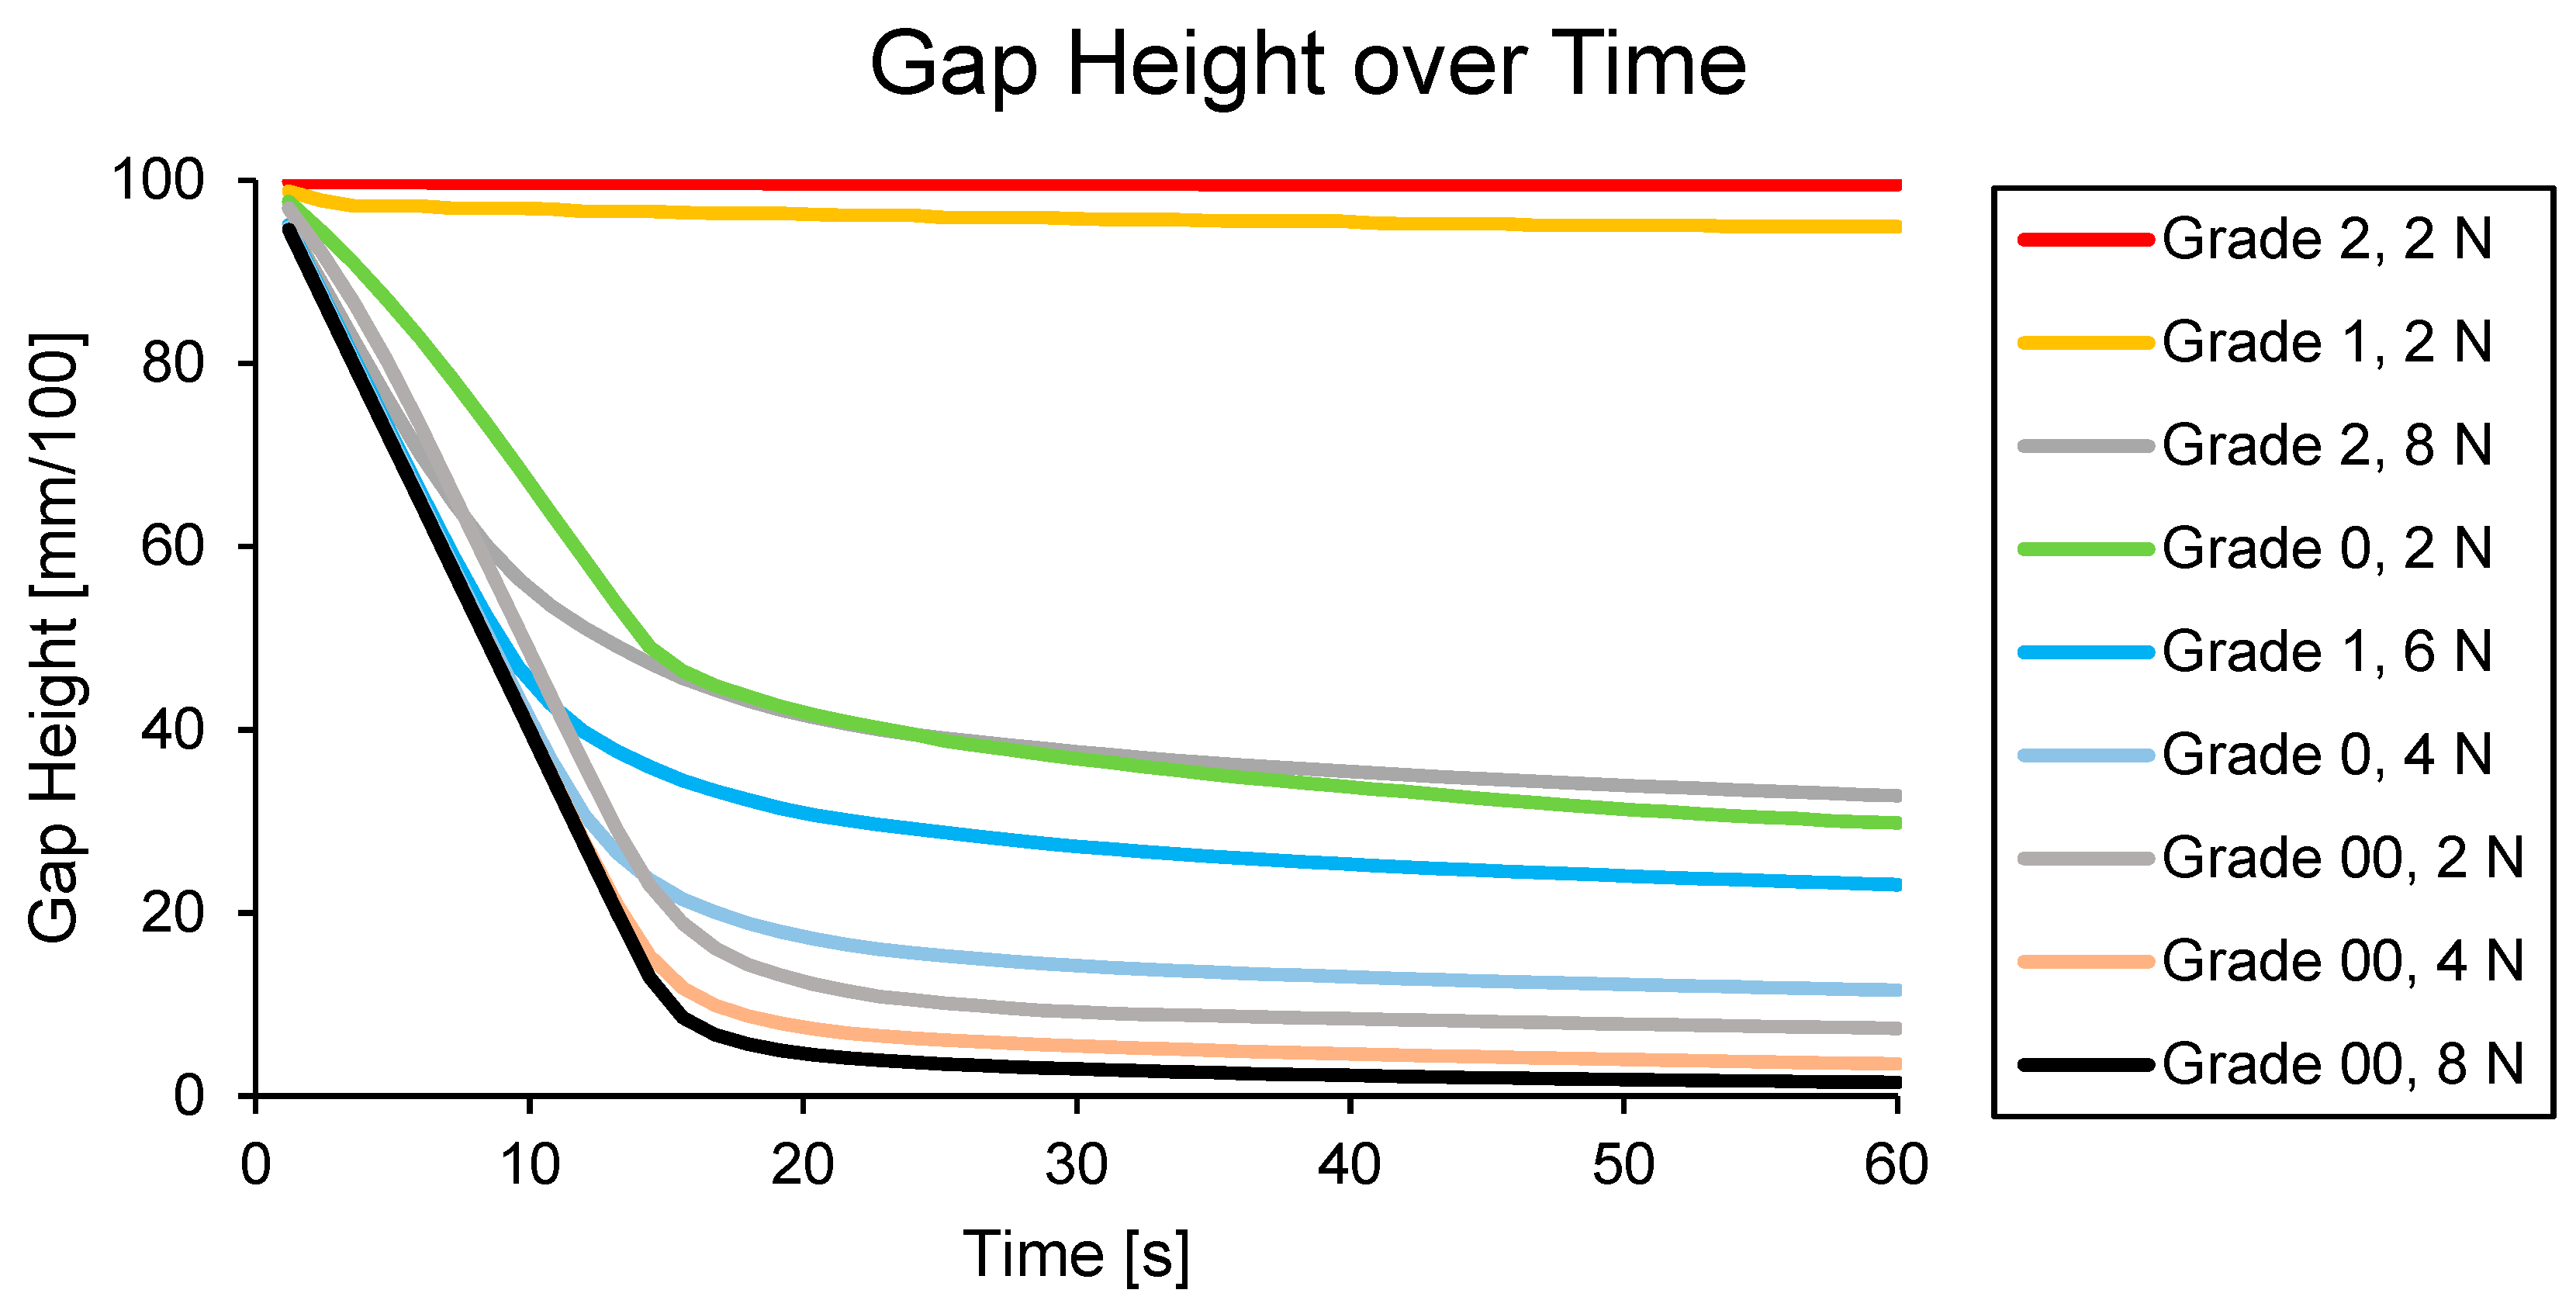
To select an appropriate penetration time, one must examine the penetration as a function of time. Figure 4 examines the gap height over time as a constant normal force is imposed on grease samples. This figure considers a range of forces between 2 N and 8 N and uses greases ranging from grade 00 to grade 2. For some grease types, a low normal force will cause the plate to barely move or, in some cases, not move at all. In cases where the top plate moves, the initial velocity (slope of this plot) is approximately the same but begins to level off as the plate nears a steady state. Because of this, it takes longer for the top plate to reach a steady state when the plate must travel a longer distance. Nevertheless, for all cases, it appears that 20 s is sufficient, confirming the results of a previous study [6]. Therefore, 20 s was used for all subsequent measurements.
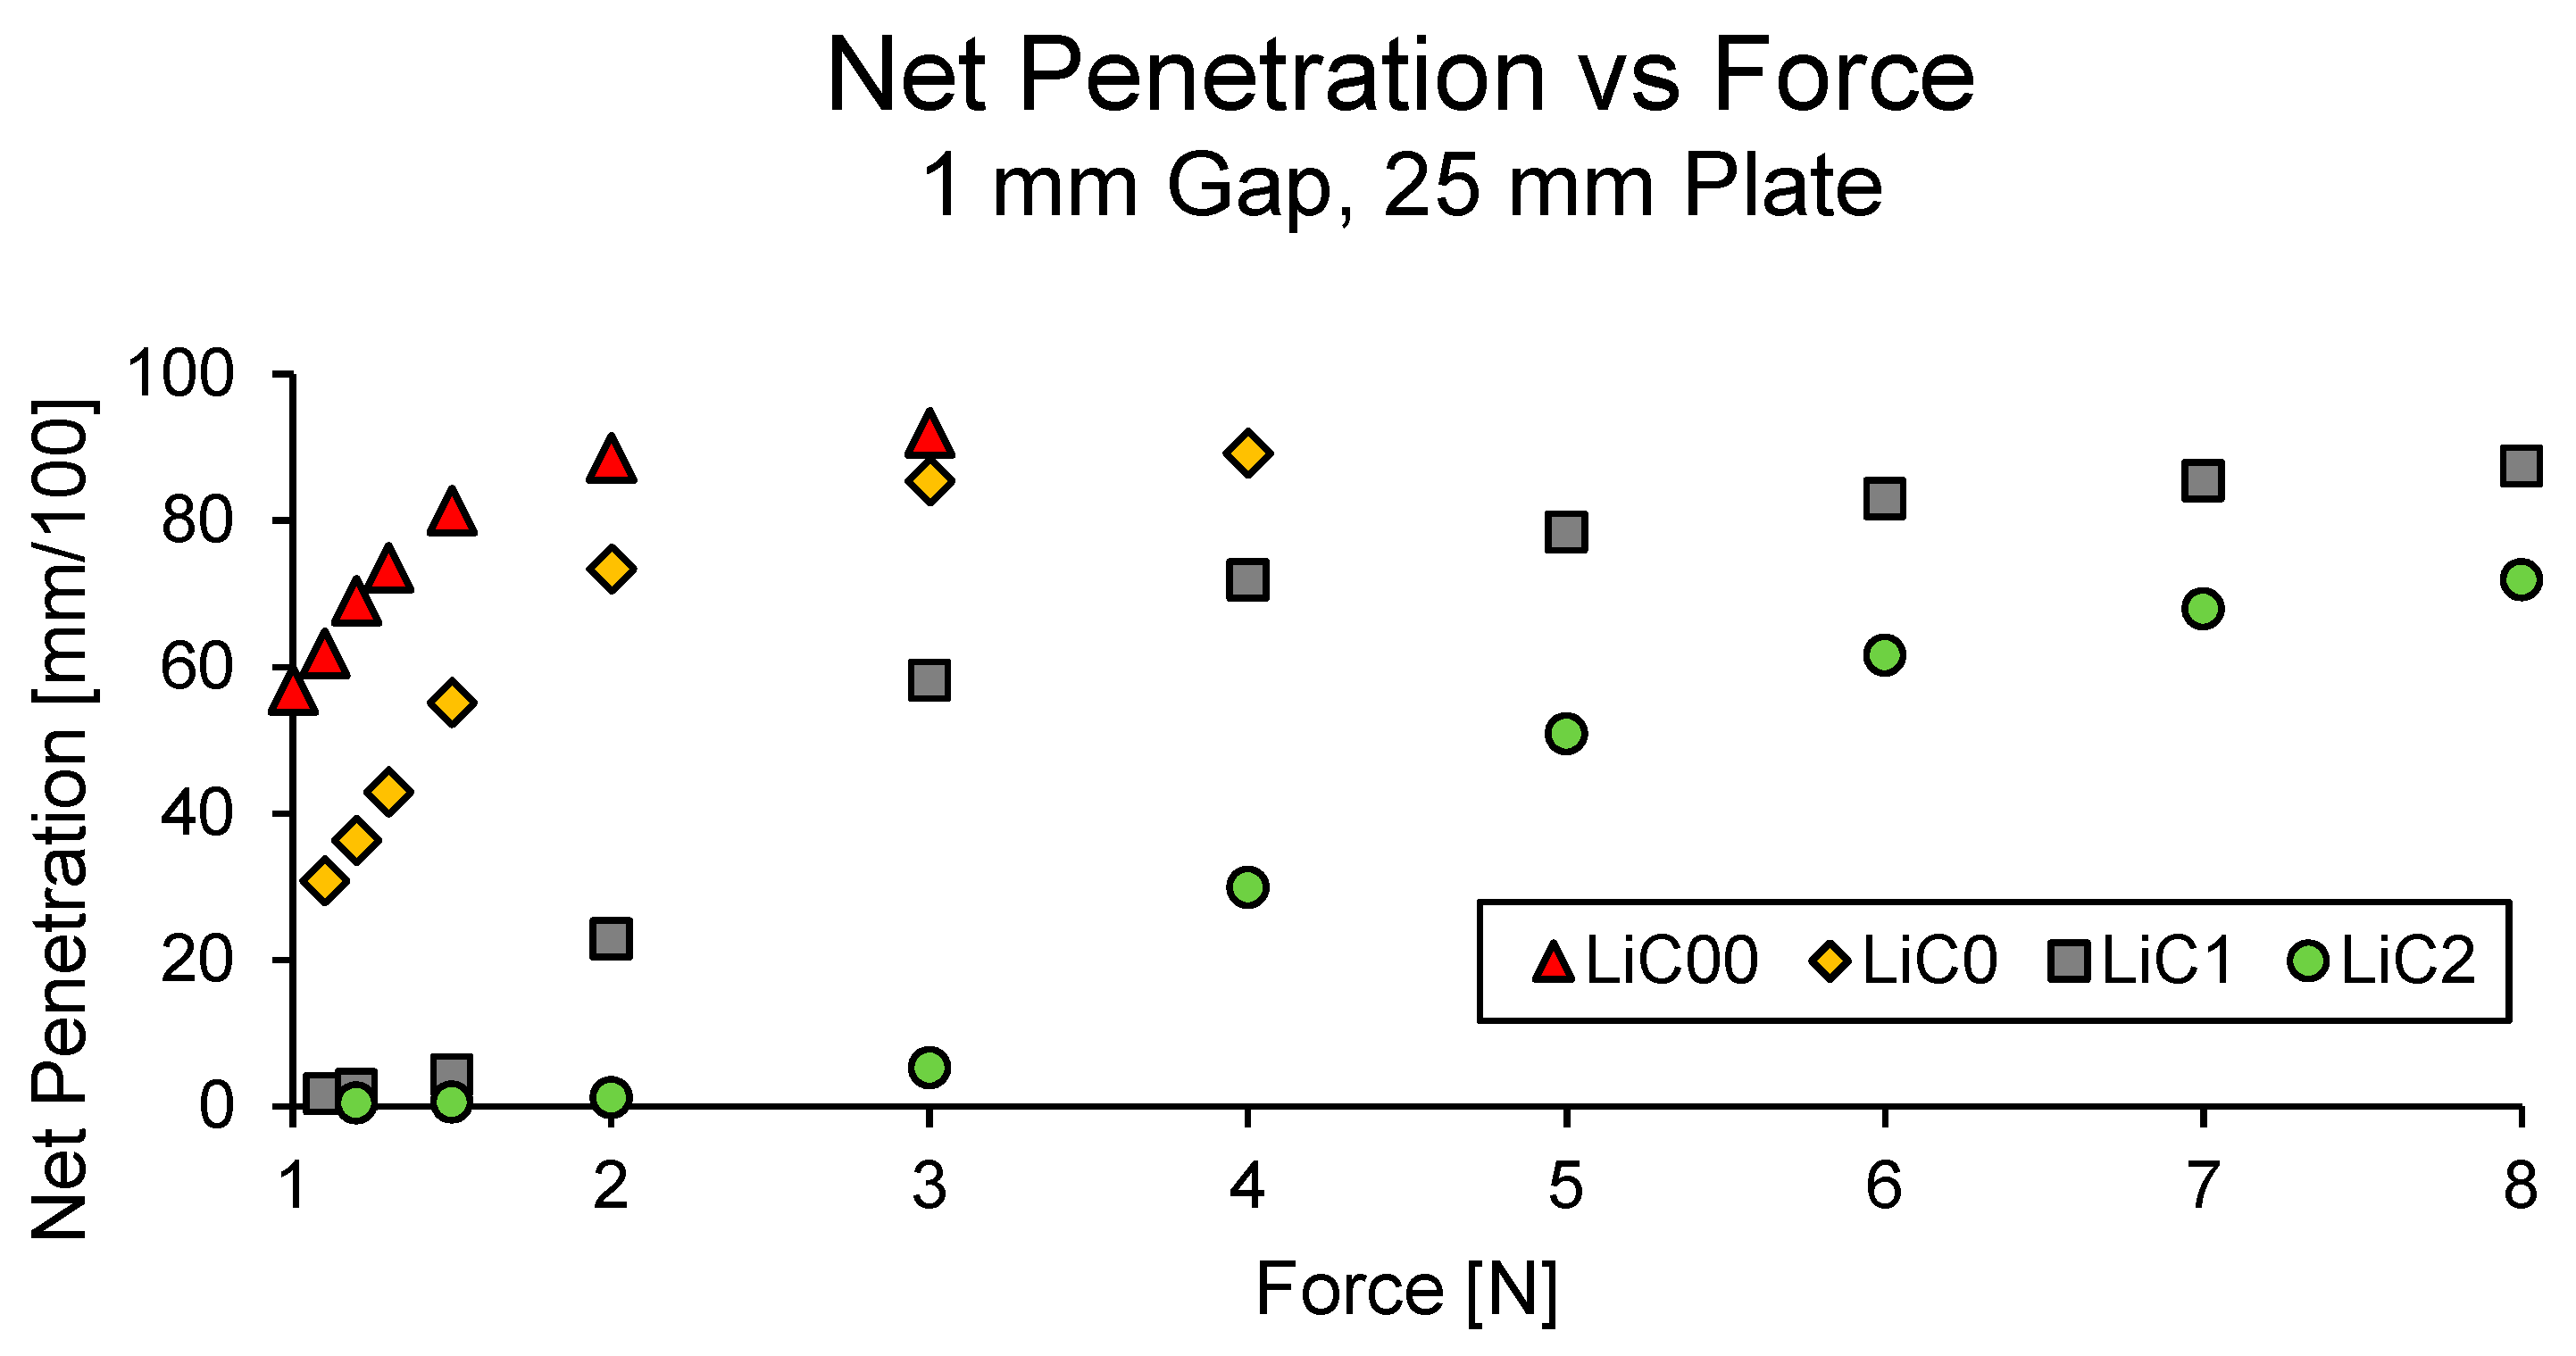
The next thing to look at is how penetration is affected by changing the normal force. For this examination and all future rheometer penetration test results, data will be presented as net penetration to provide a similar meaning as cone penetration. This will be defined as the final gap height subtracted from the initial gap height. In this way, the higher the penetration, the less firm a given grease is. In addition, the units of mm are converted to mm/100, which also corresponds to the percentage of the initial gap.
Figure 5 shows that there is a clearly nonlinear trend relating net penetration and normal force for a given grease sample. It is possible to separate the trend into three regions: a region where the force is too low, a region where the force is too high, and a region in the middle where the force is appropriate for measuring consistency. For greases below grade 1, the first region is not visible on the plot because imposing a force of less than 1 N using the rheometer often led to no movement. A force of 1.2 N would work well to determine the consistency of a grade 00 or grade 0 grease. However, it would not be able to determine any significant difference between grade 1 and grade 2 grease. Similarly, a force of 4 N would work well for a grade 1 or grade 2 grease but would not be useful for any grease below grade 1. Generally, the goal of testing greases with the rheometer penetration method is to keep results within the middle region. This means that the rheometer penetration test needs to vary the force according to the consistency of the grease chosen in order to keep results within the region of approximately between 15 mm/100 and 80 mm/100. Unfortunately, this means that if the rheometer penetration results are to be correlated with other tests, each normal force must be considered individually.
The final procedure developed for assessing the consistency of a grease using the rheometer penetration test involves first applying the sample to the base plate and/or upper plate of the rheometer. The top plate is then lowered to 2 mm where the sample is trimmed, and then lowered to the measurement gap of 1 mm. The desired normal force is imposed for 20 s, and the difference between the initial and final value is reported as the net penetration value. If the net penetration is not between 15 mm/100 and 80 mm/100, then the force should be changed.
4. Comparison of Tests
The procedure developed for testing grease consistency using a rheometer penetration test will now be compared with the cone penetration test, yield stress measurements, and crossover stress measurements to observe correlations among these tests at room temperature.
4.1. Materials and Procedures
In order to test as wide a range of consistencies as possible and to obtain various intermediate consistencies, greases (given in Table 2) were sheared for various intervals in a standard grease worker specified by ASTM D217. For many of the greases, such as PU2 and AlC2.1, this led to considerable changes in consistency. However, some of the other grease types, such as all the lithium complex greases tested, showed a minimal change in consistency from the mechanical shear of the grease worker. In order to obtain an even wider array of consistencies, the lithium complex greases were mixed together in various ratios and the calcium sulfonate grease was contaminated with small amounts of water (under 10 percent by weight). The procedure for mixing involves placing the desired ratio of materials together in the grease worker and working for a minimum of 500 strokes. Overall, the exact proportions of greases, the exact concentration of water, and the exact number of strokes are not relevant to this investigation. This study is exclusively focused on examining the similarities and differences among the various consistency tests using the same sample in each.
Unless indicated otherwise, all results of oscillatory tests (calculation of yield stress and crossover stress) were conducted using a 25 mm flat plate with a 1 mm gap at 1 Hz with no relaxation or pre-shear. These tests, as well as cone penetration measurements and rheometer penetration measurements, were done three times, and the average value is presented.
4.2. Identifying Variables
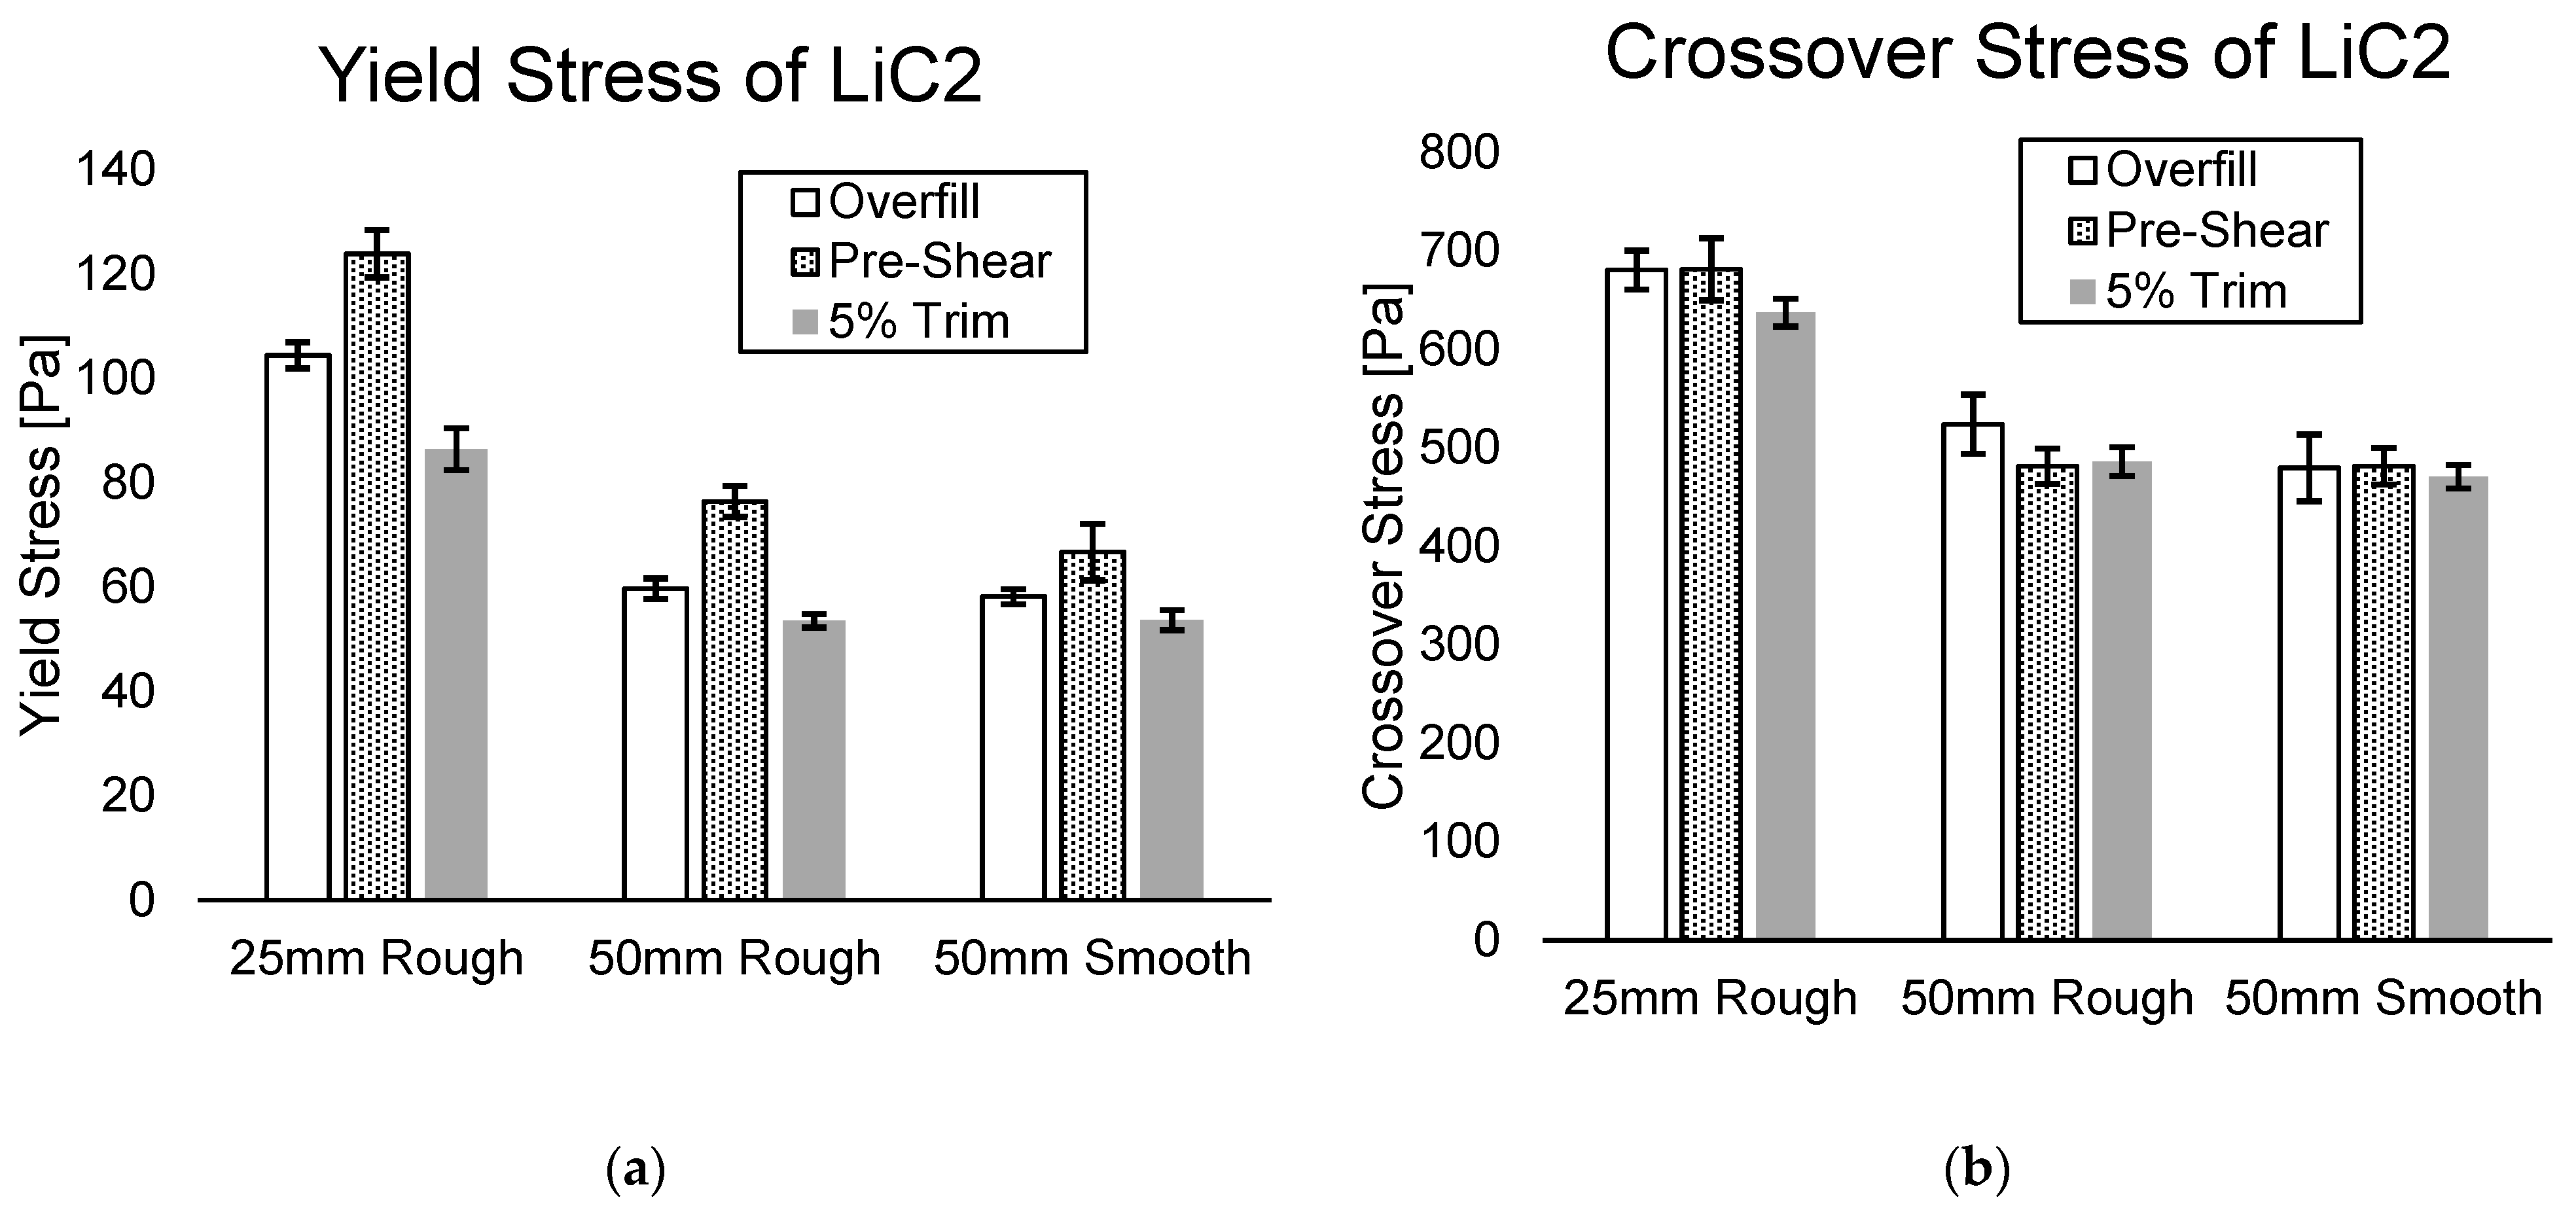
A further investigation of variables was conducted for the oscillatory tests. These tests calculated the yield stress and crossover stress of one particular sample but assessed the influence of plate size, plate roughness, overfilling the gap, and pre-shearing the sample. The results are summarized in Figure 6.
The results based on plate properties indicate that, as expected, the smaller plate measured a higher yield stress and crossover stress than the larger plates. In addition, it appears that the surface roughness of the plate does not cause a significant difference in the results. This is also expected, as one of the advantages of oscillatory rheometry is the minimal sensitivity to plate roughness.
A pre-shear of 5 s−1 for 5 s prior to measuring the critical stresses was done to intensify the effects of sample manipulation during testing and assess the sensitivity of the test to initial conditions. This investigation revealed that pre-shear had a significant effect on calculating yield stress but had a small effect on calculating crossover stress. Due to the relatively large standard deviation observed when using pre-shear, it was not used for subsequent tests.
Overfilling of the sample with a 100% trim was found to significantly affect results for both yield stress and crossover stress. In addition to overestimating both stresses, a higher standard deviation was noticed for results obtained using an overfilled gap. Therefore, care was taken to cleanly trim every sample at 5% above the measurement gap.
4.3. Rheometer Penetration Test Results
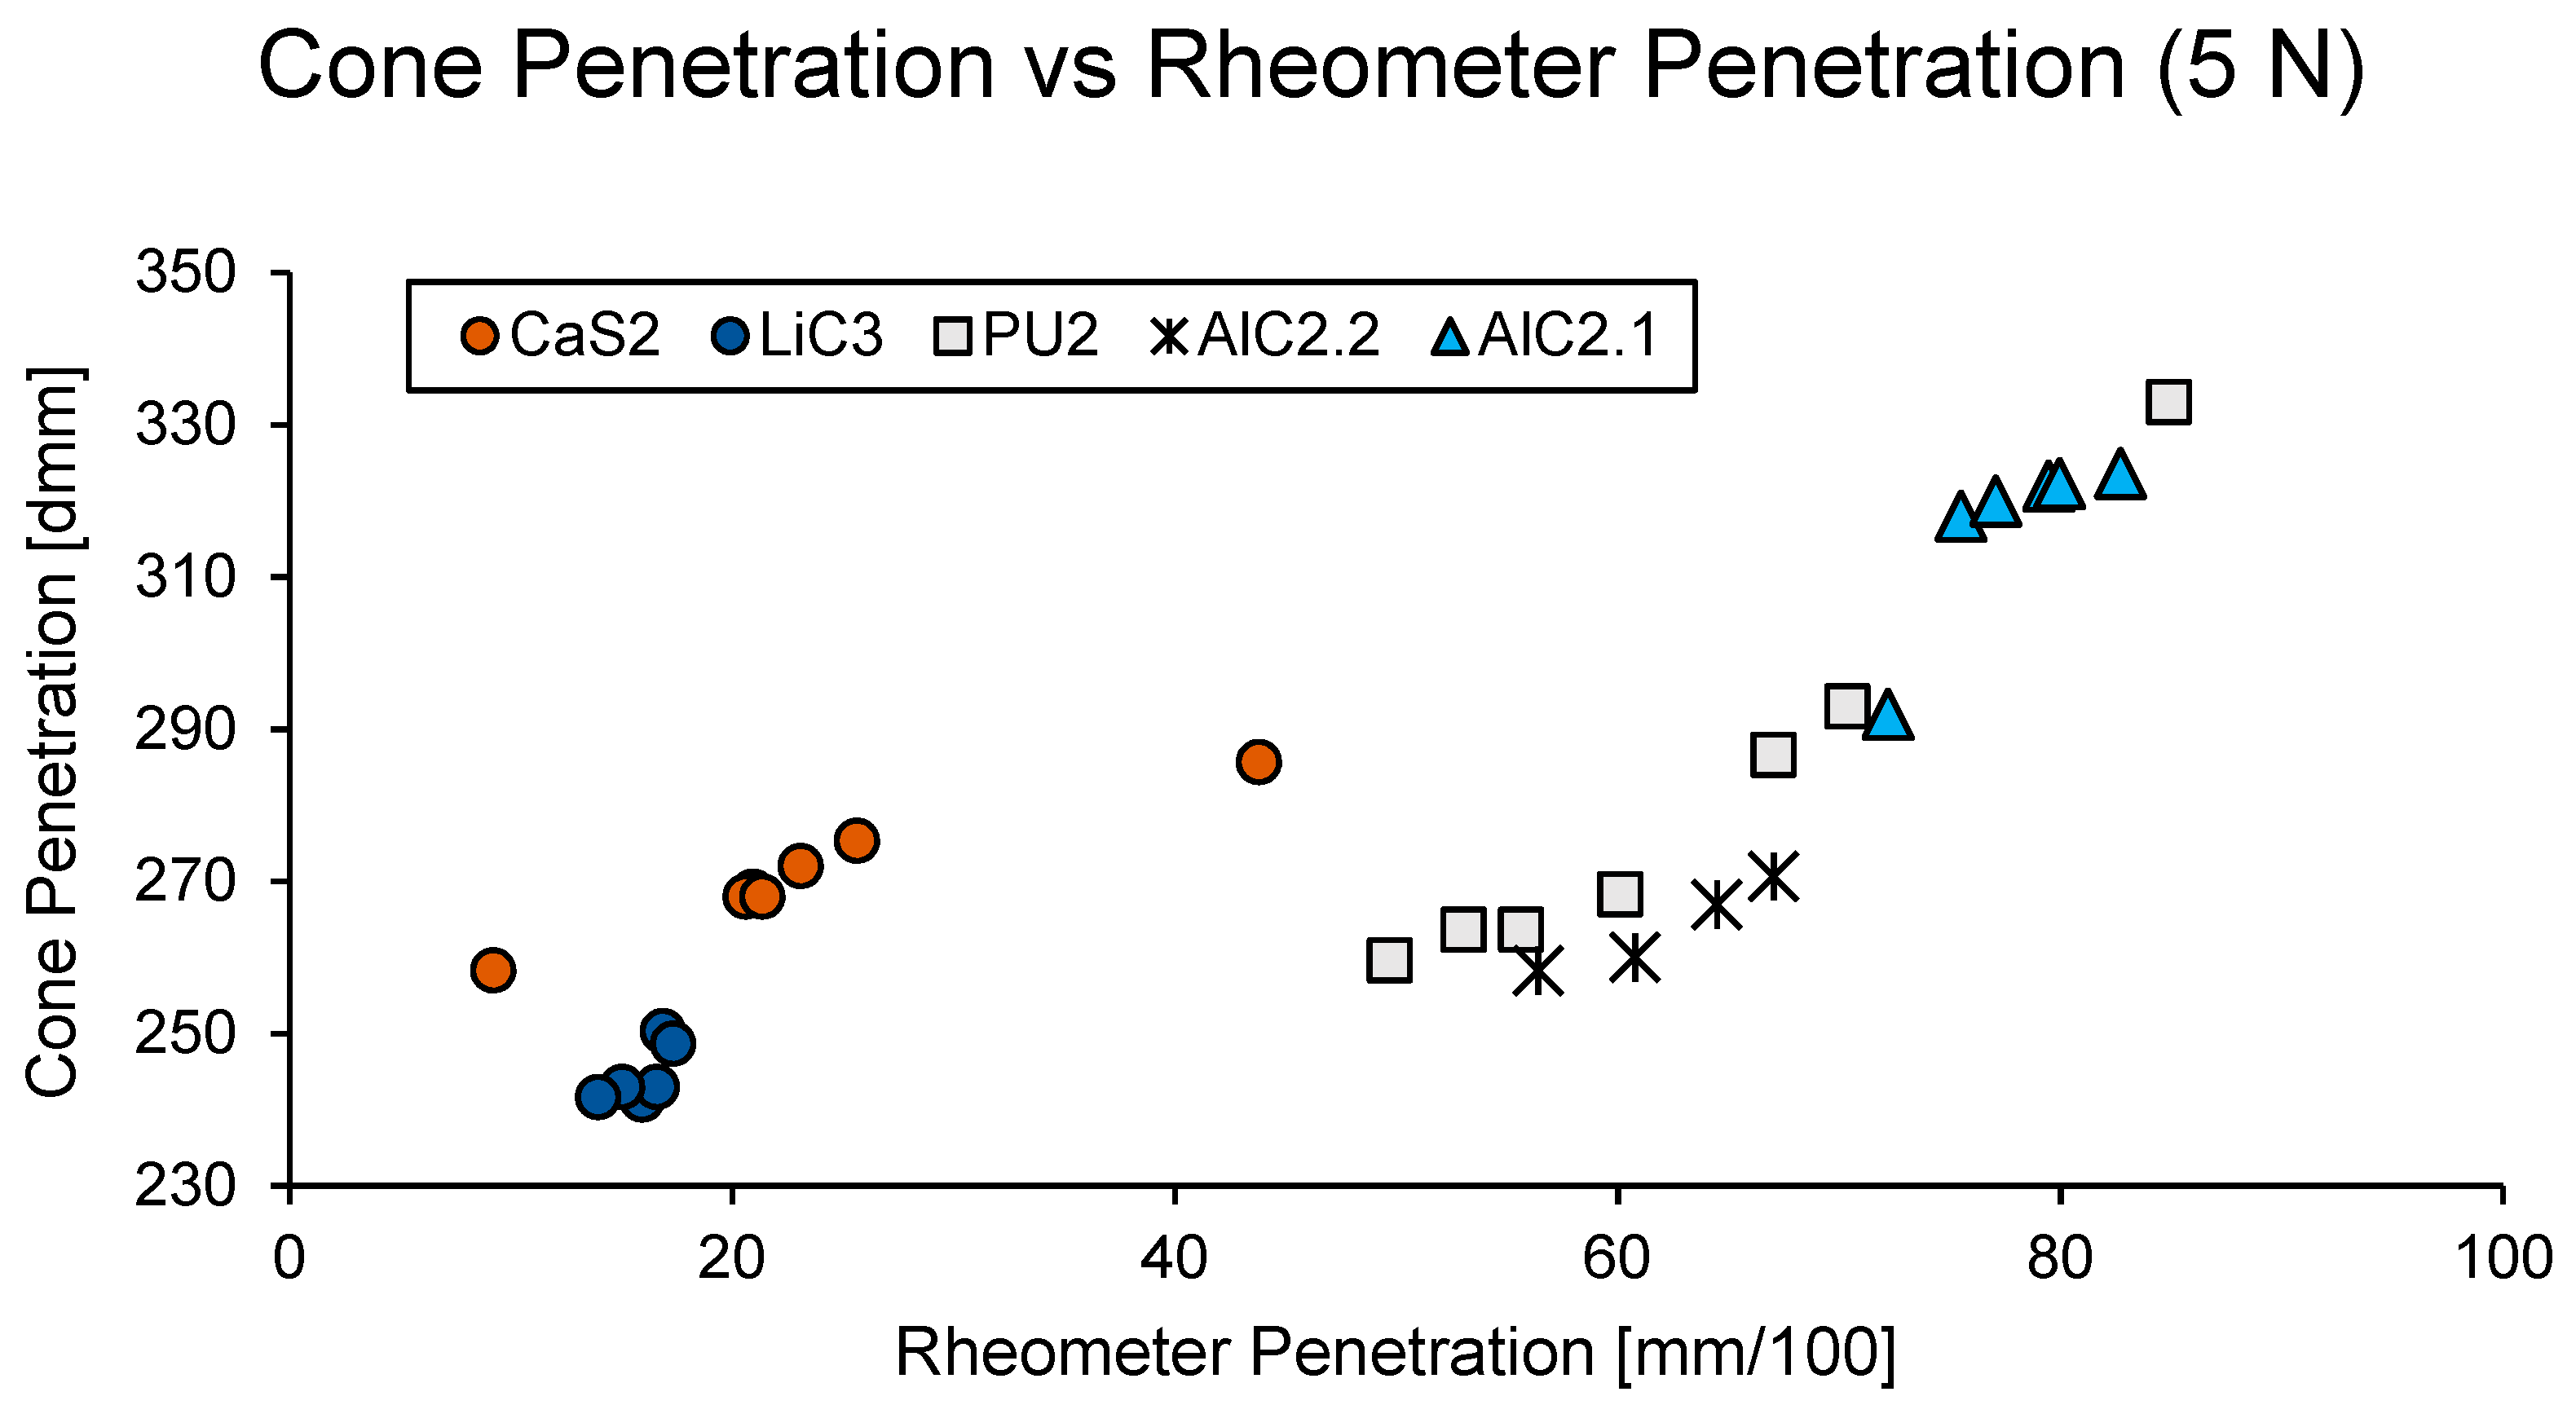
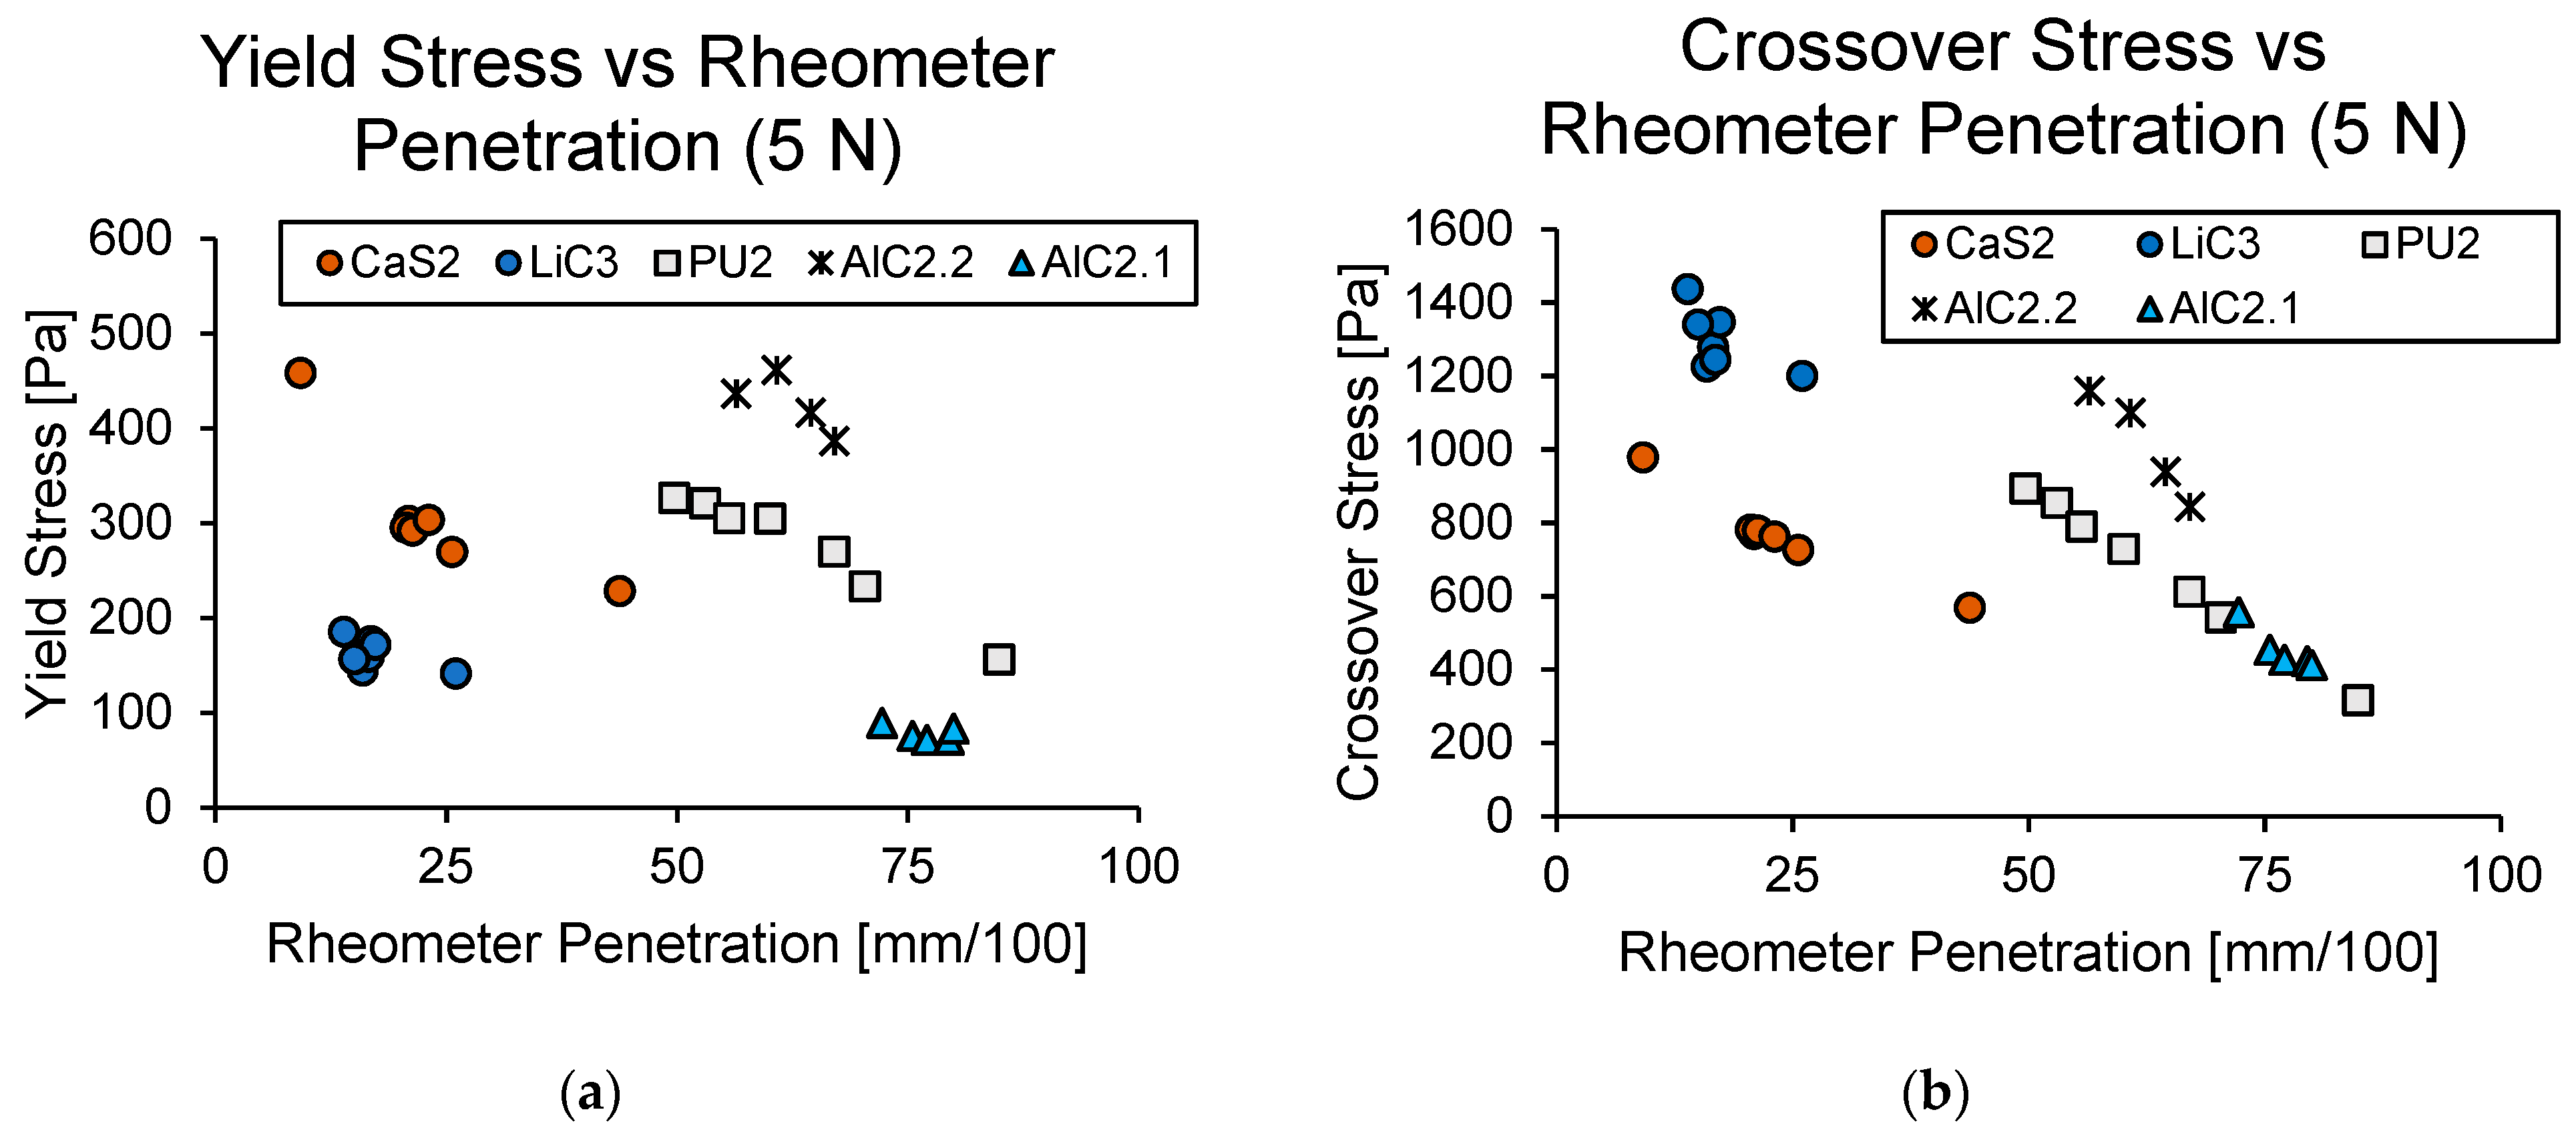
Here, the results of all four tests considered (cone penetration, rheometer penetration, yield stress, and crossover stress) will be compared. The first set of results presented involves looking more closely at the rheometer penetration test. Because different normal forces must be used to test different greases, here, each normal force has an associated set of data. For simplicity, only one set of data will be presented; however, this set is particularly representative of all data collected. Figure 7 and Figure 8 compare the rheometer penetration test done using a 5 N normal force to other consistency tests.
Figure 7 shows that there is a general positive correlation between cone penetration and rheometer penetration; however, different greases show slightly different behaviors. This means that using a rheometer to assess the change to a particular grease’s consistency would be a valid approach, but comparing two different greases to each other with this approach would not. Using a linear correlation between cone penetration and rheometer penetration in this case would likely lead to excessive error and it is, therefore, recommended that this approach not be taken if one is interested in comparing the consistency of different greases.
Results shown in Figure 8 are perhaps even more indicative that a correlation between rheometer penetration and the other tests that should not be used in practice since a meaningful trend cannot be established. Nevertheless, a comparison of the other tests yielded interesting results.
4.4. Oscillatory Test Results
The next results shown compare the oscillatory test results to each other and to cone penetration results.
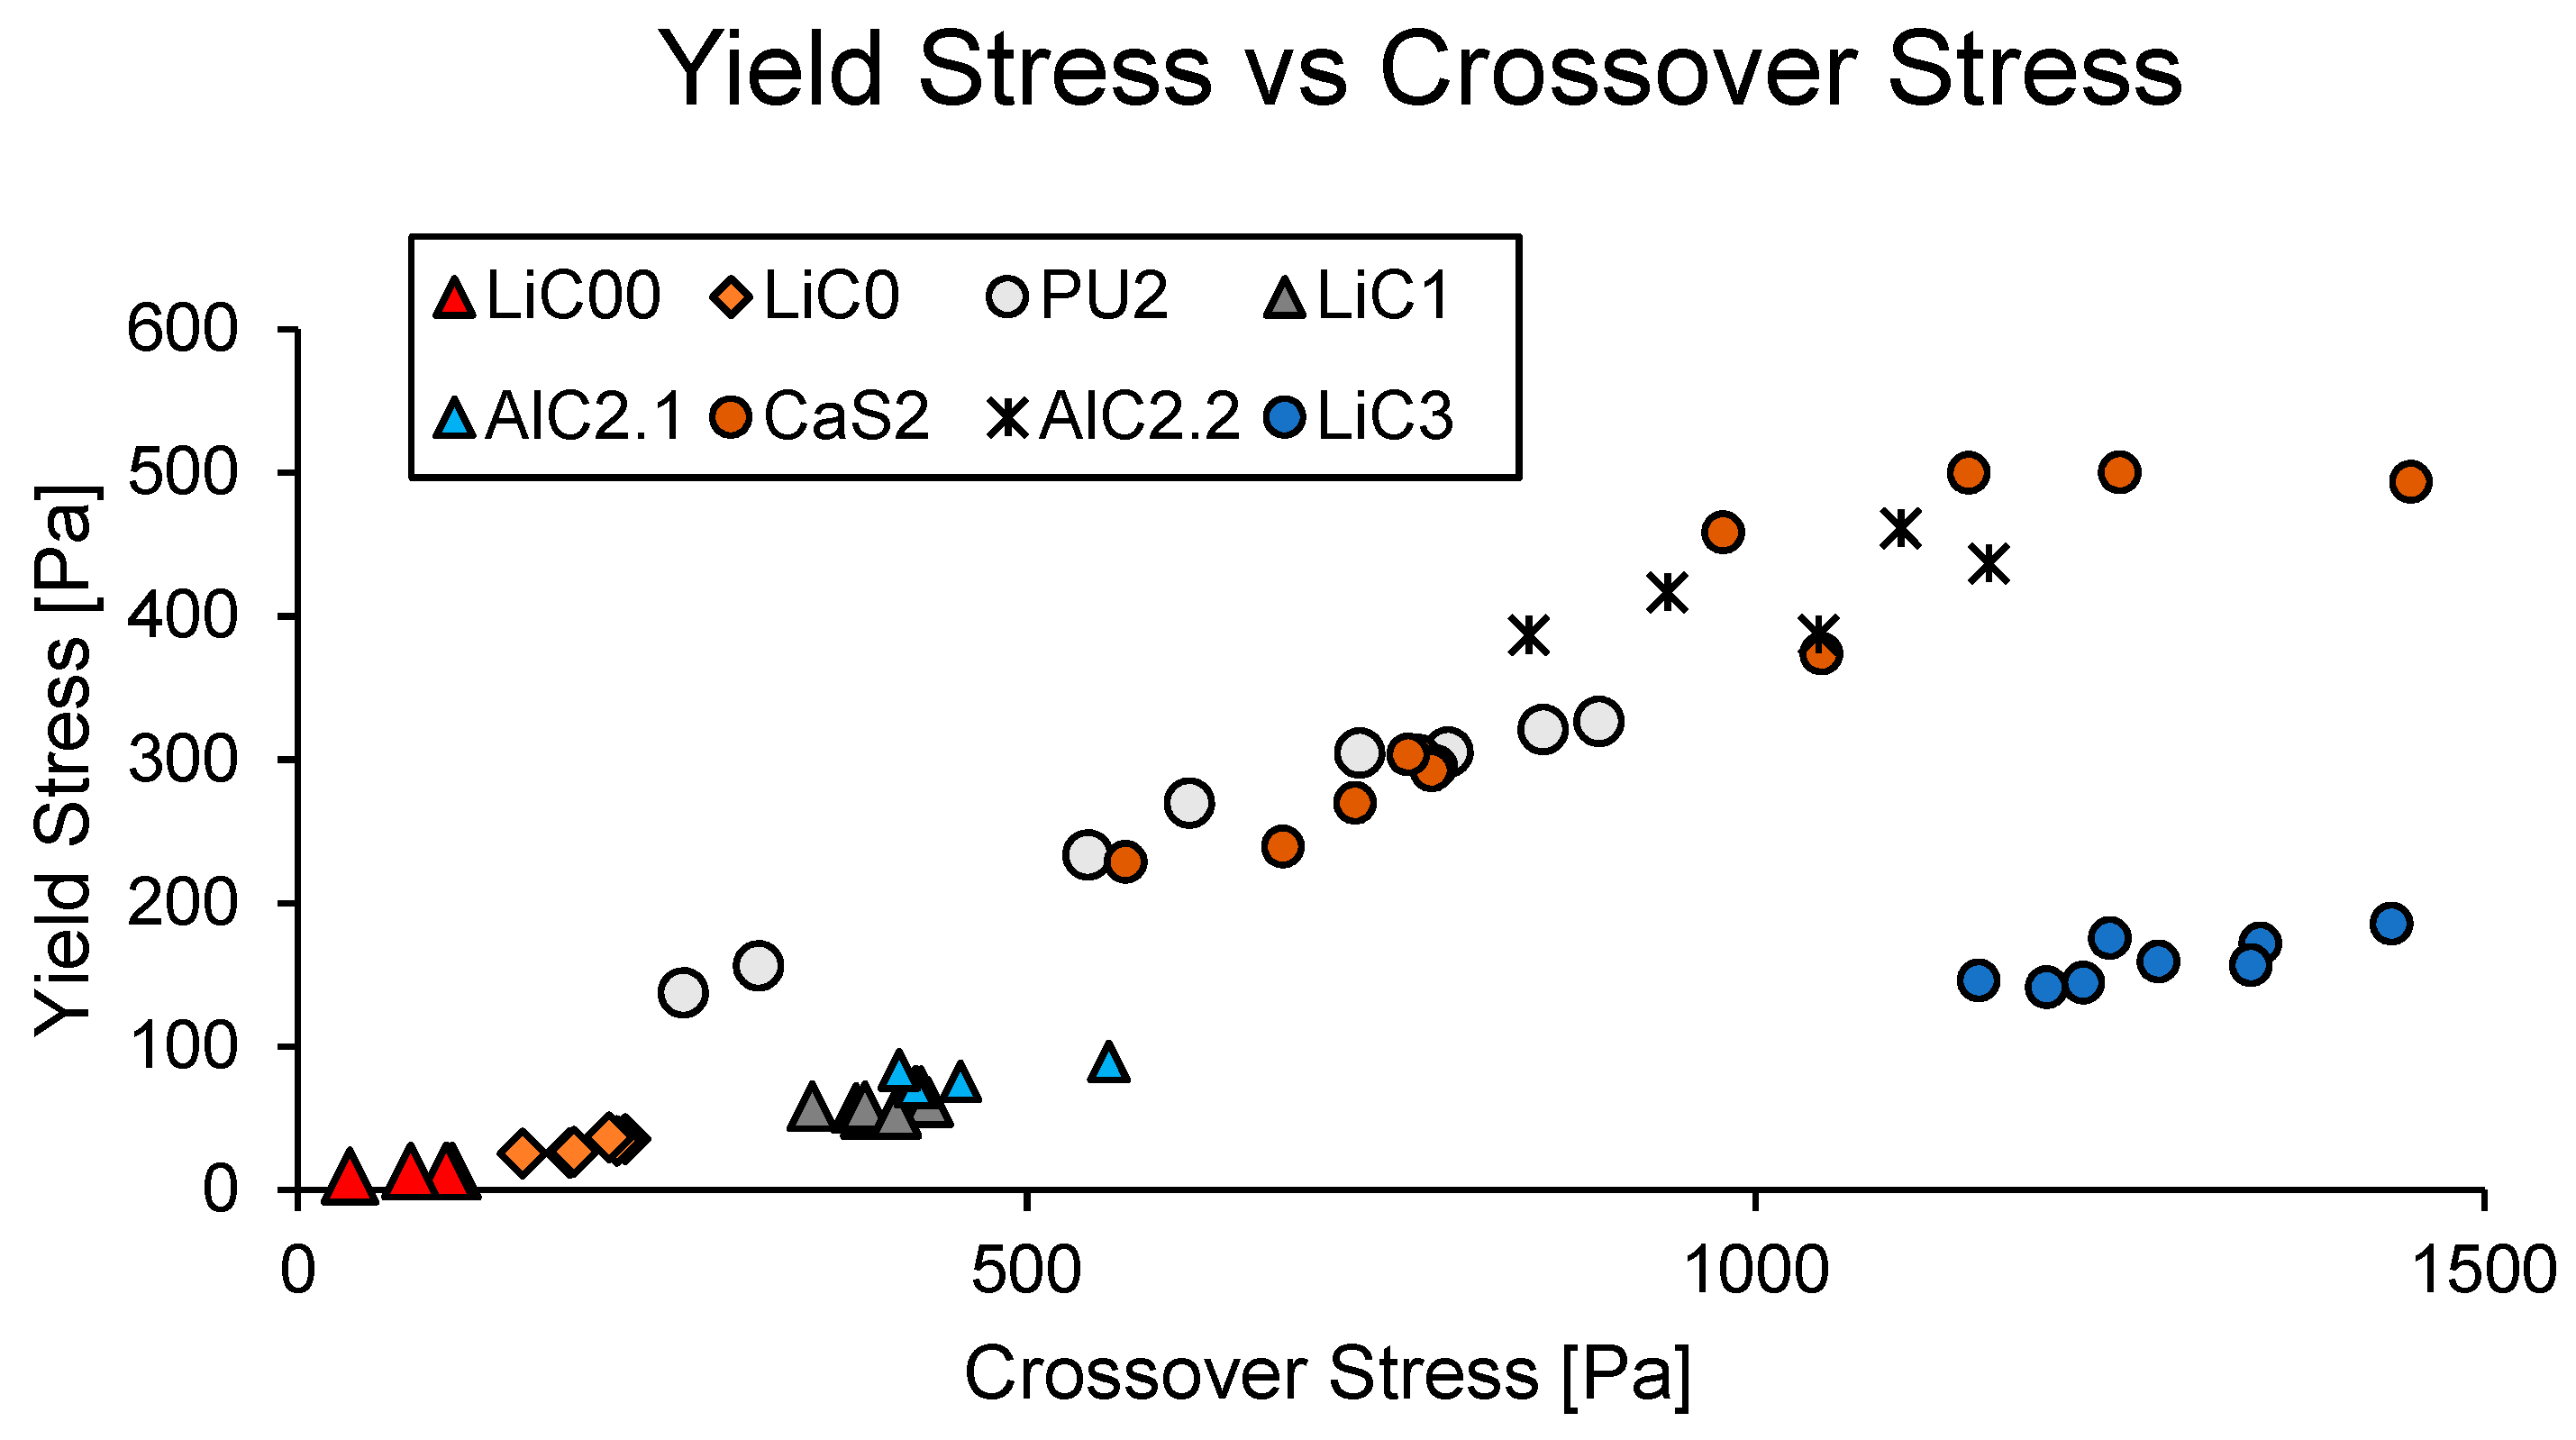
Figure 9 shows the relationship between yield stress and crossover stress for the greases selected. As expected, based on another study [8], there is a general positive correlation between these two measurements. However, there is one particularly notable cluster of data points associated with the LiC3 grease. These points were found to completely deviate from the expected trend and indicate that there is some important discrepancy between yield stress and crossover stress.
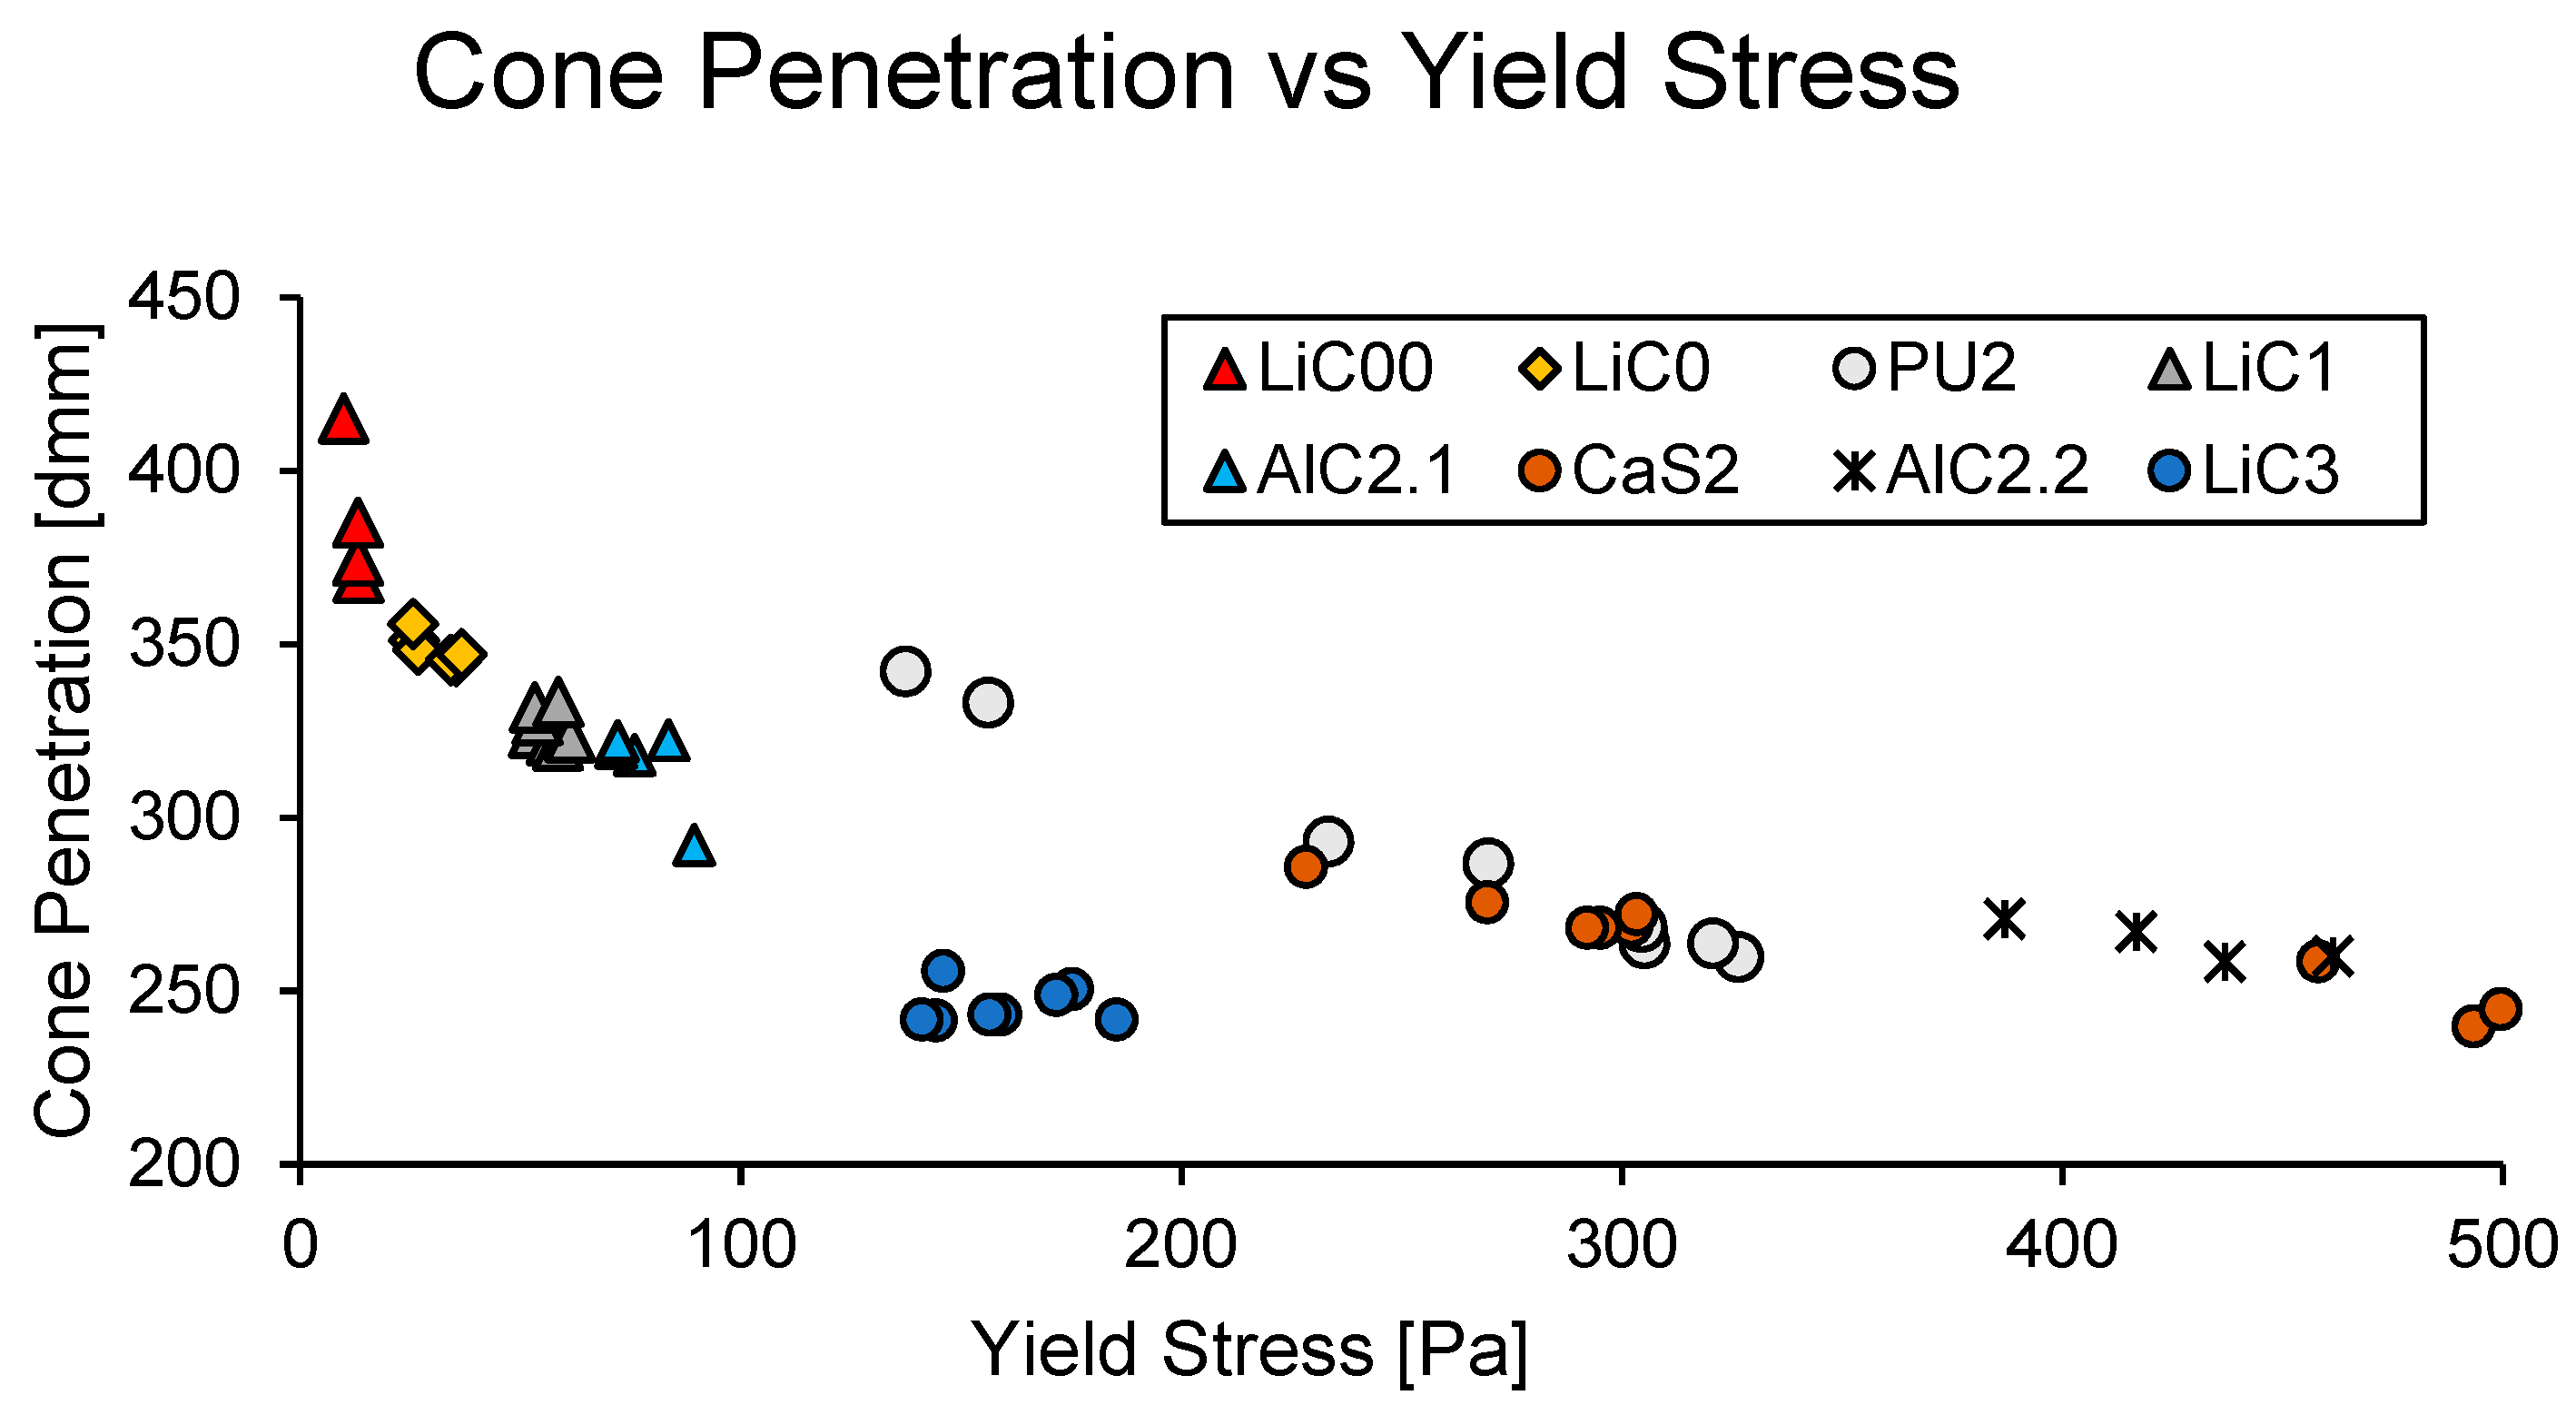
Figure 10 shows the relationship between cone penetration and yield stress, where a general negative correlation is established. This figure, once again, shows that the LiC3 grease deviates from the expected trend by a significant amount. This grease appears to have a much lower cone penetration value than the PU2 grease, yet it shows a similar value of yield stress. Because of this, it is not recommended to use this measure of yield stress to estimate cone penetration.
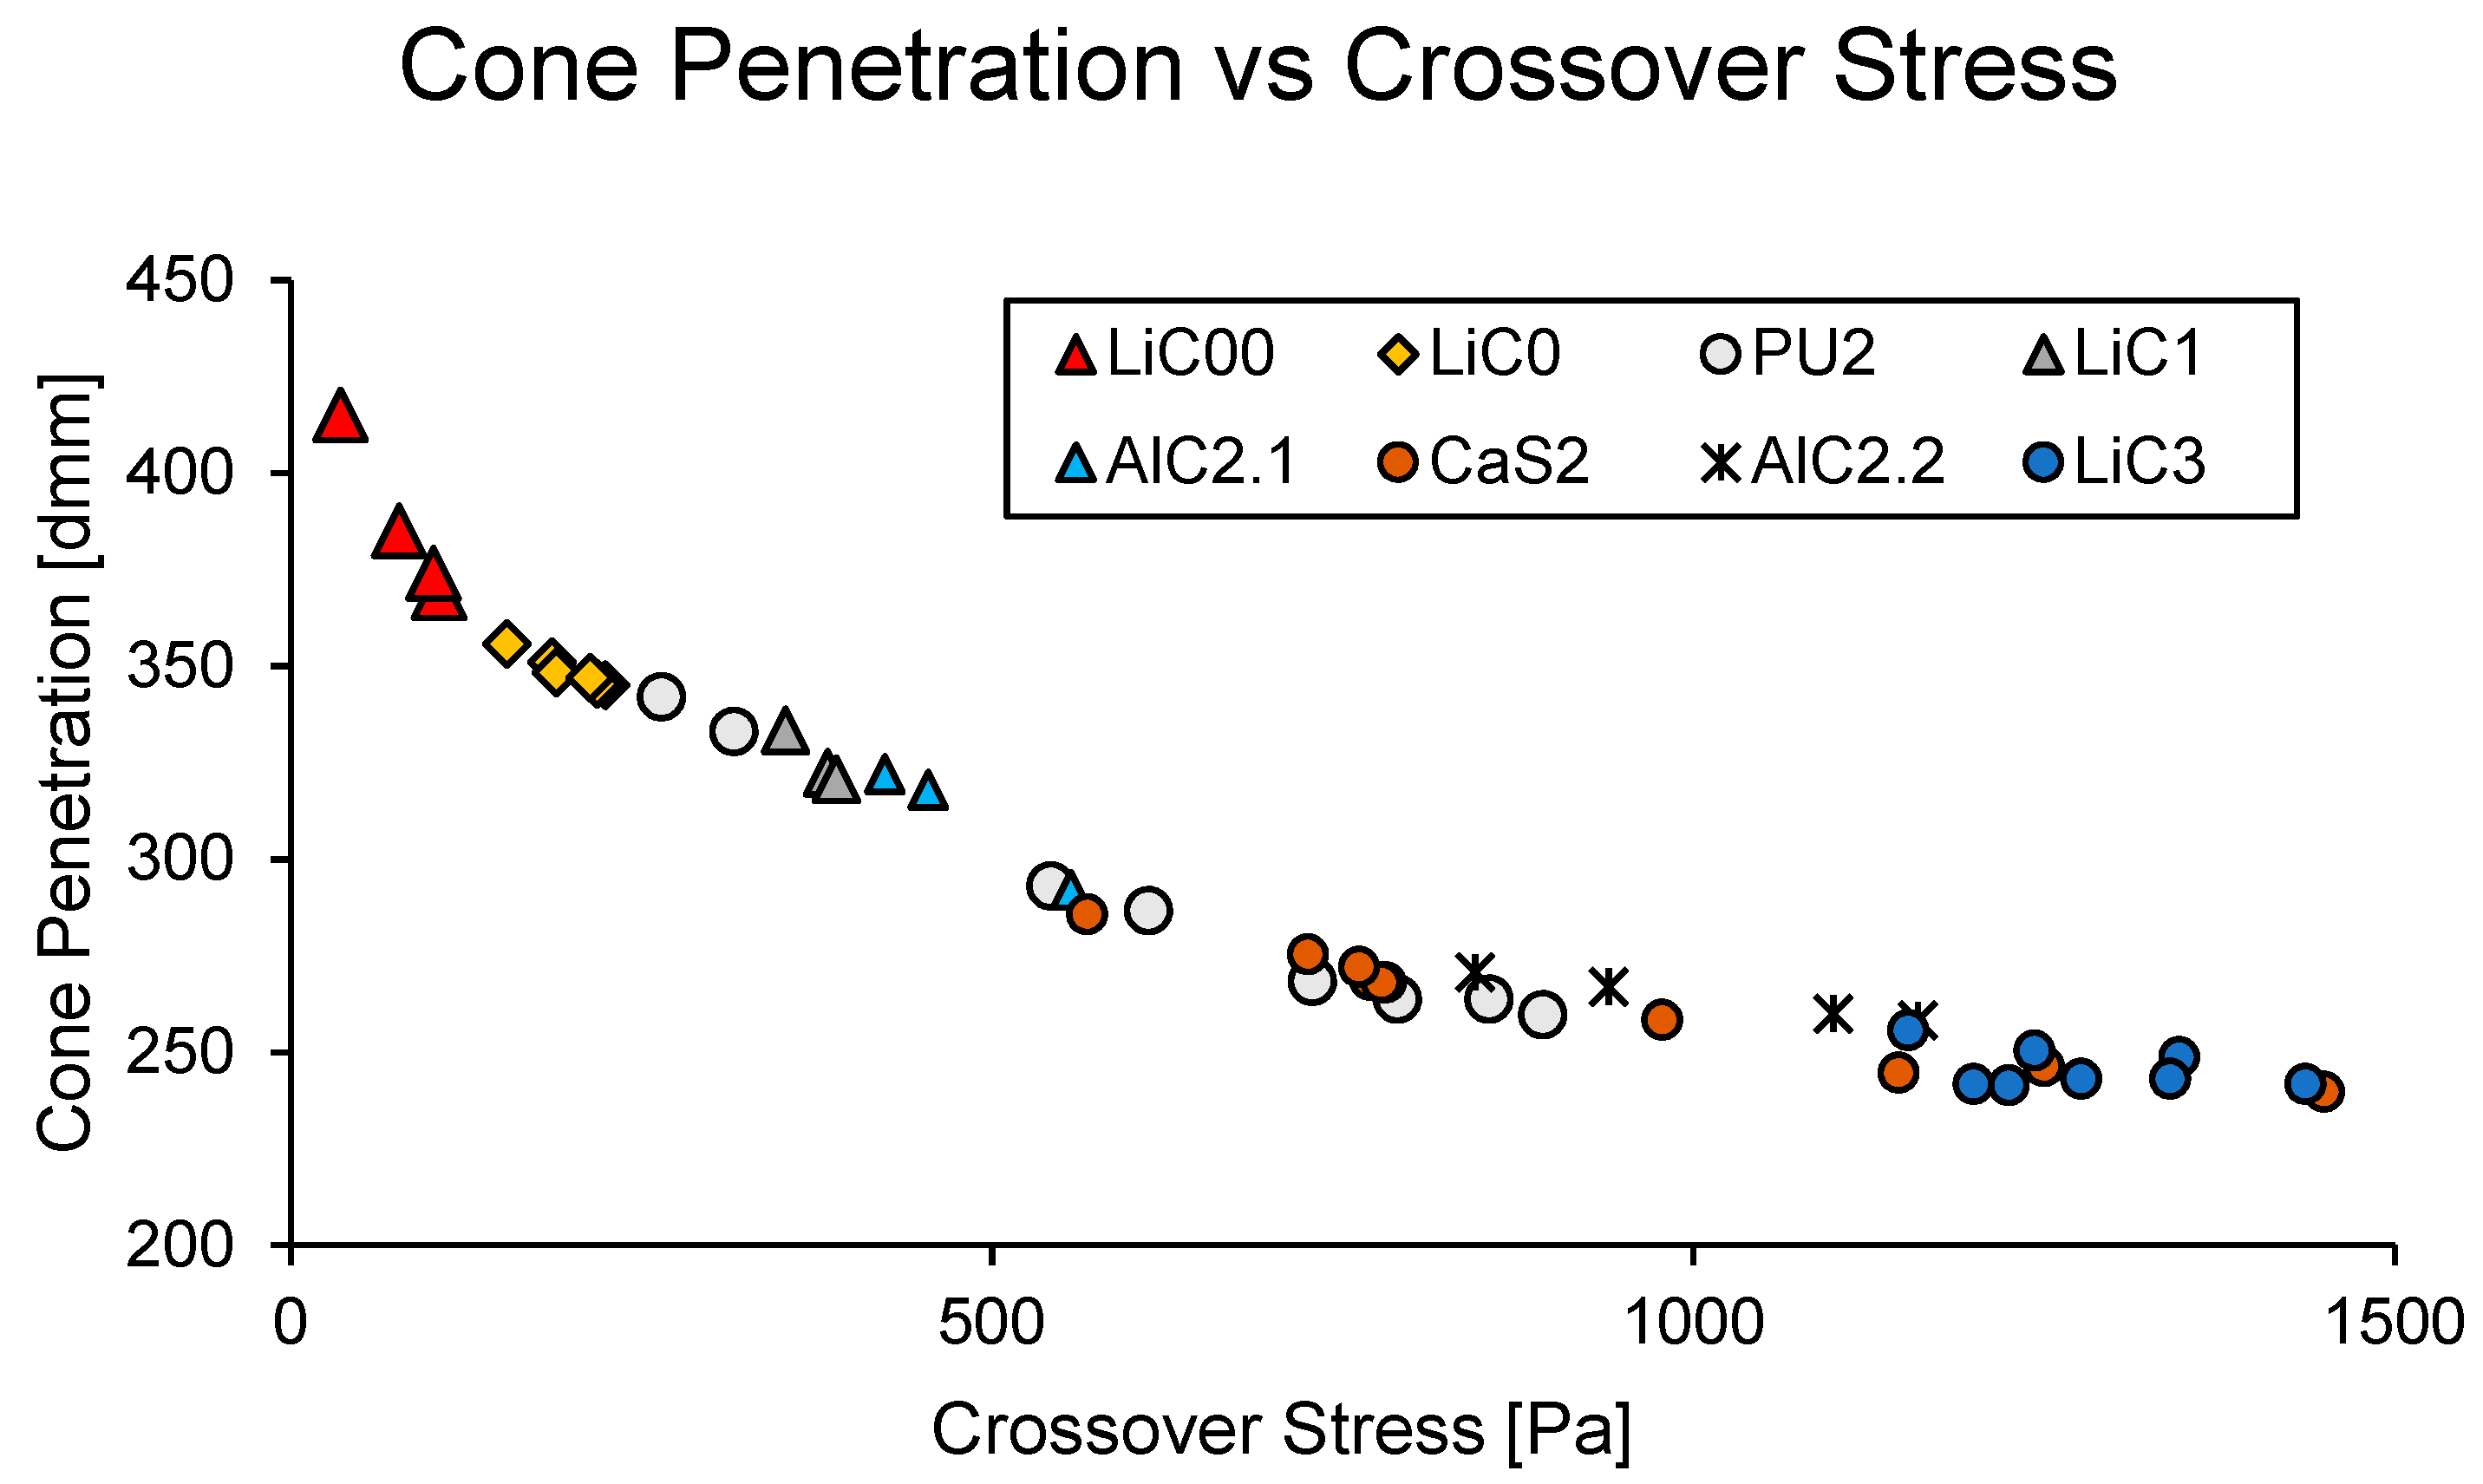
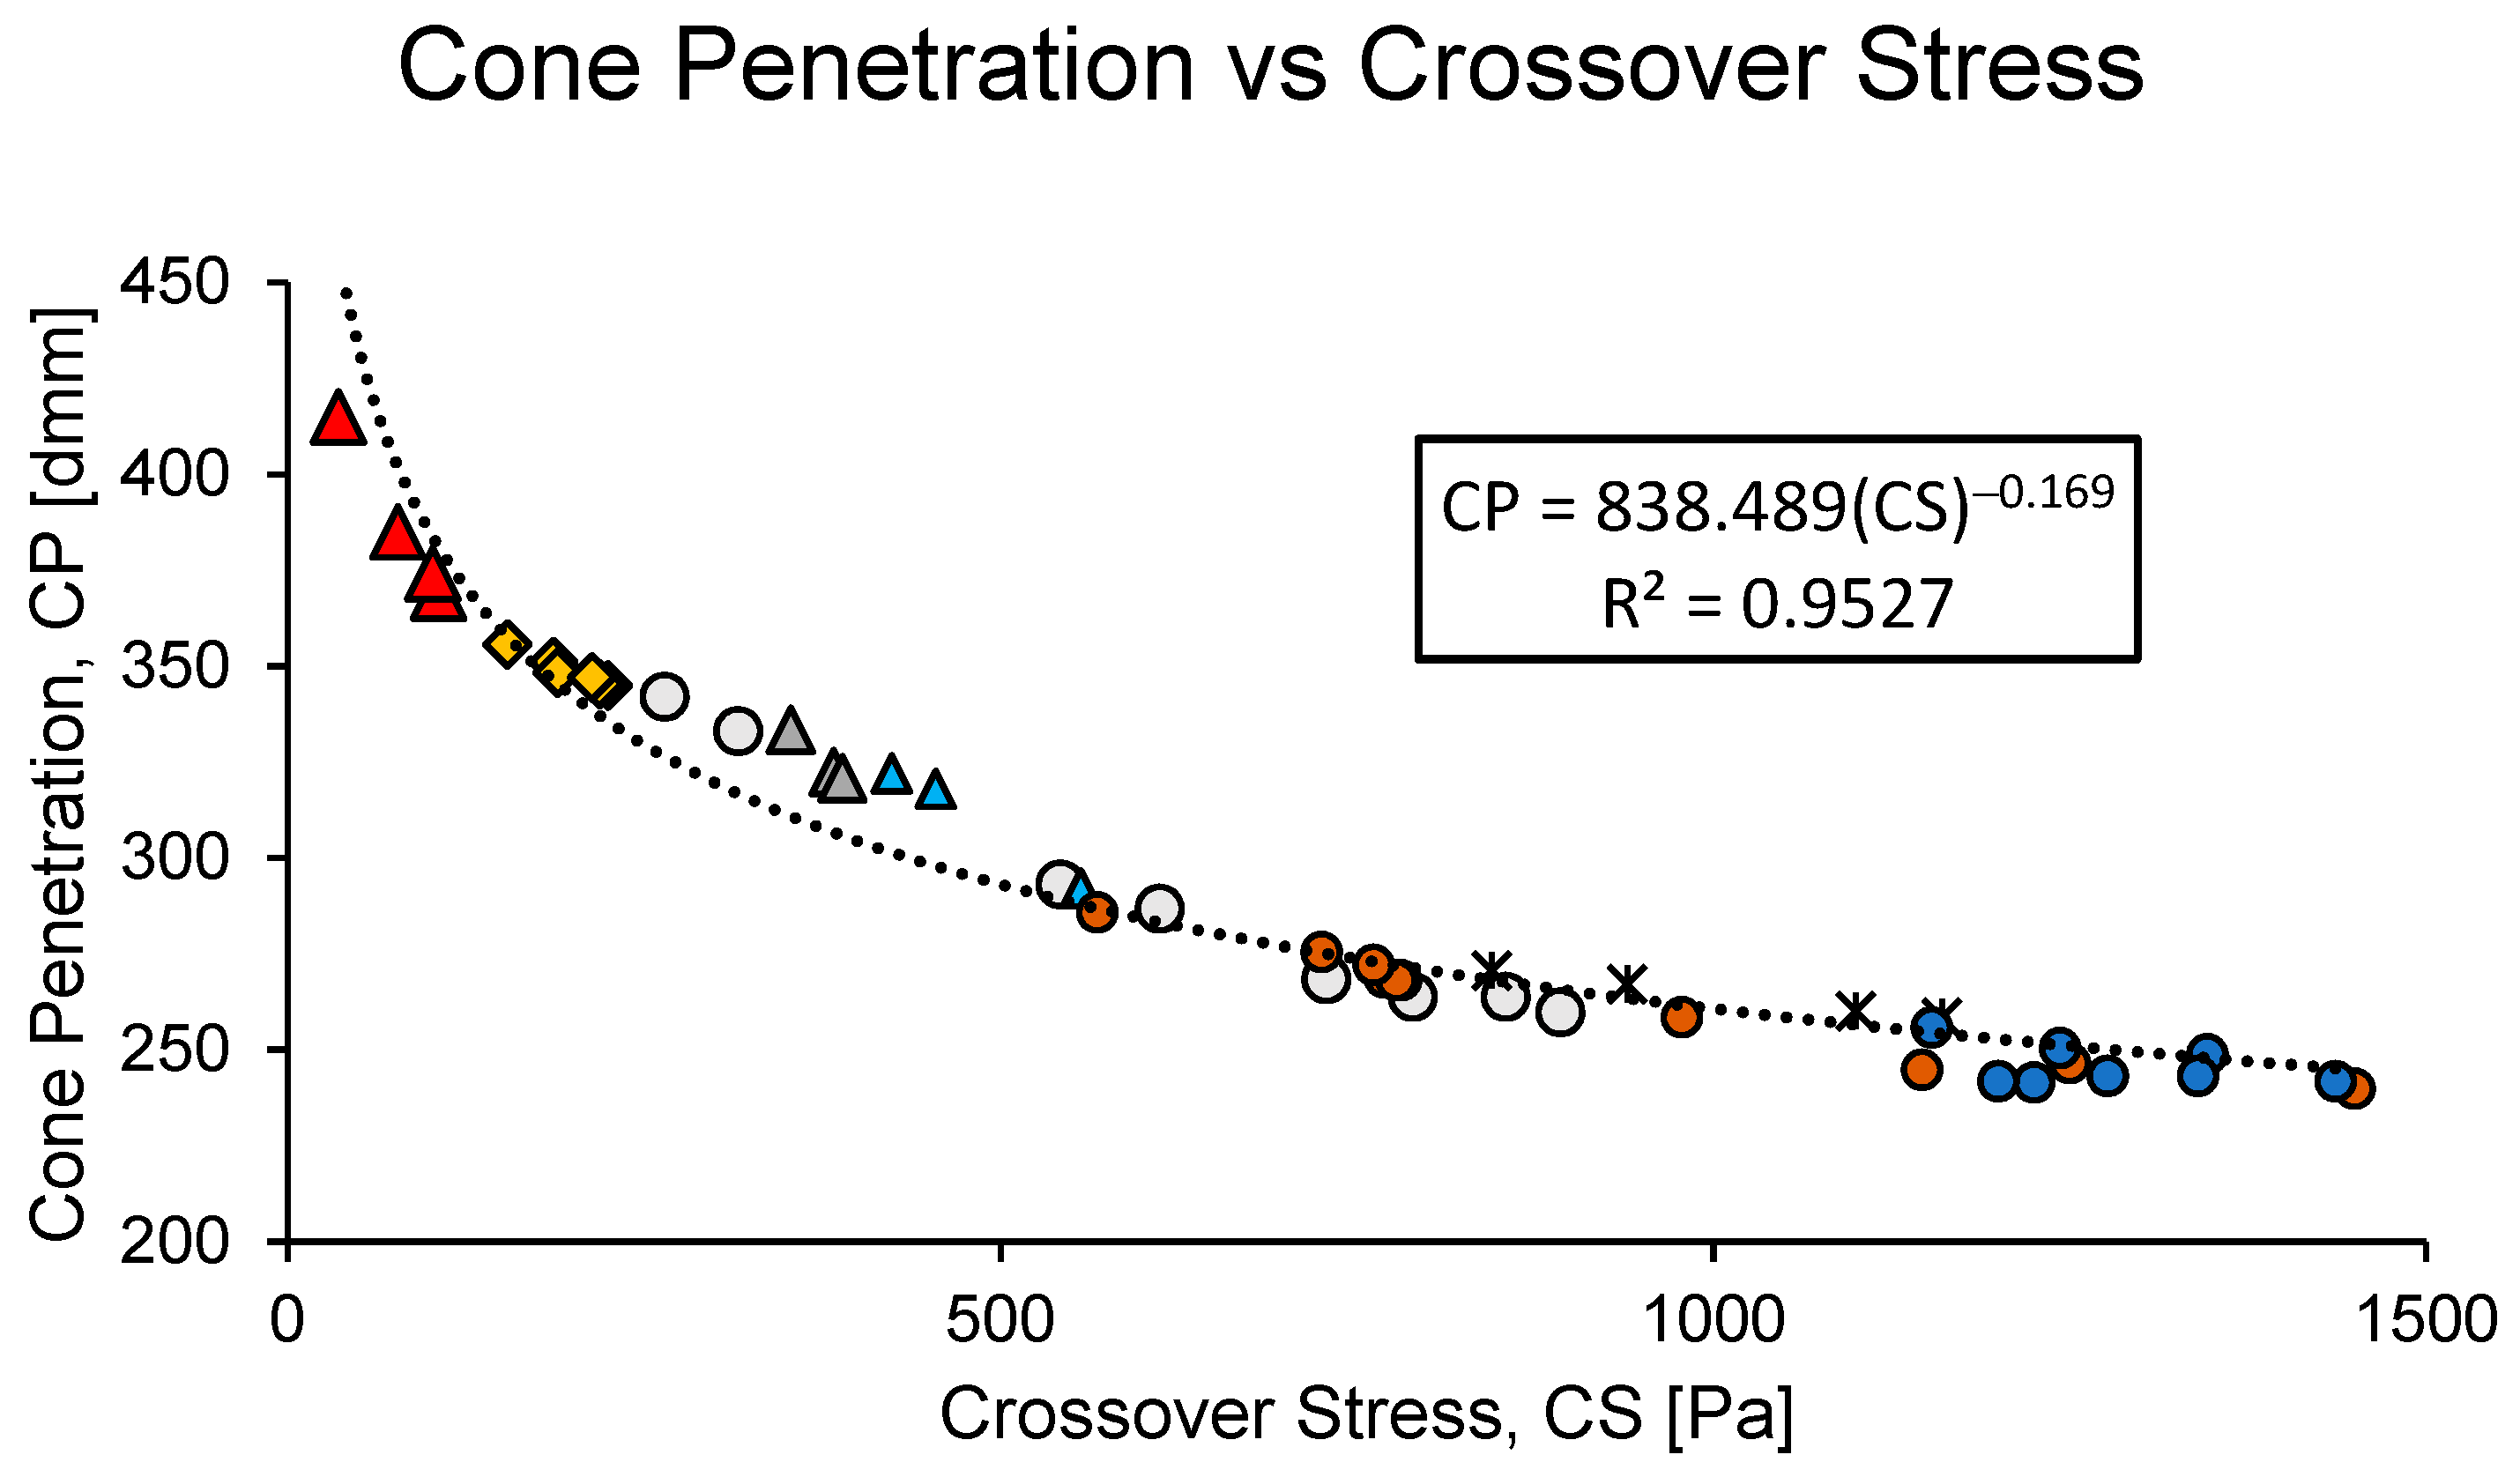
Figure 11 shows a plot of cone penetration (CP) vs. crossover stress (CS), where the correlation is significantly better than in any of the preceding plots. In this case, the LiC3 grease fits in exactly where it would be expected and no grease deviates significantly from the overall trend. These data are fitted to a power law in Figure 12, where the coefficient of determination is above 0.95. Because of the good fit for all types of greases tested, it appears that using a rheometer to measure crossover stress could be used as a reasonable substitute for the cone penetration test.
5. Discussion
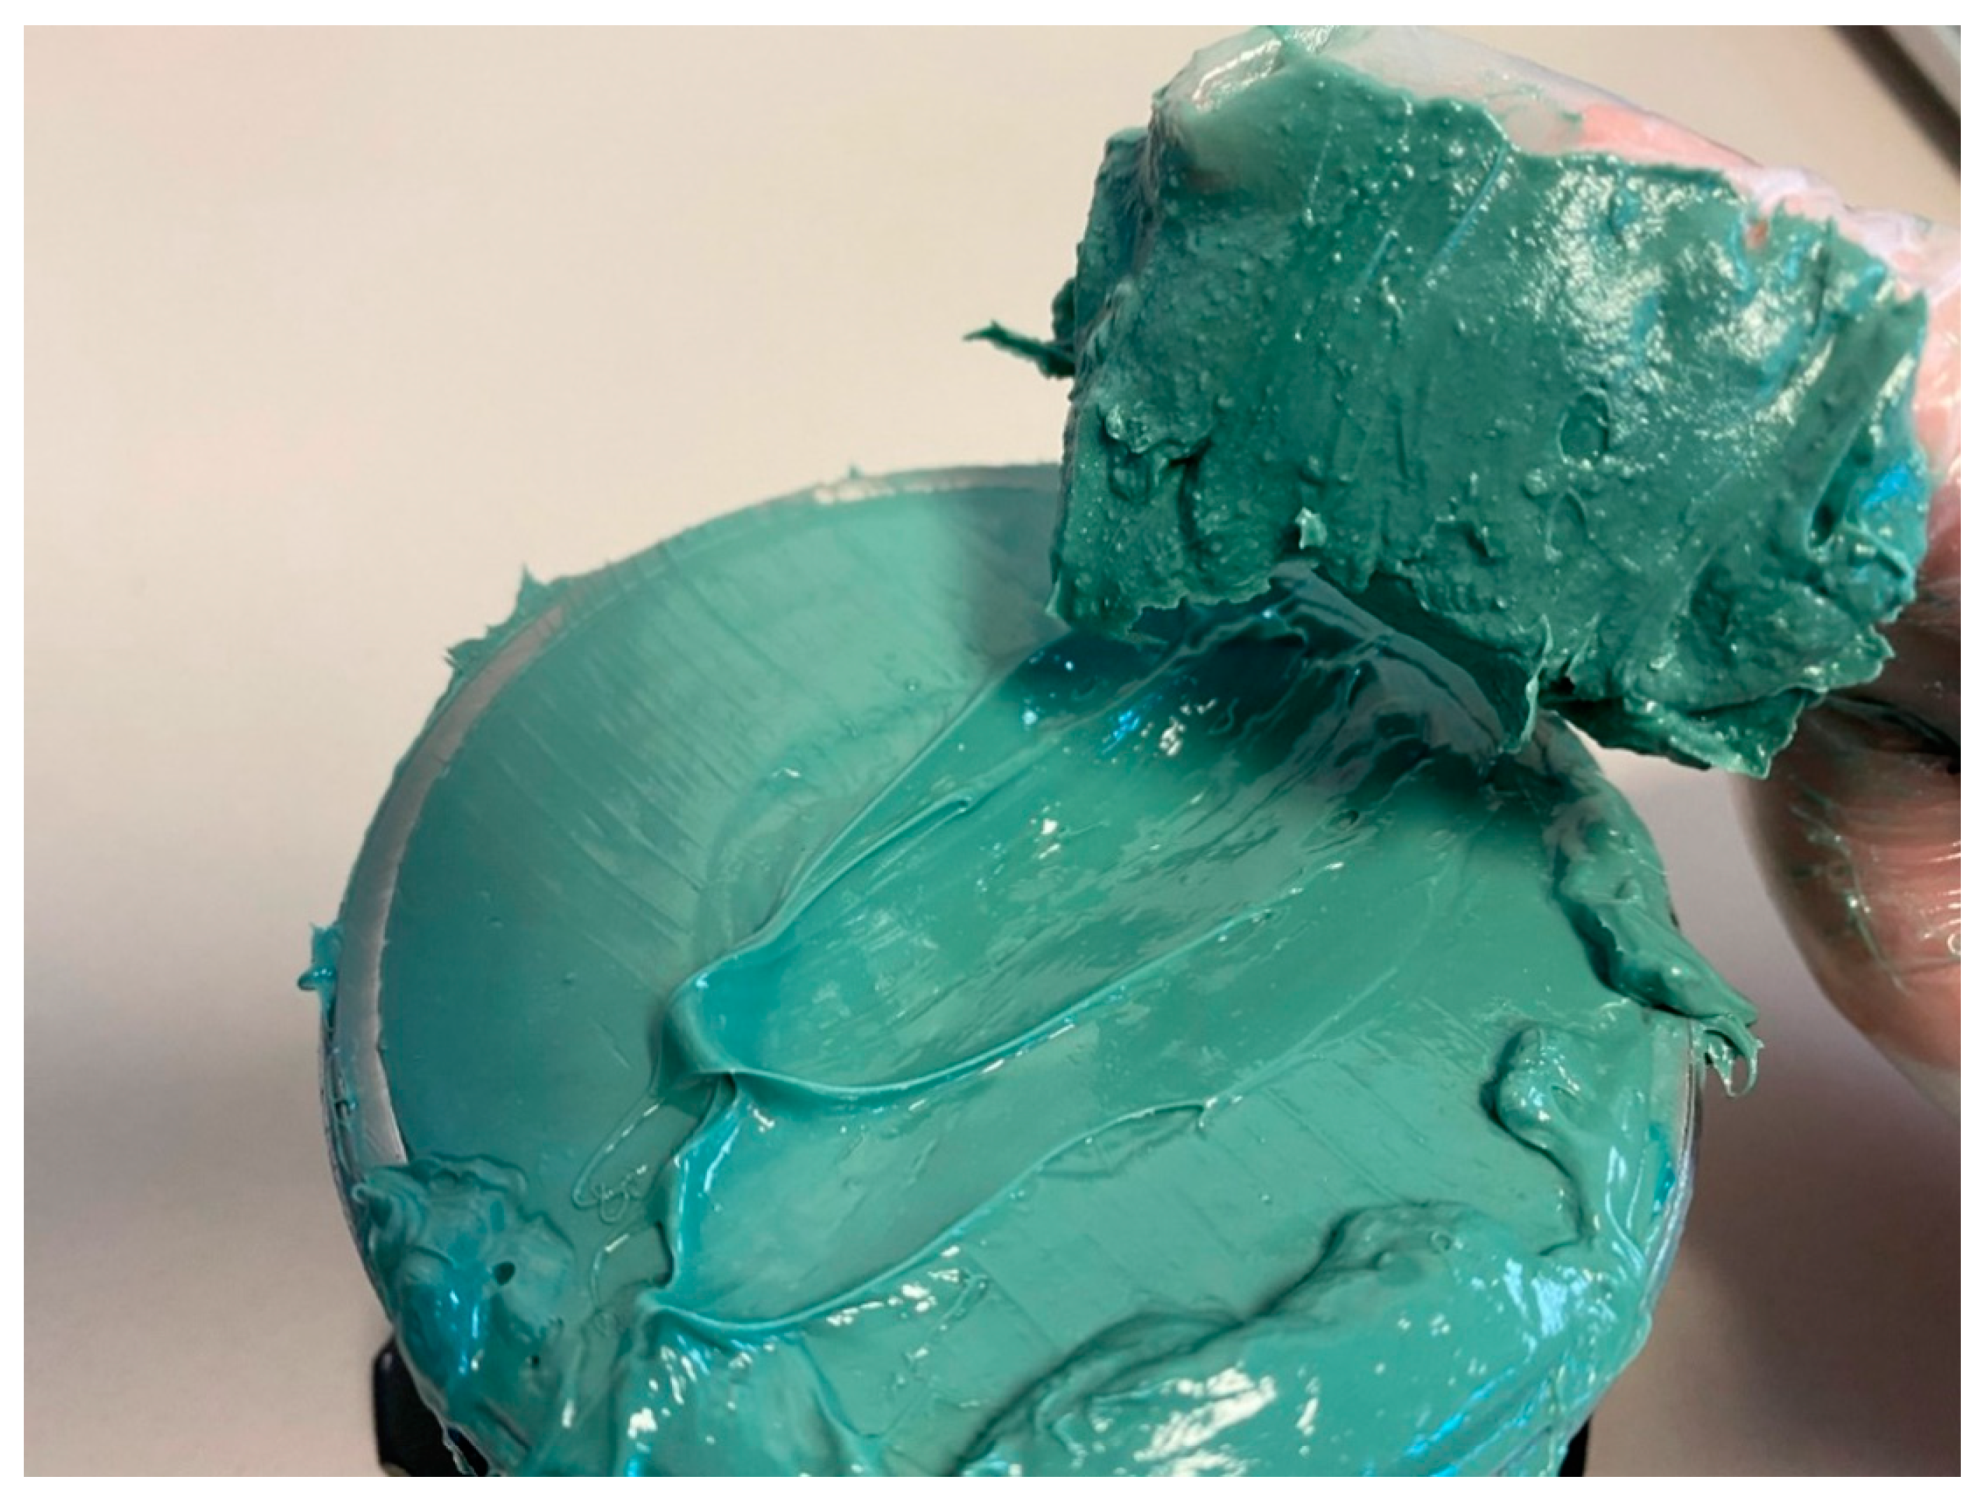
When considering tests of grease consistency, it is important to realize that consistency is an overall property of a given sample. Even within a sample, there are likely localized differences in consistency that can cause different samples of the same batch to show different results. This can be especially pronounced when a grease has been in storage and/or has experienced large temperature fluctuations. As is displayed in Figure 13, greases can even appear visually nonhomogeneous. The non-homogeneity of the grease by itself can cause a significant difference between an unworked sample and one that is worked for merely 60 strokes in a grease worker.
Though it is important to note that some of the apparent uncertainty of a grease’s consistency is due to the grease sample itself, the method for testing consistency plays a dominant role.
5.1. Rheometer Penetration
Overall, the rheometer penetration test shows different trends with different greases. It is possible that the results correlate with some property that was not investigated, but there is no clear correlation between it and any of the other tests considered. Perhaps finding the properties—such as tackiness, base oil viscosity, or other rheological properties—responsible for causing the poor correlation would help give a deeper understanding of the tests themselves as well as grease performance.
Nevertheless, an interesting metaphor between the rheometer penetration test and the cone penetration test can be drawn despite significantly different geometries. The minimum penetration value that corresponds to an NLGI grade (grade 6) is 85 dmm, while the maximum penetration value that corresponds to an NLGI grade (grade 000) is 475 dmm. This is despite the fact that the minimum possible value of penetration is 0 dmm and the maximum value (where the cone hits the bottom of the cup) is 635 dmm. If this is scaled to the rheometer test with a 100 mm/100 starting gap, this corresponds to a minimum penetration of 13.4 mm/100 and maximum penetration of 74.8 mm/100. Despite the completely different geometry, this appears to match somewhat closely with the desirable middle region for the rheometer penetration test. This is especially true for greases within the range of grade 0 to grade 2.
5.2. Cone Penetration
Though the cone penetration remains one of the most common tests, many critics contend that the results of the test do not indicate useful information about a grease. For instance, some point out that it is likely more important to look at pumpability and other grease flow characteristics than cone penetration [26] when considering a grease for a given application. However, the test is such a fundamental tool in measuring a grease that it is unlikely to go away any time soon. In addition, it has an advantage over the other methods used herein in that it can test very firm greases. Greases corresponding to an NLGI grade of 4 or above are generally unsuitable for use in a rheometer, while the cone is designed such that it will give a meaningful penetration value.
A look at the interaction of grease, the cone, and the cup during the cone penetration test shows that there are different phases of the test. The first phase is where the cone penetrates initially and the portion of the cone with a very steep angle causes rapid penetration. This is useful for testing very firm greases where a normal wide cone design would show a negligible penetration.
The second phase involves shallow penetration of the “main” cone body, which is roughly independent of the diameter of the grease cup. According to ASTM D217, this takes place for penetration values below 265 dmm. In this phase, grease begins to be lifted out of the cup, but not enough to significantly impact results.
The third phase is a transition phase, where the grease is lifted out of the cup and begins to be squeezed between the cone and the cup rim. In this region, the geometry of the cup starts to become a significant factor in penetration measurement. This roughly corresponds to the region of penetration between 265 and 400 dmm.
Finally, the fourth phase of cone penetration is where the cup geometry plays a major role in penetration. A large amount of grease is squeezed between the cone and the lip of the cup, causing the cup geometry to play a major role in determining penetration. If a cup of grease with different dimensions were used, it is expected that the penetration values would be significantly different. As is mentioned in ASTM D217, in order to obtain consistent readings for grease within this region (above 400 dmm), it is imperative to center the cone exactly above the cup.
A final note on the cone penetration test is that there are scaled-down alternatives given by ASTM D1403 with correlations between these tests and the full-scale test. These linear correlations are clearly empirical, pointing out some difficulty in describing the behavior of grease during this test with an analytical method. In addition, these tests are further restricted by not allowing the testing of 000 and 00 greases.
5.3. Critical Stress
The evaluation of critical stresses through oscillatory rheometry appears to be a useful tool in measuring grease properties. The yield stress method used appears to be more sensitive to variables such as pre-shear and overfilling compared to the crossover stress method. In addition, the yield stress method does not appear to correlate well with cone penetration. Results from this study as well as the paper defining the procedure [10] show that a grease with a higher cone penetration may or may not have a lower yield stress. This does not mean that this method has no value but does indicate that it is a poor choice for estimating cone penetration and NLGI grade.
6. Conclusions
After a procedure was established for conducting rheometer penetration tests, the method was used to assess the consistency of various greases and compared to other methods of assessing consistency. It was found that the rheometer penetration test does not correlate well with any of the other tests and is, therefore, only recommended to quickly and easily monitor the change in consistency to a particular grease. Though using this method is acceptable to monitor the change in consistency to a particular grease, it is not acceptable to compare the consistency of different greases to each other. There is clearly some parameter responsible for the lack of agreement between the rheometer penetration test and other tests and investigating this lack of agreement can be beneficial for understanding the tests themselves as well as the general nature of grease.
An interesting result from the experiments is that the crossover stress test appears to be an excellent substitute for the cone penetration test. This test is simple to perform, can use a very small sample, is not particularly sensitive to sample preparation, allows for temperature control, and correlates very well with cone penetration. The main disadvantages are that it requires an expensive instrument and relies on arbitrarily chosen parameters such as plate diameter, gap height, and oscillatory frequency. Nevertheless, many researchers use the same variables and if a 25 mm flat plate is used with a 1 mm gap at 1 Hz, the equation given by Figure 11 would be a valid way of estimating cone penetration using the crossover stress. This relationship holds true for all grease types tested and is expected to hold for any other grease type.
Overall, these methods of assessing consistency can be used as a tool for monitoring the degradation of grease due to processes such as shear, oil bleed, contamination, and chemical reactions. However, it is important to keep in mind that the consistency of a grease can appear to change simply because a given sample has a different balance of thickener and oil compared to the average. Thus, appropriate sample selection is an important factor for in-service sampling and even sampling of an unused grease that has been in storage. Once an appropriate sample is taken, it appears that using oscillatory rheometry to calculate the crossover stress has a significant value for reliably assessing the consistency of a grease.
Author Contributions
A.G. is the main author of the paper and received significant guidance, insight, and technical assistance from Professor M.M.K. during writing. All authors have read and agreed to the published version of the manuscript.
Funding
This research received no external funding.
Conflicts of Interest
The authors declare no conflict of interest.
References
- Lugt, P. A Review on Grease Lubrication in Rolling Bearings. Tribology Transactions—TRIBOL TRANS. 52. 470–480. Tribol. Trans. 2009, 52, 470–480. [Google Scholar] [CrossRef]
- Rezasoltani, A.; Khonsari, M. Mechanical degradation of lubricating grease in an EHL line contact. Tribol. Int. 2017, 109, 541–551. [Google Scholar] [CrossRef]
- ASTM D217-19b. Standard Test Methods for Cone Penetration of Lubricating Grease; ASTM International: West Conshohocken, PA, USA, 2019. [Google Scholar]
- ASTM D1403-20b. Standard Test Methods for Cone Penetration of Lubricating Grease Using One-Quarter and One-Half Scale Cone Equipment; ASTM International: West Conshohocken, PA, USA, 2020. [Google Scholar]
- Rezasoltani, A.; Khonsari, M. On the Correlation Between Mechanical Degradation of Lubricating Grease and Entropy. Tribol. Lett. 2014, 56, 197–204. [Google Scholar] [CrossRef]
- Lijesh, K.P.; Khonsari, M. On the Assessment of Mechanical Degradation of Grease Using Entropy Generation Rate. Tribol. Lett. 2019, 67, 50. [Google Scholar] [CrossRef]
- Barnes, H. The yield stress—A review or ‘παντα ρει’—everything flows? J. Non-Newton. Fluid Mech. 1999, 81, 133–178. [Google Scholar] [CrossRef]
- Couronné, I.; Vergne, P.; Ponsonnet, L.; Truong-Dinh, N.; Girodin, D. Influence of Grease Composition on its Structure and its Rheological Behavior. In Proceedings of the Leeds-Lyon Conference, Thinning Films and Tribological Interfaces, Leeds-Lyon, UK, 14–17 September 2000. [Google Scholar]
- Zakani, B.; Grecov, D. Yield Stress Analysis of a Fumed Silica Lubricating Grease. Tribol. Trans. 2018, 61, 1131–1140. [Google Scholar] [CrossRef]
- Cyriac, F.; Lugt, P.; Bosman, R. On a New Method to Determine the Yield Stress in Lubricating Grease. Tribol. Trans. 2015, 58, 1021–1030. [Google Scholar] [CrossRef] [Green Version]
- Zhou, Y.; Bosman, R.; Lugt, P. A Master Curve for the Shear Degradation of Lubricating Greases with a Fibrous Structure. Tribol. Trans. 2019, 62, 78–87. [Google Scholar] [CrossRef] [Green Version]
- Zhou, Y.; Bosman, R.; Lugt, P. On the Shear Stability of Dry and Water-Contaminated Calcium Sulfonate Complex Lubricating Greases. Tribol. Trans. 2019, 62, 626–634. [Google Scholar] [CrossRef] [Green Version]
- Cyriac, F.; Lugt, P.; Bosman, R. The Impact of Water on the Yield Stress and Startup Torque of Lubricating Greases. Tribol. Trans. 2017, 60, 824–831. [Google Scholar] [CrossRef] [Green Version]
- Lijesh, K.P.; Khonsari, M.; Miller, R. Assessment of Water Contamination on Grease Using the Contact Angle Approach. Tribol. Lett. 2020, 68, 103. [Google Scholar] [CrossRef]
- Rezasoltani, A.; Khonsari, M. On Monitoring Physical and Chemical Degradation and Life Estimation Models for Lubricating Greases. Lubricants 2016, 4, 34. [Google Scholar] [CrossRef] [Green Version]
- Gurt, A.; Khonsari, M. The Use of Entropy in Modeling the Mechanical Degradation of Grease. Lubricants 2019, 7, 82. [Google Scholar] [CrossRef] [Green Version]
- Rezasoltani, A.; Khonsari, M. An engineering model to estimate consistency reduction of lubricating grease subjected to mechanical degradation under shear. Tribol. Int. 2016, 103, 465–474. [Google Scholar] [CrossRef]
- Pierre, N.S. Need to Know: Grease Consistency. Nye Lubricants. Available online: https://www.nyelubricants.com/need-to-know-grease-consistency (accessed on 4 January 2021).
- Lugt, P. Grease Lubrication in Rolling Bearings; John Wiley & Sons: Hoboken, NJ, USA, 2012. [Google Scholar]
- Balan, C.; Franco, J. Influence of the Geometry on the Transient and Steady Flow of Lubricating Greases. Tribol. Trans. 2001, 44, 53–58. [Google Scholar] [CrossRef]
- Cardinaels, R.; Reddy, N.; Clasen, C. Quantifying the errors due to overfilling for Newtonian fluids in rotational rheometry. Rheol. Acta 2019, 58, 525–538. [Google Scholar] [CrossRef] [Green Version]
- SKF. SKF Grease Test Kit TKGT 1: Instructions for Use; SKF Group: Gothenburg, Sweeden, 2009. [Google Scholar]
- Engmann, J.; Servais, C.; Burbidge, A. Squeeze flow theory and applications to rheometry: A review. J. Non-Newton. Fluid Mech. 2005, 132, 1–27. [Google Scholar] [CrossRef]
- Hoffner, B.; Gerhards, C.; Peleg, M. Imperfect lubricated squeezing flow viscometry for foods. Rheol. Acta 1997, 36, 686–693. [Google Scholar] [CrossRef]
- Lee, S.; Denn, M.; Crochet, M.; Metzner, A. Compressive flow between parallel disks: I. Newtonian fluid with a transverse viscosity gradient. J. Non-Newton. Fluid Mech. 1982, 10, 3–30. [Google Scholar] [CrossRef]
- Flemming, W.; Sander, J. Is it Time to Retire the Grease Penetration Test? NLGI Spokesm. 2018, 82, 14–22. [Google Scholar]
Figure 1.
Grease cup (a) before and (b) after cone penetration.

Figure 2.
Anton Paar MCR 301 rheometer used in experiments

Figure 3.
Rheometer penetration results of PU2 with a 4 N normal force comparing a standard 5% trim to a 100% trim, a pre-sheared sample, and to a sample relaxed for 20 min.
Figure 3.
Rheometer penetration results of PU2 with a 4 N normal force comparing a standard 5% trim to a 100% trim, a pre-sheared sample, and to a sample relaxed for 20 min.

Figure 4.
Rheometer gap height as a function of time for various greases and forces.

Figure 5.
Rheometer net penetration as a function of force for various grease grades.

Figure 6.
Comparison of (a) yield stress and (b) crossover stress of LiC2 worked for 60 strokes using an overfilled sample compared to a pre-sheared sample compared to a standard 5% trim.
Figure 6.
Comparison of (a) yield stress and (b) crossover stress of LiC2 worked for 60 strokes using an overfilled sample compared to a pre-sheared sample compared to a standard 5% trim.

Figure 7.
Cone penetration vs rheometer penetration for various greases with a 5 N normal force.

Figure 8.
Comparison of (a) yield stress and (b) crossover stress with rheometer penetration at a force of 5 N for various grease types.
Figure 8.
Comparison of (a) yield stress and (b) crossover stress with rheometer penetration at a force of 5 N for various grease types.

Figure 9.
Yield stress vs crossover stress for various greases.

Figure 10.
Cone penetration vs yield stress for various greases.

Figure 11.
Cone penetration vs crossover stress for various greases.

Figure 12.
Cone penetration (CP) vs crossover stress (CS) for various grease types with a power fit.
Figure 12.
Cone penetration (CP) vs crossover stress (CS) for various grease types with a power fit.

Figure 13.
Smooth texture of worked grease in the cup below compared to the rough texture of unworked grease above it.
Figure 13.
Smooth texture of worked grease in the cup below compared to the rough texture of unworked grease above it.


Table 1.
National Lubricating Grease Institute (NLGI) grades and applications [18].
Table 1.
National Lubricating Grease Institute (NLGI) grades and applications [18].
| NLGI Grade | Penetration [dmm] | Food Equivalent | Common Application |
|---|---|---|---|
| 000 | 445–475 | Ketchup | Gear boxes/low temperature use |
| 00 | 400–430 | Yogurt | Gear boxes/low temperature use |
| 0 | 355–385 | Mustard | Centralized lubrication systems |
| 1 | 310–340 | Tomato paste | General purpose bearings |
| 2 | 265–295 | Peanut butter | General purpose bearings |
| 3 | 220–250 | Butter | High-speed bearings |
| 4 | 175–205 | Frozen yogurt | Very high-speed bearings |
| 5 | 130–160 | Fudge | Low-speed journal bearings |
| 6 | 85–115 | Cheddar cheese | Very slow journal bearings |
Table 2.
Greases used.
| Grease Abbreviation | Thickener Type | Labeled NLGI Grade |
|---|---|---|
| LiC00 | Lithium complex | 00 |
| LiC0 | Lithium complex | 0 |
| LiC1 | Lithium complex | 1 |
| LiC2 | Lithium complex | 2 |
| LiC3 | Lithium complex | 3 |
| AlC2.1 | Aluminum complex | 2 * |
| AlC2.2 | Aluminum complex | 2 |
| CaS2 | Calcium sulfonate | 2 |
| PU2 | Polyurea | 2 |
* The measured consistency of this grease was approximately grade 1.
Publisher’s Note: MDPI stays neutral with regard to jurisdictional claims in published maps and institutional affiliations. |
© 2021 by the authors. Licensee MDPI, Basel, Switzerland. This article is an open access article distributed under the terms and conditions of the Creative Commons Attribution (CC BY) license (http://creativecommons.org/licenses/by/4.0/).
Share and Cite
MDPI and ACS Style
Gurt, A.; Khonsari, M.M. Testing Grease Consistency. Lubricants 2021, 9, 14. https://0-doi-org.brum.beds.ac.uk/10.3390/lubricants9020014
AMA Style
Gurt A, Khonsari MM. Testing Grease Consistency. Lubricants. 2021; 9(2):14. https://0-doi-org.brum.beds.ac.uk/10.3390/lubricants9020014
Chicago/Turabian StyleGurt, Alan, and Michael M. Khonsari. 2021. "Testing Grease Consistency" Lubricants 9, no. 2: 14. https://0-doi-org.brum.beds.ac.uk/10.3390/lubricants9020014
Note that from the first issue of 2016, this journal uses article numbers instead of page numbers. See further details here.