1. Introduction
The main tasks of lubricants in gear applications are to form a sufficient lubricating film between the meshing gear partners, remove friction heat from the contact area and reduce friction as well as wear. Consequently, the selected lubricants should reduce the risk of damage on the tooth flanks of the meshing gears. Various typical damages on the gear flanks are highly dependent on the used lubricant regarding the base oil and containing additive packages. These damages are scuffing, sliding wear, pitting and micropitting [
1].
Scuffing is defined as an instantaneous welding of the mating surfaces and leads to failures in corresponding flank areas. As a consequence, the profile form changes, which leads to increased dynamics. Additionally, friction martensite of high hardness is formed on the surface. This leads to a temperature influenced zone of low strength below the surface and a rough surface with high notch effects [
2,
3].
Sliding wear is the continuous material loss of the surface in each load cycle, whereas the pitch point, where pure rolling is located, remains stationary. Wear leads to increased noise behavior, because of the deterioration of accuracy. Additionally, wear leads to a pointed tooth, which leads to a reduction of the contact ratio. Because of the reduced critical section at the tooth root the risk of tooth root breakage increases [
4,
5].
Pitting is a fatigue failure of the tooth flank, which occurs predominantly in areas of negative specific sliding. The crack initiation is located on or near the surface and the cracks propagate into the material. This leads to shell shaped outbreaks, which lead to increasing noise and vibrations. This failure often develops progressive for case hardened gears until tooth breakage [
6,
7,
8]. Recent studies on long-cycle contact fatigue experiments to determine pitting lives in a statistically are conducted in [
9].
Micropitting is a surface fatigue phenomenon, which is the result of numerous small surface cracks. It occurs in Hertzian rolling and sliding contacts under unfavourable lubrication regimes in EHL-contacts and usually on materials with a high surface hardness. It can be optically detected as a grey and dull area on affected surfaces. Micropitting also occurs predominantly in areas of negative specific sliding. Because of micropitting the involute profile changes due to profile deviations and the noise as well as the dynamic forces increase. Micropitting also has an influence on pitting lifetime and capacity [
10,
11,
12,
13,
14].
Figure 1 shows the typical appearance of scuffing, sliding wear, pitting and micropitting on gear flanks.
Since damages on gear flanks limit the durability of a gear box, selecting a suitable lubricant increases the gear load carrying capacity. In order to rate the load carrying capacity of lubricants, different test methods were established. Lubricants often contain performance additives, which lead to complex physical-chemical interactions strongly depending on the operating conditions (e.g., temperature) between the lubricant components and the gear material. As a result, the performance of gear lubricants cannot be estimated theoretically and must be verified in lubricant tests [
2,
5,
10,
15,
16,
17,
18,
19,
20].
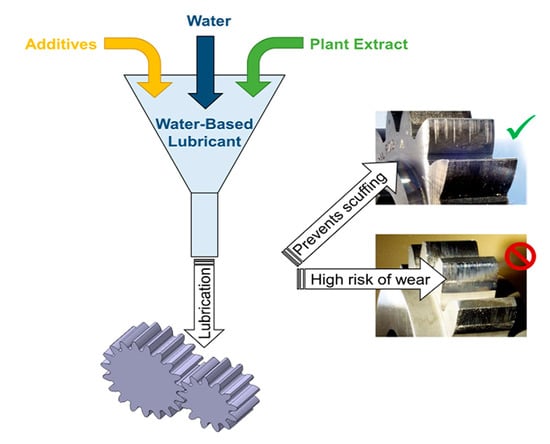
Especially for newly developed lubricants such as environmentally friendly lubricants, the performance has to be ensured and classified. Water-based or water-containing fluids have many advantages, for example a very high thermal conductivity and a low friction coefficient. This leads to improved efficiency and heat balance of gearboxes [
21,
22]. The main challenge for especially water-based lubricants is to ensure a load carrying capacity regarding scuffing, wear, pitting and micro-pitting. Several studies on water-based or water-containing fluids have been conducted. For example in [
23,
24,
25] experimental investigations were carried out with mineral-oil, pure water and oil-in-water working fluids containing carbon nanocapsules. In [
26] synthetic polymers are examined regarding their surface interactions and in [
27] the coefficient of friction of a water-based fluid is determined for different shear rates. For water-based lubricants a sufficient lubricant film thickness and/or adequate additives are needed in order to avoid tribological influenced damages such as wear and scuffing on the surface of gear flanks. By adding polymers from plant extract to water, the viscosity increases, and the fluid is still biodegradable. A higher viscosity of a fluid correlates with a higher lubricant film thickness. Therefore, a selection of polymer as well as additive packages were defined, and four samples were investigated regarding their scuffing resistance. One sample of these four samples was considered for further investigations regarding its wear resistance. Additionally, after the investigations on the wear resistance, measurements with a Mini-Traction Machine (MTM) and Oscillating Friction and Wear Tests (SRV) were conducted with different polymers in order to optimize the stability, corrosion and wear resistance of the lubricant.
2. Materials and Methods
Scuffing on gears leads to a limited gear load carrying capacity, because of the changed properties on and below the flank surface of the gears. A typical scuffing damage on a gear wheel can be seen in
Figure 1a. The main influence parameters on scuffing, beside the lubricant properties itself, are the oil temperature, the load, the coefficient of friction and the sliding speed. In order to avoid scuffing, a maximum allowable temperature in the contact area, which depends on the combination of gear material and gear lubricant as well as the kind of heat dissipation and lubrication system, may not be exceeded. Therefore, the microstructure in the case-hardened layer regarding the retained austenite and the geometrical accuracy as well as the profile modifications are important for the scuffing load carrying capacity. Especially the type of additives as well as the additive concentration, the oil viscosity and the chemistry of the base oil, which influences the coefficient of friction, have a high impact on the scuffing load carrying capacity [
2,
28].
Occurring sliding wear, which will also be referred to wear in the following, leads to mass loss and a wearing off of the hardened case layer, which limits the gear load carrying capacity. A typical wear damage on a gear wheel can be seen in
Figure 1b. The characteristic parameter for the risk of wear is the minimum lubricant film thickness. As a result, the viscosity and the additives of the gear lubricant are important for the wear load carrying capacity. The gear geometry regarding the sliding speed, the gear module and adequate profile modifications also have an impact on the wear behavior. Additionally, the wear load carrying capacity is influenced by the heat treatment, the surface hardness, the surface roughness and the accuracy grade of the gears [
4,
28].
In the following the experimental setup for the FZG back-to-back test rig and the used test methods for the determination of the scuffing and wear resistance as well as the coefficient of friction are described.
2.1. Experimental Setup of the FZG Back-to-Back Test Rig
The FZG scuffing test and the FZG slow speed wear test are conducted on the FZG back-to-back test rig according to ISO 14635-1 [
2]. “The test rig consists of test gears and slave gears with an identical gear transmission ratio. The test gears and the slave gears are connected through two torsional shafts. The pinion of the test gear and the pinion of the slave gear are mounted on the same shaft and the wheel of the slave gear as well as the wheel of the test gears are located on the other shaft. The shaft between the pinions is divided into two parts that are connected by a coupling. While this coupling is opened at standstill, one coupling flange is fixed and the other flange is loaded with a lever and weights to introduce a static torque into the system. After locking the coupling, the lever is removed and the electric motor can be started. For adjusting the defined torque, different weights are hung on the loading arm. The motor only has to compensate the power losses in the system, which allows a very energy efficient testing” [
29].
The test gears run dip lubricated with the test lubricant at a constant speed for a fixed number of load cycles. The lubricant temperature is controlled thermostatically with the help of a temperature sensor and electric heating elements in the housing of the test gearbox.
2.1.1. Scuffing Test According to DIN ISO 14635-1
The scuffing test according to DIN ISO 14635-1 [
2] is conducted on the FZG back-to-back test rig, which is described in
Section 2.1. “The gears of type “FZG-A” are applied for this test method. The test gears are designed as spur gears with 16 teeth on the pinion and 24 teeth on the gear, normal module of 4.5 mm, no tooth correction and a pressure angle of 20°. The center distance is 91.5 mm and the effective tooth width is 20 mm for both partners. The test gears are made of case hardening steel and they are case-carburized with a surface hardness of 60–62 HRC in the area of the tooth flank. Details of this type of gearing are summarized in
Table 1 [
29].”
“The test consists of 12 load stages. After every stage, the torque of the pinion is increased. The first stage starts with a torque of 3.3 Nm (load stage 1) and can be raised to a maximum of 534.5 Nm (load stage 12). The Hertzian contact pressure is increasing from pC = 146 N/mm2 to a maximum of pC = 1841 N/mm2. The speed in the standard test is 1.455 rpm at the wheel, equivalent to a circumferential speed of vt = 8.3 m/s. The defined running time per load stage is 15 min.
In general, the test gears are removed from the test rig after load stage 4 for a close observation of the damage on the flanks of the gears. If the summed-up width of the scuffing damages from all teeth is larger than the width of a flank (20 mm) the test is finished and the last running step is identified as the failure load stage. This allows a classification of the lubricant regarding scuffing. The test is ended when the failure criterion has been met and or when the last load stage has been completed without meeting the failure criterion. In order to ensure that the damage on the surface is significantly caused by scuffing light microscopic inspections of the tooth flanks are conducted [
29].”
2.1.2. Slow Speed Wear Test according to DGMK 377-01
The wear test according to DGMK 377-01 [
5] for determining the wear behavior of gear lubricants is carried out on a modified FZG back-to-back test rig. The basic principal of the test rig is shown schematically in
Section 2.1. A test gear pair with defined geometry (type C-PT) is used for the test execution. The test gears are designed as spur gears with 16 teeth on the pinion and 24 teeth on the gear, a normal module of 4.5 mm, no tooth correction and a pressure angle of 20°. The center distance is 91.5 mm and the effective tooth width is 14 mm for both partners. The test gears are made of case hardening steel and they are case-carburized with a surface hardness of 750 ± 30 HV1 in the area of the tooth flank. Details of this type of gearing are summarized in
Table 2.
It should be noted that FZG-A-type and FZG-C-type gears have significantly different profile shift coefficients, resulting in strongly different values of sliding speed on pinion and wheel and therefore promoting different failure modes.
In the standard slow speed wear test, the first test interval is run at a circumferential speed of 0.05 m/s and a lubricant temperature of 90 °C for 40 h. This is followed by a test interval at 120 °C and the same circumferential speed for 40 h. Finally, the wear development at a higher speed is examined. This final test interval is carried out at a circumferential speed of 0.57 m/s and a lubricant temperature of 90 °C for 40 h. During all test intervals, the same test gear pair is used.
In the first and second test interval, the weight loss of the pinion and wheel is determined after 20 h and 40 h. For the third test interval, the measurement of the weight loss is carried out after 40 h. Classification into the wear categories “low”, “medium”, “high” and “very high” is carried out for each test interval (40 h) based on the cumulative weight loss of pinion and wheel per test interval. In addition, light microscopic inspections of the tooth flanks ensure that the loss of mass is significantly caused by wear.
2.2. Principle of the Water-Based Lubricant Technology
“In general, lubricants consist of a base fluid such as oil, polyglycol or water mixed with additives. For this the herein investigated lubricant, a liquid solution of water and polymers forms the base fluid. These polymers are gained by plant extracts and increase the viscosity of the mixture in comparison to the base fluid [
29].” The water content for the investigated samples is >85%. Additives are added to the base fluid in order to affect the physical and chemical properties of the fluid. The base fluid is the main component of the lubricant and spreads and/or dissolves the additives to influence the tribological impact on the surface [
4]. There are different polymer thickeners (e.g., cellulose derivate, polyvinylpyrolidon etc.) in various chain length available to modify the water viscosity in a wide range which makes this technology in many processes applicable. However, these polymers differ in its sheer stability, compatibility with other additives and biological resistance. Therefore, it is necessary to choose the right polymer to meet the demands of a certain process application. Beside anti wear (AW) and extreme pressure (EP) additives these formulations require a proper corrosion inhibitor to prevent the application system of rust and additives to enhance the biological resistance of the fluid. Further information is given in
Section 3.2 and
Section 3.3.
2.3. Mini-Traction Machine (MTM)
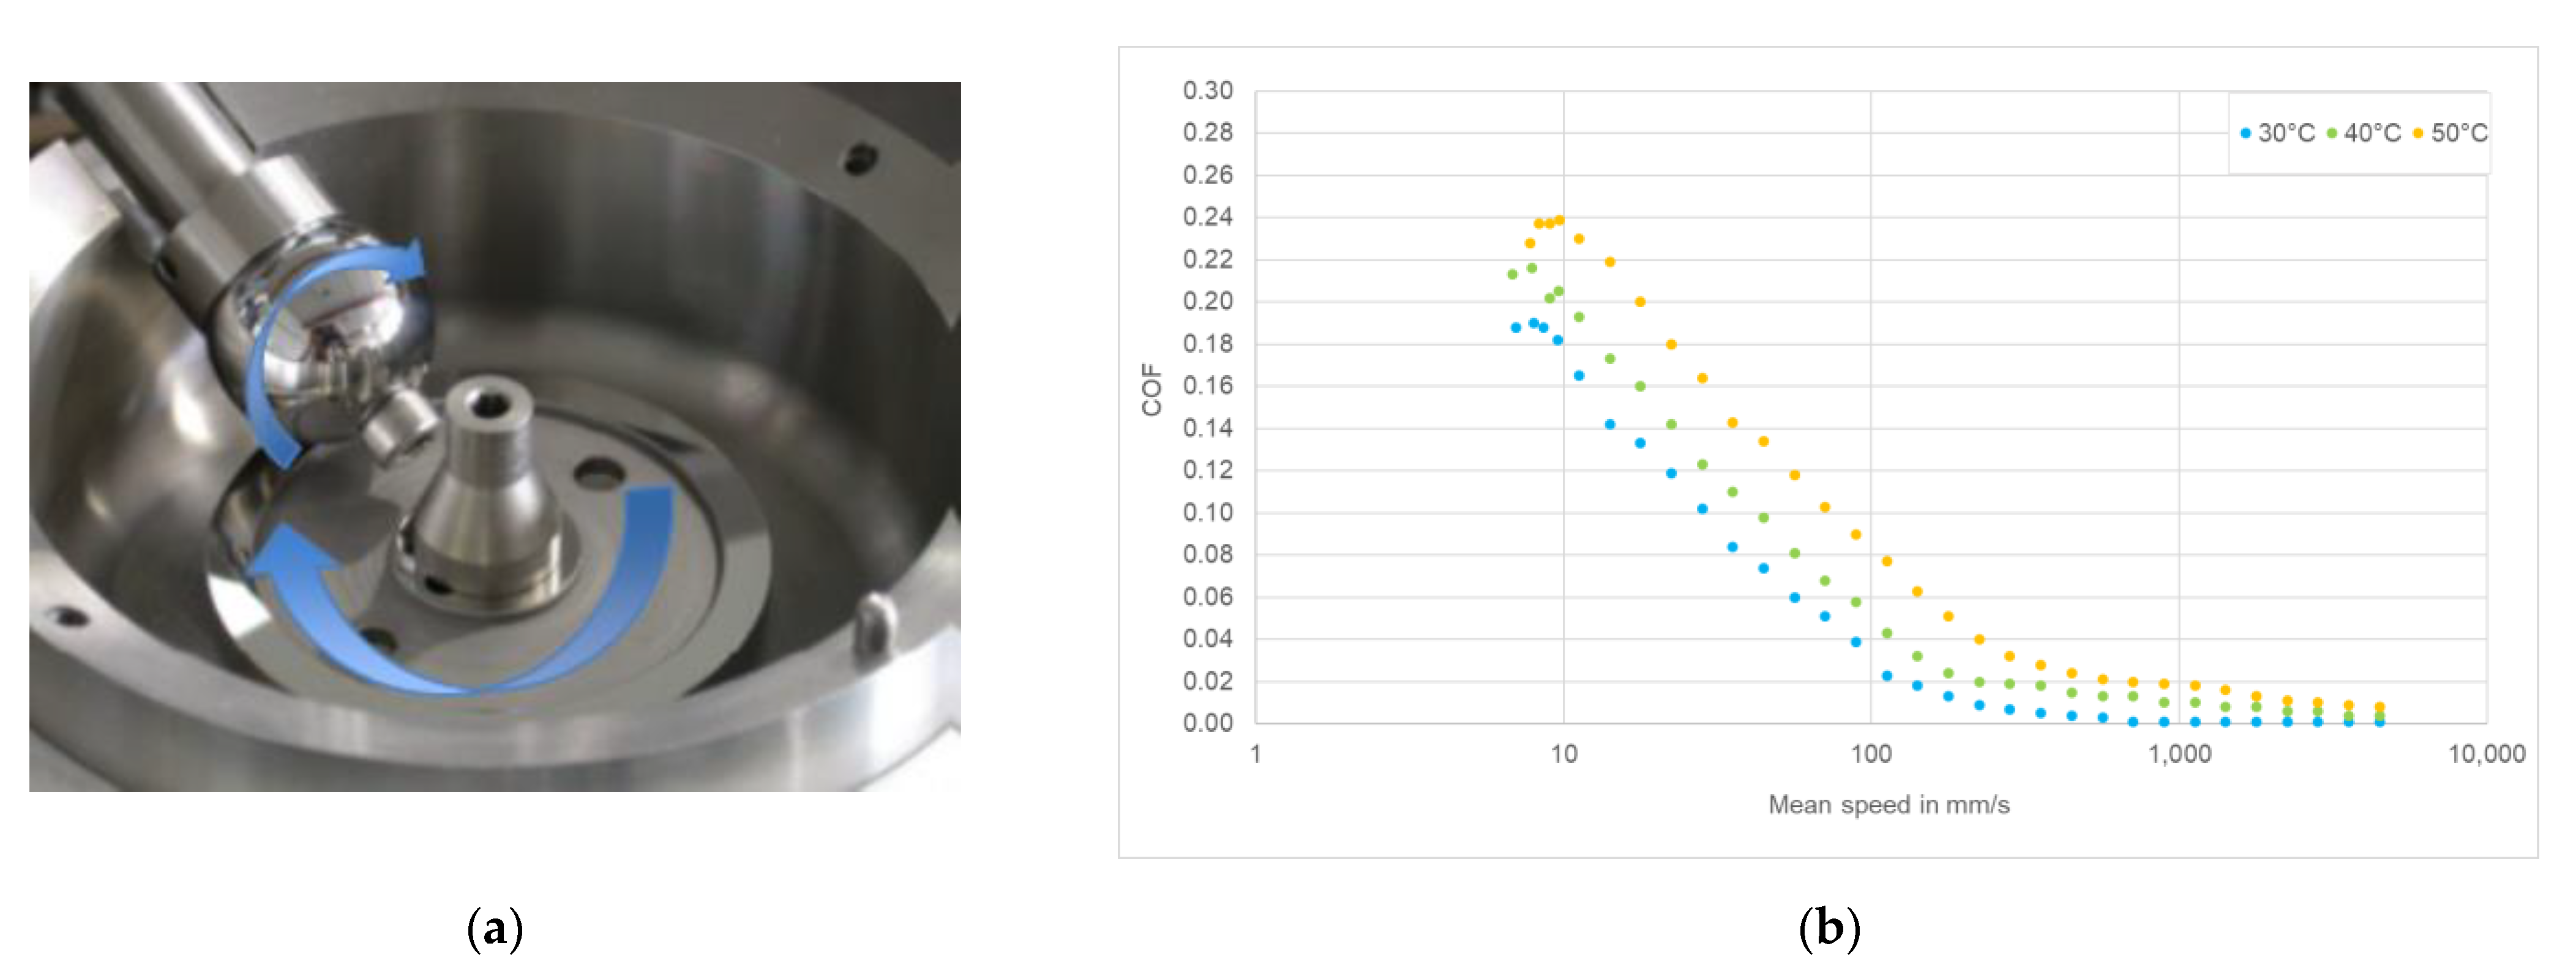
The Mini-Traction Machine (MTM) is a multi-purpose instrument for measuring friction and traction properties of lubricated and unlubricated surface contacts, under a wide range of rolling and sliding conditions. The MTM allows to investigate friction and traction using a variety of materials, geometrical contacts, oil temperatures and contact pressures. One of the main uses of the MTM is to measure friction between lubricated steel surfaces. The MTM is used to determine the friction profile, typically recorded in the form of a Stribeck curve for metal—metal contacts.
Figure 2 shows the test scheme and a typical test run at different temperatures.
2.4. Oscillating Friction and Wear Test (SRV)
The oscillating friction and wear test (SRV) is a tool which is widely used in lubricant development for a long time already. With the SRV-bench especially the mixed and boundary friction conditions of the rolling-sliding process (forward- and backward-slip) can be simulated. This test method gives fast, good differentiating and reproducible results, as e.g., the friction coefficient (COF) at various conditions (load, temperature, etc.). The oscillating movement of the tribo-system relies in accordance with the forsaken load, a praxis approached strain profile, in which the oscillation approximately realizes the above mentioned forward- and backward-slip. Further statements about the stick-slip-behavior can be deduced from the test.
The upper specimen oscillates on the lower specimen in a sinusoidal movement shape. The lateral friction force, which results from the movement of the upper on the lower specimen is measured. The COF is calculated and logged during the whole test duration.
Figure 3 shows the test scheme of SRV.
3. Results
Experimental investigations were carried out regarding the scuffing and sliding wear capacity of different samples. All fluid samples, which were investigated experimentally, had a kinematic viscosity of 34 mm2/s at 40 °C.
3.1. Scuffing Test A/8.3/RT acc. to DIN ISO 14635-1
The scuffing tests according to DIN ISO 14635-1 [
2] were carried out at room temperature with different lubricant samples.
Table 3 shows an overview of the used lubricant samples. In the first step, scuffing tests were carried out with sample 1 and sample 2. Both samples contain the same additive- package (I) but different plant extracts (a and b). In both tests a massive foam formation was observed. The test with sample 2 showed a higher scuffing load carrying capacity. Due to the massive foam formation in the test with both samples, a new sample (sample 4) was prepared with the same plant extract as in sample 2, but with improved additives (II) regarding the foam behavior. The Anti-foaming agents contain organo-modified polysiloxans. Scuffing tests were carried out using sample 4 and sample 3, which is the same mixture without any plant extract.
After carrying out the experimental test with sample 1, the failure load stage 7 was found. For sample 2, the failure load stage 10 was reached in the first test run. In a repeat run with sample 2, the failure load stage 9 was achieved. This is within the range of the repeatability of the test procedure. Beside the strong foam formation, no other abnormalities such as corrosion phenomena were detected during the test with the samples 1 and 2.
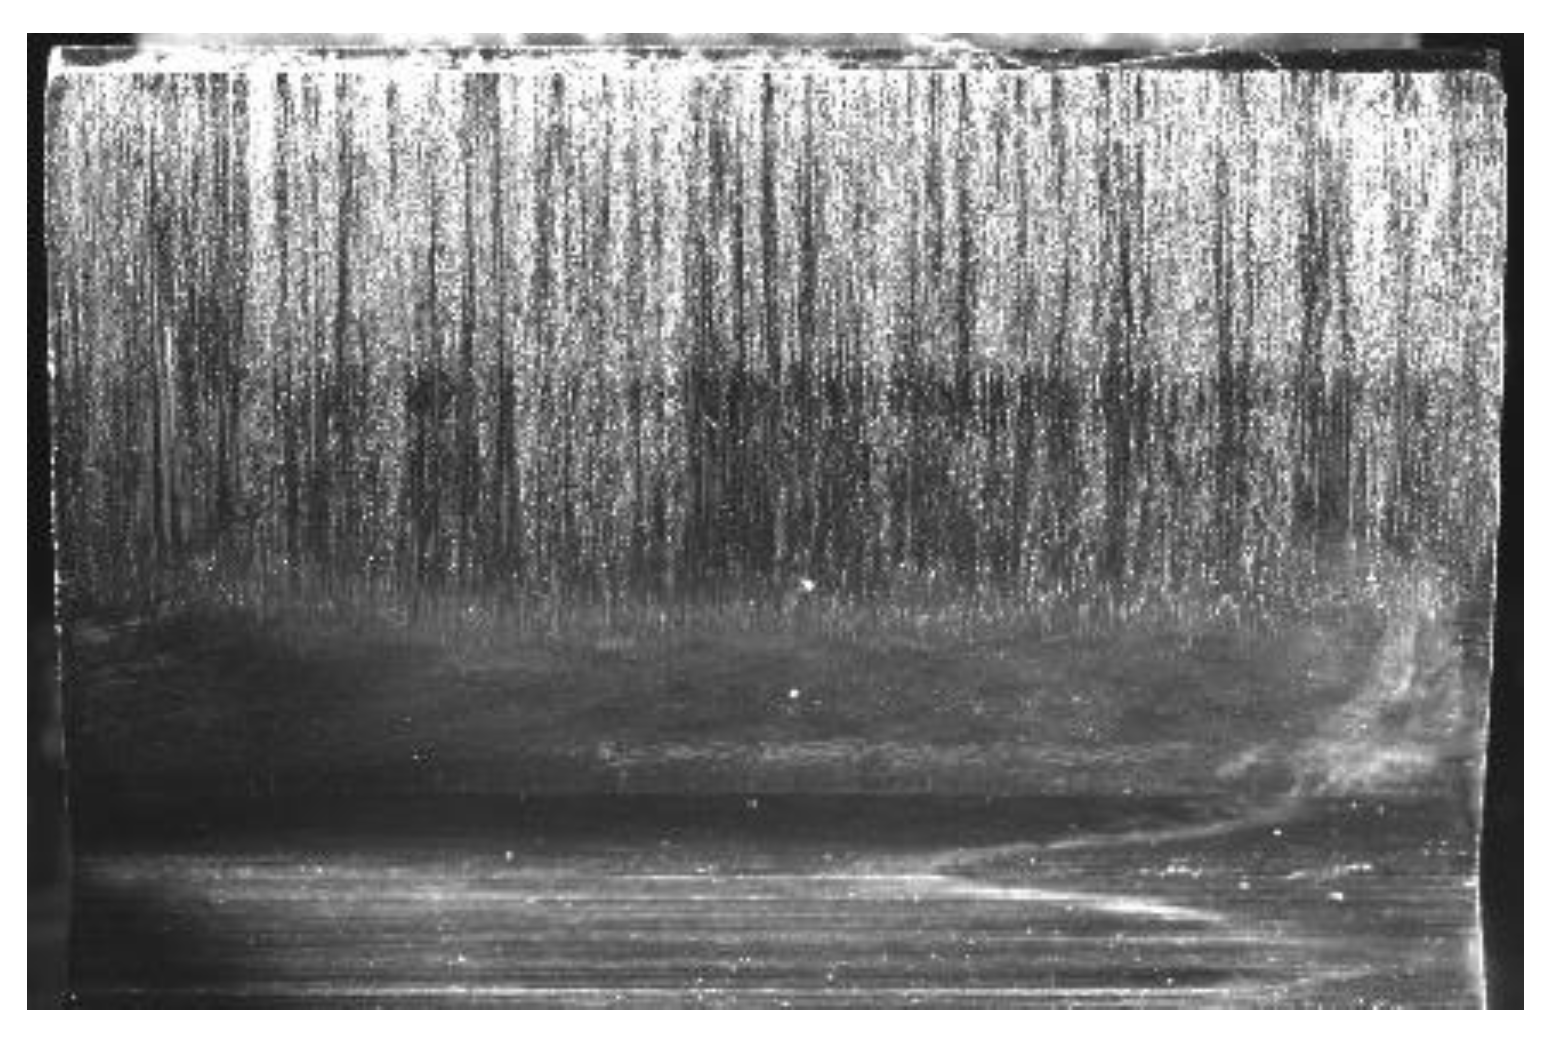
Figure 4 shows an exemplary flank photo of the pinion after the scuffing test with sample 1.
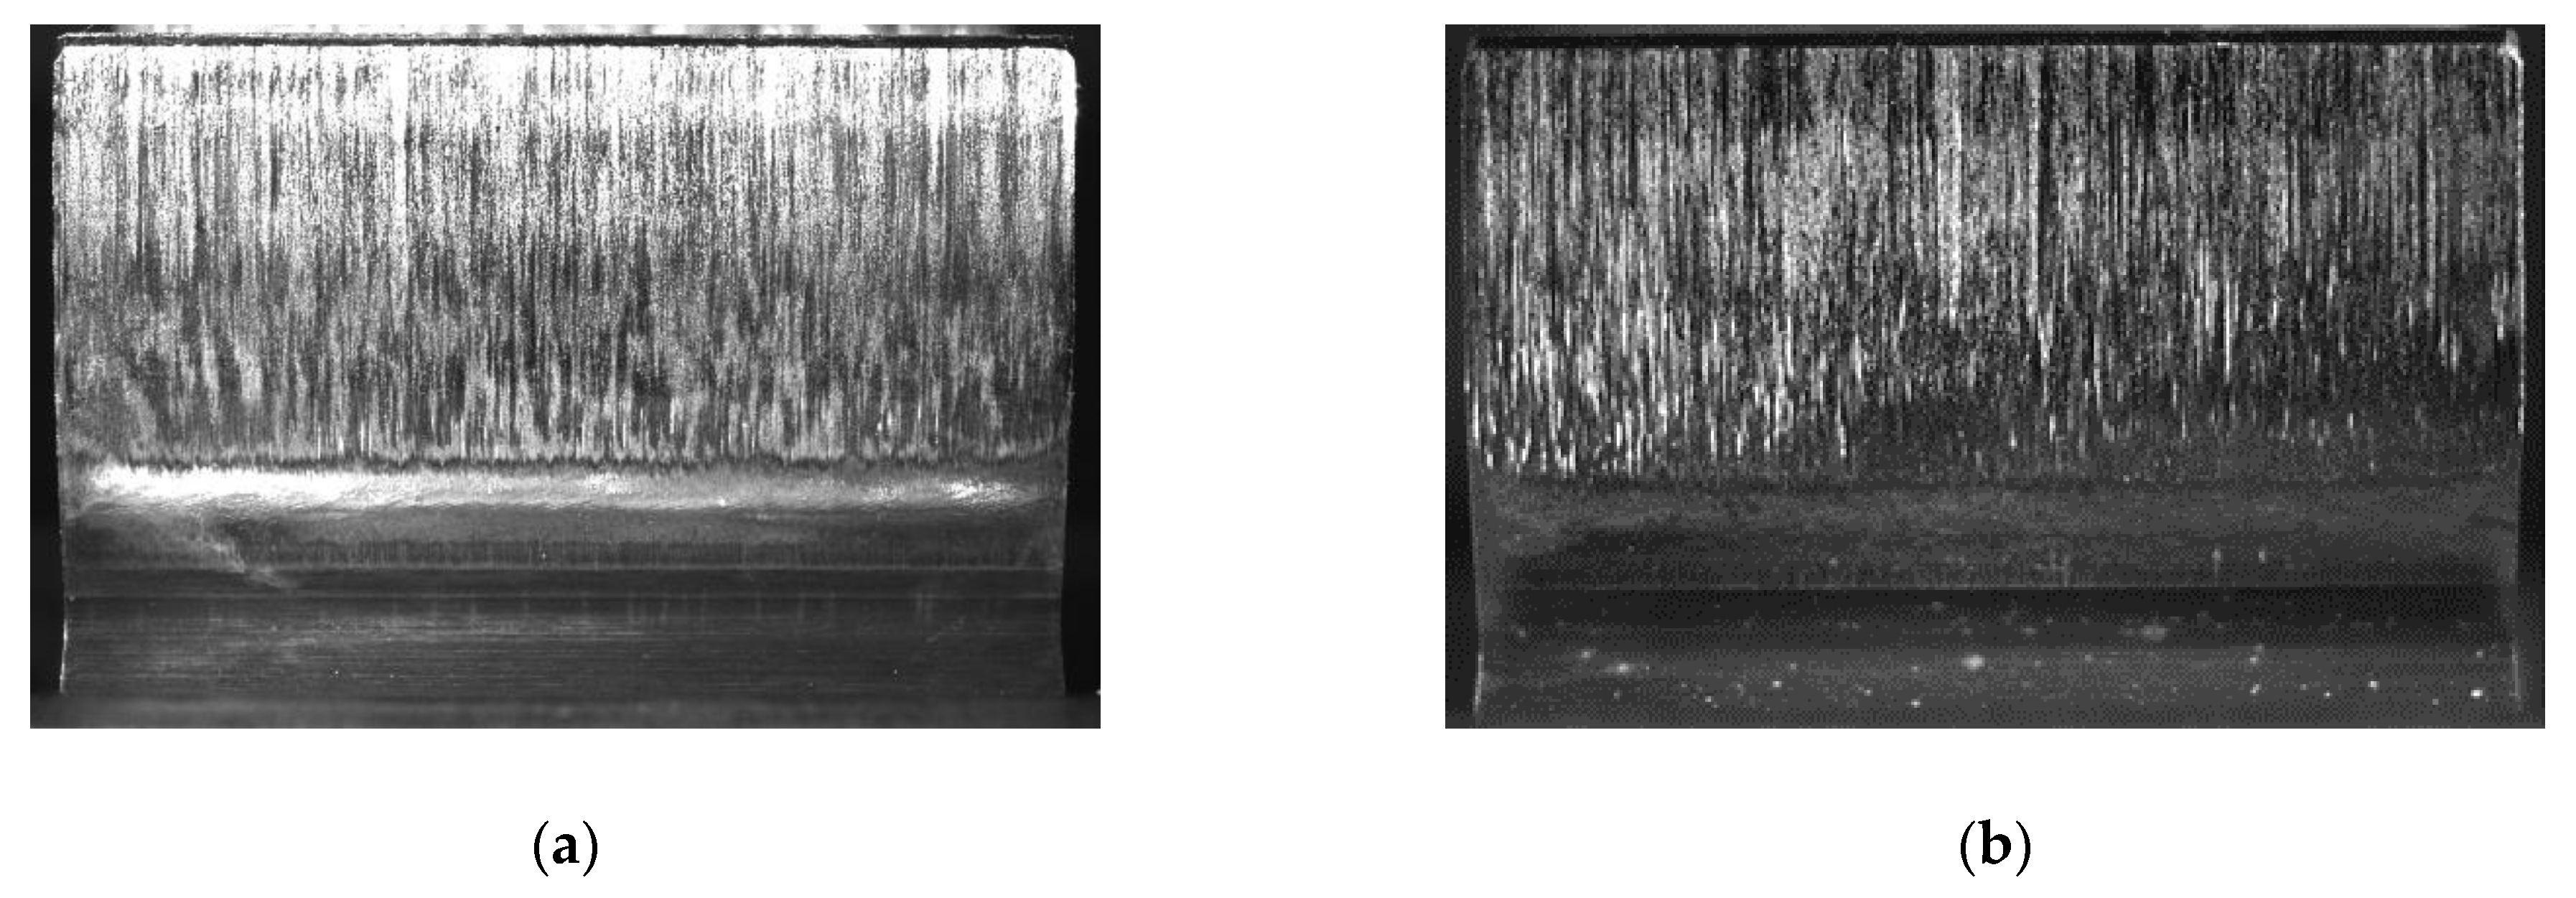
Figure 5 shows exemplary flank photos of the pinions after the scuffing test with sample 2.
For sample 3, the failure load stage 7 was determined on the basis of two test runs. The lubricant temperature at the beginning of the tests was always room temperature.
Figure 6 shows exemplary flank photos of the pinions after the scuffing tests with sample 3.
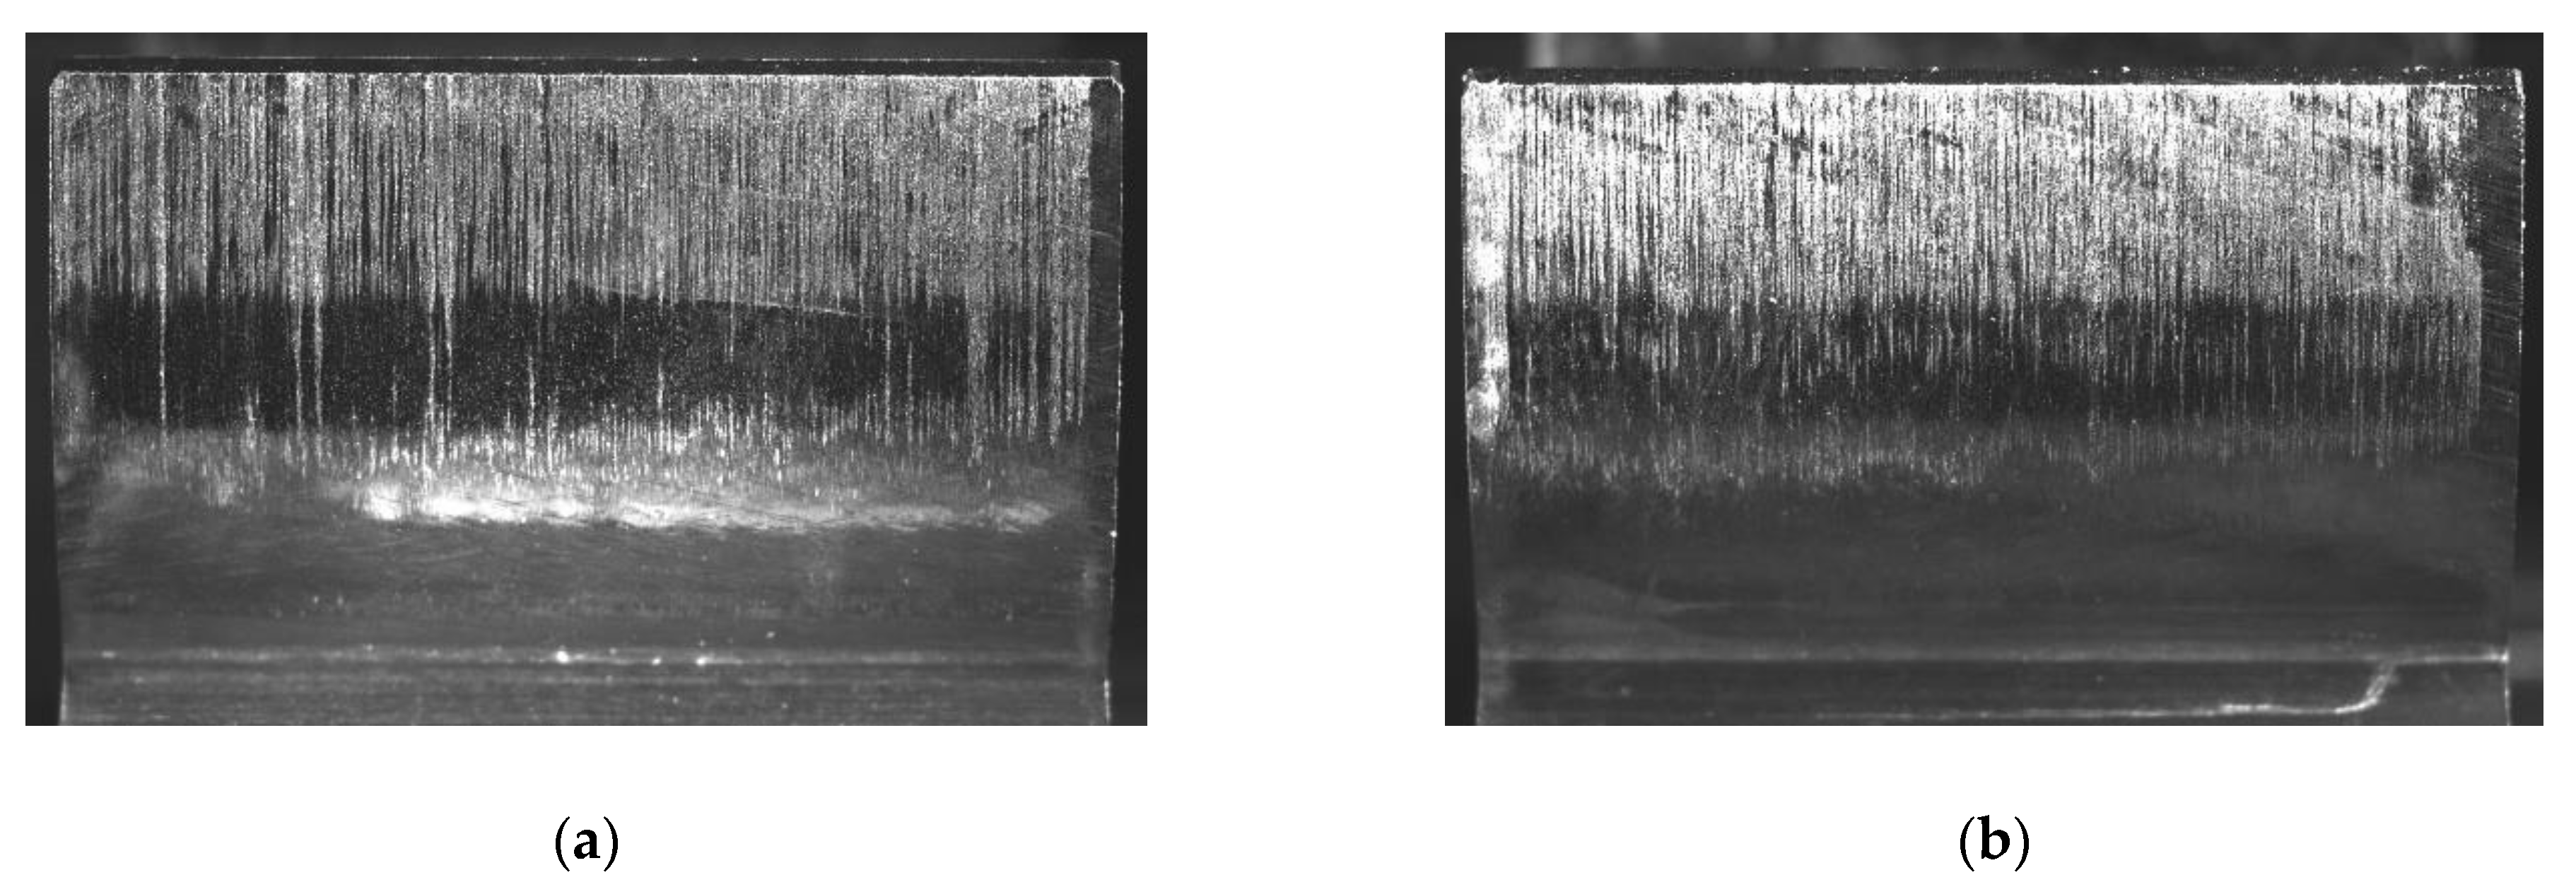
During the execution of the scuffing test with the lubricant sample 4, the failure load stage 8 was reached in the first test run and the failure load stage 9 in the second test run. There was merely little foam formation during the test.
Figure 7 shows exemplary flank photos of the pinion after the scuffing tests with sample 4.
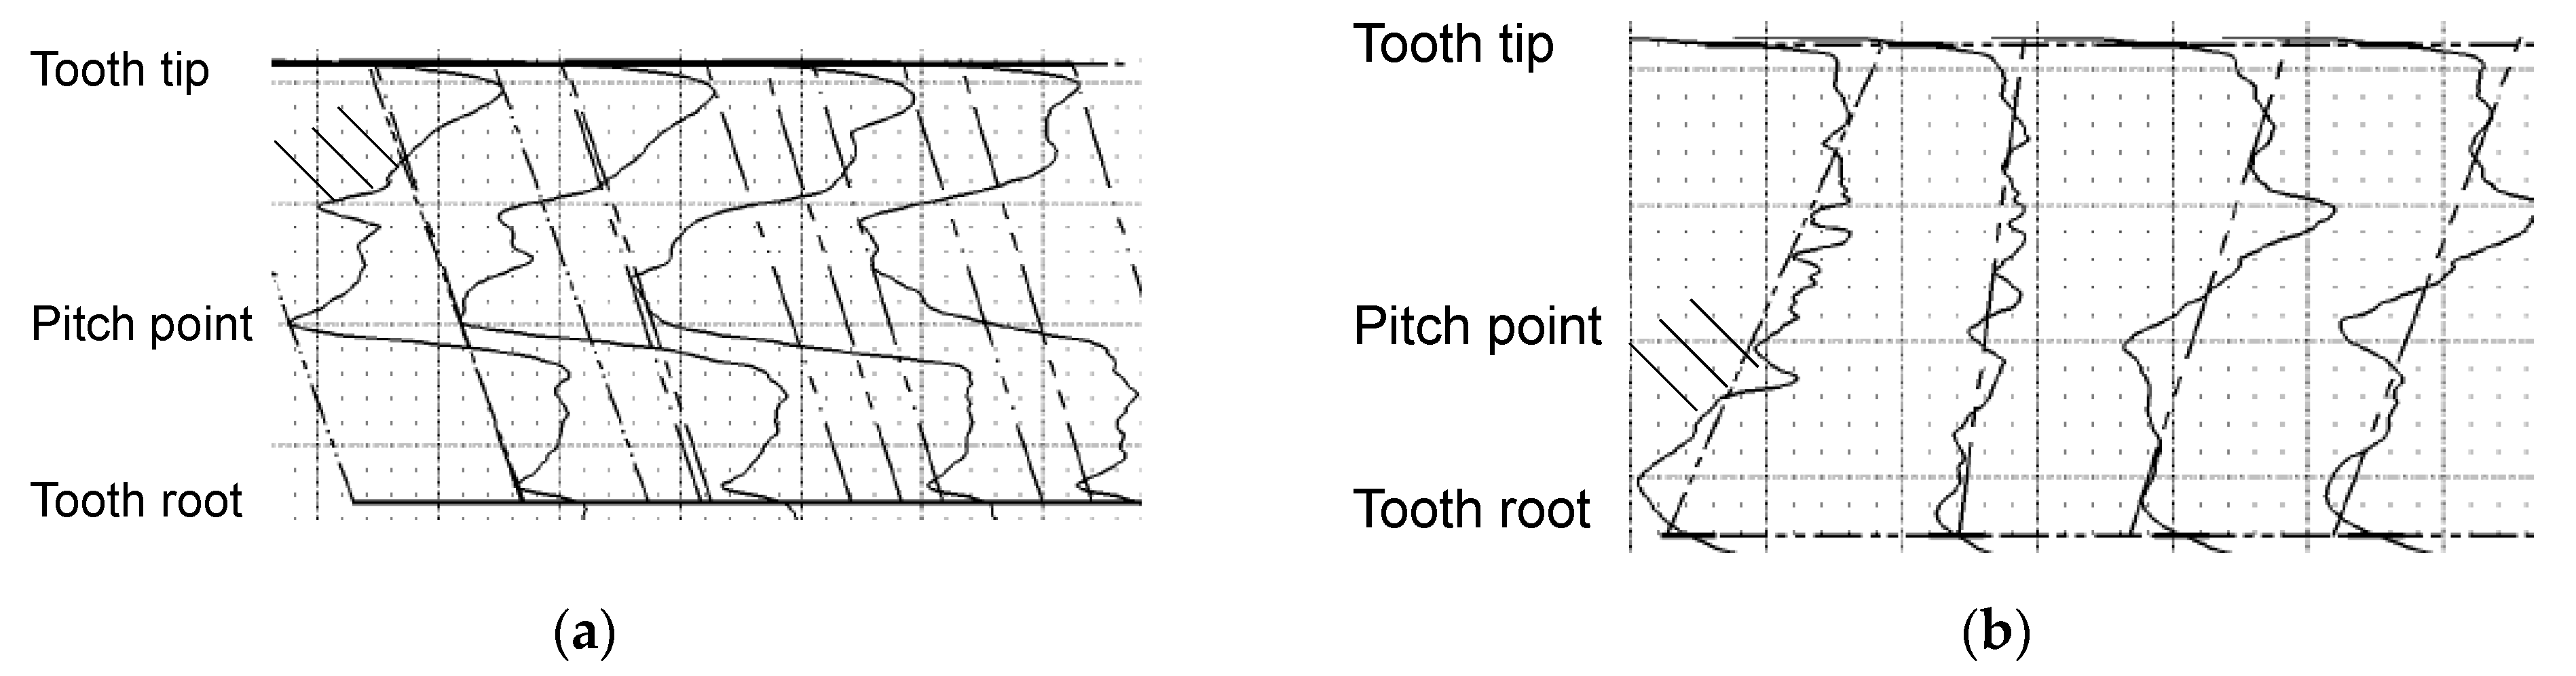
Figure 8 shows exemplary measurements of the profile form of four teeth of the pinion and the wheel after the first test run with sample 4. It can be seen that the main part of the profile deviation is located above the pitch point on the pinion and below the pitch point of the wheel. This is typical for a scuffing damage.
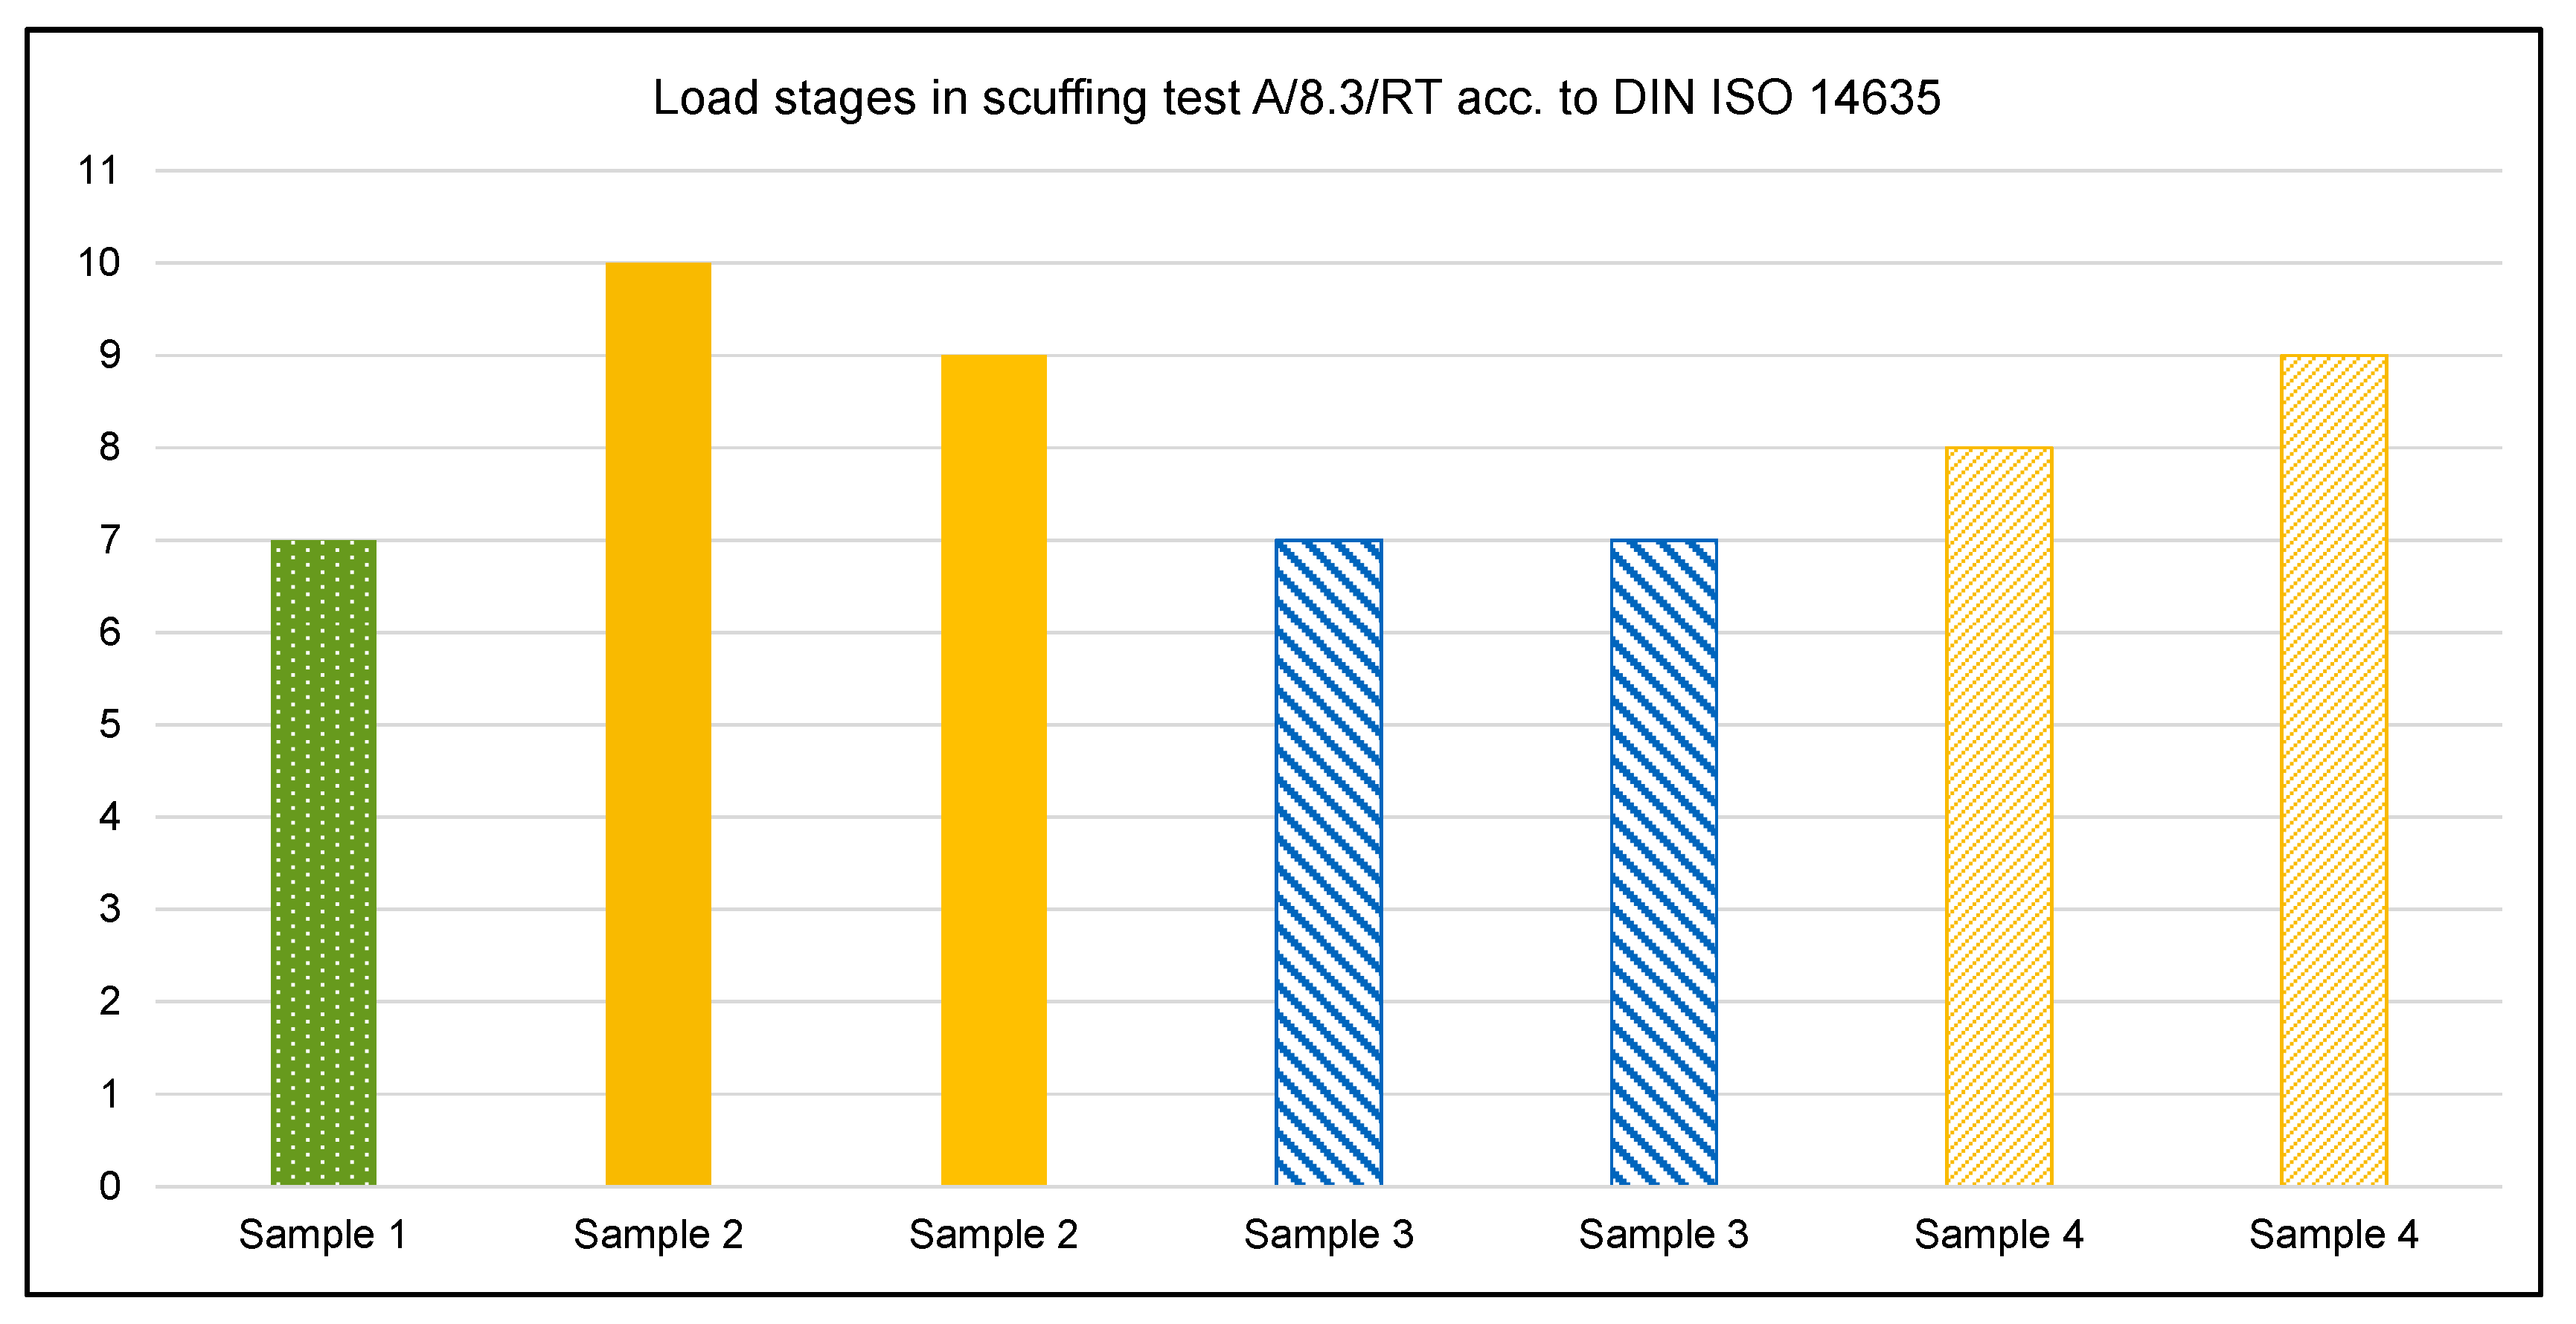
Figure 9 shows an overview of the obtained failure load stages in the scuffing test A/8.3/RT acc. to DIN ISO 14635-1 for all samples. It can be seen that sample 4 shows the best results considering the scuffing resistance and foam behavior.
3.2. Slow Speed Wear Test acc. to DGMK 377-01
The experimental tests based on the slow speed wear test according to DGMK 377-01 [
5] were carried out at room temperature (test interval 1 and 3) and 40 °C (test interval 2), because of the boiling point of water. The load was reduced to a lower load stage compared to the standard load stage 12. The circumferential speed was not changed compared to the standard test. Two tests were carried out on different load stages. For both tests, sample 4 acc. to
Table 3 was used.
3.2.1. Wear Test C/0.05/RT:40/8
The first test was performed at a load of 171.6 Nm (load stage 8). This corresponds to a pressure of 1245 N/mm
2 at the pitch point. The first test interval of this wear test showed clear sliding wear on the tooth flanks. The mass loss corresponded to the wear category “medium”. After the first 20 h in the second test interval at 40 °C, the test gears were enclosed in the test box for about 2 days without any movement of the test gears. As a result, corrosion occurred mainly on the upper half of the gears, which were not in the lubricant bath. In the following tests, the test gears were removed of the test box directly after the test was finished. The weight loss in the test interval with the corrosion was very small. After another 20 h at 40 °C test temperature, most of the corrosion had disappeared and a slight increase of the weight loss was observed. As a result, only slight wear was visible in the second test interval. However, a final evaluation is not possible, as the occurrence of corrosion can have an influence on the weight measurement. In the last test section, the lubricant showed the wear category “medium” again. The values of the sum of the mass loss of pinion and wheel over the test run and the corresponding wear categories are shown in
Table 4.
The progress of the wear loss of pinion and wheel is accumulated and plotted in
Figure 10. It can be seen that within the first 20 h in the first test interval the strongest increase of mass loss was detected. The increase of the mass loss during the third test interval with an increased circumferential speed is comparable to the last 20 h of the first test interval and the last 20 h of the second test interval.
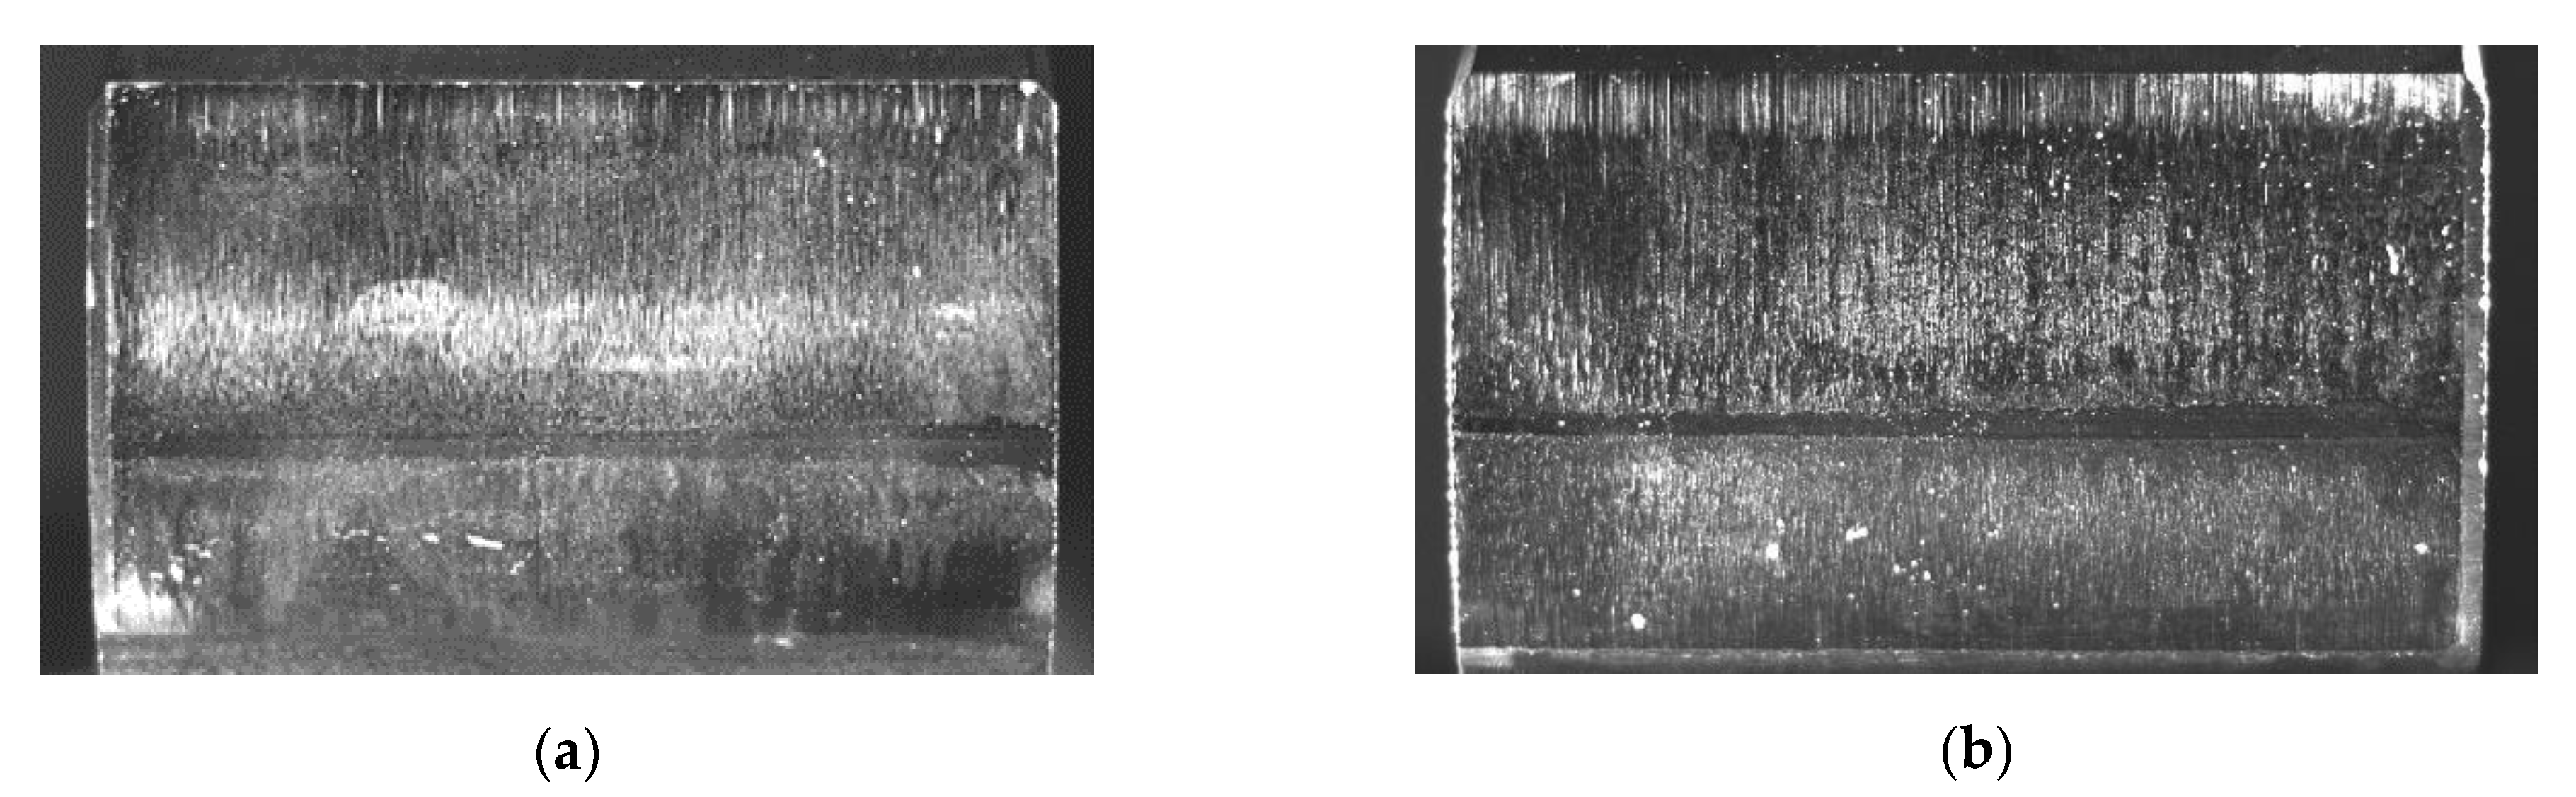
Figure 11 shows exemplary pictures of the flanks of the test gears for pinion and wheel after the testing at load stage 8. It can be seen that the measured mass loss is clearly assigned to wear. The wear damage can be detected above and below the pitch point for pinion and wheel.
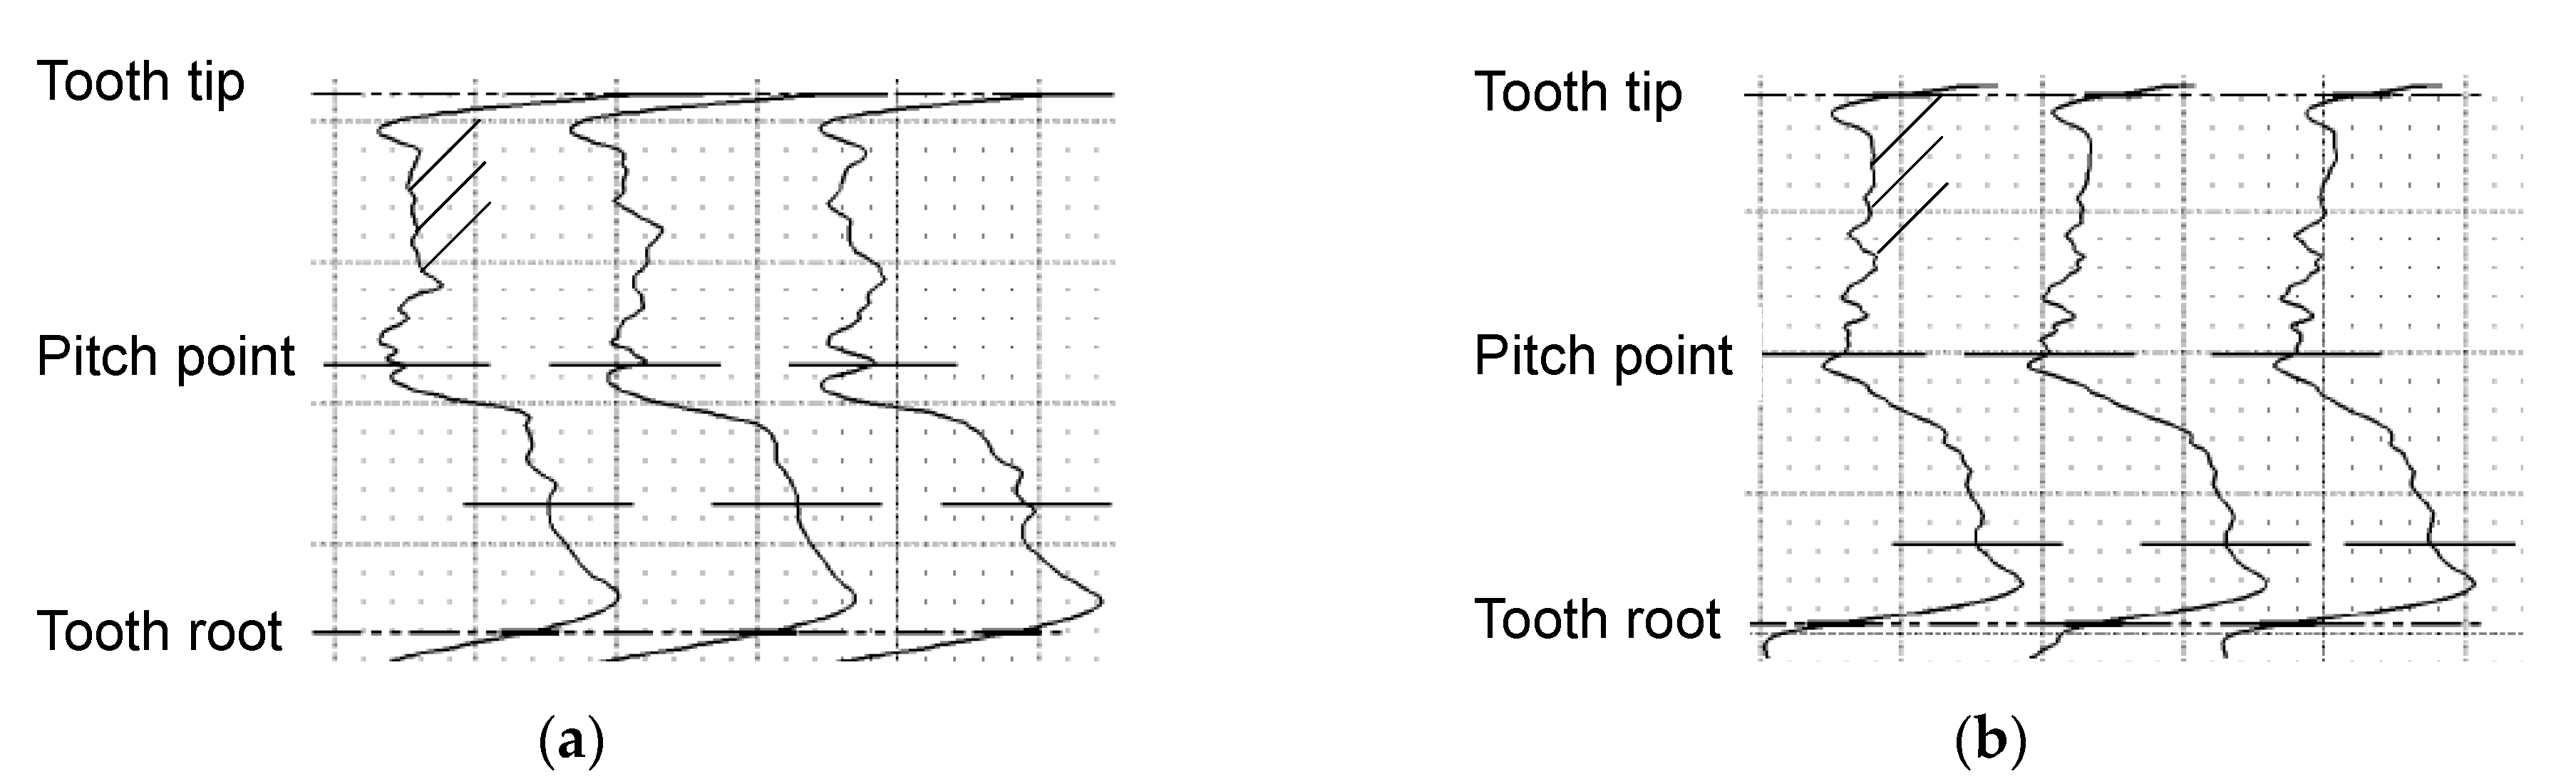
Figure 12 shows the profile measurement of three teeth evenly distributed over the circumference for pinion and wheel. The profile measurement agrees with the optically detected characteristics of the wear damage. A higher material loss can be seen below the pitch point than above the pitch point. Additionally, a scrape mark due to mesh interference can be detected in the dedendum of the pinion and wheel.
3.2.2. Wear Test C/0.05/RT:40/10
The second test was performed at a load of 265.1 Nm (load stage 10). This corresponds to a pressure of 1547 N/mm
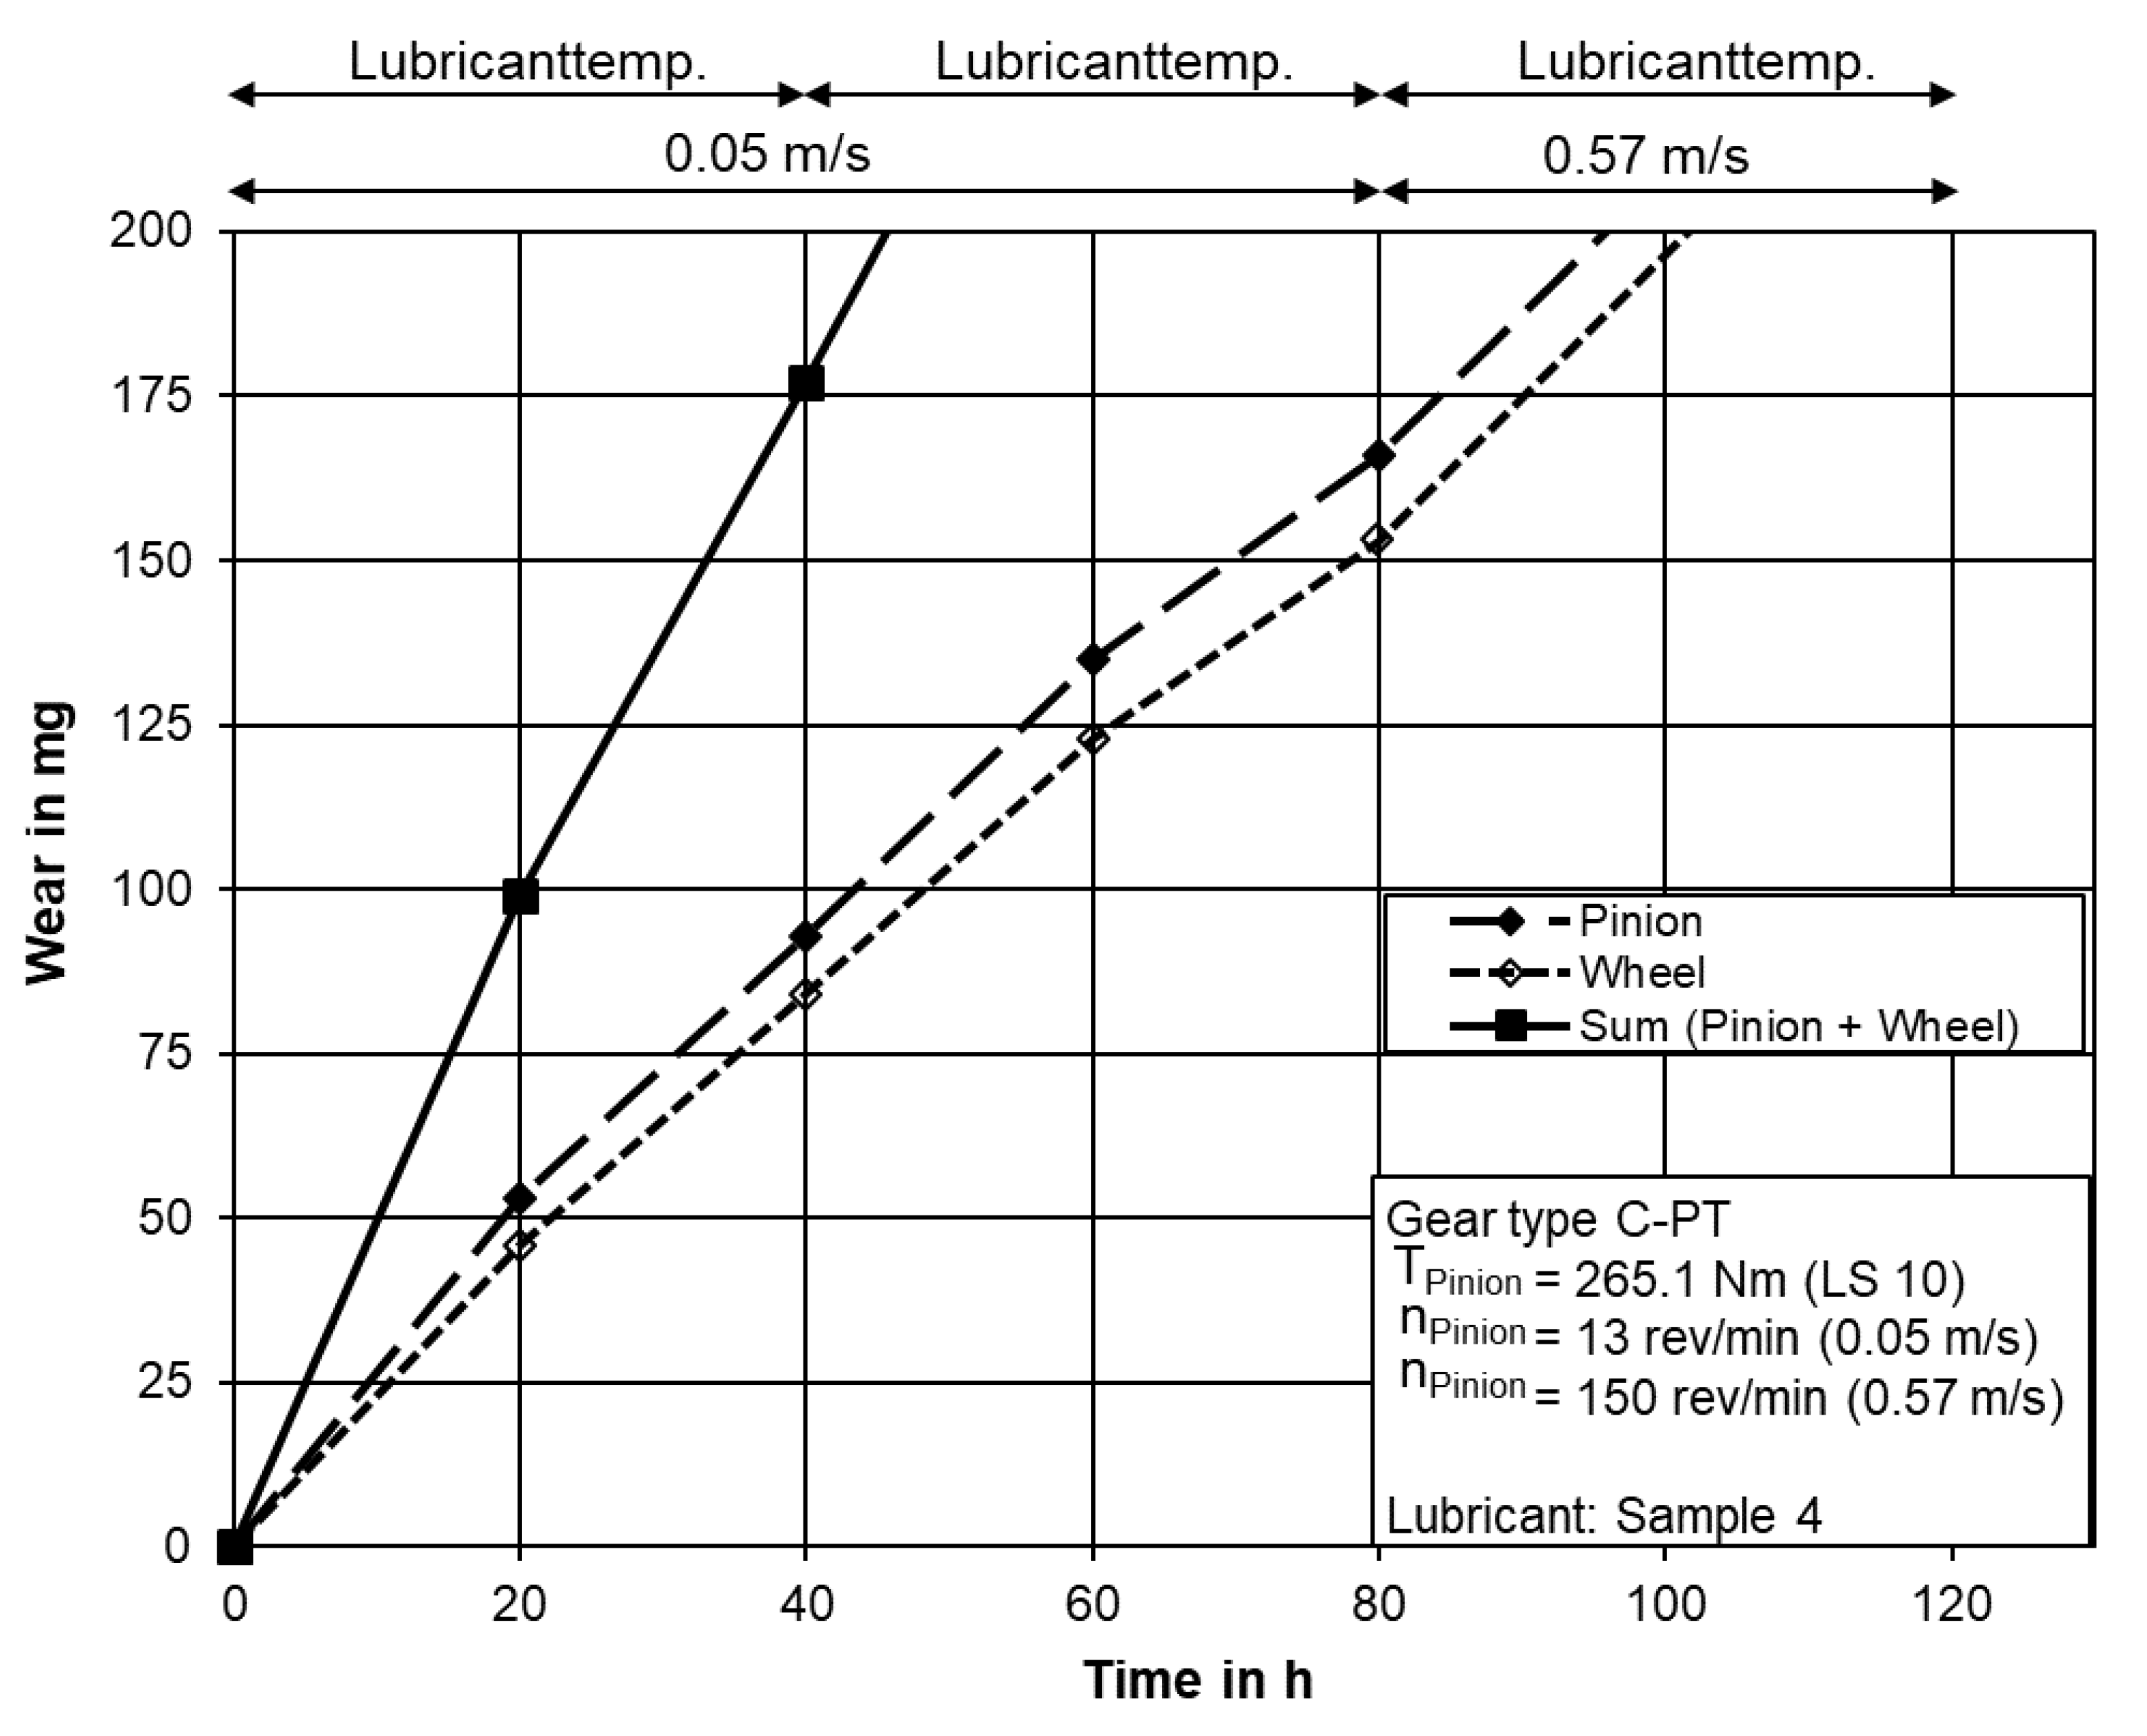
2 at the pitch point. In the first test interval of this wear test, wear could clearly be detected. The first interval was assigned to the wear category “high”. During the second test interval, the wear increased slightly less than in the first test interval. This was formally assigned to the wear category “medium”. It should be noted, that the absolute values of the first and second interval are almost comparable. In the last test section, which was carried out at room temperature, the lubricant was again assigned to the wear category “high”. The cumulative values of the mass loss of pinion and wheel over the test run are shown in
Table 5 and plotted in
Figure 13.
A linear gradient can be seen over the individual test sections. During the test section at 40 °C, slightly less wear was determined than at room temperature. The gradient in the diagram at 40 °C is slightly less strong than in the test sections at room temperature.
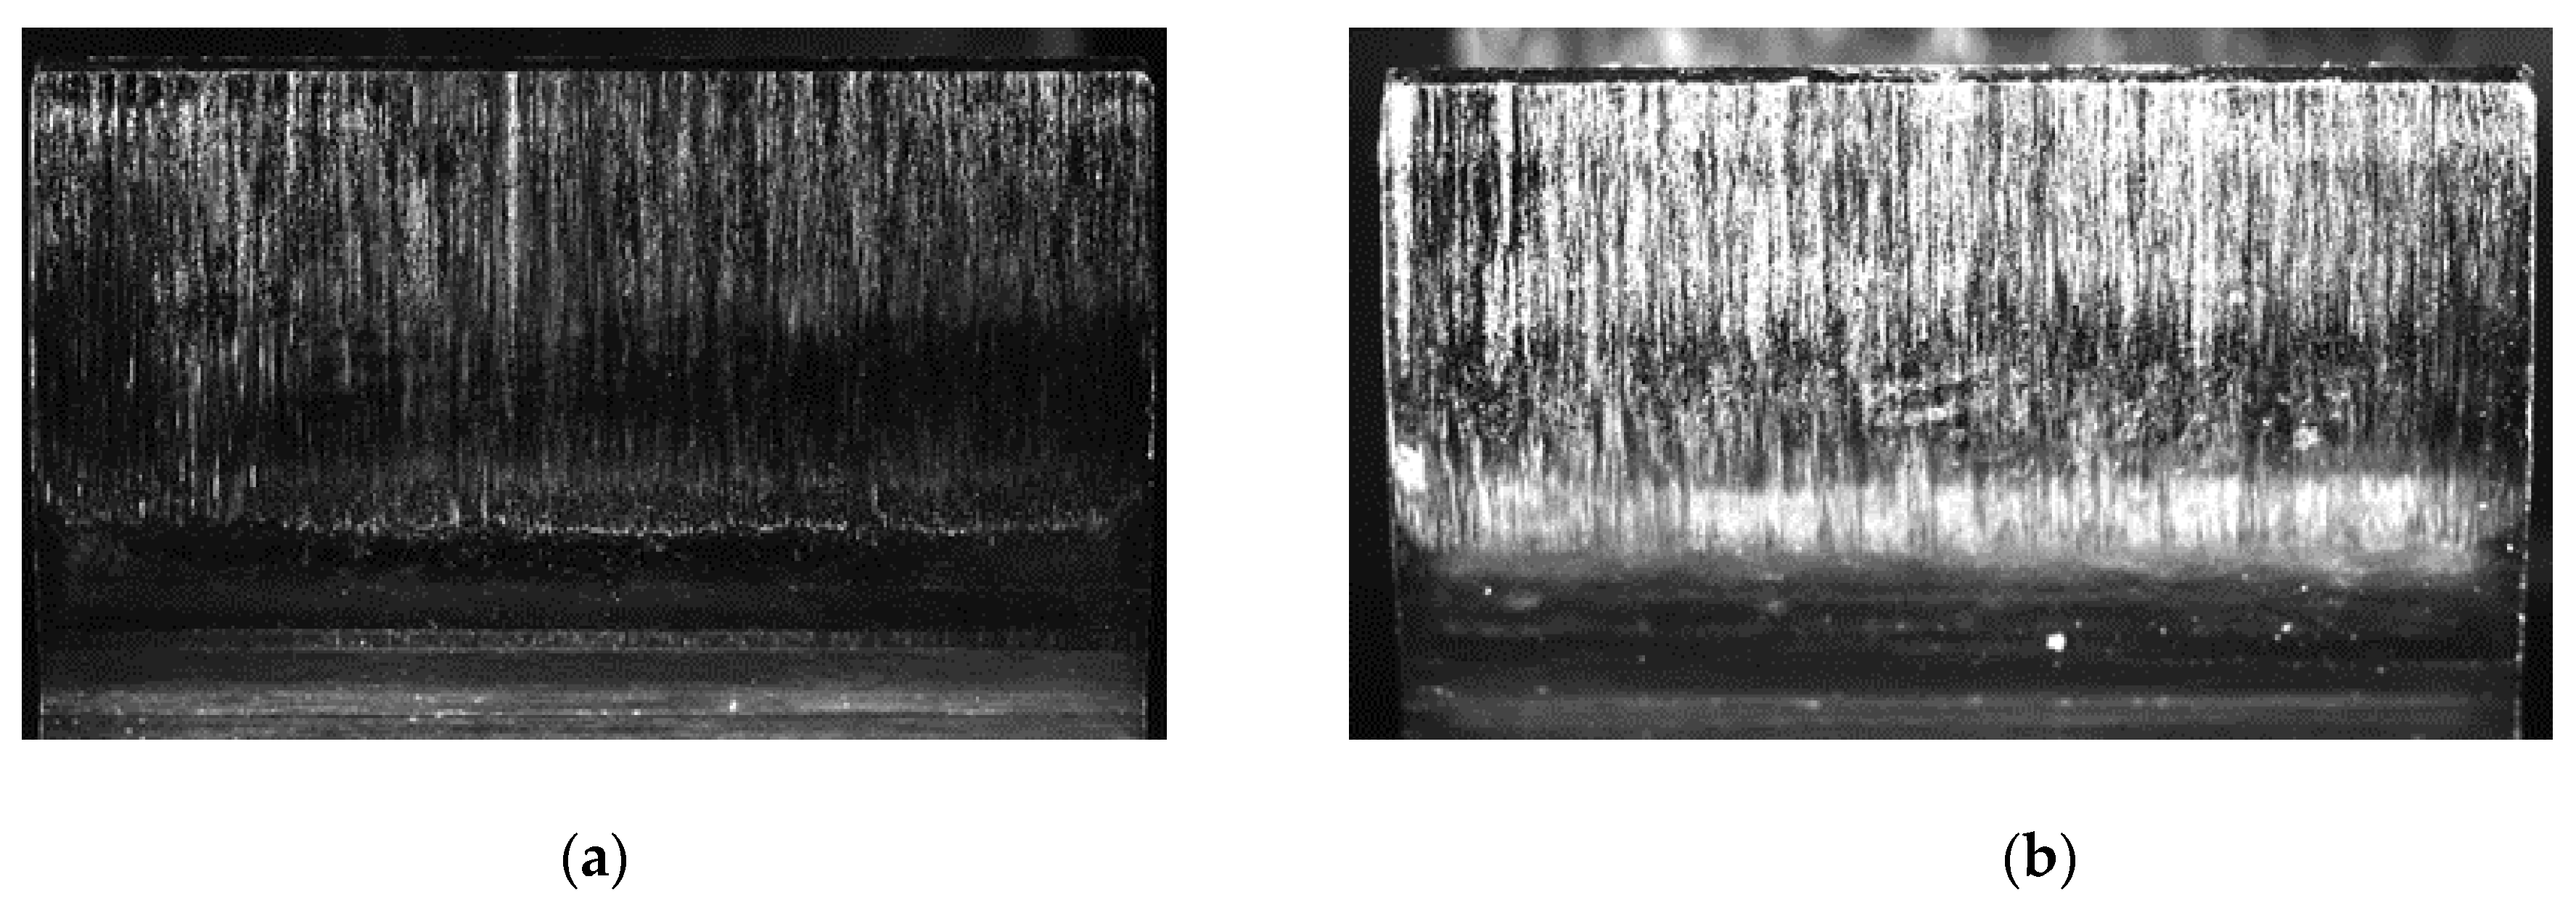
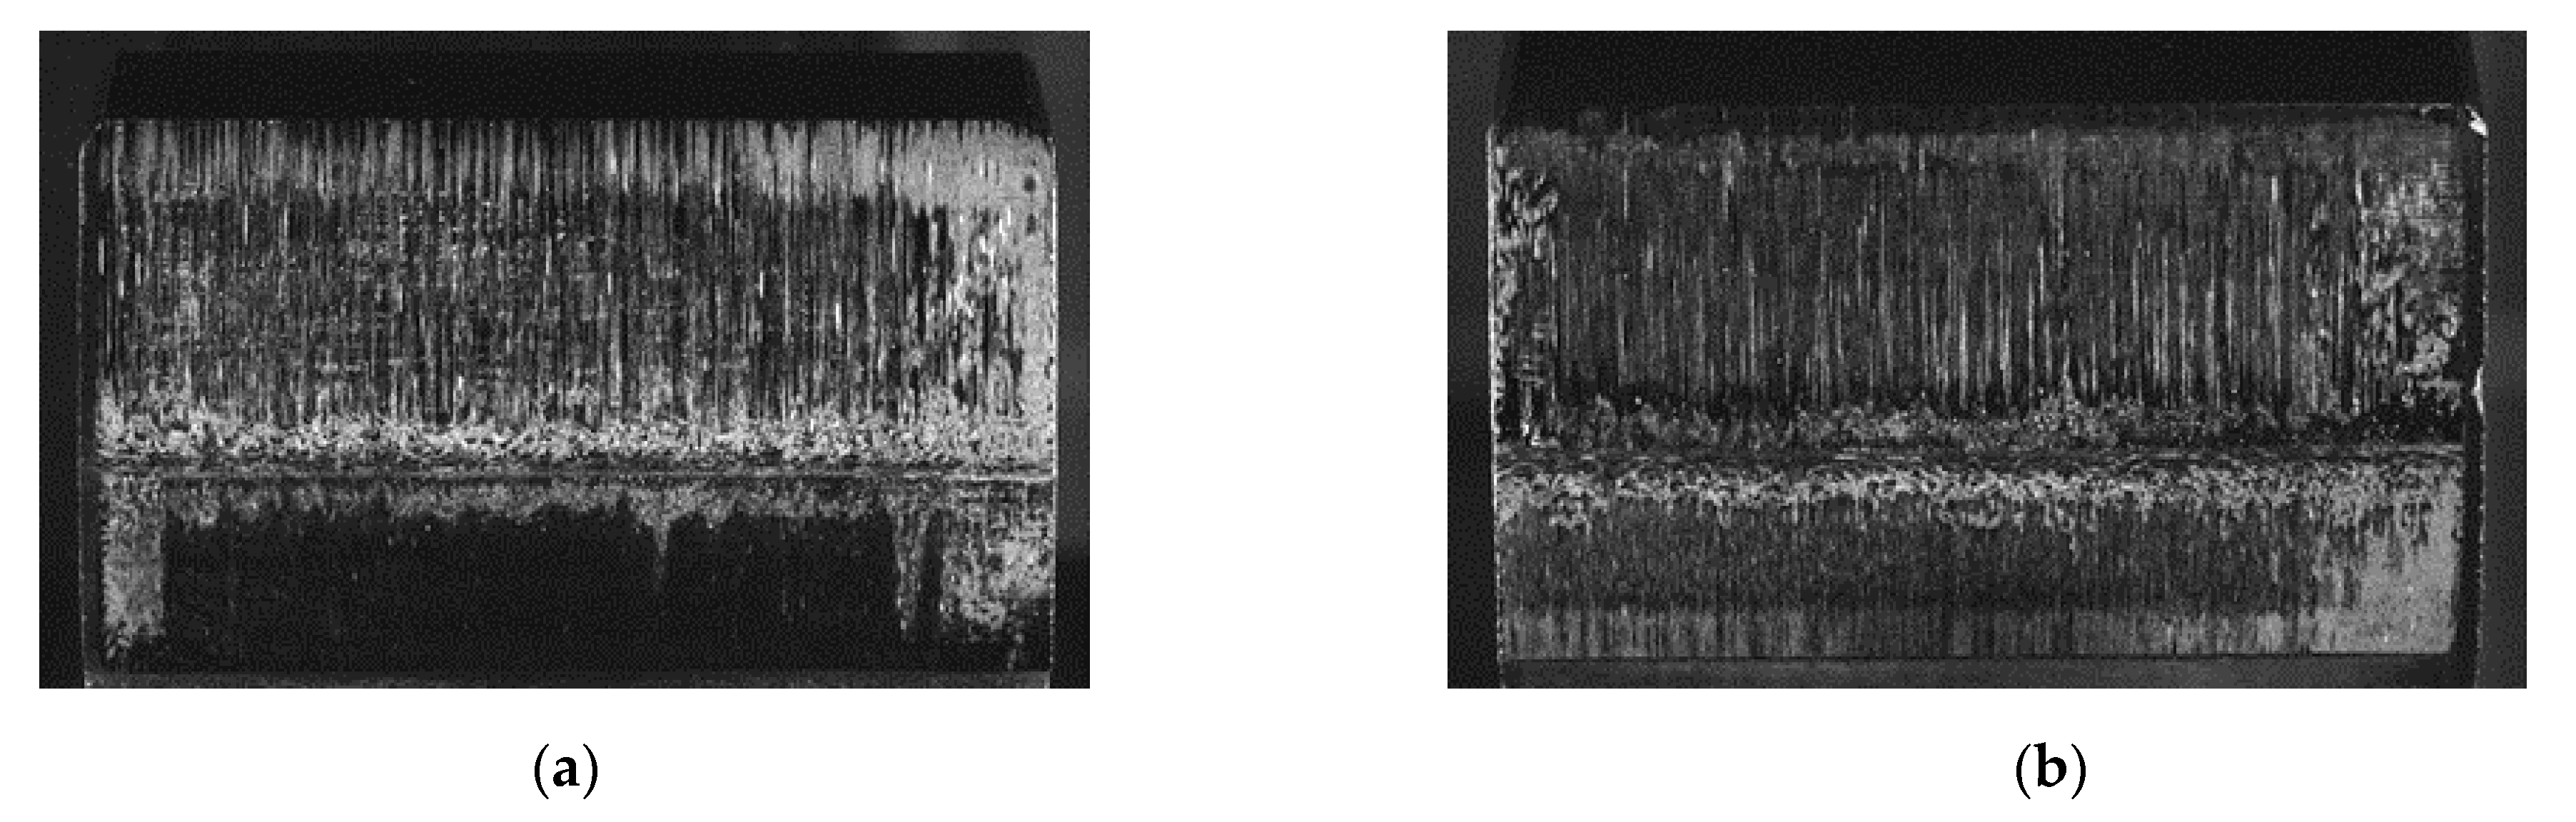
Figure 14 shows exemplary pictures of the flanks of the test gears for pinion and wheel after the testing at load stage 10. The measured mass loss is clearly assigned to wear and the wear damage can be detected above and below the pitch point for pinion and wheel.
Figure 15 shows the profile measurement of three teeth evenly distributed over the circumference for pinion and wheel. The profile measurement agrees with the optically detected characteristics of the wear damage and shows material loss below and above the pitch point. A scrape mark can be detected in the dedendum of the pinion and wheel.
3.3. Tribologigal Evaluation
Since sample 4 showed some problems with stability and had a low wear resistance, further tribologigal investigations with MTM and SRV were conducted on three samples each with a different polymer and same additives. In order to avoid corrosion, the ratio of corrosion inhibitor was increased. Information on the samples can be seen in
Table 6.
3.3.1. MTM Measurement
The measurements with the MTM at 30 °C show very similar good behavior in the high velocity range (slide friction area). Sample 4 and 6 show some unsteady events with high friction coefficient in the low and very low speed range (mixed friction) which can be interpreted as insufficient lubrication events. This can be seen in
Figure 16.
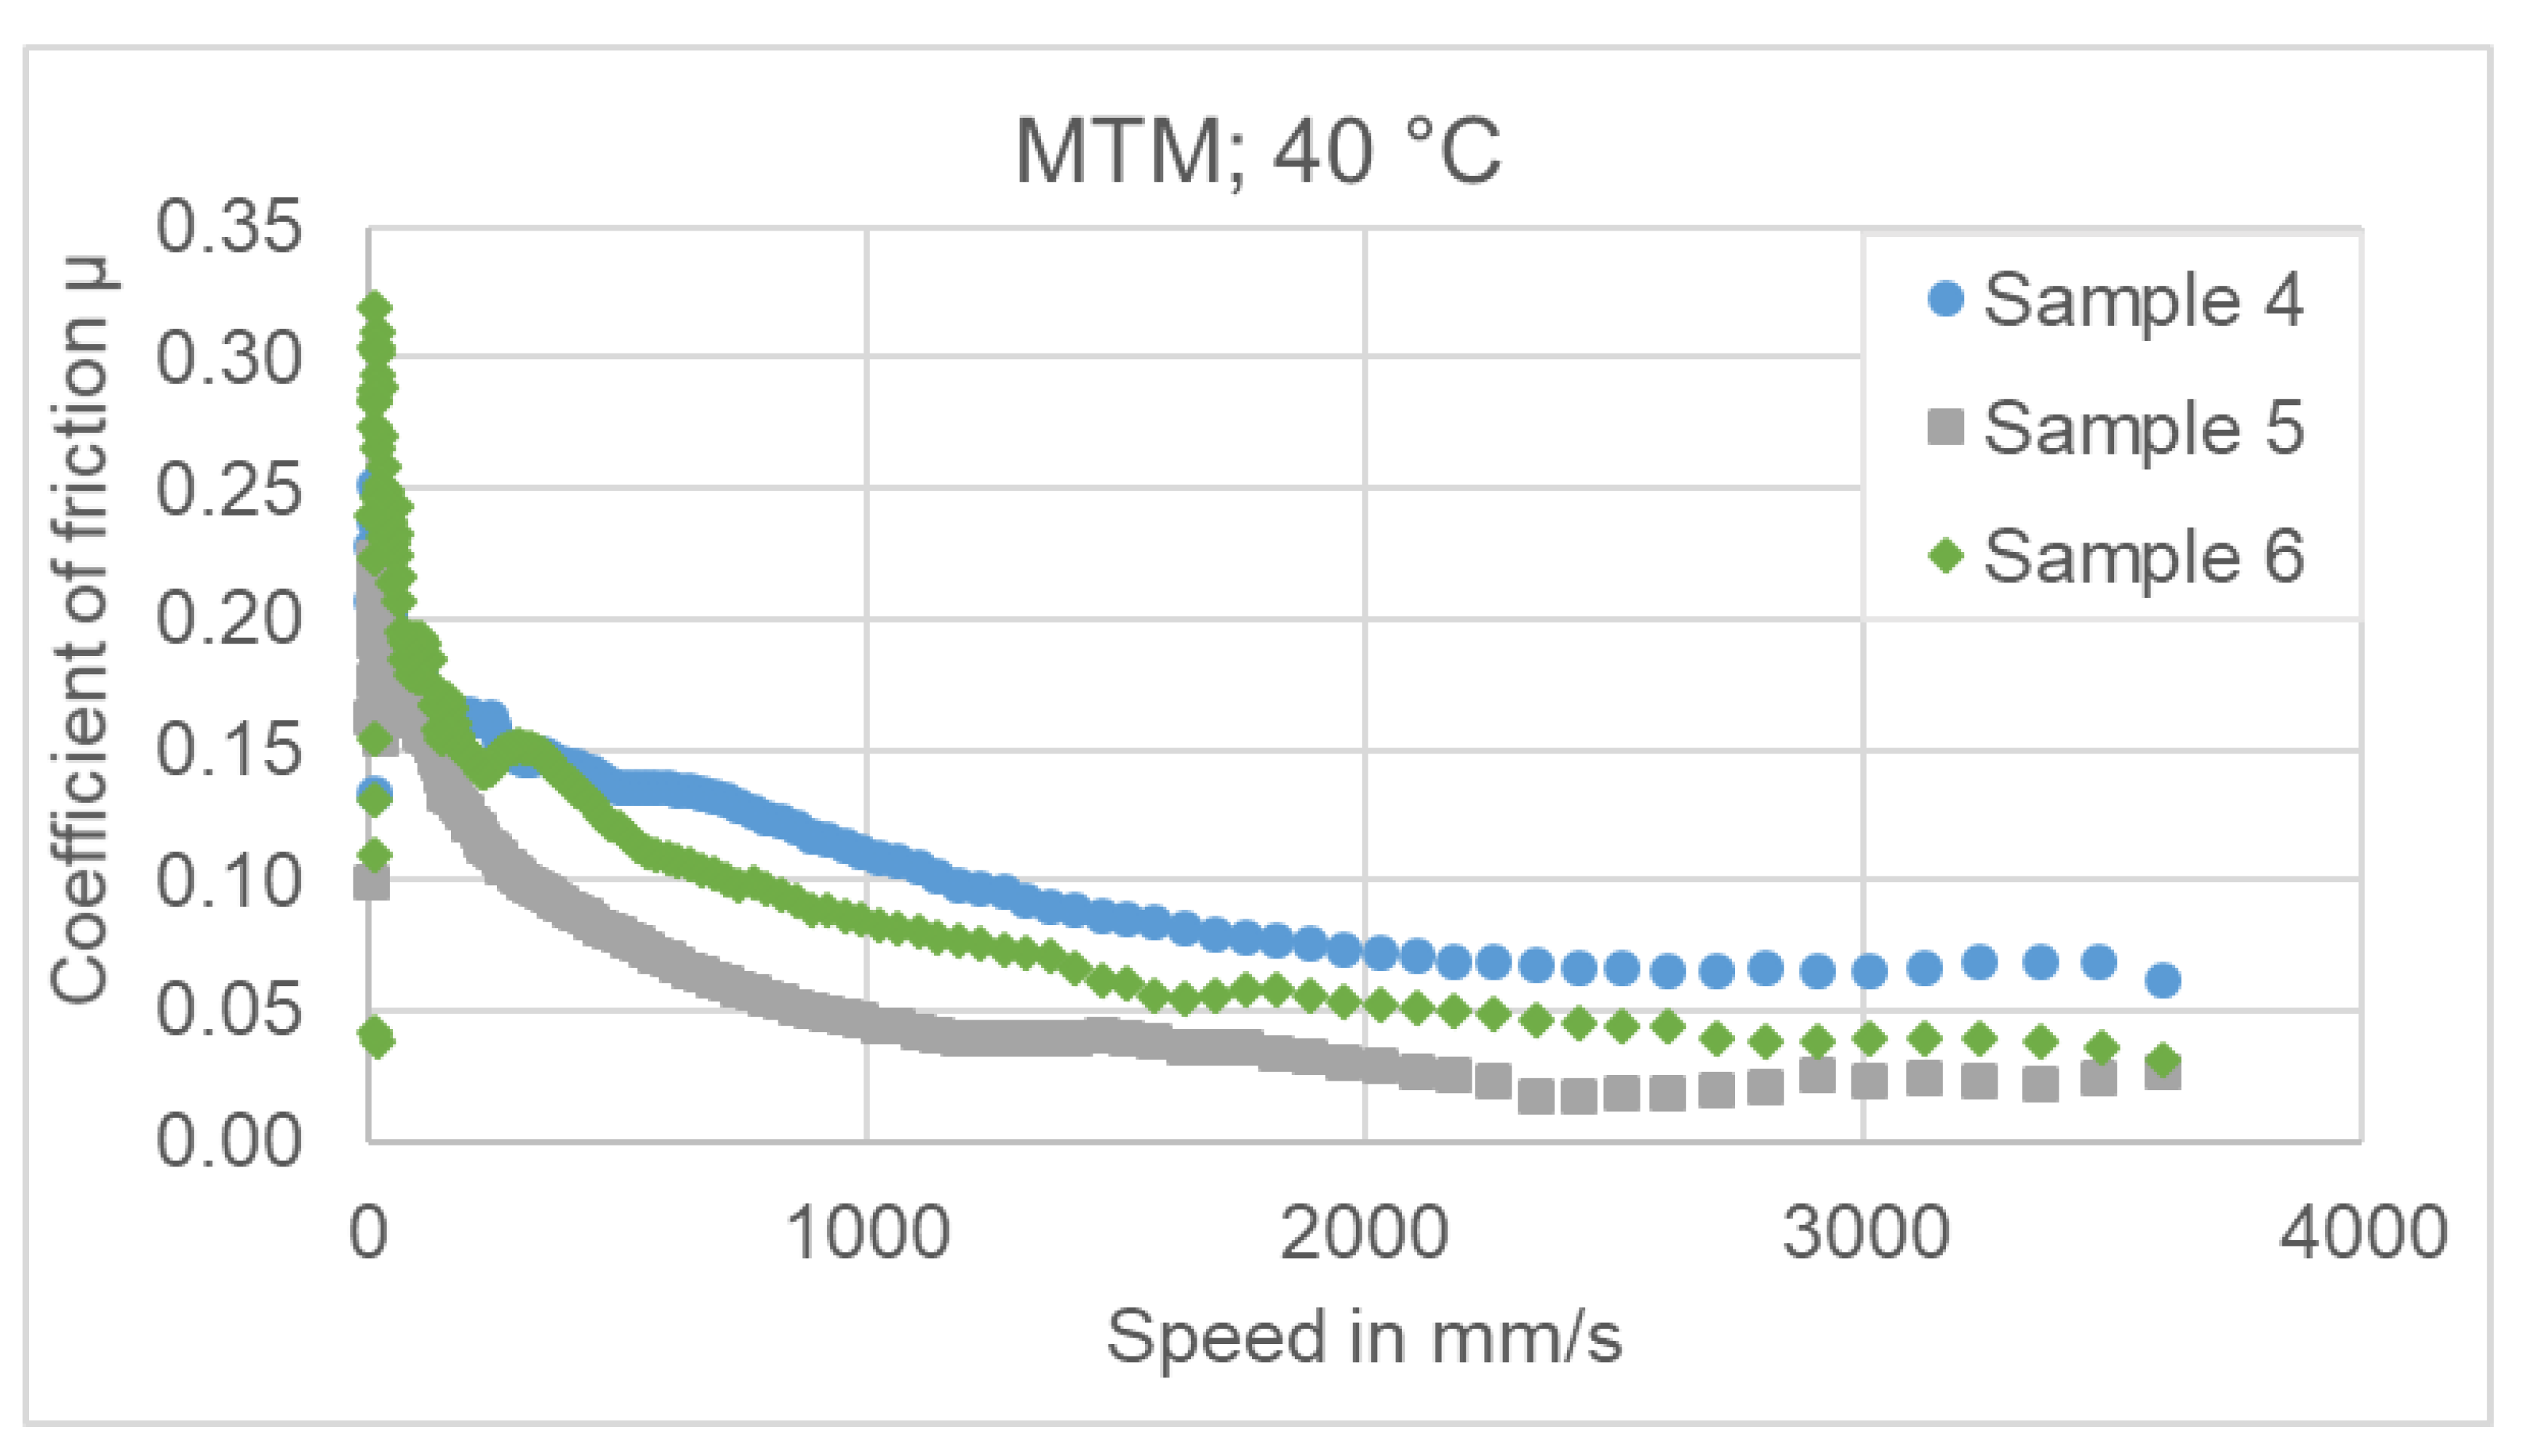
At 40 °C the friction coefficient values differ from each other. Sample 4 has the steadiest course over the whole range of velocity but also the highest friction coefficients which leads to higher energy loss in the lubricating process. Sample 6 has a semi steady trend and some very high values in the low and very low range, which indicate suboptimal performance in the mixed friction conditions and lead therefore to more wear. The best values in terms of friction coefficients over the whole range shows sample 5. This can be seen in
Figure 17.
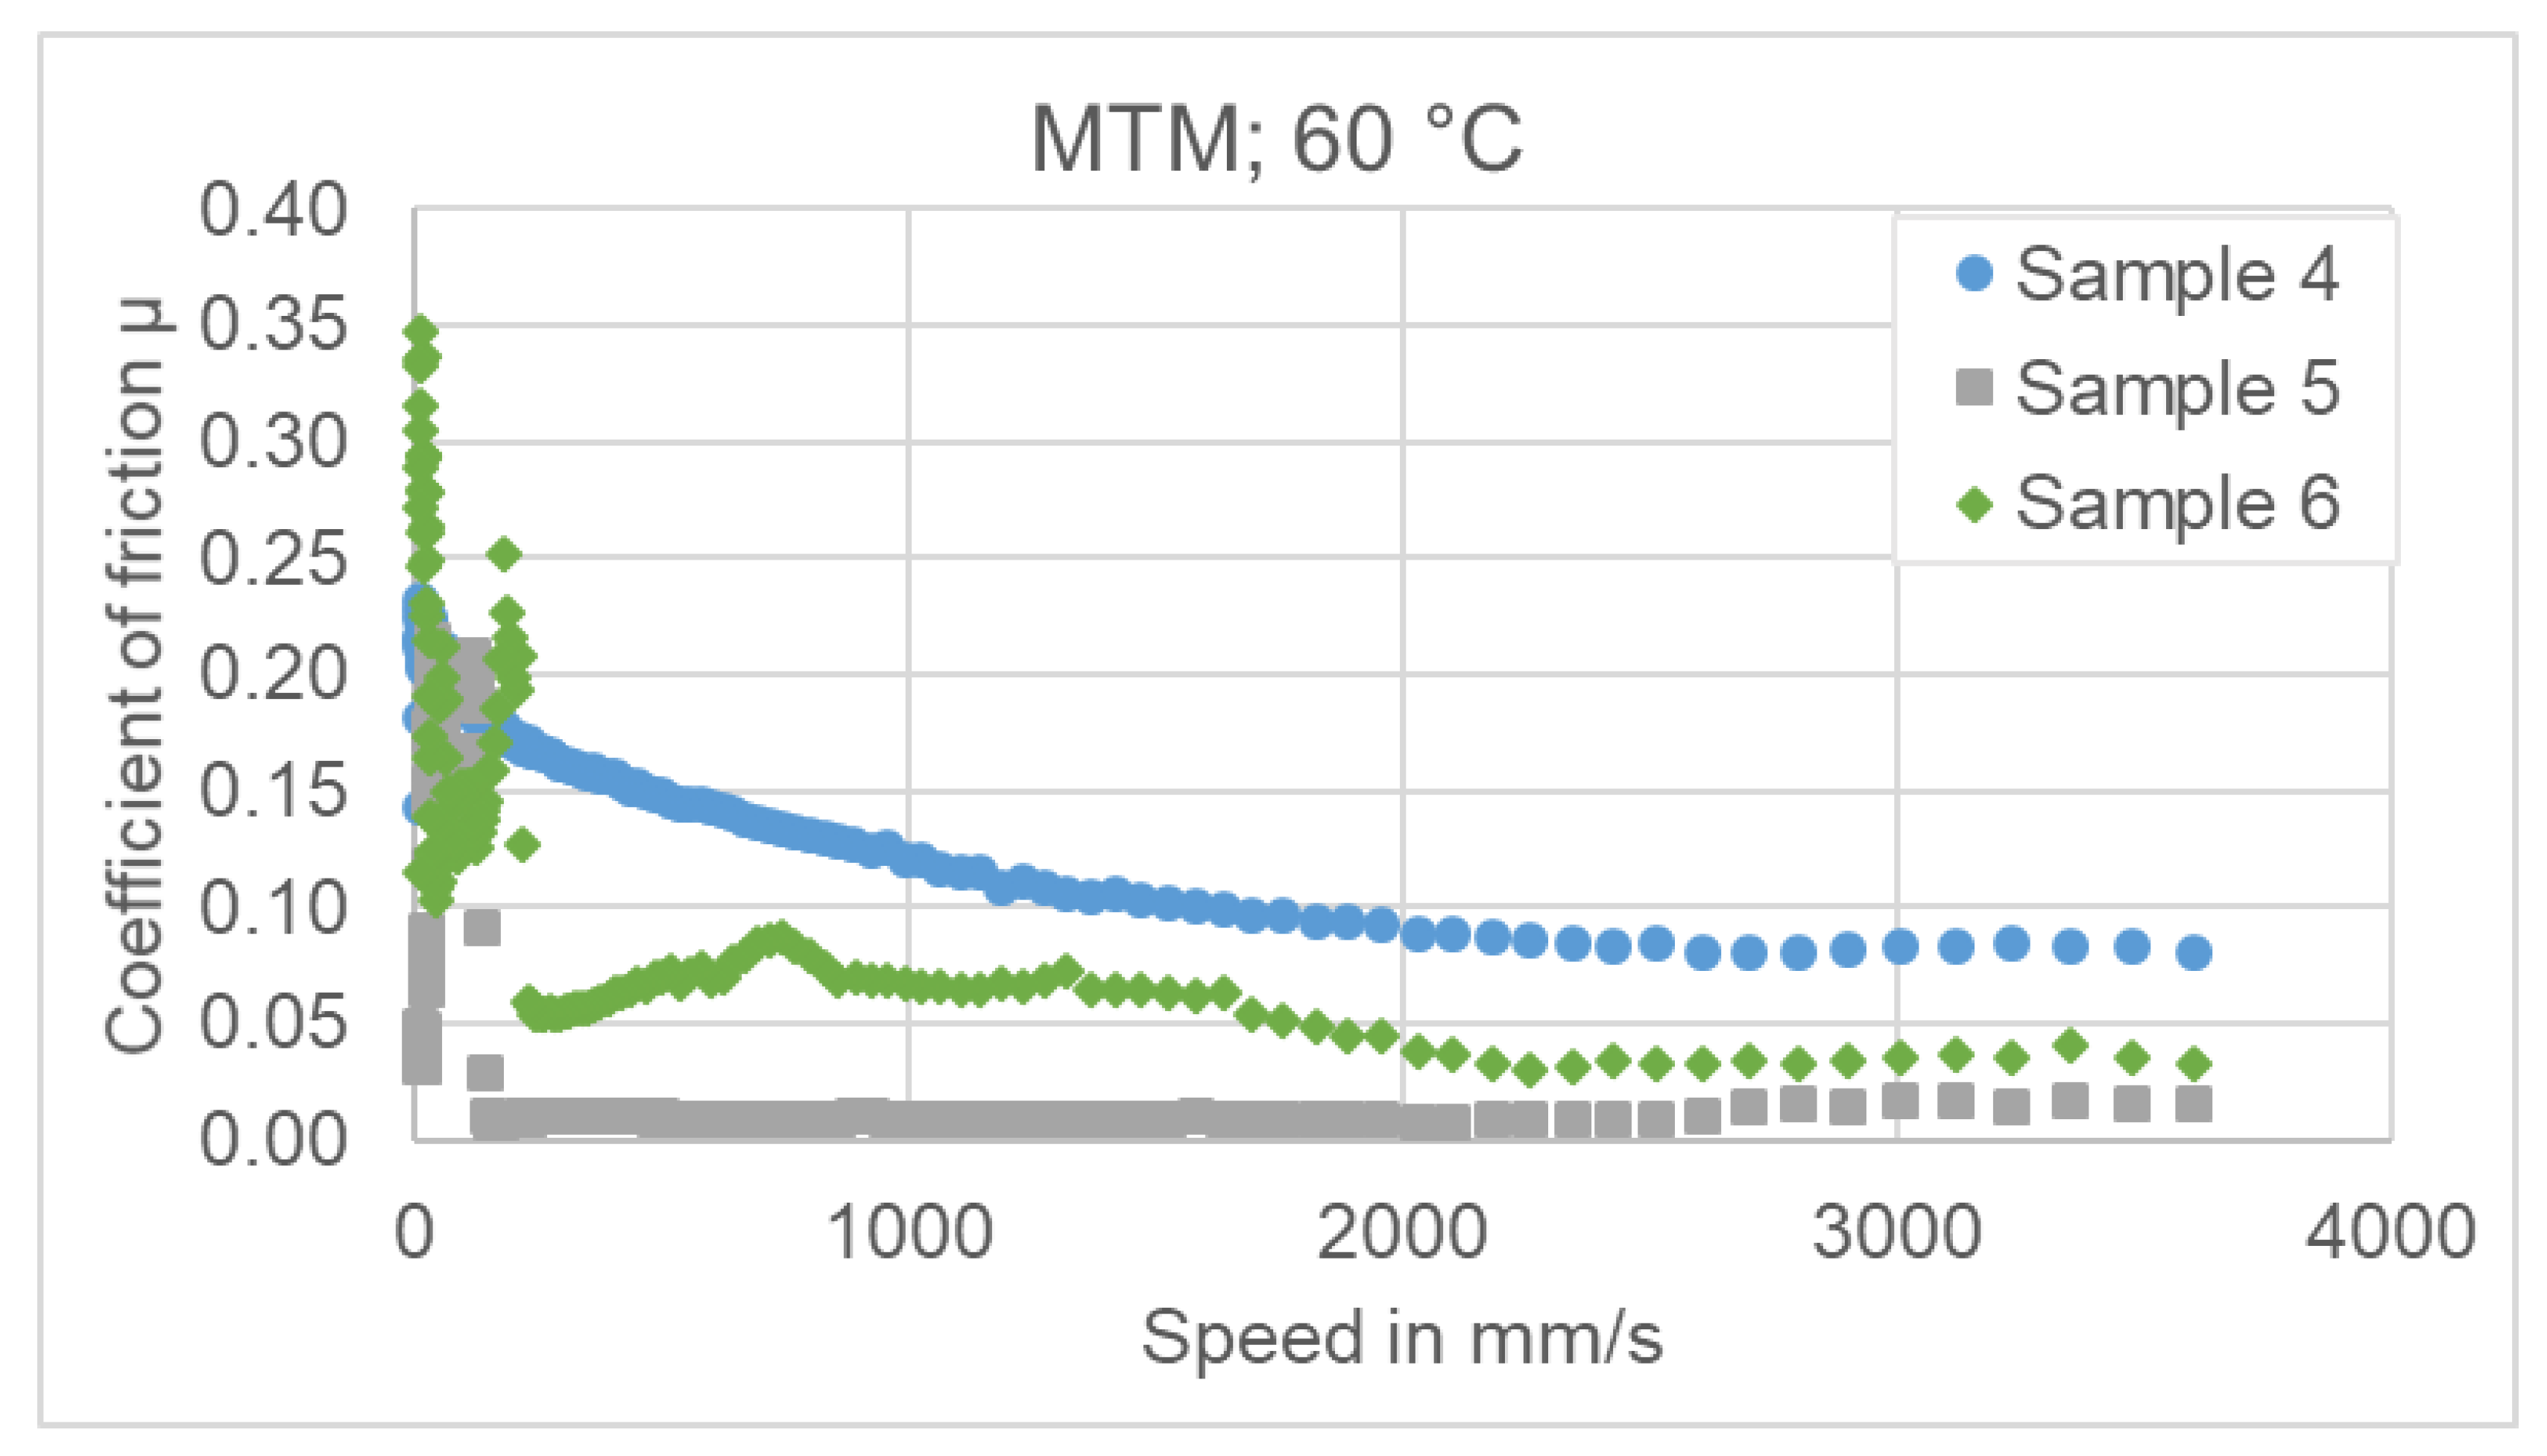
Increasing the temperature up to 60 °C the observed effects are strengthened. Sample 5 and particularly sample 6 has many unsteady events in the mixed friction area. Remarkable is the extreme low friction coefficient over nearly the whole velocity range for sample 5, which stands for good lubricating properties of the lubricant. This can be seen in
Figure 18.
3.3.2. SRV Test
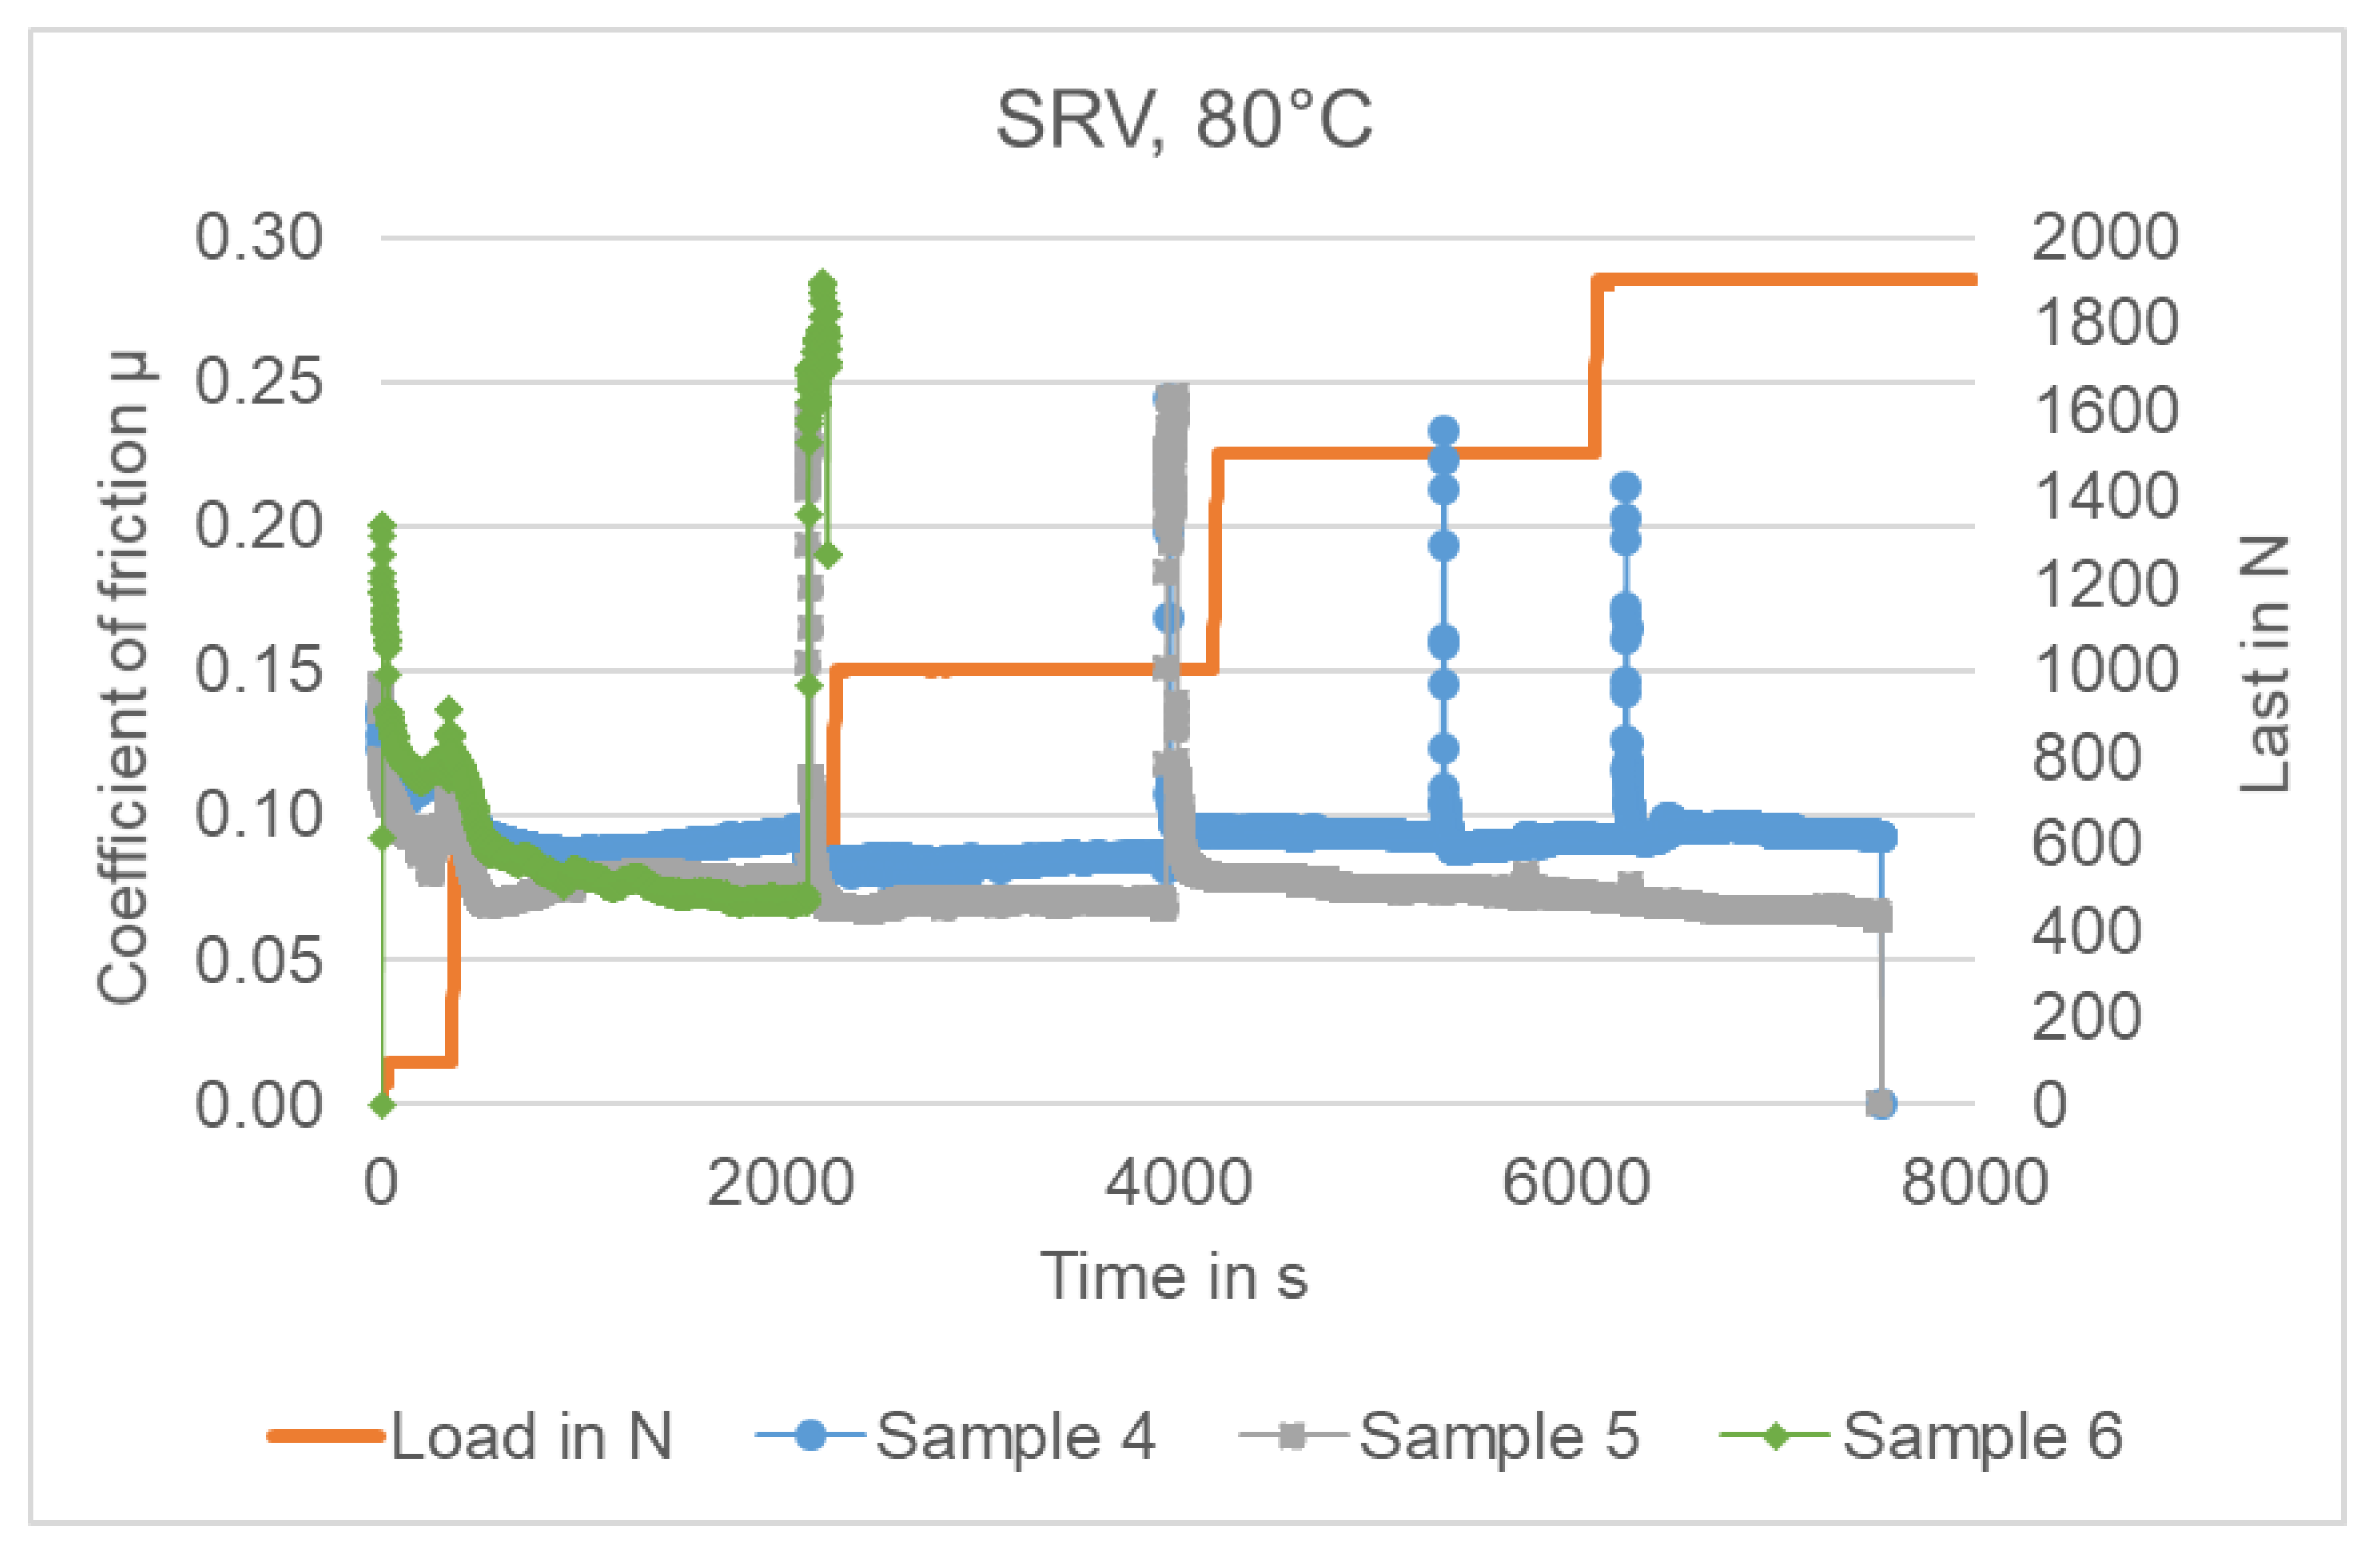
This test was performed to investigate the sensitivity of the samples regarding increasing load during the friction.
Figure 19 shows the results for sample 4, 5 and 6. The graph for sample 6 show a breakdown of the lubrication film at only 600 N load, which indicates the lubricant is not applicable for lubrication processes with high pressure situations. However, with sample 4 and 5 very high loads up to 1900 N can be achieved. In both graphs some spike events had been detected regarding the friction coefficient but not that high as they reach the test abortion criteria. These spikes indicate a very short time of inadequate lubrication conditions which produce wear for a short time but do not lead to micro welding. A slight advantage is given for sample 5 as the friction coefficient is slightly lower.
4. Discussion and Summary
In this experimental investigation, scuffing tests of the type A/8.3/RT according to ISO 14365-1 [
2] were performed in order to define an optimized combination of plant extracts (polymers) and additive-packages regarding the scuffing load carrying capacity. Additionally, a first indication of the wear behavior of the lubricant sample with the best scuffing load carrying capacity was determined in two slow speed wear tests. Further tribological investigations were carried out with different polymers in order to optimize the stability and wear resistance of the lubricant.
In [
29] the general suitability of a lubricant based on water and plant extracts for gear applications was shown in some preliminary experimental investigations with one fluid sample. A scuffing load capacity with the failure load stage 7 was identified for this fluid, which is typical for mildly additivated conventional turbine oils. In this investigation, an increase of the failure load stage of about 2–3 failure load stages depending on the kind of plant extract was shown. As a result, the containing plant extract influences the scuffing load carrying capacity significantly.
The scuffing tests were carried out at room temperature with four different lubricant samples. Three samples were combined differently with two additive-packages and two plant extracts. One sample contained additives and no plant extract. The results showed, that the sample without any plant extract had a low scuffing load carrying capacity. Additionally, one of the two plant extracts showed a higher scuffing resistance. The sample with the highest scuffing load carrying and optimized foam behavior was chosen for further investigations regarding the wear load carrying capacity.
In the slow speed wear tests, the lubricant sample showed a high risk of sliding wear. The appearance of wear on the tooth flanks is caused by a low lubricant film thickness. A low lubricant film thickness at a given load is the result of a low viscosity of the lubricant. Consequently, the added polymers did not cause a thickening of the fluid as high as expected. However, in the investigations on the scuffing load carrying capacity, a significant increase in the load carrying capacity was determined when adding the polymers. This leads to the conclusion that the load carrying capacity of the sample can be improved by the plant extracts.
During the slow speed wear tests, a wear category “medium” was observed at load stage 8 and a wear category “high” was observed at load stage 10 during the first test interval at room temperature. These results give information on bearable loads in possible applications. The results of the wear test match the results of the scuffing test, which indicate the failure load stage 9 for this lubricant sample.
For both slow speed wear test runs, the strongest increase of mass loss was detected within the first 20 h in the first test interval at room temperature. This wear behavior could be caused by the running-in behavior of this sample. Additionally, in the second interval at 40 °C slightly less wear was determined than in the first test interval at room temperature. This may be because of the additives, which presumably show a better performance at higher temperatures. In future investigations, wear tests at higher temperatures (≥40 °C) will be carried out in order to determine optimized conditions regarding the wear resistance. Additionally, the wear loss during the third test interval, which was carried out at a higher circumferential speed, was only slightly less strong compared to the first interval. A higher circumferential speed correlates with a higher lubricant film thickness and therefore with a higher wear resistance. As a result, the experimental investigations show that the increase in circumferential speed is not yet sufficient to suppress wear. Further investigations are necessary to study the wear behavior of this kind of lubricant. Because of the occurring corrosion during the slow speed wear test, the low wear resistance and the lack of stability of the used polymer in sample 4 the final formulation of this lubricants sample shall be further optimized. Consequently, different polymers and additives have to be investigated in order to define a more suitable additives-polymer-combination. Therefore, further measurements with MTM and SRV were conducted with three samples, which contain different polymers. The polymer in sample 5 shows a higher stability and lower friction coefficient than sample 4. For sample 5 a low friction coefficient over nearly the whole velocity range could be detected, which stands for good lubricating properties of the lubricant. As a result, further investigations will follow with sample 5.
Despite these challenges regarding the wear resistance, the usage of water-based lubricants offers many advantages [
30]. Compared to conventional lubricants, these environmental friendly lubricants are free of any harmful solvents or contain less harmful solvents. This can be beneficial for the usage as gear transmission fluid in the field of agriculture, forestry or food industry as well as in boats or deep sea applications. By using water-based lubricants environmental risks like water contamination can be reduced. Fire protection can also be improved and gear boxes run by water-based lubricants are easier to handle than oils regarding disposing and cleaning [
29]. The considered water-based lubricant shows a very high thermal conductivity as well as a very low coefficient of friction [
29]. A possible application for such lubricants can be found in a field that operates at low temperatures and high speed, which could be innovative electric motor boat drives.
5. Conclusions
The results of this experimental investigation show, that depending on the kind of plant extract, the scuffing load carrying capacity can be increased for about 2–3 failure load stages.
During the slow speed wear tests, the lubricant sample showed a high risk of sliding wear. This leads to the conclusion, that the lubricant film thickness, which is influenced by the polymers, is not high enough. There was a stronger increase of mass loss within the first 20 h in the first test intervals compared to the further test process with the same circumferential speed. These observations lead to the conclusion of a pronounced running-in behavior for this fluid. In addition, it was observed, that the increase of the circumferential speed is not yet sufficient to suppress wear.
Nevertheless, the results of the scuffing and wear load carrying capacity tests give information on bearable loads (load stages 8–9 according to ISO 14365-1 [
2]) in possible applications. In order to define a more suitable additive-polymer-combination regarding the wear resistance different polymers and additives have to be investigated. Additionally, further investigations are necessary to study the wear behavior of this kind of lubricant.
However, the general suitability for gear applications of a lubricant based on water and plant extracts was shown in this and previous experimental investigations [
29]. Despite the challenges regarding the wear resistance, the usage of such environmental friendly, water-based lubricants offers many advantages like improved fire protection, high thermal conductivity and a low coefficient of friction.
Author Contributions
Conceptualization, T.T. and T.A.; methodology, T.A.; formal analysis, N.S., K.J.W., T.T.; investigation, N.S.; resources, T.A., C.F. and K.S.; writing—original draft preparation, N.S.; writing—review and editing, K.J.W., T.T., K.S., C.F. and T.A.; visualization, N.S, K.J.W., T.T.; supervision, K.J.W., T.T., K.S. and T.A.; project administration, K.S., T.T., N.S. All authors have read and agreed to the published version of the manuscript.
Funding
This research received funding from the Bayrische Forschungsstiftung.
Institutional Review Board Statement
“Not applicable.” Our studies do not involve humans or animals.
Informed Consent Statement
“Not applicable.” Our studies do not involve humans.
Data Availability Statement
So far no data supporting reported results can be found, including publicly archived datasets analyzed.
Acknowledgments
The presented results are based on the research project Az-1314-17 supported by the Bavarian Research Foundation (BFS). The authors would like to thank for the sponsorship and support received from the BFS and the participation of Carl Bechem GmbH, Torqeedo GmbH, Leistritz Pumpen GmbH, Renk AG, Wittenstein alpha GmbH and Fraunhofer Institute for Process Engineering and Packaging IVV within this research project.
Conflicts of Interest
The authors declare no conflict of interest.
References
- Niemann, G.; Winter, H. Machine Elements Volume 2 (in German), 2nd ed.; Springer: Berlin, Germany, 1983. [Google Scholar]
- DIN Deutsches Institut für Normung e.V. DIN ISO 14635-1: 2006-05, Gears-FZG Test Methods Part 1: FZG Test Method A/8.3/90 for Determining the Relative Scuffing Load Capacity of Lubricating Oils (in German); DIN: Berlin, Germany, 2006. [Google Scholar]
- Höhn, B.-R.; Michaelis, K.; Collenberg, H.; Schlenk, L. Effect of Temperature on the Scuffing Load Capacity of EP Gear Lubricants. Lubr. Sci. 2001, 7, 317–332. [Google Scholar]
- Plewe, H.-J. Studies on the Abrasion Wear of Lubricated, Slow-Running Gears (in German). Ph.D. Thesis, Technical University Munich, Munich, Germany, 1980. [Google Scholar]
- Bayerdörfer, I.; Michaelis, K.; Höhn, B.-R. DGMK 377-1—Method to Assess the Wear Characteristics pf Lubricants FZG Test Method C/0,05/90:120/12—Information Sheet; Deutsche Wissenschaftliche Gesellschaft für Erdöl, Erdgas und Kohle e.V.: Hamburg, Germany, 1997. [Google Scholar]
- International Organization for Standardization. ISO: 6336-2:2006-09, Calculation of Load Capacity of Spur and Helical Gears-Part 2: Calculation of Surface Durability (Pitting); ISO: Geneva, Switzerland, 2006. [Google Scholar]
- Höhn, B.-R.; Oster, P.; Radev, T.; Steinberger, G.; Tobie, T. Improvement of Standardized Test Methods for Evaluating the Lubricant Influence on Micropitting and Pitting Resistance of Case Carburized Gears; AGMA Technical Paper 06FTM07; AGMA: Alexandria, VA, USA, 2006. [Google Scholar]
- Höhn, B.-R.; Oster, P.; Tobie, T.; Hergesell, M. Development of a Short Duration Pitting Test to Evaluate the Lubricant Influence on the Pitting Carrying Capacity of Spur Gears; DGMK Report 2006-10; DGMK: Hamburg, Germany, 2006; pp. 1–85. [Google Scholar]
- Moss, J.; Kahraman, A.; Wink, C. An Experimental Study of Influence of Lubrication Methods on Efficiency and Contact Fatigue Life of Spur Gears. J. Tribol. 2018, 140, 051103. [Google Scholar] [CrossRef]
- Schönnenbeck, G.; Emmert, S. FVA-Nr. 54/I-IV—Mirco-Pitting Information Sheet: Test Procedure for the Investigation of the Micro-Pitting Capacity of Gear Lubricants; Forschungsvereinigung Antriebstechnik e.V.: Frankfurt/Main, Germany, 1993. [Google Scholar]
- Schrade, U. Influence of Gear Geometry and Operating Conditions on the Micropitting Load Carrying Capacity of Gears (in German). Ph.D. Thesis, Technical University Munich, Munich, Germany, 1999. [Google Scholar]
- International Organization for Standardization. ISO/TS 6336-22:2018-04, Calculation of Load Capacity of Spur and Helical Gears—Part 22: Calculation of Mircopitting Load Capacity; ISO: Geneva, Switzerland, 2018. [Google Scholar]
- Höhn, B.-R.; Oster, P.; Schrade, U.; Tobie, T. Investigations on the Micropitting Load Capacity of Case Carburized Gears. In AGMA Technical Paper 04FTM5; AGMA: Alexandria, VA, USA, 2004; pp. 1–13. [Google Scholar]
- Höhn, B.-R.; Oster, P.; Tobie, T. Demands on the Micropitting Carrying Capacity of Gear Oils. Calculation of the Micropitting Carrying Capacity of Gear Wheels. Tribology and Lubrication Technology (in German); ISO: Geneva, Switzerland, 2007; Volume 5, pp. 46–59. [Google Scholar]
- Stemplinger, J.-P. (Ed.) FZG and different Testing Methods for Lubricant Influences on Gear Failure Modes. In Eleventh International Tribology Conference of the South African Institute of Tribology, Universität of Pretoria—Conference Center, Pretoria, Africa, 10–12 March 2015; The South African Institute of Tribology: Sandton, African, 2015. [Google Scholar]
- Stemplinger, J.-P. (Ed.) Gearbox Efficiency—Focus on Measurements and Lubricant Influences. In Eleventh International Tribology Conference of the South African Institute of Tribology, Universität of Pretoria—Conference Center, Pretoria, Africa, 10–12 March 2015; The South African Institute of Tribology: Sandton, African, 2015. [Google Scholar]
- O´Connor, B. The Influence of Additive Chemistry on Micropitting; Gear Technology: Alexandria, VA, USA, 2005; pp. 35–41. [Google Scholar]
- Schedl, U.; Oster, P.; Winter, H.; Höhn, B.-R. FVA-Nr. 2/lV—Pittingtest Information Sheet (in German); Forschungsvereinigung Antriebstechnik e.V.: Frankfurt, Germany, 1997. [Google Scholar]
- Sagraloff, N.; Hein, M.; Tobie, T.; Stahl, K. (Eds.) Practical use of micropitting test results according to FVA 54/7 for calculation of micropitting load capacity acc. to ISO/TR 15144-1. In Proceedings of the ICG International Conference on Gears, Garching, Germany, 13–15 September 2017; VDI-Verein Deutscher Ingenieure. 2017. [Google Scholar]
- Illenberger, C.; Tobie, T.; Stahl, K. Development of a CEC-pitting test method for gear lubricants—Measures to reduce scattering and micropitting generation in gear pitting tests. In Proceedings of the 74th Annual Meeting and Exhibition of the Society of Tribologists and Lubrication Engineers, Nashville, TN, USA, 19 May 2019. [Google Scholar]
- Yilmaz, M.; Mirza, M.; Lohner, T.; Stahl, K. Superlubricity in EHL contacts with water-containing gear fluids. Lubricants 2019, 7, 46. [Google Scholar] [CrossRef]
- Yilmaz, M.; Lohner, T.; Michaelis, K.; Stahl, K. Minimizing gear friction with water-containing gear fluids. Forsch. Ing. Eng. Res. 2019, 83, 327–337. [Google Scholar] [CrossRef] [Green Version]
- Jeng, Y.-R.; Tsai, P.-C.; Chang, C.-M.; Hsu, K.-F. Tribological Properties of Oil-in-Water Emulsion with Carbon Nanocapsule Additives. Materials 2020, 13, 5762. [Google Scholar] [CrossRef] [PubMed]
- Jeng, Y.-R.; Huang, Y.-H.; Tsai, P.-C.; Hwang, G.-L. Tribological properties of carbon nanocapsule particles as lubricant additive. J. Tribol. 2014, 136, 041801. [Google Scholar] [CrossRef] [PubMed]
- Jeng, Y.-R.; Huang, Y.-H.; Tsai, P.-C.; Hwang, G.-L. Tribological Performance of Oil-Based Lubricants with Carbon-Fe Nanocapsules Additive. Tribol. Trans. 2015, 58, 924–929. [Google Scholar] [CrossRef]
- Lin, W.; Kampf, N.; Klein, J. Designer Nanoparticles as Robust Superlubrication Vectors. ACS Nano 2020, 14, 7008–7017. [Google Scholar] [CrossRef] [PubMed]
- Chen, W.; Amann, T.; Kailer, A.; Rühe, J. Thin-Film Lubrication in the Water/Octyl β-D-Glucopyranoside System: Macroscopic and Nanoscopic Tribological Behavior. Langmuir 2019, 35, 7136–7145. [Google Scholar]
- International Organization for Standardization. ISO/WD 10825-1:2020-08, Gears—Wear and Damage to Gear Teeth—Terminology; ISO: Geneva, Switzerland, 2020. [Google Scholar]
- Sagraloff, N.; Dobler, A.; Tobie, T.; Stahl, K.; Ostrowski, J. Development of an Oil Free Water-Based Lubricant for Gear Applications. Lubricants 2019, 7, 33. [Google Scholar] [CrossRef] [Green Version]
- Yilmaz, M.; Lohner, T.; Stahl, K. Bearing power losses withwater-containing gear fluids. Lubricants 2020, 8, 5. [Google Scholar]
Figure 1.
Typical appearance of scuffing (a), sliding wear (b), pitting (c) and micropitting (d) on gear flanks.
Figure 1.
Typical appearance of scuffing (a), sliding wear (b), pitting (c) and micropitting (d) on gear flanks.
Figure 2.
Test scheme of MTM (a) and typical test run at different temperatures (b).
Figure 2.
Test scheme of MTM (a) and typical test run at different temperatures (b).
Figure 3.
Test scheme of SRV.
Figure 3.
Test scheme of SRV.
Figure 4.
Exemplary flank of the pinion after load stage 7 of scuffing test A/8.3/RT with sample 1.
Figure 4.
Exemplary flank of the pinion after load stage 7 of scuffing test A/8.3/RT with sample 1.
Figure 5.
Exemplary flank of the pinions after scuffing test A/8.3/RT with sample 2 after load stage 10 of test run 1 (a) resp. after load stage 9 of test run 2 (b).
Figure 5.
Exemplary flank of the pinions after scuffing test A/8.3/RT with sample 2 after load stage 10 of test run 1 (a) resp. after load stage 9 of test run 2 (b).
Figure 6.
Exemplary flank of the pinion after load stage 7 of the scuffing tests A/8.3/RT with sample 3 after test run 1 (a) and test run 2 (b).
Figure 6.
Exemplary flank of the pinion after load stage 7 of the scuffing tests A/8.3/RT with sample 3 after test run 1 (a) and test run 2 (b).
Figure 7.
Exemplary flank of the pinion after scuffing test A/8.3/RT with sample 4 after load stage 8 of test run 1 (a) resp. after load stage 9 of test run 2 (b).
Figure 7.
Exemplary flank of the pinion after scuffing test A/8.3/RT with sample 4 after load stage 8 of test run 1 (a) resp. after load stage 9 of test run 2 (b).
Figure 8.
Exemplary measurement of the profile form of four teeth of the pinion (a) and the wheel (b) after the scuffing test A/8.3/RT with sample 4 test run 1.
Figure 8.
Exemplary measurement of the profile form of four teeth of the pinion (a) and the wheel (b) after the scuffing test A/8.3/RT with sample 4 test run 1.
Figure 9.
Obtained load stages in the scuffing test A/8.3/RT acc. to DIN ISO 14635-1.
Figure 9.
Obtained load stages in the scuffing test A/8.3/RT acc. to DIN ISO 14635-1.
Figure 10.
Accumulated mass loss of pinion and wheel during the testing of C/0.0.5/RT:40/8.
Figure 10.
Accumulated mass loss of pinion and wheel during the testing of C/0.0.5/RT:40/8.
Figure 11.
Exemplary pictures of the flanks of pinion (a) and wheel (b) after test C/0.05/RT:40/8.
Figure 11.
Exemplary pictures of the flanks of pinion (a) and wheel (b) after test C/0.05/RT:40/8.
Figure 12.
Measurement of the profile form of three teeth evenly distributed over the circumference of the test gears for pinion (a) and wheel (b) after the test C/0.05/RT:40/8.
Figure 12.
Measurement of the profile form of three teeth evenly distributed over the circumference of the test gears for pinion (a) and wheel (b) after the test C/0.05/RT:40/8.
Figure 13.
Accumulated mass loss of pinion and wheel during the testing C/0.0.5/RT:40/10.
Figure 13.
Accumulated mass loss of pinion and wheel during the testing C/0.0.5/RT:40/10.
Figure 14.
Exemplary pictures of the flanks of pinion (a) and wheel (b) after test C/0.05/RT:40/10.
Figure 14.
Exemplary pictures of the flanks of pinion (a) and wheel (b) after test C/0.05/RT:40/10.
Figure 15.
Measurement of the profile form of three teeth evenly distributed over the circumference of the test gears for pinion (a) and wheel (b) after test C/0.05/RT:40/10.
Figure 15.
Measurement of the profile form of three teeth evenly distributed over the circumference of the test gears for pinion (a) and wheel (b) after test C/0.05/RT:40/10.
Figure 16.
MTM Measurements for sample 4, sample 5 and sample 6 at 30 °C.
Figure 16.
MTM Measurements for sample 4, sample 5 and sample 6 at 30 °C.
Figure 17.
MTM Measurements for sample 4, sample 5 and sample 6 at 40 °C.
Figure 17.
MTM Measurements for sample 4, sample 5 and sample 6 at 40 °C.
Figure 18.
MTM Measurements for sample 4, sample 5 and sample 6 at 60 °C.
Figure 18.
MTM Measurements for sample 4, sample 5 and sample 6 at 60 °C.
Figure 19.
SRV Measurements for sample 4, sample 5 and sample 6 at 80 °C.
Figure 19.
SRV Measurements for sample 4, sample 5 and sample 6 at 80 °C.
Table 1.
Details of type “FZG-A” test gears for the FZG scuffing test.
Table 1.
Details of type “FZG-A” test gears for the FZG scuffing test.
| Dimension | Symbol | Numerical Value | Unit |
|---|
| Centre distance | a | 91.5 | mm |
| Effective tooth width | b | 20.0 | mm |
| Module | m | 4.5 | mm |
| Number of teeth pinion | z1 | 16 | - |
| Number of teeth wheel | z2 | 24 | - |
| Pressure angle | α | 20.0 | ° |
| Helix angle | β | 0 | ° |
| Profile-shift coefficient | x1/x2 | 0.853/−0.5 | - |
| Grinding | Maag criss-cross grinding (15° method) |
| Tooth correction | none |
Table 2.
Details of type “FZG-C” test gears for the FZG slow speed wear test.
Table 2.
Details of type “FZG-C” test gears for the FZG slow speed wear test.
| Dimension | Symbol | Numerical Value | Unit |
|---|
| Centre distance | a | 91.5 | mm |
| Effective tooth width | b | 20.0 | mm |
| Module | m | 4.5 | mm |
| Number of teeth pinion | z1 | 16 | - |
| Number of teeth wheel | z2 | 24 | - |
| Pressure angle | α | 14.0 | ° |
| Helix angle | β | 0 | ° |
| Profile-shift coefficient | x1/x2 | 0.182/0.172 | - |
| Grinding | Maag 0°-grinding |
| Tooth correction | none |
Table 3.
Used samples with different plant extracts and additive packages for the scuffing test A/8.3/RT.
Table 3.
Used samples with different plant extracts and additive packages for the scuffing test A/8.3/RT.
| Sample | Basic | Thickener | Additive-Packages |
|---|
| 1 | Water | Polymer 1 | I |
| 2 | Water | Polymer 2 | I |
| 3 | Water | - | II (anti foam) |
| 4 | Water | Polymer 2 | II (anti foam) |
Table 4.
Sum of the mass loss of pinion and wheel during each test interval of test C/0.05/RT:40/8.
Table 4.
Sum of the mass loss of pinion and wheel during each test interval of test C/0.05/RT:40/8.
| Lubricant | C/0.05/RT/8 | C/0.05/40/8 | C/0.57/RT/8 |
| 20 h | 40 h | 60 h | 80 h | 120 h |
| Sample 4 | | Wear for pinion and wheel in test part in mg |
| Sum | 126 | 43 | (0) * | 33 | 112 |
| Sum | 169 | (33) * | 112 |
| | Wear category |
| | “medium” | (“low”) * | “medium” |
| Wear category: “low”: <40 mg, “medium”: <170 mg, “high”: <400 mg, “very high”: >=400 mg |
Table 5.
Sum of the mass loss of pinion and wheel during each test interval of test C/0.05/RT:40/10.
Table 5.
Sum of the mass loss of pinion and wheel during each test interval of test C/0.05/RT:40/10.
| Lubricant | C/0.05/RT/10 | C/0.05/40/10 | C/0.57/RT/10 |
| 20 h | 40 h | 60 h | 80 h | 120 h |
| Sample 4 | | Wear for pinion and wheel in test part in mg |
| Sum | 99 | 78 | 81 | 61 | 173 |
| Sum | 177 | 142 | 173 |
| | Wear category |
| | “high” | “medium” | “high” |
Table 6.
Used samples for the measurements with MTM and SRV.
Table 6.
Used samples for the measurements with MTM and SRV.
| Sample | Basic | Thickener | Additives |
|---|
| Sample 4 | Water | Polymer 2 | EP/AW/Corrosion Inhibitor/Anti Foam Agent/Biological Stabilizer |
| Sample 5 | Water | Polymer 3 | EP/AW/Corrosion Inhibitor/Anti Foam Agent/Biological Stabilizer |
| Sample 6 | Water | Polymer 4 | EP/AW/Corrosion Inhibitor/Anti Foam Agent/Biological Stabilizer |
| Publisher’s Note: MDPI stays neutral with regard to jurisdictional claims in published maps and institutional affiliations. |
© 2021 by the authors. Licensee MDPI, Basel, Switzerland. This article is an open access article distributed under the terms and conditions of the Creative Commons Attribution (CC BY) license (http://creativecommons.org/licenses/by/4.0/).

 ,
, 


