A Digital Twin for Friction Prediction in Dynamic Rubber Applications with Surface Textures

 , , , , ,
  , and
, and
Abstract
:1. Introduction
1.1. Surface Texturing in Tribological Applications
1.2. Reduced Order Modelling
1.3. Objectives
2. Materials and Methods
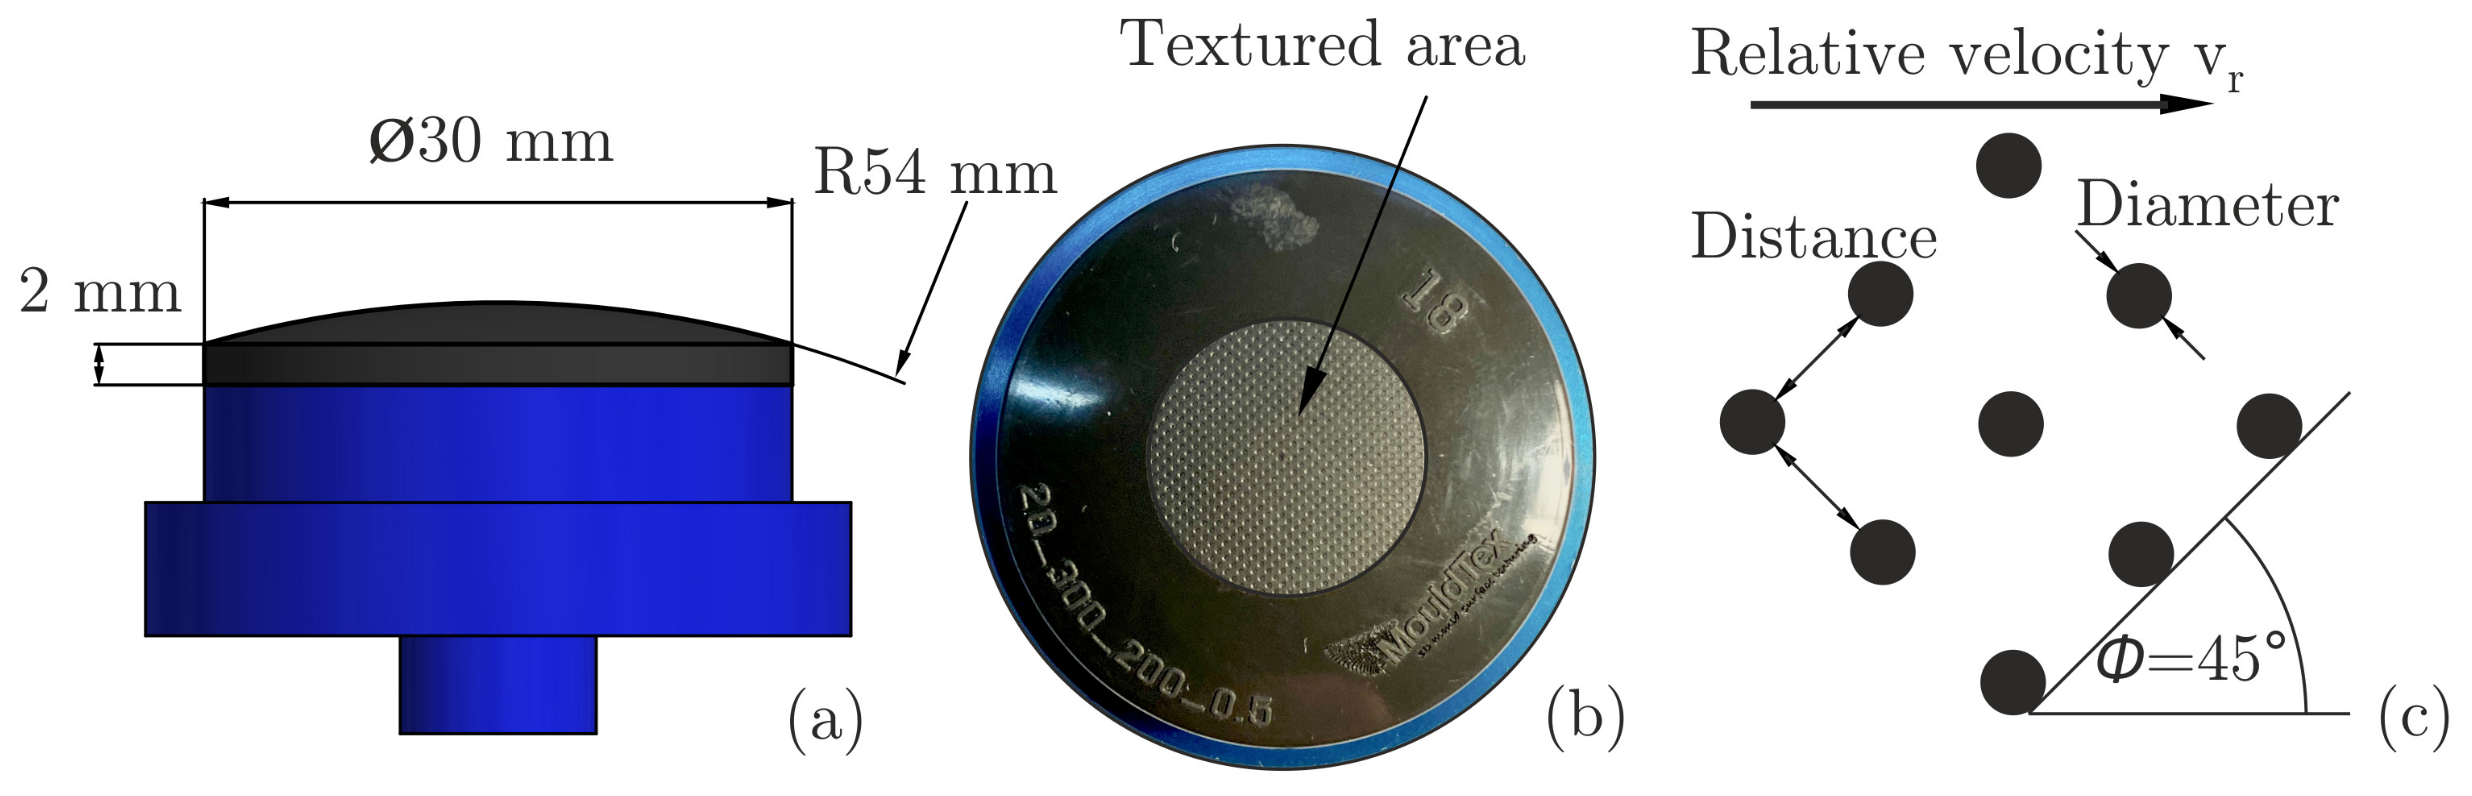
2.1. Rubber Specimen Geometry and Surface Texture Parameters
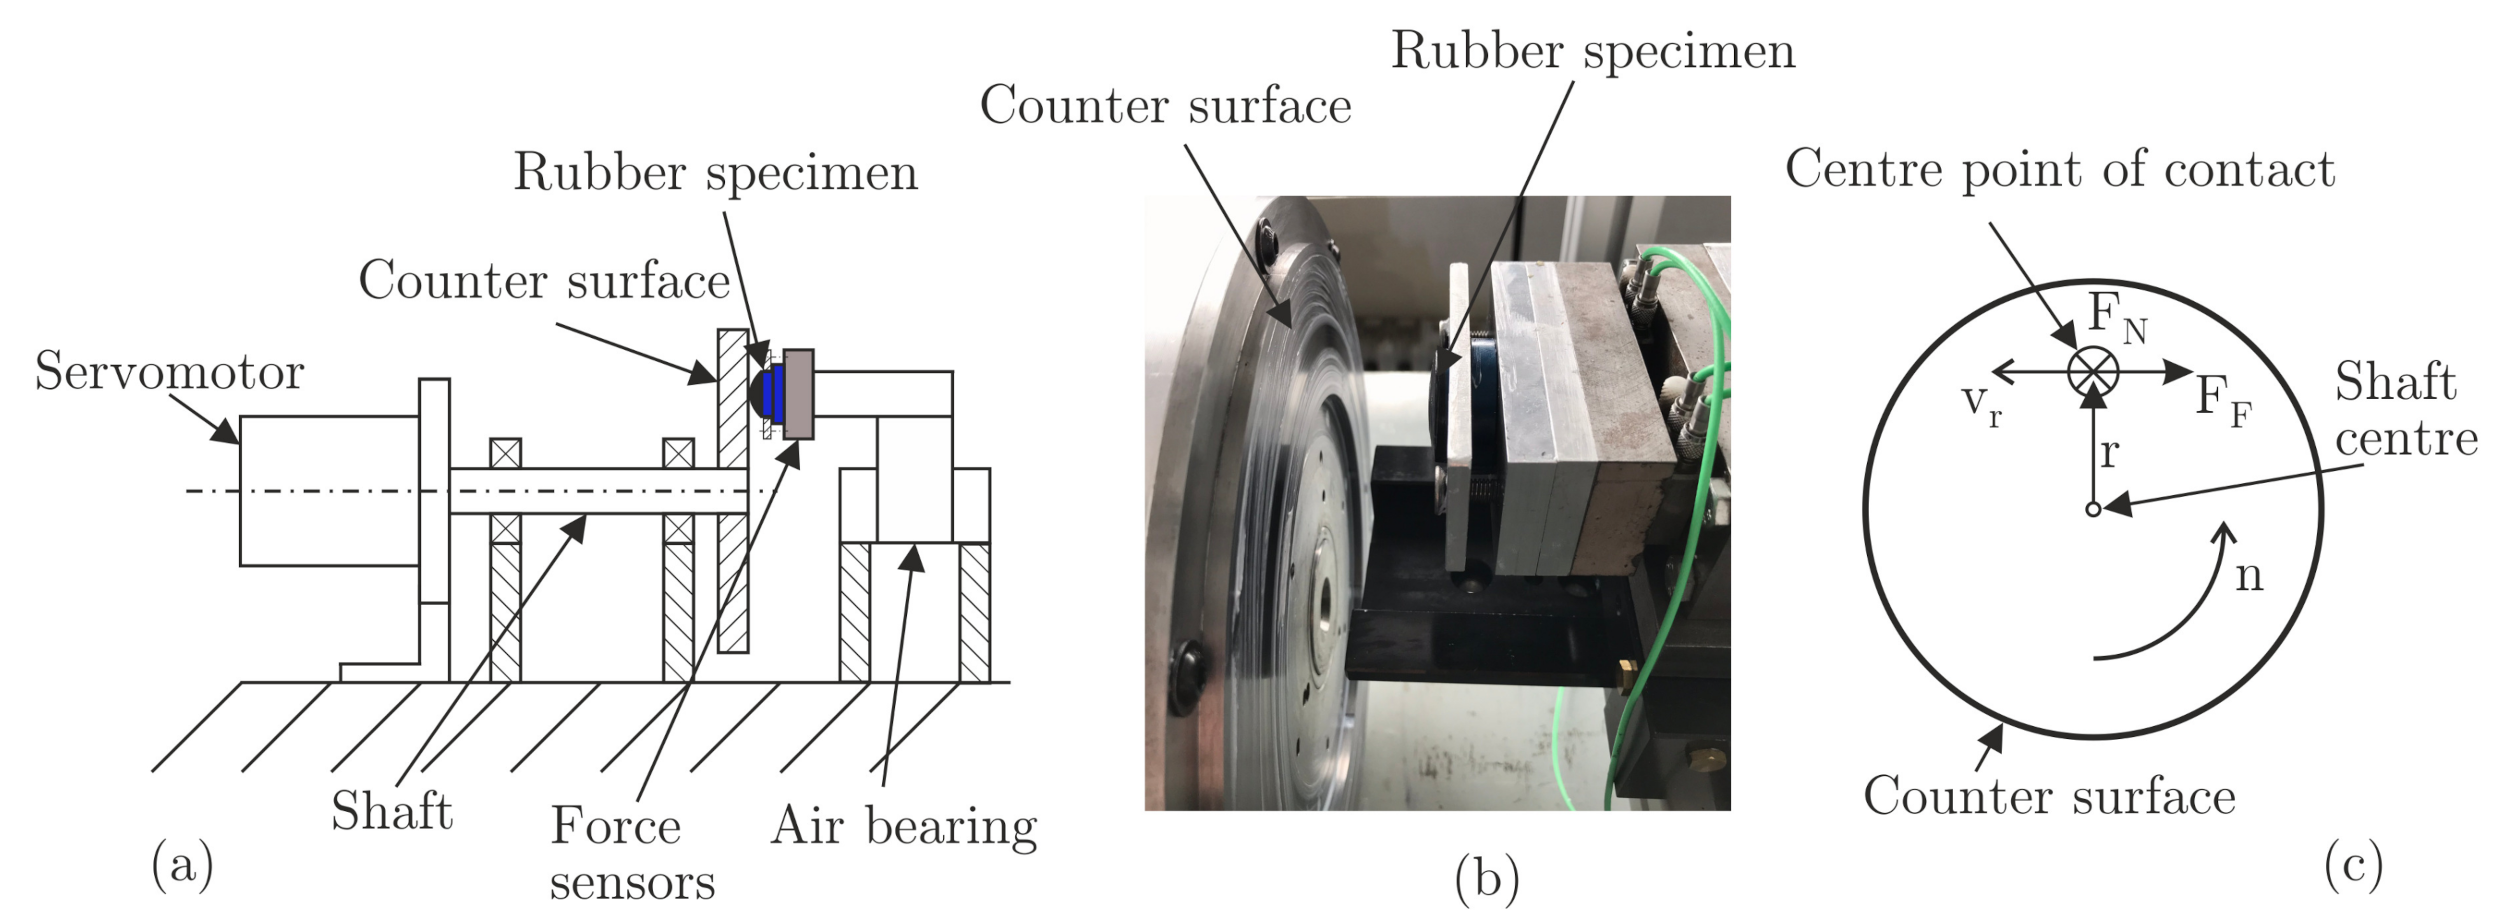
2.2. Test Rig Setup and Experimental Procedure for Determining the Coefficient of Friction
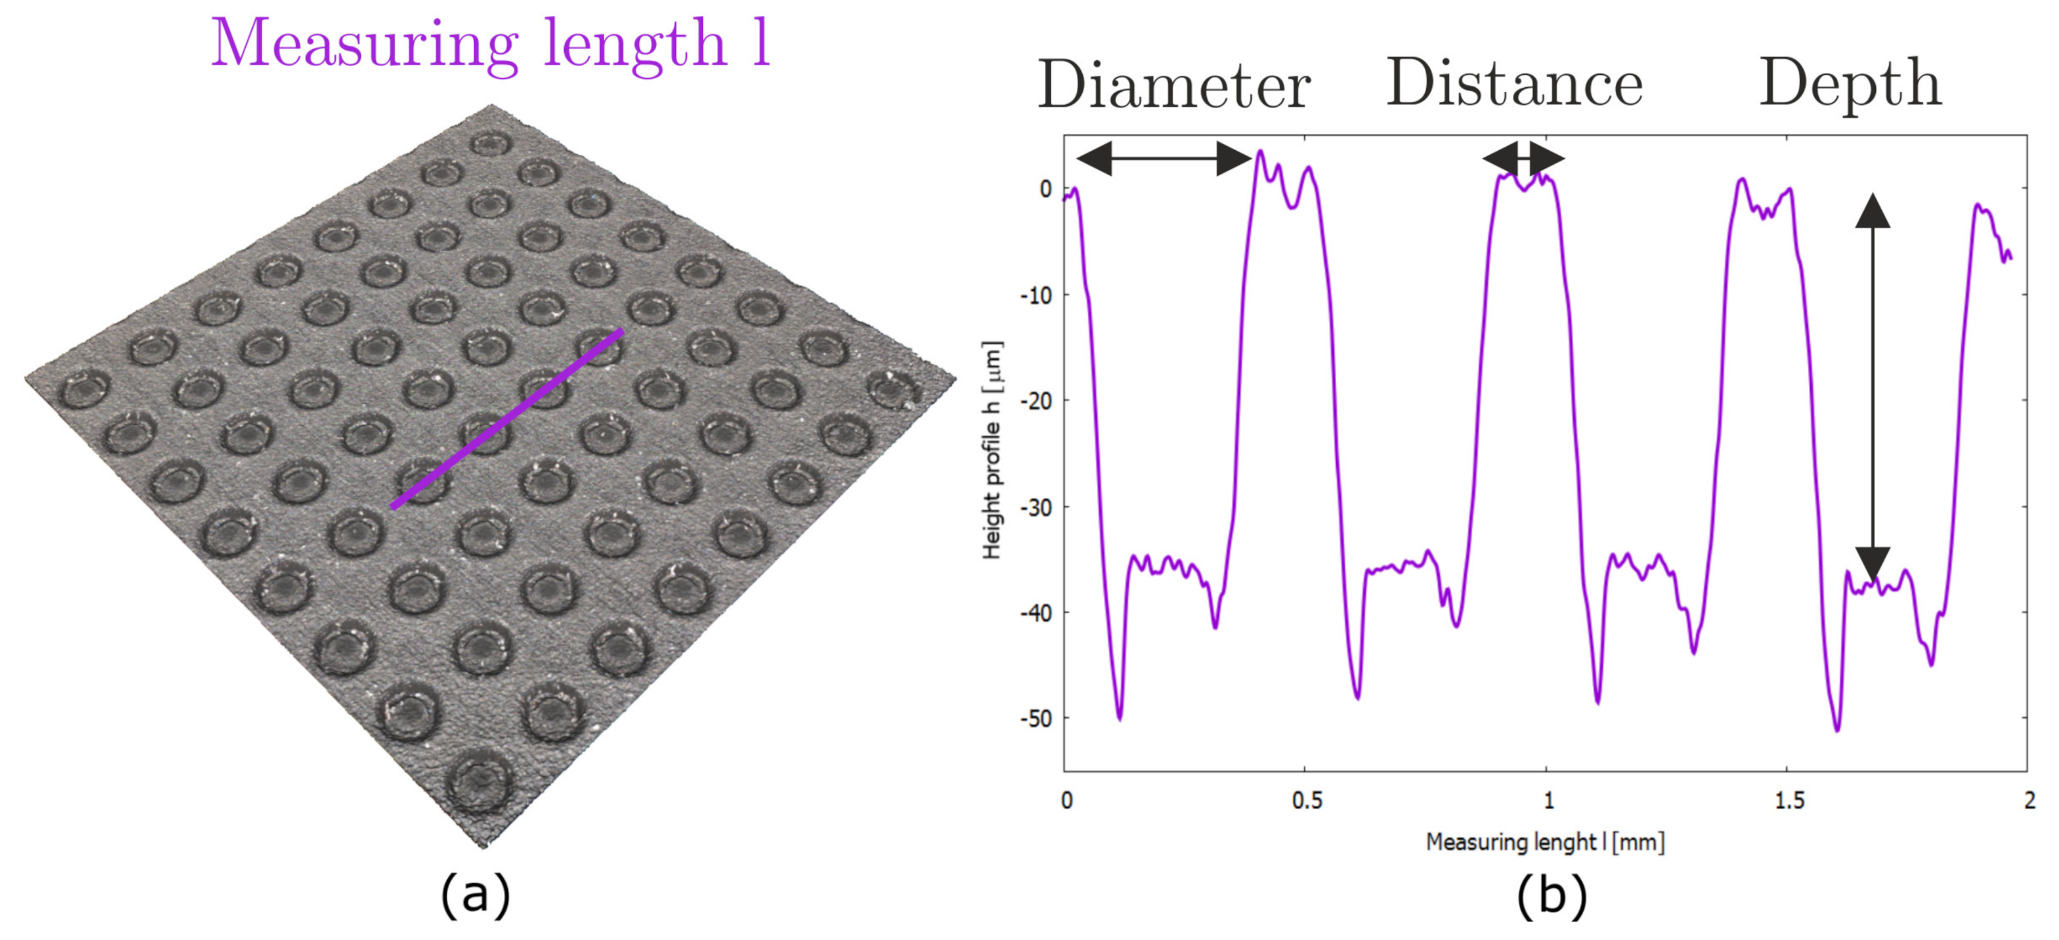
2.3. Method of Measurement for Real Dimple Dimensions
2.4. Software Development for Reduced Order Modelling
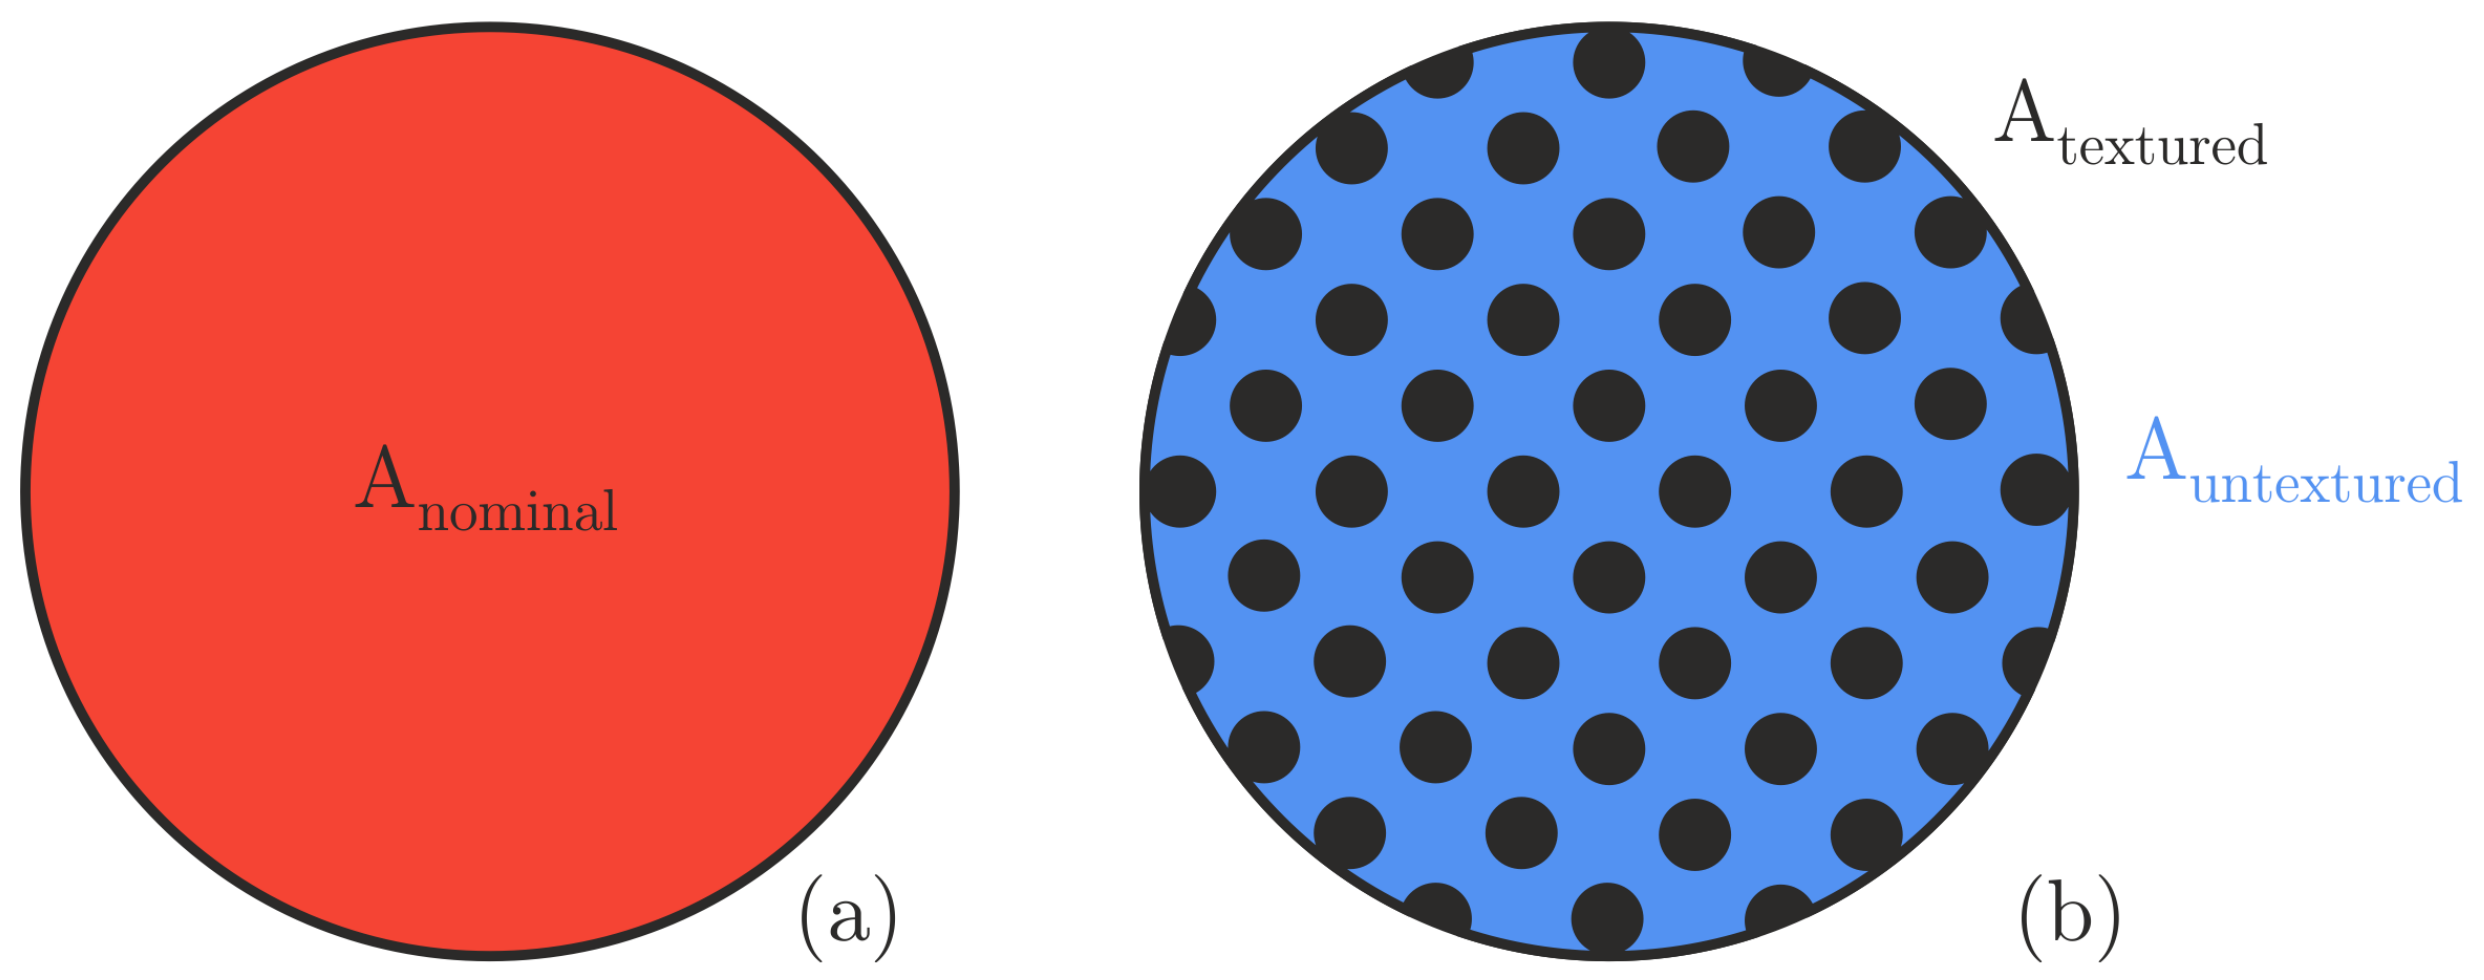
2.5. Reduced Order Modelling Data Pre-Processing for Friction Reduction
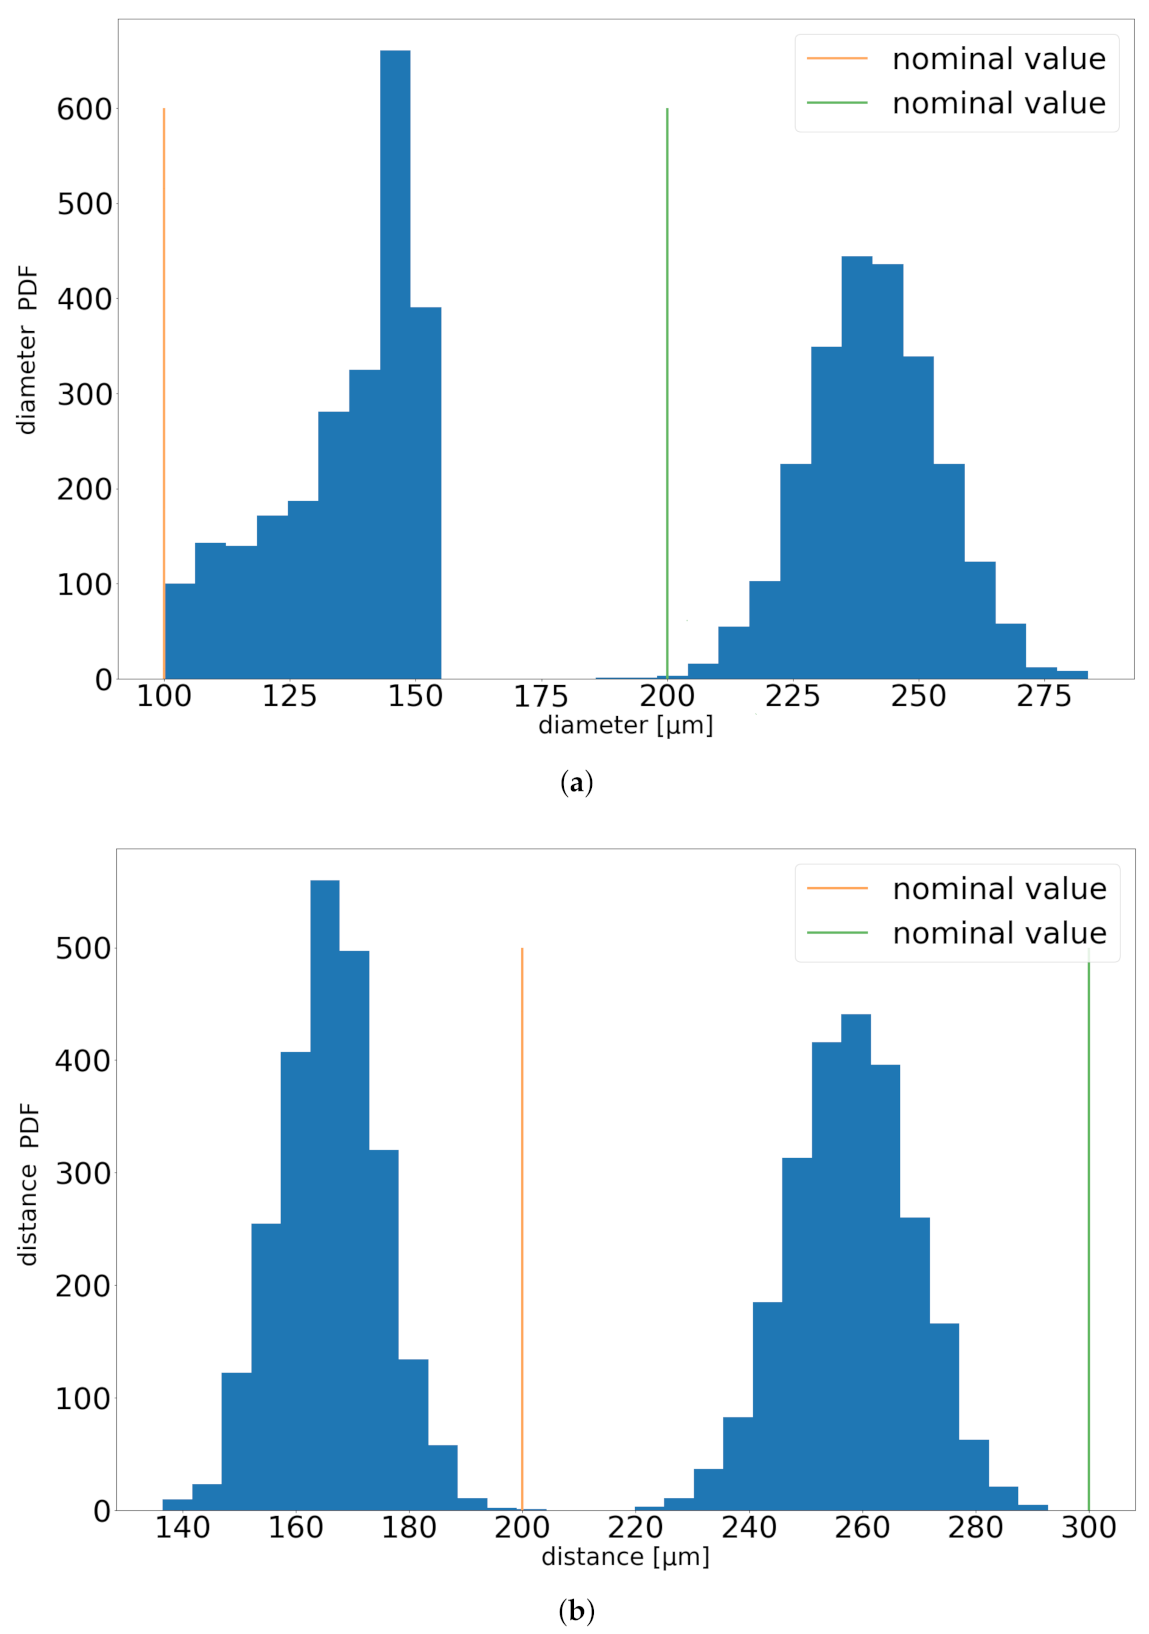
2.6. Statistical Analysis of Real Dimple Dimensions
3. Results
3.1. Measurement Results of the Real Dimple Dimensions and Definition of Dimensionless Dimple Parameters
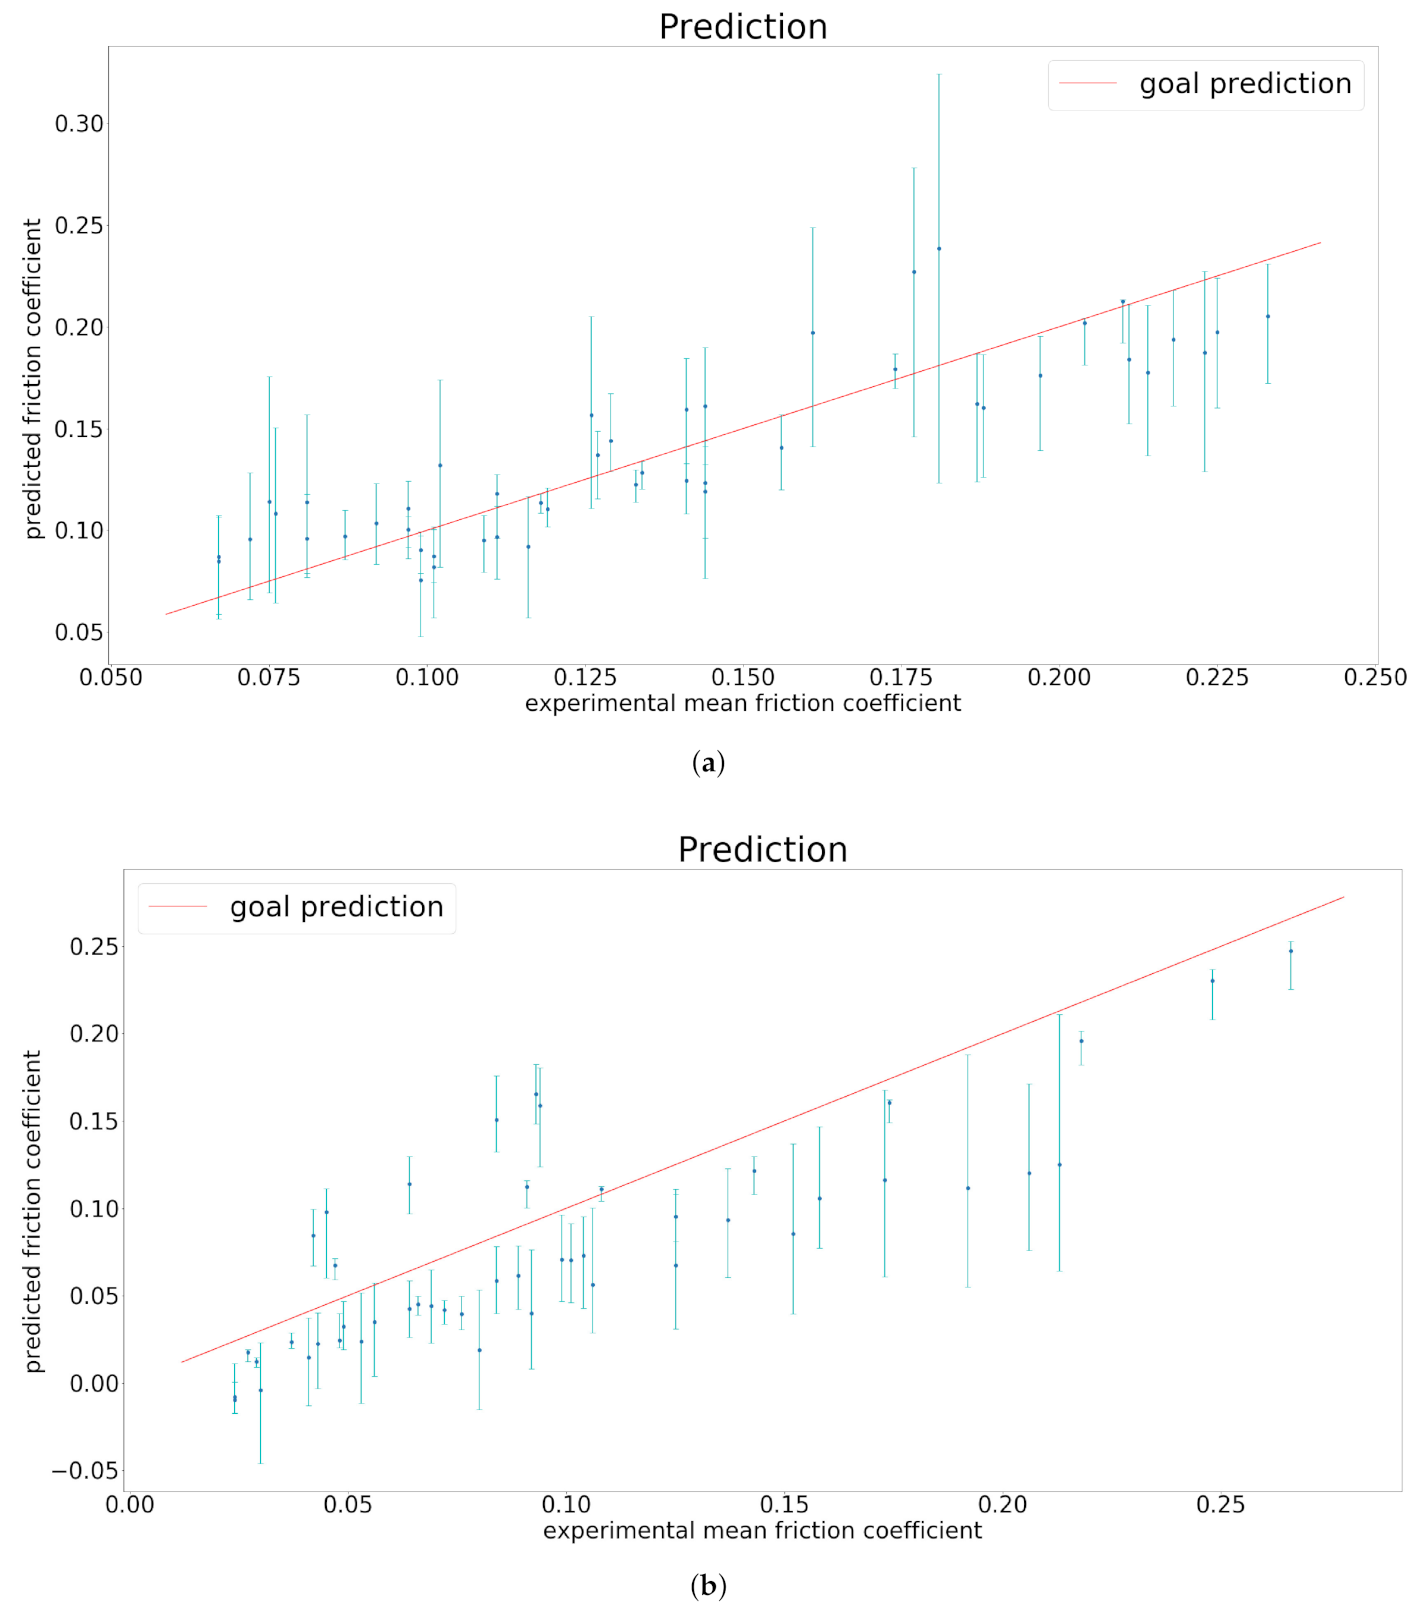
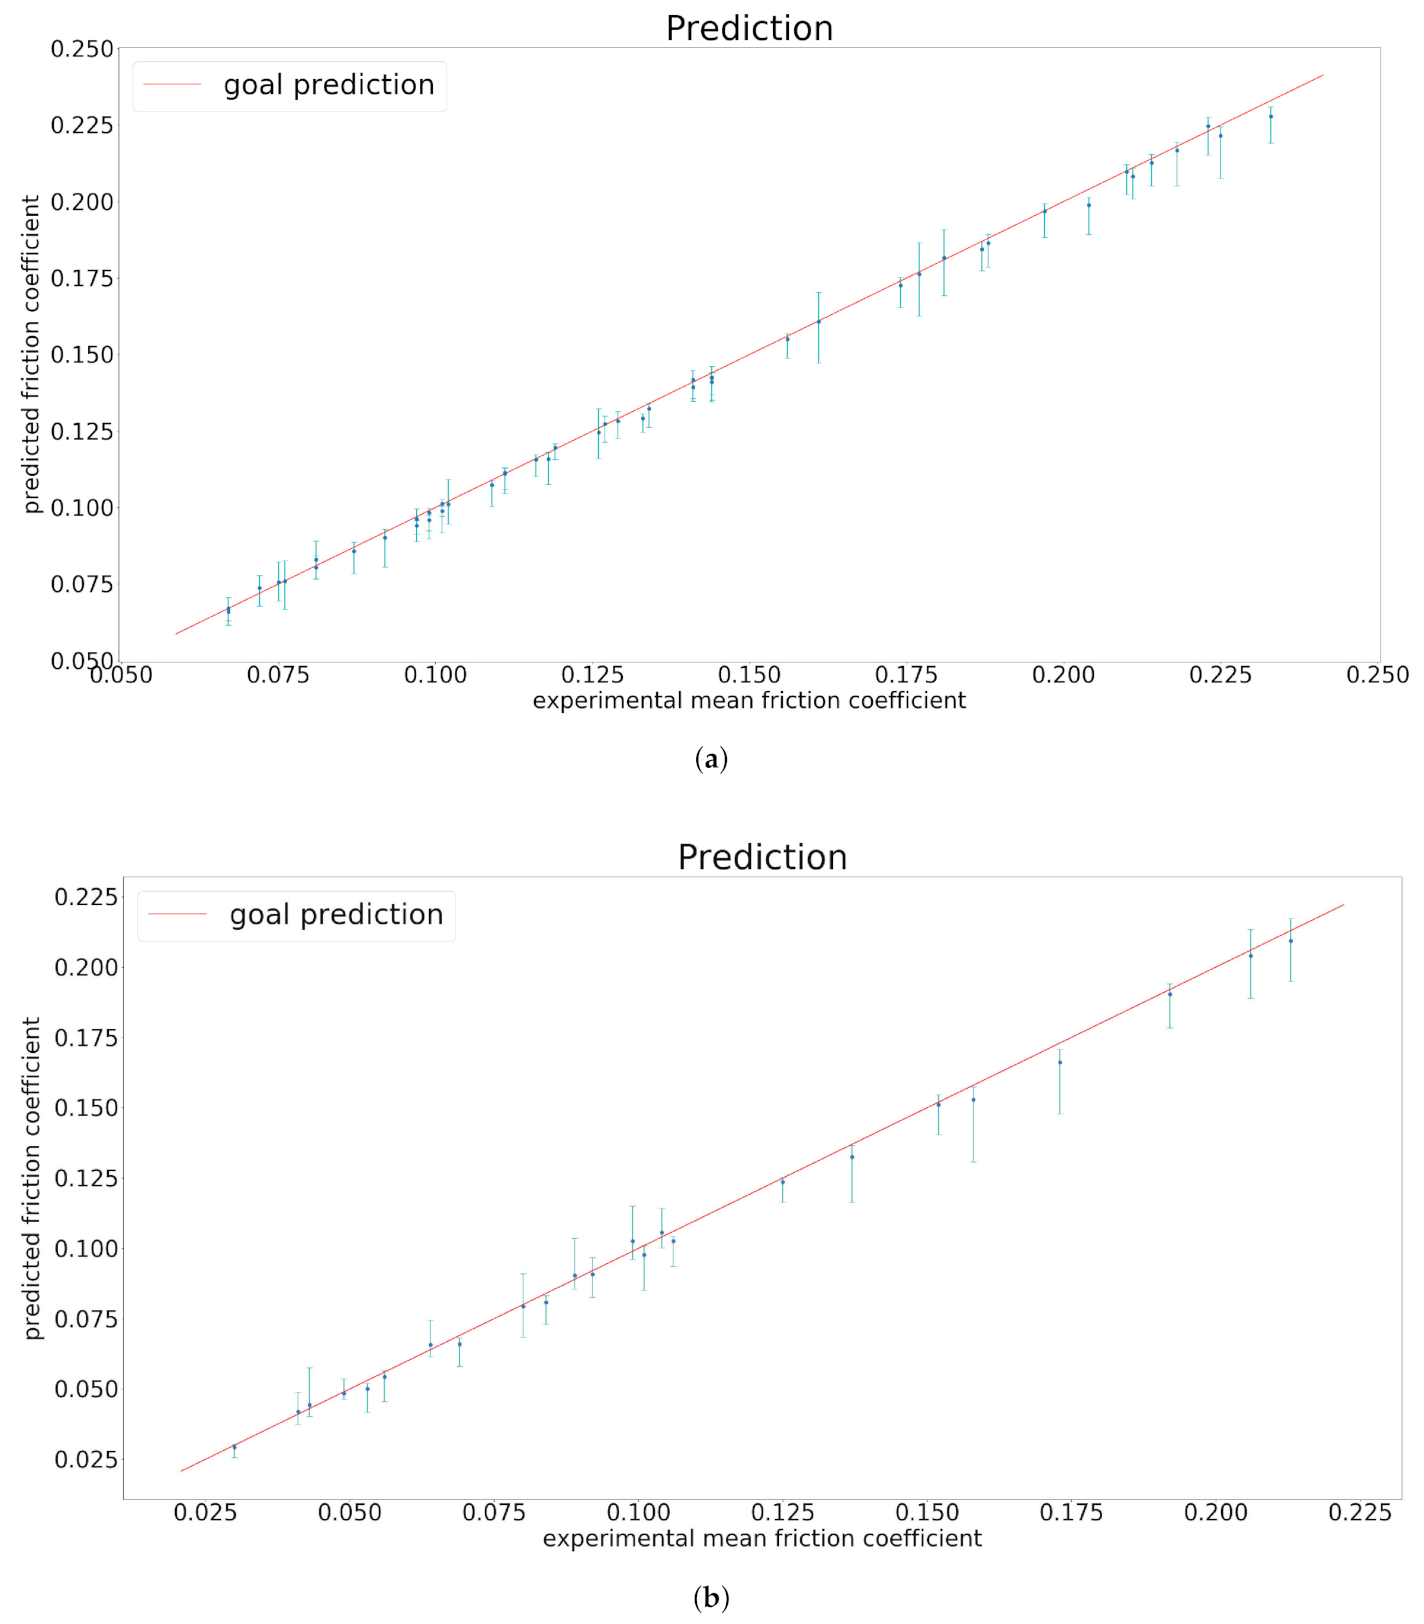
3.2. Reduced Order Modelling on Friction Coefficient Data
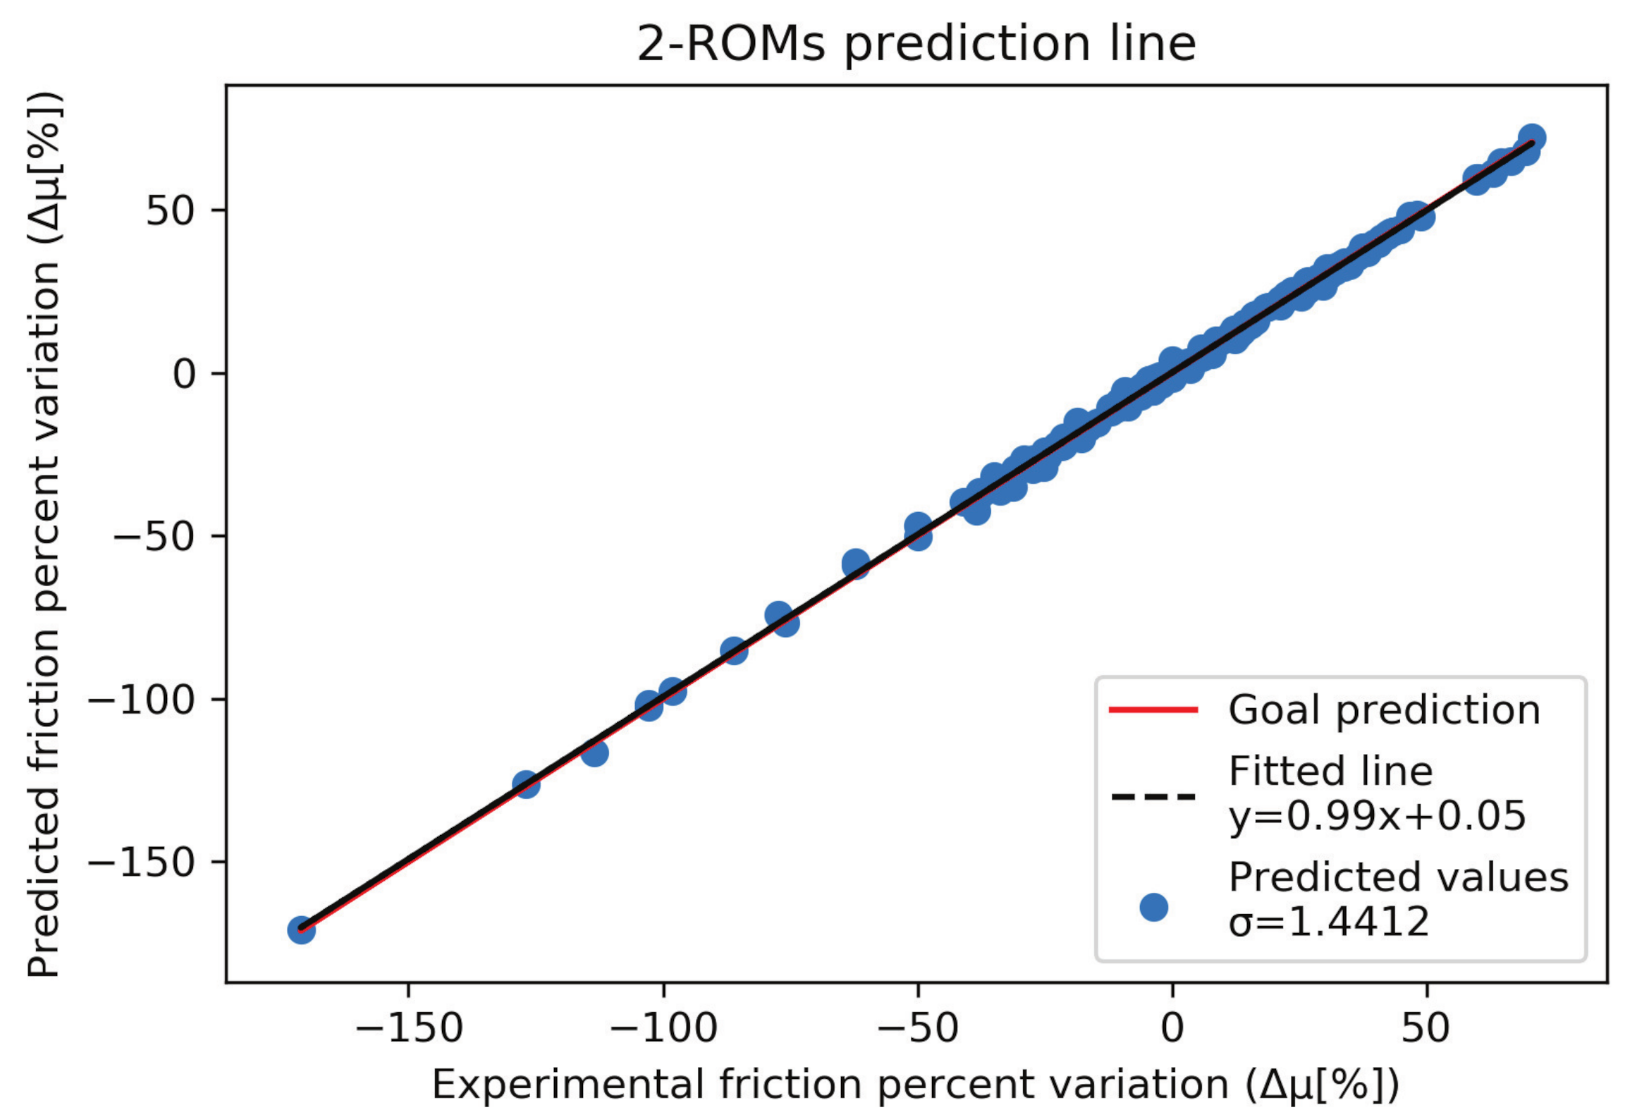
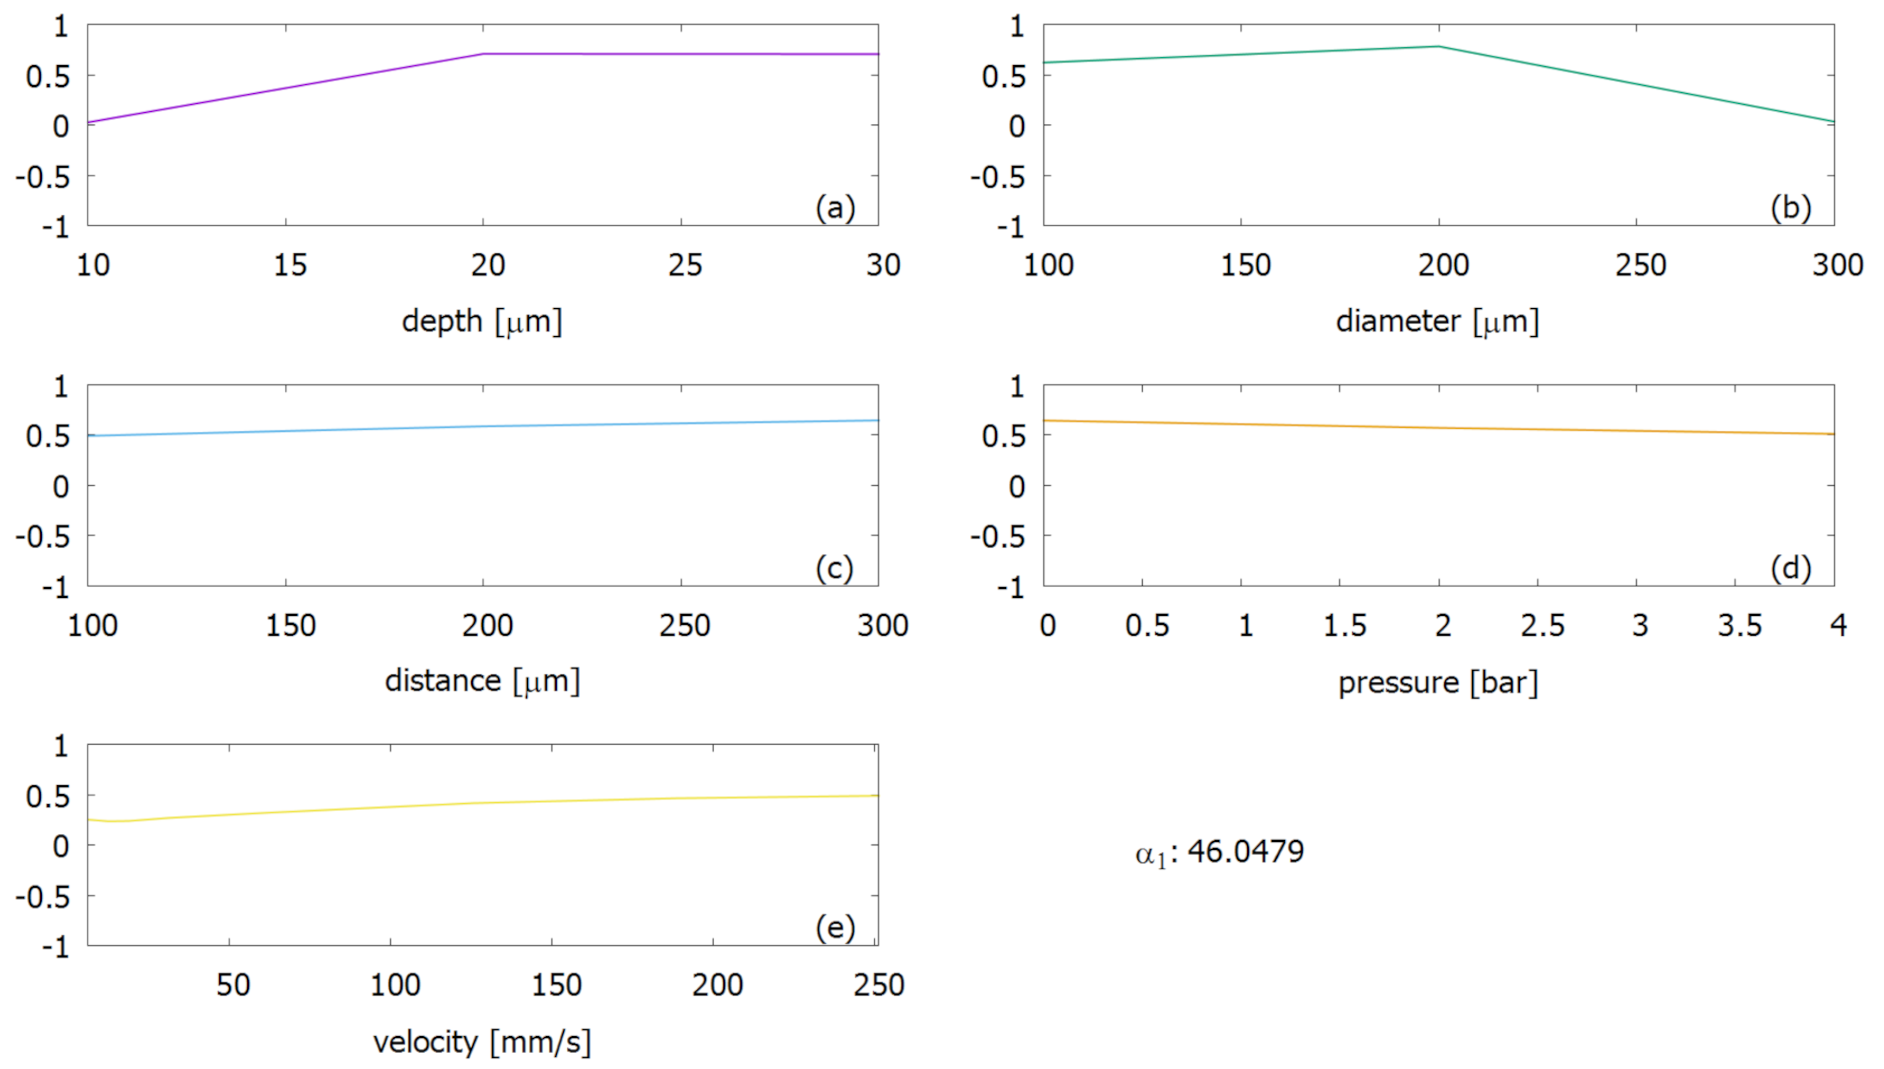
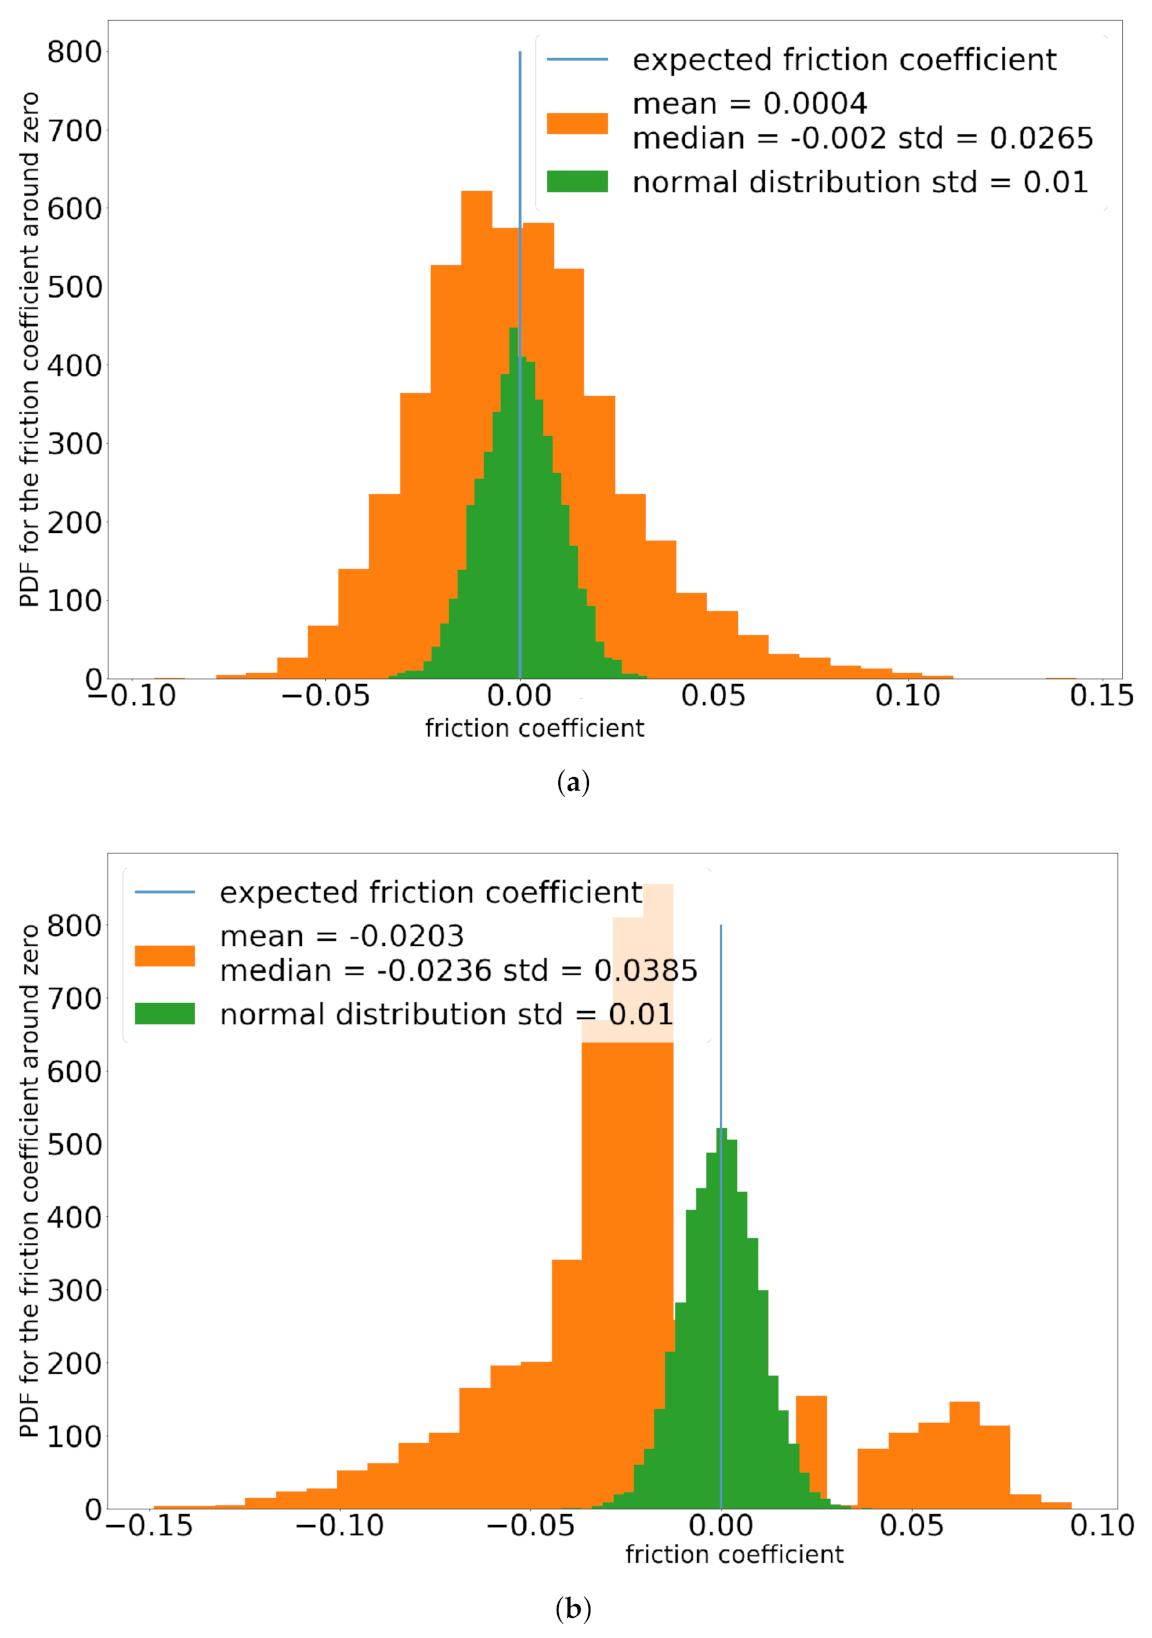
3.3. Reduced Order Modelling on Pre-Processed Data for Friction Variations
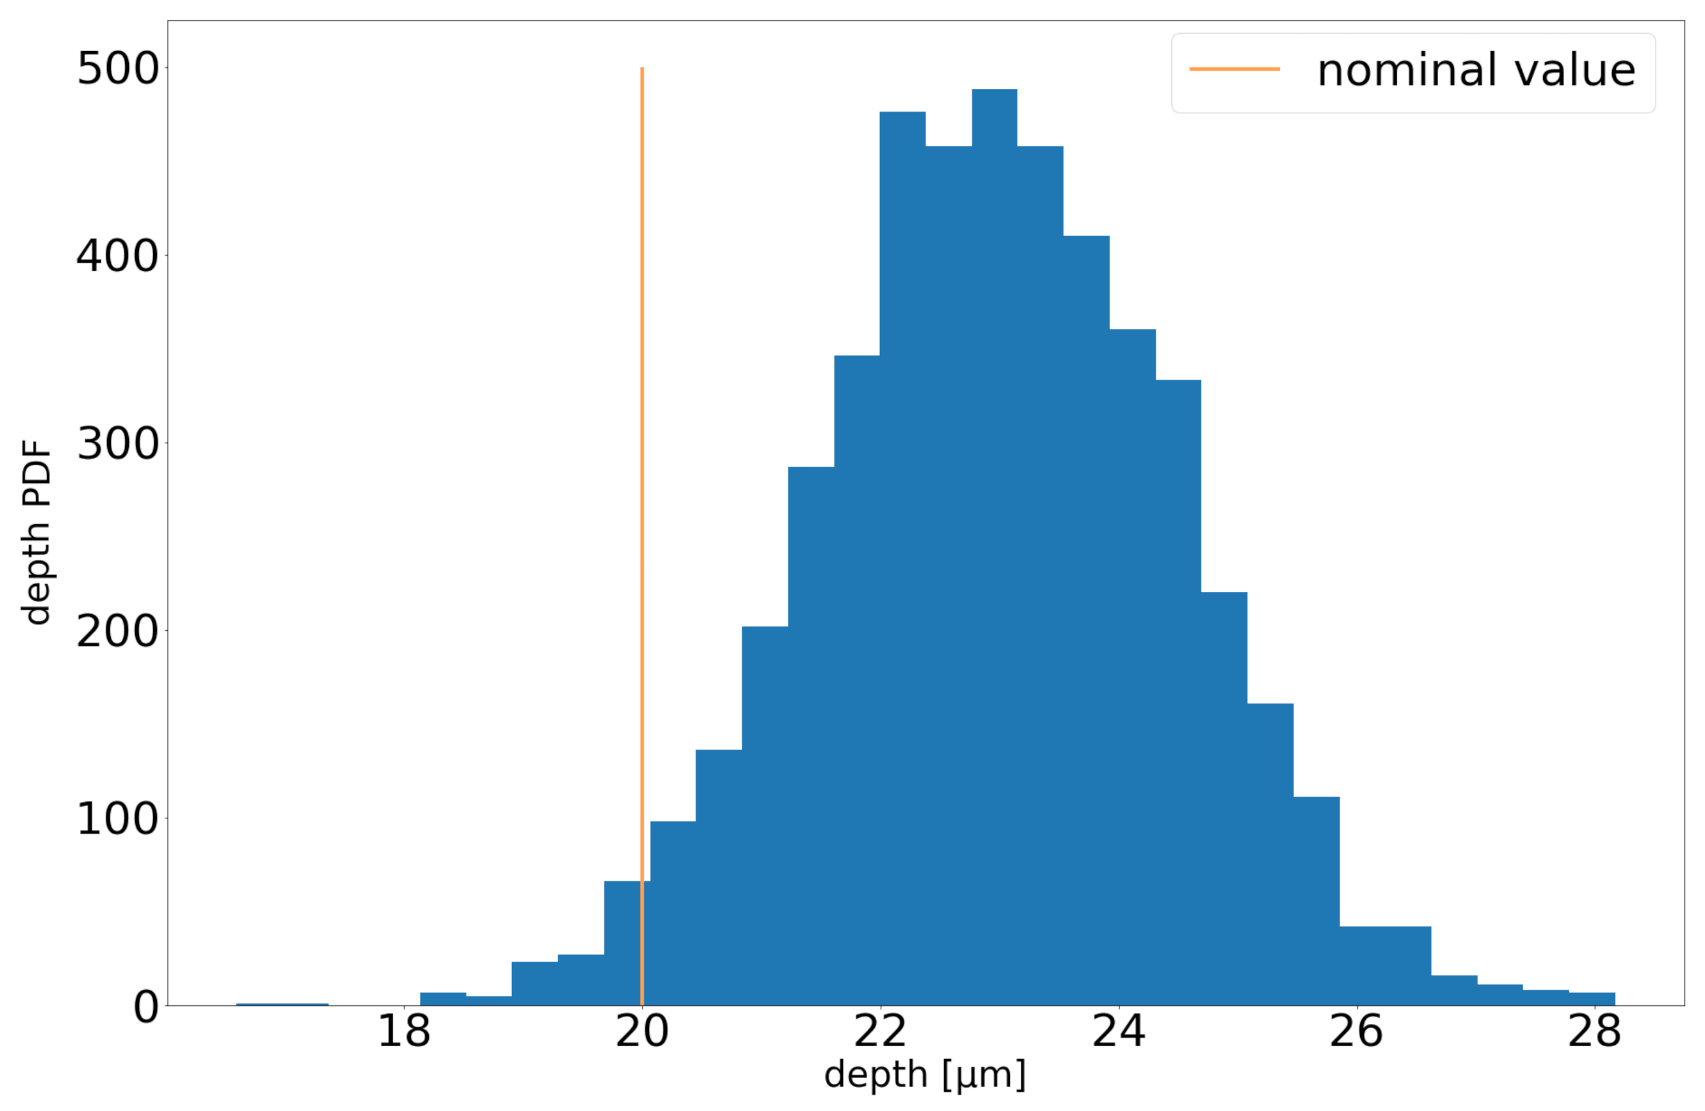
3.4. Statistical Analysis Results of Real Dimple Dimensions
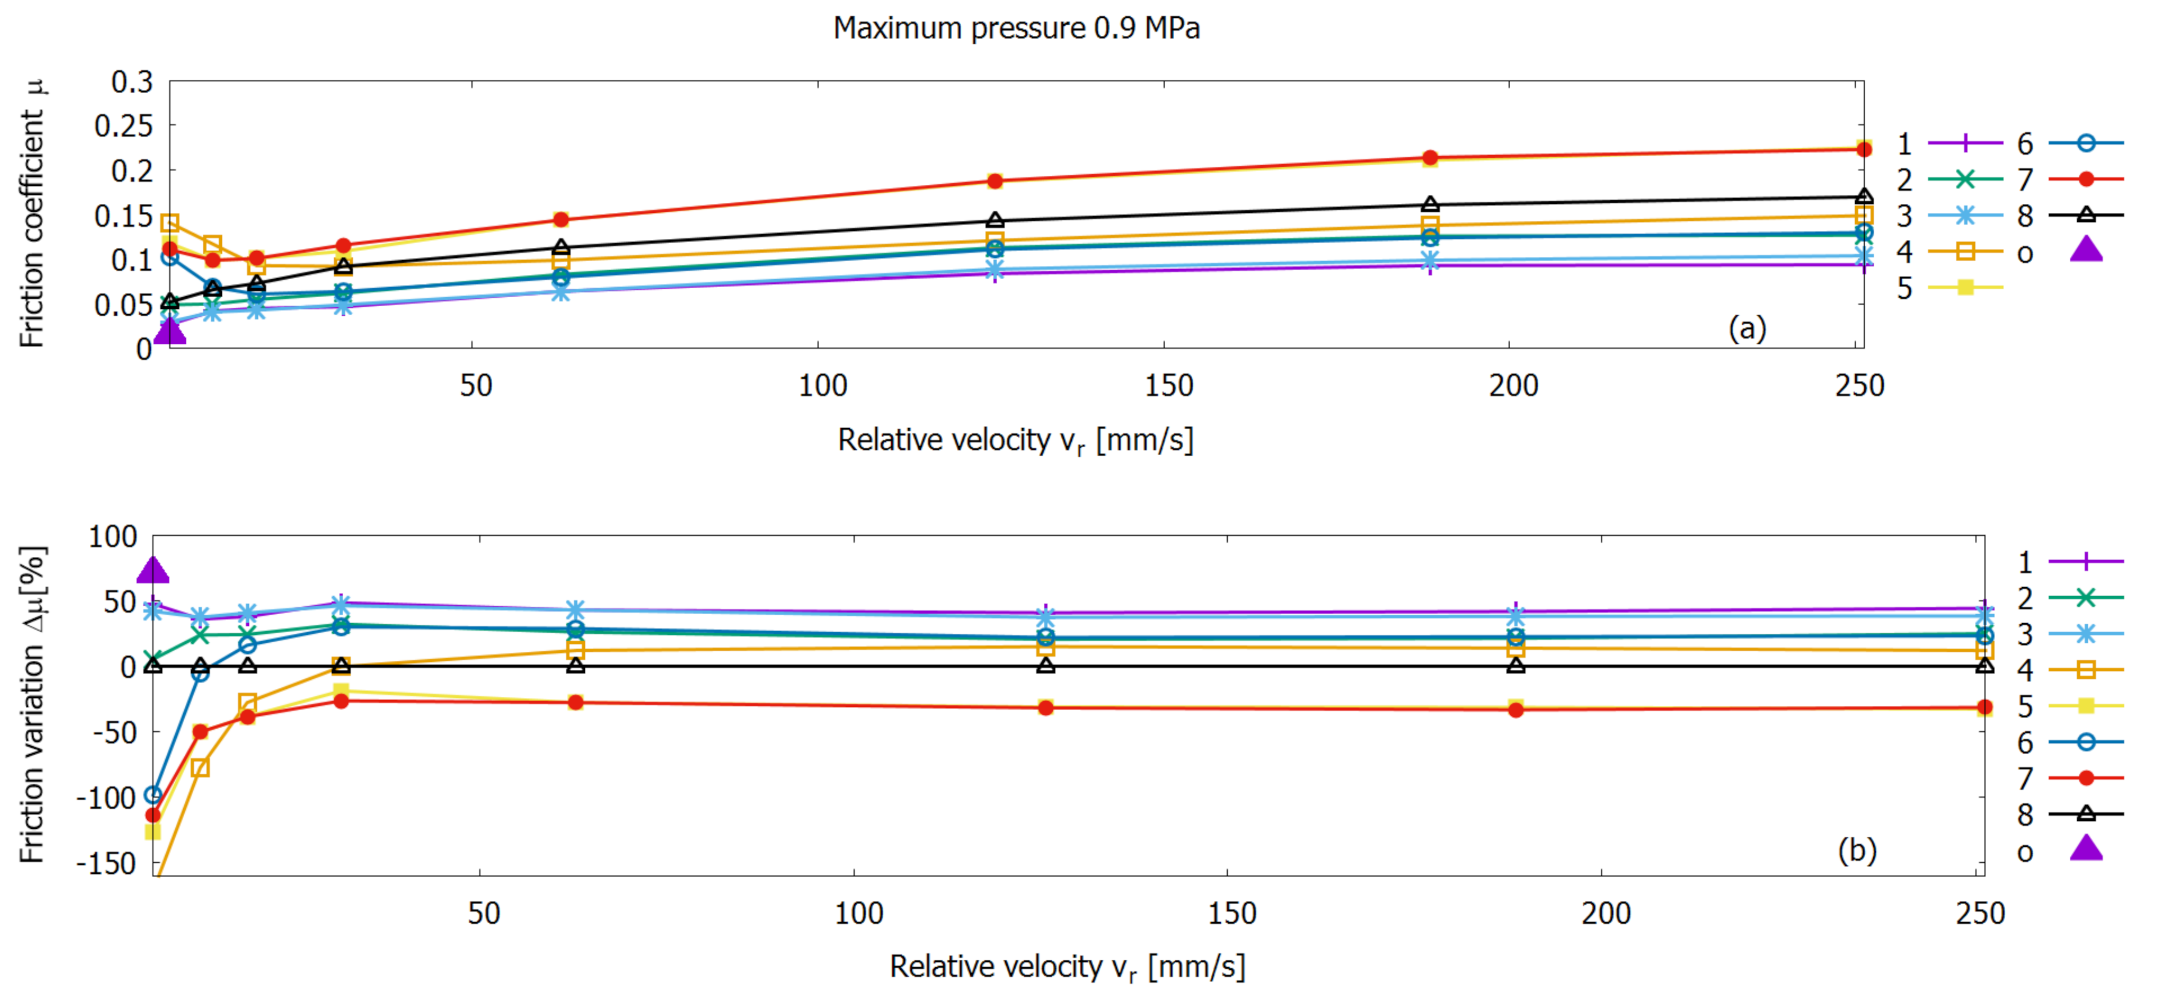
3.5. Experimental Friction Measurement Results and ROM Friction Prediction Outcome
4. Discussion
5. Conclusions
Author Contributions
Funding
Institutional Review Board Statement
Informed Consent Statement
Data Availability Statement
Acknowledgments
Conflicts of Interest
Abbreviations
| AI | Artificial Intelligence |
| CFD | Cumulative Density Function |
| DoE | Design of Experiment |
| DT | Digital Twin |
| FEM | Finite Element Method |
| LST | Laser Surface Texturing |
| ML | Machine Learning |
| Probability Density Function | |
| PGD | Proper Generalized Decomposition |
| POD | Proper Orthogonal Decomposition |
| ROM | Reduced Order Modelling |
| SEHL | Soft Elasto-Hydrodynamic Lubrication |
| SVD | Singular Value Decomposition |
| TDM | Texturing During Moulding |
| TRD | Tensor Rank Decomposition |
References
- Korane, K. Low-Friction Seals Give High Fluid-Power Efficiency. Available online: https://www.machinedesign.com/news/article/21829567/lowfriction-seals-give-high-fluidpower-efficiency (accessed on 22 March 2021).
- Jeng, Y.R. Impact of plateaued surfaces on tribological performance. Tribol. Trans. 1996, 39, 354–361. [Google Scholar] [CrossRef]
- Wróblewski, P.; Iskra, A. Geometry of shape of profiles of the sliding surface of ring seals in the aspect of friction losses and oil film parameters. Combust. Engines 2016, 55. [Google Scholar] [CrossRef]
- Ryk, G.; Kligerman, Y.; Etsion, I. Experimental Investigation of Laser Surface Texturing for Reciprocating Automotive Components. Tribol. Trans. 2002, 45, 444–449. [Google Scholar] [CrossRef]
- Tomanik, E.; Profito, F.J.; Zachariadis, D.C. Modelling the hydrodynamic support of cylinder bore and piston rings with laser textured surfaces. Tribol. Int. 2013, 59, 90–96. [Google Scholar] [CrossRef]
- Etsion, I.; Burstein, L. A Model for Mechanical Seals with Regular Microsurface Structure. Tribol. Trans. 1996, 39, 677–683. [Google Scholar] [CrossRef]
- Etsion, I.; Kligerman, Y.; Halperin, G. Analytical and experimental investigation of laser-textured mechanical seal faces. Tribol. Trans. 1999, 42, 511–516. [Google Scholar] [CrossRef]
- Etsion, I. Improving Tribological Performance of Mechanical Components by Laser Surface Texturing. Tribol. Lett. 2004, 17, 733–737. [Google Scholar] [CrossRef]
- Pettersson, U.; Jacobson, S. Influence of surface texture on boundary lubricated sliding contacts. Tribol. Int. 2003, 36, 857–864. [Google Scholar] [CrossRef]
- Grützmacher, P.G.; Profito, F.J.; Rosenkranz, A. Multi-Scale Surface Texturing in Tribology—Current Knowledge and Future Perspectives. Lubricants 2019, 7, 95. [Google Scholar] [CrossRef] [Green Version]
- Shinkarenko, A.; Kligerman, Y.; Etsion, I. The effect of surface texturing in soft elasto-hydrodynamic lubrication. Tribol. Int. 2009, 42, 284–292. [Google Scholar] [CrossRef]
- Etsion, I. Modeling of surface texturing in hydrodynamic lubrication. Friction 2013, 1. [Google Scholar] [CrossRef] [Green Version]
- Zimmermann, M.; Wangenheim, M. Friction behaviour of surface textured elastomeric seals in pneumatic actuators. In Proceedings of the 23rd International Conference on Fluid Sealing, Manchester, UK, 2–3 March 2016; BHR Group: Cranfield, UK, 2016; p. 97. [Google Scholar]
- Dobrica, M.B.; Fillon, M.; Pascovici, M.D.; Cicone, T. Optimizing surface texture for hydrodynamic lubricated contacts using a mass-conserving numerical approach. Proc. Inst. Mech. Eng. Part J J. Eng. Tribol. 2010, 224, 737–750. [Google Scholar] [CrossRef]
- Vlădescu, S.; Olver, A.; Pegg, I.; Reddyhoff, T. Combined friction and wear reduction in a reciprocating contact through laser surface texturing. Wear 2016, 358–359, 51–61. [Google Scholar] [CrossRef] [Green Version]
- Adjemout, M.; Aurore, A.; Bouyer, J.; Brunetière, N.; Marcos, G.; Czerwiec, T. Influence of the real dimple shape on the performance of a surface textured mechanical seal. Tribol. Int. 2014, 115, 409–416. [Google Scholar] [CrossRef]
- Tao, F.; Qi, Q.; Wang, L.; Nee, A. Digital Twins and Cyber-Physical Systems toward Smart Manufacturing and Industry 4.0: Correlation and Comparison. Engineering 2019, 5, 653–661. [Google Scholar] [CrossRef]
- Tao, F.; Zhang, H.; Liu, A.; Nee, A.Y. Digital twin in industry: State-of-the-art. IEEE Trans. Ind. Inform. 2018, 15, 2405–2415. [Google Scholar] [CrossRef]
- Chinesta, F.; Cueto, E.; Abisset-Chavanne, E.; Duval, J.; Khaldi, F. Virtual, Digital and Hybrid Twins: A New Paradigm in Data-Based Engineering and Engineered Data. Arch. Comput. Methods Eng. 2018. [Google Scholar] [CrossRef] [Green Version]
- Le Clainche, S.; Vega, J.M. A Review on Reduced Order Modeling using DMD-Based Methods. In Proceedings of the IUTAM Symposium on Model Order Reduction of Coupled Systems, Stuttgart, Germany, 22–25 May 2018; Springer: Berlin/Heidelberg, Germany, 2020; pp. 55–66. [Google Scholar]
- Mignolet, M.P.; Przekop, A.; Rizzi, S.A.; Spottswood, S.M. A review of indirect/non-intrusive reduced order modeling of nonlinear geometric structures. J. Sound Vib. 2013, 332, 2437–2460. [Google Scholar] [CrossRef]
- Wuest, T.; Weimer, D.; Irgens, C.; Thoben, K.D. Machine learning in manufacturing: Advantages, challenges, and applications. Prod. Manuf. Res. 2016, 4, 23–45. [Google Scholar] [CrossRef] [Green Version]
- Zambrano, V.; Rodríguez-Barrachina, R.; Calvo, S.; Izquierdo, S. TWINKLE: A digital-twin-building kernel for real-time computer-aided engineering. SoftX 2020, 11, 100419. [Google Scholar] [CrossRef]
- Dataset Generated and Used Within This Publication. Available online: http://devex.ita.es/mouldtex/optimizer/Data.zip (accessed on 22 March 2021).
- Lee, C.Y.; Lin, C.S.; Jian, R.Q.; Wen, C.Y. Simulation and experimentation on the contact width and pressure distribution of lip seals. Tribol. Int. 2006, 39, 915–920. [Google Scholar] [CrossRef]
- Parker Pneumatic Seals Catalogue. Available online: https://www.parker.com/Literature/Praedifa/Catalogs/Catalog_PneuSeals_PTD3351-EN.pdf (accessed on 22 March 2021).
- OKS Adherent Silicone Grease Lubricant Specification. Available online: https://www.oks-germany.com/en/products/oks-1155-adherent-silicone-grease/ (accessed on 22 March 2021).
- TWINKLE: A Digital-Twin-Building Kernel for Real-Time Computer-Aided Engineering. Available online: https://github.com/caeliaITAINNOVA/Twinkle (accessed on 22 March 2021).
- Pedregosa, F.; Varoquaux, G.; Gramfort, A.; Michel, V.; Thirion, B.; Grisel, O.; Blondel, M.; Prettenhofer, P.; Weiss, R.; Dubourg, V.; et al. Scikit-learn: Machine Learning in Python. J. Mach. Learn. Res. 2011, 12, 2825–2830. [Google Scholar]
- Langford, J. The cross validation problem. In Proceedings of the International Conference on Computational Learning Theory, Bertinoro, Italy, 27–30 June 2005; Springer: Berlin/Heidelberg, Germany, 2005; pp. 687–688. [Google Scholar]
- Bochkanov, S. ALGLIB. Available online: www.alglib.net (accessed on 22 March 2021).
- Ayodele, T.O. Types of machine learning algorithms. New Adv. Mach. Learn. 2010, 3, 19–48. [Google Scholar]
- Berry, M.W.; Mohamed, A.; Yap, B.W. Supervised and Unsupervised Learning for Data Science; Springer: Berlin/Heidelberg, Germany, 2019. [Google Scholar]
- Harris, C.R.; Millman, K.J.; van der Walt, S.J.; Gommers, R.; Virtanen, P.; Cournapeau, D.; Wieser, E.; Taylor, J.; Berg, S.; Smith, N.J.; et al. Array programming with NumPy. Nature 2020, 585, 357–362. [Google Scholar] [CrossRef]
- Virtanen, P.; Gommers, R.; Oliphant, T.E.; Haberland, M.; Reddy, T.; Cournapeau, D.; Burovski, E.; Peterson, P.; Weckesser, W.; Bright, J.; et al. SciPy 1.0: Fundamental Algorithms for Scientific Computing in Python. Nat. Methods 2020, 17, 261–272. [Google Scholar] [CrossRef] [Green Version]
- Shinkarenko, A.; Kligerman, Y.; Etsion, I. The Validity of Linear Elasticity in Analyzing Surface Texturing Effect for Elastohydrodynamic Lubrication. Trans. ASME J. Tribol. 2009, 131. [Google Scholar] [CrossRef]
- Wang, X.; Kato, K.; Adachi, K.; Aizawa, K. The effect of laser texturing of SiC surface on the critical load for the transition of water lubrication mode from hydrodynamic to mixed. Tribol. Int. 2001, 34, 703–711. [Google Scholar] [CrossRef]
- Schneider, J.; Braun, D.; Greiner, C. Laser Textured Surfaces for Mixed Lubrication: Influence of Aspect Ratio, Textured Area and Dimple Arrangement. Lubricants 2017, 5, 32. [Google Scholar] [CrossRef] [Green Version]
- Mouldtex Project. Available online: http://www.mouldtex-project.eu/ (accessed on 22 March 2021).


| Sample i | Dimple Diameter [m] | Dimple Distance [m] | Dimple Depth [m] |
|---|---|---|---|
| 1 | 100 | 300 | 10 |
| 2 | 200 | 100 | 10 |
| 3 | 200 | 200 | 10 |
| 4 | 300 | 100 | 30 |
| 5 | 300 | 200 | 20 |
| 6 | 300 | 200 | 30 |
| 7 | 300 | 300 | 20 |
| 8 | - | - | - |
| a | |||
|---|---|---|---|
| Rotational Speed n[min] | Relative Velocity [mm/s] | ||
| 0.6 | 6 | ||
| 1.2 | 12 | ||
| 1.8 | 19 | ||
| 3.0 | 31 | ||
| 6.0 | 63 | ||
| 12.0 | 126 | ||
| 18.0 | 188 | ||
| 24.0 | 251 | ||
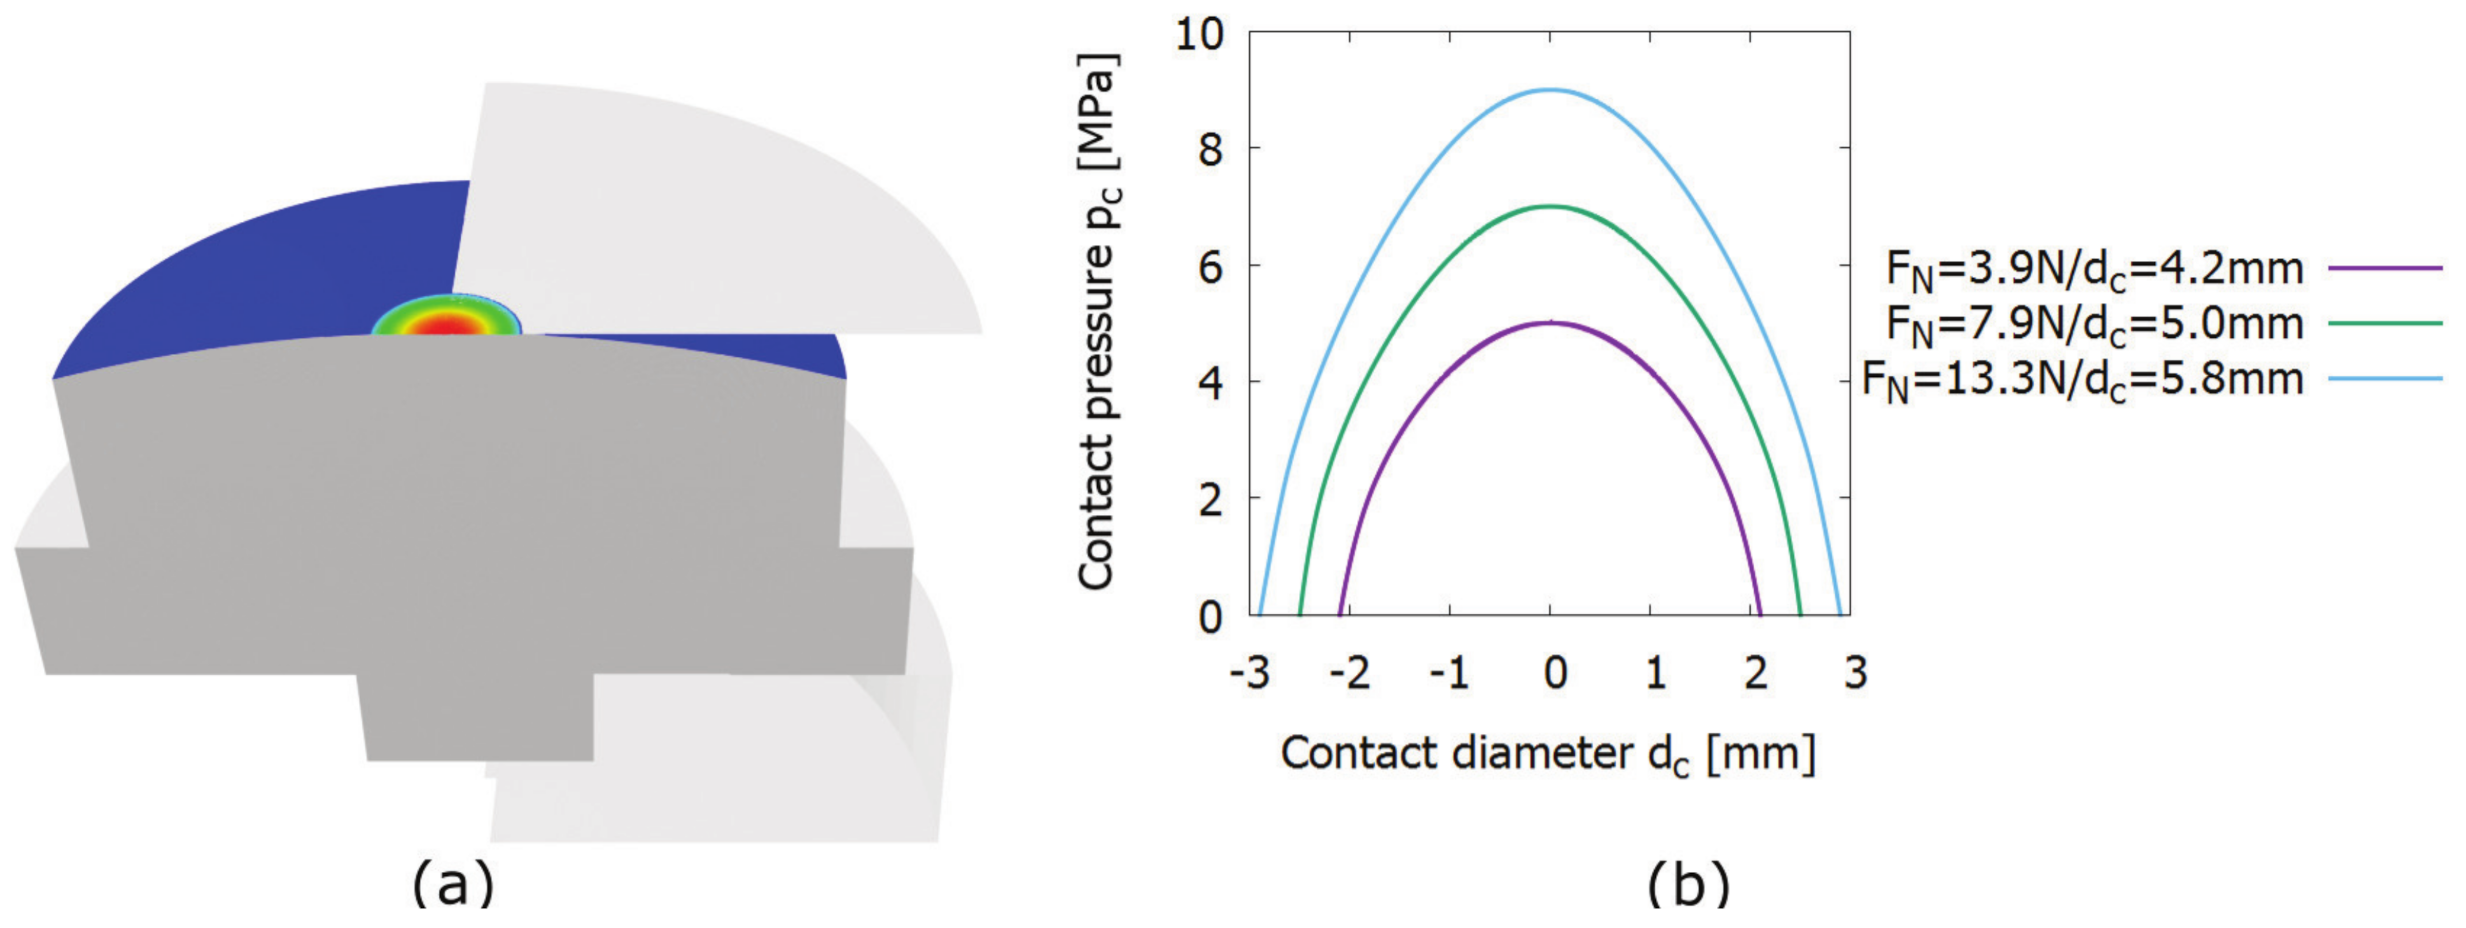
| b | |||
| Normal Force [N] | Max Contact Pressure [MPa] | Contact Diameter [mm] | Nominal Contact Area [mm] |
| 3.9 | 0.5 | 4.2 | 13.8 |
| 7.9 | 0.7 | 5.0 | 19.6 |
| 13.3 | 0.9 | 5.8 | 26.4 |
| Sample i | Dimple Diameter [m] | Dimple Distance [m] | Dimple Depth [m] | Aspect Ratio | Textured Area [%] |
|---|---|---|---|---|---|
| 1 | 135 | 258 | 16 | 0.11 | 9 |
| 2 | 242 | 100 | 11 | 0.05 | 39 |
| 3 | 241 | 165 | 10 | 0.04 | 28 |
| 4 | 337 | 66 | 35 | 0.10 | 55 |
| 5 | 330 | 170 | 22 | 0.06 | 34 |
| 6 | 346 | 153 | 35 | 0.10 | 37 |
| 7 | 336 | 252 | 20 | 0.06 | 25 |
| 8 | - | - | - | - | - |
| a | b | ||||
|---|---|---|---|---|---|
| Untextured ROM | Textured ROM | ||||
| Train | Test | Train | Test | ||
| 1 | 1.000 | 0.895 | 1 | 1.000 | 0.914 |
| 2 | 1.000 | 0.968 | 2 | 1.000 | 0.872 |
| 3 | 1.000 | 0.988 | 3 | 1.000 | 0.882 |
| 4 | 1.000 | 0.974 | 4 | 1.000 | 0.943 |
| 5 | 1.000 | 0.988 | 5 | 1.000 | 0.923 |
| 6 | 1.000 | 0.903 | 6 | 1.000 | 0.896 |
| 7 | 1.000 | 0.871 | 7 | 1.000 | 0.963 |
| 8 | 1.000 | 0.994 | 8 | 1.000 | 0.912 |
| 9 | 1.000 | 0.915 | 9 | 1.000 | 0.953 |
| 10 | 1.000 | 0.982 | 10 | 1.000 | 0.938 |
| avg | 1.000 | 0.948 | avg | 1.000 | 0.919 |
| Use Case Num. | Relative Velocity [mm/s] | Max Contact Pressure [MPa] | Dimple Diameter [m] | Dimple Distance [m] | Dimple Depth [m] | Aspect Ratio | Textured Area [%] | Predicted Friction Reduction [%] |
|---|---|---|---|---|---|---|---|---|
| 1 | 251 | 0.5 | 270 | 100 | 10 | 0.04 | 42 | 63 |
| 2 | 31 | 0.7 | 300 | 186 | 11 | 0.04 | 30 | 81 |
| 3 | 6 | 0.9 | 274 | 111 | 11 | 0.04 | 39 | 72 |
| 4 | 100 | 0.6 | 300 | 140 | 11 | 0.04 | 36 | 79 |
Publisher’s Note: MDPI stays neutral with regard to jurisdictional claims in published maps and institutional affiliations. |
© 2021 by the authors. Licensee MDPI, Basel, Switzerland. This article is an open access article distributed under the terms and conditions of the Creative Commons Attribution (CC BY) license (https://creativecommons.org/licenses/by/4.0/).
Share and Cite
Zambrano, V.; Brase, M.; Hernández-Gascón, B.; Wangenheim, M.; Gracia, L.A.; Viejo, I.; Izquierdo, S.; Valdés, J.R. A Digital Twin for Friction Prediction in Dynamic Rubber Applications with Surface Textures. Lubricants 2021, 9, 57. https://0-doi-org.brum.beds.ac.uk/10.3390/lubricants9050057
Zambrano V, Brase M, Hernández-Gascón B, Wangenheim M, Gracia LA, Viejo I, Izquierdo S, Valdés JR. A Digital Twin for Friction Prediction in Dynamic Rubber Applications with Surface Textures. Lubricants. 2021; 9(5):57. https://0-doi-org.brum.beds.ac.uk/10.3390/lubricants9050057
Chicago/Turabian StyleZambrano, Valentina, Markus Brase, Belén Hernández-Gascón, Matthias Wangenheim, Leticia A. Gracia, Ismael Viejo, Salvador Izquierdo, and José Ramón Valdés. 2021. "A Digital Twin for Friction Prediction in Dynamic Rubber Applications with Surface Textures" Lubricants 9, no. 5: 57. https://0-doi-org.brum.beds.ac.uk/10.3390/lubricants9050057