The Influence of Mechanical Deformations on Surface Force Measurements


Univ. Grenoble Alpes, CNRS, LIPhy, 38000 Grenoble, France
Lubricants 2021, 9(7), 69; https://0-doi-org.brum.beds.ac.uk/10.3390/lubricants9070069
Submission received: 9 June 2021
/
Revised: 5 July 2021
/
Accepted: 6 July 2021
/
Published: 13 July 2021
(This article belongs to the Special Issue Green Tribology: New Insights toward a Sustainable World)
Abstract
:Surface Force Balance (SFB) experiments have been performed in a dry atmosphere and across an ionic liquid, combining the analysis of surface interactions and deformations, and illustrate that the mechanical deformations of the surfaces have important consequences for the force measurements. First, we find that the variation of the contact radius with the force across the ionic liquid is well described only by the Derjaguin–Muller–Toporov (DMT) model, in contrast with the usual consideration that SFB experiments are always in the Johnson–Kendall–Roberts (JKR) regime. Secondly, we observe that mica does not only bend but can also experience a compression, of order with mica. We present a modified procedure to calibrate the mica thickness in a dry atmosphere, and we show that the structural forces measured across the ionic liquid cannot be described by the usual exponentially decaying harmonic oscillation, but should be considered as a convolution of the surface forces across the liquid and the mechanical response of the confining solids. The measured structural force profile is fitted with a heuristic formulation supposing that mica compression is dominant over liquid compression, and a scaling criterion is proposed to distinguish situations where the solid deformation is negligible or dominant.
1. Introduction
Understanding the behavior of liquids in nanoconfinement is crucial for a range of applications including energy storage (electrolyte in contact with porous electrodes), lubrication (lubricant in between rough sliding surfaces) and filtration (such as sea water through a membrane), as well as in biological systems (ion crossing the cell membrane in a nanochannel, etc.). Very often, model experiments are performed with elementary systems of simple geometry: two surfaces facing each other in force measurements, a single channel in flow measurements. This allows for a simpler mathematical description of the system, while putting aside the complex collective effects happening in the presence of multiple asperities or pores. The ultimate goal is to understand the underlying physics at a fundamental level, independent of a particular geometry. For example, the Surface Force Balance/Apparatus (SFB/SFA), and the Atomic Force Microscope (AFM) are force measurements techniques using surfaces of different shapes and radii of curvatures R: crossed cylinders of radii ∼1 in SFB, sphere of radius ∼10 – and a plane in AFM. The normal interaction force profiles obtained can, in certain conditions, be directly compared by rescaling the measured force F by the radius of curvature R. Indeed, Derjaguin showed that is proportional to the energy density between equivalent planar and parallel surfaces, provided that (i) , (ii) the interactions involved are additive and (iii) the surfaces are not deformed [1,2]. However, real solids are not perfectly rigid, and significant deformations of the surfaces can occur depending on the strength and range of the interaction. For example, when measuring friction in the boundary lubrication regime and under applied load, a strong repulsion across the molecularly thick boundary film typically leads to a substantial flattening of the surfaces [3]. Such deformations are not limited to situations of nanometric proximity of the confining solids, as they can be mediated by hydrodynamic interactions across the liquid [4,5]. These mechanical deformations have to be taken into account in order to correctly interpret the data, to compare with theories or numerical simulations, and to extrapolate the results to other experimental set-ups or practical applications. The SFB/SFA is a tool of choice in this respect, because the analysis of the so-called Fringes of Equal Chromatic Order (FECO) allows for an in situ characterization of the geometry, with a submolecular resolution (∼0.1 ) in the normal direction and an optical resolution (∼1 ) in the lateral direction. Although some pioneering works have been specifically dedicated to the study of contact mechanics with the SFA (i.e., the variation of the contact radius with the force, see, for example, [6,7]), deformations measurements are relatively rare in the extensive SFA literature. This is maybe because the amplitudes of the reported forces are generally small, and so these deformations are too small to be measured accurately and are calculated using theoretical models instead, or the deformations are considered to have a negligible effect on the force profile (i.e., the variation of the force with the distance) [8,9,10,11,12,13,14].
In this paper, we report on SFB experiments performed in a dry atmosphere and across an ionic liquid, for which we exploited the full capabilities of the instrument to measure directly and simultaneously the surface interactions and deformations. In the first case of the dry atmosphere (adhesion force of strong amplitude and short range), we find that the variation of the contact radius with the force is well described by a Johnson–Kendall–Roberts (JKR) model [15] and an effective elastic modulus describing the layered solid surfaces, in perfect agreement with the seminal work of Horn, Israelachvili and Fribac [6]. For relatively thick mica (∼7 ), we simultaneously observe that the mica does not only bend but also experiences a compression of ∼1 . Consequently, the common calibration procedure that uses the jump-in point in a dry atmosphere leads in this case to an underestimation of the mica thickness and an equivalent outward shift of the force profile measured after injecting the liquid; we propose a modified calibration procedure to take this effect into account. In the second case of the ionic liquid (adhesion force of moderate amplitude and long range), we find that the variation of the contact radius with the force is well described by a Derjaguin–Muller–Toporov (DMT) model [16] and an effective elastic modulus describing the layered solid surfaces, in contrast with the widespread assumption that contact mechanics between adhering surfaces in the SFA/SFB is always described by JKR model [17]. For the system studied here, we also show that the mechanical deformations of the solid surfaces strongly affect the shape of the structural force profile, with the commonly used exponentially decaying harmonic oscillation being convoluted with the compression of the mica. Finally, we propose a heuristic formulation to describe such convoluted structural force profile when the solid compression dominates the liquid compression, as well as a general scaling criterion to determine, for any surface force experiment, its regime of convolution (i.e., solid compression negligible or dominant compared to liquid compression).
2. Materials and Methods
The Surface Force Balance (SFB) has been explained in detail in previous publications [2,11,18]. Here, we briefly recall the principle of the instrument, illustrated in Figure 1b, and the details particular to the present experiments.
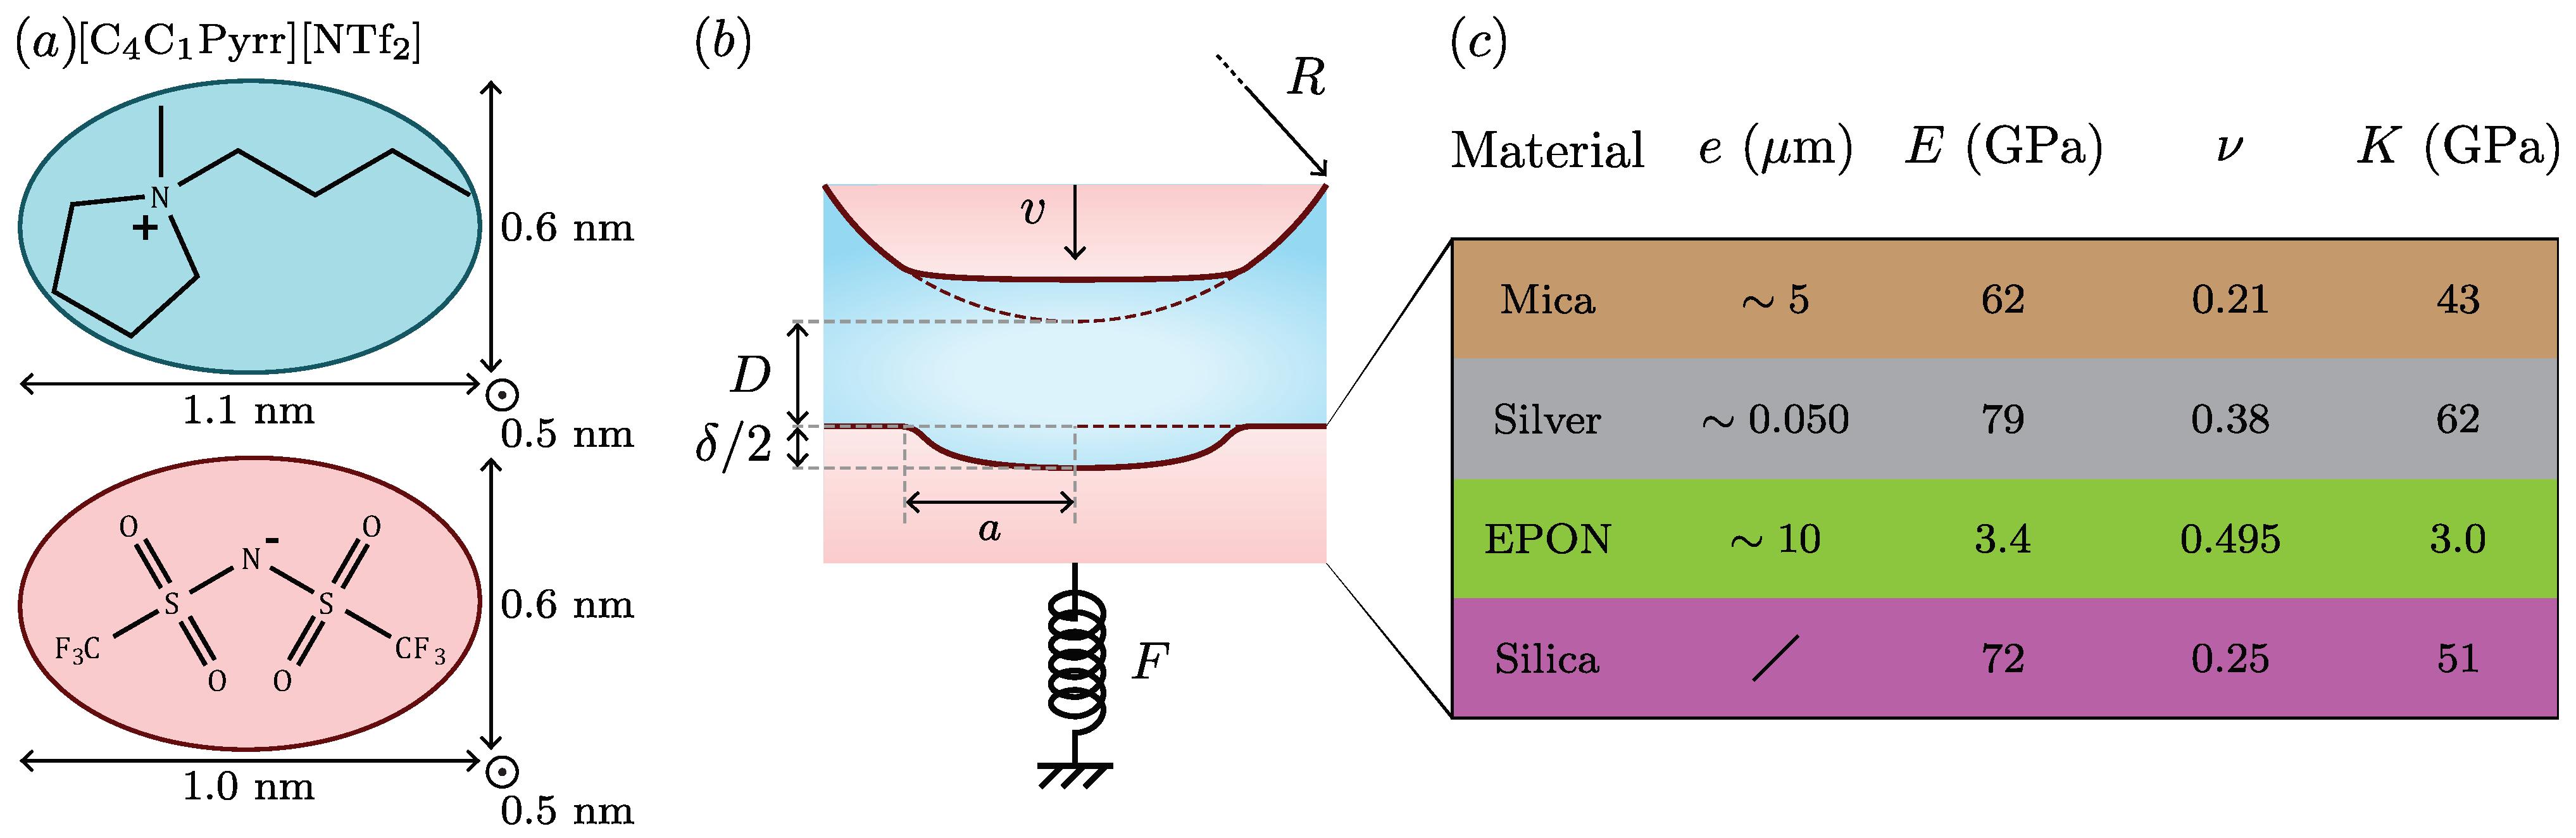
Muscovite mica is cleaved to produce atomically smooth facets of micrometric thickness and millimetric extension, which are backsilvered and glued onto glass (fused silica) cylindrical (radius 1 cm) lenses with an epoxy resin (EPON 1004, Shell Chemicals, Houston, TX, USA). Two surfaces are made with mica of the same thickness, form a stack of different layers (represented in Figure 1c, together with their thicknesses, Young’s moduli, Poisson’s ratios and elastic moduli), and are arranged in a cross-cylinder geometry. First, calibrations are carried out in a dry atmosphere, which is achieved by inserting PO, phosphorus pentoxide (Sigma-Aldrich, St. Louis, MO, USA, 99%), in the chamber and purging the chamber with N, nitrogen, about one hour prior to the calibrations. Secondly, measurements are performed with an ionic liquid, because these liquids have been proven to resist squeeze-out even under very large loads [19], a regime in which significant mechanical deformations of the surfaces are expected. The liquid used is [CCPyrr][NTf], 1-butyl-1-methylpyrrolidinium bis[(trifluoromethane)sulfonyl]imide (Iolitec, 99%), whose chemical structure and size are indicated in Figure 1a (molar mass , density , refractive index and dynamic viscosity at [20]). It is dried in a Schlenck line at and for ∼10 h and inserted in the chamber just after, which contains PO and is purged again with N for about one hour prior to the measurements.
![Lubricants 09 00069 g001]()
Figure 1.
(a) Chemical structure and sizes of [CCPyrr][NTf]. Ion sizes are estimated from geometry, bond lengths and covalent radii, associated with the most stable configuration found by energy minimization (Chem3D 16.0, PerkinElmer Informatics). (b) Schematic of the SFB experiment to measure the surface interactions and to characterize, in situ, the geometry, when a liquid is confined between two mica surfaces. (c) Composition of the layers forming each solid surface, with associated thickness e, Young’s modulus E, Poisson’s ratio and elastic modulus (values from [7,21,22]). For the anisotropic mica, the given mechanical properties correspond to the c-axis, the direction of interest for this study. A wide range of Young’s moduli have been reported for mica (50–500 in [6]); the quoted value has been consistently obtained by Brillouin scattering [21] and nanoindentation [7].

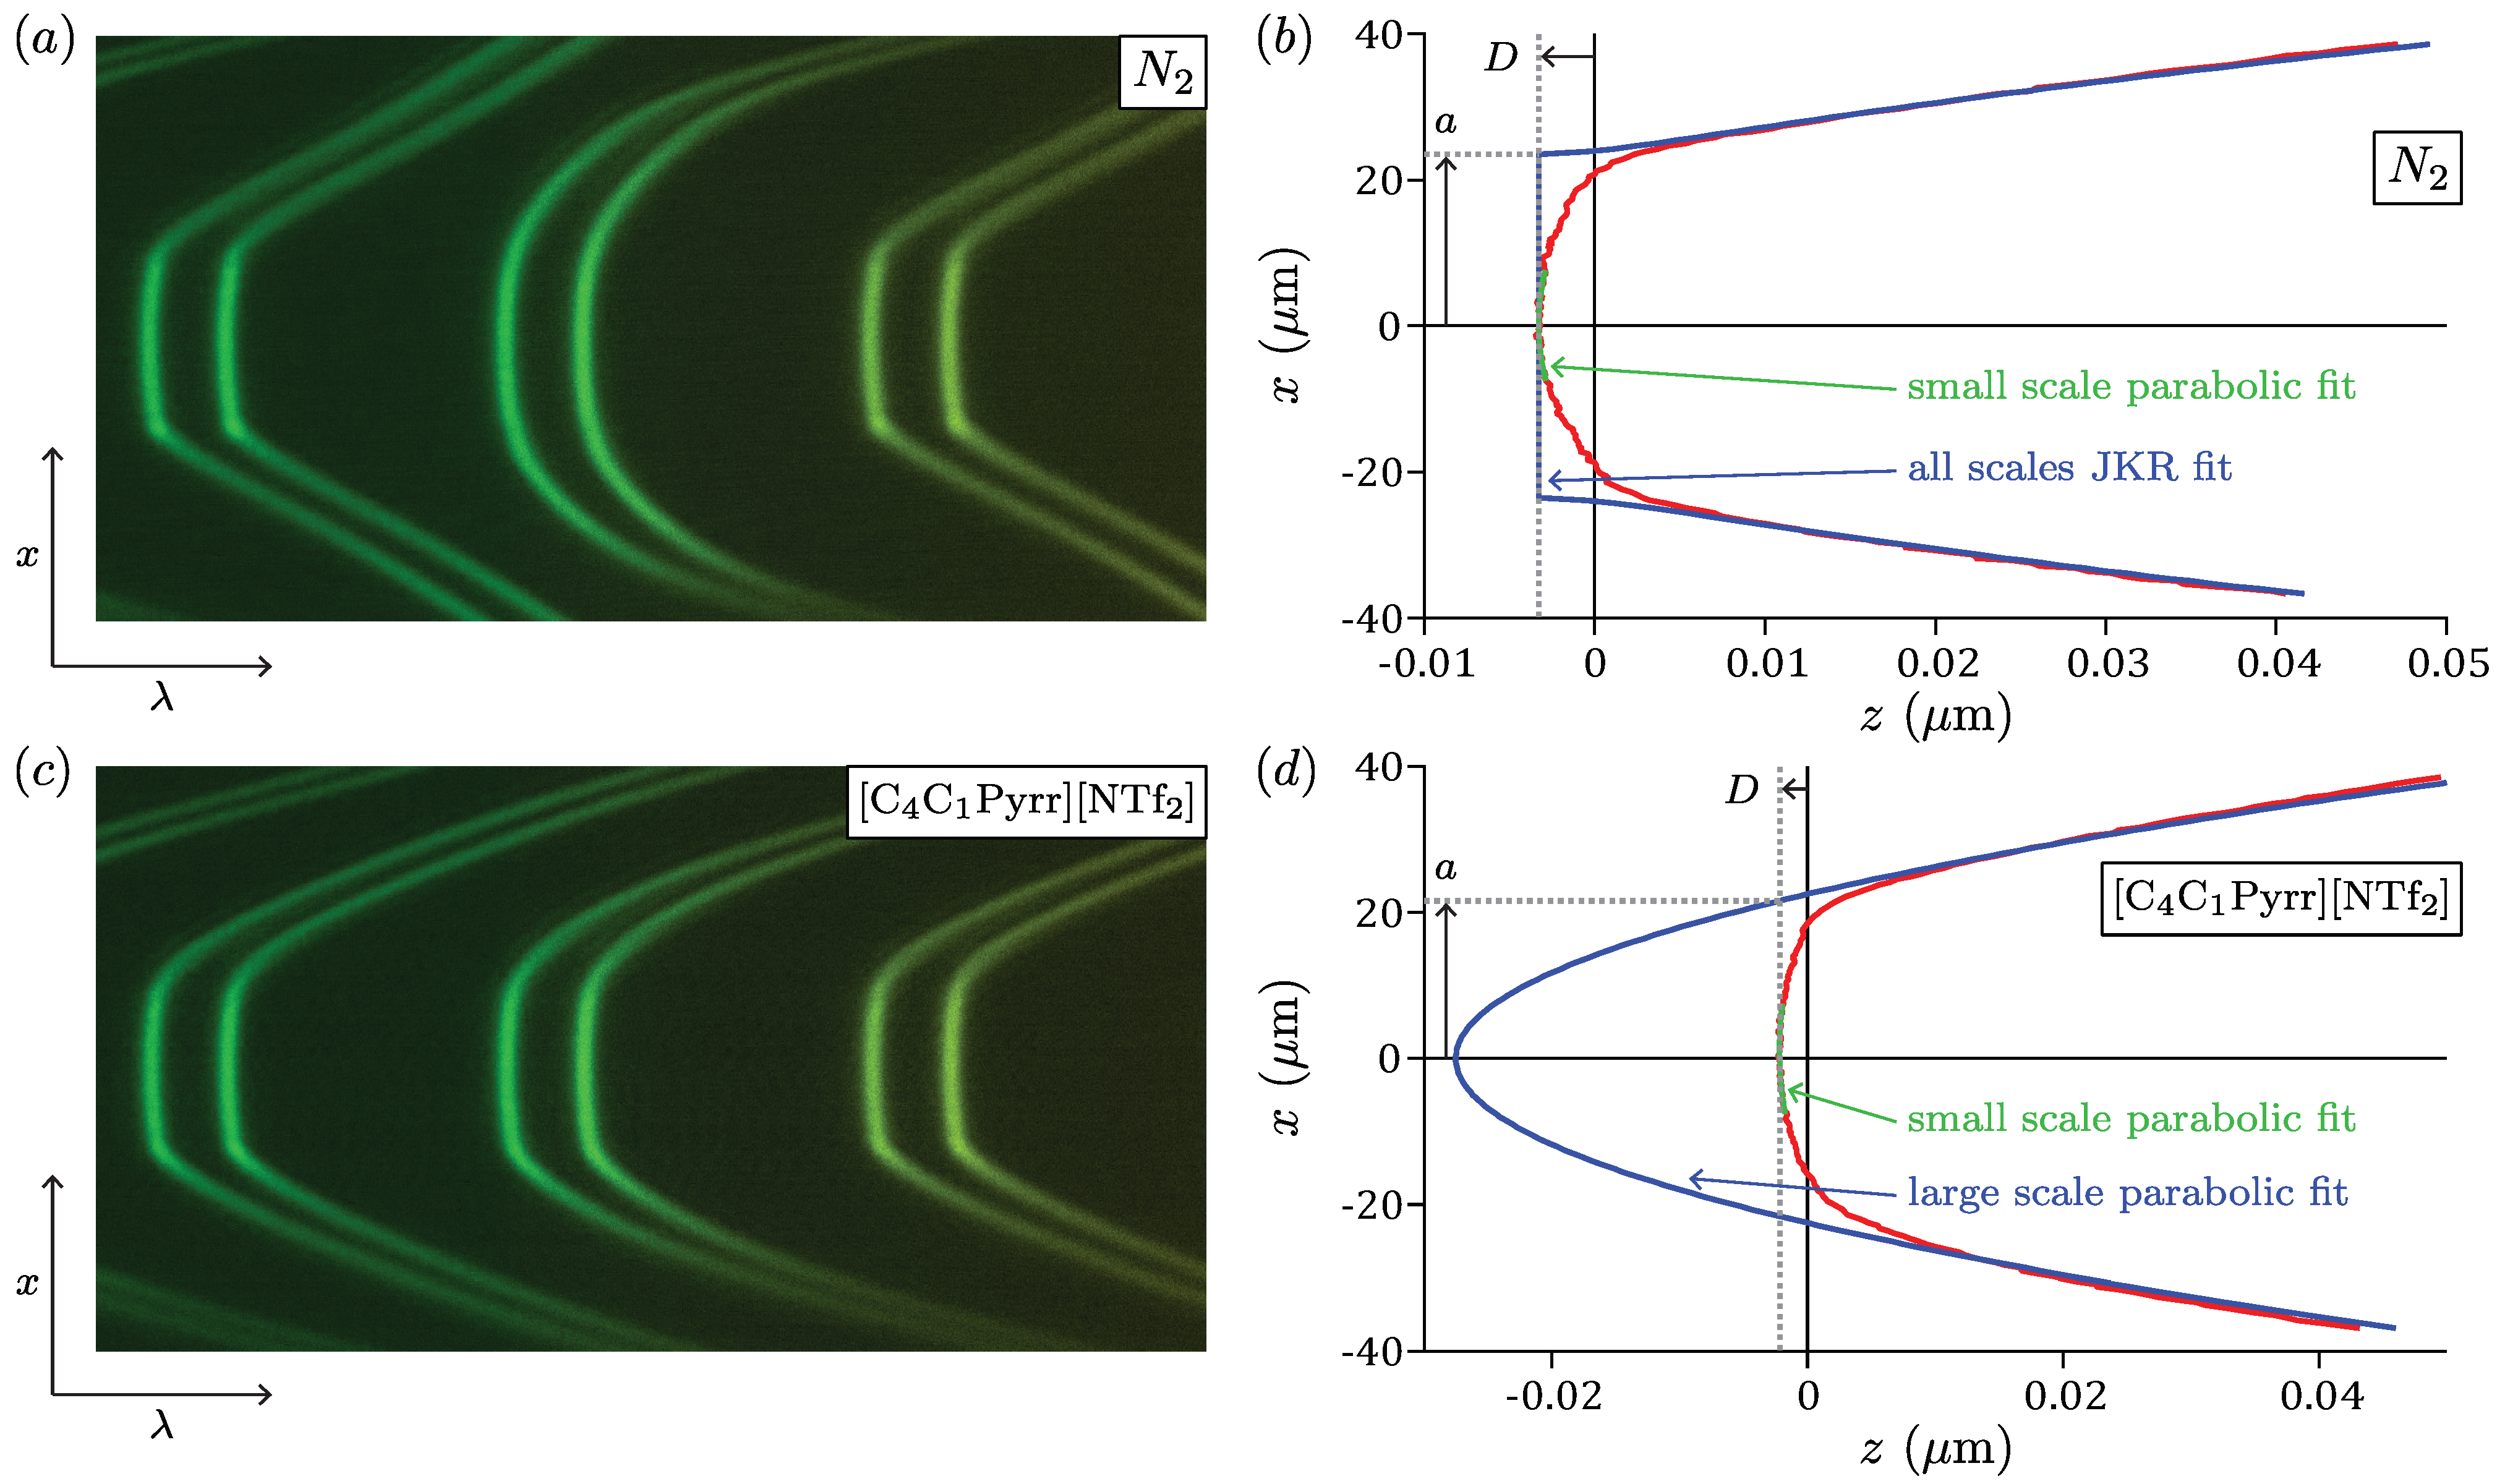
White light is passed through the confined medium, it interferes in this optical resonator, and is then directed towards a spectrometer and collected by a CCD camera (QImaging Retiga R6, resolution ). The analysis of the Fringes of Equal Chromatic Order (FECO, shown in Figure 2a,c) then allows one to calculate the profile of the distance between the surfaces (Figure 2b,d) [23]. We developed an automatic procedure in order to extract the apical distance D and the contact radius a from this profile. The procedure is described in detail in the supplementary materials, together with a brief presentation of the models of contact mechanics that will be used in the next section to analyze the data. Finally, the apical distance D is measured with a precision of given by the standard deviation of the signal and an accuracy of due to light disalignment when changing the contact spot [24]. The contact radius a is measured with a precision of given by the standard deviation of the signal, and an accuracy of due to the uncertainty regarding the value of the radius of curvature R.
The top surface can be moved normally with a stepper motor (large displacement range ∼10 , poor linearity, mechanical vibrations induced) or with a piezoelectric tube (small displacement range ∼1 , good linearity, no measurable mechanical vibrations induced). For a given run, the velocity v can be determined with a precision of ∼1%. From run to run, this velocity can typically vary by ∼10% for the same control parameters, due to thermal drifts. In the following, some graphs result from the superposition of several runs, which is why the indicated velocities have an error bar of ∼10%. The bottom lens is mounted on a spring of constant , which is calibrated before the experiment by measuring its deflection when adding different masses. The normal force F is then deduced from the temporal evolution of the distance when applying a constant velocity v to the top surface, using a procedure that takes into account the presence of the viscous force at large separations (detailed in [18]). In comparison to previous studies we performed, the normal spring used in the present measurements is about 20 times stiffer; this was chosen in order to a apply larger load (at fixed displacement range). Note that this choice of a stiff spring increases the explored ranges of load and deformation as well as the slope of the spring instability, which is convenient for the investigation of contact mechanics, but does not limit the generality of this study. This comes with a price in terms of sensitivity limit, ∼10, which does not allow one to detect the anomalously long-range electrostatic force that has been observed with concentrated electrolytes [25,26].
3. Results and Discussion
3.1. Calibrations in a Dry Atmosphere
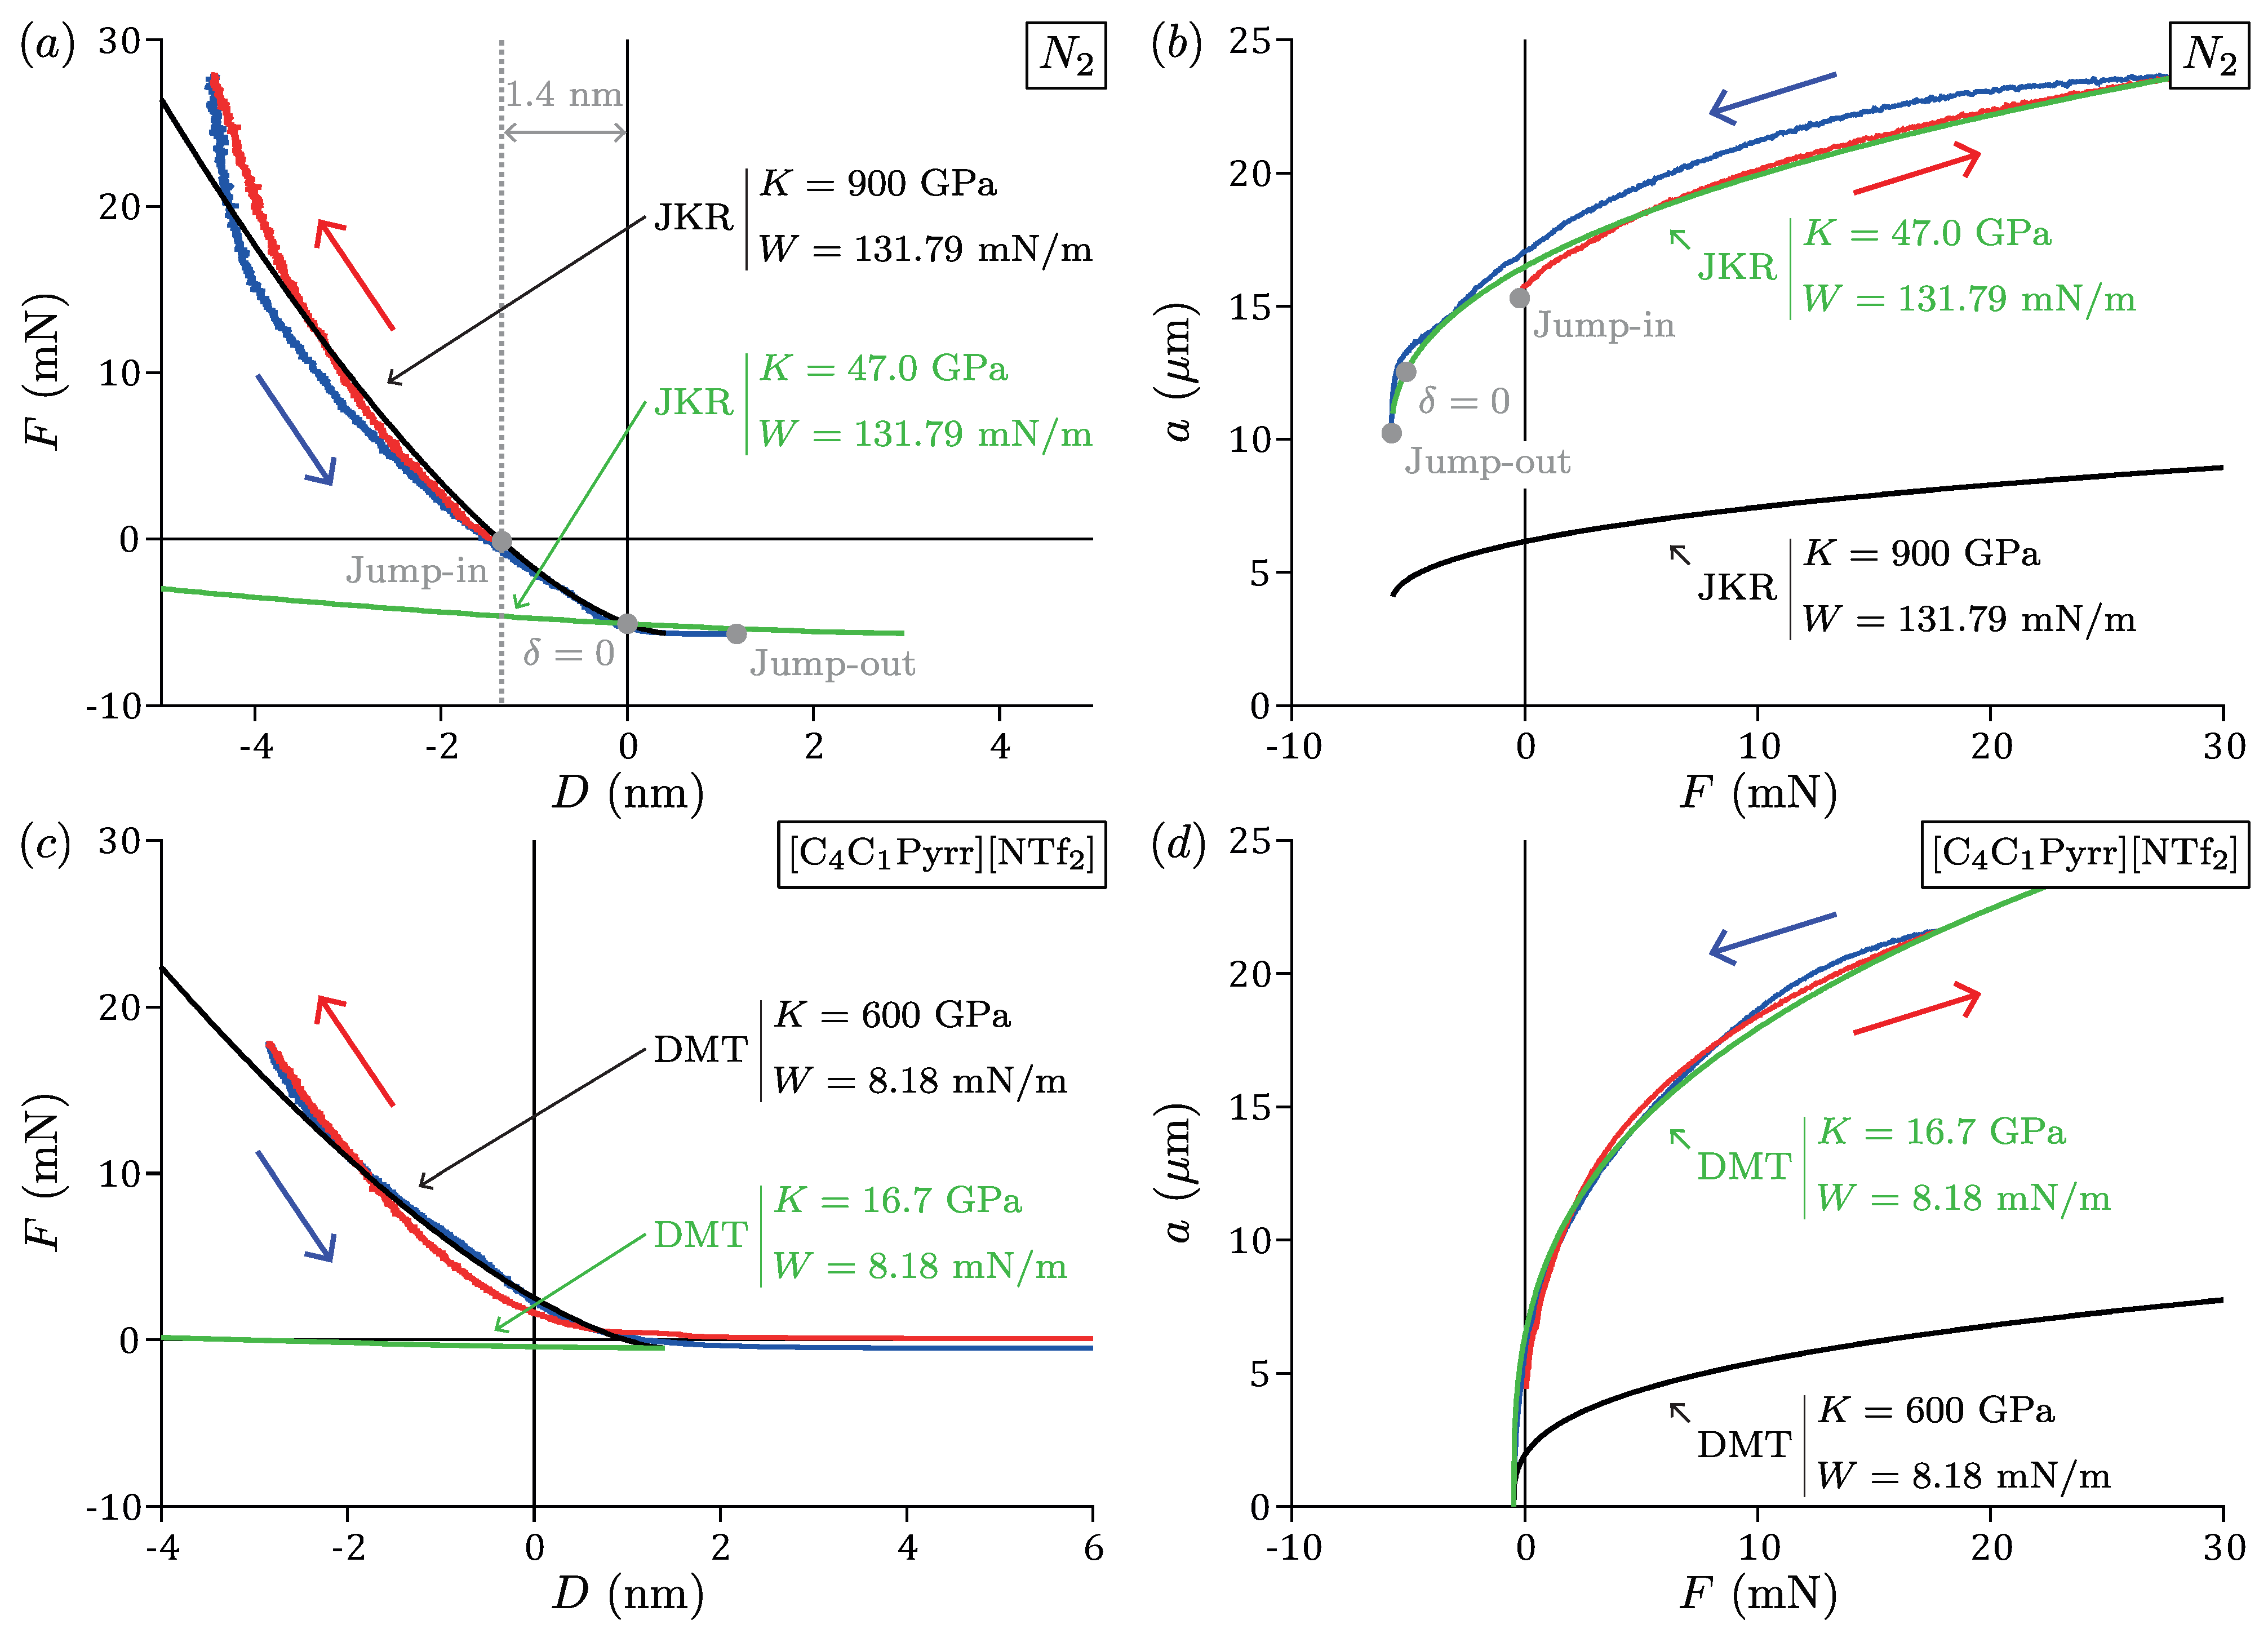
In Figure 3a,b are shown the force F, the distance D and the contact radius a measured when approaching (in red) then retracting (in blue) the top surface with the stepper motor at across N. Initially separated by N, the surfaces are brought closer until they experience a strong van der Waals attraction, which together with the spring instability causes a jump-in to mica–mica contact and a slightly negative force (); thereafter, the applied load is increased continuously and very large positive forces are reached. At some point (), the direction of the motion is reversed, the applied load is decreased continuously and large negative forces are reached until the spring instability at leads to a jump-out to large distances.
The variation of the contact radius a with the force F, plotted in Figure 3b, is totally consistent with the work of Horn, Israelachvili and Fribac [6]. Clearly, the jump-out happens at a non-zero value for the contact radius (), which is a typical feature of the JKR model (see the corresponding FECO image and separation profile in Figure S1a,b). The measured relationship is compared to the JKR prediction (Equation (4) of the Supplementary Materials) in the following manner. First, the force reached just before the jump-out is used to compute the adhesion energy . Then, a fitting procedure provides the elastic modulus . As the range of a van der Waals attractive force across a gas is 0.3 [6], a Maugis parameter 19 is obtained (using Equation (6) of the Supplementary Materials), confirming the suitability of the JKR model for this system [27]. The data are reasonably fitted by the model (see the curve in green), and the extracted W and K are consistent with the values reported in previous studies for similar systems [6,7]. As the solids used in this experiment are complex stacks of layers associated with different thicknesses, Young’s moduli and Poisson’s ratios (values from the literature given in Figure 1c), the value of K extracted from the fit should be interpreted as an effective quantity. Therefore, it is expected that this value is between the Young’s modulus of mica or glass and the Young’s modulus of the glue, and depends on the mica and glue thicknesses [6]. Note that the curves measured on approach and retraction are not superimposed, a phenomenon known as the adhesion hysteresis and due to non-elastic processes at play. For this system, it is generally assumed that adhesion hysteresis is mainly caused by viscoelasticity and plasticity in the glue layer [6,7].
The variation of the force F with the distance D is plotted in Figure 3a. We observe a clear change in D when the surfaces are in contact, of ∼5 between the points of maximum load and of jump-out, or ∼2 between jump-in and jump-out. Potentially, imperfections of the double cantilever spring may induce a tiny rotation of the solids when varying the load, leading to a progressive dealignment of the light and so to a shift of the fringe positions and of the extracted distance. However, we ruled out this possible artefact by checking the tuning of the optics at regular intervals during the loading–unloading cycle. Note that the curves measured on approach and retraction are not perfectly superimposed, mainly due to mechanical imperfections of the set-up, i.e., non-linearity of the stepper motor and long-term thermal drifts, leading to errors in the determination of the force. In addition, we have made sure that this phenomenon is not due to a potential contamination of a particular experiment, by systematically observing that mica undergoes a significant indentation in many separate experiments with different mica sheets. As the mica is the single material separating the two silver mirrors, such a variation can only be explained by a compression of the two mica layers in contact. In early SFA/SFB studies, FECO were observed directly by eye or recorded with analogical photography, which is why very thin mica layers were used (typically of thickness) to maximize the resolution of the measurement, and it was estimated that the mica experiences only negligible compression, of order ∼0.1 [6,28,29]. However, in recent years, as high resolution CCD cameras have been used in combination with fast spectral correlations and multilayer matrix methods to analyze the FECO [30], there has been a tendency towards working with thicker mica. One expects, in this case, a significant compression of mica, which indeed has been repeatedly mentioned in studies using a so-called extended surface force apparatus [31,32,33,34,35,36,37], but has not been studied specifically.
Such compression of the mica spacer layers raises a technical difficulty for analyzing the FECO. Like what is usually carried out, we have supposed that the interferometer is composed of two mica layers of the same constant thickness separating a vacuum layer of thickness D (with known and constant refractive indexes), which is clearly wrong here when the surfaces are in contact. To be more rigorous, we have also re-analyzed the FECO when the surfaces are in contact, now supposing that the interferometer is composed of a single mica layer of variable thickness ( is defined as positive for compression and negative for dilatation). It turns out that the two methods provide the same amplitude of compression; qualitatively, this is because in both cases we are looking at a small wavelength variation around a given reference point, which is not sensitive to the refractive index considered. Consequently, the variations of the distance D observed here have to be interpreted as changes in N thickness when the surfaces are out of contact, and changes in mica thickness when the surfaces are in contact.
In these conditions, an important question is related to how can we define the mechanical origin, i.e., the point at which . A sensible choice is to select the point where the indentation of the surfaces is zero, i.e., . Following the JKR model, is positive at the maximum load (compression) and negative at the jump-out (dilatation). The point of zero indentation is located in between and does not correspond to the point of zero force, i.e., . Considering that the measured relationship is reasonably fitted by the JKR model, we have taken the point from the fit as the mechanical zero for the measured D (as indicated in Figure 3a,b), corresponding to a mica thickness . Such a definition of mechanical origin then leads to a distance D that can be negative when the mica layers are compressed. This calibration procedure is significantly different from what is carried out usually. In general, the force profile in a dry atmosphere is not measured, but the surfaces are slowly approached until they jump-in to contact and it is at this point that the “mica thickness” is calibrated. In our experiment, the surfaces are already compressed by just after the jump-in. The usual procedure therefore leads to an underestimation of the mica thickness by ∼1 for this ∼7 -thick mica, and an equivalent outward shift of the force profile measured after injecting the liquid (adhesion is generally much smaller across a liquid than dry atmosphere). If the mica is thinner or if the spring is stiffer, the shift is expected to decrease and there is less ambiguity regarding the definition of mechanical origin [28]. However, in the general case, this effect is present, and taking it into account is particularly important when investigating aspects at the molecular scale. In the following, we present three examples of situations where this may matter.
- Since the conception of the SFA, negative distances from to have been reported when two mica surfaces separated by water jump-in to contact [11,28,38,39,40,41,42]. This is due to the washing of gas molecules and organic contaminants (carbon compounds) that are spontaneously deposited on the mica surfaces in air [43] and to the dissolution in water of the potassium ions initially present on the mica surfaces. As adhesion is typically 10 times smaller in water than in a dry atmosphere, the mica is expected to be less compressed after the jump-in across water than during the calibration after the jump-in across a dry atmosphere. As compression of mica was not considered in these studies, the thickness of the contaminant layer may be underestimated, albeit not by more than a few angstroms given the much thinner mica used. Nevertheless, the dependence of this effect on the mica thickness and spring constant may explain—at least in part—the strong variability in the reported values.
- In the case of molecular liquid giving rise to a structural force profile under confinement, a good accuracy on the distance D is needed in order to identify the absolute number of ordered layers composing the film (as illustrated in the subsection titled “Influence of surface deformations on structural force profile”).
- Dynamic measurements can be performed with the SFA to determine the slip length associated with a flow of liquid in vicinity of a solid surface. By definition, the slip length is the distance between the hydrodynamic origin and the mechanical origin. Being able to measure nanometric slip lengths therefore requires having a subnanometric resolution on the mechanical zero [18,44,45,46,47,48].
Finally, one can ask whether the JKR model can also describe the relationship. If we use Equation (4) of the supplementary materials and a reference (i.e., the origin corresponds to ), with the values and coming from the fit of the relationship, the model does not fit at all and predicts an indentation that varies much more than in the experiment (by ∼40 instead of ∼5 in the explored range of force, see green curve in Figure 3a). Qualitatively, this is because the effective parameters coming from the fit of the relationship correspond to the indentation of the whole mica/glue/glass system, while here we measure the indentation of the mica only. If we approximate the different layers composing the solids as springs in series, we expect that the ratio of the indentation of mica relative to the indentation of glue is of the order of the ratio of the Young’s modulus of mica relative to the Young’s modulus of glue, i.e., , which is indeed of the same order of magnitude than the measured ratio of . If we now relax the parameter K to fit the relationship (black curve in Figure 3a), it does not fit the relationship (for the same reason given just before, see black curve in Figure 3b) and it provides a value , one order of magnitude larger than the elastic modulus of mica. This is because we probe a contact zone of size , while the validity of the JKR model would require to consider the mica as a semi-infinite solid. Qualitatively, the finite size of the mica layers cuts off the range of the elastic deformations, leading to an apparent stiffening of the solids compared to their bulk counterparts. Some analytical formulations exist for the opposite case of an infinitely thin elastic layer between two rigid solids [49,50] (applicable for ), but not for the intermediate case present here ().
To summarize, the JKR model reasonably fits the variation of the contact radius with the force—considering the whole mica/glue/glass system as an effective homogeneous material—but completely fails to describe the variation of the force with the distance -because only the indentation of the mica is measured, which forms a layer that cannot be considered as semi-infinite. In order to simultaneously fit the and relationships with a coherent set of parameters, complex models that explicitly include the description of all the layers are needed. So far, only a few remarkable approaches have attempted to quantitatively fit the relationship with such a description, using approximated analytical formulations [29] or finite element methods [7,51]. In particular, they described how the effective elastic modulus K depends on the properties of the different layers and showed that these multi-layer aspects have to be taken into account to obtain a correct value of adhesion energy W from the jump-out force [52]. Similar approaches could be followed in the future to quantitatively fit the relationship while taking into account the compression of mica, which was neglected.
3.2. Contact Mechanics Across an Ionic Liquid
In Figure 3c,d are shown the force F, the distance D and the contact radius a measured when approaching (in red) then retracting (in blue) the top surface with the stepper motor at across [CCPyrr][NTf]. When the ionic liquid is confined at the nanoscale, a structural force profile is observed due to the organization of the ions in ordered layers. Initially far away, the surfaces are brought closer until they experience a repulsive wall at 1.5 (hereafter reported as layer ) for a load of up to , then a layer is squeezed out and the surfaces jumped in to another repulsive wall at ∼0.5 (hereafter reported as layer ); thereafter, the applied load is increased continuously and very large positive forces are reached. At some point (), the direction of the motion is reversed, the applied load is decreased continuously and small negative forces are reached until the spring instability at leads to a jump-out to large distances. In this subsection, we focus on the contact mechanics of the system when the liquid is composed of a single layer of ions (layer ). The influence of the mechanical deformations on the structural force profile will be detailed in the next subsection.
The variation of the contact radius a with the force F is plotted in Figure 3d. In contrast with the measurements across N, the jump-out clearly happened at a zero value for the contact radius ( within the systematic experimental error), which is a typical feature of the DMT model (see the corresponding FECO image and separation profile in Figure S1c,d). The measured relationship is compared to the DMT prediction (Equation (3) of the Supplementary Materials) in the following manner. First, the force reached just before the jump-out is used to compute the adhesion energy . Then, a fitting procedure provided the elastic modulus . The data are reasonably fitted by the model (see the curve in green) and the extracted K is of the same order than the value previously obtained from the analysis of the variation of the contact radius with the force in N. The effective elastic modulus changed by a factor of 3 after injecting the liquid, which can be attributed to a different glue thickness, as it cannot be ensured that the spots used on the surfaces are strictly the same. Our findings contrast with the widespread consideration that SFA measurements are always performed in the JKR regime, which is based on the calculation of the Maugis parameter from Equation (6) of the Supplementary Materials [17]. The difficulty of such an approach is that strongly depends on the range d of the attractive forces, which can be delicate to estimate. For this measurement, we have to assume for the range of the attractive force across the ionic liquid (plausible value, given the range of the structural force profile detailed in the next subsection), to obtain a Maugis parameter that corresponds to the DMT regime. On the contrary, looking at the value of the contact radius just before the jump-out is an extremely sensitive method, which does not rely on any estimation of microscopic parameters. For our experiment with the ionic liquid, the JKR model predicts that the surfaces would separate at (for and ), while we clearly observe that the jump-out happened at a contact radius that is below the systematic experimental error of . This unambiguously shows that we are in the present case not in the JKR regime but in the DMT regime.
Two situations have been addressed in the seminal paper of Horn, Israelachvili and Fribac [6]: the case of strong adhesion () over a range of a fraction of nanometers—obtained with a dry atmosphere—which was well fitted by the JKR model, and the case of negligible adhesion ()—obtained with an aqueous electrolyte—which was well fitted by the Hertz model [3]. For our intermediate situation of moderate adhesion (10 ) over a range of a few nanometers, obtained with an ionic liquid, we have shown that the variation of the contact radius with the force is well fitted by the DMT model. This finding is of general interest, as such a situation of moderate adhesion over a range of a few nanometers is not specific to ionic liquids only, but is frequently encountered in SFA experiments (for example, with apolar liquids, salt solutions, polymer melts or liquid crystals), and the use of a correct model of contact mechanics is necessary to interpret force measurements, in particular for the two situations listed below.
- The jump-out force obtained with force measurement techniques is routinely used to deduce the surface energy W. As the relationship between these two quantities depends on the model ( in the JKR model, in the DMT model), it is crucial to know the regime of contact in order to extract reliable values [53].
- When investigating friction in the boundary lubrication regime with smooth adhering surfaces, the applied load is generally large enough to flatten the sliding surfaces. These mechanical deformations have to be known in order to interpret the data, in particular to determine whether the friction is controlled by the area of contact or by the load, and to unravel the role of adhesion [10,39,53,54,55,56,57,58,59,60,61].
The variation of the force F with the distance D is plotted in Figure 3c. When the surfaces are separated by a single layer of ions (layer ), we clearly observe that D can be negative—a possibility that was mentioned in recent studies [35,36,37]—and changes by ∼4 between the points of maximum load and of jump-out. This is due to the compressibilities of the mica layers and of the liquid film, i.e., the materials separating the two silver mirrors. As explained in the previous subsection, for such small changes in D it is not possible to disentangle the contributions coming from the two mica spacers (indentation , defined as positive for compression and negative for dilatation) and the liquid film (thickness ) with the FECO. In fact, we effectively measure the distance between the silver mirrors , from which we subtract the undeformed mica thickness calibrated in a dry atmosphere, to finally obtain:
Similarly to the calibrations in a dry atmosphere, one can ask whether the DMT model can also fit the relationship, supposing that most of the changes in D come from the indentation of the mica (taking a reference ). If we use Equation (3) of the supplementary materials with the values and coming from the fit of the relationship, the model does not fit at all and predicts an indentation that varies much more than in the experiment (by ∼50 instead of ∼4 in the explored range of force—see green curve in Figure 3c). If we now relax the parameter K to fit the relationship (black curve in Figure 3c), it does not fit the relationship (black curve in Figure 3d) and it provides a value of , one order of magnitude larger than the elastic modulus of mica. Again, this is because we measure only the contribution of the mica to the total indentation of the solids, and the mica layers cannot be considered as semi-infinite at such large loads where we probe a contact zone of size .
3.3. Influence of Surface Deformations on Structural Force Profile
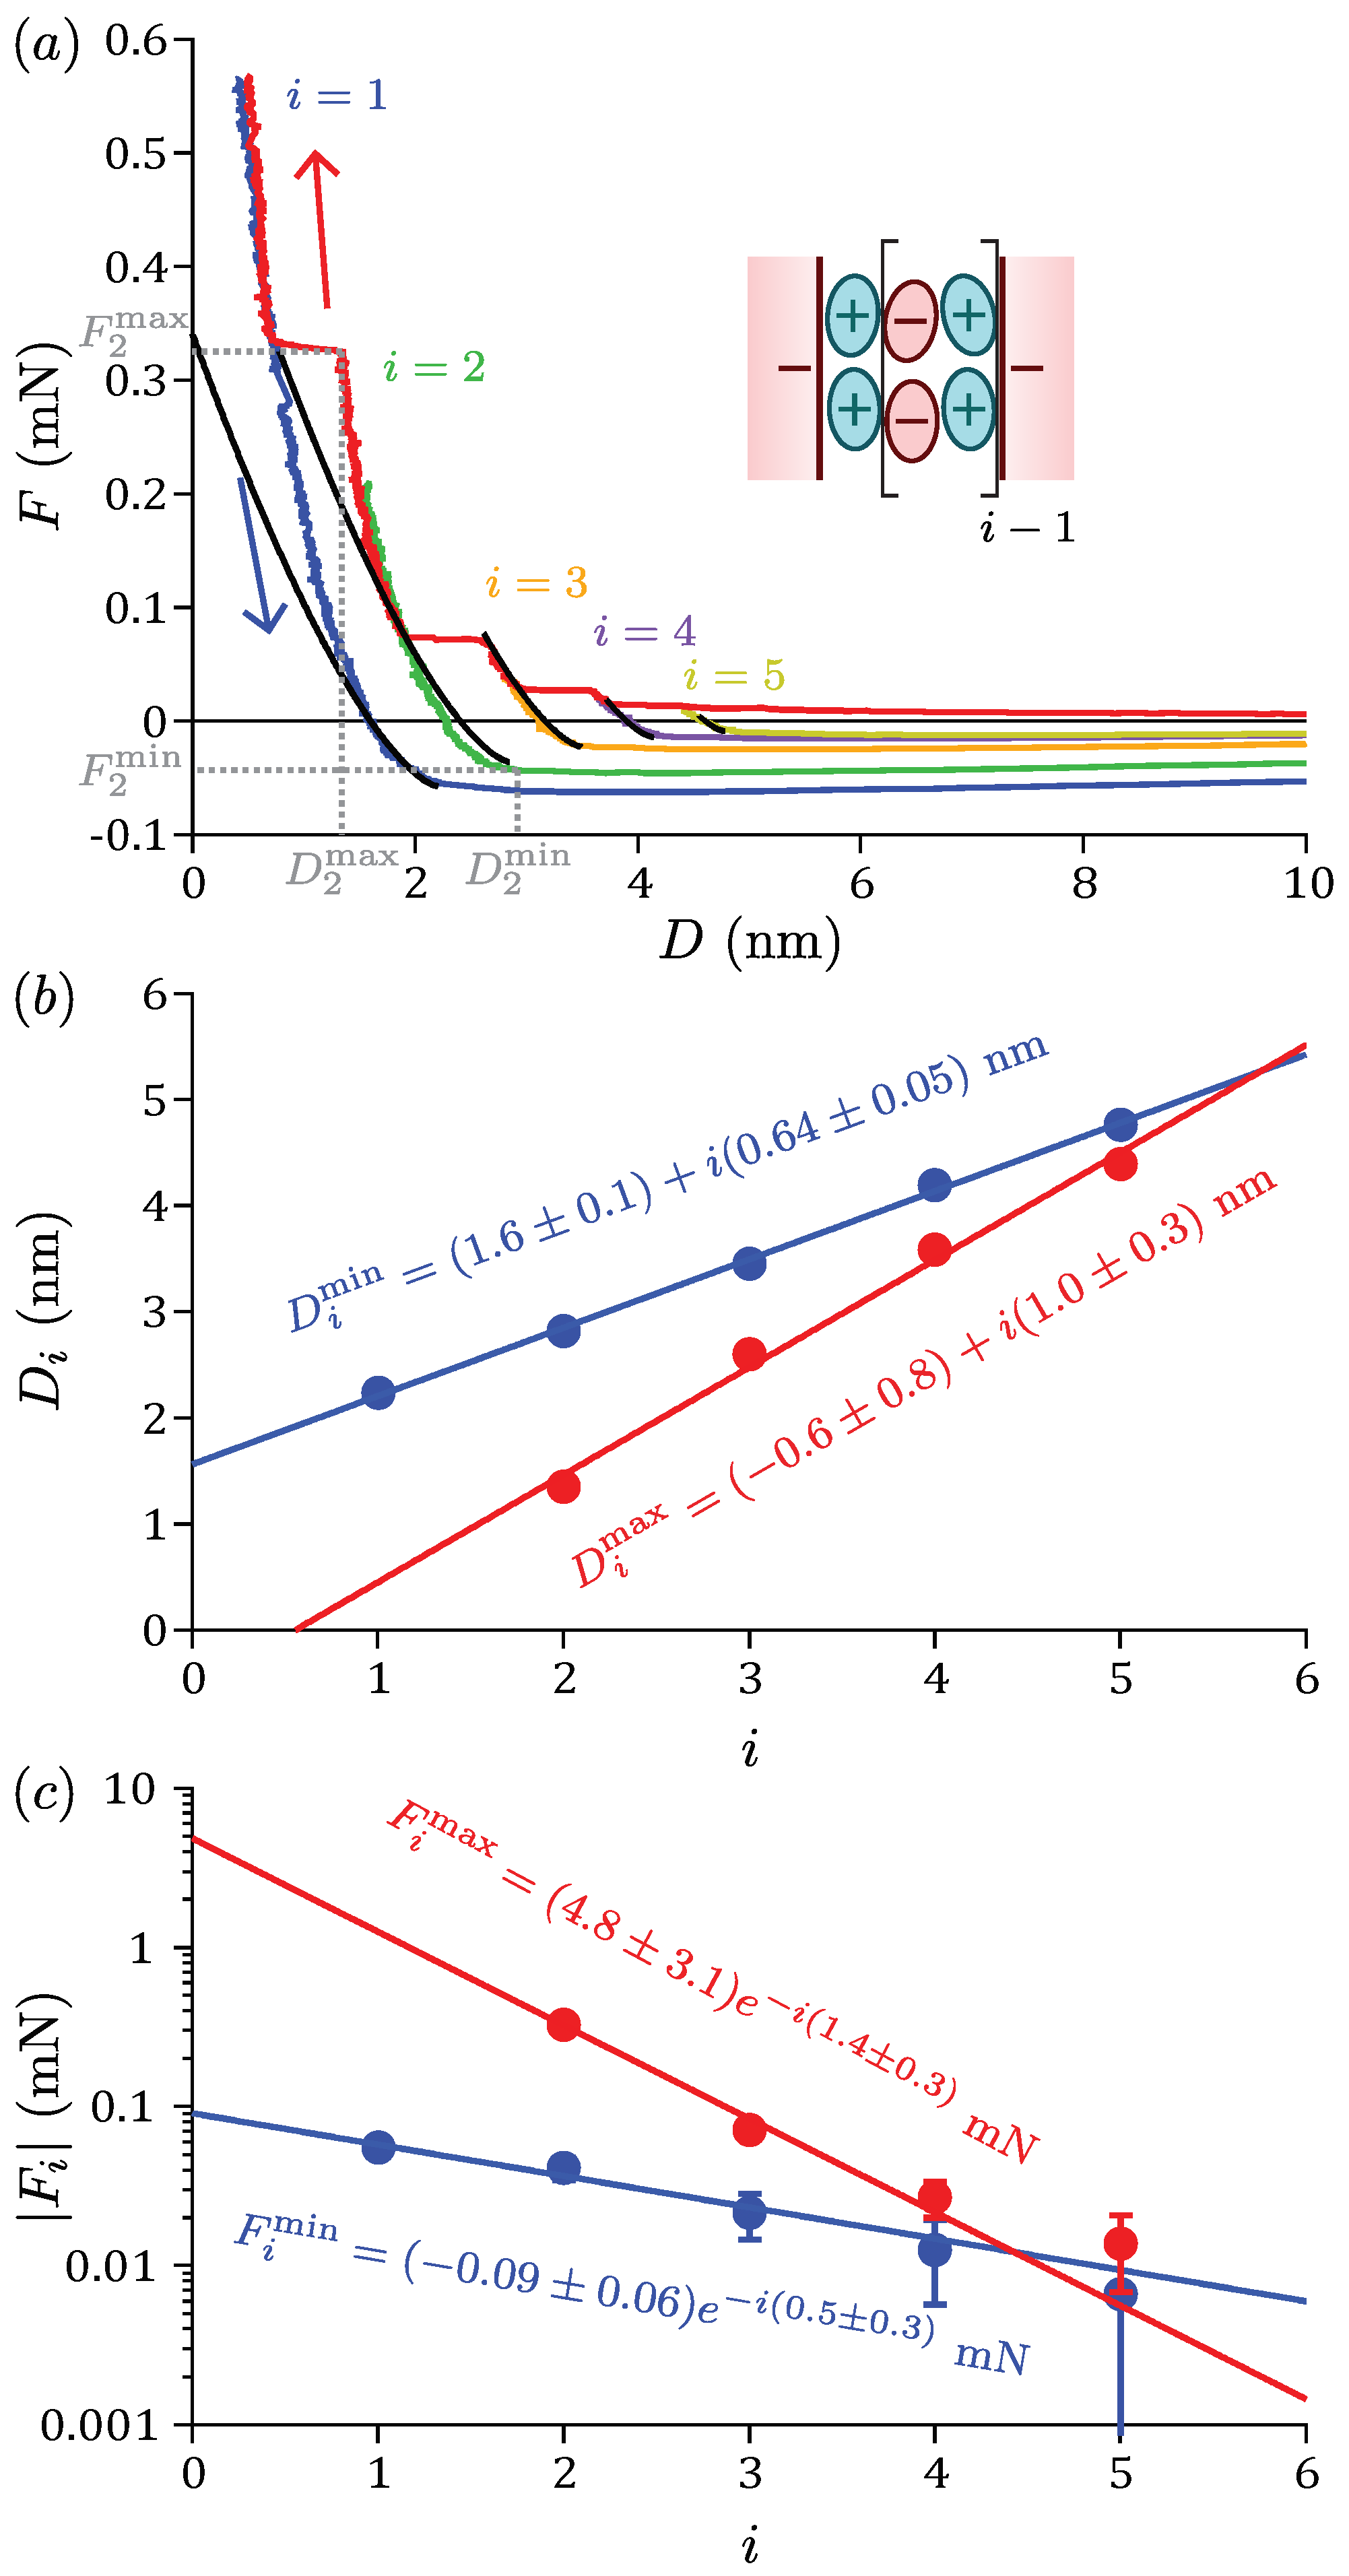
In this subsection, we now focus on the detailed shape of the structural force profile. Due to the spring instability, the surfaces experience a jump-in on approach every time a layer is squeezed out, an a jump-out on retraction from a given layer. Therefore, several runs are necessary for the most comprehensive exploration of the force profile. Figure S2 shows the force profiles measured when approaching the top surface up to a given layer and retracting from this layer with the piezoelectric tube at . Five layers can be distinguished and are labeled by i. From run to run, the whole force profile randomly shifts by a fraction of a nanometer, while the jump-in distances and the forces are reproducible. We consider that these shifts are non-physical, but result from imperfections of the set-up, such as fluctuations of the contact spots on the surfaces that lead to slight dealignment of the light from run to run. Therefore, in the present work, we have manually shifted the force profiles such that all the approaches are fitted to the approach up to layer (in red). In Figure 4a is shown the resulting force profile with only the approach up to layer (in red) and the retractions from the different layers for clarity ( in blue, in green, in orange, in purple, in yellow). Such structural force profile has been observed many times with ionic liquids and is attributed to the ordering of ions in the film, with a structure consisting of alternating layers of anions and cations (as sketched in the inset) [62,63,64,65,66,67,68,69,70]. For a given layer i, the distance D is not constant. In general, this is interpreted as a result of the change in the local liquid density for infinitely stiff surfaces, and the structural force profile is fitted with a semi-empirical exponentially decaying harmonic function of the form:
where the four fitting parameters are the period of the oscillations , the decay length , and the position and amplitude of the first layer. To characterize the structural force profile, we have measured, for each layer i, the distances , and the forces , at the points of the maximum and minimum forces (i.e., just before the jump-in and jump-out, respectively, as indicated in Figure 4a for ).
Figure 4b shows the variations of the distances , with the layer index i. The two curves exhibit a good linearity and are fitted with the relations:
where the slopes , represent the mean layer thickness and the intersects , correspond to the position of the extrapolated layer (fitted values indicated in the figure). The mean layer thickness obtained from the maxima is significantly larger than the mean layer thickness obtained from the minima . This observation can be interpreted as a consequence of the mica compression. According to the DMT model for a given layer, the indentation of the solids is zero at the minimum force (jump-out point) and continuously increases up to the maximum force (jump-in point). When going from layer to , the range of force explored decreases (due to repulsive maxima and adhesive minima that come closer to ), as well as the amplitude of mica compression. The variation of with i thus includes a systematic decrease in the mica compression, leading to an overestimation of the mean layer thickness. On the contrary, the variation of with i does not include any influence of the mica compression, and provides the true mean layer thickness . Another method to determine the mean layer thickness consists in measuring the average jump-in distance, supposing an unchanged mica compression and a fast viscous relaxation during the squeeze-out events. This provides a consistent value of , confirming our interpretation of the effect of the mica compression on the mean layer thickness. Interestingly, this value is smaller than the mean ion pair diameter of (given by with M being the molar mass of the ionic liquid, its bulk density and the Avogadro number [62]), perhaps suggesting a denser packing of ions in confinement than in the bulk. However, our value is also smaller than the previous measurements performed with the same ionic liquid, reporting a mean layer thickness of between two mica surfaces with an SFB [71] and between a mica surface and a SiN tip with an AFM [72]. A possible explanation for this difference is the inherent contribution from viscosity to the force profile, in particular, in the vicinity of the jump-in and jump-out instability. For the method using the positions of the minima, viscosity tends to move the point of minimum force towards larger distances, even more so if adhesion is larger; for the method using the jump-in distances, viscosity tends to reduce the jump-in distances. In both cases, viscous effects possibly lead to an underestimation of the mean layer thickness. Previous studies may be less affected by viscosity, as retractions were performed by slow steps in the SFB study [71] (with similar radii of curvature), and the radius of curvature was six orders of magnitude smaller in the AFM study [72] (with a velocity less than an order of magnitude larger).
Figure 4c shows the variations of the forces , with the layer index i. In this log-lin representation, the two curves exhibit a good linearity and are exponentially fitted with the relations:
where the slopes give access to the ratios , of the period of the oscillation on the decay length, and the intersects correspond to the amplitudes , of the extrapolated layer (fitted values indicated in the figure). The curves obtained with the maxima and the minima are clearly distinct, as a consequence of the asymmetry of the envelope of the force profile with the horizontal axis. Such asymmetry cannot be due to the van der Waals contribution which is always attractive for symmetric systems. It cannot be explained by the anomalously long-range electrostatic force that has been observed with concentrated electrolytes [25,26], because exponentially fitting the mean amplitude gives a decay of ∼1 and an amplitude of ∼, respectively, one order of magnitude smaller and two orders of magnitude larger than for long-range electrostatic force reported for this system [18,26]. In fact, the exponentially decaying harmonic oscillation given by Equation (2) can be predicted theoretically in the asymptotic limit of large distances (far-field term), and an additional (non-oscillating) exponentially decay has been proposed as a correction at small distances (short-field term, with two additional fitting parameters) [68,73,74]. This second term, which is intrinsic to the liquid for infinitely stiff surfaces, could contribute to the asymmetry of the measured force profile. The significant deformations of the surfaces could also contribute to the asymmetry, in the following manner. According to the DMT model for a given layer, the surfaces are not deformed at the minimum force (jump-out point), and flattened at the maximum force (jump-in point). Compared to a situation without deformation of the solid surfaces, the squeezing out of the liquid layer intuitively requires a larger force, leading to a maximum that is larger than the minimum in absolute value. When going from layer to , the range of forces explored decreases, as well as the amplitude of flattening, and the points of maximum and minimum forces are more and more symmetric around the horizontal axis.
An important aspect to interpret structural force profiles is to identify the composition of the layers. As the period is similar to the mean ion pair diameter, it is usually considered that one squeeze-out event corresponds to the squeezing out of an electroneutral “slab” of one cation layer and one anion layer. In the case of negatively charged surfaces, the first layer () is then assumed to be composed of a monolayer of cations (as sketched in inset of Figure 4a). Direct solid–solid contact is never reached, due to the strong electrostatic attraction between the cations and the negatively charged surfaces. For our experiment, one can ask whether we really reached this single layer of cations within the explored range of loads. The position of the first layer at the point of minimum force (including no indentation of the surfaces) is , a bit larger than the cation sizes (given in Figure 1a). However, the measurement of the absolute distance D depends on many delicate steps (alignment of the optics, calibration of the mica thickness in a dry atmosphere, choice of a particular run to shift the force profiles laterally), and deducing the thickness of the monolayer from the cation sizes requires knowing their conformations, making accurate comparisons difficult. If we extrapolate the exponential fit of to the layer (see Figure 4c), it predicts that the next squeeze-out event would take place at a force , while we did not observe any additional jump-in for a force up to (see Figure 3c). Thus, we think that the layer seen at the maximum load is indeed composed of a single layer of cations, and we identify it as .
In the SFA literature, the structural force profile is usually fitted with an exponentially decaying harmonic oscillation (Equation (2), with four fitting parameters), supposing that there are no surface deformations. In general, such a description seems reasonable because the eye measurements produce more scattered points and/or the retraction branches are not explored. However, in a few studies, it has been pointed out that the oscillation is not rigorously sinusoidal, notably in the first paper reporting a structural force for a simple liquid [75], and even more clearly in a recent study with an extended surface force apparatus [35]. In Figure S3, we have plotted two exponentially decaying harmonic oscillation (Equation (2)), the one in gray corresponding to the parameters , , and and the one in black corresponding to the parameters , , and . None of these curves fit the measured force profile, and adding an exponential, short-field, term would not improve the situation. Indeed, for an exponentially decaying harmonic oscillation, the stable branches are half convex and half concave, each minimum is located almost at the middle position between the surrounding maxima, and one value of D corresponds to a single value of F. In the experiment, the stable branches are always convex, the minima and maxima are not regularly spaced, and one value of D can correspond to several values of F (we can have ). So, it is clear that an exponentially decaying harmonic function is not appropriate to describe the detailed shape of the measured structural force profile. We propose a heuristic description, assuming on the contrary that the mica compression dominates the liquid compression, i.e., that the change in D within each layer comes only from the indentation of mica (elastic modulus K). For each layer, we suppose that the mica indentation is given by the DMT model (Equation (3) of the Supplementary Materials) with a reference and an adhesion , up to a maximum force . Finally, we obtain the following expression:
Basically, the liquid controls the positions (distance at the point of minimum force) and the strengths (forces at the points of the minimum and maximum distances) of the layers, while the mica controls the shape of the profile within the layers. Excluding the radius of curvature R, which is measured independently, the force profile is described by seven fitting parameters, which is the exact number of parameters required to describe an asymmetric structural force profile with deformable surfaces characterized by a single elastic modulus. To compare with our measurements, we have used the values , coming from the linear fit of , the values , coming from the exponential fit of , the values , coming from the exponential fit of , and we have fitted the single remaining parameter K. The fit shown in Figure 4a is very good at low loads, with being remarkably close to the elastic modulus of bulk mica (value given in Figure 1c). This is because a contact zone of size is probed when the force is close enough to the adhesion minimum, i.e., . The elastic deformations affect only the top mica layers, which can be considered as semi-infinite in these conditions [7,51]. At larger loads, the system enters in the regime described in the two previous subsections: the finite size of the mica layers cuts off the range of the elastic deformations, leading to an apparent stiffening of the solids compared to their bulk counterparts. To summarize, in contrast with previous considerations that neglected mica compression [17], we find for our system that the surface deformations have a strong influence on the force profile even at low loads. In particular, we expect this effect to be more important and independent of the mica thickness at low loads and smaller and reduced for thinner mica at large loads.
For our specific ionic liquid/mica system measured with SFB, we have shown that the detailed shape of the structural force profile is strongly affected by the mechanical deformations of the surfaces, with a mica compression that is dominant compared to the ionic liquid compression. A convolution of the surface forces across the liquid and the mechanical response of the confining solids may be present for other solid/liquid systems and force measurement techniques. In a typical AFM experiment (see, for example, [68]), the deflection of a cantilever is measured as a function of the approach position z imposed on the base of this cantilever. The force is deduced by multiplying the deflection by the calibrated spring constant, and the distance between the tip and the substrate is calculated as the difference between the cantilever deflection and the linear fit of the relationship when the surfaces are in contact. In fact, this standard procedure supposes ideal surfaces that are infinitely stiff in the fitting region. In practice, real solids are compliant, and this method leads to subtracting the indentation of the surfaces, linearized in the fitting region. As the relationship between the force and the indentation is generally not linear, the calculated distance is not exactly equal to the distance between the tip and the substrate. In addition, the amplitude of the force depends on the geometry of the surfaces and is therefore affected by their deformation. For these two reasons, the mechanical deformations of the confining surfaces are expected to influence the measured force profile also in the case of AFM. Irrespective of the particular system or technique used, it is very important to know the degree of convolution, i.e., whether the solid compression is negligible or dominant compared to the liquid compression, in order to interpret properly the structural force profile regarding the compressibility of the liquid layers [33,70,75,76,77,78,79]. Indeed, this question of the “elasticity” of a thin liquid film is connected to a strong debate in the community, to understand how a liquid can exhibit a solid-like behaviour in nanoconfinement [8,80,81,82,83]. Our study suggests that the finite slope of the structural force profile in each layer is not necessarily due to a change in load of packing fraction or structure of the molecules in the structured film, but can be attributed, in some cases, and at least in part, to the indentation of the confining solids. For these reasons, we propose a general criterion to distinguish the two opposite regimes of convolution for a generic system exhibiting a structural force profile. We consider the mechanical response of a liquid confined between infinitely stiff solid surfaces (taken as an exponentially decaying harmonic oscillation ), the mechanical response of two deformable solid surfaces in direct contact (assumed to be a simple Hertz force ), and the two responses being measured with an external spring (imposing a restoring spring force ):
The pure liquid response is measured without spring instability if the gradient of the oscillating force is smaller than the gradient of the restoring spring force: . Similarly, the convoluted response of the liquid and the solids is only weakly affected by the solids if the gradient of the oscillating force is much smaller than the gradient of the Hertz force: . For convenience, we define two dimensionless parameters and as the ratios of these gradients and we estimate them with simple scalings:
The different parameters have analogous roles, even if the exact exponents and numerical factors are not the same. There is no spring instability (resp. small influence of surfaces deformations) when (resp. ), which is fulfilled for systems with small adhesion and large period , measured with a spring of large stiffness k (resp. with solids of large elastic modulus K) and, less intuitively, with surfaces of small radii of curvature R. In the following, we test these criteria with studies in the literature that use different systems and instruments.
- For this SFB study with an ionic liquid (1 , 3000 , 50 , 1 , 0.6 ), we obtain 2 and 4, in agreement with the fact that we have spring instabilities and a strong effect of the surface deformations on the structural force profile.
- For a previous SFA study with liquid crystals [84] (, , , , ), we obtain 1 and , in agreement with the fact that they have no spring instabilities and a small effect of the surface deformations on the structural force profile.
- For a previous AFM study with polyelectrolytes [73] (, , , , ), we obtain and . Additionally, for a previous AFM study with colloidal suspensions [74] (, , , , ), we obtain and . This is in agreement with the fact that both studies have no spring instabilities and a small effect of the surface deformations on the structural force profile.
If the surface deformations have a small effect on the structural force profile (, i.e., solid compression is negligible compared to liquid compression), a fit with a semi-empirical exponentially decaying harmonic oscillation (Equation (2)) or a variation from it can be attempted. On the contrary, if the surface deformations have a strong effect on the structural force profile (, i.e., solid compression is dominant compared to liquid compression), a fit with our heuristic formulation (Equation (5)) or a variation from it is preferable. For an intermediate situation where the surface deformations have a moderate effect on the structural force profile (1, i.e., solid compression of the same order than liquid compression), more sophisticated models are required, such as the energy minimization approach proposed by Hoth et al. [68].
4. Conclusions
By simultaneously measuring interactions and characterizing, in situ, the geometry of the contact, we have shown that the mechanical deformations of the confining solids can have a strong influence on surface force measurements. Although this paper focus on the analysis of specific SFB experiments with dry atmosphere and an ionic liquid, we think some of the conclusions listed below may be of general interest for the community of surface force measurements.
- SFA experiments are not always in the JKR regime but can be in the DMT regime, typically for situations of moderate adhesion over a range of a few nanometers, as we have seen in the case of the ionic liquid. Using the correct model of contact mechanics is crucial, notably for quantitative investigations of adhesion or friction. The two regimes of contact are usually distinguished by calculating the value of the Maugis parameter from an estimate of the range of the attractive forces; it is in fact more accurate to look at the value of the contact radius before jump-out.
- In classical SFA experiments using mica sheets glued on glass lenses, the mica does not only bend but can also experience a compression, which we observed for relatively thick mica.
- This compression has to be taken into account for a proper calibration of the undeformed mica thickness in a dry atmosphere; for this purpose, we presented a method based on the fitting of the relation between the contact radius and the force with the JKR model. The usual procedure, which consists of taking the jump-in point as a reference, can lead to an underestimation of the mica thickness and an equivalent outward shift of the force profile measured after injecting the liquid. We found that this effect amounts to ∼ for a ∼-thick mica, and we expect it to decrease with the mica thickness.
- For any system showing a structural force profile with SFA or AFM, the exponentially decaying harmonic oscillation due to local variations of liquid density may be convoluted with the mechanical response of the confining solids. A correct interpretation of the detailed shape of the structural force profile is necessary to understand the behaviour of liquids in nanoconfinement.
- We have proposed a simple scaling criterion to estimate the degree of convolution. Typically, compression in the solids is dominant over compression in the liquid for simple liquids (large energies, small length-scales) and easily deformable solids (small elastic modulus, large radius of curvature). For SFA experiments with mica sheets glued on glass lenses, the influence of mica compression is interpreted to be more important and independent of the mica thickness at low loads and smaller and reduced for thinner mica at large loads. This effect is expected to be even more important at all loads when mica is replaced by a softer layer (such as EPON glue) [85,86,87] or at high loads if the distance measurement includes the indentation of the whole solid bodies (not only the top layers) [70].
- When the solid compression is dominant compared to liquid compression, a fit of the structural force profile with an exponentially decaying harmonic function is not appropriate. We have illustrated that it can be useful to consider heuristic formulations, which are based on extensions of contact mechanics models to situations where the solid surfaces confine a structured liquid film.
Supplementary Materials
The following are available online at https://0-www-mdpi-com.brum.beds.ac.uk/article/10.3390/lubricants9070069/s1, 1. Models of contact mechanics, 2. Method for the determination of surface deformation, Figure S1: FECO images and separation profiles for surfaces in contact across N2 or [CCPyrr][NTf], Figure S2: Force profile across [CCPyrr][NTf] obtained over several approach–retraction cycles, Figure S3: Comparison of the force profile across [CCPyrr][NTf] with exponentially decaying harmonic oscillations.
Funding
This research was funded by the European Research Council (under Starting Grant No. 676,861, LIQUISWITCH).
Institutional Review Board Statement
Not applicable.
Informed Consent Statement
Not applicable.
Data Availability Statement
The data presented in this paper are available upon reasonable request from the author.
Acknowledgments
I am grateful to Susan Perkin, who gave me the freedom to conduct this research when I was a Postdoctoral Resarch Associate at the Department of Chemistry, Physical and Theoretical Chemistry Laboratory, University of Oxford, Oxford OX1 3QZ, UK. I was supported by the European Research Council (under Starting Grant No. 676,861, LIQUISWITCH), the EPA Cephalosporin Junior Research Fellowship and Linacre College (University of Oxford).
Conflicts of Interest
The author declares no conflict of interest.
Abbreviations
The following abbreviations are used in this manuscript:
| SFB | Surface Force Balance |
| SFA | Surface Force Apparatus |
| AFM | Atomic Force Microscope |
| FECO | Fringes of Equal Chromatic Order |
| JKR | Johnson–Kendall–Roberts |
| DMT | Derjaguin–Muller–Toporov |
References
- Derjaguin, B. Untersuchungen über die Reibung und Adhäsion, IV. Kolloid-Zeitschrift 1934, 69, 155–164. [Google Scholar] [CrossRef]
- Israelachvili, J.N. Intermolecular and Surface Forces, 3rd ed.; Academic Press: San Diego, CA, USA, 2011. [Google Scholar] [CrossRef]
- Hertz, H. Ueber die Berührung fester elastischer Körper. J. Reine Angew. Math. 1882, 156. [Google Scholar] [CrossRef]
- Leroy, S.; Steinberger, A.; Cottin-Bizonne, C.; Restagno, F.; Léger, L.; Charlaix, E. Hydrodynamic Interaction between a Spherical Particle and an Elastic Surface: A Gentle Probe for Soft Thin Films. Phys. Rev. Lett. 2012, 108, 264501. [Google Scholar] [CrossRef]
- Wang, Y.; Dhong, C.; Frechette, J. Out-of-Contact Elastohydrodynamic Deformation due to Lubrication Forces. Phys. Rev. Lett. 2015, 115, 248302. [Google Scholar] [CrossRef] [Green Version]
- Horn, R.G.; Israelachvili, J.N.; Pribac, F. Measurement of the Deformation and Adhesion of Solids in Contact. J. Colloid Interface Sci. 1987, 115, 480–492. [Google Scholar] [CrossRef]
- McGuiggan, P.M.; Wallace, J.S.; Smith, D.T.; Sridhar, I.; Zheng, Z.W.; Johnson, K.L. Contact mechanics of layered elastic materials: Experiment and theory. J. Phys. D 2007, 40, 5984–5994. [Google Scholar] [CrossRef]
- Klein, J.; Kumacheva, E. Confinement-Induced Phase Transitions in Simple Liquids. Science 1995, 269, 816–819. [Google Scholar] [CrossRef] [PubMed]
- Klein, J.; Kumacheva, E. Simple liquids confined to molecularly thin layers. I. Confinement-induced liquid-to-solid phase transitions. J. Chem. Phys. 1998, 108, 6996–7009. [Google Scholar] [CrossRef]
- Kumacheva, E.; Klein, J. Simple Liquids Confined to Molecularly Thin Layers. II. Shear and Frictional Behavior of Solidified Films. J. Chem. Phys. 1998, 108, 7010–7022. [Google Scholar] [CrossRef]
- Perkin, S.; Chai, L.; Kampf, N.; Raviv, U.; Briscoe, W.; Dunlop, I.; Titmuss, S.; Seo, M.; Kumacheva, E.; Klein, J. Forces Between Mica Surfaces, Prepared in Different Ways, Across Aqueous and Nonaqueous Liquids Confined to Molecularly Thin Films. Langmuir 2006, 22, 6142–6152. [Google Scholar] [CrossRef]
- Klein, J. Modes of energy loss on shearing of thin confined films. Tribol. Lett. 2007, 26, 229. [Google Scholar] [CrossRef]
- Mazuyer, D.; Cayer-Barrioz, J.; Tonck, A.; Jarnias, F. Friction Dynamics of Confined Weakly Adhering Boundary Layers. Langmuir 2008, 24, 3857–3866. [Google Scholar] [CrossRef] [PubMed]
- Smith, A.M.; Lovelock, K.R.J.; Gosvami, N.N.; Welton, T.; Perkin, S. Quantized Friction Across Ionic Liquid Thin Films. Phys. Chem. Chem. Phys. 2013, 15, 15317–15320. [Google Scholar] [CrossRef] [Green Version]
- Johnson, K.L.; Kendall, K.; Roberts, A.D.; Tabor, D. Surface energy and the contact of elastic solids. Proc. R. Soc. A 1971, 324, 301–313. [Google Scholar] [CrossRef] [Green Version]
- Derjaguin, B.V.; Muller, V.M.; Toporov, Y.P. Effect of Contact Deformations on the Adhesion of Particles. J. Colloid Interface Sci. 1975, 53, 314–326. [Google Scholar] [CrossRef]
- Christenson, H.K. Surface Deformations in Direct Force Measurements. Langmuir 1996, 12, 1404–1405. [Google Scholar] [CrossRef]
- Lhermerout, R.; Perkin, S. Nanoconfined Ionic Liquids: Disentangling Electrostatic and Viscous Forces. Phys. Rev. Fluids 2018, 3, 014201. [Google Scholar] [CrossRef]
- Lhermerout, R.; Diederichs, C.; Perkin, S. Are Ionic Liquids Good Boundary Lubricants? A Molecular Perspective. Lubricants 2018, 6, 9. [Google Scholar] [CrossRef] [Green Version]
- Rao, C.J.; Venkatesan, K.A.; Tata, B.; Nagarajan, K.; Srinivasan, T.; Vasudeva Rao, P. Radiation stability of some room temperature ionic liquids. Radiat. Phys. Chem. 2011, 80, 643–649. [Google Scholar] [CrossRef]
- McNeil, L.E.; Grimsditch, M. Elastic moduli of muscovite mica. J. Phys. Condens. Matter 1993, 5, 1681–1690. [Google Scholar] [CrossRef]
- Köster, W.; Franz, H. Poisson’s ratio for metals and alloys. Metall. Rev. 1961, 6, 1–56. [Google Scholar] [CrossRef]
- Israelachvili, J.N. Thin Film Studies Using Multiple-Beam Interferometry. J. Colloid Interface Sci. 1973, 44, 259–272. [Google Scholar] [CrossRef]
- Schwenzfeier, K.A.; Erbe, A.; Bilotto, P.; Lengauer, M.; Merola, C.; Cheng, H.W.; Mears, L.L.E.; Valtiner, M. Optimizing multiple beam interferometry in the surface forces apparatus: Novel optics, reflection mode modeling, metal layer thicknesses, birefringence, and rotation of anisotropic layers. Rev. Sci. Instrum. 2019, 90, 043908. [Google Scholar] [CrossRef]
- Gebbie, M.A.; Dobbs, H.A.; Valtiner, M.; Israelachvili, J.N. Long-range electrostatic screening in ionic liquids. Proc. Natl. Acad. Sci. USA 2015, 112, 7432–7437. [Google Scholar] [CrossRef] [Green Version]
- Smith, A.M.; Lee, A.A.; Perkin, S. The Electrostatic Screening Length in Concentrated Electrolytes Increases with Concentration. J. Phys. Chem. Lett. 2016, 7, 2157–2163. [Google Scholar] [CrossRef] [Green Version]
- Maugis, D. Adhesion of spheres: The JKR-DMT transition using a dugdale model. J. Colloid Interface Sci. 1992, 150, 243–269. [Google Scholar] [CrossRef]
- Israelachvili, J.N.; Adams, G.E. Measurement of forces between two mica surfaces in aqueous electrolyte solutions in the range 0–100 nm. J. Chem. Soc. Faraday Trans. 1978, 74, 975–1001. [Google Scholar] [CrossRef]
- Math, S.; Horn, R.; Jayaram, V.; Biswas, S.K. A general contact mechanical formulation of multilayered structures and its application to deconvolute thickness/mechanical properties of glue used in surface force apparatus. J. Colloid Interface Sci. 2007, 308, 551–561. [Google Scholar] [CrossRef]
- Heuberger, M. The extended surface forces apparatus. Part I. Fast spectral correlation interferometry. Rev. Sci. Instrum. 2001, 72, 1700–1707. [Google Scholar] [CrossRef]
- Espinosa-Marzal, R.M.; Drobek, T.; Balmer, T.; Heuberger, M.P. Hydrated-ion ordering in electrical double layers. Phys. Chem. Chem. Phys. 2012, 14, 6085–6093. [Google Scholar] [CrossRef] [PubMed]
- Espinosa-Marzal, R.M.; Arcifa, A.; Rossi, A.; Spencer, N.D. Ionic Liquids Confined in Hydrophilic Nanocontacts: Structure and Lubricity in the Presence of Water. J. Phys. Chem. C 2014, 118, 6491–6503. [Google Scholar] [CrossRef]
- Jurado, L.A.; Kim, H.; Arcifa, A.; Rossi, A.; Leal, C.; Spencer, N.D.; Espinosa-Marzal, R.M. Irreversible structural change of a dry ionic liquid under nanoconfinement. Phys. Chem. Chem. Phys. 2015, 17, 13613–13624. [Google Scholar] [CrossRef]
- Jurado, L.A.; Kim, H.; Rossi, A.; Arcifa, A.; Schuh, J.K.; Spencer, N.D.; Leal, C.; Ewoldt, R.H.; Espinosa-Marzal, R.M. Effect of the environmental humidity on the bulk, interfacial and nanoconfined properties of an ionic liquid. Phys. Chem. Chem. Phys. 2016, 18, 22719–22730. [Google Scholar] [CrossRef]
- Zachariah, Z.; Espinosa-Marzal, R.M.; Spencer, N.D.; Heuberger, M.P. Stepwise collapse of highly overlapping electrical double layers. Phys. Chem. Chem. Phys. 2016, 18, 24417–24427. [Google Scholar] [CrossRef] [Green Version]
- Heuberger, M.P.; Zachariah, Z.; Spencer, N.D.; Espinosa-Marzal, R.M. Collective dehydration of ions in nano-pores. Phys. Chem. Chem. Phys. 2017, 19, 13462–13468. [Google Scholar] [CrossRef] [PubMed]
- Zachariah, Z.; Espinosa-Marzal, R.M.; Heuberger, M.P. Ion specific hydration in nano-confined electrical double layers. J. Colloid Interface Sci. 2017, 506, 263–270. [Google Scholar] [CrossRef] [PubMed]
- Tabor, D.F.R.S.; Winterton, R.H.S. The direct measurement of normal and retarded van der Waals forces. Proc. R. Soc. A 1969, 312, 435–450. [Google Scholar] [CrossRef]
- Homola, A.M.; Israelachvili, J.N.; Gee, M.L.; McGuiggan, P.M. Measurements of and Relation Between the Adhesion and Friction of Two Surfaces Separated by Molecularly Thin Liquid Films. J. Tribol. 1989, 111, 675–682. [Google Scholar] [CrossRef]
- Raviv, U.; Laurat, P.; Klein, J. Fluidity of water confined to subnanometre films. Nature 2001, 413, 51–54. [Google Scholar] [CrossRef]
- Raviv, U.; Klein, J. Fluidity of Bound Hydration Layers. Science 2002, 297, 1540–1543. [Google Scholar] [CrossRef] [Green Version]
- Raviv, A.; Laurat, P.; Klein, J. Time dependence of forces between mica surfaces in water and its relation to the release of surface ions. J. Chem. Phys. 2002, 116, 5167–5172. [Google Scholar] [CrossRef]
- Poppa, H.; Elliot, A.G. The surface composition of Mica substrates. Surf. Sci. 1971, 24, 149–163. [Google Scholar] [CrossRef]
- Chan, D.Y.C.; Horn, R.G. The drainage of thin liquid films between solid surfaces. J. Chem. Phys. 1985, 83, 5311–5324. [Google Scholar] [CrossRef] [Green Version]
- Israelachvili, J.N. Measurement of the Viscosity of Liquids in Very Thin Films. J. Colloid Interface Sci. 1986, 110, 263–271. [Google Scholar] [CrossRef]
- Klein, J.; Kamiyama, Y.; Yoshizawa, H.; Israelachvili, J.N.; Fredrickson, G.H.; Pincus, P.; Fetters, L.J. Lubrication forces between surfaces bearing polymer brushes. Macromolecules 1993, 26, 5552–5560. [Google Scholar] [CrossRef]
- Campbell, S.E.; Luengo, G.; Srdanov, V.I.; Wudl, F.; Israelachvili, J.N. Very Low Viscosity at the Solid-Liquid Interface Induced by Adsorbed C60 Monolayers. Nature 1996, 382, 520–522. [Google Scholar] [CrossRef]
- Cottin-Bizonne, C.; Steinberger, A.; Cross, B.; Raccurt, O.; Charlaix, E. Nanohydrodynamics: The Intrinsic Flow Boundary Condition on Smooth Surfaces. Langmuir 2008, 24, 1165–1172. [Google Scholar] [CrossRef]
- Reedy, E. Thin-coating contact mechanics with adhesion. J. Mater. Res. 2006, 21, 2660–2668. [Google Scholar] [CrossRef]
- Borodich, F.M.; Galanov, B.A.; Perepelkin, N.V.; Prikazchikov, D.A. Adhesive contact problems for a thin elastic layer: Asymptotic analysis and the JKR theory. Math. Mech. Solids 2019, 24, 1405–1424. [Google Scholar] [CrossRef]
- Sridhar, I.; Johnson, K.L.; Fleck, N.A. Adhesion mechanics of the surface force apparatus. J. Phys. D 1997, 30, 1710–1719. [Google Scholar] [CrossRef]
- Israelachvili, J.N.; Perez, E.; Tandon, R.K. On the adhesion force between deformable solids. J. Colloid Interface Sci. 1980, 78, 260–261. [Google Scholar] [CrossRef]
- Grierson, D.S.; Flater, E.E.; Carpick, R.W. Accounting for the JKR-DMT transition in adhesion and friction measurements with atomic force microscopy. J. Adhes. Sci. Technol. 2005, 19, 291–311. [Google Scholar] [CrossRef] [Green Version]
- Derjaguin, B.V. Mechanical properties of the boundary lubrication layer. Wear 1988, 128, 19–27. [Google Scholar] [CrossRef]
- Israelachvili, J.N.; Chen, Y.L.; Yoshizawa, H. Relationship between adhesion and friction forces. J. Adhes. Sci. Technol. 1994, 8, 1231–1249. [Google Scholar] [CrossRef]
- Berman, A.; Drummond, C.; Israelachvili, J. Amontons’ law at the molecular level. Tribol. Lett. 1998, 4, 95. [Google Scholar] [CrossRef]
- Bogdanovic, G.; Tiberg, F.; Rutland, M.W. Sliding Friction between Cellulose and Silica Surfaces. Langmuir 2001, 17, 5911–5916. [Google Scholar] [CrossRef]
- Bureau, L. Nonlinear Rheology of a Nanoconfined Simple Fluid. Phys. Rev. Lett. 2010, 104, 218302. [Google Scholar] [CrossRef] [PubMed] [Green Version]
- Lessel, M.; Loskill, P.; Hausen, F.; Gosvami, N.N.; Bennewitz, R.; Jacobs, K. Impact of van der Waals Interactions on Single Asperity Friction. Phys. Rev. Lett. 2013, 111, 035502. [Google Scholar] [CrossRef] [PubMed]
- Vialar, P.; Merzeau, P.; Barthel, E.; Giasson, S.; Drummond, C. Interaction between Compliant Surfaces: How Soft Surfaces Can Reduce Friction. Langmuir 2019, 35, 15723–15728. [Google Scholar] [CrossRef] [PubMed]
- Lhermerout, R.; Perkin, S. A new methodology for a detailed investigation of quantized friction in ionic liquids. Phys. Chem. Chem. Phys. 2020, 22, 455–466. [Google Scholar] [CrossRef]
- Horn, R.G.; Evans, D.F.; Ninham, B.W. Double-layer and solvation forces measured in a molten salt and its mixtures with water. J. Phys. Chem. 1988, 92, 3531–3537. [Google Scholar] [CrossRef]
- Atkin, R.; Warr, G.G. Structure in Confined Room-Temperature Ionic Liquids. J. Phys. Chem. C 2007, 111, 5162–5168. [Google Scholar] [CrossRef]
- Bou-Malham, I.; Bureau, L. Nanoconfined ionic liquids: Effect of surface charges on flow and molecular layering. Soft Matter 2010, 6, 4062–4065. [Google Scholar] [CrossRef]
- Perkin, S.; Albrecht, T.; Klein, J. Layering and shear properties of an ionic liquid, 1-ethyl-3-methylimidazolium ethylsulfate, confined to nano-films between mica surfaces. Phys. Chem. Chem. Phys. 2010, 12, 1243–1247. [Google Scholar] [CrossRef]
- Ueno, K.; Kasuya, M.; Watanabe, M.; Mizukami, M.; Kurihara, K. Resonance shear measurement of nanoconfined ionic liquids. Phys. Chem. Chem. Phys. 2010, 12, 4066–4071. [Google Scholar] [CrossRef]
- Zhang, X.; Zhong, Y.X.; Yan, J.W.; Su, Y.Z.; Zhang, M.; Mao, B.W. Probing double layer structures of Au (111)-BMIPF6 ionic liquid interfaces from potential-dependent AFM force curves. Chem. Commun. 2012, 48, 582–584. [Google Scholar] [CrossRef]
- Hoth, J.; Hausen, F.; Müser, M.H.; Bennewitz, R. Force microscopy of layering and friction in an ionic liquid. J. Phys. Condens. Matter 2014, 26, 284110. [Google Scholar] [CrossRef]
- Cheng, H.W.; Stock, P.; Moeremans, B.; Baimpos, T.; Banquy, X.; Renner, F.U.; Valtiner, M. Characterizing the Influence of Water on Charging and Layering at Electrified Ionic-Liquid/Solid Interfaces. Adv. Mater. Interfaces 2015, 2, 1500159. [Google Scholar] [CrossRef]
- Garcia, L.; Jacquot, L.; Charlaix, E.; Cross, B. Nanomechanics of ionic liquids at dielectric and metallic interfaces. Faraday Discuss. 2017, 206, 443–457. [Google Scholar] [CrossRef]
- Smith, A.M.; Lee, A.A.; Perkin, S. Switching the Structural Force in Ionic Liquid-Solvent Mixtures by Varying Composition. Phys. Rev. Lett. 2017, 118, 096002. [Google Scholar] [CrossRef]
- Hayes, R.; El Abedin, S.Z.; Atkin, R. Pronounced Structure in Confined Aprotic Room-Temperature Ionic Liquids. J. Phys. Chem. B 2009, 113, 7049–7052. [Google Scholar] [CrossRef]
- Moazzami-Gudarzi, M.; Kremer, T.; Valmacco, V.; Maroni, P.; Borkovec, M.; Trefalt, G. Interplay between Depletion and Double-Layer Forces Acting between Charged Particles in Solutions of Like-Charged Polyelectrolytes. Phys. Rev. Lett. 2016, 117, 088001. [Google Scholar] [CrossRef] [PubMed]
- Schön, S.; von Klitzing, R. A simple extension of the commonly used fitting equation for oscillatory structural forces in case of silica nanoparticle suspensions. Beilstein J. Nanotechnol. 2018, 9, 1095–1107. [Google Scholar] [CrossRef] [PubMed] [Green Version]
- Horn, R.G.; Israelachvili, J.N. Direct measurement of structural forces between two surfaces in a nonpolar liquid. J. Chem. Phys. 1981, 75, 1400–1411. [Google Scholar] [CrossRef]
- Smith, A.M.; Lovelock, K.R.J.; Perkin, S. Monolayer and bilayer structures in ionic liquids and their mixtures confined to nano-films. Faraday Discuss. 2013, 167, 279–292. [Google Scholar] [CrossRef]
- Griffin, L.R.; Browning, K.L.; Clarke, S.M.; Smith, A.M.; Perkin, S.; Skoda, M.W.A.; Norman, S.E. Direct measurements of ionic liquid layering at a single mica-liquid interface and in nano-films between two mica-liquid interfaces. Phys. Chem. Chem. Phys. 2017, 19, 297–304. [Google Scholar] [CrossRef] [Green Version]
- Cheng, H.W.; Weiss, H.; Stock, P.; Chen, Y.J.; Reinecke, C.R.; Dienemann, J.N.; Mezger, M.; Valtiner, M. Effect of Concentration on the Interfacial and Bulk Structure of Ionic Liquids in Aqueous Solution. Langmuir 2018, 34, 2637–2646. [Google Scholar] [CrossRef]
- Lhermerout, R.; Diederichs, C.; Sinha, S.; Porfyrakis, K.; Perkin, S. Are Buckminsterfullerenes Molecular Ball Bearings? J. Phys. Chem. B 2019, 123, 310–316. [Google Scholar] [CrossRef]
- Khan, S.H.; Matei, G.; Patil, S.; Hoffmann, P.M. Dynamic Solidification in Nanoconfined Water Films. Phys. Rev. Lett. 2010, 105, 106101. [Google Scholar] [CrossRef] [Green Version]
- Seddon, J.R.T. Conservative and Dissipative Interactions of Ionic Liquids in Nanoconfinement. J. Phys. Chem. C 2014, 118, 22197–22201. [Google Scholar] [CrossRef]
- Khan, S.H.; Hoffmann, P.M. Young’s modulus of nanoconfined liquids? J. Colloid Interface Sci. 2016, 473, 93–99. [Google Scholar] [CrossRef] [Green Version]
- Comtet, J.; Nigues, A.; Kaiser, V.; Coasne, B.; Bocquet, L.; Siria, A. Nanoscale capillary freezing of ionic liquids confined between metallic interfaces and the role of electronic screening. Nat. Mater. 2017, 16, 634–639. [Google Scholar] [CrossRef] [Green Version]
- Cross, B.; Crassous, J. Rheological properties of a highly confined film of a lyotropic lamellar phase. Eur. Phys. J. E 2004, 14, 249–257. [Google Scholar] [CrossRef]
- Britton, J.; Cousens, N.E.A.; Coles, S.W.; van Engers, C.D.; Babenko, V.; Murdock, A.T.; Koós, A.; Perkin, S.; Grobert, N. A Graphene Surface Force Balance. Langmuir 2014, 30, 11485–11492. [Google Scholar] [CrossRef] [PubMed]
- van Engers, C.D.; Cousens, N.E.A.; Babenko, V.; Britton, J.; Zappone, B.; Grobert, N.; Perkin, S. Direct Measurement of the Surface Energy of Graphene. Nano Lett. 2017, 17, 3815–3821. [Google Scholar] [CrossRef] [PubMed]
- van Engers, C.D.; Balabajew, M.; Southam, A.; Perkin, S. A 3-mirror surface force balance for the investigation of fluids confined to nanoscale films between two ultra-smooth polarizable electrodes. Rev. Sci. Instrum. 2018, 89, 123901. [Google Scholar] [CrossRef] [PubMed]
Figure 2.
(a) Picture of the FECO when the two solid surfaces are in contact across N, observed in (wavelength )- (lateral distance x) space. (b) Corresponding profile of the distance z between the surfaces along the lateral coordinate x (in red). A parabolic fit at small scale close to the apex (in green) allows one to measure the apical distance D, while a fit with the JKR profile (Equation (8) of the Supplementary Materials) at all measured scales (in blue) is used to extract the contact radius a. (c) Picture of the FECO when the two solid surfaces are in contact across [CCPyrr][NTf], observed in (wavelength )-(lateral distance x) space. (d) Corresponding profile of the distance z between the surfaces along the lateral coordinate x (in red). A parabolic fit at small scale close to the apex (in green) allows one to measure the apical distance D, while a parabolic fit at large scale (in blue) is used to extract the contact radius a. In both cases, the FECO images were recorded with a black and white camera, then recolored using the calibration of the wavelength axis with a mercury lamp. The two particular cases shown here correspond to the points of maximum load reached in Figure 3.

Figure 3.
(a) Force F as a function of distance D and (b) contact radius a as a function of force F when approaching (in red) and retracting (in blue) the top surface across N with the stepper motor at . The green curve is a JKR fit of (Equation (4) of the Supplementary Materials) with , and ; the black curve is a JKR fit of with , and . (c) Force F as a function of distance D and (d) contact radius a as a function of force F when approaching (in red) and retracting (in blue) the top surface across [CCPyrr][NTf] with the stepper motor at . The green curve is a DMT fit of (Equation (3) of the Supplementary Materials) with , and ; the black curve is a DMT fit of with , and .

Figure 4.
(a) Force profile measured with [CCPyrr][NTf] between mica surfaces when approaching or retracting the top surface with the piezoelectric tube at , showing structuring with five distinguishable layers labeled by i. For clarity, only the full approach is shown (in red), together with retractions from layers (in blue), (in green), (in orange), (in purple), (in yellow). The black lines are the fit with Equation (5). Inset: proposed structure of alternating layers of cations and anions. (b) Distances measured at the points of maximum and minimum force (respectively, in red and blue), as a function of the layer index i. Straight lines are the corresponding linear fits (Equations (3)). (c) Forces measured at the points of maximum and minimum forces (respectively, in red and blue), as a function of the layer index i, in log-lin representation. Straight lines are the corresponding exponential fits (Equation (4)).

Publisher’s Note: MDPI stays neutral with regard to jurisdictional claims in published maps and institutional affiliations. |
© 2021 by the author. Licensee MDPI, Basel, Switzerland. This article is an open access article distributed under the terms and conditions of the Creative Commons Attribution (CC BY) license (https://creativecommons.org/licenses/by/4.0/).
Share and Cite
MDPI and ACS Style
Lhermerout, R. The Influence of Mechanical Deformations on Surface Force Measurements. Lubricants 2021, 9, 69. https://0-doi-org.brum.beds.ac.uk/10.3390/lubricants9070069
AMA Style
Lhermerout R. The Influence of Mechanical Deformations on Surface Force Measurements. Lubricants. 2021; 9(7):69. https://0-doi-org.brum.beds.ac.uk/10.3390/lubricants9070069
Chicago/Turabian StyleLhermerout, Romain. 2021. "The Influence of Mechanical Deformations on Surface Force Measurements" Lubricants 9, no. 7: 69. https://0-doi-org.brum.beds.ac.uk/10.3390/lubricants9070069
Note that from the first issue of 2016, this journal uses article numbers instead of page numbers. See further details here.